
Core Loss Analysis of Interior Permanent Magnet Synchronous Machines under SVPWM Excitation with Considering Saturation

National Engineering Laboratory for Electric Vehicles, Beijing Institute of Technology, No. 5 South Zhongguancun Street, Haidian District, Beijing 100081, China
*
Author to whom correspondence should be addressed.
Energies 2017, 10(11), 1716; https://doi.org/10.3390/en10111716
Submission received: 22 September 2017
/
Revised: 10 October 2017
/
Accepted: 16 October 2017
/
Published: 26 October 2017
(This article belongs to the Special Issue Emerging Power Electronics Technologies for Power Systems and Machine Drives)
Abstract
:Core loss is one of the significant factors affecting the high power density of permanent magnet machines; thus, it is necessary to consider core loss in machine design. This paper presents a novel method for calculating the core loss of permanent magnet synchronous machines under space vector pulse width modulation (SVPWM) excitation, taking magnetic saturation and cross coupling into account. In order to accurately obtain the direct and quadrature (d-q) axis, current in the given load condition, the permanent magnet motor model under SVPWM excitation has been modified, so as to consider the influence of magnetic saturation and cross coupling effects on the d-q axis flux-linkage. Based on the magnetic field distribution caused by permanent magnet and armature reactions, the stator core loss can be calculated with the core loss analytical model, corresponding to the rotational magnetic field. In this study, the method has been applied to analyze core loss in an interior permanent magnet synchronous machine, and has been validated by the experimental results. The influence of pole/slot number combinations on core loss in the same on-load condition is also investigated. This study provides a potential method to guide motor design optimization.
1. Introduction
Space vector pulse width modulation (SVPWM) has been widely used in machine control systems because of its high output of current waveforms and high direct-current voltage utilization, and its status is becoming more and more important with the development of power electronics. However, motors under SVPWM excitation induce more harmonic current, which in turn increases stator core loss. This core loss is a main contributing factor that decreases the power density [1,2]. Currently, core loss under the pulse width modulation control has been studied extensively [3,4,5], but relatively little has been discussed regarding core loss under SVPWM excitation. In particular, different control systems play different roles in core loss [6]. In addition, machines with high power density cause more electromagnetic load in the stator core. This will obviously cause magnetic saturation and a cross coupling effect, which result in the various direct and quadrature (d-q) axis inductances that are dependent on the armature current. Therefore, machine performance, particularly current harmonic and core loss, can be clearly affected by magnetic saturation, especially in interior permanent magnet synchronous machines (IPMSM). Consequently, it is necessary to study core loss under SVPWM excitation, while considering magnetic saturation.
Co-analysis simulation has been mainly applied to core loss under SVPWM excitation. In [7], a co-analysis method was used to analyze losses due to time-harmonic currents with a SVPWM inverter, in a permanent magnet synchronous motor (PMSM) of 150 kW. The results were verified by the experimental results. The error between losses obtained by the co-analysis method and results caused by the sinusoidal current were compared. In the literature [8], the influence of the amplitude modulation radio and frequency modulation radio on eddy current losses and stator losses of permanent magnet synchronous generators under SVPWM modulation, have been analyzed by co-analysis simulation. Calculation models have presented reference values for setting proper amplitude modulation radios and frequency modulation radios under SVPWM modulation. In addition, the influence of magnetic saturation on core loss in surface-mounted permanent magnet synchronous machines has been analyzed in the literature [9]. However, the analyses considering saturation have simply used finite element analysis (FEA), under deep core saturation, caused by the larger armature current, so it lacks theory. It can be seen from the analysis mentioned above that few studies have been presented on core loss under SVPWM excitation. In addition, it is difficult to build an accurate co-analysis method, and the core loss obtained by the co-analysis model is time-consuming. If a co-analysis method has not been employed to deal with core loss under SVPWM excitation, machine saturation cannot been considered in the core loss model. Therefore, it is important to research the core loss calculation method, which includes the magnetic saturation effect under SVPWM excitation.
Recently, more and more studies have focused on analyzing the magnetic saturation of stator cores. The frozen permeability method, verified by many studies, has been mainly applied to calculate inductances and flux-linkages with consideration to magnetic saturation and cross coupling [10,11,12]. In [10], an analytical method to calculate d-q axis inductance for an interior permanent magnet machine with a V-shaped rotor in the no-load condition has been proposed, based on the winding function theory. A lumped parameter magnetic circuit model was adopted to investigate the saturation and nonlinearity of the bridge. Furthermore, much attention has been played on the influence of magnetic saturation on machine design and control systems. An improved method considering core saturation and cross coupling has been derived to obtain the ideal maximum torque per ampere (MTPA) angle of PMSM. The updated inductance and flux-linkage, which were obtained by fitting the FEA simulation data, were applied to each optimization iteration step of the MTPA algorithm [13]. A stator flux oriental vector control technique, taking saturation and cross coupling into account, in a flux switching permanent magnet machine was presented, to minimize volume and cost, and reduce cogging torque, noise and vibrations. The d-q axis inductances have been identified using an advanced model [14,15,16,17]. However, few studies have been done to discuss the influence of the SVPWM model, which includes magnetic saturation and cross coupling, on core loss.
In terms of reducing core loss, motor design optimization, including the permanent magnet structure and pole/slot number combinations, is the most common approach. In [18,19], the permanent magnet (PM) cavity of an interior machine with a single-layer U-shaped PM was optimized to reduce the core loss of the machine. In addition, the electromagnetic torque ripple and cogging torque were also reduced by using the improved PM cavity. The on-load core loss of interior machines considering the local magnetic saturation and the influence of slot/pole number combinations is discussed in [20,21,22]. A detailed core loss density in different parts accounting for the slot/pole number combinations was calculated and compared in the same d-q axis current. However, the machine parameters, such as inductance and flux-linkage, could be affected by the slot/pole number combinations, so that the machine electromagnetic torque with various slot/pole number combinations is different in the same d-q axis current. Therefore, core loss cannot be accurately used to evaluate machine performance.
Based on the previous research presented above, a novel method for calculating the core loss of IPMSM machines under SVPWM excitation considering magnetic saturation is proposed in the paper. The PM motor model of SVPWM has been modified to deal with magnetic saturation and cross coupling, to accurately obtain the d-q current with the given load condition. The stator core loss can be calculated by the core loss analytical model corresponding to the rotational magnetic field. Moreover, the influence of pole/slot number combinations with consideration to the saturation effect on core loss and total loss in the same load condition has been investigated in the paper. It has the potential to guide the motor design optimization.
The paper is organized as follows: Section 1 provides an introduction. Section 2 proposes the method for calculating core loss under SVPWM excitation with consideration to magnetic saturation and cross coupling. Section 3 analyzes the magnetic field distribution and core loss in the different load conditions. Section 4 provides the experiment to verify the core loss. Section 5 describes the influence of pole/slot number combinations on core loss and total loss. Finally, Section 6 gives the conclusions.
2. The Stator Core Loss Calculation Method
2.1. Modified PM Motor Model
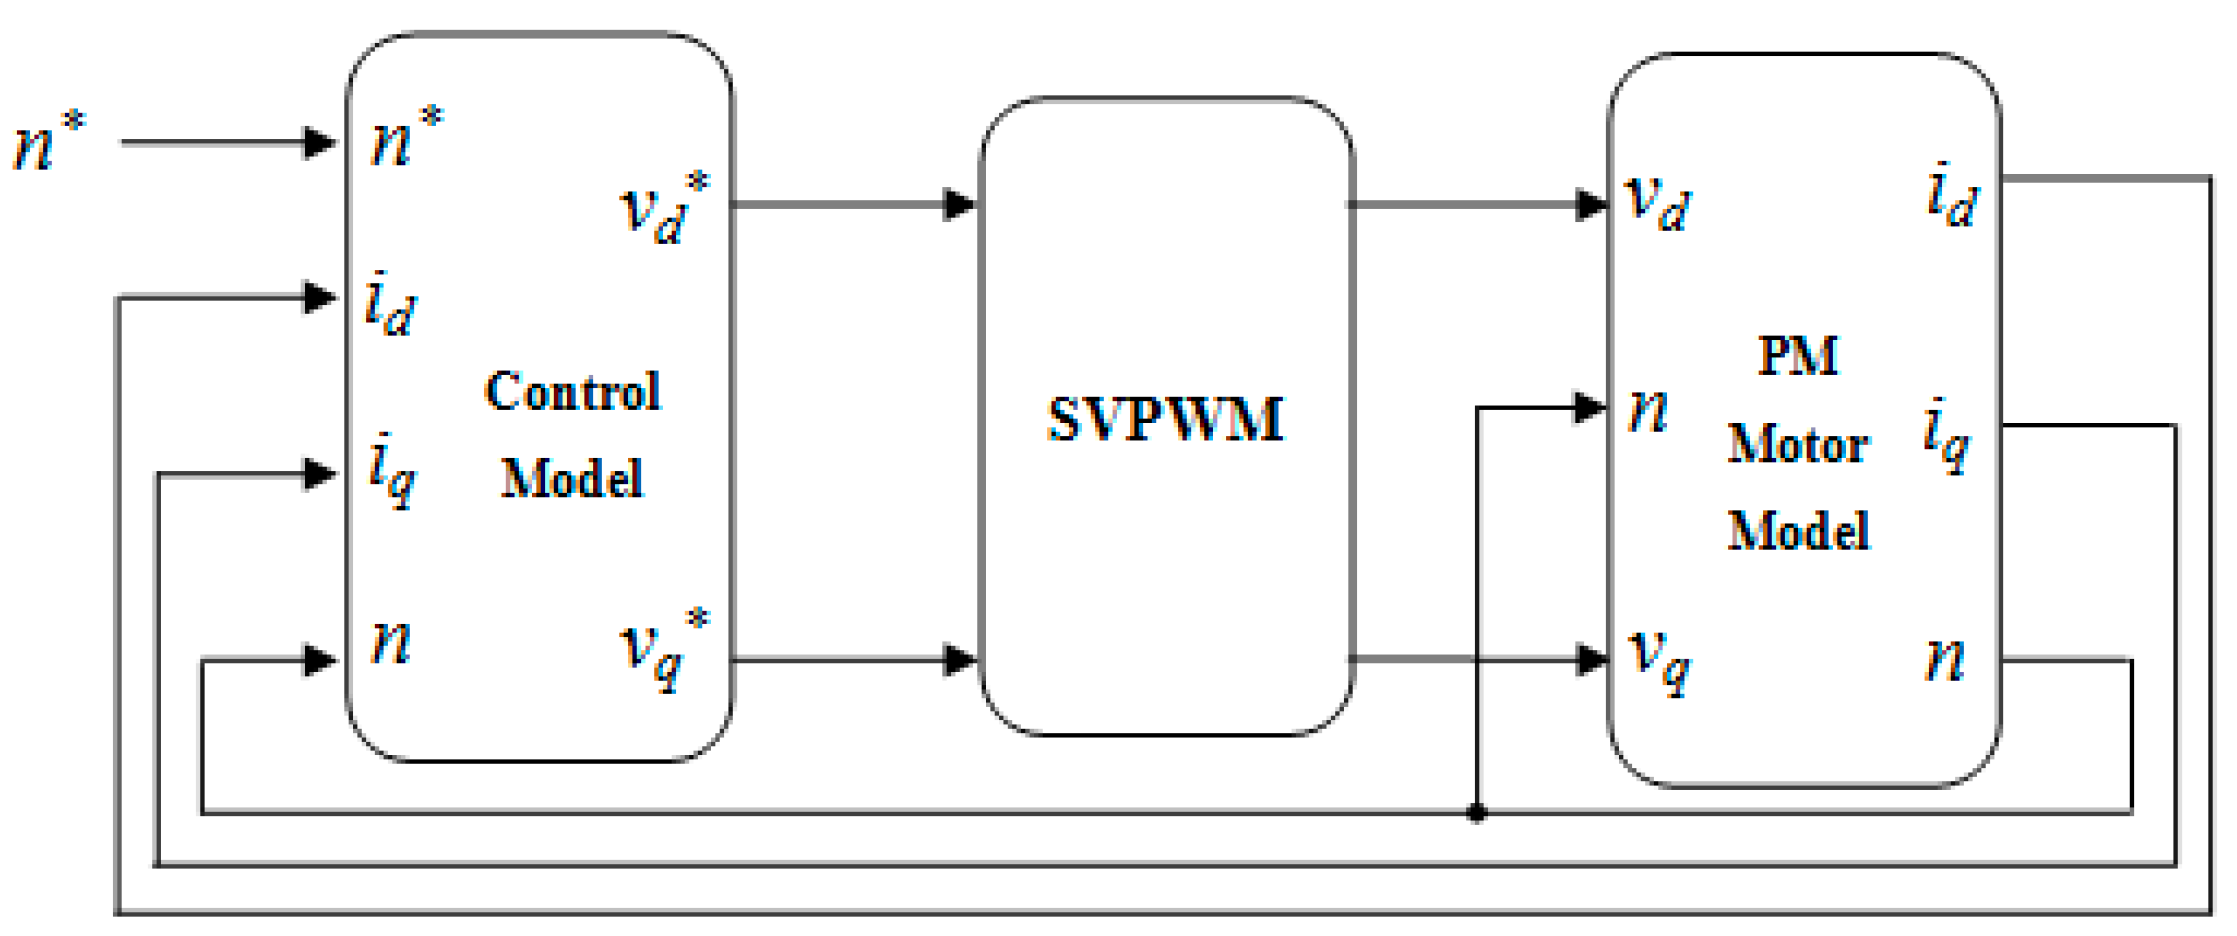
Stator core loss is influenced by the control technique. The SVPWM control diagram presented in Figure 1 was needed in this model. The ideal voltages, vd* and vq*, modulated using SVPWM excitation can be obtained from the target speed (n*), actual speed (n), and actual current (id, iq). Then, the PM motor model calculates the actual current (id, iq) and actual speed (n) by using the relationship between mechanical and electrical properties in the steady state, which can be defined as:
where vd is the d axis phase voltage, vq is the q axis voltage, Ld and Lq are the d axis inductance and q axis inductance, respectively, Rs is the phase resistance, ω is the electrical angular speed, φf is the flux-linkage of the permanent magnet, Te is the electromagnetic torque, p is the number of poles, B is the damping coefficient, ωm is the mechanical angular speed, TL is the load torque, and J is the rotor inertia moment.
Thus, for a given speed and torque condition, the motor operating characteristics can be obtained by Equations (1)–(4). In this way, the inductances, Ld and Lq, and flux-linkage, φf, are kept constant in the solving process. However, the inductances (Ld, Lq) and flux-linkage (φf) change with the d-q axis currents because of the magnetic saturation and cross coupling in the steel sheet. To avoid error due to not considering saturation in the motor model, the PM motor model should be modified to deal with the magnetic saturation and cross coupling effects, so as to accurately reflect the motor operating performances. It is well known that Equations (1)–(4) can be rewritten from the view point of flux-linkage:
where φd(id, iq) and φq(id, iq) are the d axis and q axis flux linkages that are dependent on the armature currents, id and iq, respectively.
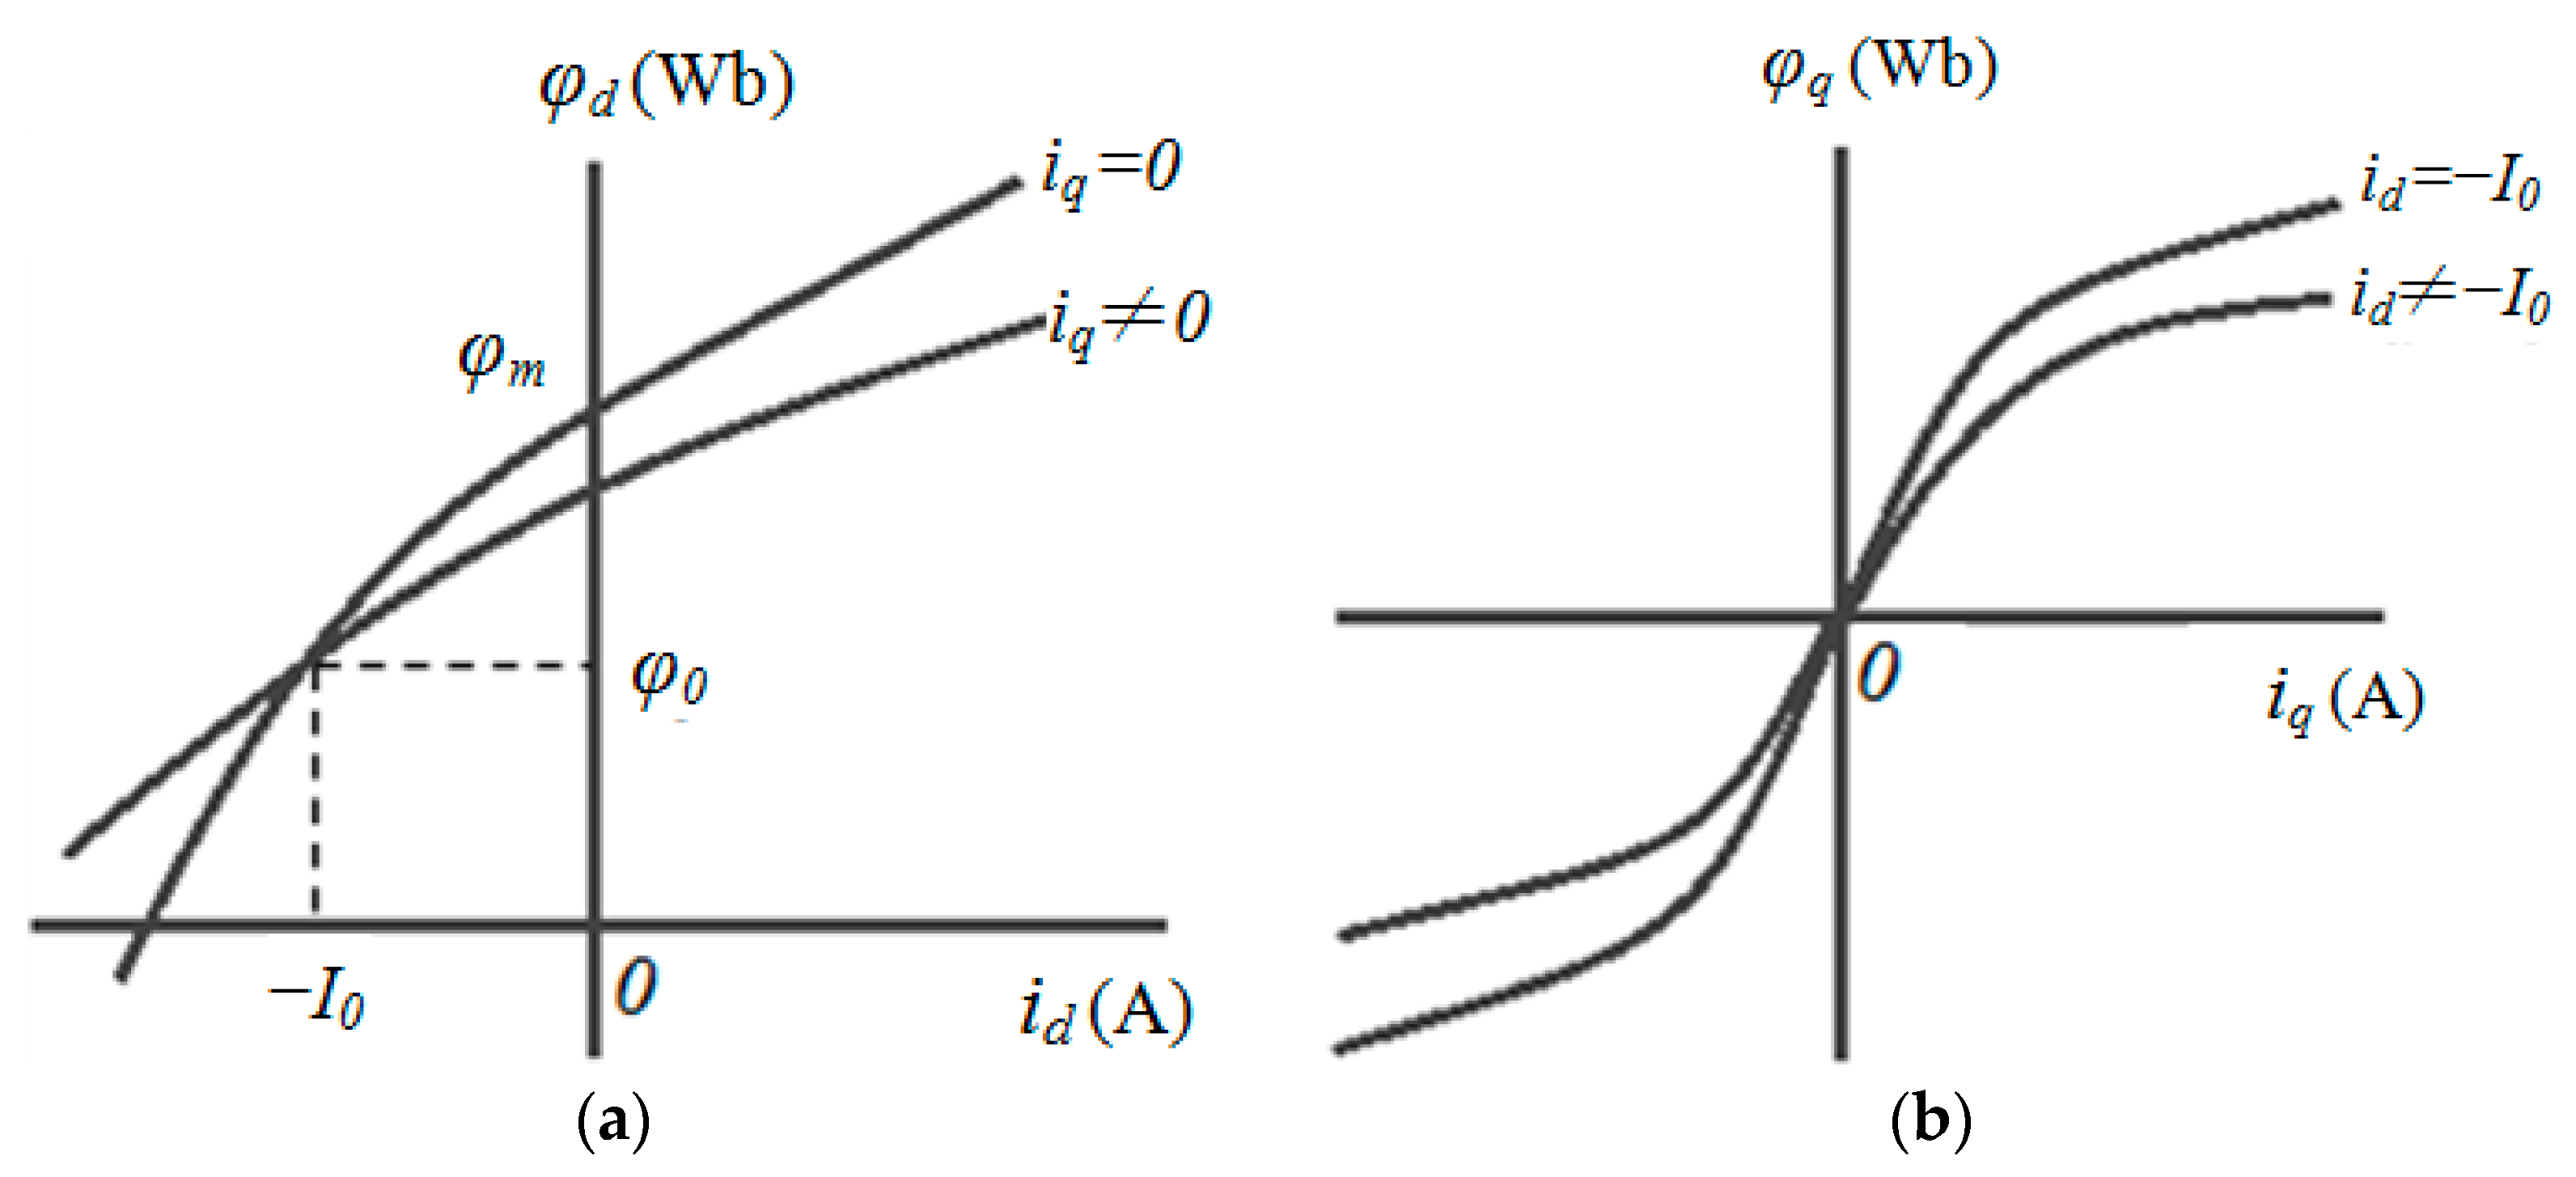
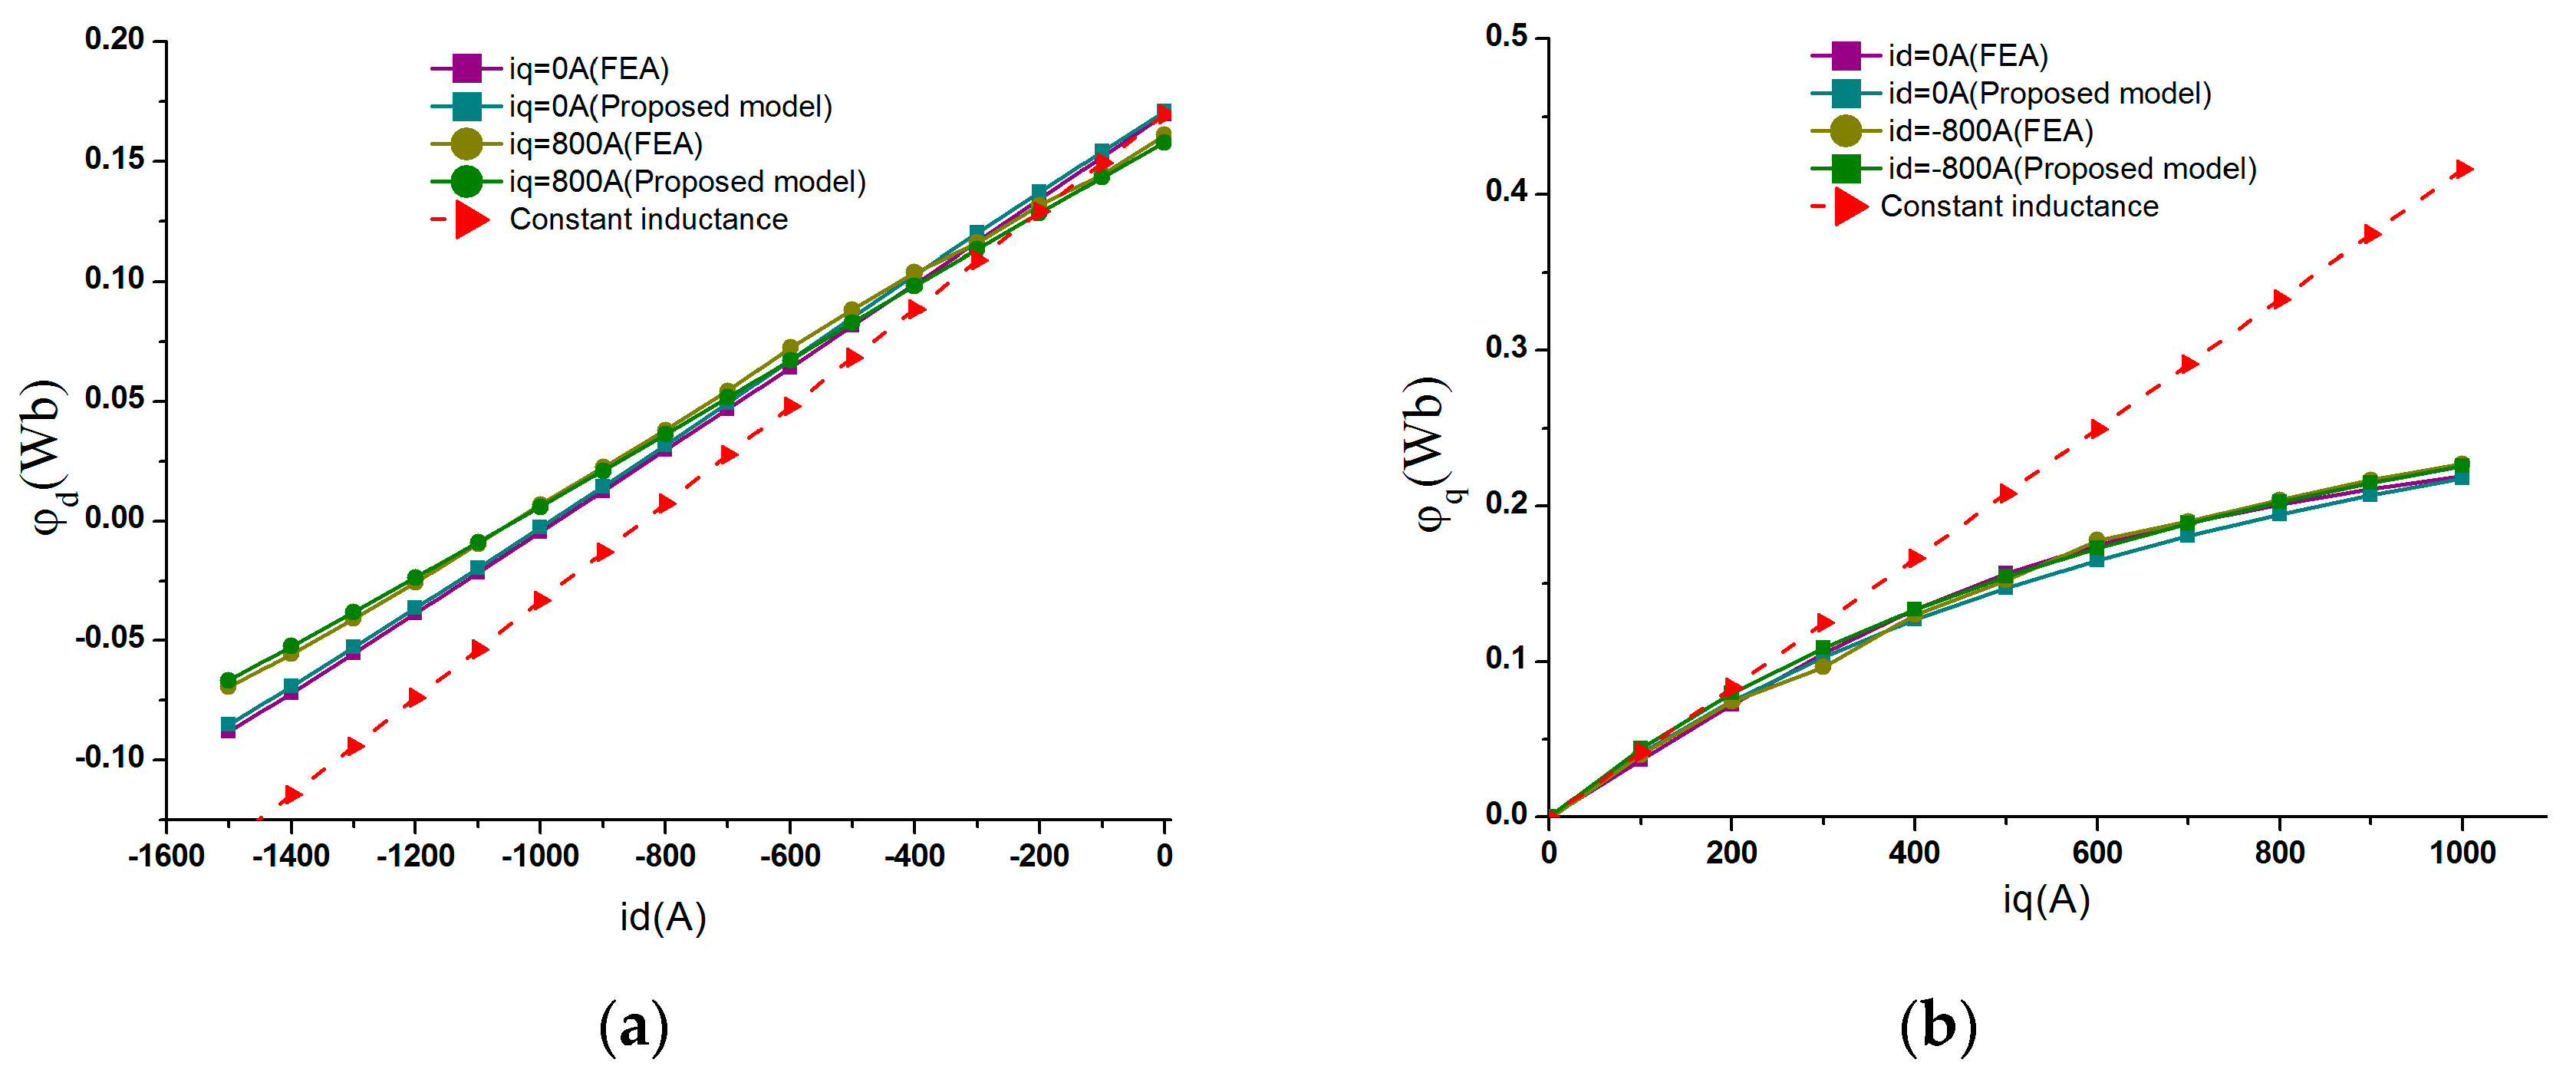
To develop the ideal PM motor model, the d-q axis flux linkage that is dependent on the current (id, iq) is available in Equations (5)–(7). Figure 2a shows the relationship between the d axis flux-linkage and d axis armature current when iq is kept constant. Each line in various iq pass through a common point (−I0, φ0). This means that the permanent magnet flux and d-q axis flux path reach a balance, no matter what the q axis current is. In addition, the influences from iq to φq play different roles at the common point. Figure 2b shows the influences from iq to φq with a fixed value of d axis current. When id is equal to −I0, φq reaches a maximum value. Thus, the fitting relation between φd, φq and id, iq can be expressed as [15]:
where KLd and Ksd are the fitting coefficients that define the curve shapes presented in Figure 2a, with consideration to the magnetic saturation, Ksqd defines the d axis saturation caused by the q axis current (iq). Meanwhile, the fitting coefficients, KLq and Ksq, determine the curve shapes presented in Figure 2b with consideration to the magnetic saturation, and Ksdq defines the q axis saturation caused by the d axis current (id).
The current (id, iq), which varies with φd, φq can be obtained by solving the Equation (8). That is:
Additionally, the phase voltage and current are unable to exceed the maximum allowed value due to the limitation of the inverter.
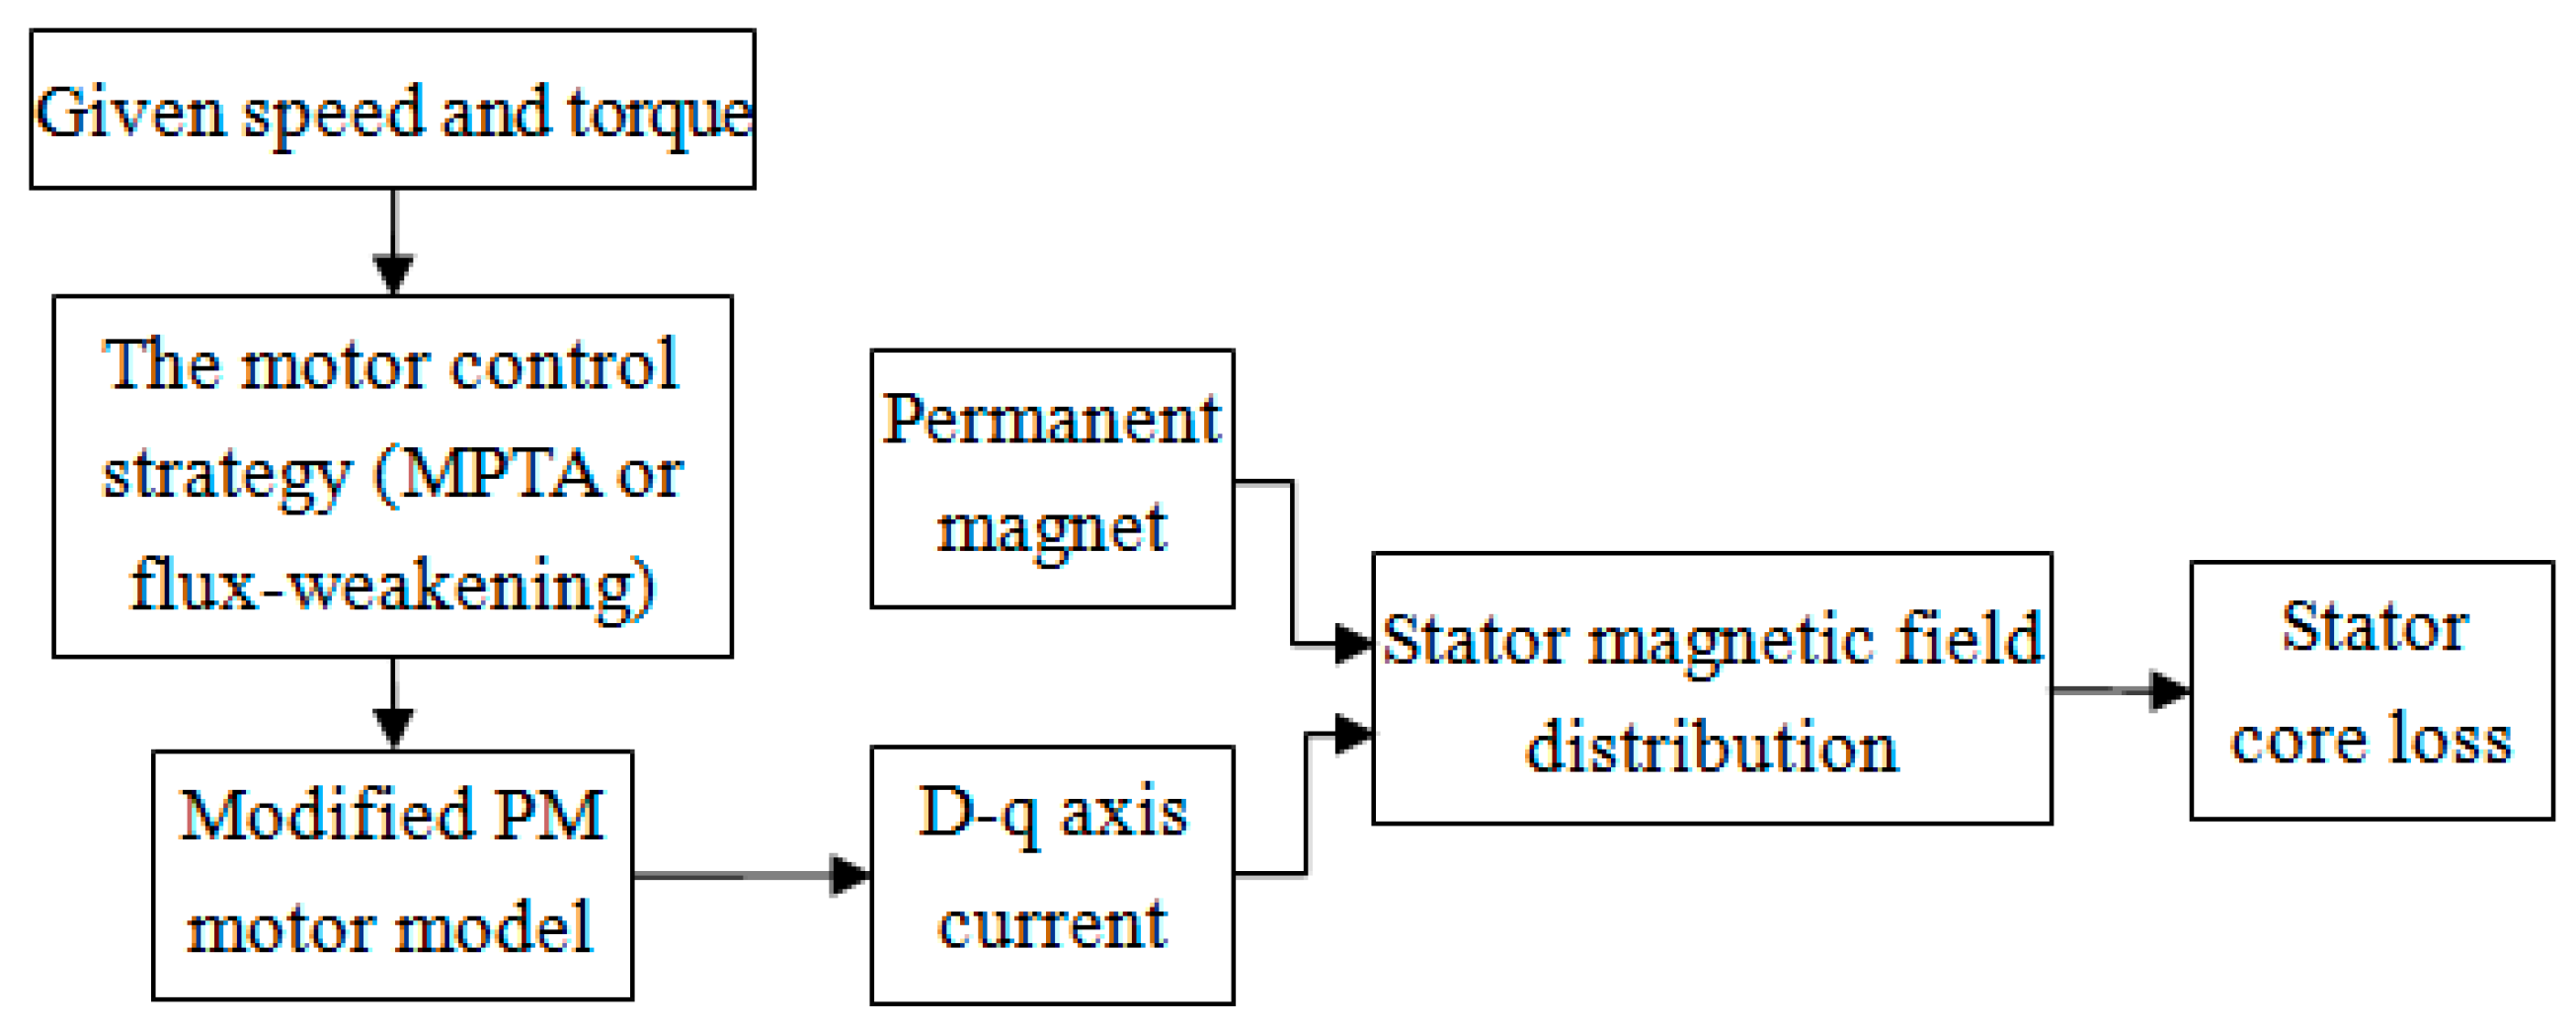
By applying Equations (5)–(7) and (9), the modified PM motor model containing the magnetic saturation property was designed, which is shown in Figure 3. MTPA is applied to the constant torque region, and flux-weakening is applied to the constant power region. Thereafter, the current (id, iq) for a given speed and torque can be obtained by the iterative procedure in any specified operating region.
2.2. Stator Core Loss Calculation Method
The rotational magnetic field caused by the common excitation of the permanent magnet and armature reaction produces core loss in the stator. Based on Bertotti’s core loss model, the stator core loss can be decomposed into hysteresis loss, eddy current loss and eddy current excess loss. Generally, the stator core loss calculation model for a rotational magnetic field that is regarded as two perpendicular alternative magnetic fields, is proposed in [23]. However, this calculation method is only true when the flux density is less than 1.2 T and the frequency is less than 400 Hz. Another calculation method for a rotational magnetic field, which has the higher calculation accuracy, is introduced in [24], but it is difficult to measure core loss under circular field excitations, thus, it is hard to obtain the coefficients of the core loss model.
In order to calculate core loss with consideration to magnetic saturation and higher frequencies, a core loss prediction model with piecewise variable coefficients, based on Bertotti’s core loss model is used in this paper. In the model, an additional flux density higher-order term and an additional flux density lower-order term are introduced, to allow consideration of the increased eddy current loss and the local hysteresis loss caused by magnetic saturation and the harmonic field, respectively. Moreover, the rotating magnetic field is regarded as two perpendicular alternative magnetic fields in the stator core loss calculation model, in which the core loss density can be expressed as [25]:
where Kh, Ke and Kexc are the coefficient of hysteresis loss, eddy current loss and eddy current excess loss, respectively; Bkmax is the kth harmonic amplitude of the major axis flux density; Bkmin is the kth harmonic amplitude of the minor axis flux density; Kr is the core loss coefficient of rotational magnetic excitation (Kr = 1 + Bkmin/Bkmax), Ph, Pe and Pexc refer to the core loss densities from hysteresis loss, eddy current loss and eddy current excess loss, respectively; k is the harmonic order of flux density; α is the coefficient; f is the motor frequency; n1k and β1k are the coefficients of the additional flux density higher-order term, which reflect the hysteresis loss changes caused by the local hysteresis loops; n2k, β2k are the coefficients of the additional flux density low-order term, which reflect the eddy current loss changes caused by magnetic saturation, where n1k, β1k, n2k and β2k vary with the amplitude and frequency of the flux density. The coefficients of the core loss model can be easily obtained by the curve-fitting experimental data of core loss under alternating field excitations. More detailed calculation processes for the coefficients can be found in the literature [25].
Then, the stator total core loss can be calculated using the loss density and mass of each subdivision element. That is:
where La is the axis length of the stator, ρ is the density of the steel sheet, Ns is the number of subdivision elements, Δs(i) is the area of the ith subdivision element.
Consequently, the calculation flow chart of stator core loss is shown in Figure 4.
3. Stator Core Loss Analysis with Magnetic Saturation
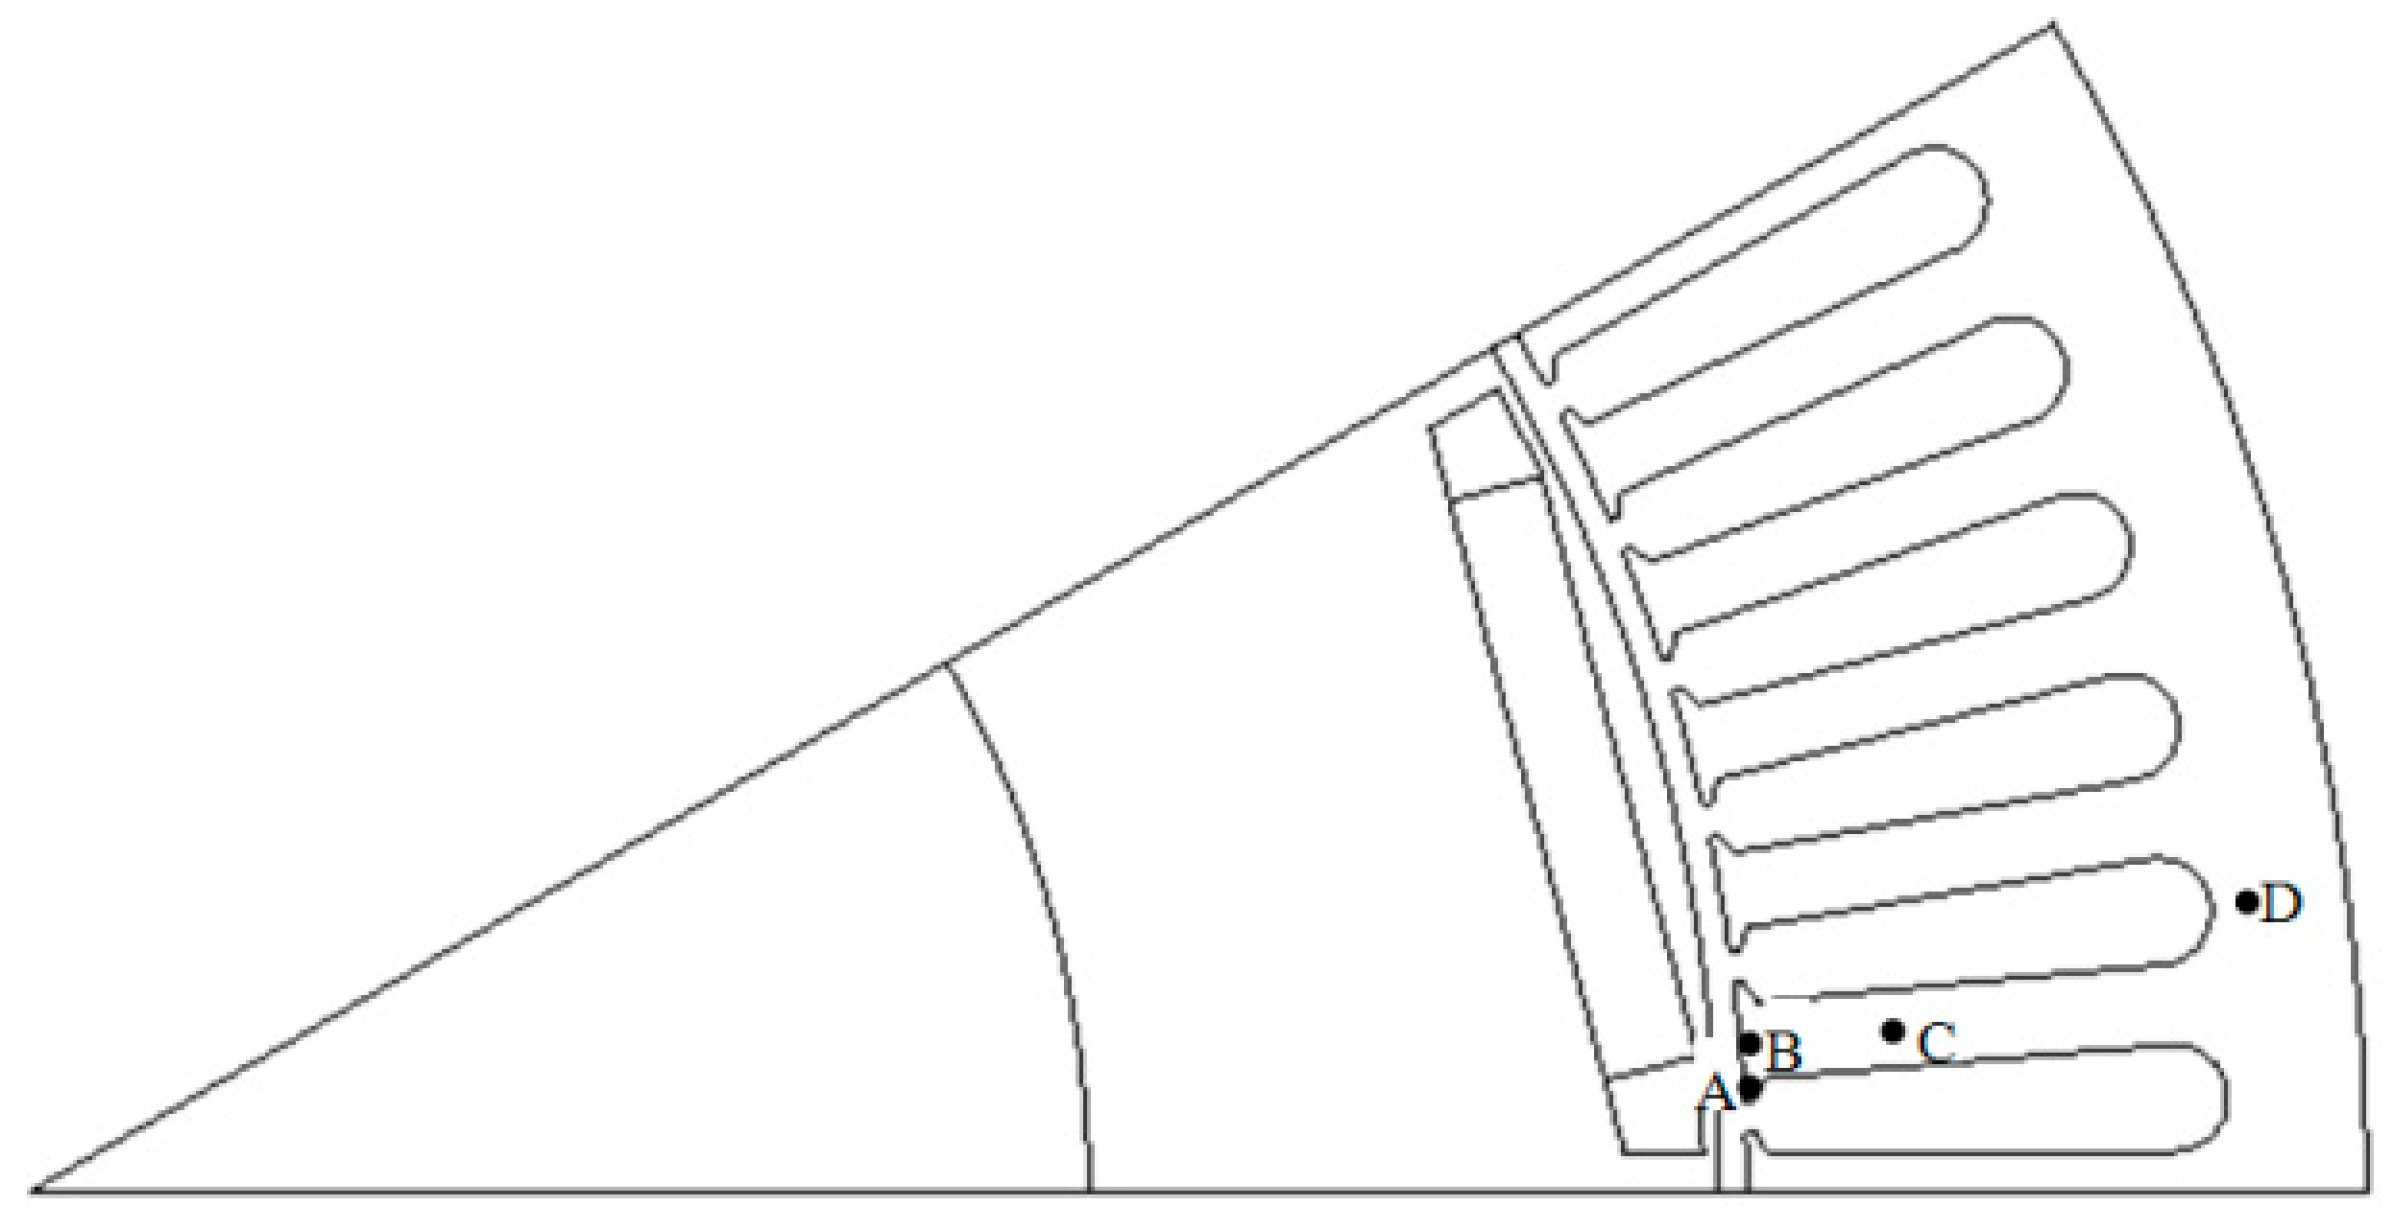
In order to properly analyze the influence of magnetic saturation on stator core loss, an IPMSM, as shown in Figure 5, was used in the paper. Moreover, in order to analyze the magnetic field in different stator parts, four points, A, B, C and D, were selected in the stator core. The motor specifications are given in Table 1. In addition, the proposed method for calculating core loss is compared with a conventional method, so as to present the improvement of the proposed method. Because the conventional method does not take the saturation effect into account, the armature current at a given load condition can be calculated by Equations (1)–(4), where the inductances and flux-linkage are kept constant in the solving process. Then, the magnetic field and stator core loss can be obtained by a two-dimensional (2D) time-step FEA method.
3.1. Armature Current Comparison
Based on the motor parameters, the fitting coefficients in Equation(9), which is presented in Table 2, can be determined by fitting the relationship between the d-q axis armature current and the flux linkage performances, by using finite element analysis (FEA). Then, the d-q axis flux-linkage, with respect to the current (id, iq), can be calculated. The d-q axis flux-linkage comparison obtained by FEA and the proposed model are shown in Figure 6. It was observed that when the motor is operated in the saturation region, the flux-linkage obtained from the proposed model is far lower than that from the model with constant inductance. Moreover, the FEA results have a good agreement with the calculation results obtained by the proposed model.
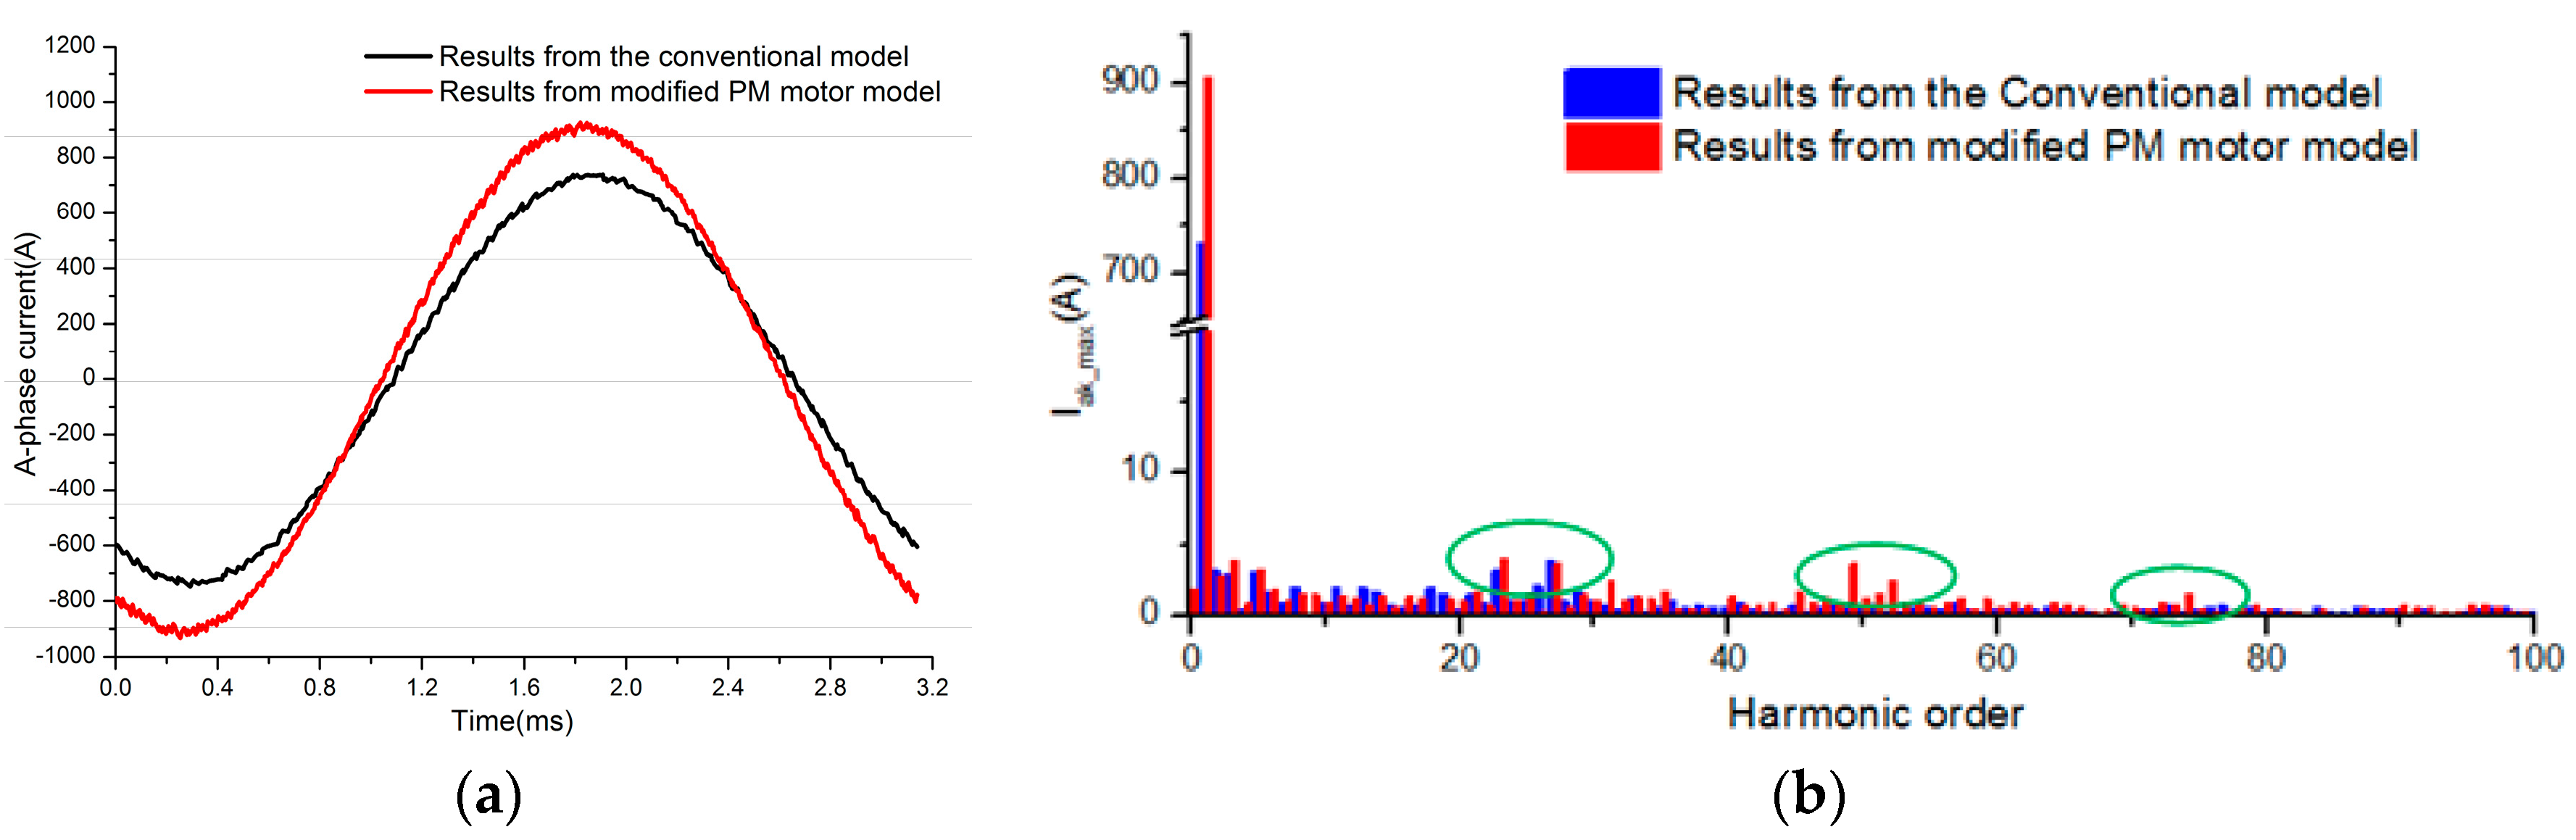
In the proposed method, the d-q axis current with magnetic saturation can be determined by the modified motor model. However, the saturation effect is not considered in the conventional model; the d-q axis current is solved by Equations (1)–(4). By using park inverse transformation, the armature current can be obtained. Figure 7a shows the armature current at the rated operating point (3185 rpm, 1110 Nm), obtained from both the proposed model and the conventional model.
At the rated operating point, the armature current from the proposed model was higher than the current from the conventional model, due to the influence of the d-q axis current on the flux-linkage. In order to clearly describe the differences in armature current obtained from the proposed model and the conventional model, the armature current harmonic in the time domain calculated by Fourier decomposition is shown in Figure 7b.
The errors between the fundamental current from the proposed model and the fundamental current from the conventional model reached 18%, and the harmonic current which considers saturation, reached a higher value. However, based on the armature currents obtained by the proposed model and the conventional model, the main harmonic order is (2i − 1)fc/f ± 2, (2i − 1)fc/f ± 4, 2ifc/f ± 1, 2ifc/f ± 5 (i = 1, 2, 3…), where fc is the carrier frequency, and f is the motor frequency. The carrier frequency of the controller in this paper is 8 kHz.When the motor operates at the rated speed, the ratio of fc to f is 25.1. Thus, the main harmonic order is 21, 23, 27, 29, 49, 50 etc., which is marked in Figure 7b.
3.2. Magnetic Field Comparison
The magnetic field distribution, caused by the permanent magnet and armature reaction, varies widely in the different positions of the stator core under the same load conditions. Therefore, four points—A, B, C and D—in the stator core, which are marked in Figure 5, were chosen to introduce the stator magnetic field distribution in one entire electrical period of the rated operating point.
Figure 8 shows the typical time variation curve of the radial and tangential components of flux density, and the elliptical flux density vector waveforms at points, A, B, C and D, at the rated operating point, in which the curve enclosed with the dashed line is the flux density obtained from the conventional model and that enclosed with the solid line is the flux density obtained from the proposed model.
Almost all of the motor magnetic fields in the different positions of the stator core have a rotational magnetic field. In particular, the rotational magnetic field accounts for the maximum proportion at points A and B. However, the radial component of flux density is far beyond the tangential component at point C, so the magnetic field at point C can be approximately considered as an alternative magnetic field. Moreover, the magnetic field at point D is an elliptical rotating field, due to the higher radial flux density. Therefore, it is necessary to consider the influence of the rotational magnetic field on the core loss calculation model. Based on the rotational magnetic field, a series of the elliptical harmonic magnetic field vectors, formed with major axis flux density (Bkmax) and minor axis flux density (Bkmin) can be obtained by applying Fourier decompositions to the radial and tangential components of flux density.
Figure 9 shows the elliptical harmonic magnetic field vectors at points A, B, C and D, at the rated operating point.
The radial and tangential flux densities at every position of the stator core are mainly odd harmonics. In the conventional unsaturated PM motor model, the inductances, Ld and Lq, are simply considered constant gains. However, in the proposed saturated motor model, the inductances, Ld and Lq, vary with the armature current of the self-axis and the other axis. Thus, compared with the flux density obtained from the conventional model, great changes have taken place in the flux density obtained from proposed model, especially at points A and B. The fundamental amplitude of radial flux density decreases while the fundamental amplitude of tangential flux density increases at point A. In addition, it can be obviously seen that the change rate in flux density at point A is higher than at the other three points. At the rated operating point, if the saturation is considered in the motor model, the larger demagnetizing current reduces the fundamental amplitude of the radial flux density. Meanwhile, in contrast to the harmonics without saturation in the conventional model, the harmonics of radial and tangential flux density increase. This is because if the saturation is considered, the various inductances that are dependent on the current (id, iq) lead to the large current harmonics.
3.3. Stator Core Loss Comparison
Using Equations (11) and (12), stator core loss can be obtained. Figure 10a shows the core loss at the low speed of 1000 rpm. At the speed of 1000 rpm, torque varies from 100 Nm to 1660 Nm, where 1660 Nm is the machine’s maximum torque. Figure 10b shows the errors in percentage forms between the hysteresis loss, eddy current loss and eddy current excess loss, obtained from the proposed model and the conventional model. In the region of 1000 rpm, MTPA control is used in IPMSM. The low fundamental frequency leads to the lower core loss. It can be seen from Figure 10a that the core loss increases as torque increases. The reason for this is that the armature current under MTPA control increases as torque increases, which results in the increasing magnetic field. For a specific frequency, core loss has increased, due to the increasing magnetic field. Moreover, as the torque increases, the armature current from the proposed model is larger than the current from the conventional model, especially in the high torque region, so the fundamental flux density amplitude obtained from the proposed model is larger in the high torque region, whereas the harmonics are higher in the low torque region. Therefore, the errors of hysteresis loss increase and the other loss errors decrease, when the torque varies from 100 Nm to 1660 Nm. In addition, the minimum error of total loss has taken place at the rated point, and the maximum error of total core loss is increased to 12% at the maximum torque of 1660 Nm, due to the higher fundamental flux density amplitude.
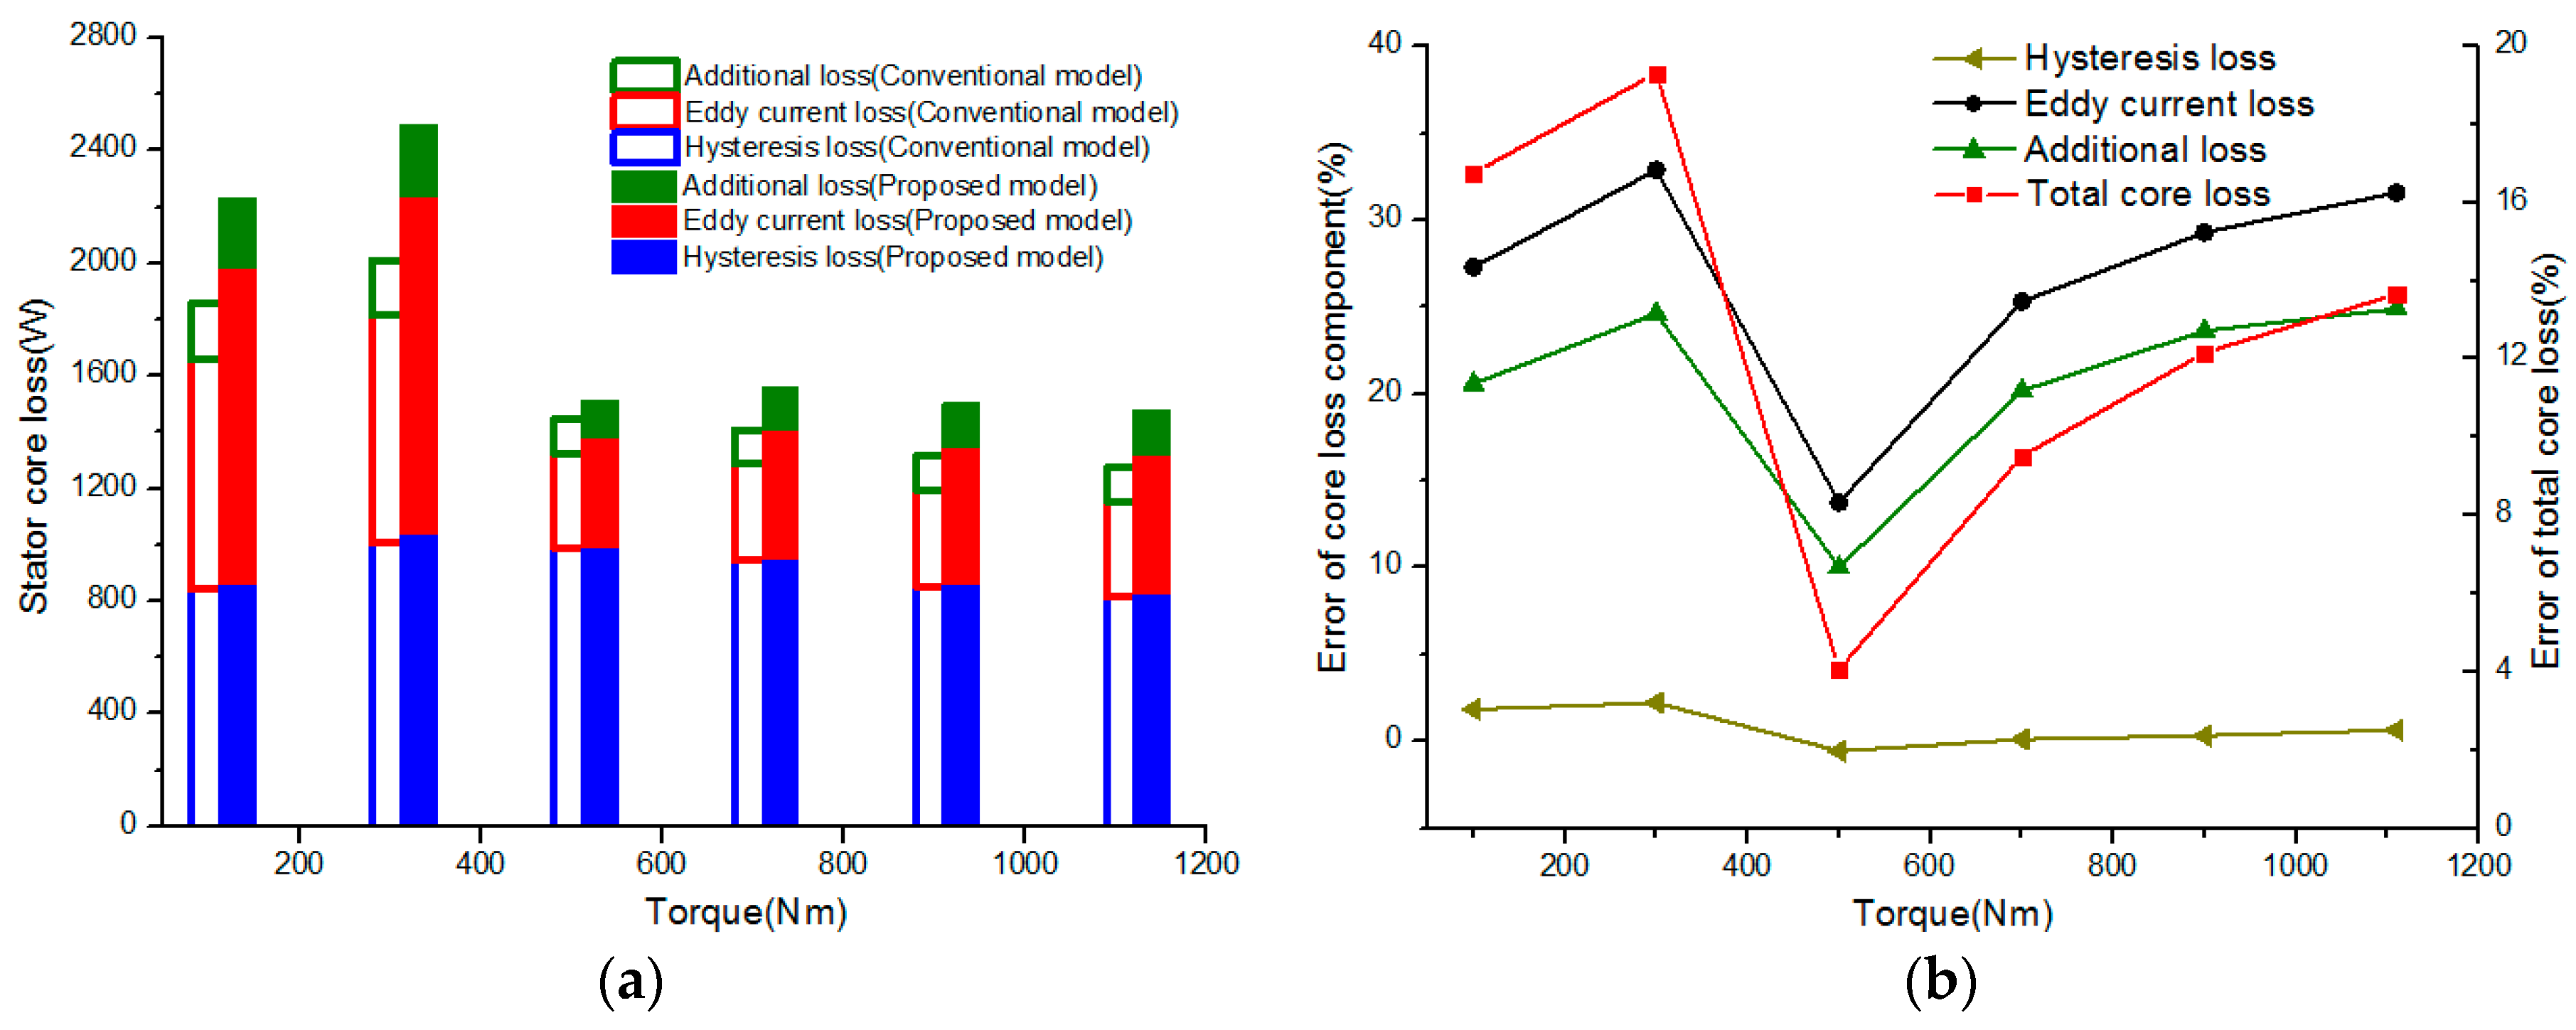
Figure 11a shows the core loss at the rated speed of 3185 rpm, in which the torque varies from 100 Nm to 1110 Nm. At the rated speed, 1110 Nm is the machine’s rated torque. Figure 11b shows the errors in percentage forms between the hysteresis loss, eddy current loss and eddy current excess loss obtained from the proposed model and the conventional model. Because of the rising fundamental frequency, the core loss is much higher than the core loss in the region of 1000 rpm. Unlike the relation between torque and core loss in the region of 1000 rpm, core loss decreases as torque increases in the region of 3185 rpm. Particularly, core loss in the region above 300 Nm is much less than core loss in the torque of 300 Nm. This is due to the different control modes. For the higher speed, MTPA control is used for low torques (100, 300 Nm), and flux-weakening control, which increases the minus d axis current and decreases the q axis current, is applied for high torques (above 300 Nm). In the flux-weakening region, the magnetic field has been reduced by the increasing minus d axis current and the decreasing q axis current, and the higher the torque is, the greater the flux-weakening effect is. Thus, for the specific frequency condition, the magnetic field under MTPA control is higher than that under flux-weakening control, and the magnetic field is lower in the higher torque region. Therefore, the core loss under flux-weakening control is much less than the core loss under MTPA control. When the machine operates with a torque of 300 Nm, the maximum error from core loss, obtained from the proposed model and the conventional model reaches 19%, because of the higher harmonic of the magnetic field obtained from the proposed model. Moreover, the eddy current loss is more sensitive to the flux density compared with the other two losses, so magnetic saturation has an important effect on the eddy current loss in the entire speed-torque region.
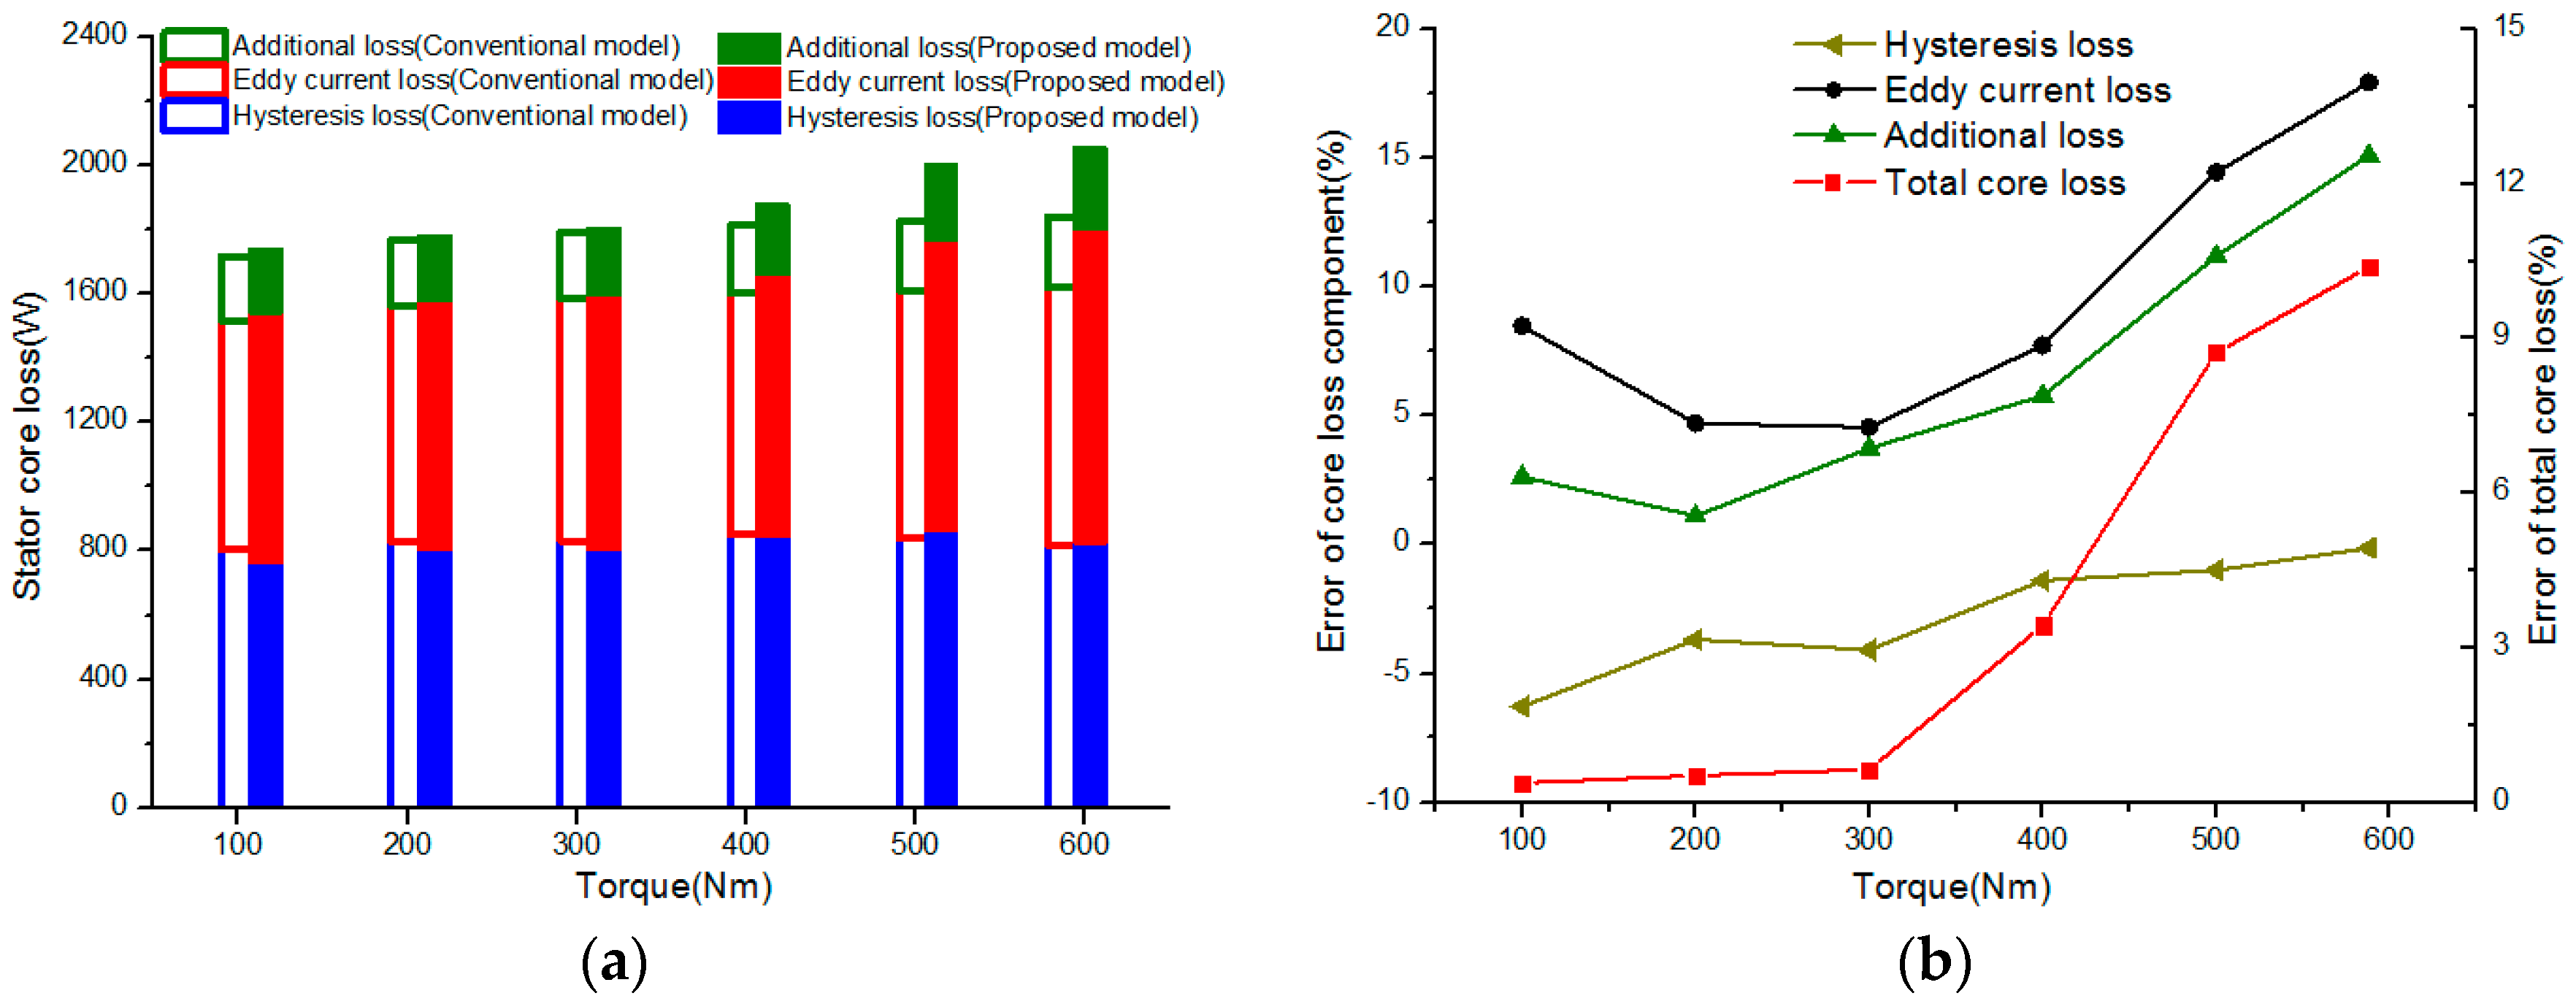
Figure 12a shows the core loss at the high speed of 6000 rpm, in which the torque varies from 100 Nm to 588 Nm. At a speed of 6000 rpm, 588 Nm is the torque at the rated power of 370 kW. Figure 12b shows the errors in percentage forms between the hysteresis loss, eddy current loss and eddy current excess loss obtained from the proposed model and the conventional model. In the region of 6000 rpm, flux-weakening control is used in the motor. It was observed that the core loss considering saturation changed little, when compared with that from the conventional model in the low torque region. As the torque increases, the d axis demagnetization current considering saturation increased much more under the deep flux-weakening region. Therefore, the hysteresis loss with saturation was lower than that from the conventional model, due to the lower fundamental amplitude of flux density, but the eddy current loss and eddy current excess loss with saturation were greater because of the greater harmonics of flux density. In addition, the core loss error including saturation, in the region of 6000 rpm, was around 10%, which is much less than in the other speed regions.
Compared with the results calculated by the conventional method, the influence of saturation on the inductance and flux-linkage, which vary with the motor operating conditions, can be considered well in the proposed method. Moreover, the maximum value of errors for calculating stator core loss reached 19% in certain load conditions. Therefore, it is necessary to consider magnetic saturation in the core loss calculation model, and the proposed method takes magnetic saturation into account.
4. Verification
In order to verify the accuracy of the method for calculating core loss, the machine experimental platform was built to measure the loss, as shown in Figure 13. When the machine operates in the on-load conditions, input power (Pin) and output power (Pout) can be measured by the experiment. The total loss can be given as:
where Pcu is the copper loss, which can be calculated from the measured armature current; PFe is the core loss; Pre is the rotor eddy current loss and Pme is the mechanical loss, which can be obtained by the empirical formula. That is:
where PB and Pw are the friction loss and wind friction loss, respectively; km is the empirical coefficient; Gr is the rotor mass; n is the machine speed; lr is the axis length of the rotor and Dr is the rotor outer diameter.
Particularly, it is difficult to separate the core loss from the rotor eddy current loss. Therefore, the sum of the core loss and rotor eddy current loss was applied, to verify the method used in this paper. That is:
Based on Equation (15), Figure 14 shows a comparison of calculation and experimental results for the sum of core loss and rotor eddy current loss in the rated condition, where the rated conditions are the constant torque region below the rated speed of 3185 rpm and the constant power region above the rated speed.
It can be seen from Figure 14 that the results obtained by the proposed method have good agreement with the experimental results. In addition, the results obtained by the proposed method were a little higher than the experimental results. This is due to the eddy current loss obtained by the 2D finite element analysis. Two-dimensional finite element analysis ignores the end effect, and produces a lower eddy current loop resistance, so the calculation results of the eddy current loss are higher than the experimental results. The errors between the results from the proposed method and the experimental results are greater in the low speed region. As the speed increases, the flux-weakening effect increases, so the eddy currents in the rotor core and permanent magnet decrease. The decreasing eddy current results in lower errors of eddy current loss. However, the results obtained by the conventional method were lower than the experimental results. Due to the higher eddy current loss, the core loss error between the results from the conventional method and the experimental results are significantly increased.
5. Influences of Pole/Slot Number Combinations on Core Loss
The influence of magnetic saturation on core loss is related to motor topology, such as the pole/slot number combinations. If IPMSM is the study object, the effect of pole/slot number combinations on the magnetic saturation and core loss can be analyzed. The pole/slot number combinations: 12/72, 12/36, 12/18 and 16/18, were chosen in this paper, according to the motor performance, cogging torque and manufacturing process. The design principles of IPMSM with different pole/slot number combinations are as follows:
- To avoid the influence of slot opening width on core loss, so ensure the slot opening width remains unchanged;
- To adjust the motor tooth width to make the tooth flux density around 1.6 T, and to adjust the yoke height to make the yoke flux density around 1.5 T in the no-load condition;
- To ensure the no-load electromotive forces are approximately identical.
Based on the design principles above, the motor topology with different pole/slot number combinations is presented in Figure 15. In order to accurately analyze the influence of pole/slot number combinations on the core loss in different regions, the stator was divided into four regions (I: tooth-tip, II: tooth, III: region between tooth and yoke, IV: yoke), and four points, A, B, C and D, were used in the four regions, respectively, as shown in Figure 15. All machines have the same stator outer diameters, inner diameters, magnet thicknesses, and air gap lengths, except for the winding structure and stator slot parameters. The different parameters are summarized in Table 3. In this way, the electromagnetic parameters, such as motor inductance, phase resistance and flux-linkage, are changed accordingly, due to the different influences of magnetic saturation caused by the pole/slot number combinations. Compared with the 12/72 machine, the phase resistance of the 16/18 machine decreased by 34%, while the inductance increased by up to 14%.
According to the four machines with pole/slot number combinations of 12/72, 12/36, 12/18 and 16/18, the rated operating point (3185 rpm, 1110 Nm) was chosen to analyze the influence of pole/slot number combinations on core loss in the paper. In order to ensure the machine performs well, the rated line voltage was 600 V. The magnetic saturation, including inductance and flux-linkage, can be influenced by the pole/slot number combinations, so that the d-q axis armature current under each pole/slot number combination machine are different. Figure 16 shows the d-q axis average current obtained by the modified PM motor model at the rated operating point. The q axis current varied little. However, the d axis current of the 16/18 machine was much larger than the other machines, so the armature current of 16/18 machine was the highest.
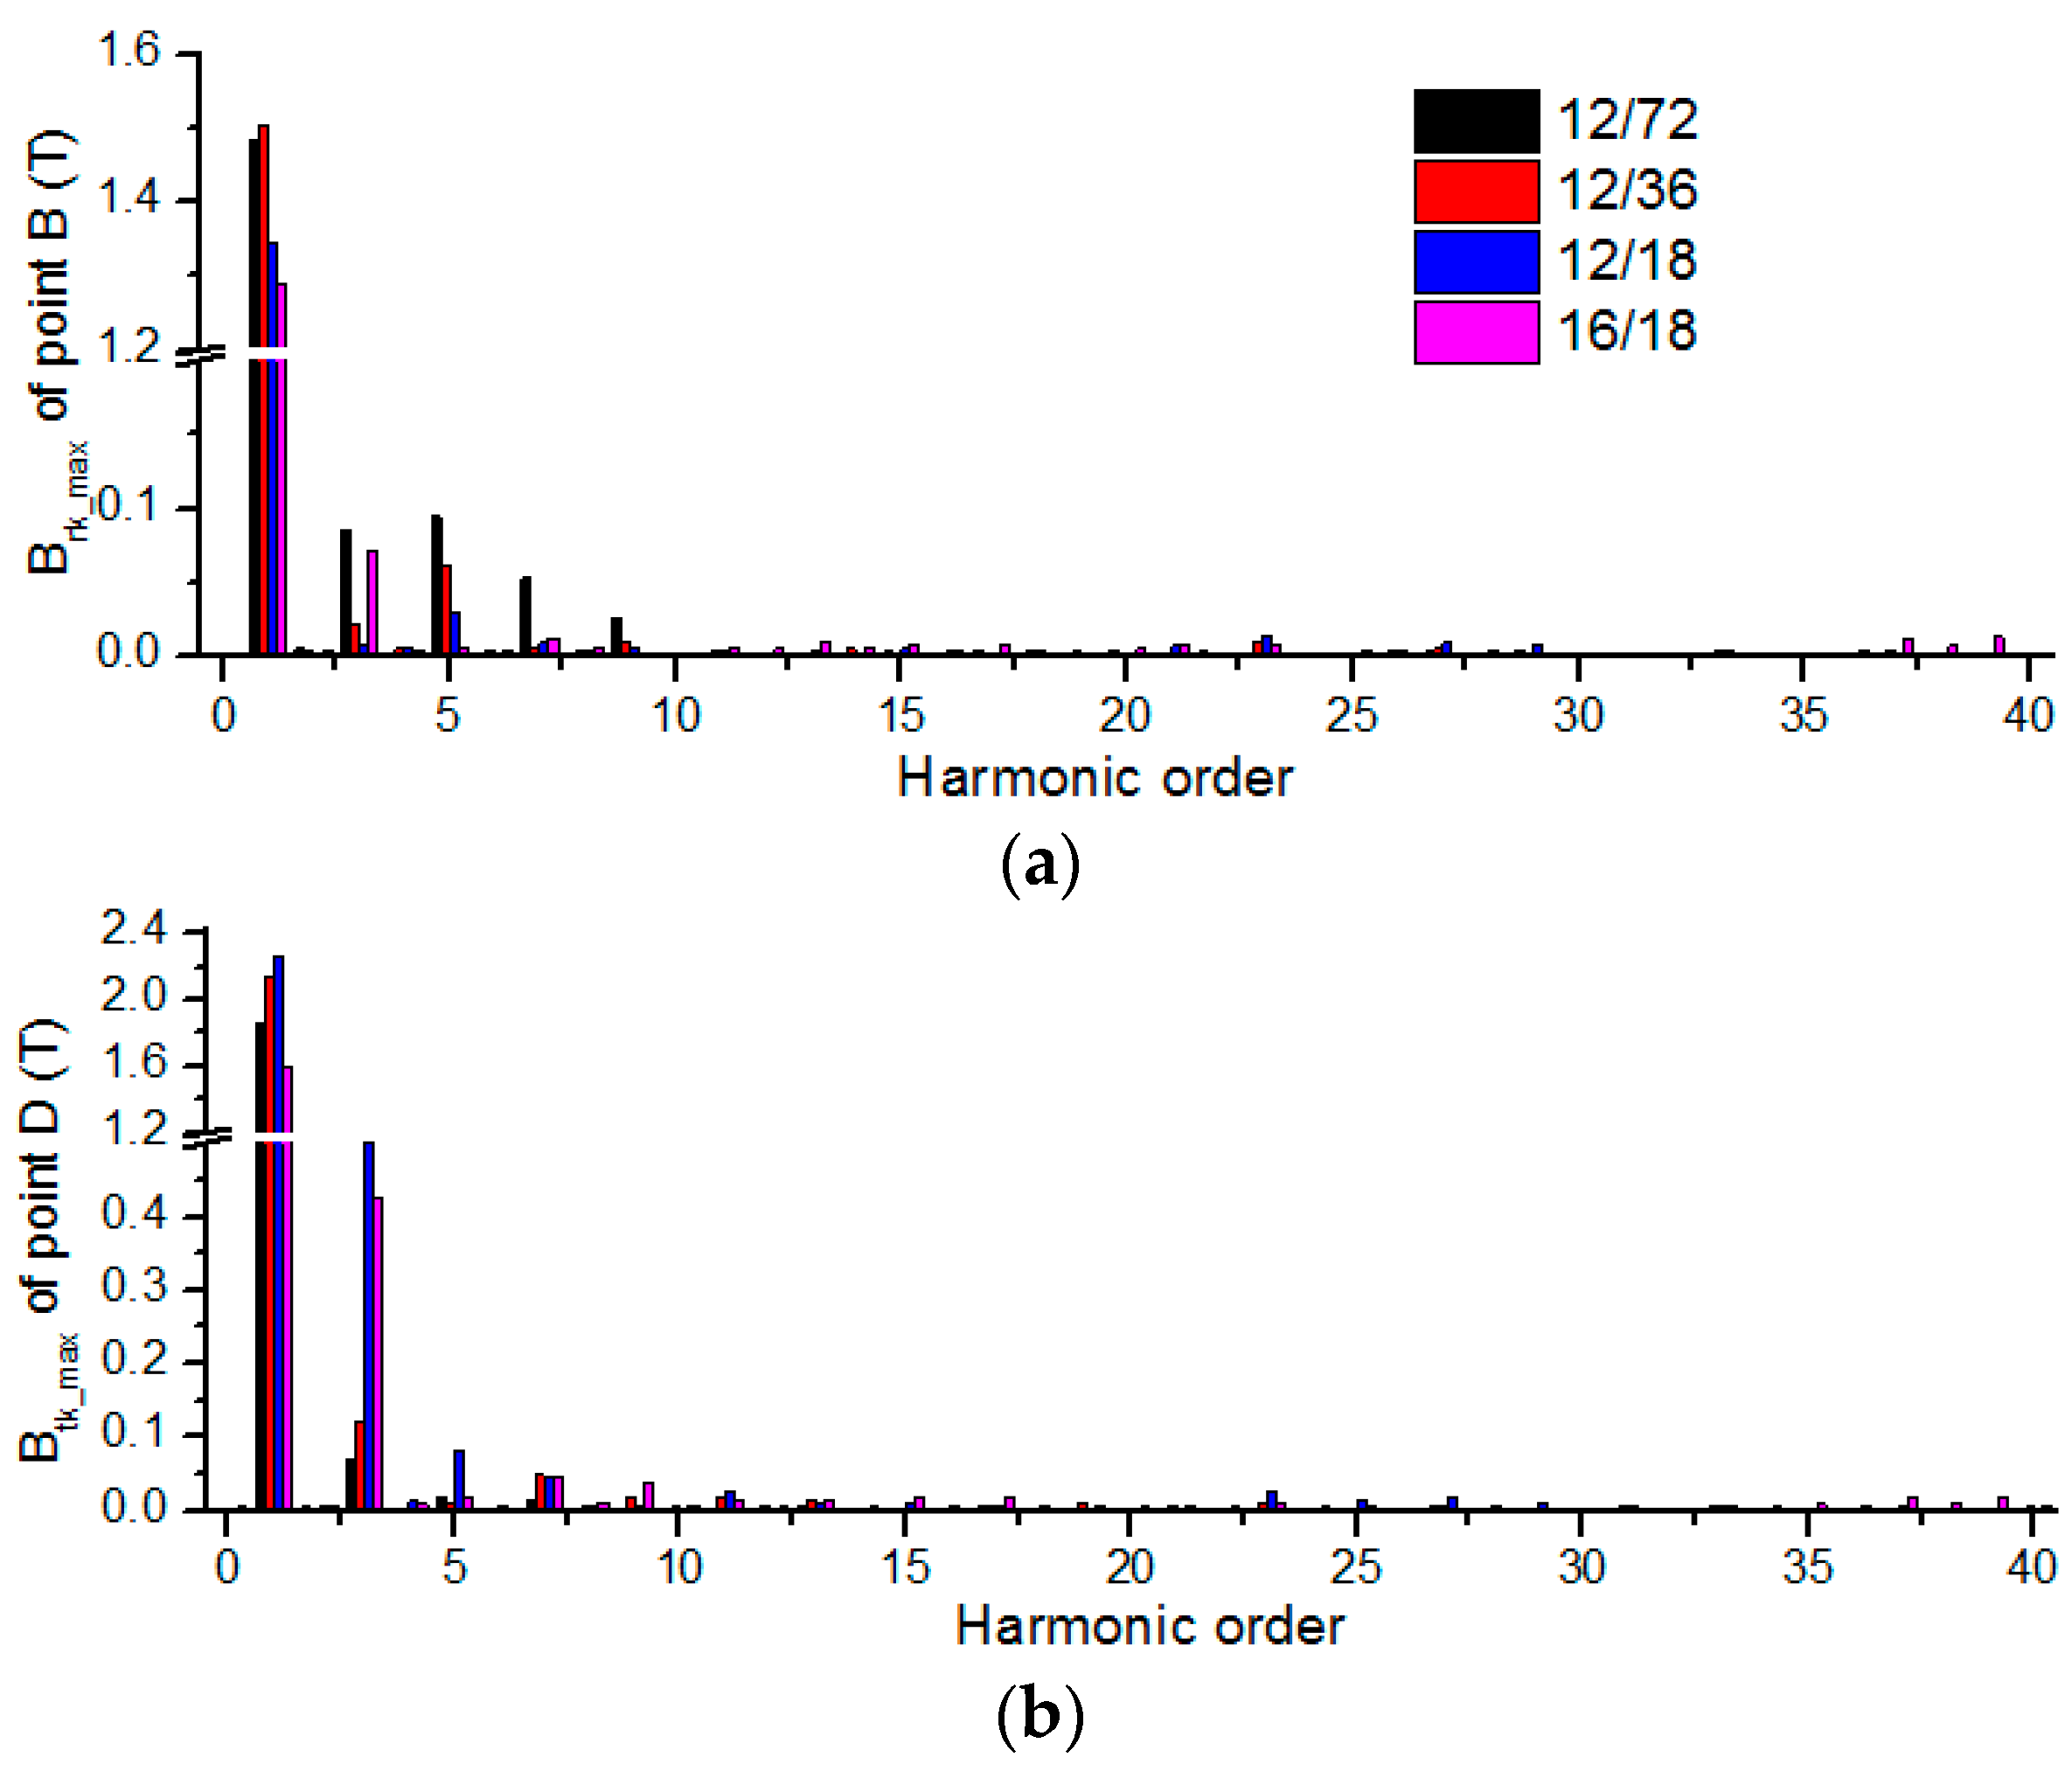
The distribution of the magnetic field and core loss in the different stator regions is different because of the nonlinearity of the steel sheet. In this section, the harmonic amplitudes of flux density at points B and D are presented in Figure 17, where Brk_max is the harmonic amplitudes of radial component of flux density, and Btk_max is the harmonic amplitudes of tangential component of flux density. It can be seen that due to the armature reaction, the flux density fundamental amplitude reaches the maximum value in the 12/36 machine and the harmonic flux density with a low order had a maximum value in the 12/72 machine at point B. However, at point D, the flux density fundamental and harmonic amplitudes of the 12/18 machine achieved maximum values. In the 16/18 machine, because the strong flux-weakening effect is caused by the d axis current, the fundamental amplitude of flux density reached the minimum value, but the harmonic of the high order was large.
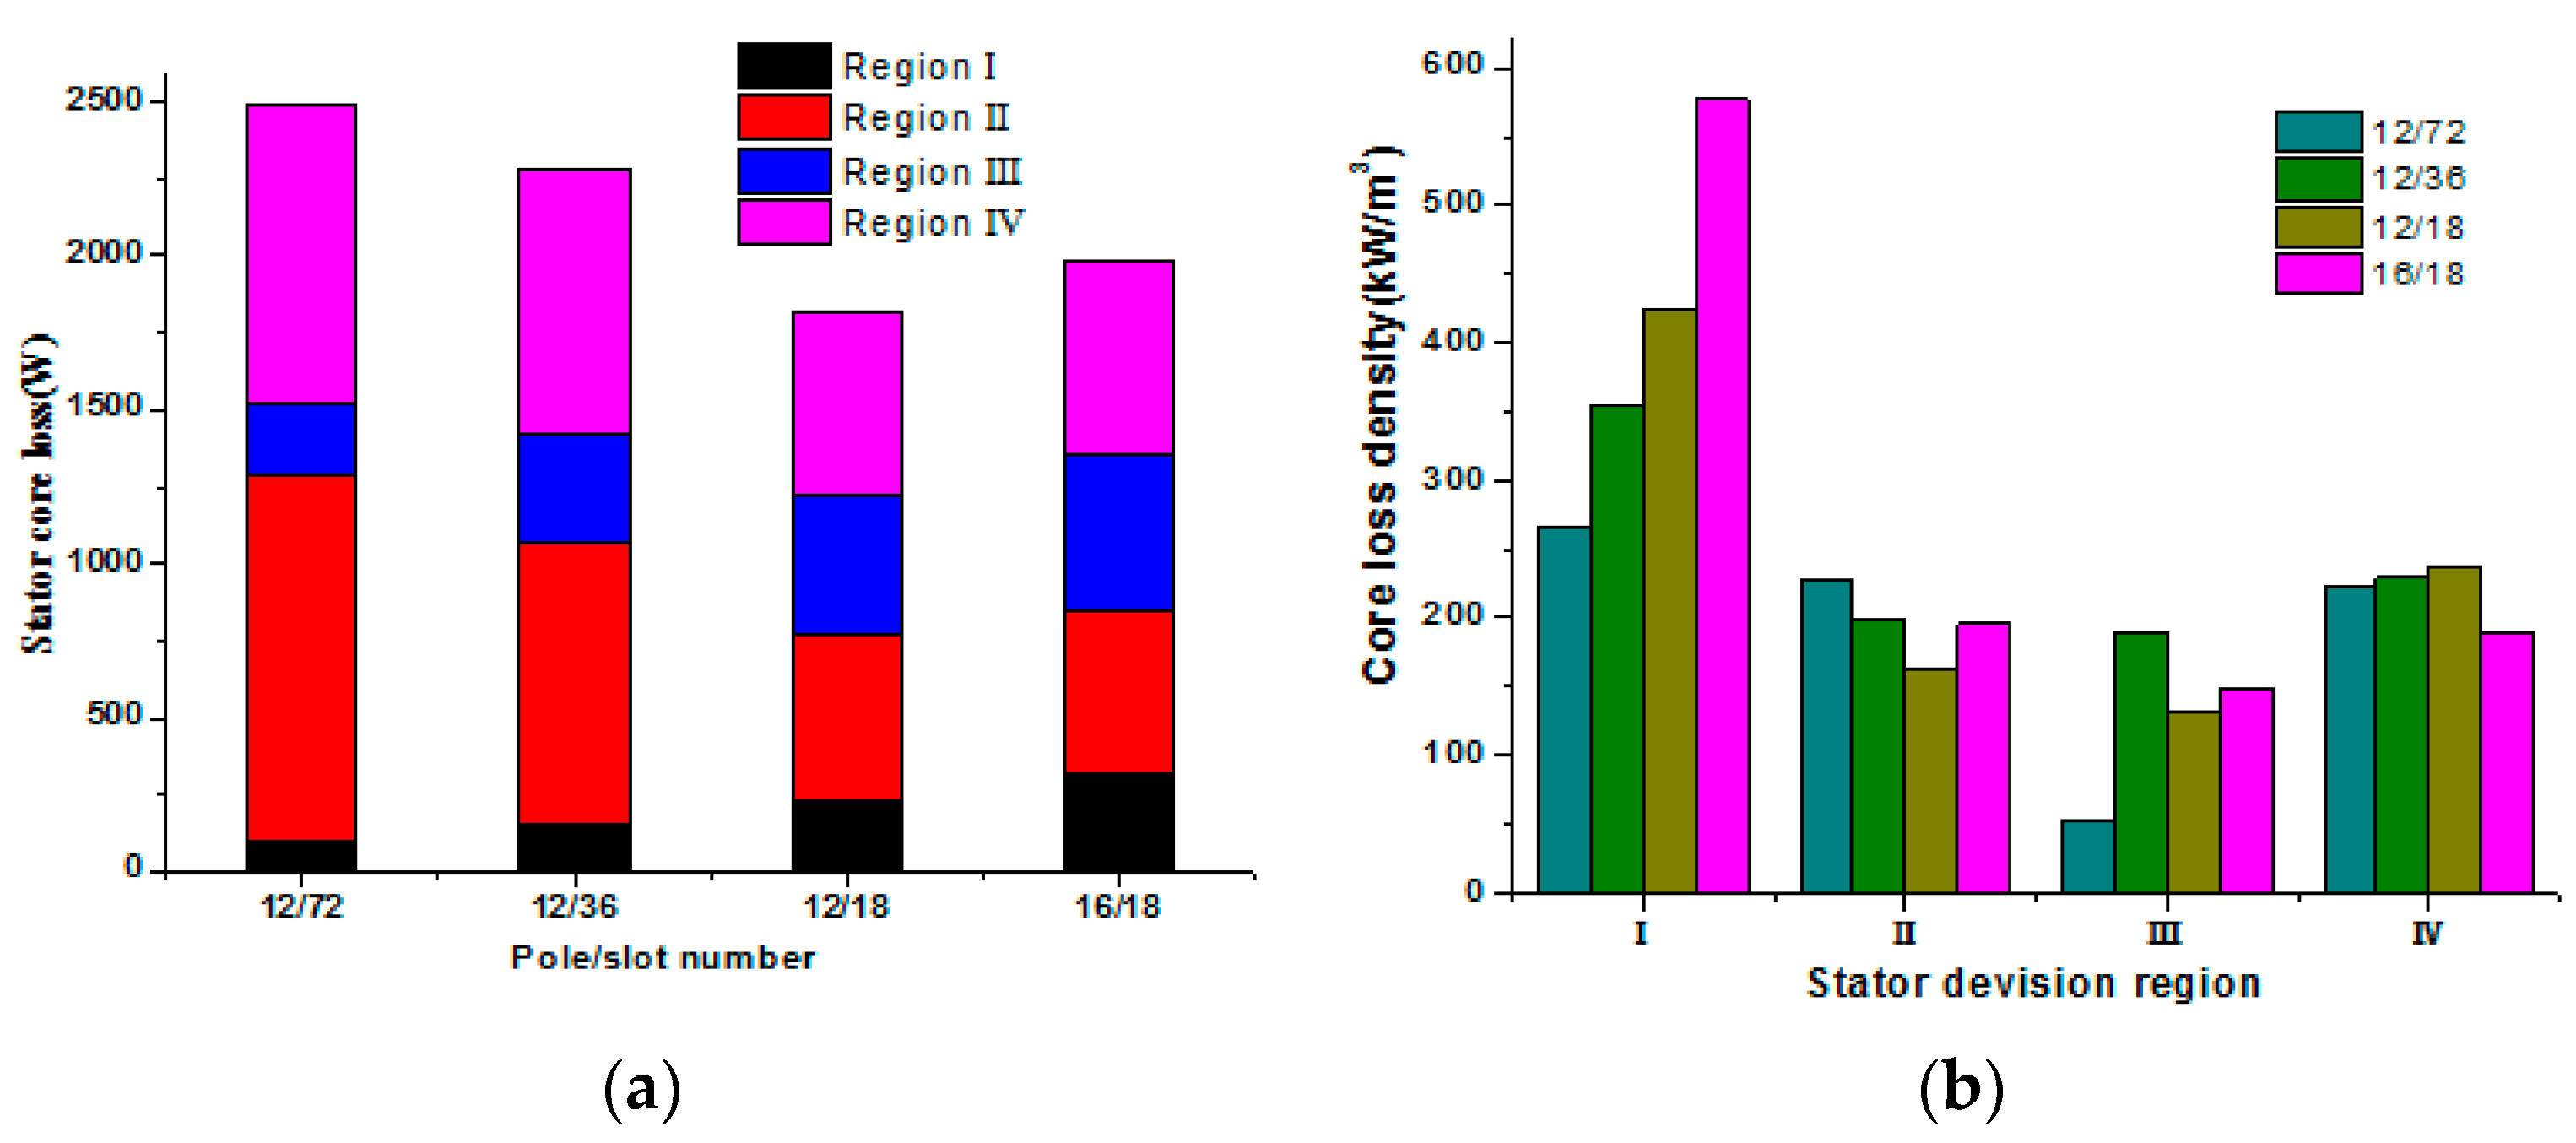
The core loss in different regions can be calculated with Equations (11) and (12). Figure 18a shows the stator core loss in the different regions. Because the flux density caused by the armature reaction is different, the core loss and core loss density under different pole/slot number combinations have great differences. The core loss achieved the minimum value in the 12/18 machine, while the core loss had a higher value in the 12/72 machine. In addition, the core loss of the 16/18 machine was larger than the core loss of the 12/18 machine, due to the high harmonic component of flux density. Figure 18b shows the core loss density in different regions. It is observed that the core loss density of the 16/18 machine was obviously larger than the core loss density of the other machines, especially in the tooth-tip of region I. The core loss density of tooth (region II) and yoke (region IV) in the 12/72 machine had high values, whereas the core loss density in region III decreased by a big margin. Moreover, the core loss density in region III in the 12/36 machine was larger than the core loss density in the other machine.
Due to the different armature currents and magnetic fields under the various pole/slot number combinations, the influence of the armature current on copper loss and rotor eddy current loss was different from that of the armature current on the core loss, at the same rated operating point. Therefore, the variation in performance of core loss is different from that of total loss in the machine of pole/slot number combinations. The total loss, including copper loss, rotor loss and core loss at the rated operating point, is presented in Table 4.
It can be seen that although the core loss decreased in the 12/36 machines, copper loss and rotor eddy current loss increased due to the large phase current, so the total loss in the 12/36 machine achieved a higher value. Meanwhile, the core loss in the 12/72 machine was the highest, but the armature current was lower than the current of the other machines, so the copper loss and eddy current loss were lower, and the total loss was relatively low. In addition, the total loss in the 12/18 machine reached the minimum value. This was due to the small resistance, which resulted in a lower copper loss. In the 16/18 machine, the high armature current produced a higher copper loss and eddy current loss, thus the total loss was larger than that in the 12/72 machine.
Under the same load conditions, the machine electromagnetic parameters vary with the pole/slot number combinations, so the armature currents of the machine with different pole/slot number combinations at the rated operating point were different. In this way, the armature reaction may have resulted in the various flux density waveforms in different stator parts, and the losses in performance were greatly different from each other. Therefore, in machine design for pole/slot number combinations, it is necessary to analyze the influence of pole/slot number combinations on the magnetic field, together with the total loss.
6. Conclusions
This paper presents a method for calculating the core loss of a permanent magnet synchronous machine under SVPWM excitation. Taking the magnetic saturation and cross coupling into consideration, the PM motor model has been modified to calculate the d-q axis current in a given load condition. The stator core loss can be obtained by the core loss analytical model, corresponding to the rotational magnetic field, which is caused by the permanent magnet and armature reaction. By this method, the core loss of the IPMSM under SVPWM excitation was obtained, and the influences of saturation on the armature current, magnetic field distribution and core loss were also discussed, in comparison with the results from the conventional model. The accuracy of this method was validated by the experimental results.
Using the proposed method, the influence of pole/slot number combinations on the core loss were investigated. The machine saturation parameters, including d-q axis flux-linkage, vary with machines of different pole/slot number combinations, so the armature current harmonic at the rated operating point is different under the same load conditions, which results in the variations in core loss and total loss. With respect to the four machines of different pole/slot number combinations mentioned in this paper, the core loss in the 12/72 machine reached the maximum value, but the total loss in the 12/36 machine achieved a higher value. Therefore, in machine design for pole/slot number combinations, it is necessary to comprehensively analyze the influence of pole/slot number combinations on the magnetic field, together with the total loss.
Acknowledgments
This work is supported in part by the International Cooperation Research Program of china (Grant No. 2015DFE72810). This work is also supported by the National Natural Science Foundation of china (Grant No. 5167070711).
Author Contributions
Yanli Feng conceived the proposed method for calculating stator core losses in the IPMSM machines under SVPWM excitation, analyzed the data, and drafted the manuscript; Chengning Zhang contributed analysis tools.
Conflicts of Interest
The authors declare no conflict of interest.
References
- Liu, X.; Du, J.; Liang, D. Analysis and Speed Ripple Mitigation of a Space Vector Pulse Width Modulation-Based Permanent Magnet Synchronous Motor with a Particle Swarm Optimization Algorithm. Energies 2016, 9, 923. [Google Scholar] [CrossRef]
- Tian, Z.; Zhang, C.N.; Zhang, S. Analytical Calculation of Magnetic Field Distribution and Stator Iron Losses for Surface-Mounted Permanent Magnet Synchronous Machines. Energies 2017, 10. [Google Scholar] [CrossRef]
- Kowal, D.; Sergeant, P.; Dupre, L.; Vandenbossche, L. Comparison of iron loss models for electrical machines with different frequency domain and time domain methods for excess loss prediction. IEEE Trans. Magn. 2015, 51, 1–10. [Google Scholar] [CrossRef]
- Kowal, D.; Sergeant, P.; Dupre, L.; Vandenbossche, L. Comparison of frequency and Time-Domain iron and magnet loss modeling including PWM harmonics in a PMSG for a wind energy application. IEEE Trans. Energy Convers. 2015, 30, 376–486. [Google Scholar] [CrossRef]
- Miyama, Y.; Hazeyama, M.; Hanioka, S.; Watanabe, N.; Daikoku, A.; Inoue, M. PWM carrier harmonic iron loss reduction technique of permanent-magnet motors for electric vehicles. IEEE Trans. Ind. Appl. 2016, 52, 2865–2871. [Google Scholar] [CrossRef]
- Sun, Z.C.; Shen, J.X.; Jin, M.J.; Hao, H. Research of the influence of different PWM inverters on the iron losses for induction motors. In Proceedings of the 2014 17th International Conference on Electrical Machines and Systems, Hangzhou, China, 22–25 October 2014; pp. 96–100. [Google Scholar]
- Jeong, T.C.; Kim, W.H.; Kim, M.J. Current harmonics loss analysis of 150 kW traction interior permanent magnet synchronous motor through co-analysis of axis current control and finite element method. IEEE Trans. Magn. 2013, 49, 2343–2346. [Google Scholar] [CrossRef]
- Zhang, Y.L.; Gao, J.; Huang, S.D.; Peng, J.; Rong, F. Stator losses of permanent magnet synchronous generator under SVPWM modulation. J. Hunan Univ. (Nat. Sci.) 2016, 43, 87–93. [Google Scholar]
- Ding, X.F.; Guo, H.; Wen, M.; Li, B.B. Effect of saturation on iron loss in PMSM. In Proceedings of the 2014 17th International Conference on Electrical Machines and Systems, Hangzhou, China, 22–25 October 2014; pp. 3356–3360. [Google Scholar]
- Liang, P.X.; Pei, Y.L.; Chai, F.; Zhao, K. Analytical calculation of d- and q-axis inductance for interior permanent magnet motors based on winding function theory. Energies 2016, 9, 580. [Google Scholar] [CrossRef]
- Xiao, Y.; Zhou, L.B.; Wang, J.; Yang, R. Finite element computation of transient parameters of a salient-pole synchronous machine. Energies 2017, 10, 1015. [Google Scholar] [CrossRef]
- Ma, M.; Li, L.; Zhang, J.; Yu, J.; Zhang, H. Investigation of cross-coupling inductances for long-stator PM linear motor arranged in multiple segments. IEEE Trans. Magn. 2015, 51, 1–4. [Google Scholar]
- Rabiei, A.; Thiringer, T.; Alatalo, M.; Grunditz, E.A. Improved maximum-torque-per-ampere algorithm accounting for core saturation, cross-coupling effect, and temperature for a PMSM intended for vehicular applications. IEEE Trans. Electrif. 2016, 2, 150–159. [Google Scholar] [CrossRef]
- Sikder, C.; Husain, I.; Wen, O.Y. Design, control and implementation of a non-rare-earth flux switching permanent magnet machine. In Proceedings of the 2016 IEEE on Energy Conversion Congress and Exposition, Milwaukee, WI, USA, 18–22 September 2016. [Google Scholar]
- Nagura, H.; Iwaji, Y.; Nakatsugawa, J.; Iwasaki, N. New vector controller for PM motors which modeled the cross-coupling magnetic flux saturation. In Proceedings of the 2010 IEEE on Power Electronics Conference, Sapporo, Japan, 21–14 June 2010; pp. 1064–1070. [Google Scholar]
- Nakatsugawa, N.; Iwasaki, N.; Nagura, H.; Iwaji, Y. Proposal of mathematical models taking into consideration magnetic saturation and cross-coupling effects in permanent magnet synchronous motors. IEEE Trans. Ind. Appl. 2010, 130, 1212–1220. [Google Scholar] [CrossRef]
- Stumberger, B.; Stumberger, G.; Dolinar, D.; Hamler, A.; Trlep, M. Evaluation of saturation and cross-magnetization effects in interior permanent-magnet synchronous motor. IEEE Trans. Ind. Appl. 2003, 39, 1264–1271. [Google Scholar] [CrossRef]
- Xia, C.L.; Guo, L.Y.; Zhang, Z.; Shi, T.N.; Wang, H.M. Optimal Designing of Permanent Magnet Cavity to Reduce Iron Loss of Interior Permanent Magnet Machine. IEEE Trans. Magn. 2015, 51. [Google Scholar] [CrossRef]
- Hwang, C.C.; Chang, C.M.; Liu, C.T. A fuzzy-based taguchi method for multi-objective design of PM motors. IEEE Trans. Magn. 2013, 49, 2153–2156. [Google Scholar] [CrossRef]
- Zhu, Z.Q.; Wu, D.; Chu, W.Q. Influence of local magnetic saturation on iron losses in interior permanent magnet machines. In Proceedings of the 2016 IEEE Internation Conference on Electrical Machines, Lausanne, Switzerland, 4–7 September 2016; pp. 1822–1827. [Google Scholar]
- Zhu, Z.Q.; Wu, D. On-load voltage distortion in fractional-slot interior permanent magnet machines. IEEE Trans. Magn. 2015, 51, 1–9. [Google Scholar] [CrossRef]
- Lee, H.W.; Lee, K.D.; Kim, W.H.; Jang, I.S.; Kim, M.J.; Lee, J.J.; Lee, J. Parameter design of IPMSM with concentrated winding considering partial magnetic saturation. IEEE Trans. Magn. 2011, 47, 3653–3656. [Google Scholar] [CrossRef]
- Stumberger, B.; Hamler, A.; Gorican, V.; Jesenik, M.; Trlep, M. Accuracy of iron loss estimation in induction motors by using different iron loss models. J. Magn. Magn. Mater. 2003, 24, 272–276. [Google Scholar] [CrossRef]
- Guo, Y.G.; Zhu, J.G.; Lu, H.Y.; Lin, Z.W.; Li, Y.J. Core loss calculation for soft magnetic composite electrical machines. IEEE Trans. Magn. 2012, 48, 3112–3115. [Google Scholar] [CrossRef]
- Zhang, D.D.; Zhao, H.S.; Wang, Y.L.; Xu, G.R.; Liu, X.F. A piecewise variable coefficient model for precise analysis on iron losses of electrical machines. Trans. China Electrotech. Soc. 2016, 31, 16–23. [Google Scholar]
Figure 1.
Block diagram of SVPWM control.

Figure 2.
The relationship between the d-q axis flux-linkage and the d-q axis armature current. (a) The relationship between the d axis flux-linkage and current; (b) The relation between the q axis flux-linkage and current.
Figure 2.
The relationship between the d-q axis flux-linkage and the d-q axis armature current. (a) The relationship between the d axis flux-linkage and current; (b) The relation between the q axis flux-linkage and current.

Figure 3.
The modified PM motor model.
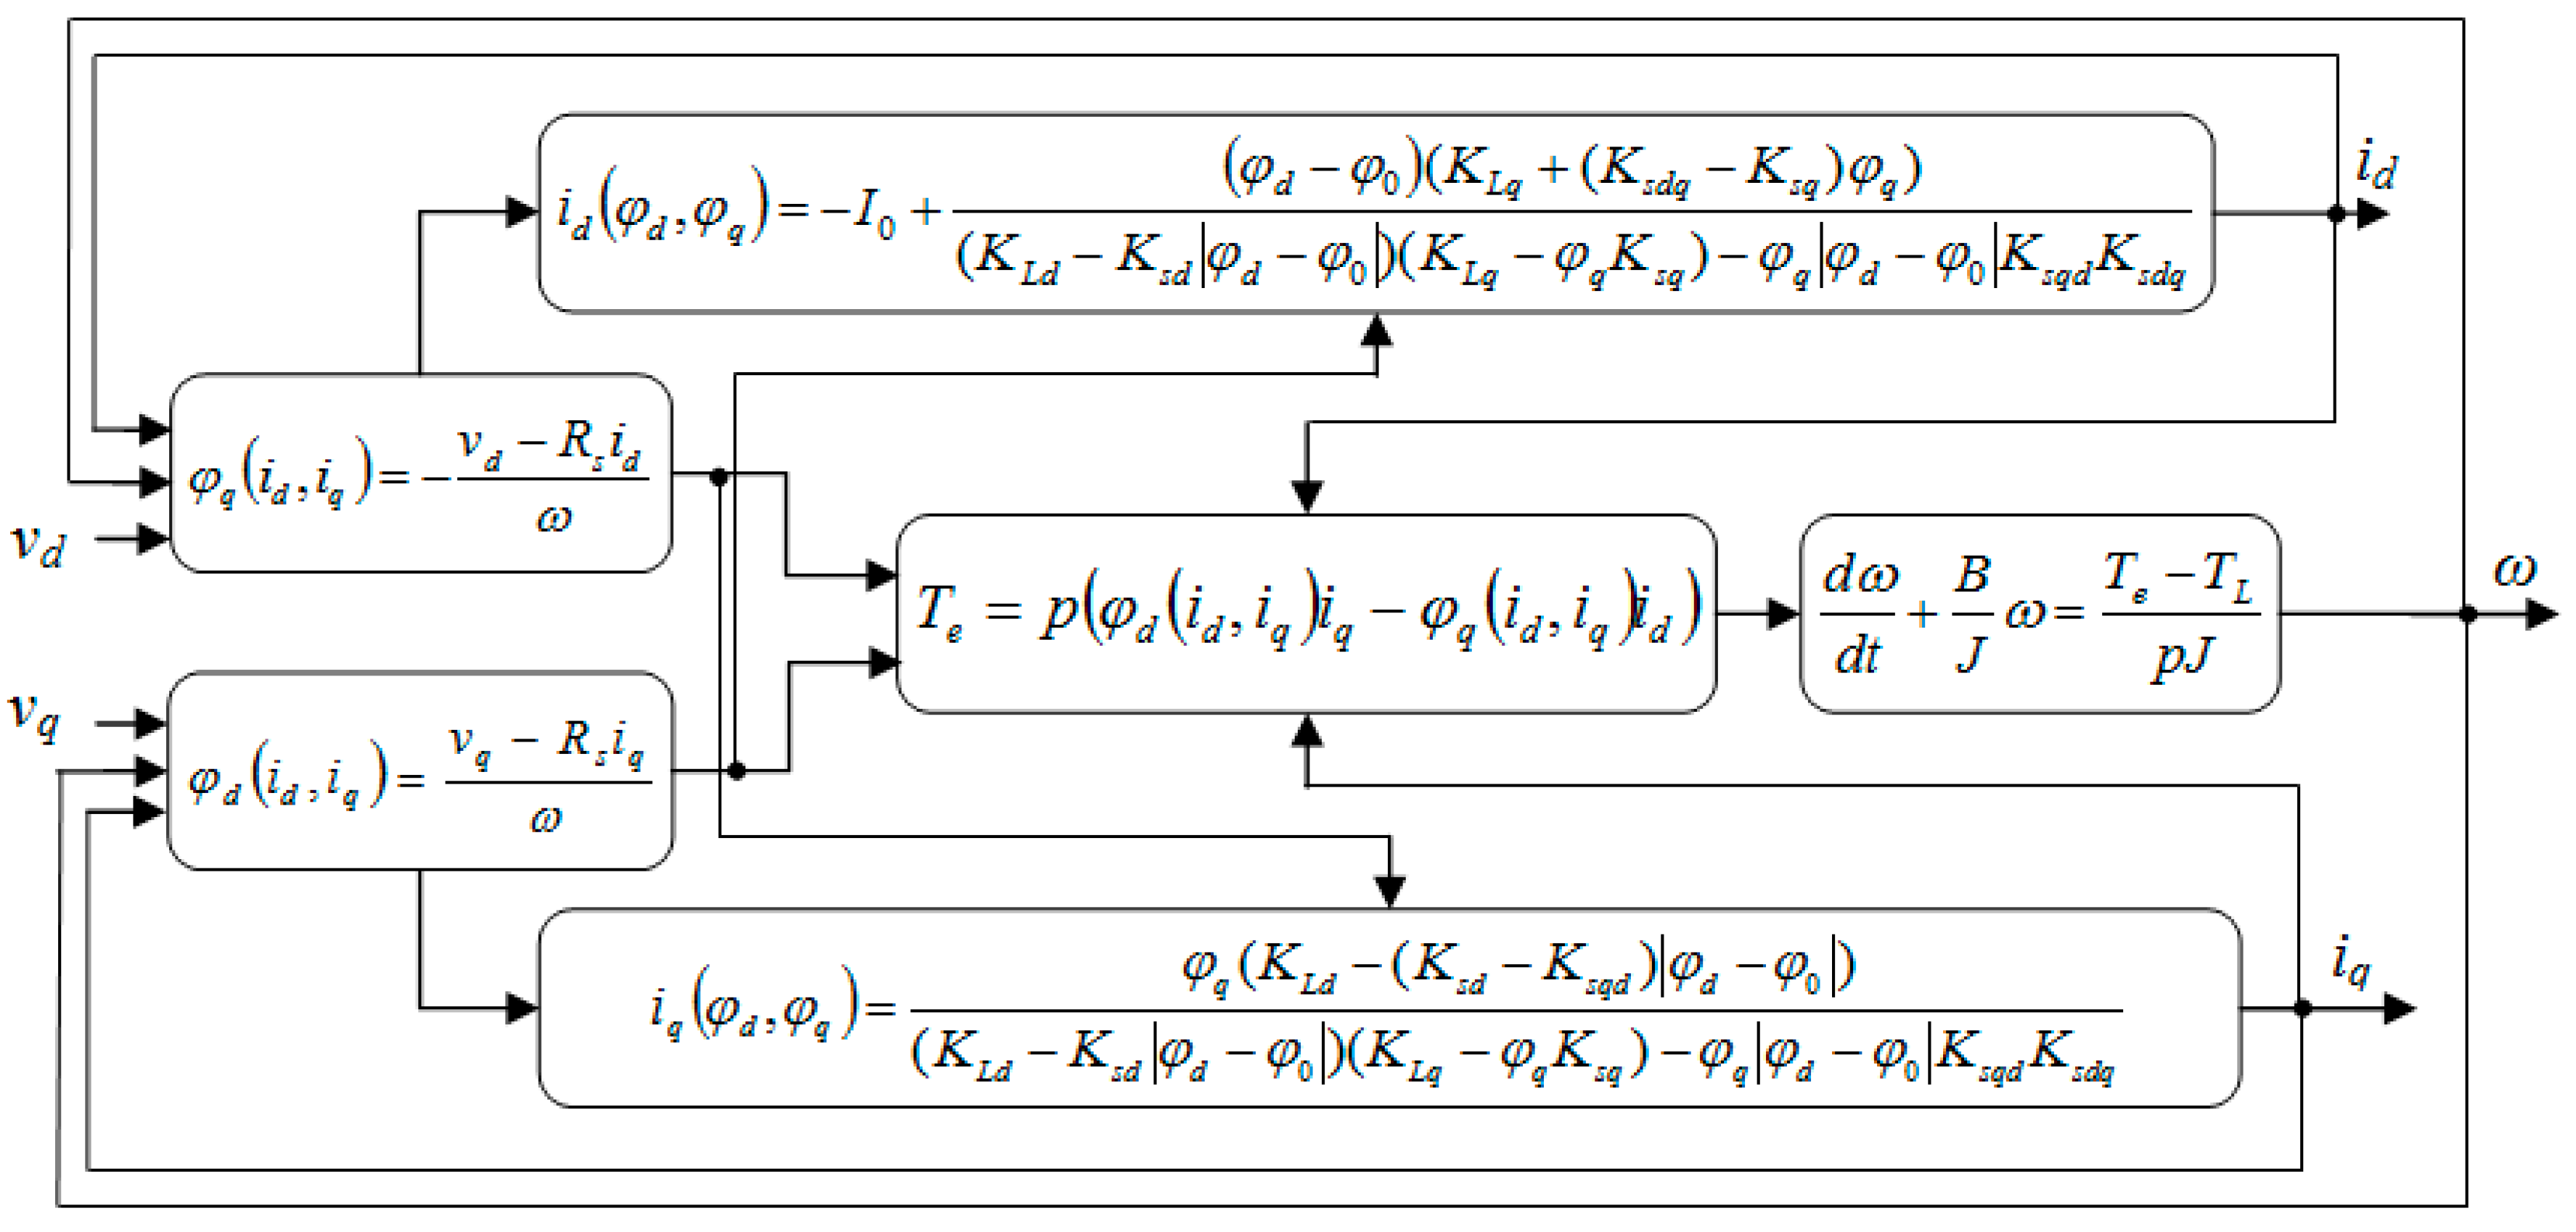
Figure 4.
The calculation flow chart of stator core loss, MPTA: maximum torque per ampere, PM: permanent magnet.
Figure 4.
The calculation flow chart of stator core loss, MPTA: maximum torque per ampere, PM: permanent magnet.

Figure 5.
The analysis model of interior permanent magnet synchronous machine (IPMSM), A: point in the border of the tooth-tip, B: point in the middle of the tooth-tip, C: point in the tooth, D: point in the yoke.
Figure 5.
The analysis model of interior permanent magnet synchronous machine (IPMSM), A: point in the border of the tooth-tip, B: point in the middle of the tooth-tip, C: point in the tooth, D: point in the yoke.

Figure 6.
The d-q axis flux-linkage comparison obtained by finite element analysis (FEA) and the proposed model. (a) The d axis flux-linkage; (b) The q axis flux-linkage.
Figure 6.
The d-q axis flux-linkage comparison obtained by finite element analysis (FEA) and the proposed model. (a) The d axis flux-linkage; (b) The q axis flux-linkage.

Figure 7.
The armature current harmonic at the rated operating point. (a) The armature current waveform; (b) The armature current harmonic.
Figure 7.
The armature current harmonic at the rated operating point. (a) The armature current waveform; (b) The armature current harmonic.

Figure 8.
The typical time variation curves of the radial and tangential component of flux density and elliptical flux density vector waveforms at points A, B, C, D, Br and Bt are the radial and tangential components of flux density, respectively, Elec. degree is the rotational electrical degree of machine..
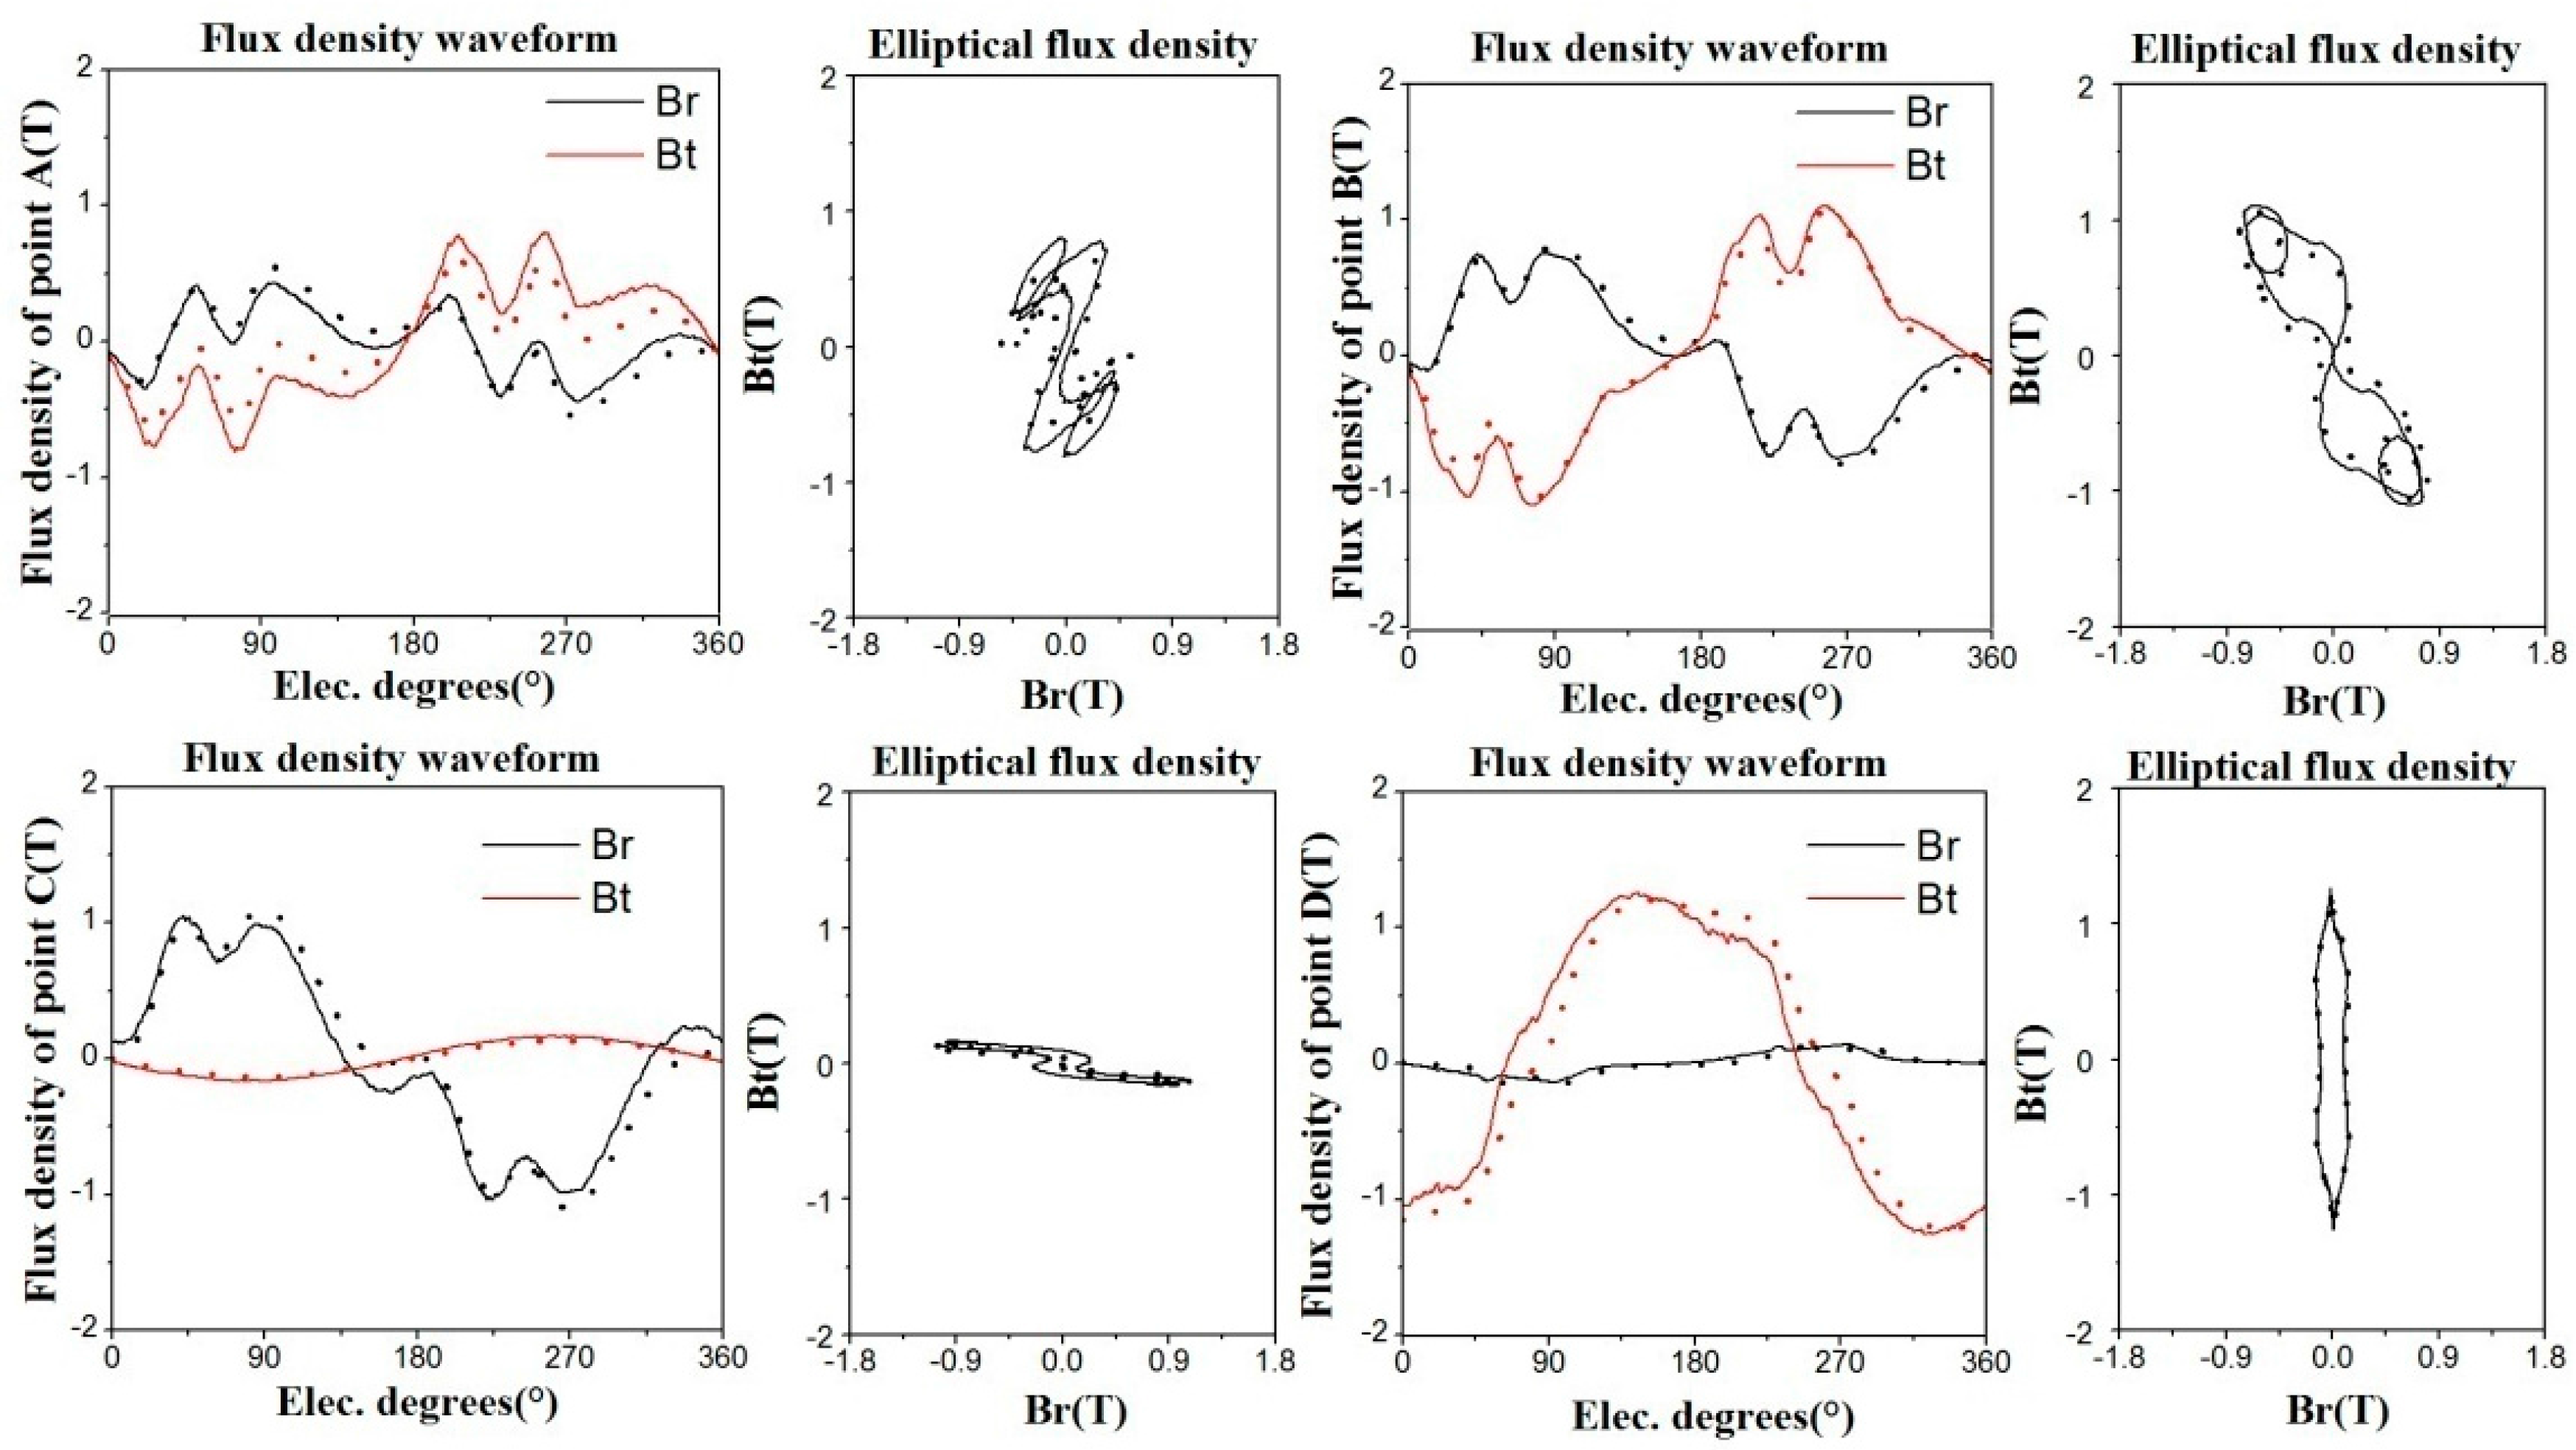
Figure 9.
The elliptical harmonic magnetic field vectors at points A, B, C, D.
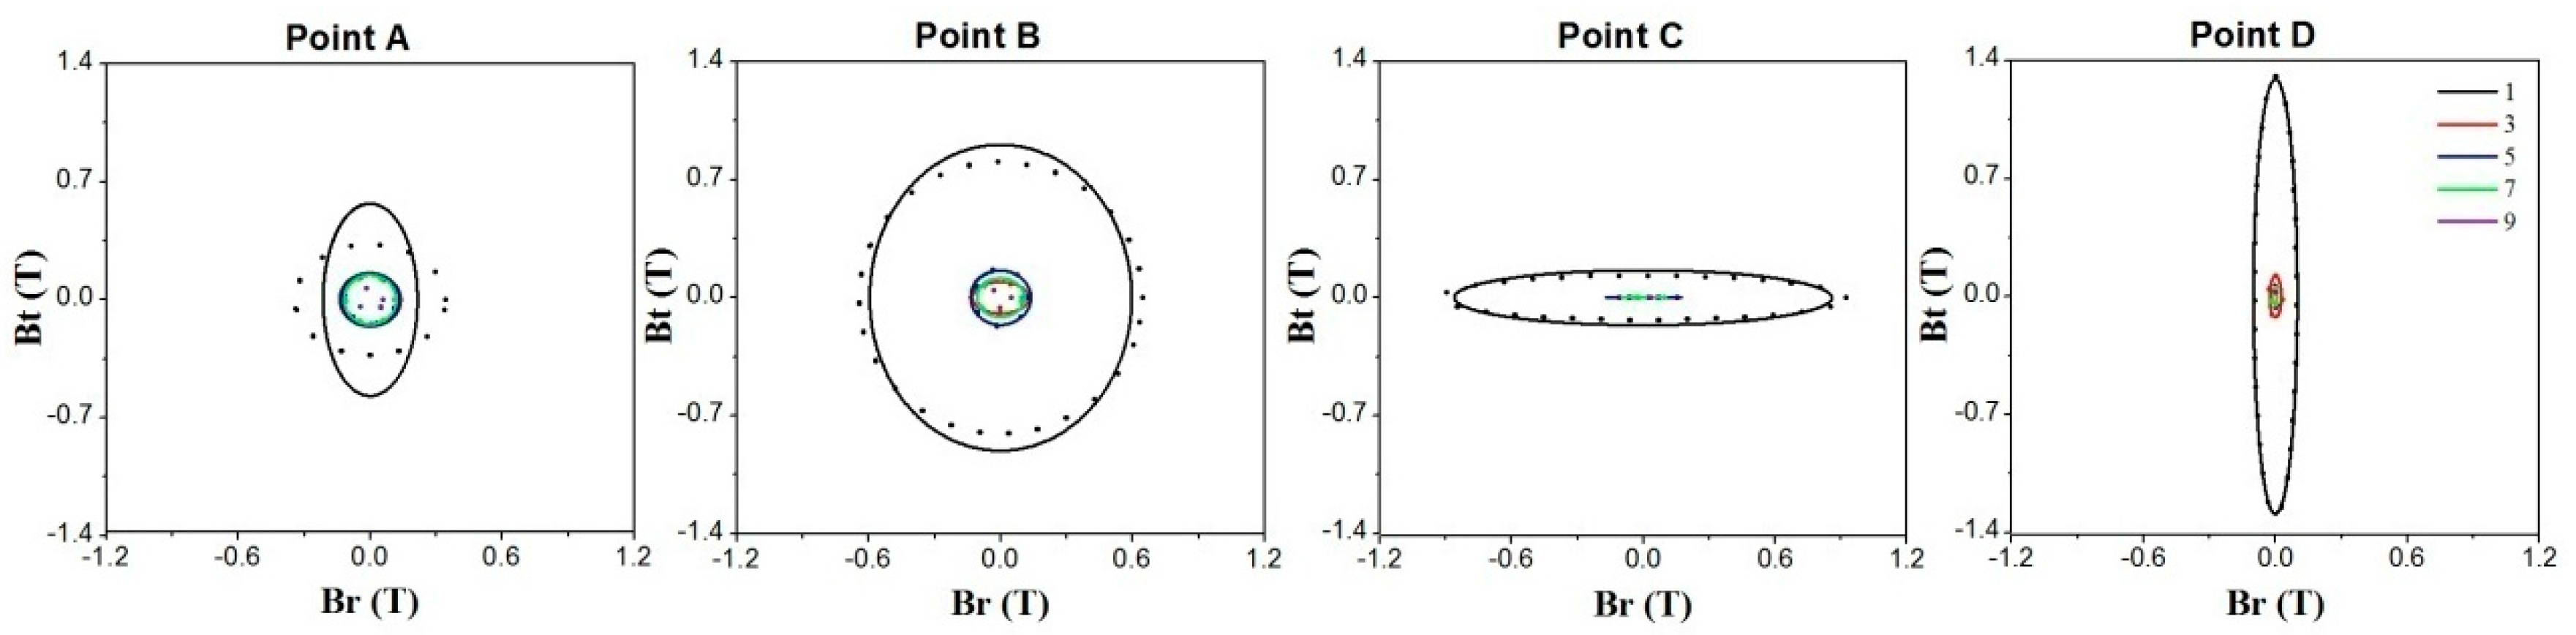
Figure 10.
The stator core loss comparison at the speed of 1000 rpm. (a) The stator core loss; (b) Errors from the core loss component comparison and total core loss comparison.
Figure 10.
The stator core loss comparison at the speed of 1000 rpm. (a) The stator core loss; (b) Errors from the core loss component comparison and total core loss comparison.
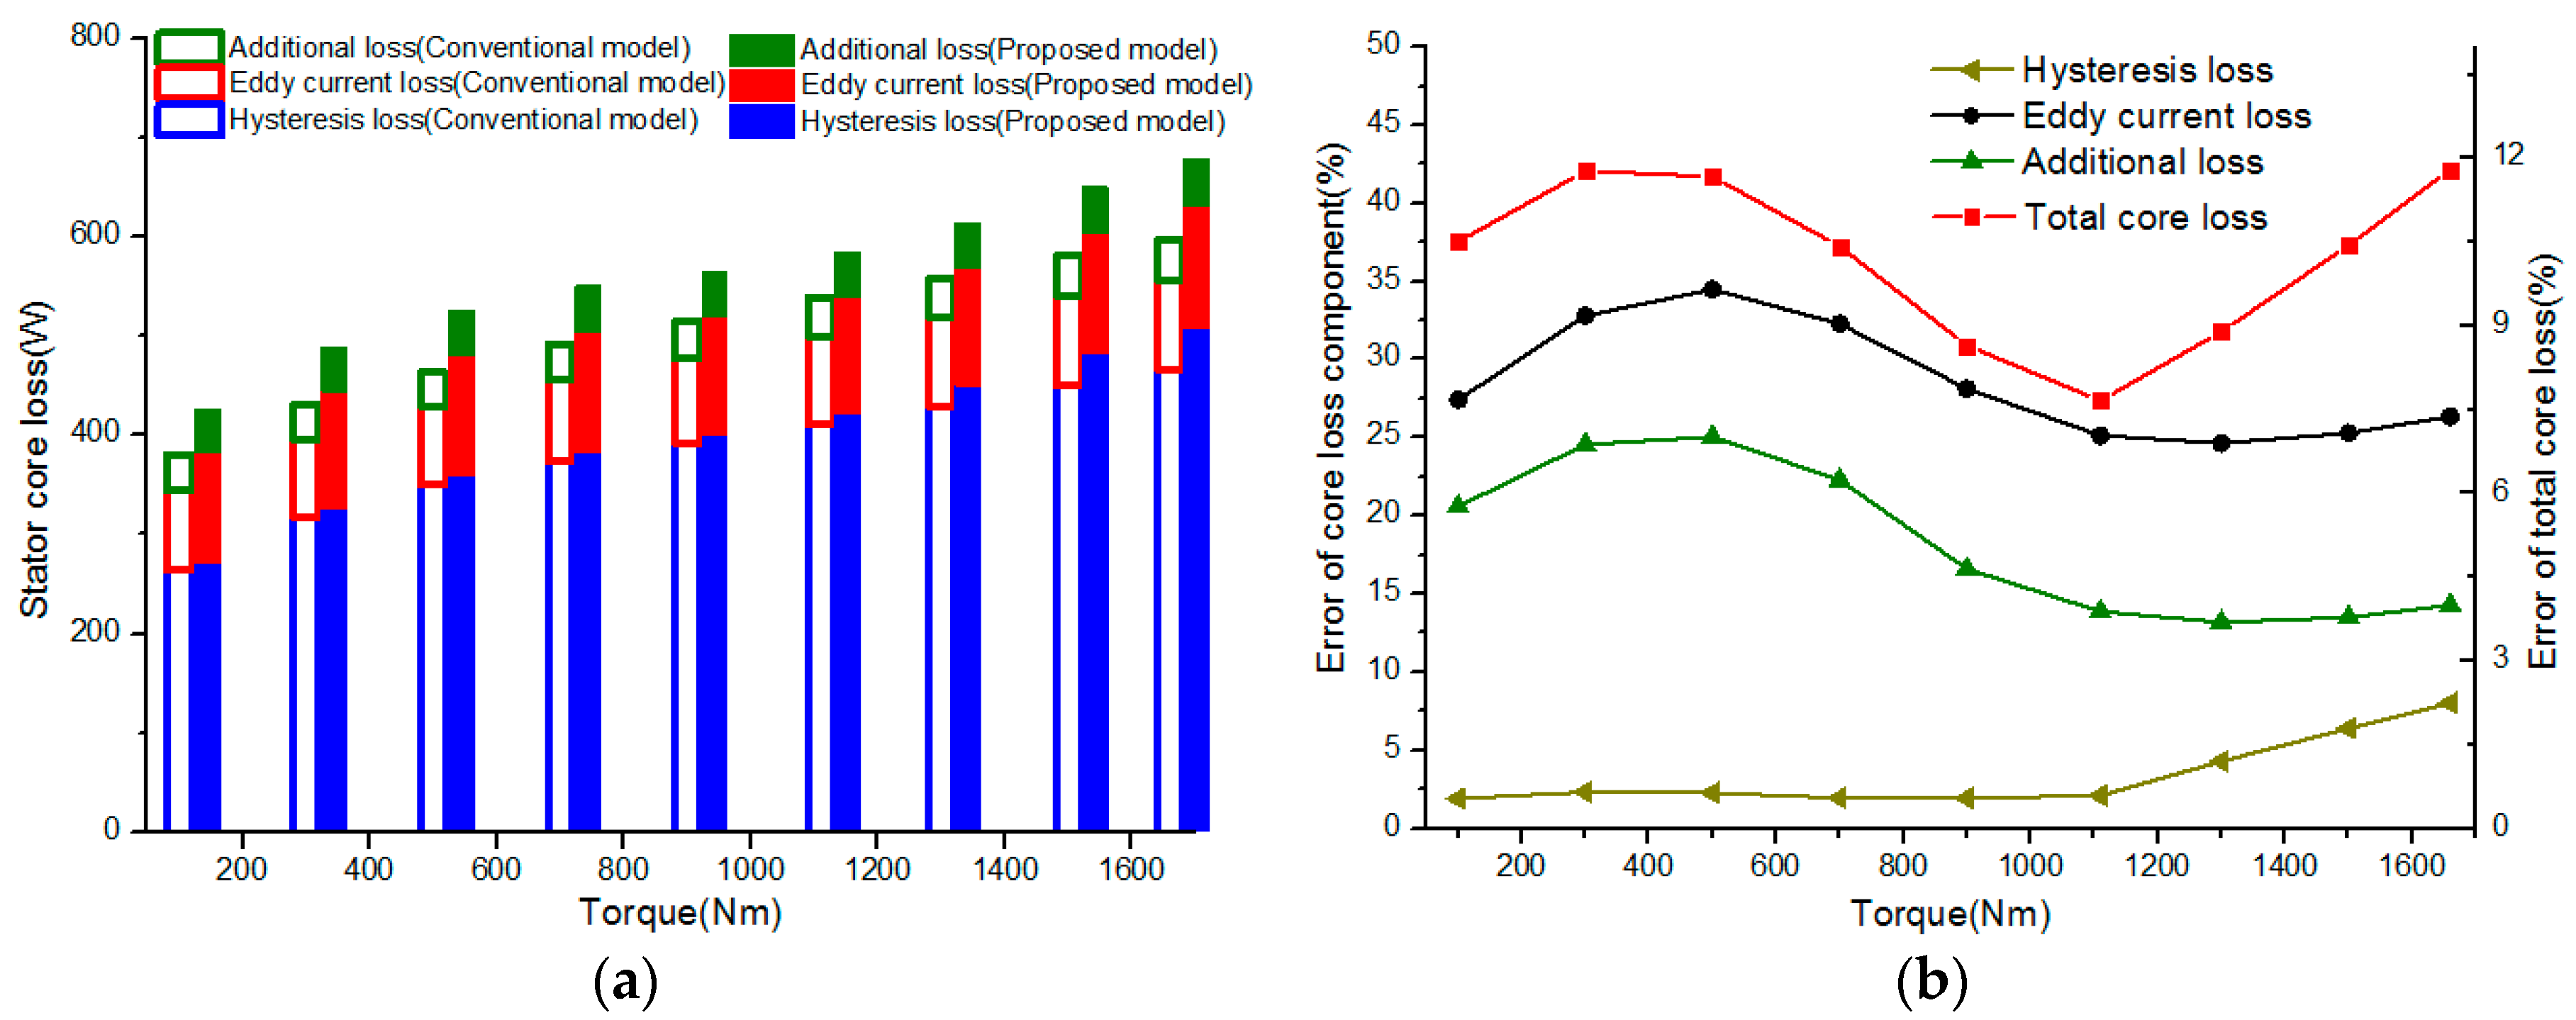
Figure 11.
The stator core loss comparison at a speed of 3185 rpm. (a) The stator core loss; (b) Errors of the core loss component comparison and total core loss comparison.
Figure 11.
The stator core loss comparison at a speed of 3185 rpm. (a) The stator core loss; (b) Errors of the core loss component comparison and total core loss comparison.

Figure 12.
The stator core loss comparison in the speed of 6000 rpm. (a) The stator core loss; (b) Error of the core loss component comparison and total core loss comparison.
Figure 12.
The stator core loss comparison in the speed of 6000 rpm. (a) The stator core loss; (b) Error of the core loss component comparison and total core loss comparison.

Figure 13.
The machine experimental platform. (a) The test machine; (b) The experimental platform.
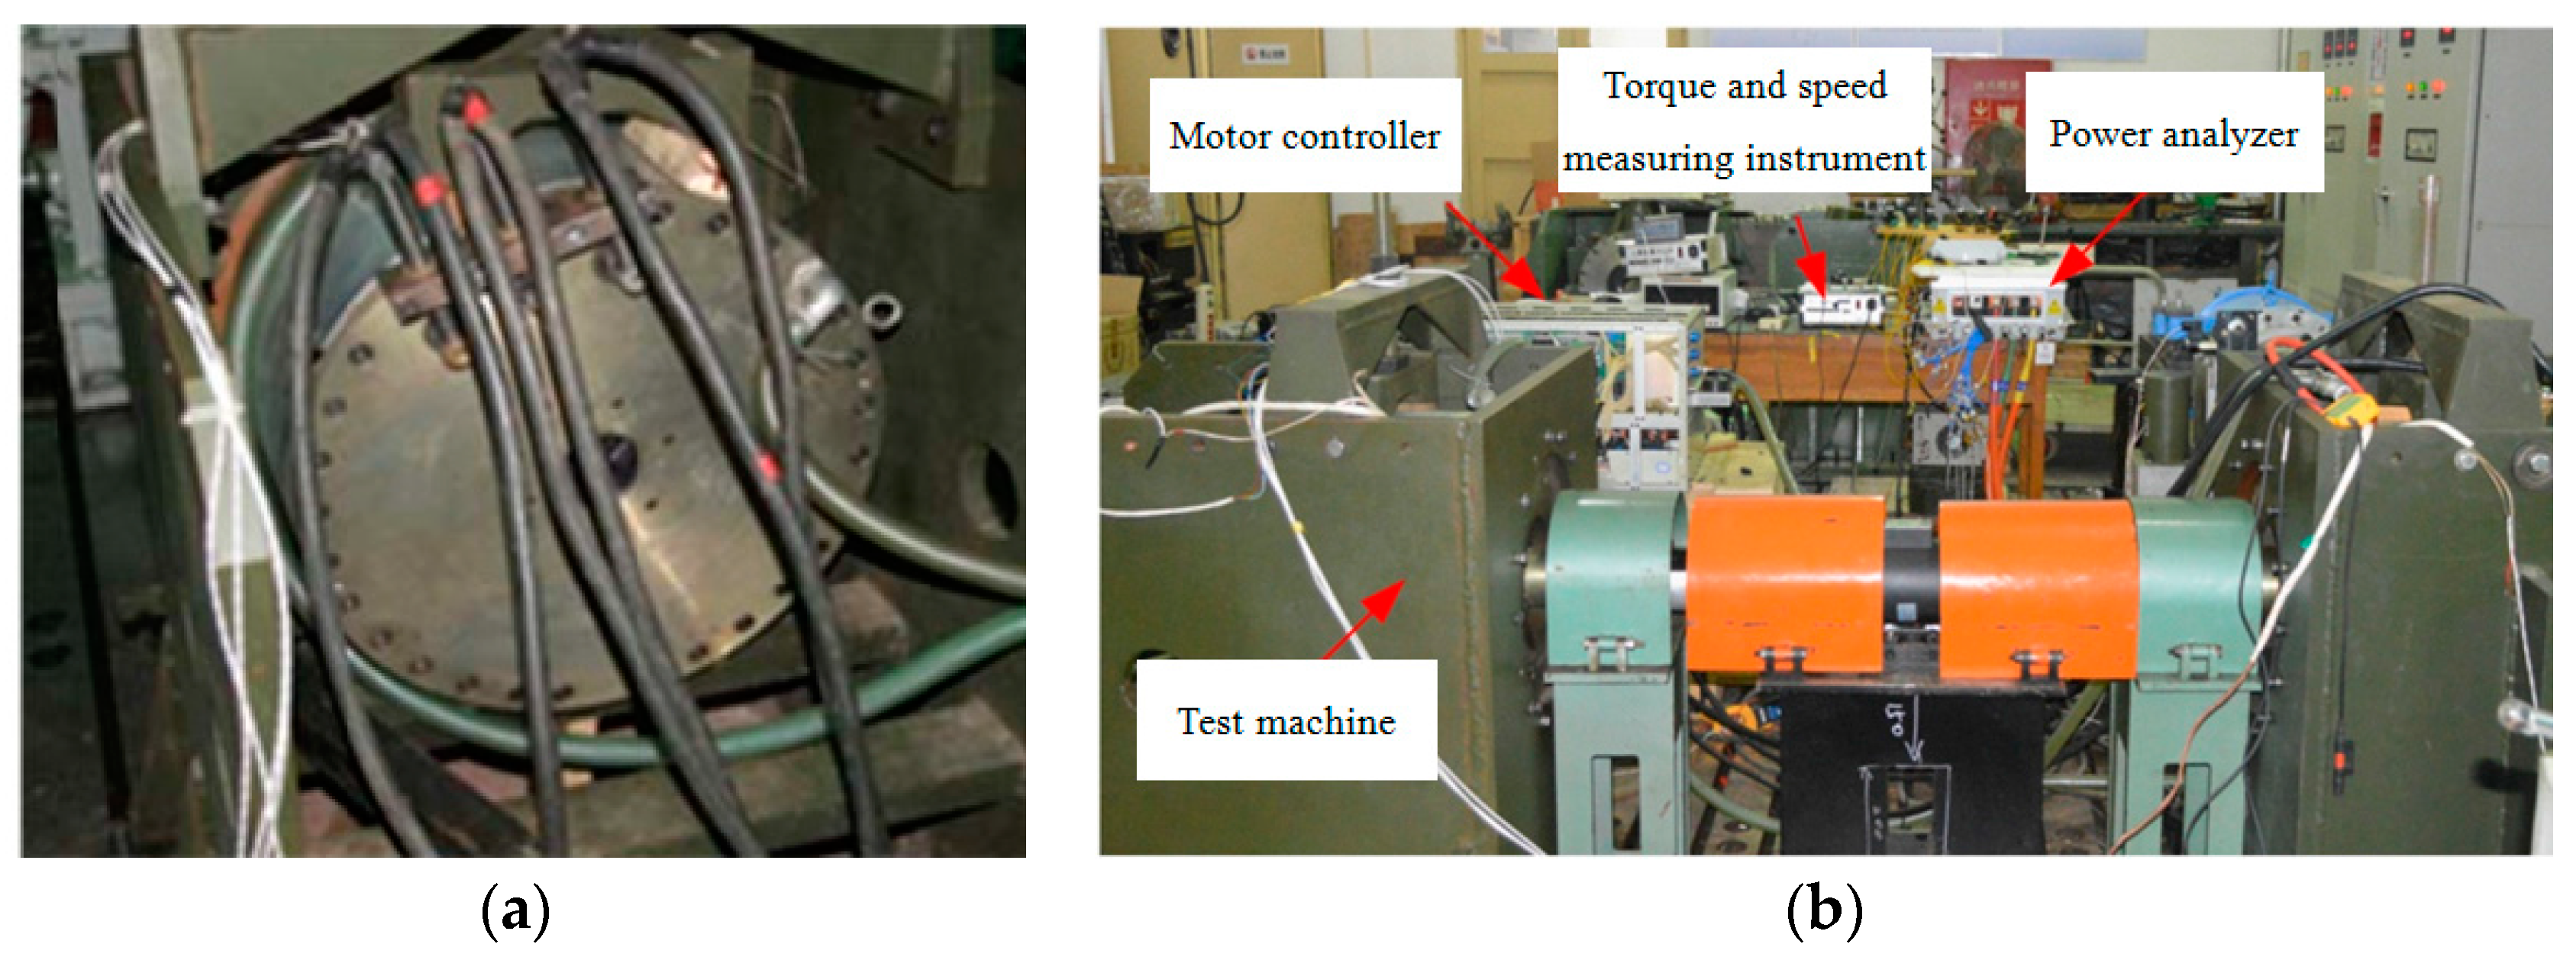
Figure 14.
The comparison of calculation and experimental results.
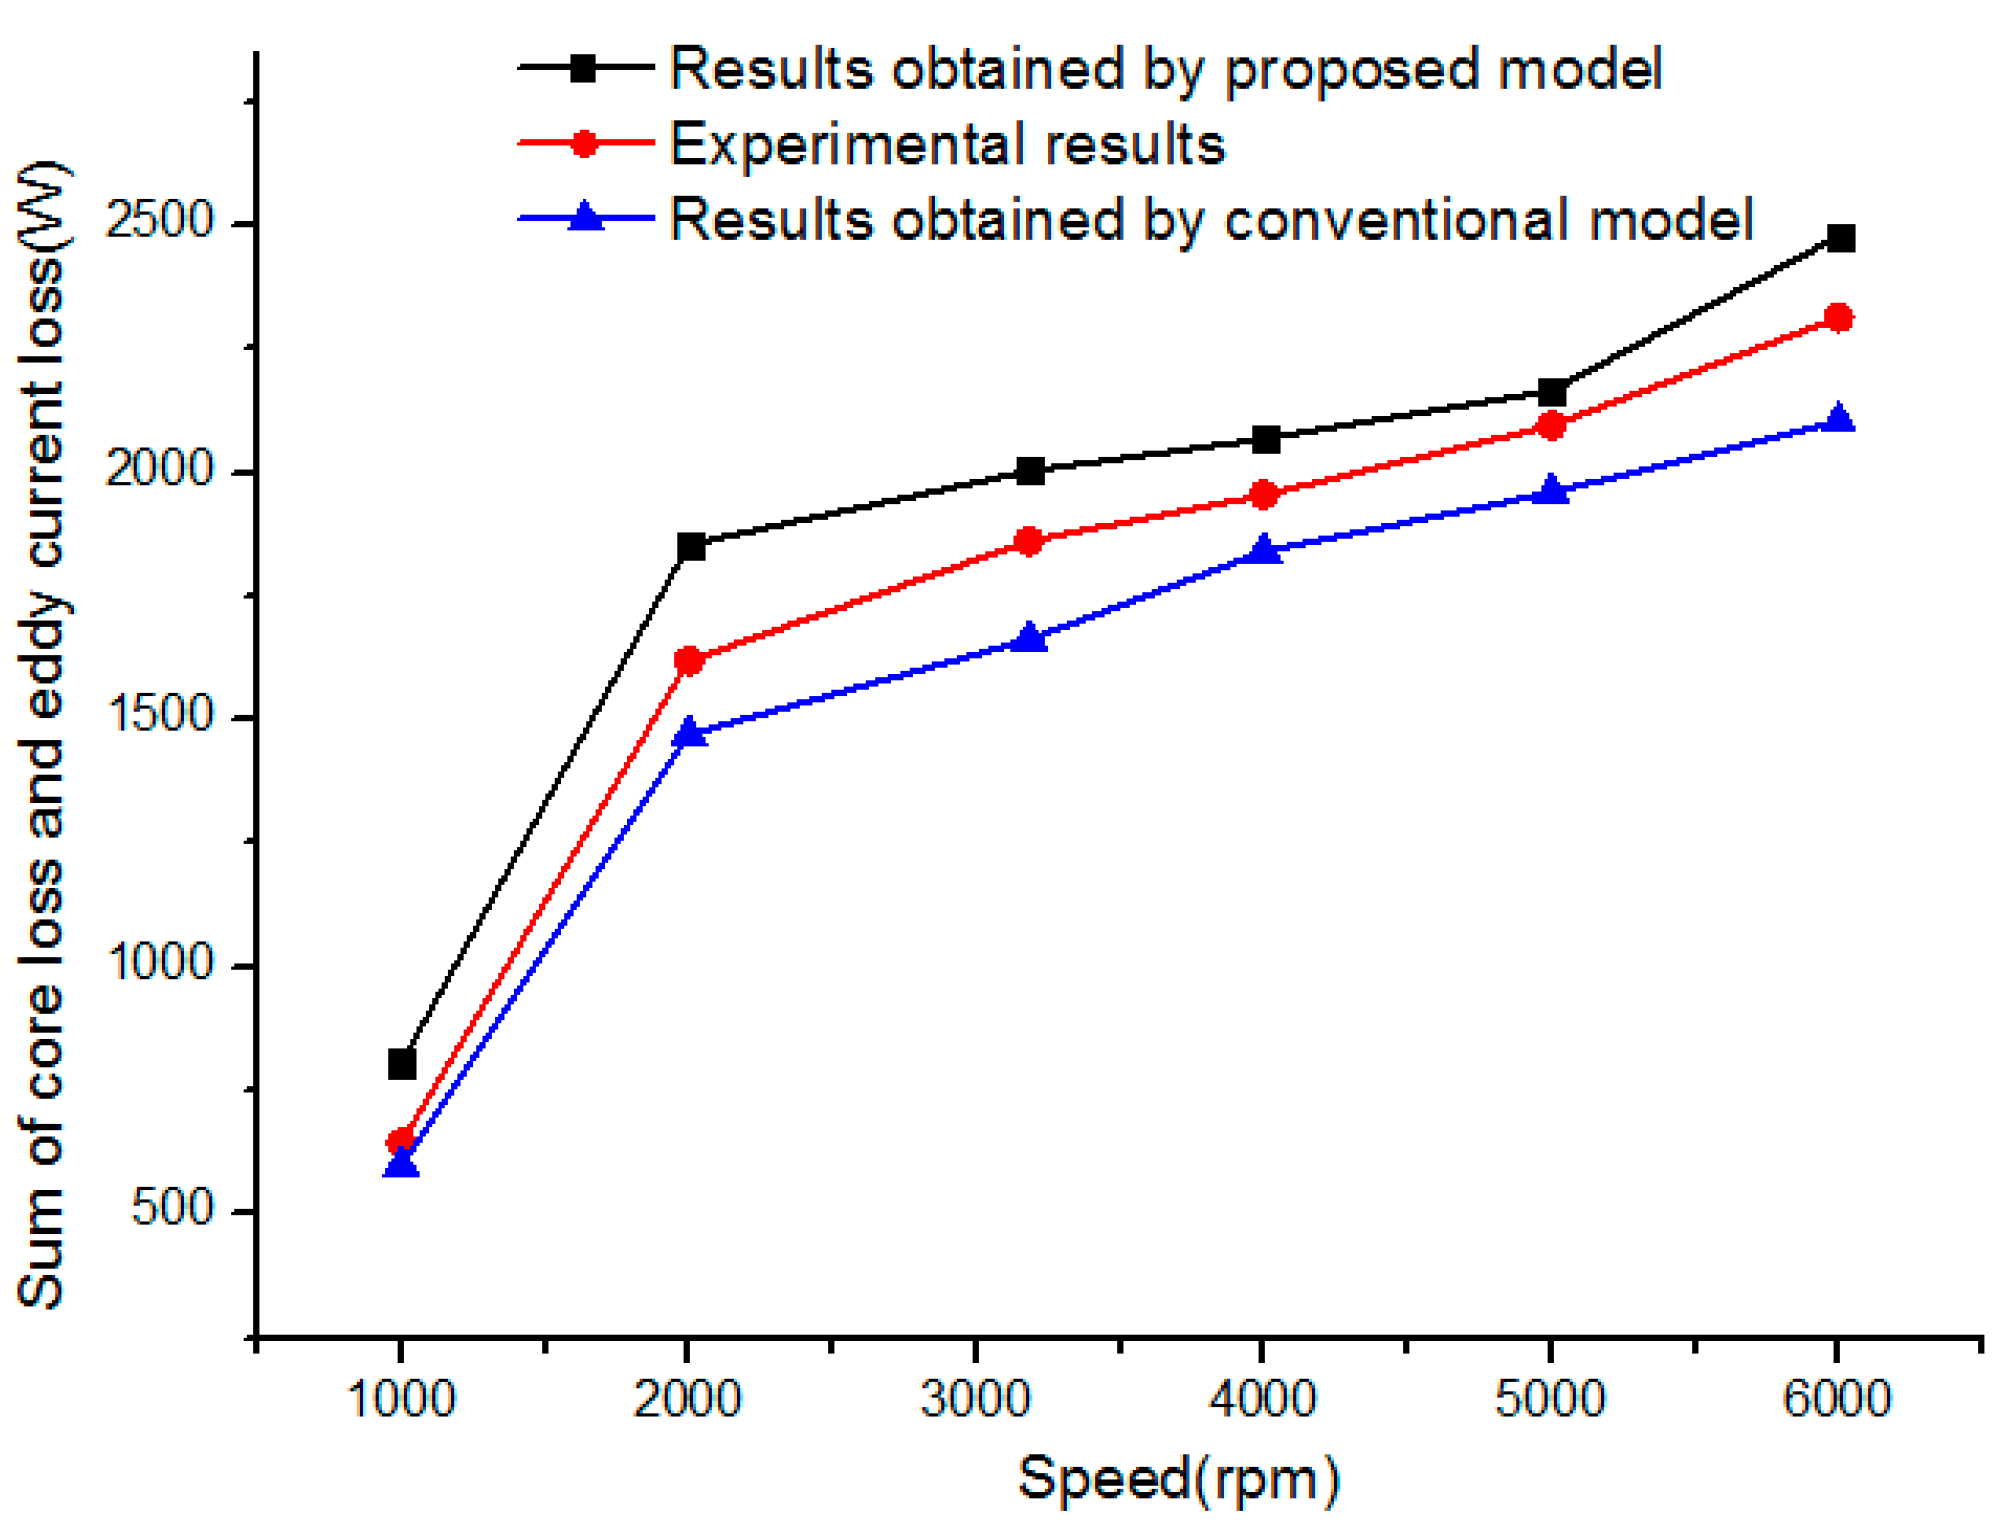
Figure 15.
The motor topology with different pole/slot number combinations. (a) 12/72; (b) 12/36; (c) 12/18; (d) 16/18. I: tooth-tip region, II: tooth region, III: region between tooth and yoke, IV: yoke region, A: point in region I, B: point in region II, C: point in region III, D: point in region IV.
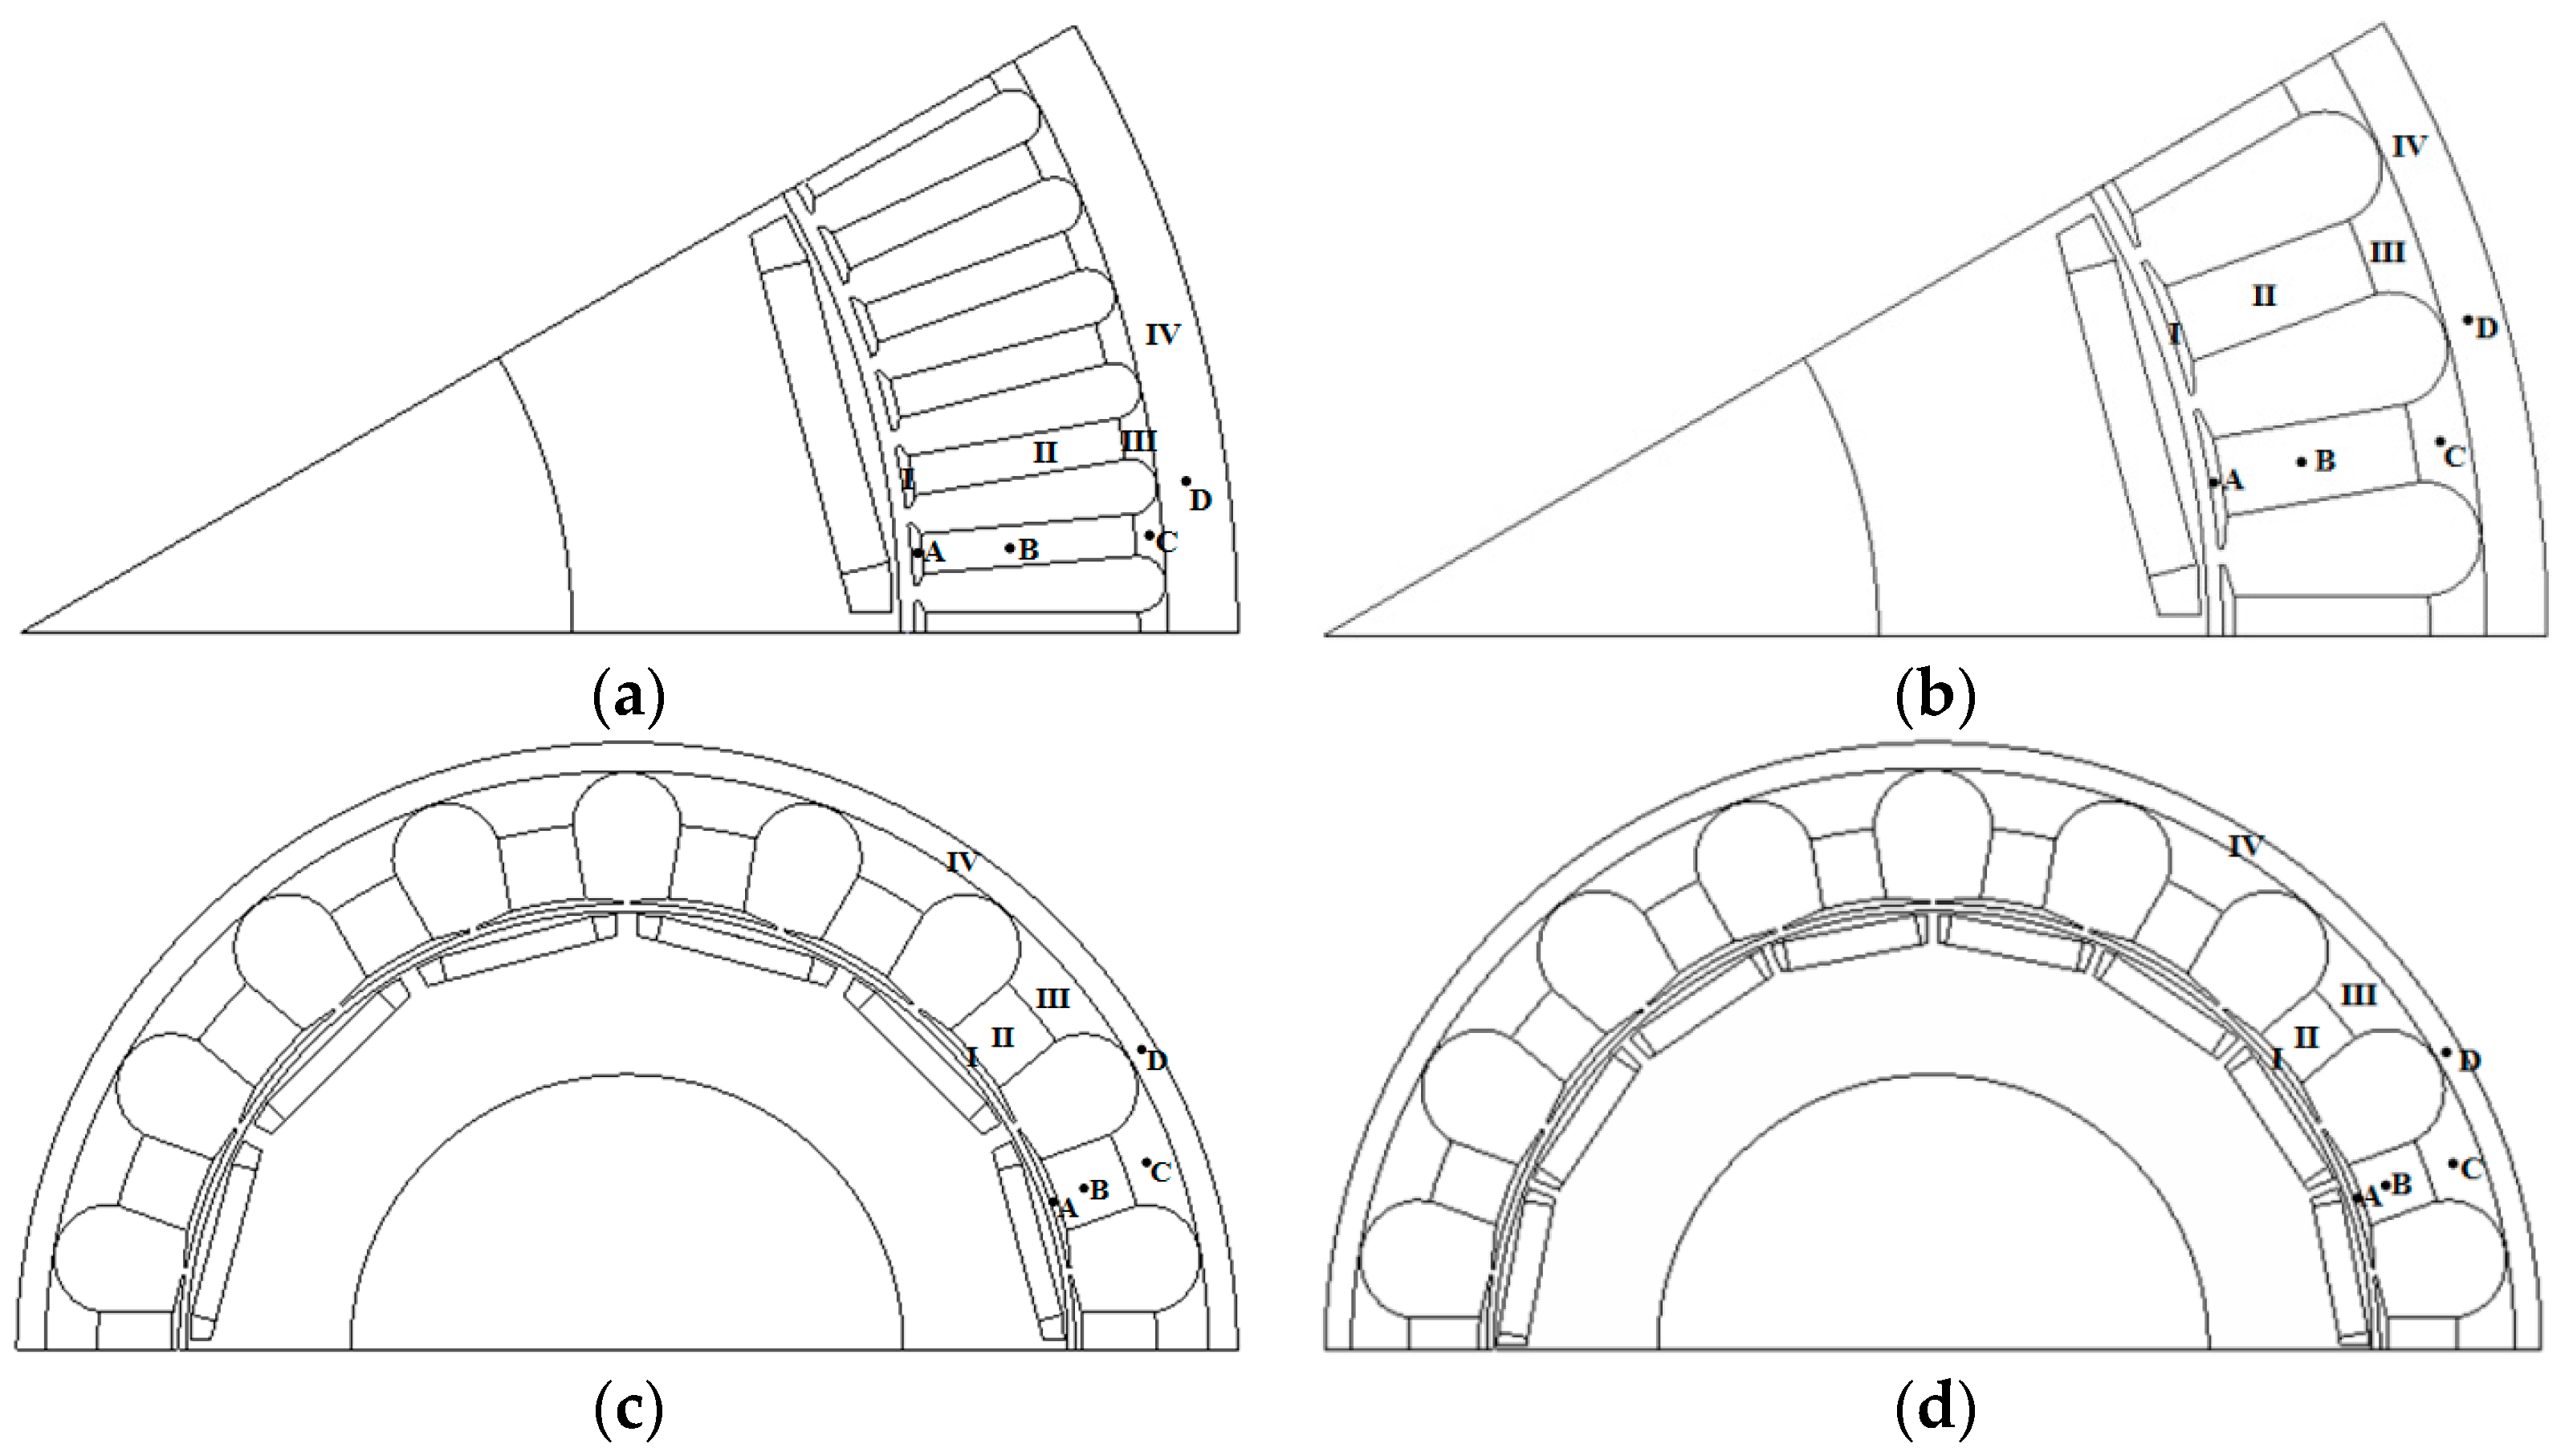
Figure 16.
The d-q axis average current at the rated operating point.
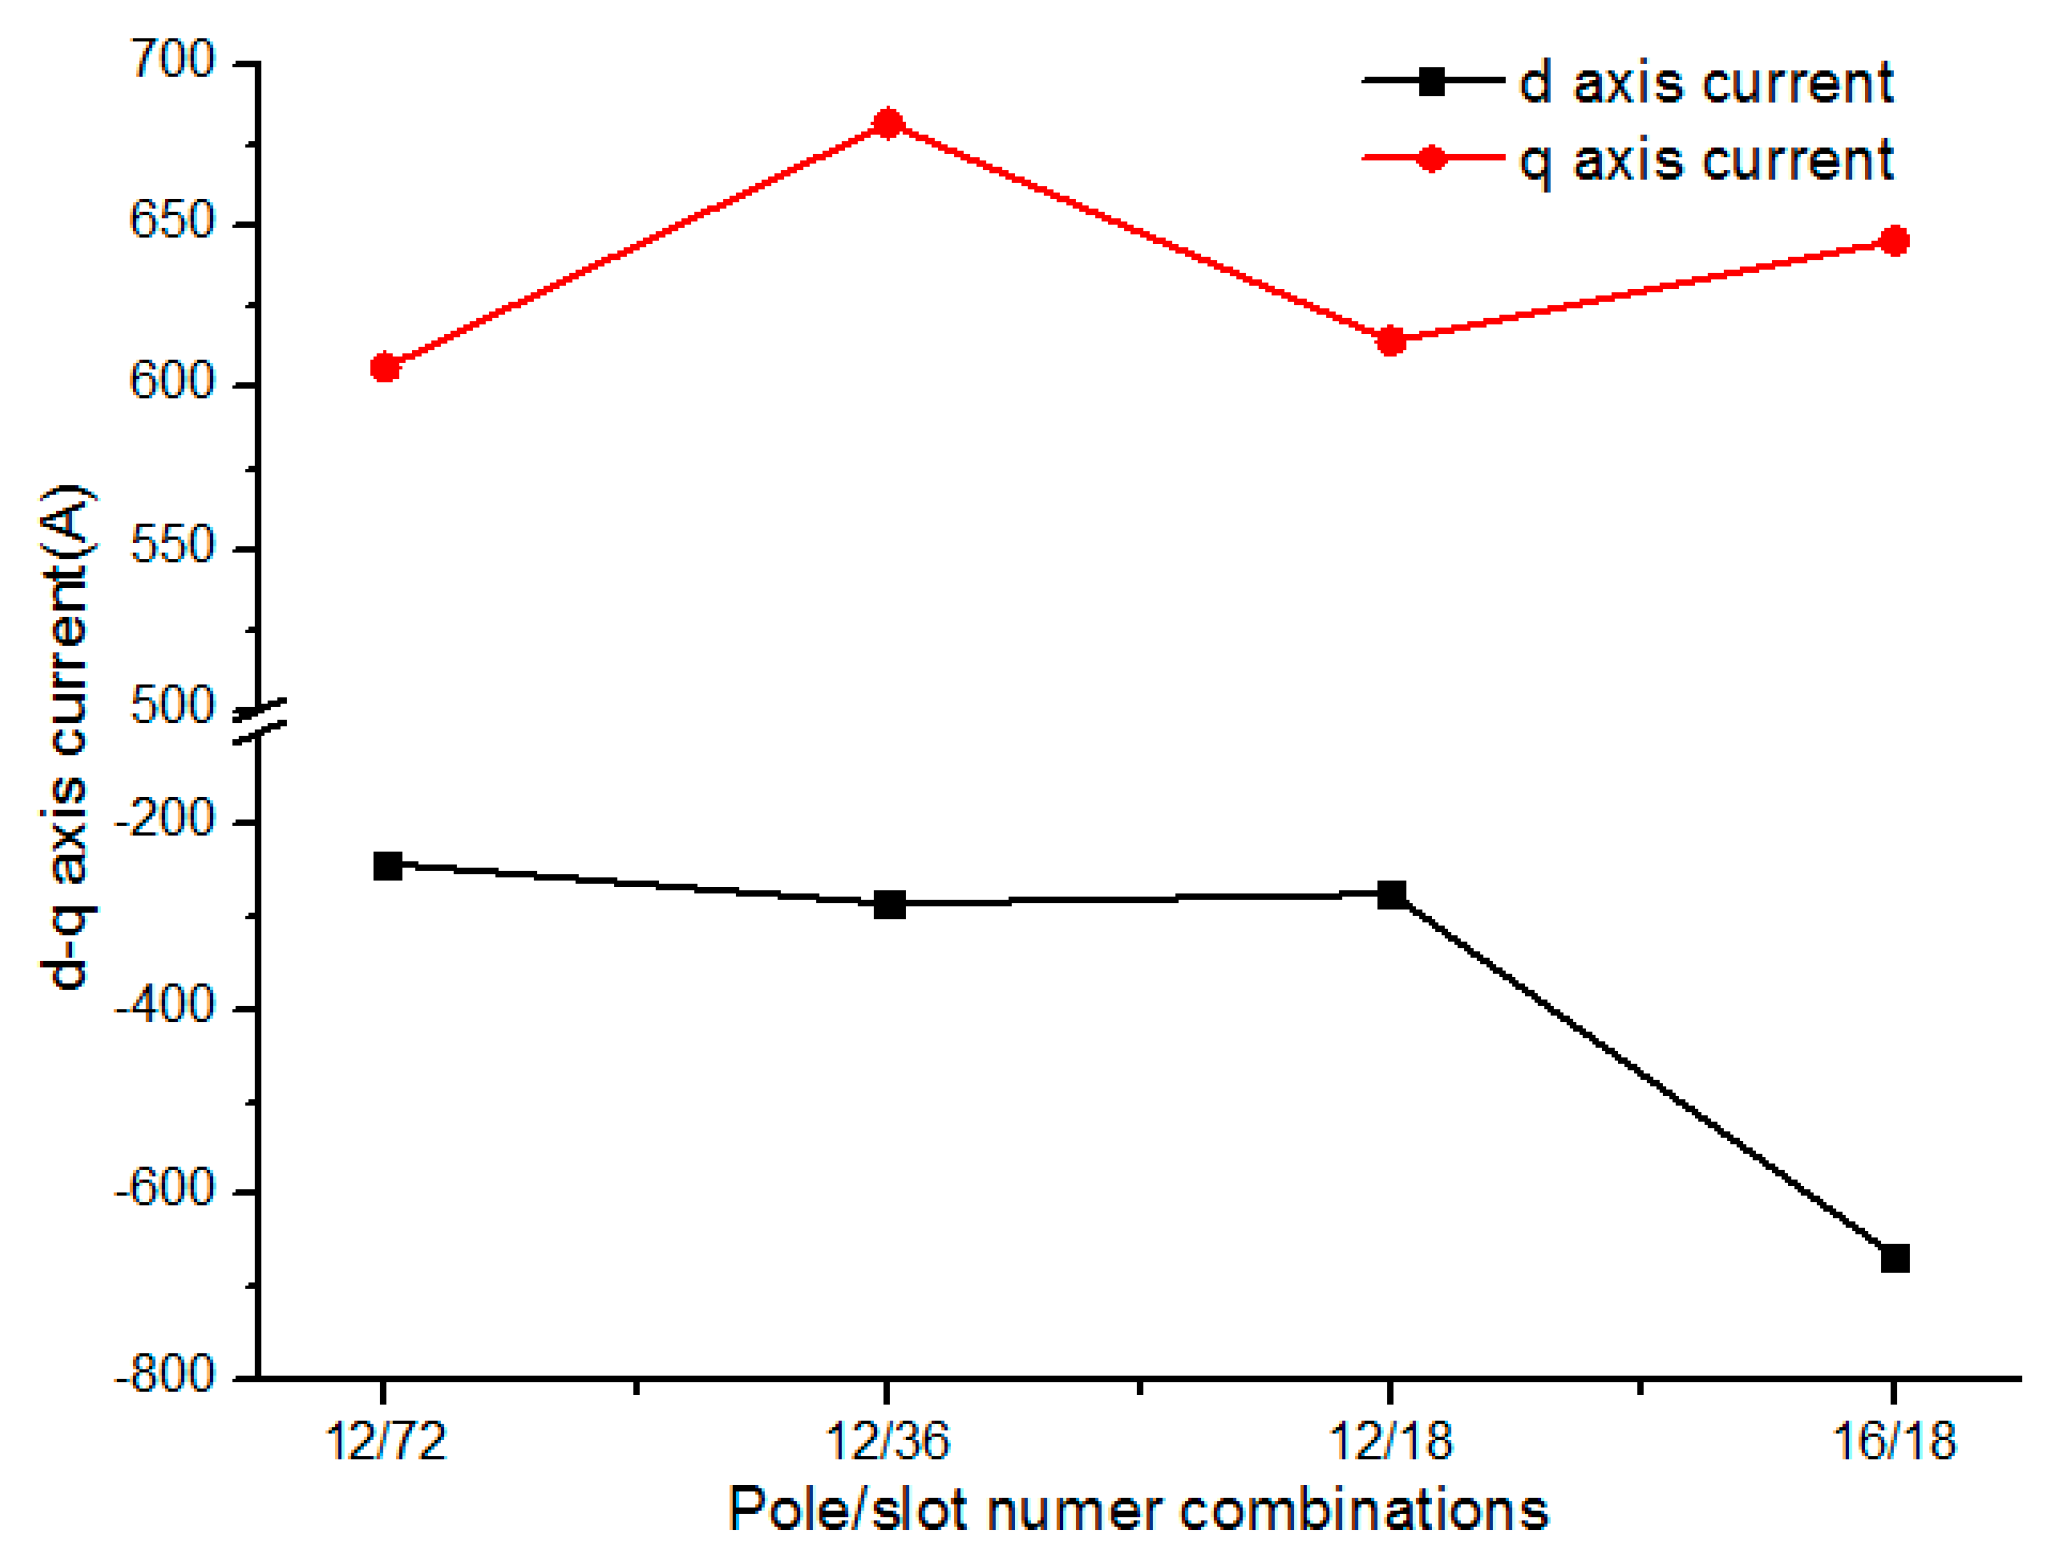
Figure 17.
The harmonic amplitudes of flux density at points B and D. (a) The flux density harmonic at point B; (b) The flux density harmonic at point D.
Figure 17.
The harmonic amplitudes of flux density at points B and D. (a) The flux density harmonic at point B; (b) The flux density harmonic at point D.

Figure 18.
The core loss and density in stator different regions. (a) The stator core loss; (b) The stator core loss density.
Figure 18.
The core loss and density in stator different regions. (a) The stator core loss; (b) The stator core loss density.

Table 1.
Motor design parameters.
| Parameters | Values | Parameters | Values |
|---|---|---|---|
| Rated power (kW) | 370 | Rated speed (rpm) | 3185 |
| Maximum power (kW) | 550 | Maximum speed (rpm) | 6000 |
| Rated torque (Nm) | 1110 | Rated line voltage (V) | 440 |
| Stator outer diameter (mm) | 490 | Number of slots | 72 |
| Stator inner diameter (mm) | 360 | Number of poles | 12 |
Table 2.
The fitting coefficients of relations between the d-q axis current and flux linkage.
| Coefficients | Values | Coefficients | Values |
|---|---|---|---|
| I0 (A) | 600 | φ0 (Wb) | 0.067224 |
| KLd | 1.8 × 10⁻⁴ | KLq | 0.00051 |
| Ksd | 7.06 × 10⁻⁶ | Ksq | 0.00122 |
| Ksdq | 1.84 × 10⁻⁴ | Ksqd | 0.0002 |
Table 3.
The designing parameters of IPMSM with different pole/slot number combinations.
| Pole/Slot Number | 12/72 | 12/36 | 12/18 | 16/18 |
|---|---|---|---|---|
| Turns per phase | 24 | 24 | 27 | 24 |
| Winding factor | 0.945 | 0.866 | 0.866 | 0.945 |
| Teeth width (mm) | 8.16 | 15.83 | 30.52 | 25.71 |
| Yoke height (mm) | 16.17 | 16.2 | 18.97 | 18.8 |
Table 4.
The losses of IPMSM with different pole/slot number combinations.
| Pole/Slot Number | Copper Loss (W) | Rotor Loss (W) | Stator Core Loss (W) | Total Loss (W) |
|---|---|---|---|---|
| 12/72 | 1546 | 980 | 2494 | 5020 |
| 12/36 | 1926 | 1036 | 2281 | 5442 |
| 12/18 | 1306 | 1064 | 1818 | 4188 |
| 16/18 | 2044 | 1246 | 1980 | 5270 |
© 2017 by the authors. Licensee MDPI, Basel, Switzerland. This article is an open access article distributed under the terms and conditions of the Creative Commons Attribution (CC BY) license (http://creativecommons.org/licenses/by/4.0/).
Share and Cite
MDPI and ACS Style
Feng, Y.; Zhang, C. Core Loss Analysis of Interior Permanent Magnet Synchronous Machines under SVPWM Excitation with Considering Saturation. Energies 2017, 10, 1716. https://doi.org/10.3390/en10111716
AMA Style
Feng Y, Zhang C. Core Loss Analysis of Interior Permanent Magnet Synchronous Machines under SVPWM Excitation with Considering Saturation. Energies. 2017; 10(11):1716. https://doi.org/10.3390/en10111716
Chicago/Turabian StyleFeng, Yanli, and Chengning Zhang. 2017. "Core Loss Analysis of Interior Permanent Magnet Synchronous Machines under SVPWM Excitation with Considering Saturation" Energies 10, no. 11: 1716. https://doi.org/10.3390/en10111716
Note that from the first issue of 2016, this journal uses article numbers instead of page numbers. See further details here.