Investigation on the Energy Saving Potential of Using a Novel Dew Point Cooling System in Data Centres

1
School of Engineering and Computer Science, University of Hull, Kingston upon Hull HU6 7RX, UK
2
School of Civil and Transportation Engineering, Guangdong University of Technology, Guangzhou, 510006, China
3
School of Mechanical and Energy Engineering, Jimei University, Xiamen, 361021, China
*
Authors to whom correspondence should be addressed.
Energies 2017, 10(11), 1732; https://doi.org/10.3390/en10111732
Submission received: 22 September 2017
/
Revised: 11 October 2017
/
Accepted: 26 October 2017
/
Published: 28 October 2017
Abstract
:Information technology (IT) has brought significant changes in people’s lives. As an important part of the IT industry, data centres (DCs) have been rapidly growing in both the number and size over the past 40 years. Around 30% to 40% of electricity consumption in DCs is used for space cooling, thus leading to very inefficient DC operation. To identify ways to reduce the energy consumption for space cooling and increase the energy efficiency of DCs’ operation, a dedicated investigation into the energy usage in DCs has been undertaken and a novel high performance dew point cooling system was introduced into a DC operational scheme. Based on the cooling load in DCs, a case study was carried out to evaluate the energy consumptions and energy usage effectiveness when using the novel dew point cooling system in different scales of DCs in various climates. It was found that by using the novel dew point cooling system, for 10 typical climates a DC can have a much lower power usage effectiveness (PUE) of 1.10 to 1.22 compared to that of 1.7 to 3.7 by using existing traditional cooling systems, leading to significantly increased energy efficiency of the DC operation. In addition, the energy performance by managing the cooling air supply at the different levels in DCs, i.e., room, row and rack level, was simulated by using a dynamic computer model. It was found that cooling air supply at rack level can provide a higher energy efficiency in DCs. Based on the above work, the energy saving potential in DCs was conducted by comparing DCs using an the novel dew point cooling system and the optimum management scheme for the cooling air supply to that using traditional air cooling systems and the same supply air management. Annual electricity consumptions for the two cases were given. It was found that by using the novel dew point cooling system and optimum management system for the cooling air supply, an 87.7~91.6% electricity consumption saving for space cooling in DCs could be achieved in 10 typical cities at 10 selected climatic conditions.
1. Introduction
The upsurge in information technology (IT) has brought fabulous changes to people’s lives. As an important basis of the IT industry, data centres (DCs) have become more and more prevalent in both the public and private sectors. They are widely used for web-hosting, intranet, telecommunications, financial transaction processing, research units, central depository information bases of governmental organizations and other fields. The DC market have been rapidly growing over the past 40 years [1,2]. The scale of the global DC market has grew from 14.84 billion dollars to 45.19 billion dollars during 2009 to 2016, and in China the DC market grew fast from 1.07 billion dollars to 10.53 billion dollars in this period [3]. In Europe, there are 1014 collocation DCs spread across its 27 member states, which consume more than 100 TWh of electricity each year [4]. In China, the capacity of DCs has reached 28.5 GW in 2013, with 549.6 TWh of annual electrical consumption [5,6].
A DC comprises a large amount of Information and Communication Technology (ICT) equipment (e.g., servers, data storage, network devices, redundant or backup power supplies, redundant data communications connections, environmental controls and various security devices) and associated components [7]. The ICT equipment in DCs are energy intensive and they need to run continually without rest during every hour of the 365 days in a year. It was shown that the energy usage of data centres is in the range of 120–940 W/m2 [8]. This keeps increasing significantly, reaching up to 100 times higher than the energy demand of commercial office accommodations [9]. In 2006, DCs consumed 61 billion kWh of electricity in the USA, which is 1.5% of the total energy consumption of USA in that year [10], in 2013, the electrical energy consumption in the USA increased to 91 billion kWh, and the quantity is expected to increase to 140 billion kWh annually by 2020 [11]. The huge energy consumptions may indicate the significant energy saving potential, so energy conservation measures should be taken in data centres.
Space cooling (i.e., air conditioning) is a fundamental need in DCs which, aiming at removing the tremendous amount of heat dissipated from the IT equipment and maintaining an adequate space temperature, consumes around 30% to 40% of energy delivered into the centre spaces [6,12,13,14]. The traditional cooling equipment for DCs are a specialised mechanical vapour compression air conditioners, which are driven by electrical energy and have lower efficiency, i.e., the coefficients of performance (COP) are around 2 to 3, leading to energy inefficient and environmentally unfriendly operation. In recent years, several alternative cooling modes, e.g., adsorption/absorption, ejector, and evaporative types, have appeared on the market, and some of them have been used in DCs. Although these technologies can save some electrical energy, there exists a lot of problems that prevents them from wider application in DCs. The problems of different technologies are as follows: (1) Evaporative/ traditional dew point cooling: low cooling efficiency, low heat transfer capacity, and low efficiency in humid climates regions, which lead to large size and climate selectivity disadvantages [15,16]; (2) Ejector cooling: requires a high temperature heat source and it is difficult to utilize waste heat in the DCs, unstable cooling output, low COP (0.4–0.7) [17,18,19], which lead disadvantages of large size, high cost and difficulty of integration into DCs; (3) Absorption/adsorption cooling: requires extra heat sources with higher temperature, lower COP (0.6–0.9), and it is difficult to utilize waste heat in the DCs [20,21,22], which lead to disadvantages of large size, high cost and difficulties of integration into DCs.
Evaporative cooling, by making use of the principle of water evaporation for heat absorbing, has gained growing popularity in air conditioning [23,24], owing to its simple structure and effective use of the latent heat of water, which is a recyclable (renewable) energy in the natural environment. Evaporative cooling technologies include two general types: direct and indirect ones. Direct Evaporative Cooling keeps the primary (product) air in direct contact with water, causing the simultaneous evaporation of the water and reduction of air temperature. As a result, the vaporised water is added into the air, creating wetter air conditions and potentially causing discomfort for the space occupants. Indirect Evaporative Cooling keeps the primary (product) air at the dry channels and the secondary (working) air in separate wet channels where water is distributed towards the surfaces to form thin water films [25]. Indirect Evaporative Cooling can lower the temperature of air and meanwhile keep its dryness, thus creating a better thermal comfort and improved indoor air quality [26,27,28]. Dew point cooling, a type of Indirect Evaporative Cooling, by modifying the structure of heat and mass exchanger to enable the pre-cooling of the secondary air prior to its entry into the wet channels, can break the wet bulb limit and lower the air temperature down to its dew point, thereby achieving 20–30% higher cooling efficiency than conventional IECs [29,30,31,32,33].
A novel dew point cooling system with high efficiency has been recently developed. The system is comprised of a highly efficient dew point cooler unit to cool the air, a dehumidifying unit to pre-treat the intake air to achieve high cooling efficiency in humid climates, a heat recovery unit to utilize the waste heat in DCs for air dehumidification, a heat storage/exchanger unit and a control system. To explore the feasibility and energy saving potential of using the novel dew point cooling system in DCs, the detailed conditions of DCs were investigated in this paper. DCs have been classified into several types in terms of their IT load capacities and climate conditions. The energy consumptions and energy usage effectiveness for various types of DCs were investigated by a case study. The energy saving potential in various types of DCs were investigated by using dynamic IT loads model to determine the cooling demand and introducing cooling air supply management. The energy saving potentials using the novel dew point cooling system in the DCs were analysed by comparing the annual electricity consumptions of DCs using traditional cooling systems and the novel dew point cooling system. The results will provide insights into the optimum selections of cooling technologies and cooling supply air management for improvement of the energy performance of DCs.
2. The Innovative Dew Point Cooling System
A super-performance dew point cooler has been recently developed [25]. The dew point cooler, employing a super performance wet material layer, innovative heat and mass exchanger and intermittent water supply scheme, achieves 100–160% higher COP and a much lower electrical energy usage compared to existing air coolers of the same type. The novel dew point cooler overcomes the difficulties remaining with existing cooling systems, thus achieving significantly improved energy efficiency. Under the standard test conditions, i.e., dry bulb temperature of 37.8 °C and coincident wet bulb temperature of 21.1 °C, the prototype cooler achieved the wet-bulb cooling effectiveness of 114% and dew-point cooling effectiveness of 75%, yielding a significantly high COP value of 52.5 [25]. Although the dew point cooler is mostly suitable for dry climates, it can maintain its high efficiency when used in humid climates by combining it with an air pretreatment system, to form an innovative dew point cooling system. The performance comparison among the novel and existing cooling systems is outlined in Table 1.
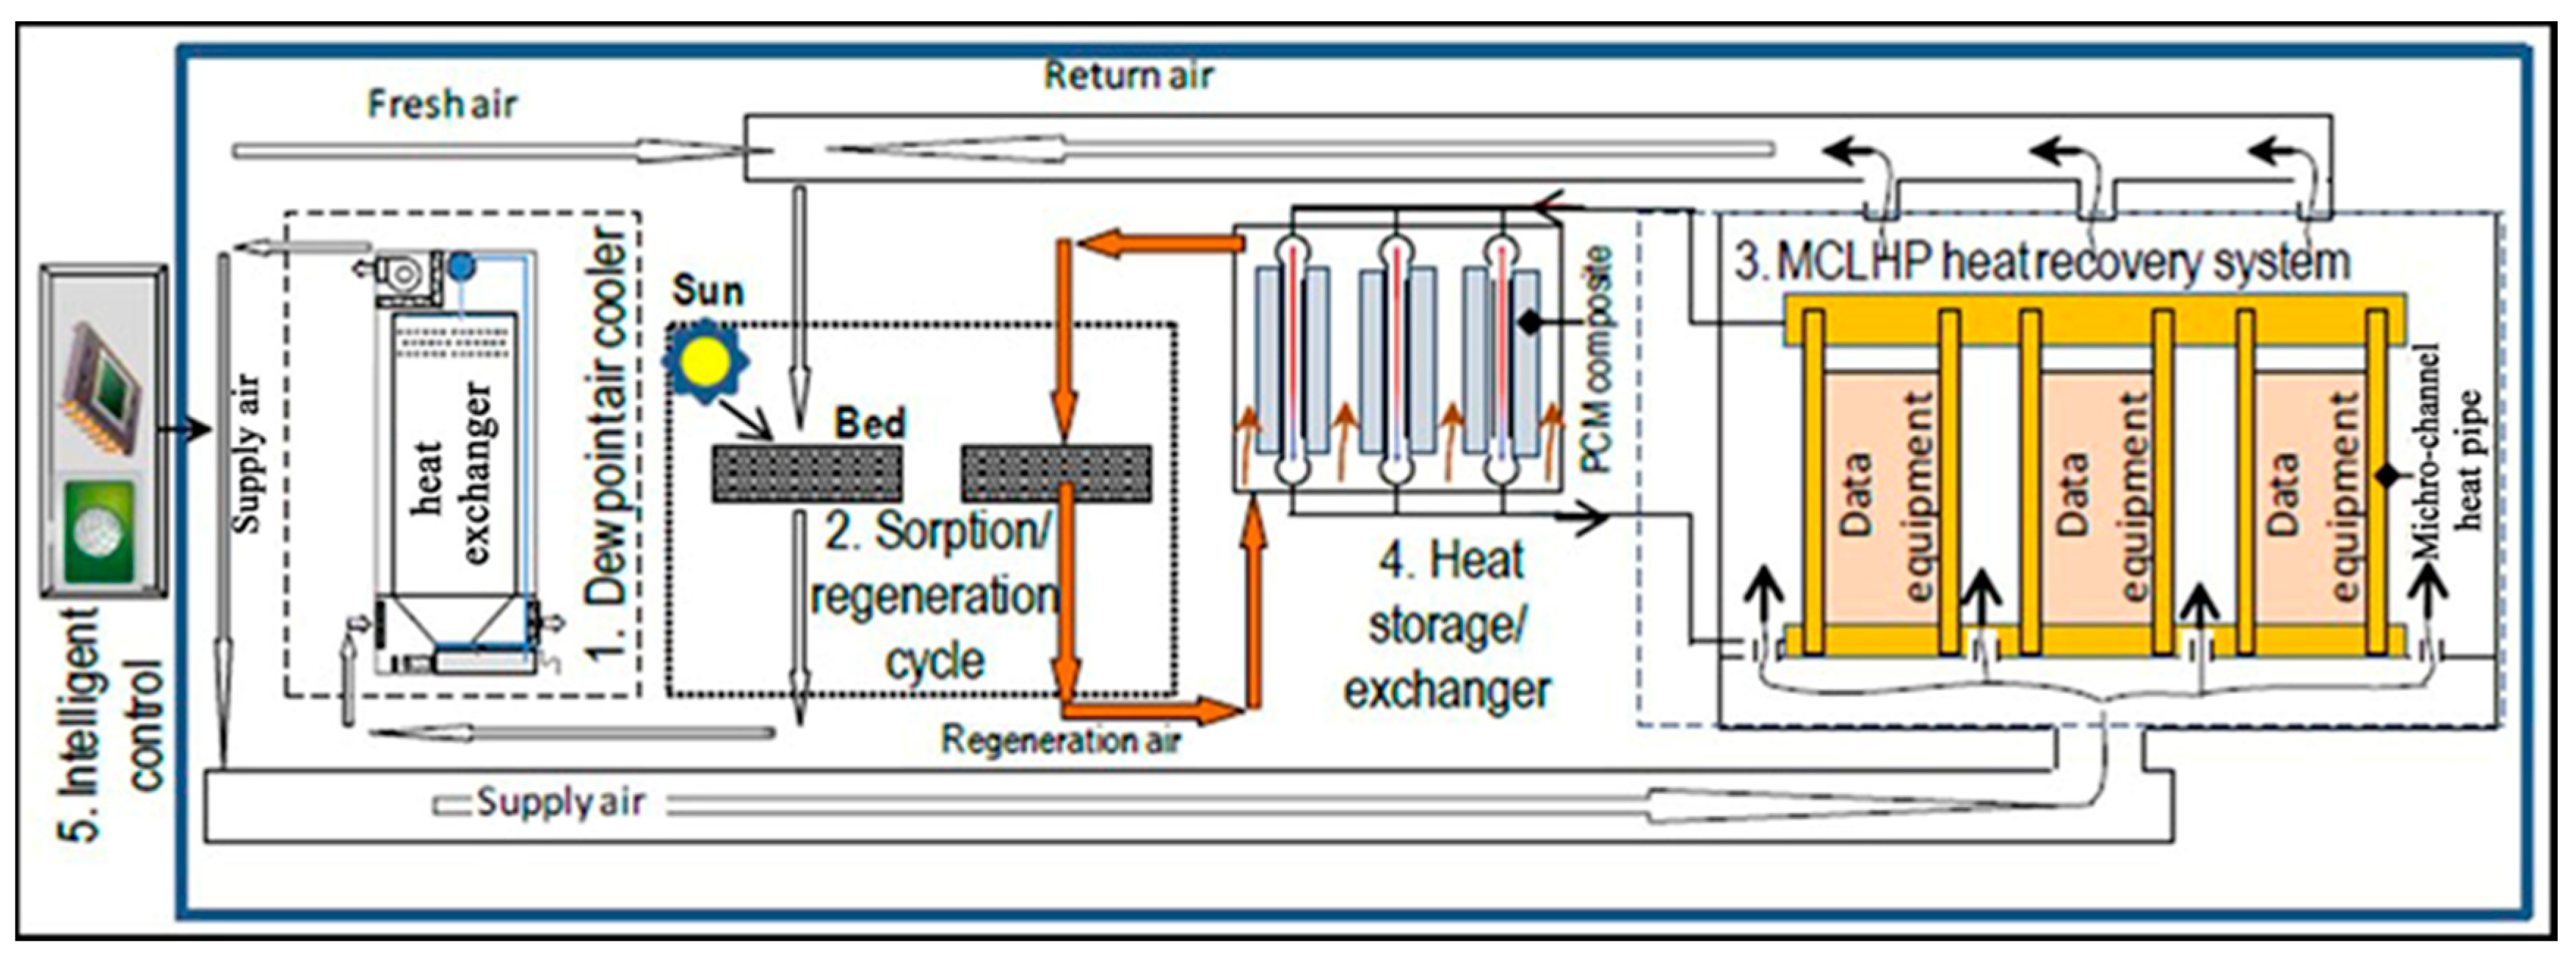
Figure 1 shows a schematic drawing of the innovative cooling system. The system comprises five major parts: (1) dew point air cooler; (2) adsorbent sorption/desorption cycle containing a sorption bed for air dehumidification and a desorption bed for adsorbent regeneration; both are functionally alternative; (3) micro-channels-loop-heat-pipe (MCLHP) based DC heat recovery system; (4) heat storage/exchanger; and (5) internet-based intelligent monitoring and control system.
During operation, mixture of the return air and fresh air will be pretreated within the sorption bed (part of the sorption/desorption cycle), which will create a lower and stabilised humidity ratio in the air, thus increasing its cooling potential. This part of the air will be delivered into the dew point air cooler. Within the cooler, part of the air will be cooled to a temperature approaching the dew point of its inlet state and delivered to the DC spaces for indoor cooling.
Meanwhile, the remainder of the air will receive the heat transported from the product air and absorb the evaporated moisture from the wet channel surfaces, thus becoming hot and saturated and being discharged to the atmosphere. As the adsorbent regeneration process requires significant amount of heat while the IT equipment generate heat constantly, a micro-channels-loop-heat pipe (MCLHP)-based DC heat recovery system will be implemented. Within the system, the evaporation part of the MCLHP will be stuck to the enclosure of the data processing (or computing) equipment to absorb the heat dissipated from the equipment, while the absorbed heat will be released to a dedicated heat storage/exchanger via the condenser of the MCLHP. Within the heat storage/exchanger, the regeneration air will be directed through, taking the heat away from it and transferring the heat to the desorption bed for adsorbent regeneration, while the paraffin/expanded-graphite within the storage/exchanger will act as the heat balance element that stores or releases heat intermittently to match the heat required by the regeneration air. The heat collected from the DC equipment and (or) from solar radiation will be jointly or independently applied to the adsorbent regeneration, while the system operation will be managed by an internet-based intelligent monitoring and control system. The individual components are described below:
- (1)
- A unique high performance dew point air cooler: The novel high performance dew point evaporative cooler had a complex heat and mass exchanger with an advanced wet material layer, An intermittent water supply scheme was implemented. The cooler achieved 100–160% higher COP compared to the existing dew point coolers. Electricity use of the cooler was reduced by 50–70% compared to existing dew coolers. Under the standard test condition, i.e., dry bulb temperature of 37.8 °C and coincident wet bulb temperature of 21.1 °C, the prototype cooler achieved the wet-bulb cooling effectiveness of 114% and dew-point cooling effectiveness of 75%, yielding a significantly high COP value of 52.5
- (2)
- An energy efficient solar and (or) CDC-waste-heat driven sorption/desorption cycle: comprising sorption and desorption beds made with identical structures which allow the periodic alternation in function, the sorption/desorption cycle can dehumidify the humid air. Compared to existing adsorption systems, the new sorption/desorption cycle has a number of innovative features [34]: (a) direct interaction between the solar radiation and bed-attained moistures reduces energy losses to surroundings, thus increasing the system’s energy efficiency by around 20%; (b) the regeneration air could be at a lower temperature (40–60 °C), thus creating an opportunity to utilize the waste heat from a DC. This will create a near-to-zero-energy adsorbent regeneration by making full use of the DC waste heat and (or) solar energy.
- (3)
- A high efficiency micro-channels-loop-heat-pipe (MCLHP)-based CDC heat recovery system. This will enable direct collection of the heat dissipated from the equipment, thus minimising the space cooling load and maximising the heat recovery rate of the system.
- (4)
- A high performance heat storage/exchanger unit, that will create an enhanced/accelerated heat storing and releasing process.
Owing to its significantly enhanced energy efficiency, environmentally friendly operation, small size and good climatic adaptability, this novel dew point cooling system is expected to be used in DCs in various climates with higher energy usage effectiveness and significant energy saving effect.
3. The Data Centres and Climate Areas
Data centres (DCs) are where the internet lives or where the digital information available around the world is stored. These storage centres are expanding rapidly and becoming power hungry. In general, electrical utility costs of a data centre is around 15 percent of the total cost of the data centre which includes servers (CPU, memory, storage), network (links, optic fibre cables and equipment) and infrastructure (cooling and power distribution) [35]. The data centres are quite diverse from an infrastructure point of view which subsequently effects the electrical power drawn and the cooling system required. It ranges from commercial city buildings to purpose built mega storages.
3.1. Energy Performance Metrics and Benchmarks for DCs
3.1.1. Thermal Environment in DCs
With the development of IT technology, the new generation of IT equipment becomes more adaptable to wide thermal environments. Therefore, in 2011 ASHRAE Technology Committee updated the thermal environment standard in DCs that was issued in 2004, which relax restrictions on the thermal environment in DCs. This enable applications of diverse cooling systems in data centres and more types of energy saving air conditioning systems can be used in DCs, which can greatly reduce energy consumption in DCs.
The ASHRAE Technology Committee issued the computer data centre standard TC9.9 in 2011, the standard gives the recommended thermal environment and the allowable thermal environment of the computer data centre when the IT equipment is running [36]. The recommended area of thermal environment is the smallest area surrounding by a closed curve, and the allowable thermal environments are areas surrounding by other four closed curves, i.e., A1–A4. The IT equipment will have higher stability when it is running in the recommended thermal environment, and the energy consumption of air-conditioning system is also higher. Therefore, it is significant to analyse the dew point cooling system working in the recommended thermal environment. The work presented in this paper is based on this recommended thermal environment. The recommended thermal environment range for an A class data centre (i.e., the data centre with a thermal environment at the recommended value) is listed in Table 2.
3.1.2. Energy Efficiency Indexes of Cooling System in Data Centres
Energy efficiency indexes of the cooling systems in DCs can be used to evaluate the energy consumption in the centre, which can help to find the keys for energy savings, and therefore provide a data basis for energy saving measures and provide a method to compare the energy efficiencies among different data centres. There are a lot of indexes to evaluate the energy efficiency in DCs, among which the most commonly used one is the Power Usage Effectiveness (PUE) index [37]. PUE is defined as ratio of overall the energy consumptions in DC to energy consumptions of IT equipment, it reflects the electrical energy usage effectiveness of IT equipment.
PUE is calculated by:
where, Ptotal—the overall energy consumptions in data centre, including energy consumptions of IT equipment, air conditioners and power equipment; PIT—energy consumptions of IT equipment. PUE is widely used and familiarised by researchers, designers, constructors and maintainers whose work are related to the data centres, PUE ≥ 1, the lower the PUE, i.e., the closer the PUE to 1, the higher the electrical energy usage effectiveness.
3.2. Classification of Climate Areas
Air temperature and humidity affect the performance of dew point cooler. In order to study the energy efficiency of the dew point cooler in different climate areas, it is necessary to understand the classification of climate areas.
Currently, the Koppen Climate Classification has become the most popular and worldwide used climate classification method. Koppen took air temperature and rain fall as indexes and referred to the distribution of plant covers to classify the climates, the world climates have been classified into five major climate zones [38], among which four zones are classified by air temperature, i.e., equatorial climate zone (marked as A zone), warm temperature climate zone (marked as C zone), cool climate zone (marked as D zone), polar climate zone (marked as E zone). All the dry climates are classified as one zone, i.e., arid climate zone (marked as B zone). Following above classification, based on the features of each climate zone and took temperature and rain fall as key factors, detailed climate classification has been carried out and the world climate has been classified into 12 climate areas [39].
Except for the two polar climate areas, summer air conditioning design parameters of 10 cities in 10 typical climate areas from the climate zones are selected to analyse the energy efficiency of the dew point cooling under these climates. The air conditioning design parameters for the 10 cities in the 10 typical climate areas are listed in Table 3.
3.3. Classification of Data Centres by Size
It is necessary to classify DCs by their characteristics, so that energy usage in DCs can be analysed according to their types. DC can be classified in terms of data availability, functions and sizes of the data centres.
DCs could be classified based on functions. There are corporate DCs, DCs inclined to provide turnkey solutions to clients, web hosting DCs which may also provide computer infrastructure, and DCs that use technology to web 2.0. Some DCs may fall into more than one category and some may vary in the same category. Some of the distinctions among the DCs include data storage technology in use, the internal and external bandwidth used, the level of server virtualization as well as the number of serves which influences the size of the data centre [40].
Munther and Robert [41] collected data from 44 DCs to analyse the efficiency metrics (annual average PUE). The PUEs of the 44 DCs in different climate zones ranges from 1.7 to 3.7 with an average value of 2.7. It was found that there were some connections between DC size and PUE − bigger DCs tends to have a lower PUE. The average PUE of the DCs with the floor area <10,000 ft2 is 2.8, and the average PUE of the DCs with the floor area >30,000 ft2 is 2.1.
The above information suggests that it is reasonable to classify DCs by size. Floor area (FA) is one way to describe the size of DCs, however, FA cannot accurately describe how much energy a DC consumes because DCs may vary in power densities. IT equipment load capacity is a clearer indication of how much electricity energy a DC consumes, how much heat will be generated by the IT equipment, and how much waste heat can be collected to make use of. DCs can be generally classified into three types in terms of IT equipment load, i.e., large, medium and small sized types, as listed in Table 4.
4. Cases Study of Dew Point Cooling System for DC Application
A case study was carried out to estimate energy performance using the novel dew point cooling system in a small, a medium and a large DCs respectively, the required cooling capacities and sizes of the dew point cooling system for the three cases were estimated.
4.1. Space Layout in Data Centers
With the rapid development of IT technology, the power density of the IT equipment gets higher and higher, currently the heat emitting from a single computer rack can be as high as 3.5–10 kW, which resulted in a power density of 0.45–1.29 W/m2 in a DC [42], and it still keeps increasing.
Assuming there are three different power density in DCs: 0.5 kW/m2, 1.0 kW/m2 and 1.5 kW/m2, and the area of the DC is 20,000 m2, the corresponding numbers of computer racks, rack rows, rack columns, servers, and power of a server are listed in Table 5. The data in Table 5 will be used for energy analysis in the next sections. Figure 2 shows an arrangement of the cooling points and racks.
4.2. Cooling Capacity and Size of the Dew Point Cooler
Due to high heat density of the DCs, the cooler outlets or coolers themselves are usually put on the two ends of rack rows, one outlet/cooler should be laid between two rack ends, as shown in Figure 2. As aforementioned, for dry climates the cooler itself can satisfy the cooling requirement of the computing and data centre. For humid climates, the air dehumidification system (i.e., sorption/regeneration cycle, heat storage/exchanger and MCLHP heat recovery system) will be combined with the cooler to enhance the cooler’s efficiency. For this situation, due to the loop heat pipe (MCLHP) can remove around 20% of the heat from the IT equipment, therefore, the required cooling capacity and size of dew point cooler will be reduced. Refer to the size of a 4 kW dew point cooler prototype developed recently by some of the authors [25], sizes of the dew point coolers with any other cooling capacities can be estimated.
In practical application, a number of dew point cooling units will be required to cool a DC. It can be assumed that a single dew point cooling unit of 50 kW would be used for small DC, that of 100 kW would be used for medium DC and that of 150 kW would be used for large DC. Therefore, total 200 units will be required for each type of DC listed in Table 5. The sizes of the above three single units were estimated respectively for the cases of dehumidification required and not required, the results are listed in Table 6.
4.3. Analysis of Heat Recovery Potential in Data Centers
The temperatures of different IT equipment are different, and the heat from some equipment can be recovered to be used for sorption bed regeneration. The temperature of the processor and internal memory is normally 85 °C [43], and the temperatures of other accessory components are lower. For example, the normal working temperature of hard disk is 45 °C [44]. For the three intake air conditions, i.e., the Air-Conditioning and Refrigeration Institute (ARI) summer condition (dry bulb—35 °C, humid ratio—14.3 g/kg), ARI humid conditions (dry bulb—30 °C, humid ratio—16.2 g/kg) and Shanghai summer conditions (dry bulb—35 °C, humid ratio—23.2 g/kg), when their regeneration temperature is higher than 60 °C, 60 °C and 75 °C respectively, the dehumidifier can provide the required intake air condition by using the recovered heat [45]. Under the most severe Shanghai summer climate conditions, when the regeneration temperature is 80 °C the moisture removal can reach 13 g/kg [46] using the recovered heat. In addition to the required temperature, the total heat output from the processor and internal memory should be sufficient for sorption bed regeneration. It was found that all the electricity consumed by the IT equipment in a DC will be released in the form of heat. Some 80% of the energy consumption of the IT equipment is from servers [45], among which 50% is from processor and internal memory [43] (that has a high temperature of 85 °C as aforementioned), which means energy consumption of the processor and internal memory can take about 40% of the heat release from IT equipment in the DC. Table 7 lists the total recoverable heat of 85 °C for sorption bed regeneration from processor and internal memory.
4.4. Analysis of Energy Performance of Using the Novel Dew Point Cooling System in Data Centers
Although a total 200 units will be required for each type of DC as mentioned in Section 4.2, the analysis will be based on individual 50, 100 or 150 kW units for small, medium and larger DCs, respectively. To analyse the performance of the novel dew point cooling system, parameters are assumed referring to ASHRAE environmental classes for data centres economizers. The assumed parameters are listed in Table 8. The temperature difference between the return air and product air is 8°C and the working-to-intake air flow ratio of the dew point cooler to be 0.35 [47].
4.4.1. Analysis of Energy Consumptions Using Dew Point Cooling System in Data Centres
As listed in Table 3, the humidity ratios of the outdoor air in Af, Am, Aw and Csa climates are higher than 10.7 g/kg, so air dehumidification is a necessary process to enhance the cooling efficiency. Therefore, in the humid climates, the energy consumption of the dew point cooling system includes two parts: energy consumption of the dew point cooler and energy consumption of the dehumidification system. In dry climates, the energy consumption is only from dew point cooler units.
Power Consumption of the Dew Point Cooler Unit
A computer simulation has been carried out to investigate the performance of COPs of the dew point cooler for various climates previously [47], the COPs of the novel dew point cooler in the different climates (10 cites in Table 3) are listed in Table 9.
Knowing the COPs and the cooling capacity of a cooler (50, 100 or 150 kW), the energy consumption of the cooler can be calculated by:
where, Q—cooling capacity of dew point cooler, kW; COP—coefficient of performance of the cooler unit; the energy consumption of the cooler is mainly from its fans.
Power Consumption of Dehumidifier in the Four Humid Climates
The energy consumption of the dehumidifier is from the regeneration fans. The power consumptions of the fans are determined by the flow rate of the fresh air to be dehumidified. In the dew point cooler, the fresh air flow rate is assumed to be equal to the working air flow rate of the system. This is because when the cooler operating, the intake air is divided into two parts, i.e., product air and working air, the working air will be exhausted to the environment and the same amount of the fresh air will mix with the return air to be the intake air. The super performance dew point cooler has an optimum working-to-intake air flow ratio of around 0.35 [47].
The working-to-intake air flow ratio can be expressed by:
where, Rw is the working-to-intake air flow ratio; Gw is the working air flow rate; Gp is the product air flow rate;
The product air flow rate can be calculated by:
where, Q—cooling capacity of dew point cooler, kW; iin and iout are air enthalpy at inlet and outlet of the cooler respectively.
Knowing the cooling capacity, working-to-intake air flow ratio and ait states at inlet and outlet, the working air flow rate can be determined by Equations (3) and (4), so the fresh air flow rates have been known. Assuming the fan efficiency is 70%, the fan power consumption can be obtained. Table 10 lists the air states in the four climate areas where the dehumidification are required.
Total Electrical Energy Consumption
The total power consumption of the dew point cooling system is the sum of the power consumption of the dew point cooler unit and the dehumidifier unit. In dry climates, the power consumption of the dehumidifier unit is equal to zero.
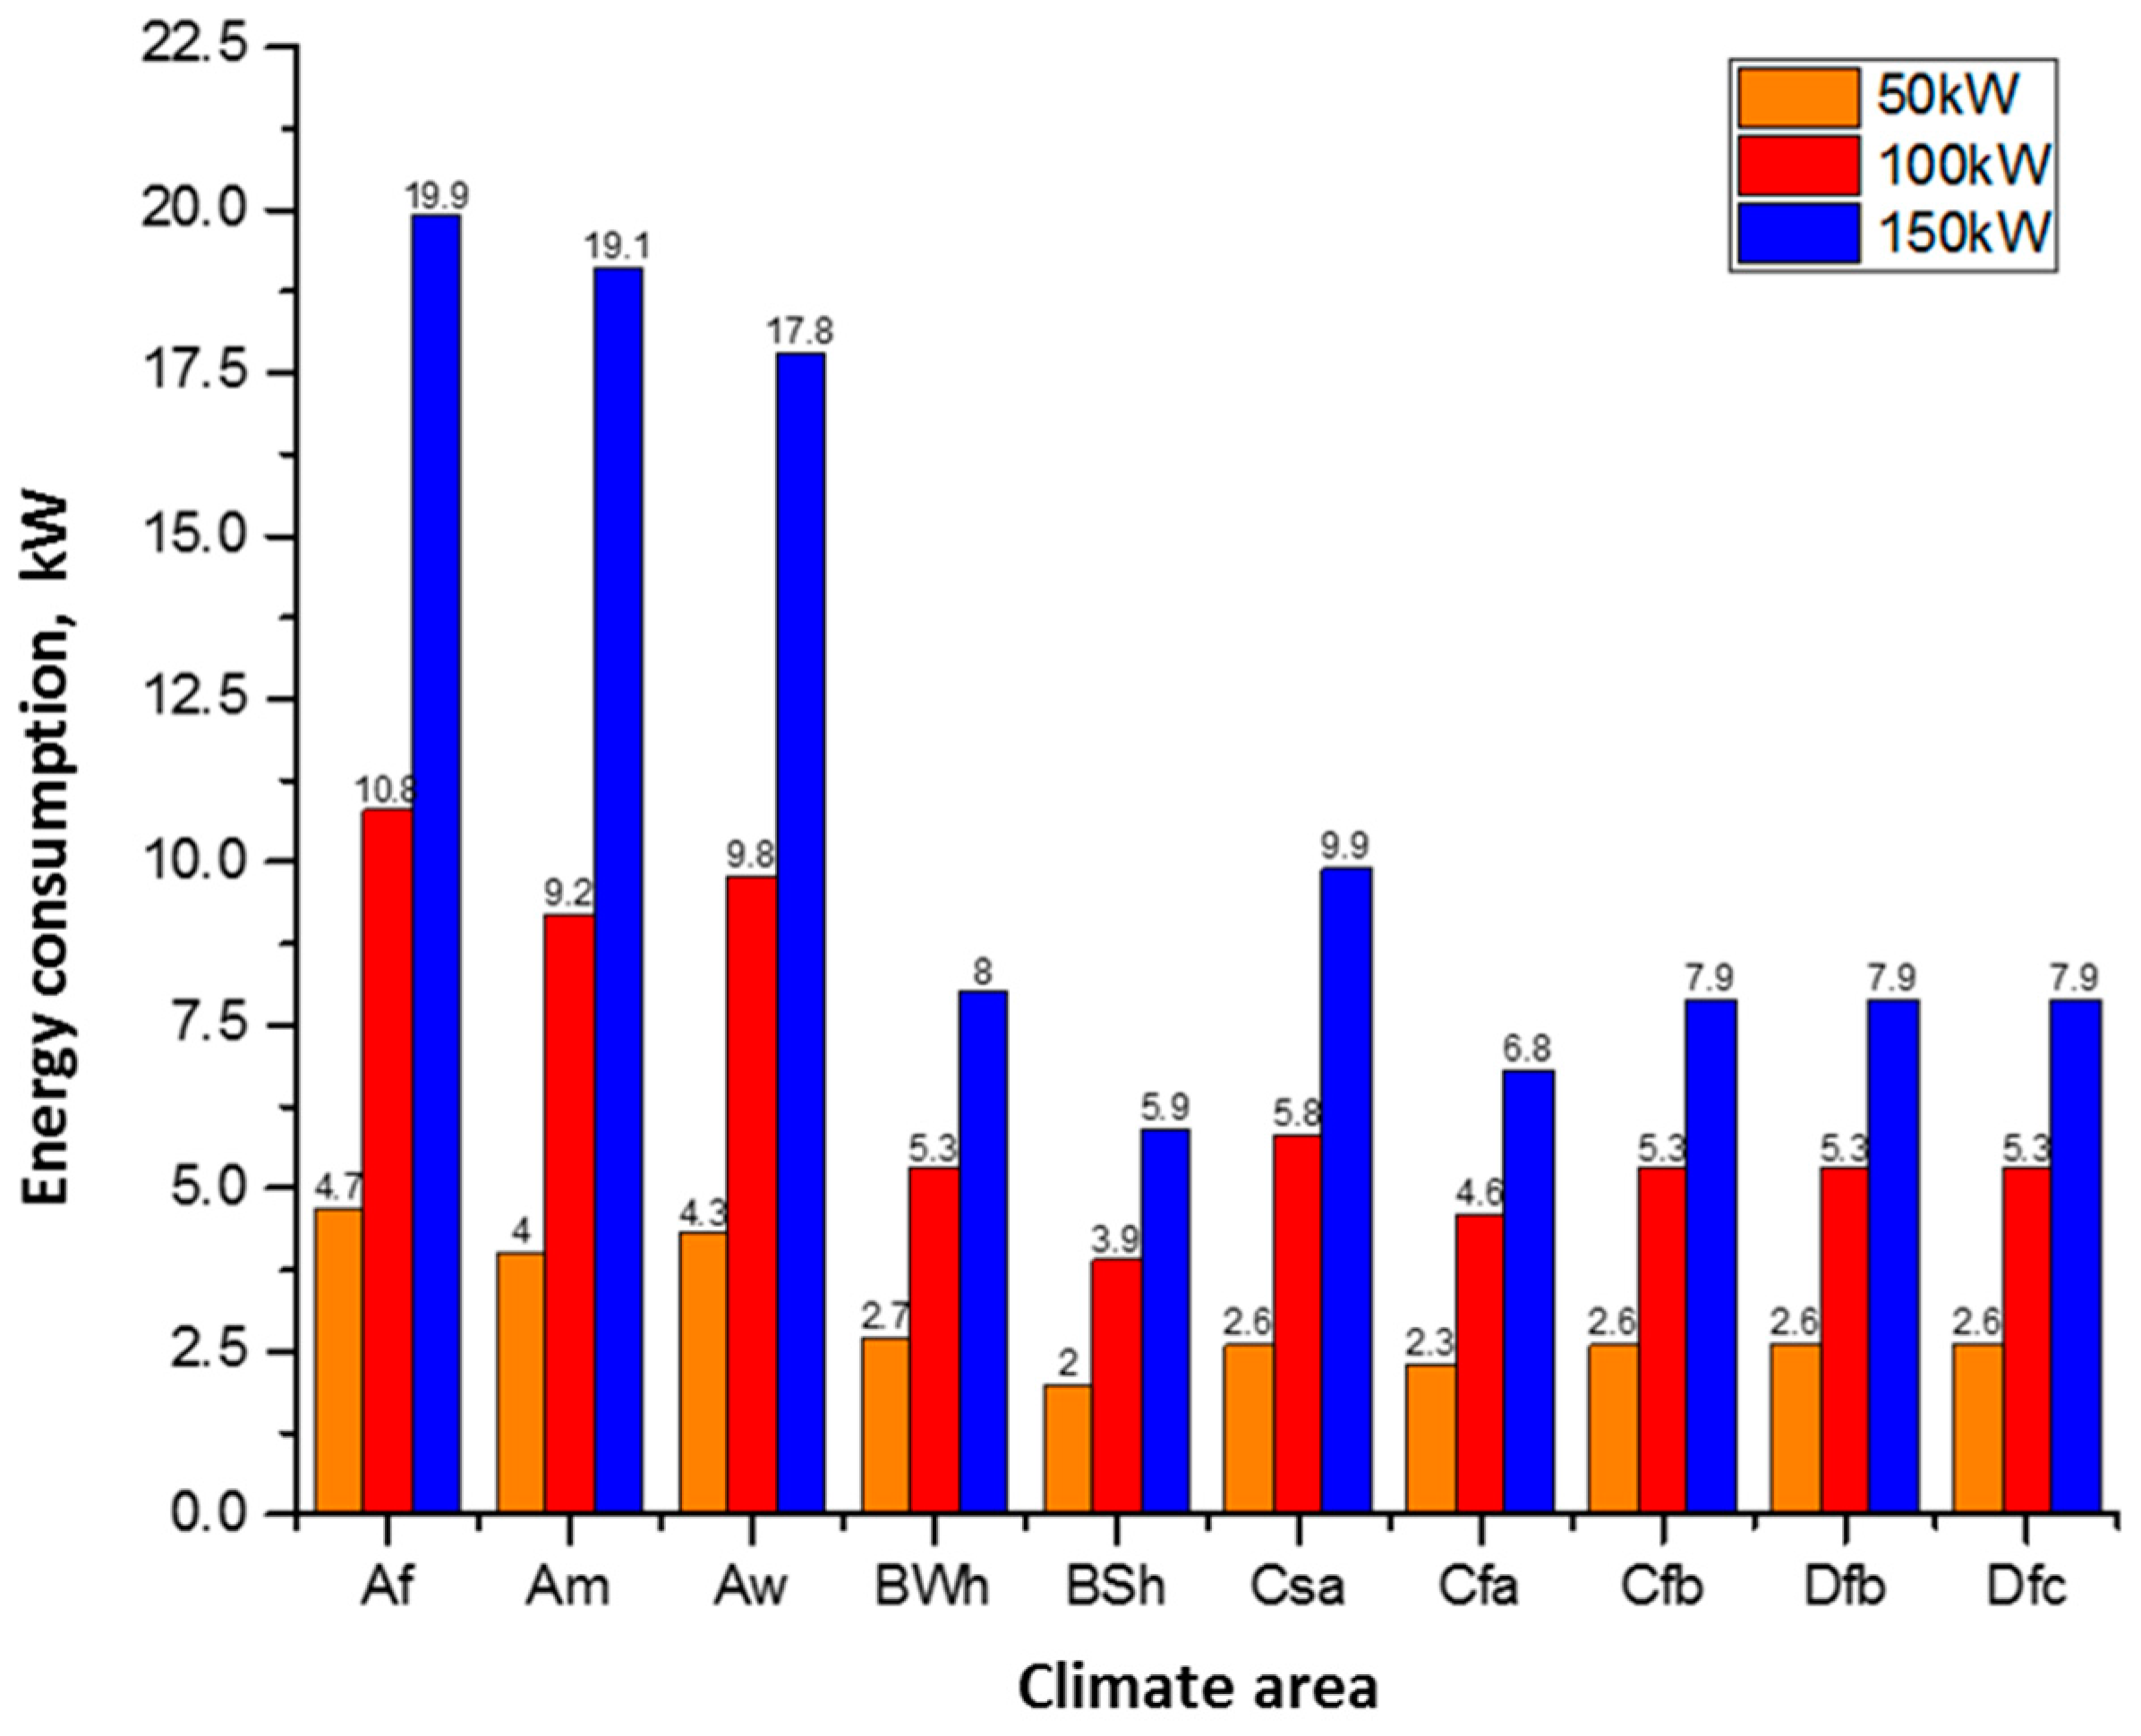
The total power consumption for 10 cities in the 10 climates is shown in Figure 3. It is seen that in the energy consumptions in four climate areas, i.e., Af, Am, Aw and Csa, are obviously higher than those in the other climate areas. This is because in these four climate areas the air from outdoors needs to be dehumidified and therefore the total energy consumption comprises both energy consumption in dew point cooler unit and energy consumption in dehumidifier unit. Table 11 lists the energy consumption in dehumidifier unit for the 4 humid climates. However, for other six climates only the dehumidifier energy consumption is applied.
It can also been seen that for the four humid areas, the highest energy consumption is in the Aw climate area. This is because the temperature in this area is highest (34.1 °C, see Table 10) among the four areas and therefore the sensible heat to be removed is the largest.
Among the six dry climate areas, although the temperature in BWh area is highest (42.4 °C, see Table 3) and therefore the sensible heat to be removed to produce the required product air is supposed to be the largest, however, the supply air mixing with return air can reduce supply air’s temperature and also the COP in this area (28) is the highest owing to its lowest humidity ratio (5.7 g/kg, see Table 3). These lead to the reduced energy consumption. Therefore, it is seen that the energy consumption in this area is close to those of Bsh, Cfa, Cfb, Dfb and Dfc area.
Due to the enthalpies of supply air in BSh, Cfa, Cfb, Dfb, Dfc climate areas are 54.2, 55.9, 53.1, 54 and 54 KJ/Kg, respectively, are less than that of the indoor air of 62.6 KJ/Kg in the data centre, so there is no need to mix the supply air with the return air to reduce its temperature. The outdoor air is directly cooled by the dew point cooler and then enters the data centre to cool the IT equipment. As the Cfb, Dfb and Dfc climate areas have higher humidity ratios of 9.6, 9.4, and 9.6 g/Kg than that in other dry climates, the COPs (19, 19, 19, respectively) of the dew point cooler are lower, despite the lower outdoor air temperatures. Therefore, energy consumptions in these three areas are higher than those in BSh and Cfa areas.
For the same climate area, energy consumption increases with cooling load, as the higher cooling load needs larger regeneration air flow rate and therefore larger fan power consumption is required. The values of the fan power consumption is determined by flow-power curve of the regeneration fans, a series of Jiaye fans (www.wxlixinfengji.com) with different scales were assumed to be used in this research.
It should be pointed out that the energy consumptions presented are for individual units, for total power consumption for each type of DC, the values should be times by 200.
4.4.2. Analysis of PUE
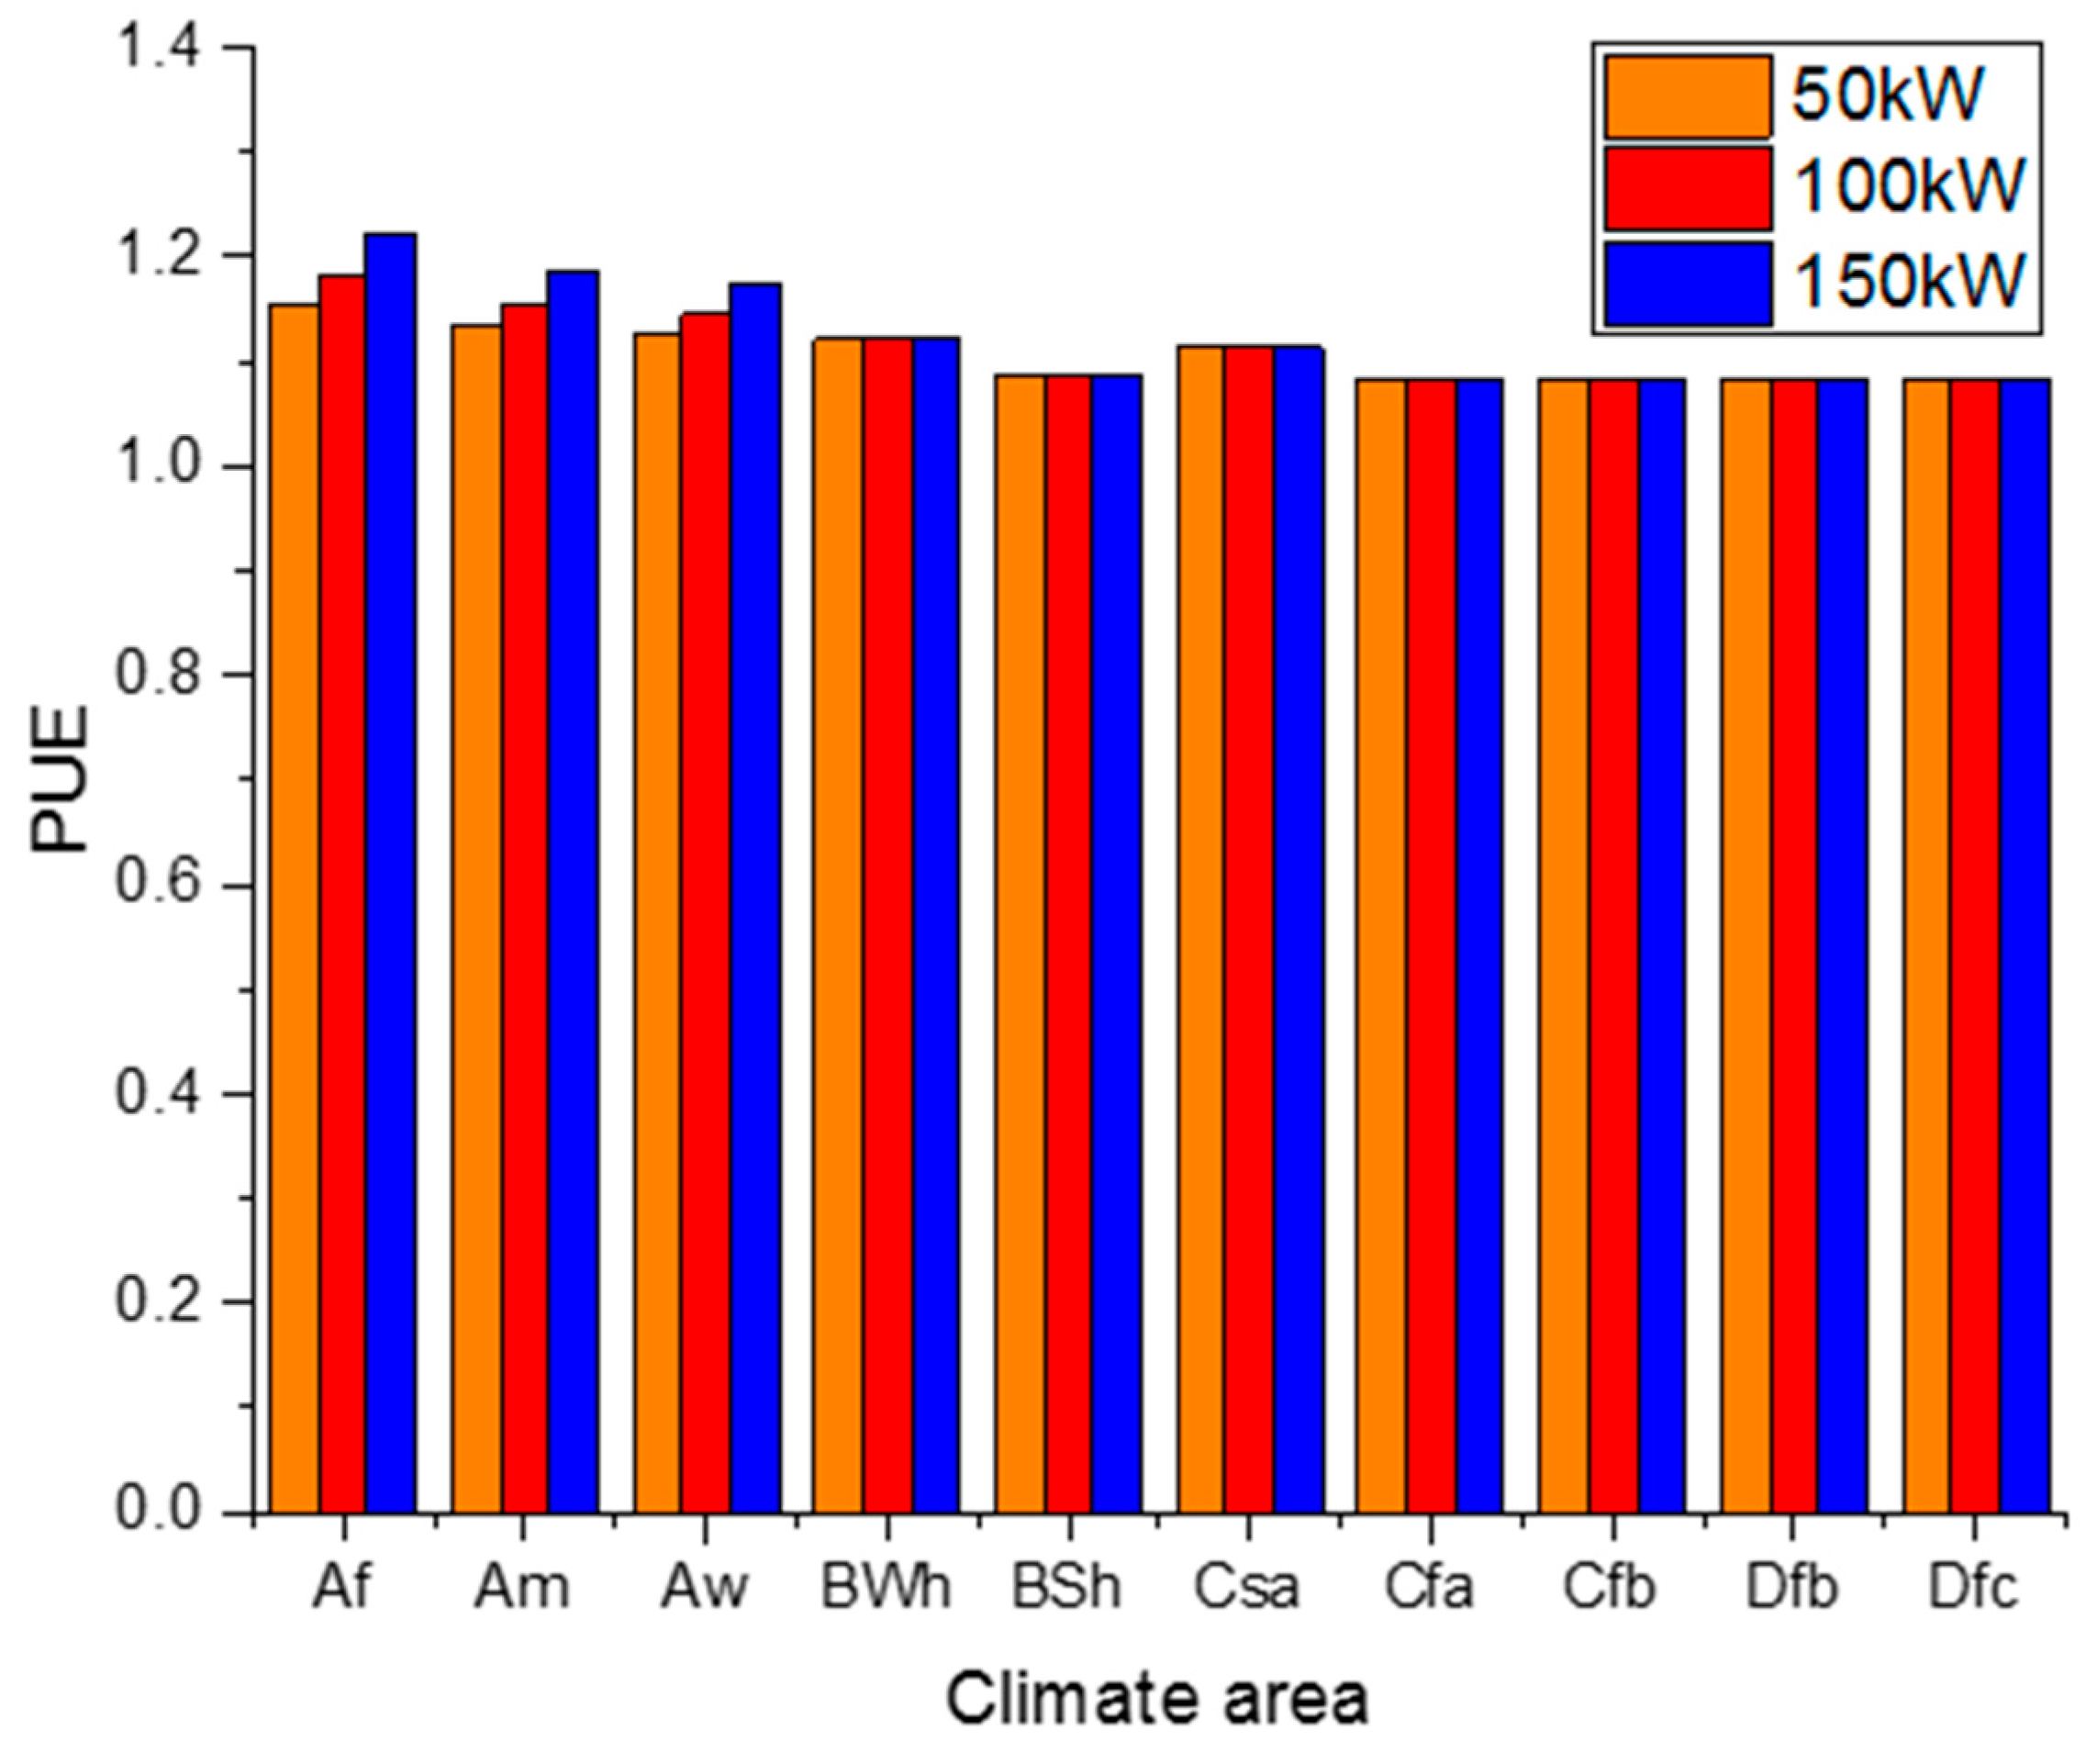
Known the total electrical power consumption of the 50 kW, 100 kW and 150 kW units in various climate areas (Figure 3), the PUE can be calculated by Equation (1). The results are shown Figure 4, where it is seen that all the PUE values of DCs in the 10 climate areas are less than 1.22 which are much less than the existing cases shown in Figure 4, the lower PUE indicates that the DCs have higher energy usage effectiveness resulted in the low energy dew point cooling system.
For the Af, Am Aw and Csa climate areas, due to the fact the intake air needs to be dehumidified, the energy consumptions of dew point cooling system in these regions are relatively higher and therefore have relative higher PUEs (between 1.13 to 1.22 for 50, 100, 150 kW units) than that in the other six climate areas (PUEs are around 1.1). In addition, it can be seen that PUE varies with cooling load in some areas (Af, Am and Aw), which is caused by the nonlinear fan curve. In these cases, higher cooling load that requires higher regeneration air flow rate leads to accelerated increased power consumption of regeneration fans.
In BWh, BSh, Cfa, Cfb, Dfb and Dfc climate areas the electrical energy consumptions are only from the dew point cooler due to no need of dehumidification. Due to the dew point coolers are designed as a modular systems, each module is considered to work with the optimum air flow rate with minimum power consumption, the fan power consumptions are not affected by the nonlinear relations in the fan curve. Therefore, PUEs do not vary with the cooling load.
5. Energy-Saving Potential of the Novel Dew Point Cooling System in DCs
This section presents an energy saving potential analysis by optimum application of the dew point cooling system in DCs. In DCs, the provided cooling normally exceeds the actual demand of IT equipment to assure the safe operation and normal operation of IT equipment, resulting in a low energy efficiency of DCs, which causes great waste of electrical energy. To improve the energy efficiency of DCs, a lot of efforts have been made currently. There are generally three ways to supply the cooling air into data centres, correspondingly, those efforts can be categorised into three groups.
5.1. Cooling Air Management and IT Load Profile in DCs
5.1.1. Cooing Air Management
There are generally three ways to supply the cooling air into data centres by managing cooling air supply at different level: (1) Managing cooling air supply at room level; (2) Managing cooling air supply at row level; (3) Managing cooling air supply at rack level. [48]. The details are stated as follows:
Managing Cooling Air Supply at Room Level
Supplying cooling air at room level usually adopts a structure of hot aisle/cold aisle with raised floor, and the configuration and air flow are shown in Figure 5a. Although supplying air through raised floor has been proved as a feasible way for saving energy [48], it still has a lot of drawbacks, such as cold air bypass and the mixing of hot and cold air. Aisle containment is an effective method for improving the air management. By using the flexible strip curtain of rigid enclosure, the cold aisle and hot aisle are separated to avoid air leakage from the enclosure.
Managing Cooling Air Supply at Row Level (In-Row Cooling)
The power density of servers in data centres keeps rising in these years. A survey shows that the percentage of the server rack, which power density is larger than 10 kW/rack, has increased to 22% [49]. Accordingly, in-row cooling system started to be used due to a better cooling performance. The configuration and air flow of in-row cooling system are shown in Figure 5b. Instead of distributing the cooling air evenly into the room, the design of in-row cooling system takes server rows as the guiding orientation, which places the cooling unit between the server racks to adjust the cooling capacity based on the temperature of servers.
Managing Cooling Air Supply at Rack Level
For server racks, not only does the average power density increase significantly, but also the peak power density. To meet the cooling demand of the racks with extremely high-power density, rack level cooling can be introduced in data centre due to its ability to provide cooling capacity more accurately. The common configuration and air flow is shown in Figure 5c. Snorkels, which direct cooling air form the under-floor plenum to the cabinet, have been used. According to Onyiorah et al. [50], snorkels can significantly reduce the temperature of the top of cabinets and eliminate over-cooling of the cabinets in the meantime.
5.1.2. IT Load Profiles
To investigate the load profile of DCs, a computer model was developed to simulate the dynamic IT equipment cooling load. To simplify the model and the computational program, the following assumptions were made: Each server consists of 20 processors, the processor is randomly in either idle status or in running status. The power consumptions of a processor in running and idle statuses are 25 W and 12.5 W respectively, and a server consists of 20 processors. By knowing the status of processors, the power consumption of a server can be determined. The server is considered as a basic unit for the energy performance analysis. Servers are contained in racks, racks are arranged in row, and rows are arranged in DC room. The IT equipment arrangements in three types of DCs (large, medium and small) can be seen in Table 5.
To design the cooling systems and air management method, usually a uniform operation status for all of servers and homogenous temperature in data centres are assumed. Nevertheless, the operation status is actually quite different from server to server. To reduce excessive cooling supply, cooling demand should be determined according to the actual operation status of individual server, or in other words IT load. This is stated as follows:
To investigate the energy saving potential when regulating the cooling supply considering the variation of power consumption from individual server, five scenarios are designed including a reference scenario:
Scenario 1. Reference case: In data centres, there could be thousands of servers which operating statuses are not uniform due to their divergent functions. Therefore, the hot spot keeps moving. Even though many servers may not operate at full load, to guarantee all of servers operate in the desired range of temperature, the supplied cooling is normally fixed at a high level and an excessive cooling is supplied. The cooling demand can be calculated by assuming all of servers are running at full load:
where Pfull is the power consumption of server running in full load, and Nservers is the number of servers in the entire data centre. This represents the case of the highest power consumption.
Scenario 2. Cooling demand response at room level: The change of server operation status results in the change of power consumption. In this scenario, instead of assuming all of processors always running at full load, the cooling demand is determined by the server which consumes the most power:
where Pi,j,h is the power consumption of the hth server in the ith row and the jth rack.
Scenario 3. Cooling demand response at the row level: The cooling demand response at the row level takes the row of server as a cooling object for adjusting the cooling demand. The cooling demand of each row is, therefore, determined by the server consuming the maximum power in that row:
where Nracks_in_row is the number of racks in a row, I is the number of rows in a room.
Scenario 4. Cooling demand response at rack level: Considering the rack of servers as the cooling object, the cooling demand of each rack is determined by the server consuming the maximum power in that rack:
where Nservers_in_rack is the number of servers in a rack, J is the number of racks in a row.
Although the processor accounts for most of the power consumption of a server, there are some other components such as hard disks and network component, which also consume power [51]. To estimate the cooling demand more accurately, it is assumed that the power consumption of hard disks and network components are 80 W and 20 W respectively, and each server contains 20 processors. Therefore, the cooling demand of a server can be corrected as:
where Pprocessor and Pdisk and Pnet are the power consumptions of processor, hard disk and network component, respectively, N is the number of processors in a server.
5.2. Energy Saving Potential for the 5 Scenarios
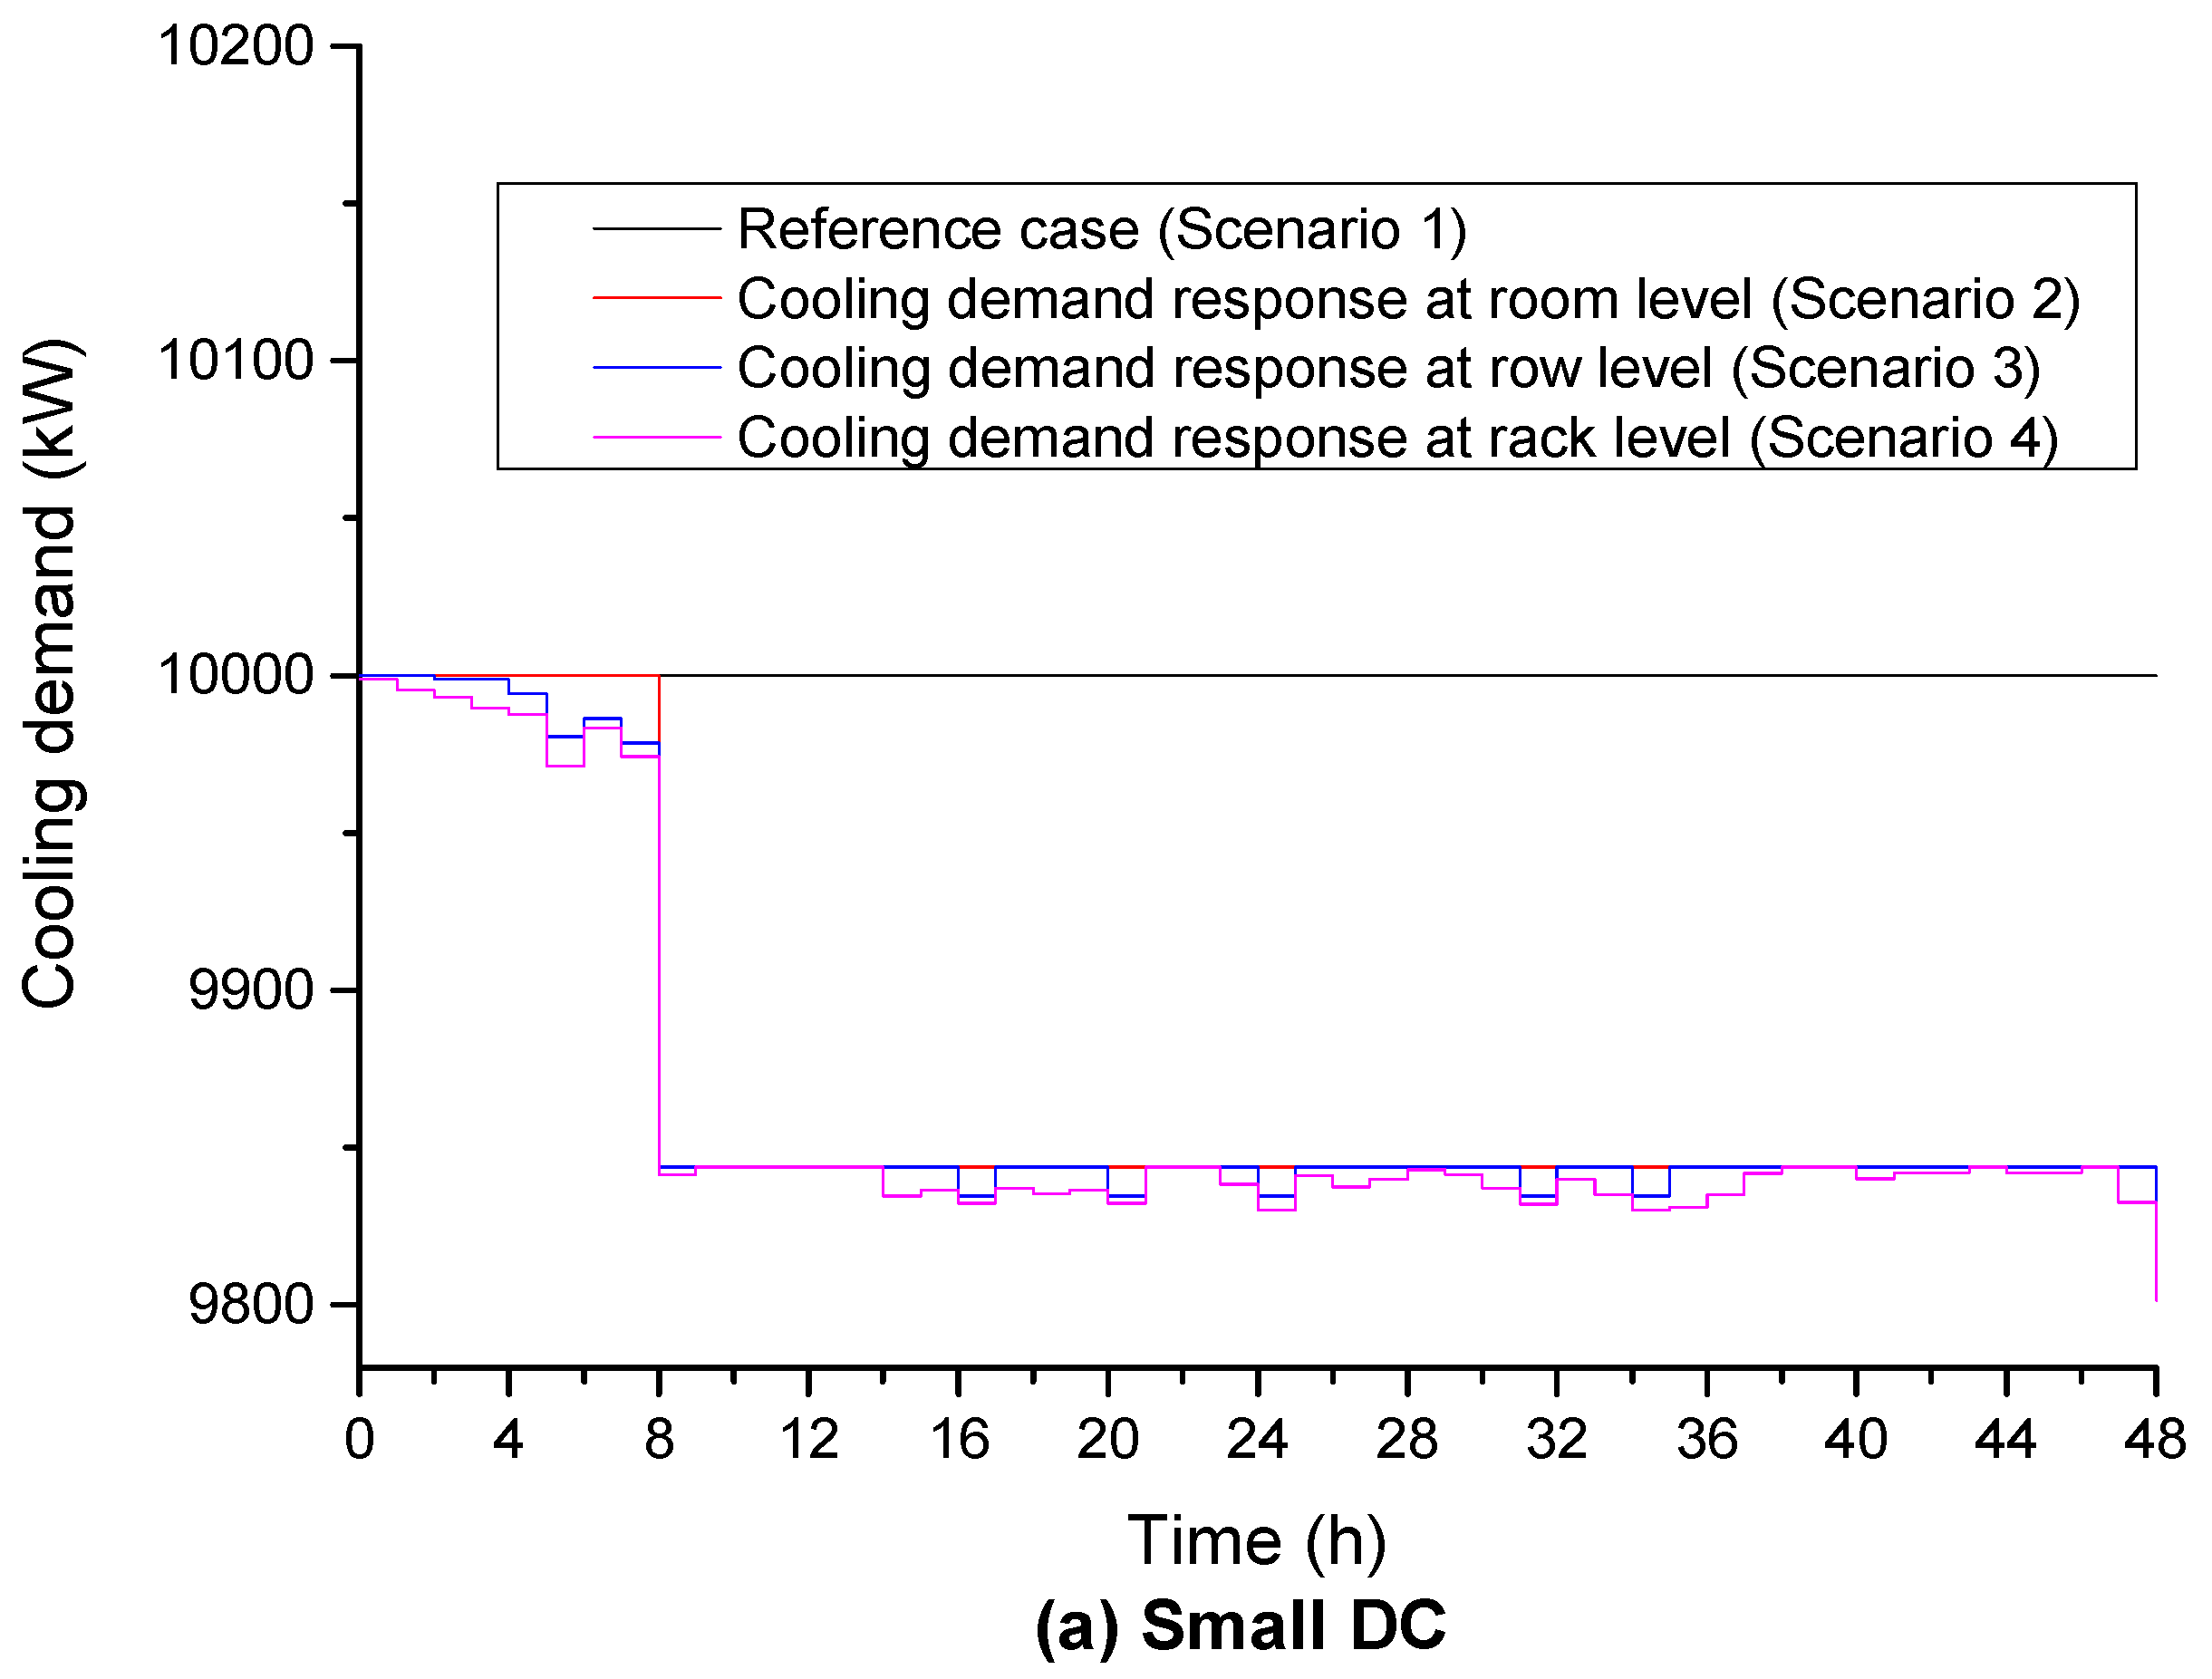
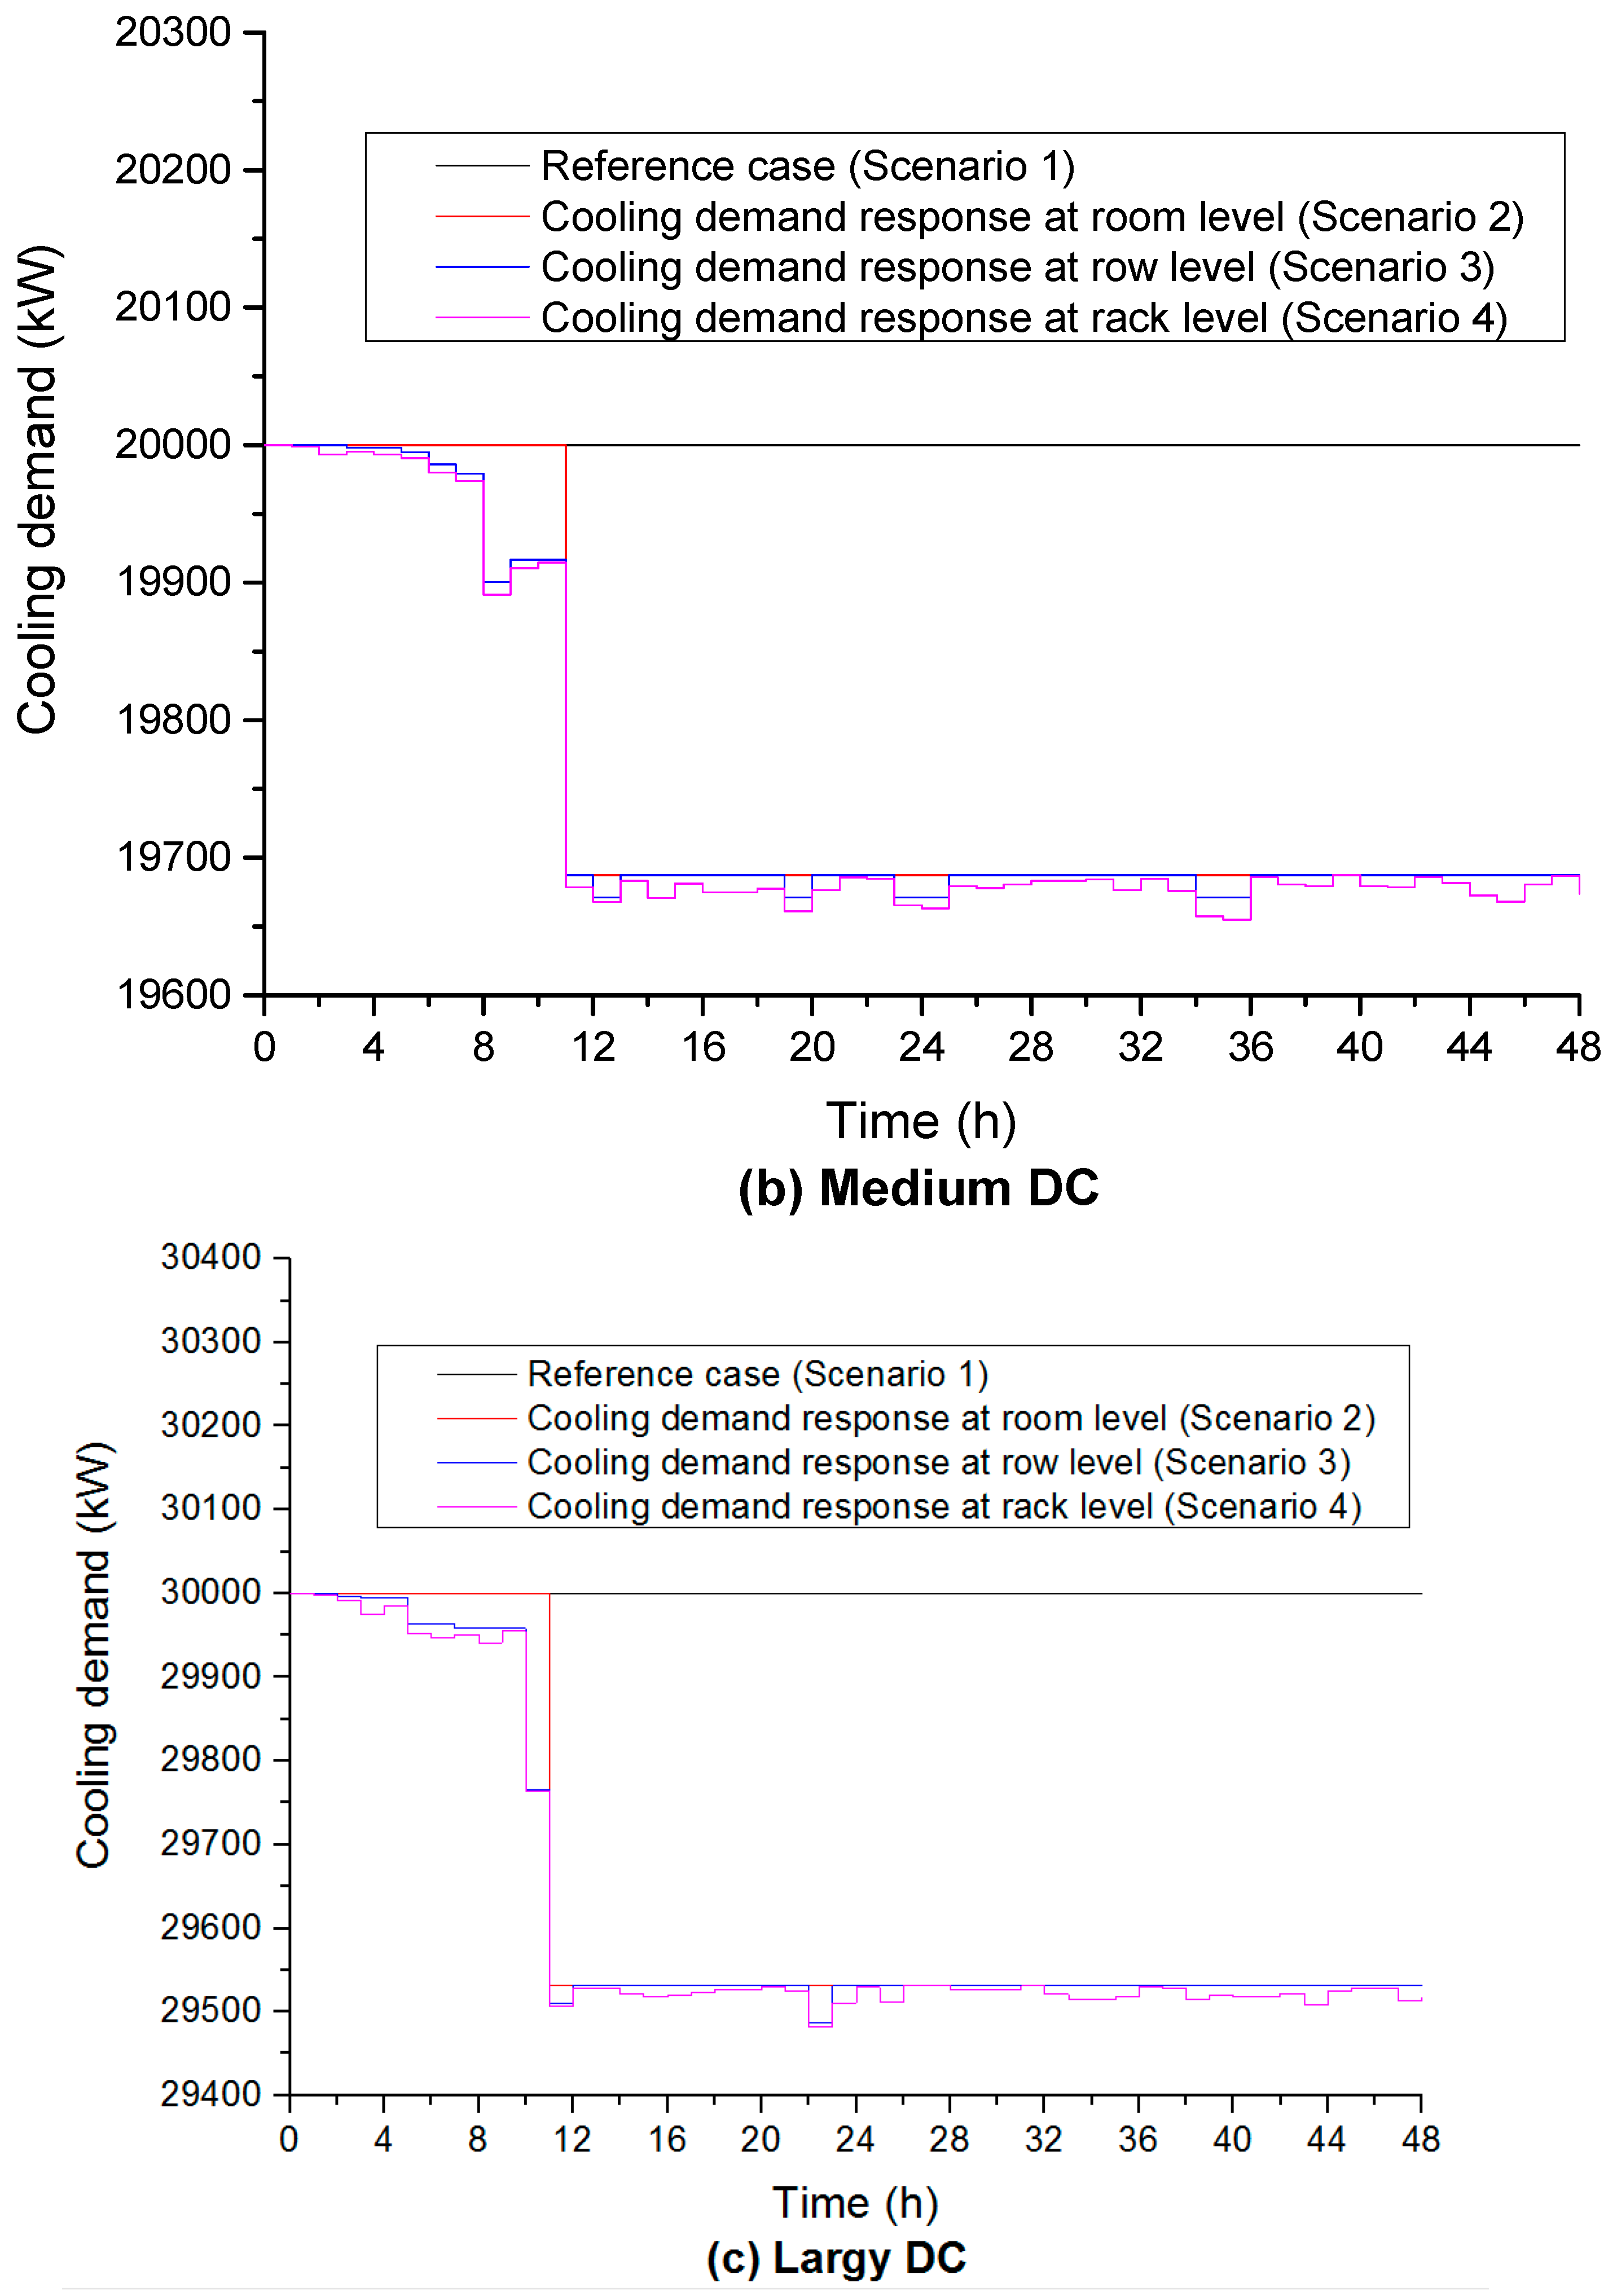
To calculate the cooling demand for different scenarios stated in Section 5.1.2, a C++ program was developed to simulate the hourly IT load of every server in small, medium and large DCs for 48 h. The simulation assumes the processor is randomly in either idle status or in running statues of 25 W and 12.5 W respectively. The simulated IT loads of eight different rows are shown in Figure 6. The dynamic hourly cooling demand is shown in Figure 7.
According to the IT load, the cooling demand respond to the four scenarios could be obtained. Table 12 lists cooling demand of different scenarios in three types of DCs in 48 h. It indicates that compared to the reference case the total cooling demand of Scenario 2, Scenario 3 and Scenario 4 is reduced by 2.4%, 4.1% and 5% respectively for small DC, 1.5%, 2.3% and 2.8% for medium DC, 1.3%, 1.6% and 2% for large DC.
Compared to the reference case, which calculates the cooling demand at a high level by assuming the most of servers are in running status, it has potential to save energy to use dynamic IT load to determine the cooling demand. It can be seen that the scale of DCs slightly affects the saving of cooling demand, the smaller the DC, the higher proportion of cooling demand would be saved.
5.3. Energy-Saving Potential in Data Centre Using the Novel Dew Point System
An electrical energy consumption using the dew point cooling system in DCs is calculated based on the above Scenario 4 and the COPs of the super performance dew point air cooler in 10 cities that listed in Table 11. Furthermore, the micro-channels-loop-heat-pipe based DC heat recovery system can recover about 20% of the total heat emitting from IT equipment in DC, which means 20 % reduced cooling load for the cooler. This has been accounted in the calculation. The equation for the calculation is as follows:
where E is the electricity energy consumption for air conditioning systems, Pcooling is the cooling demand for a DC, Δt is the time interval. The results are shown in Table 13.
Table 13 also gives the percentage of the energy saving compared to traditional vapour compression cooling systems which usually have a COP of around 3. The traditional vapour compression cooling systems require an electricity energy consumptions of around 34,543 MWh to 107,488 MWh for the cases listed in Table 13, which is much higher than that of 3247 MWh to 13,221 MWh by using the super performance dew point cooling system.
As shown in Table 13, for the three types of DCs in 10 different climates, the novel dew point cooling system can save 87.7~90.6% electricity annually.
6. Conclusions
The performance of the novel dew point cooler in 10 typical climates was investigated. It was found that the novel dew point cooler is ideal for use in dry climates, and in humid areas it can be run efficiently with the aid of dehumidification systems. In the 10 typical cities, the PUEs of DCs are lower than 1.2. PUEs are relatively higher in Af, Am, Aw and Csa climate areas, and increase with cooling load at the same climate conditions, because of the requirement of the dehumidification in these climate areas. As for the other 6 climate areas (BWh, BSh, Cfa, Cfb, Dfb and Dfc) where dehumidification is not required, the cooling loads dont impact on the PUEs.
By using the novel dew point cooling system instead of a traditional air conditioning system, 87.7~91.6% electricity consumption savings can be achieved in 10 selected cities which represent 10 typical climatic regions across the world. The DCs can be classified into three types in terms of the IT equipment load density: large, medium and small. The scale of DCs slightly affects the saving of cooling demand, the smaller the DC load capacity the higher proportion of cooling demand could be saved. Corresponding to the three ways of cold air supply, the room level, row level, and rack level, the saved cooling demand increases in the order of room level, row level, and rack level.
It should be of particular interest that the dew point cooling system can be used in data centres in various climates with much higher energy efficiency. This created an opportunity to develop a novel air cooling system for DCs with the significantly enhanced energy efficiency and greatly reduced power use, thus extending its applications worldwide. This research will therefore contribute to realisation of the global energy saving and carbon reduction targets, and bring about the enormous economic, environmental and sustainability benefits to the world.
Acknowledgments
The authors would acknowledge our sincere appreciation to the financial supports from the European Commission H20202 MSCA programme (for the EU H2020—MSCA-RISE-2016-734340—DEW-COOL-4-CDC project) and Royal Academy of Engineering (for the UK-CIAPP\415 project).
Author Contributions
Xudong Zhao conceived and proposed the research; Xiaoli Ma and Xudong Zhao contributed the novel dew point cooling system design and performance analysis; Yin Bi and Yugang Wang contributed the data center and climate area information, analysis of energy usage effectiveness and energy saving potential using the novel dew point cooling system in dada centers; Xiaoli Ma and Yin Bi wrote the paper.
Conflicts of Interest
The authors declare no conflict of interest.
References
- Cho, J.; Kim, B.S. Evaluation of air management system’s thermal performance for superior cooling efficiency in high density data centres. Energy Build. 2011, 43, 2145–2155. [Google Scholar] [CrossRef]
- Shehabi, A.; Masanet, E.; Price, H.; Horvath, A. Nazar off WW. Data centre design and location: Consequences for electricity use and greenhouse gas emissions. Build Environ. 2011, 46, 990–998. [Google Scholar] [CrossRef]
- IDC Corporation (China). 2016–2017 China IDC Industrial Development Report. 2017. Available online: http://www.idcquan.com/Special/2017baogao/ (accessed on 27 October 2017).
- Data Center Map. Available online: http://www.datacentermap.com/ (accessed on 27 October 2017).
- Li, T. In-depth analysis of 2013 data centre efficiency situation. World Power Supply 2013, 6, 7–8. [Google Scholar]
- China Data Centre Industry Development Alliance. Development Plan for National Green Data Centre in China; China Data Centre Industry Development Alliance: Beijing, China, 2015. [Google Scholar]
- Priyadumkol, J.; Kittichaikarn, C. Application of the combined air-conditioning systems for energy conservation in data centre. Energy Build. 2014, 68, 580–586. [Google Scholar] [CrossRef]
- LBNL, Data Centre Website of Lawrence Berkeley National Laboratory. Available online: http://www.lbl.gov/ (accessed on 27 October 2017).
- Oro, E.; Depoorter, V.; Garcia, A.; Salom, J. Energy efficiency and renewable energy integration in data centres. Strategies and modelling review. Renew. Sustain. Energy Rev. 2015, 42, 429–445. [Google Scholar] [CrossRef]
- EPAUS. Report to Congress on Server and Data Centre Energy Efficiency Public Law 109-431; Energy Star Program: Washington, DC, USA, 2007. [Google Scholar]
- Whitney, J.; Delforge, P. Data Centre Efficiency Assessment; Natural Resources Defense Council: New York, NY, USA, 2014. [Google Scholar]
- Renewable Energy Unit; Institute for Energy, Directorate-General Joint Research Centre; European Commission. The European Code of Conduct on Data Centre Energy Efficiency; Version 3.0; Institute for Energy Renewable and Energy Efficiency Unit, European Commission: Brussels, Belgium, 2015. [Google Scholar]
- Digital Realty Trust Inc. Europe Campos Survey Results; Digital Realty Trust Inc.: London, UK, 2013. [Google Scholar]
- Vor dem Berge, M.; da Costa, G.; Jarus, M.; Oleksiak, A.; Piatek, W.; Volk, E. Modeling Data Centre Building Blocks for Energy-efficiency and Thermal Simulations. In Proceedings of the 2nd International Workshop on Energy-Efficient Data Centres, e-Energy 2013 Conference, Berkeley, CA, USA, 20 May 2013. [Google Scholar]
- Duan, Z.; Zhan, C.; Zhang, X.; Mustafa, M.; Zhao, X.; Alimohammadisagvand, B.; Hasan, A. Indirect evaporative cooling—Past, present and future potential. Renew. Sustain. Energy Rev. 2012, 16, 6823–6850. [Google Scholar] [CrossRef]
- Zhan, C.; Duan, Z.; Zhao, X. Comparative study of the performance of the M-cycle counter-flow and cross-flow heat exchangers for indirect evaporative cooling. Energy 2011, 36, 6790–6805. [Google Scholar] [CrossRef]
- Elbel, S.; Hrnjak, P. Ejector Refrigeration: An Overview of Historical and Present Development with an Emphasis on Air-Conditioning Applications. 2008. International Refrigeration and Air Conditioning c. Paper 884. Available online: http://docs.lib.purdue.edu/iracc/884 (accessed on 27 October 2017).
- Yapici, R.; Akkurt, F. Experimental investigation on ejector cooling system performance at low generator temperature and a preliminary study on solar energy. J. Mech. Sci. Technol. 2012, 26, 3653–3659. [Google Scholar] [CrossRef]
- Liu, Y.; Tian, Q.; Wu, X.; Bai, H. Analyses of the operational conditions of the compression-ejector double-stage refrigeration system. Build. Energy Environ. 2009, 28, 37–40. [Google Scholar]
- N’tsoukpoe, K.E.; Le Pierrès, N.; Luo, L. Experimentation of a LiBr-H2O absorption process for long-term solar thermal storage: Prototype design and first results. Energy 2013, 53, 179–198. [Google Scholar] [CrossRef]
- Daou, K.; Wang, R.Z.; Xia, Z.Z. Desiccant cooling: A review. Renew. Sustain. Energy Rev. 2006, 10, 55–77. [Google Scholar] [CrossRef]
- Dabrowski, A. Adsorption—From theory to practice. Adv. Colloid Interface Sci. 2001, 93, 135–224. [Google Scholar] [CrossRef]
- Chen, Q.; Pan, N.; Guo, Z.-Y. A new approach to analysis and optimization of evaporative cooling system II: Applications. Energy 2011, 36, 2890–2898. [Google Scholar] [CrossRef]
- Goshayshi, H.R.; Missenden, J.F.; Tozer, R. Cooling tower—An energy conservation resource. Appl. Therm. Eng. 1999, 19, 1223–1235. [Google Scholar] [CrossRef]
- Xu, P.; Ma, X.; Zhao, X.; Fancey, K. Experimental investigation of a super performance dew point air cooler. Appl. Energy 2017, 203, 761–777. [Google Scholar] [CrossRef]
- Lin, J.; Thu, K.; Bui, T.D.; Wang, R.Z.; Ng, K.C.; Kumja, M.; Chua, K.J. Unsteady-state analysis of a counter-flow dew point evaporative cooling system. Energy 2016, 113, 172–185. [Google Scholar] [CrossRef]
- Pandelidis, D.; Anisimov, S. Numerical analysis of the heat and mass transfer processes in selected M-Cycle heat exchangers for the dew point evaporative cooling. Energy Convers. Manag. 2015, 90, 62–83. [Google Scholar] [CrossRef]
- Pandelidis, D.; Anisimov, S. Numerical study and optimization of the cross-flow Maisotsenko cycle indirect evaporative air cooler. Int. J. Heat Mass Transf. 2016, 103, 1029–1041. [Google Scholar] [CrossRef]
- Sohani, A.; Sayyaadi, H.; Hoseinpoori, S. Modeling and multi-objective optimization of an M-cycle cross-flow indirect evaporative cooler using the GMDH type neural network. Int. J. Refrig. 2016, 69, 186–204. [Google Scholar] [CrossRef]
- Moshari, S.; Heidarinejad, G. Numerical study of regenerative evaporative coolers for sub-wet bulb cooling with cross- and counter-flow configuration. Appl. Therm. Eng. 2015, 89, 669–683. [Google Scholar] [CrossRef]
- Chen, Y.; Yang, H.; Luo, Y. Parameter sensitivity analysis and configuration optimization of Indirect Evaporative Cooler (IEC) considering condensation. Appl. Energy 2016, 104, 87–104. [Google Scholar] [CrossRef]
- Kabeel, A.E.; Abdelgaied, M. Numerical and experimental investigation of a novel configuration of indirect evaporative cooler with internal baffles. Energy Convers. Manag. 2016, 126, 526–536. [Google Scholar] [CrossRef]
- Riangvilaikul, B.; Kumar, S. Numerical study of a novel dew point evaporative cooling system. Energy Build. 2010, 42, 2241–2250. [Google Scholar] [CrossRef]
- Zhang, X.; Xu, Y.; Xu, J.; Zhao, X. A Novel Thin Thickness and Super Conductive Heat Absorber Based Flat Plate Solar Collector. China Patent CN103759432A, 30 March 2014. [Google Scholar]
- Chen, N.; Ren, X.; Ren, S.; Wierman, A. Greening Multi-Tenant Data Centre Demand Response. In Proceedings of the 33rd International Symposium on Computer Performance, Modeling, Measurements and Evaluation (IFIP WG7.3 Performance) 2015, ACM, New York, NY, USA, 16 September 2015. [Google Scholar]
- American Society of Heating, Refrigerating and Air-Conditioning Engineers. ASHRAE T.C.9.9, 2011 Thermal Guidelines for Data Processing Environments—Expanded Data Center, Data Processing; American Society of Heating, Refrigerating and Air-Conditioning Engineers: Atlanta, GA, USA, 2011; pp. 1–45. [Google Scholar]
- Belady, C. Microsoft, The Green Grid Data Centre Power Efficiency Metrics: PUE and DCIE. The Green Grid, 2008. Available online: http://www.premiersolutionsco.com/wp-content/uploads/TGG_Data_Center_Power_Efficiency_Metrics_PUE_and_DCiE.pdf (accessed on 27 October 2017).
- Köppen climate classification From Wikipedia. Available online: https://en.wikipedia.org/wiki/Köppen_climate_classification (accessed on 27 October 2017).
- American Society of Heating, Refrigerating and Air-Conditioning Engineers. 2009 ASHRAE Handbook—Fundamentals (SI); American Society of Heating, Refrigerating and Air-Conditioning Engineers: Atlanta, GA, USA, 2009. [Google Scholar]
- Ganore, P. Different Types of Data Centres and Their Different Tasks. Available online: https://www.esds.co.in/blog/different-types-of-data-centers-and-their-different-tasks/#sthash.siCAmqnV.dpbs (accessed on 27 October 2017).
- Munther, S.; Robert, T. Data Centres’ Energy Auditing and Benchmarking-Progress Update. ASHRAE Trans. 2010, 116, 109–117. [Google Scholar]
- Yang, G.; Hu, Y.; Ma, W. Design of Air Conditioning in Data Centre. Electr. Build. 2009, 28, 21–26. [Google Scholar]
- Ebrahimi, K.; Jones, G.F.; Fleischer, A.S. A review of data centre cooling technology, operating conditions and the corresponding low-grade waste heat recovery opportunities. Renew. Sustain. Energy Rev. 2014, 31, 622–638. [Google Scholar] [CrossRef]
- Lee, K.-P.; Chen, H.-L. Analysis of energy saving potential of air-side free cooling for datacentres in worldwide climate zones. Energy Build. 2013, 64, 103–112. [Google Scholar] [CrossRef]
- Gu, L.; Zhou, F.; Meng, H. Study on energy consumption and efficiency level of data centres in China. Chin. Energy 2010, 32, 42–45. [Google Scholar]
- Ge, T. Theoretical and Experimental Investigation on a Two-Stage Rotary Desiccant Cooling System; Shanghai Jiao Tong University: Shanghai, China, 2008. [Google Scholar]
- Xu, P.; Ma, X.; Diallo, T.M.O.; Zhao, X.; Fancey, K.; Li, D.; Chen, H. Numerical investigation of the energy performance of a guideless irregular heat and mass exchanger with corrugated heat transfer surface for dew point cooling. Energy 2016, 109, 803–817. [Google Scholar] [CrossRef]
- Zhu, K.; Cui, Z.; Wang, Y.; Li, H.; Zhang, X.; Franke, C. Estimating the maximum energy-saving potential based on IT load and IT load shifting. Energy 2017, 138, 902–909. [Google Scholar] [CrossRef]
- Alajmi, A.; El-Amer, W. Saving energy by using underfloor-air-distribution (UFAD) system in commercial buildings. Energy Convers. Manag. 2010, 51, 1637–1642. [Google Scholar] [CrossRef]
- Onyiorah, C.; Eiland, R.; Agonafer, D.; Schmidt, R. Effectiveness of Rack-Level Containment in Removing Data Centre Hot-spots. In Proceedings of the IEEE Intersociety Conference on Thermal and Thermomechanical Phenomena in Electronic System (ITherm), Orlando, FL, USA, 27–30 May 2014; pp. 798–806. [Google Scholar]
- Aroca, J.A.; Chatzipapas, A.; Anta, A.F.; Mancuso, V. A Measurement-based Characterization of the Energy Consumption in Data Centre Servers. IEEE J. Sel. Areas Commun. 2015, 33, 2863–2877. [Google Scholar] [CrossRef]
Figure 1.
Schematic drawing of the novel dew point cooling system.

Figure 2.
IT Equipment layout in the data center.
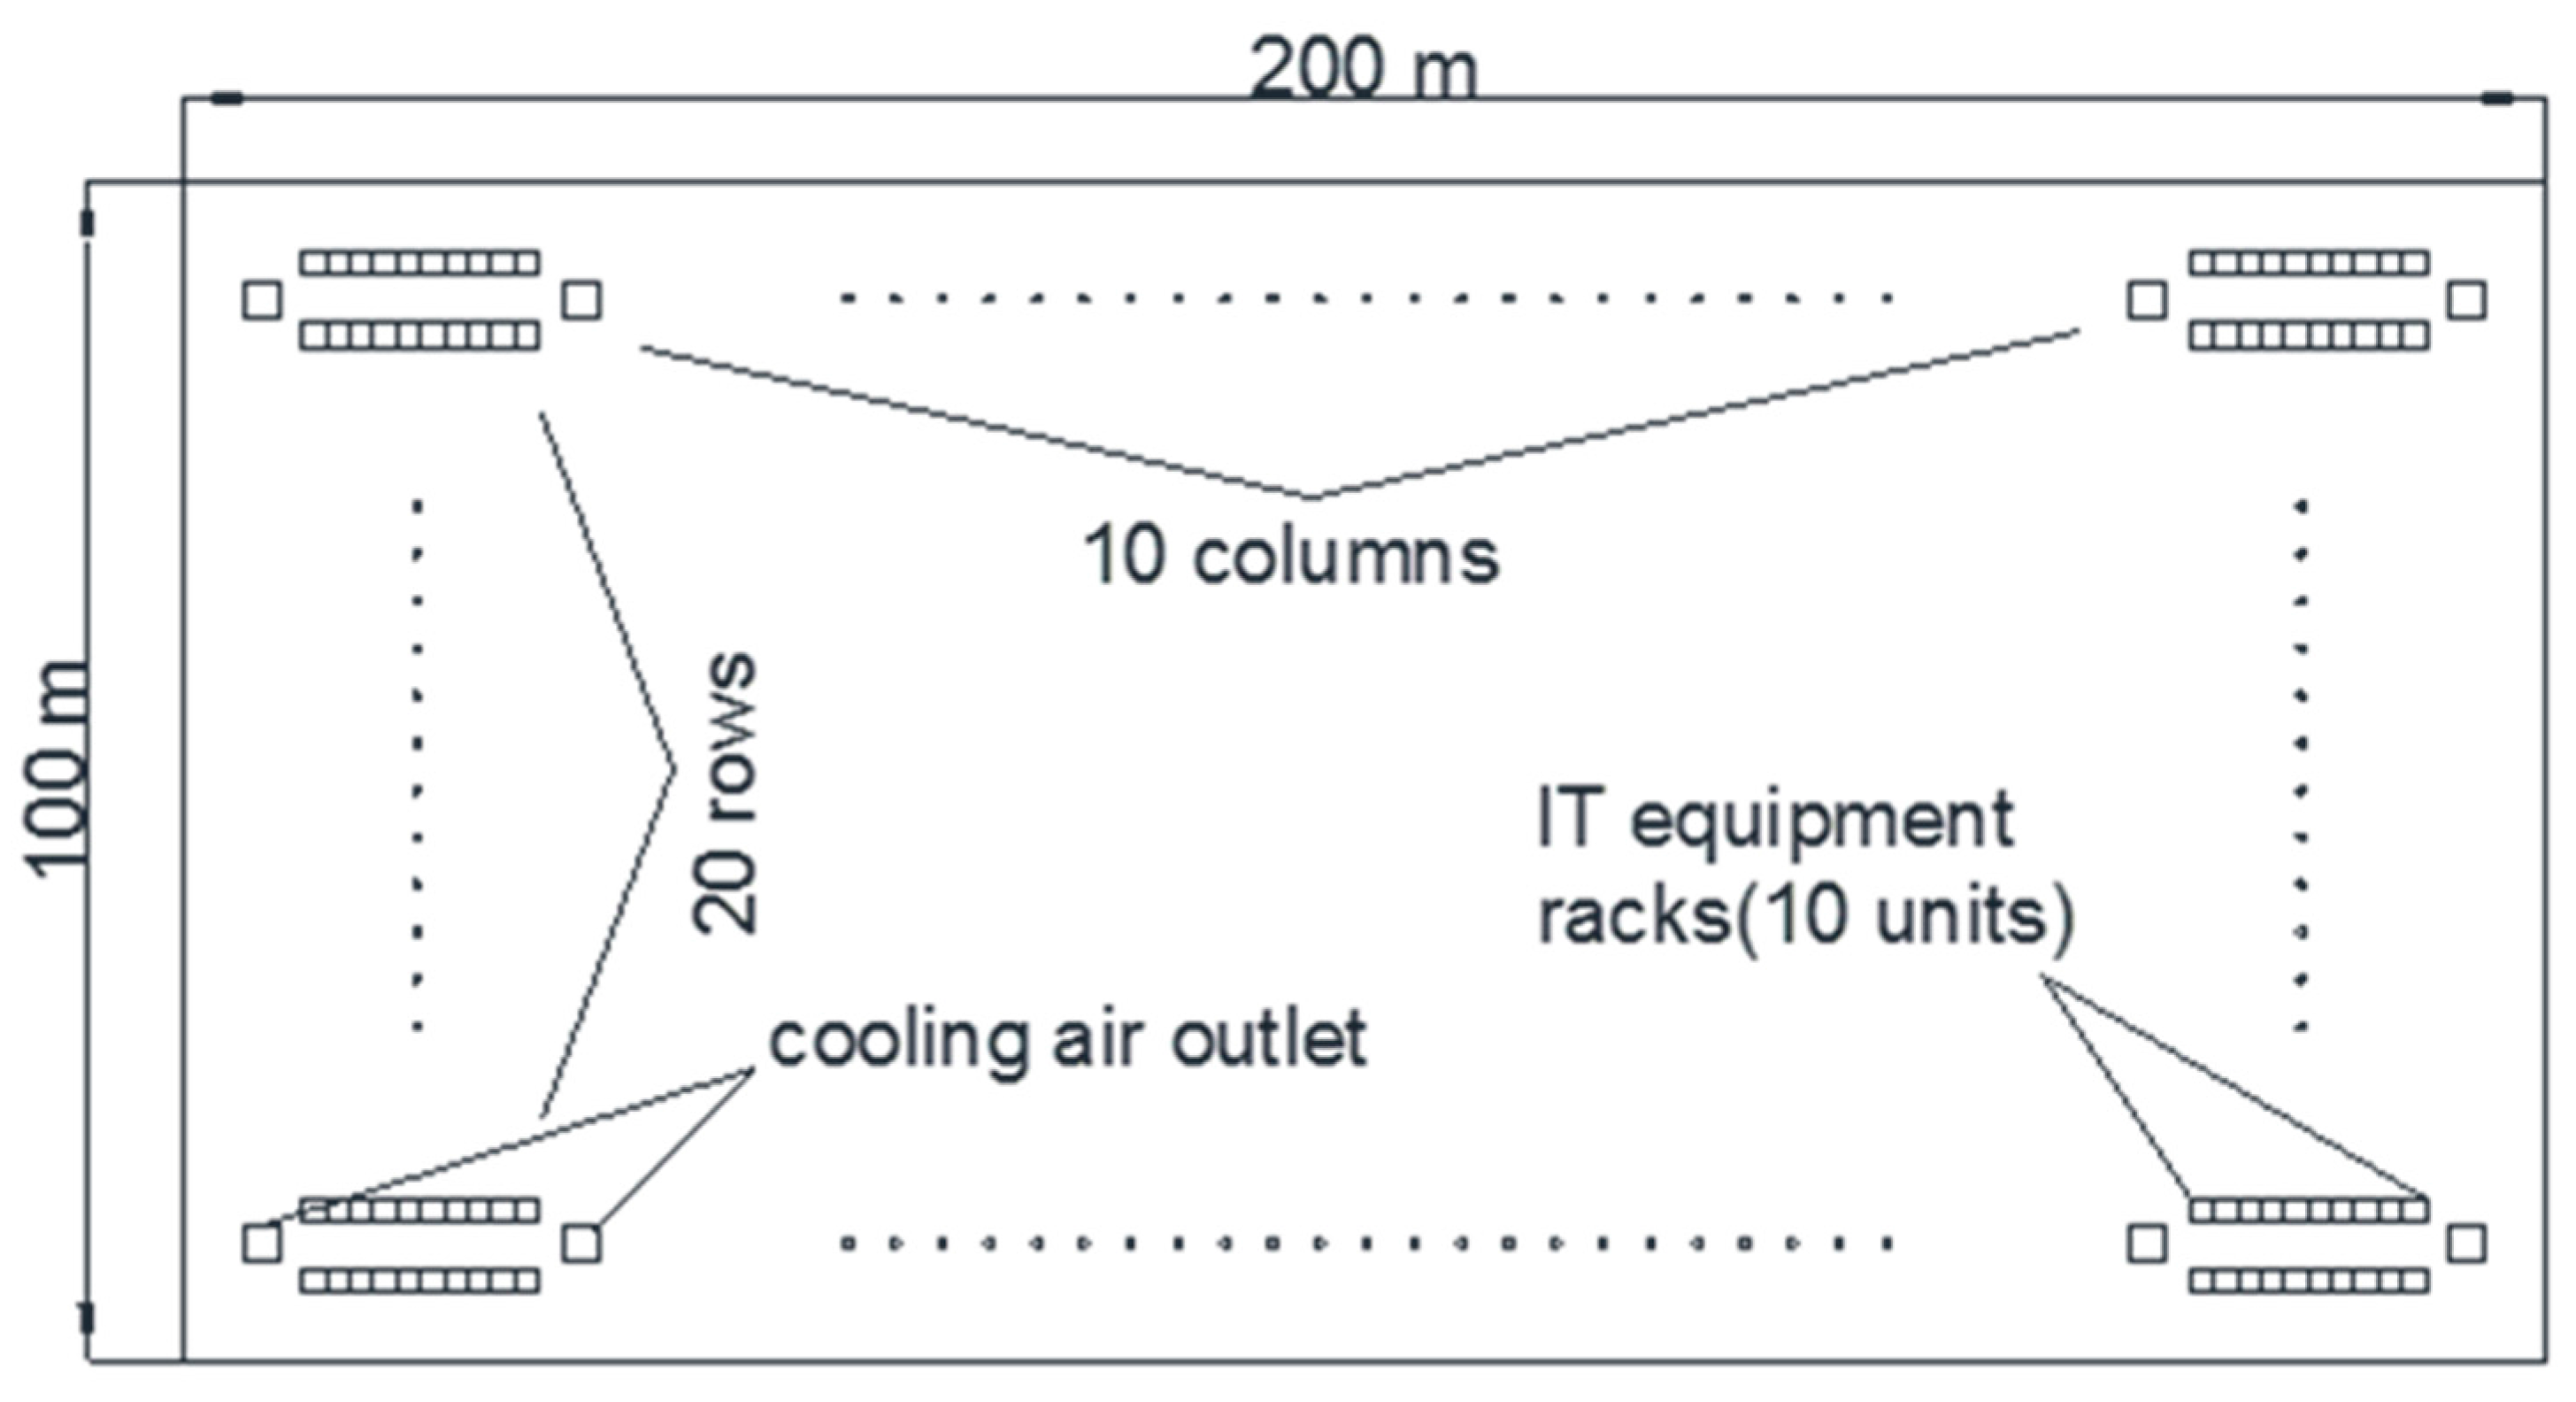
Figure 3.
Electrical energy consumption of the dew point cooler in different climate areas.

Figure 4.
PUEs in different climate areas.

Figure 5.
The configuration and air flow for systems supplying cooling air at different levels.
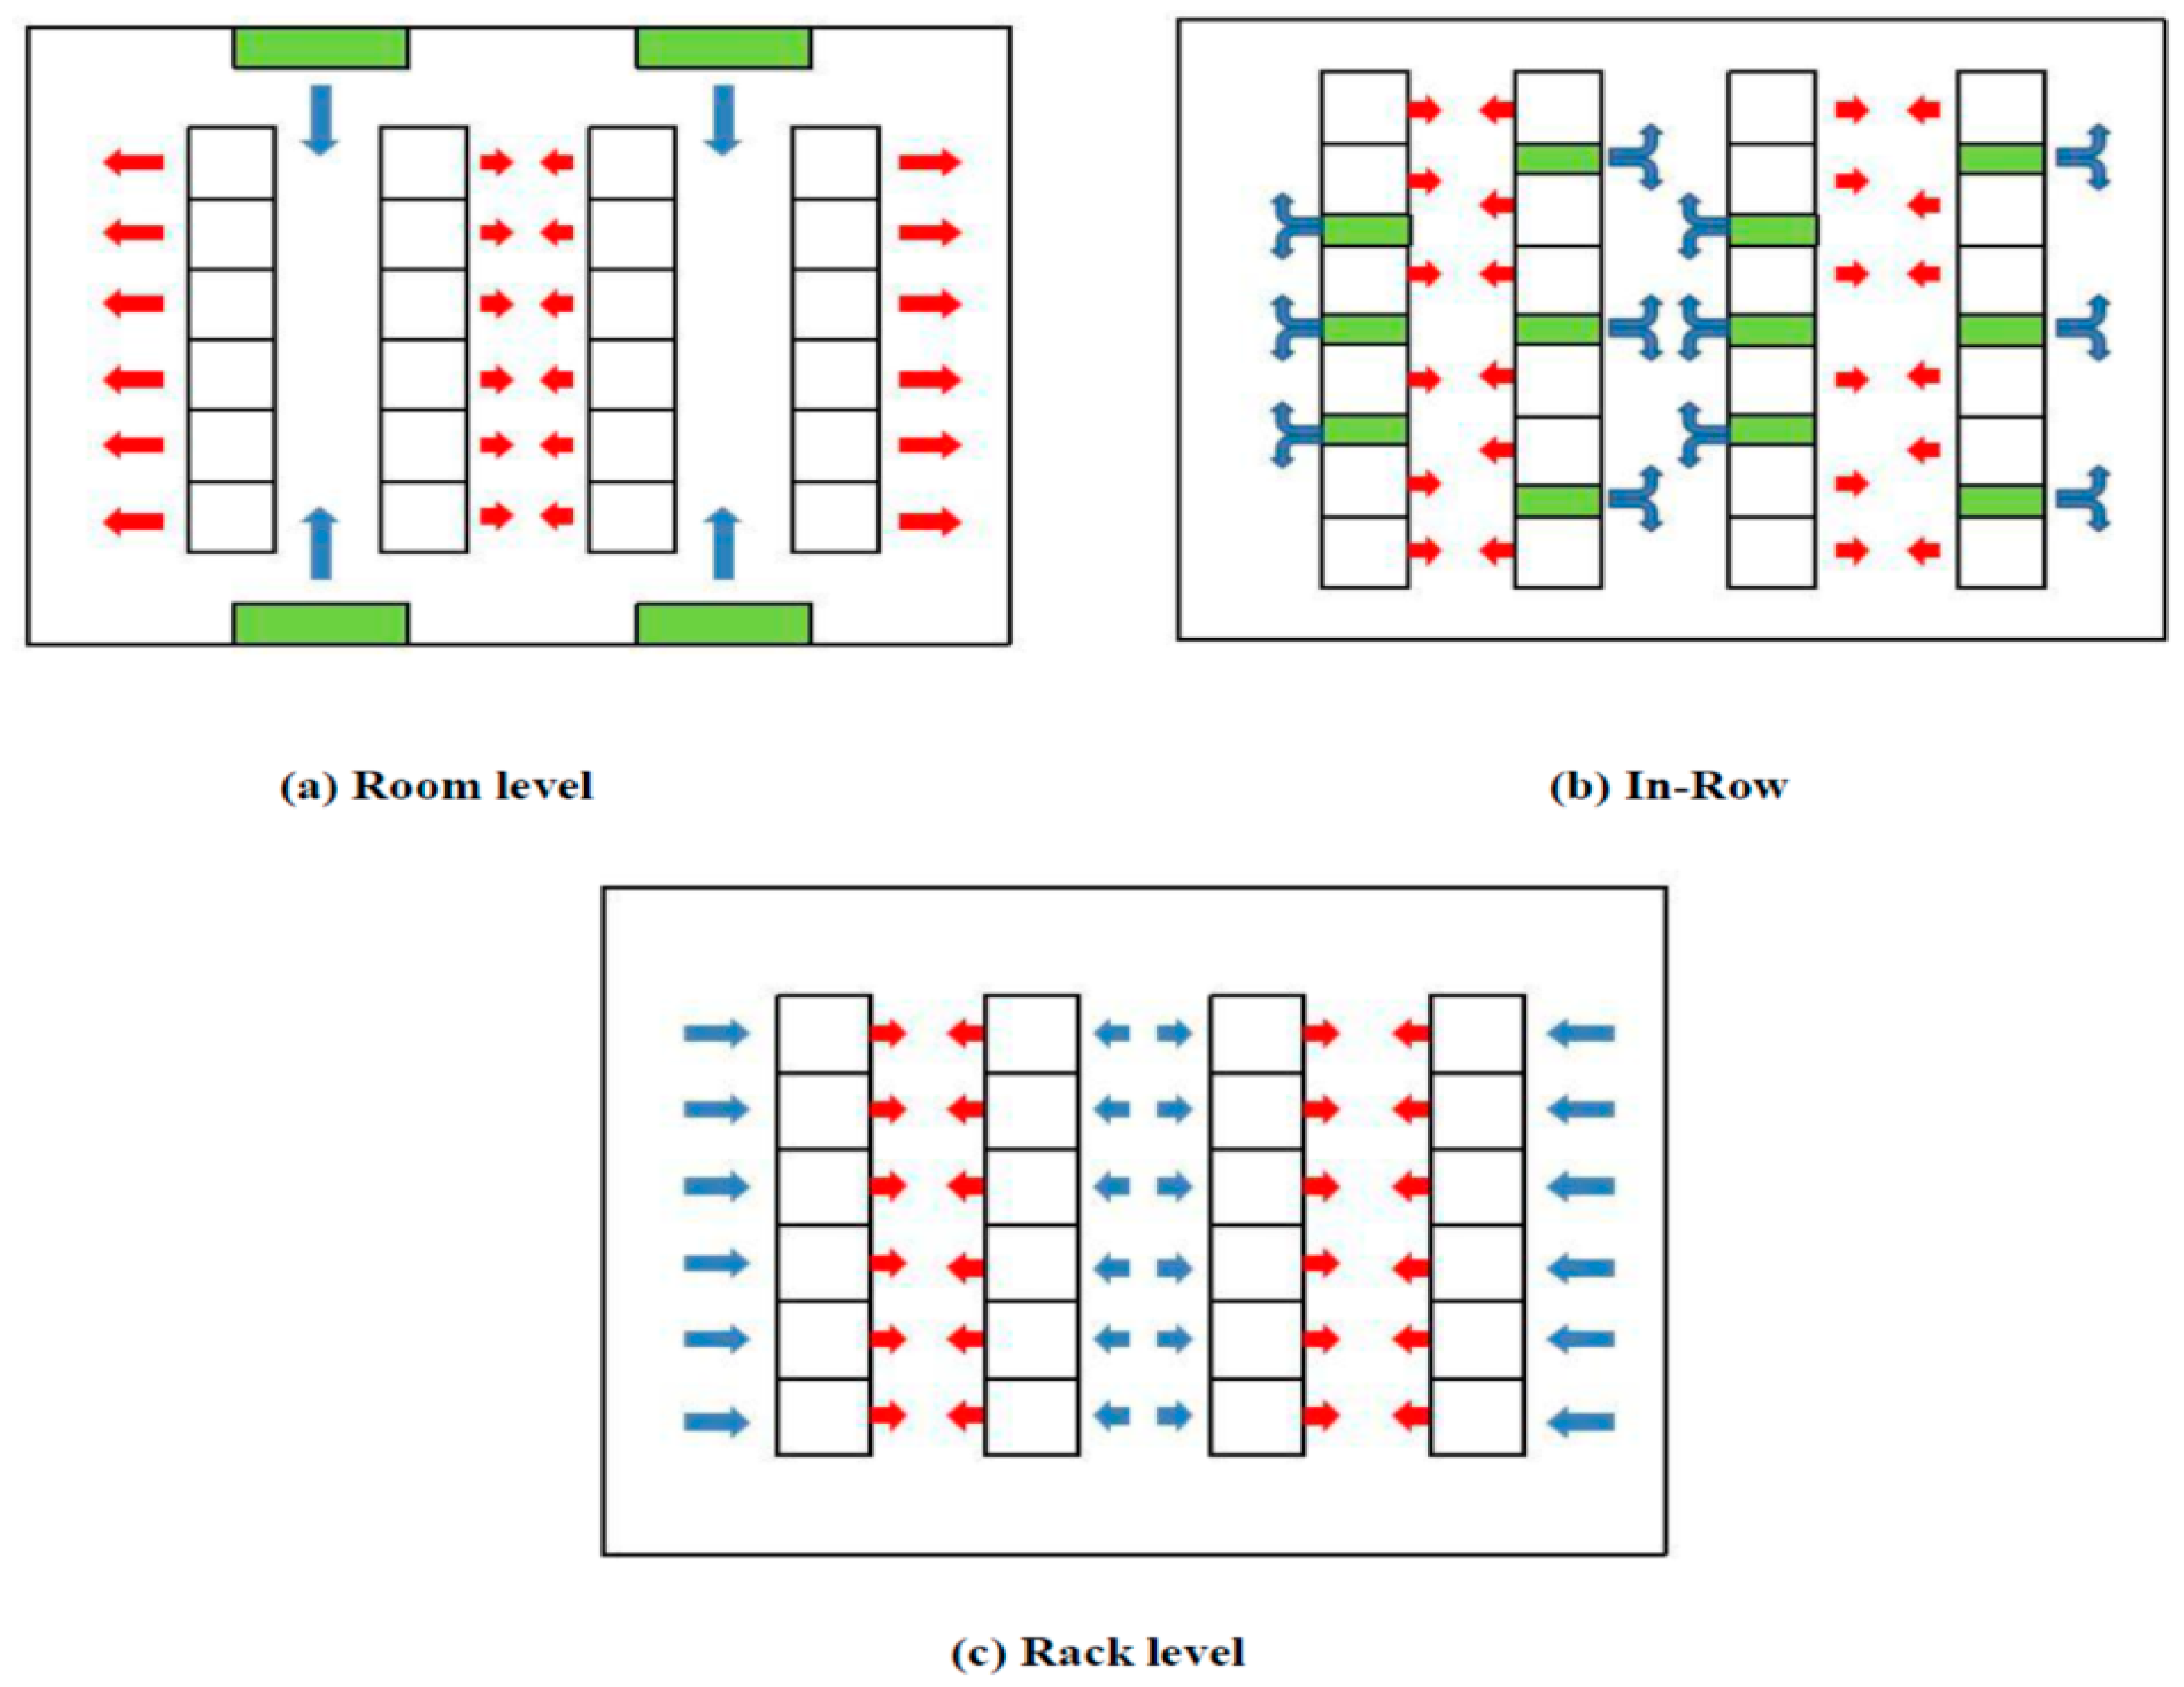
Figure 6.
IT load of different rows in three types of DCs.
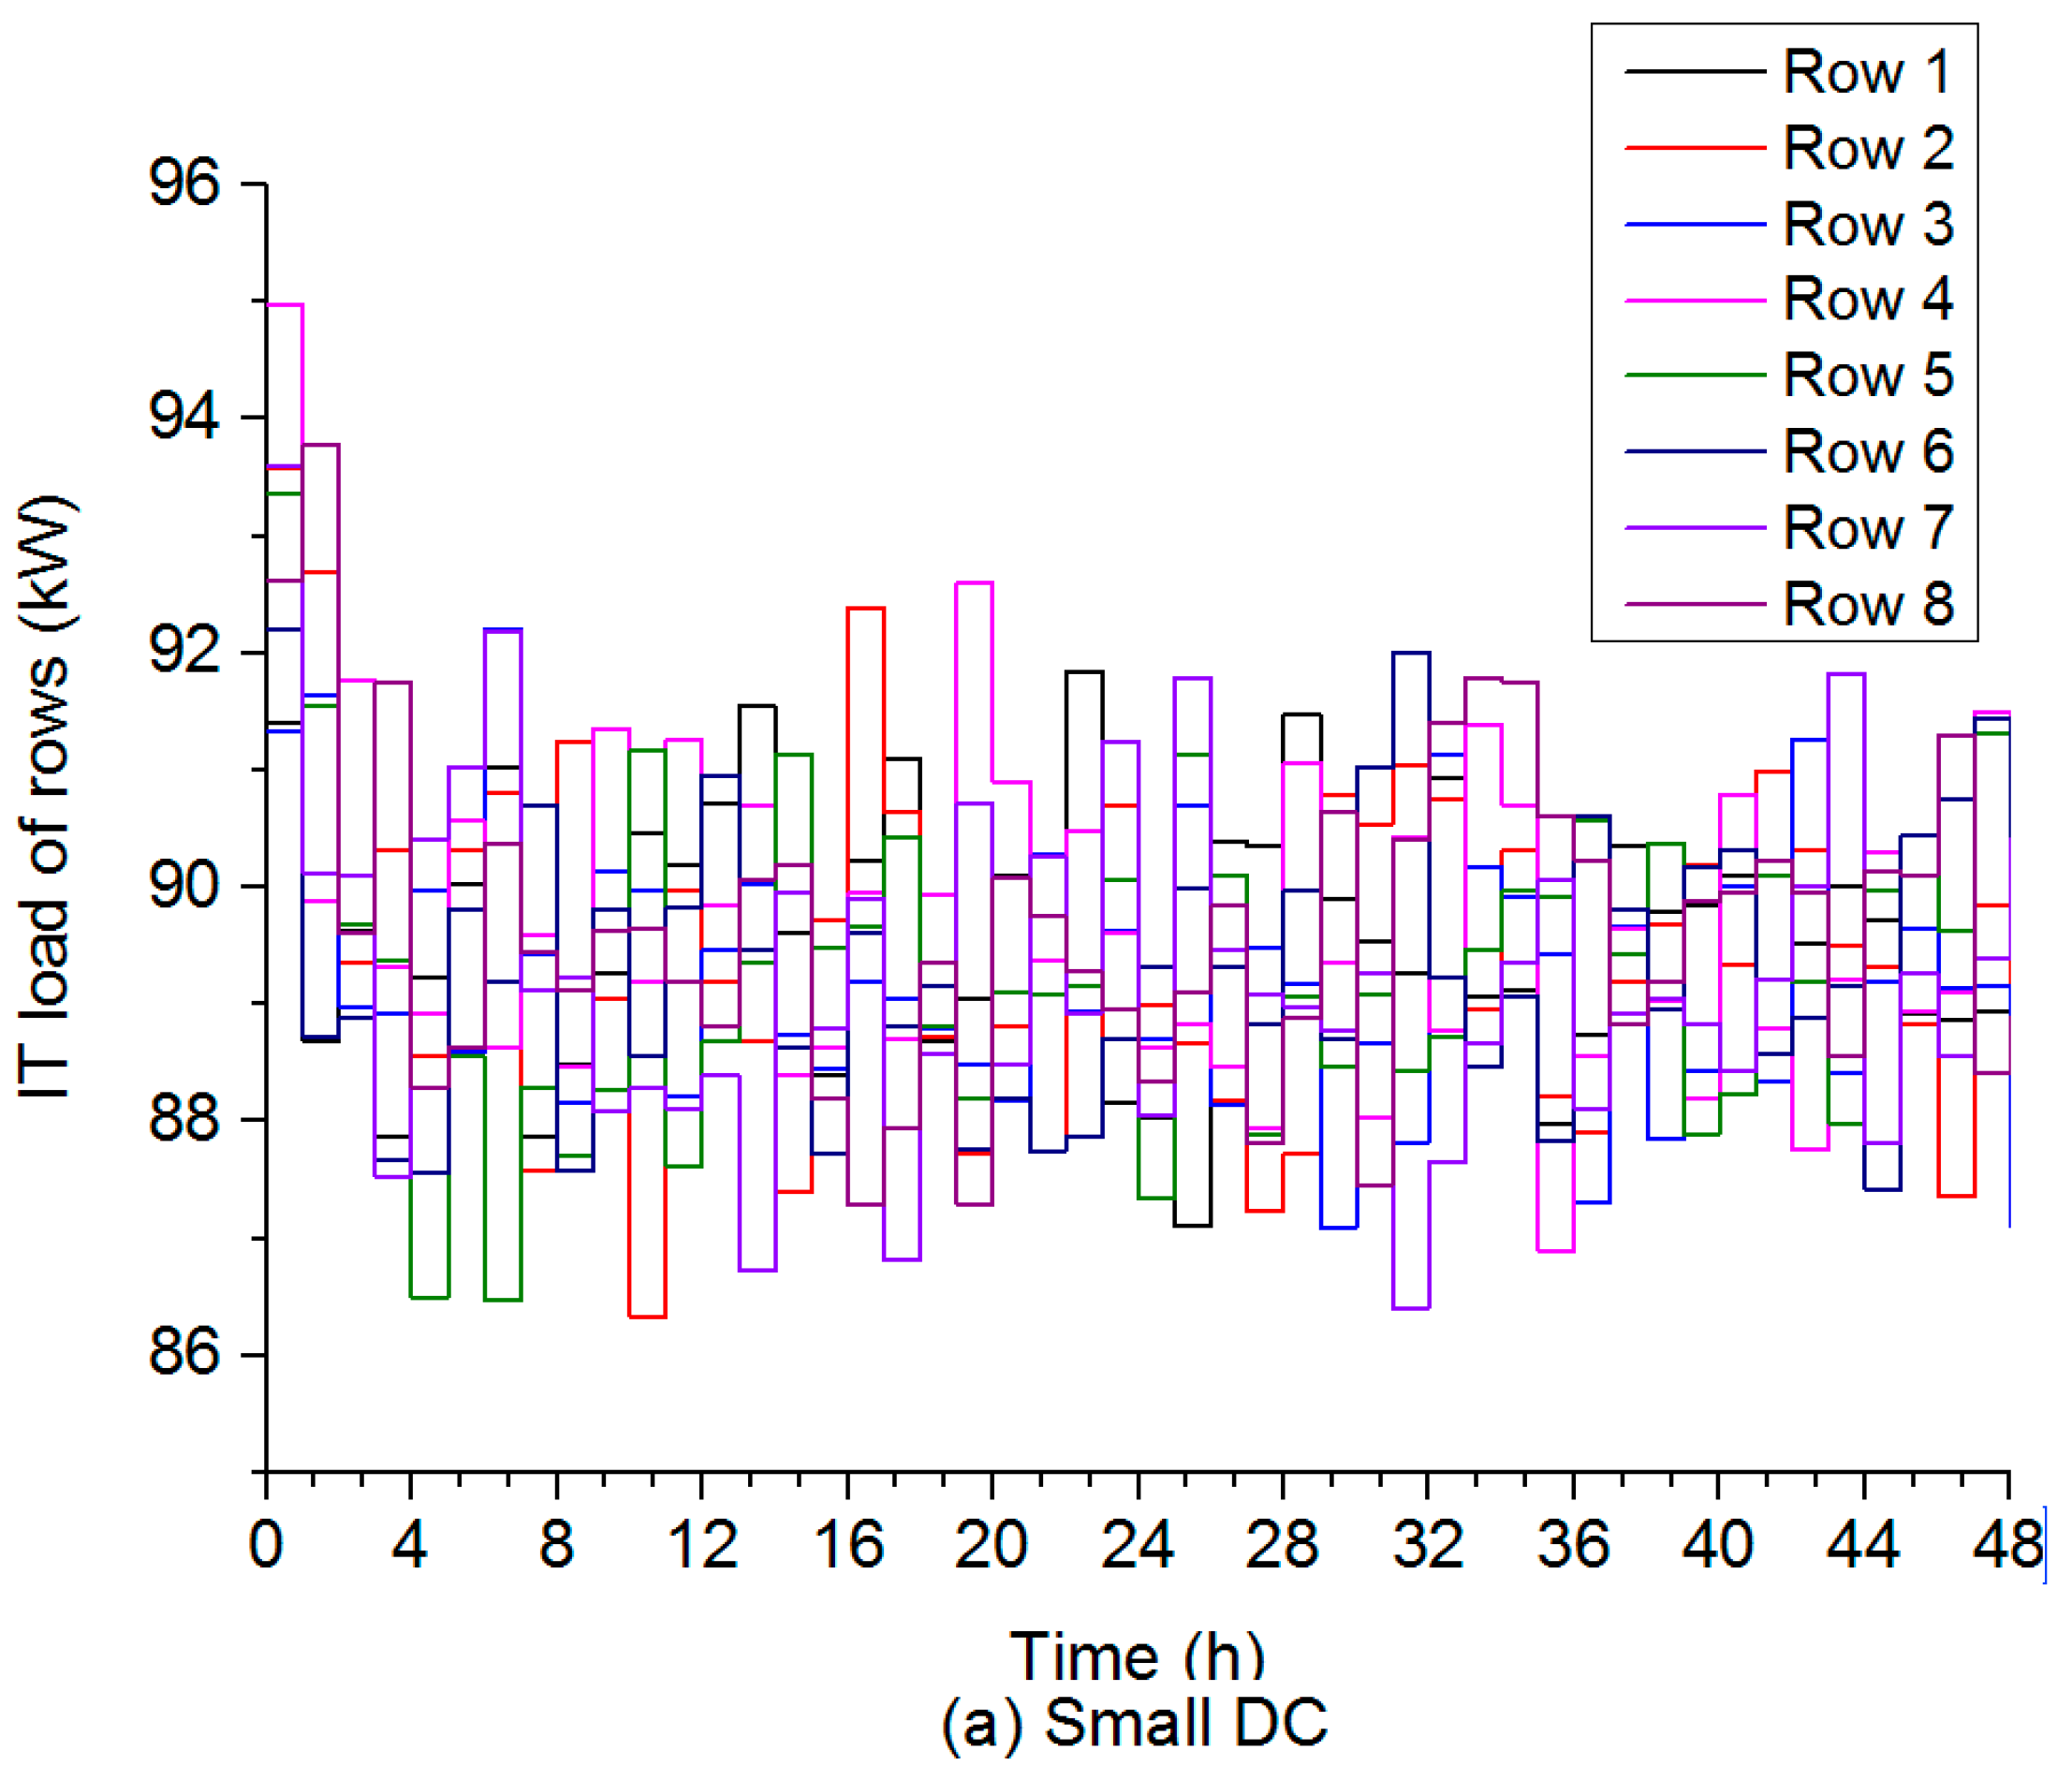
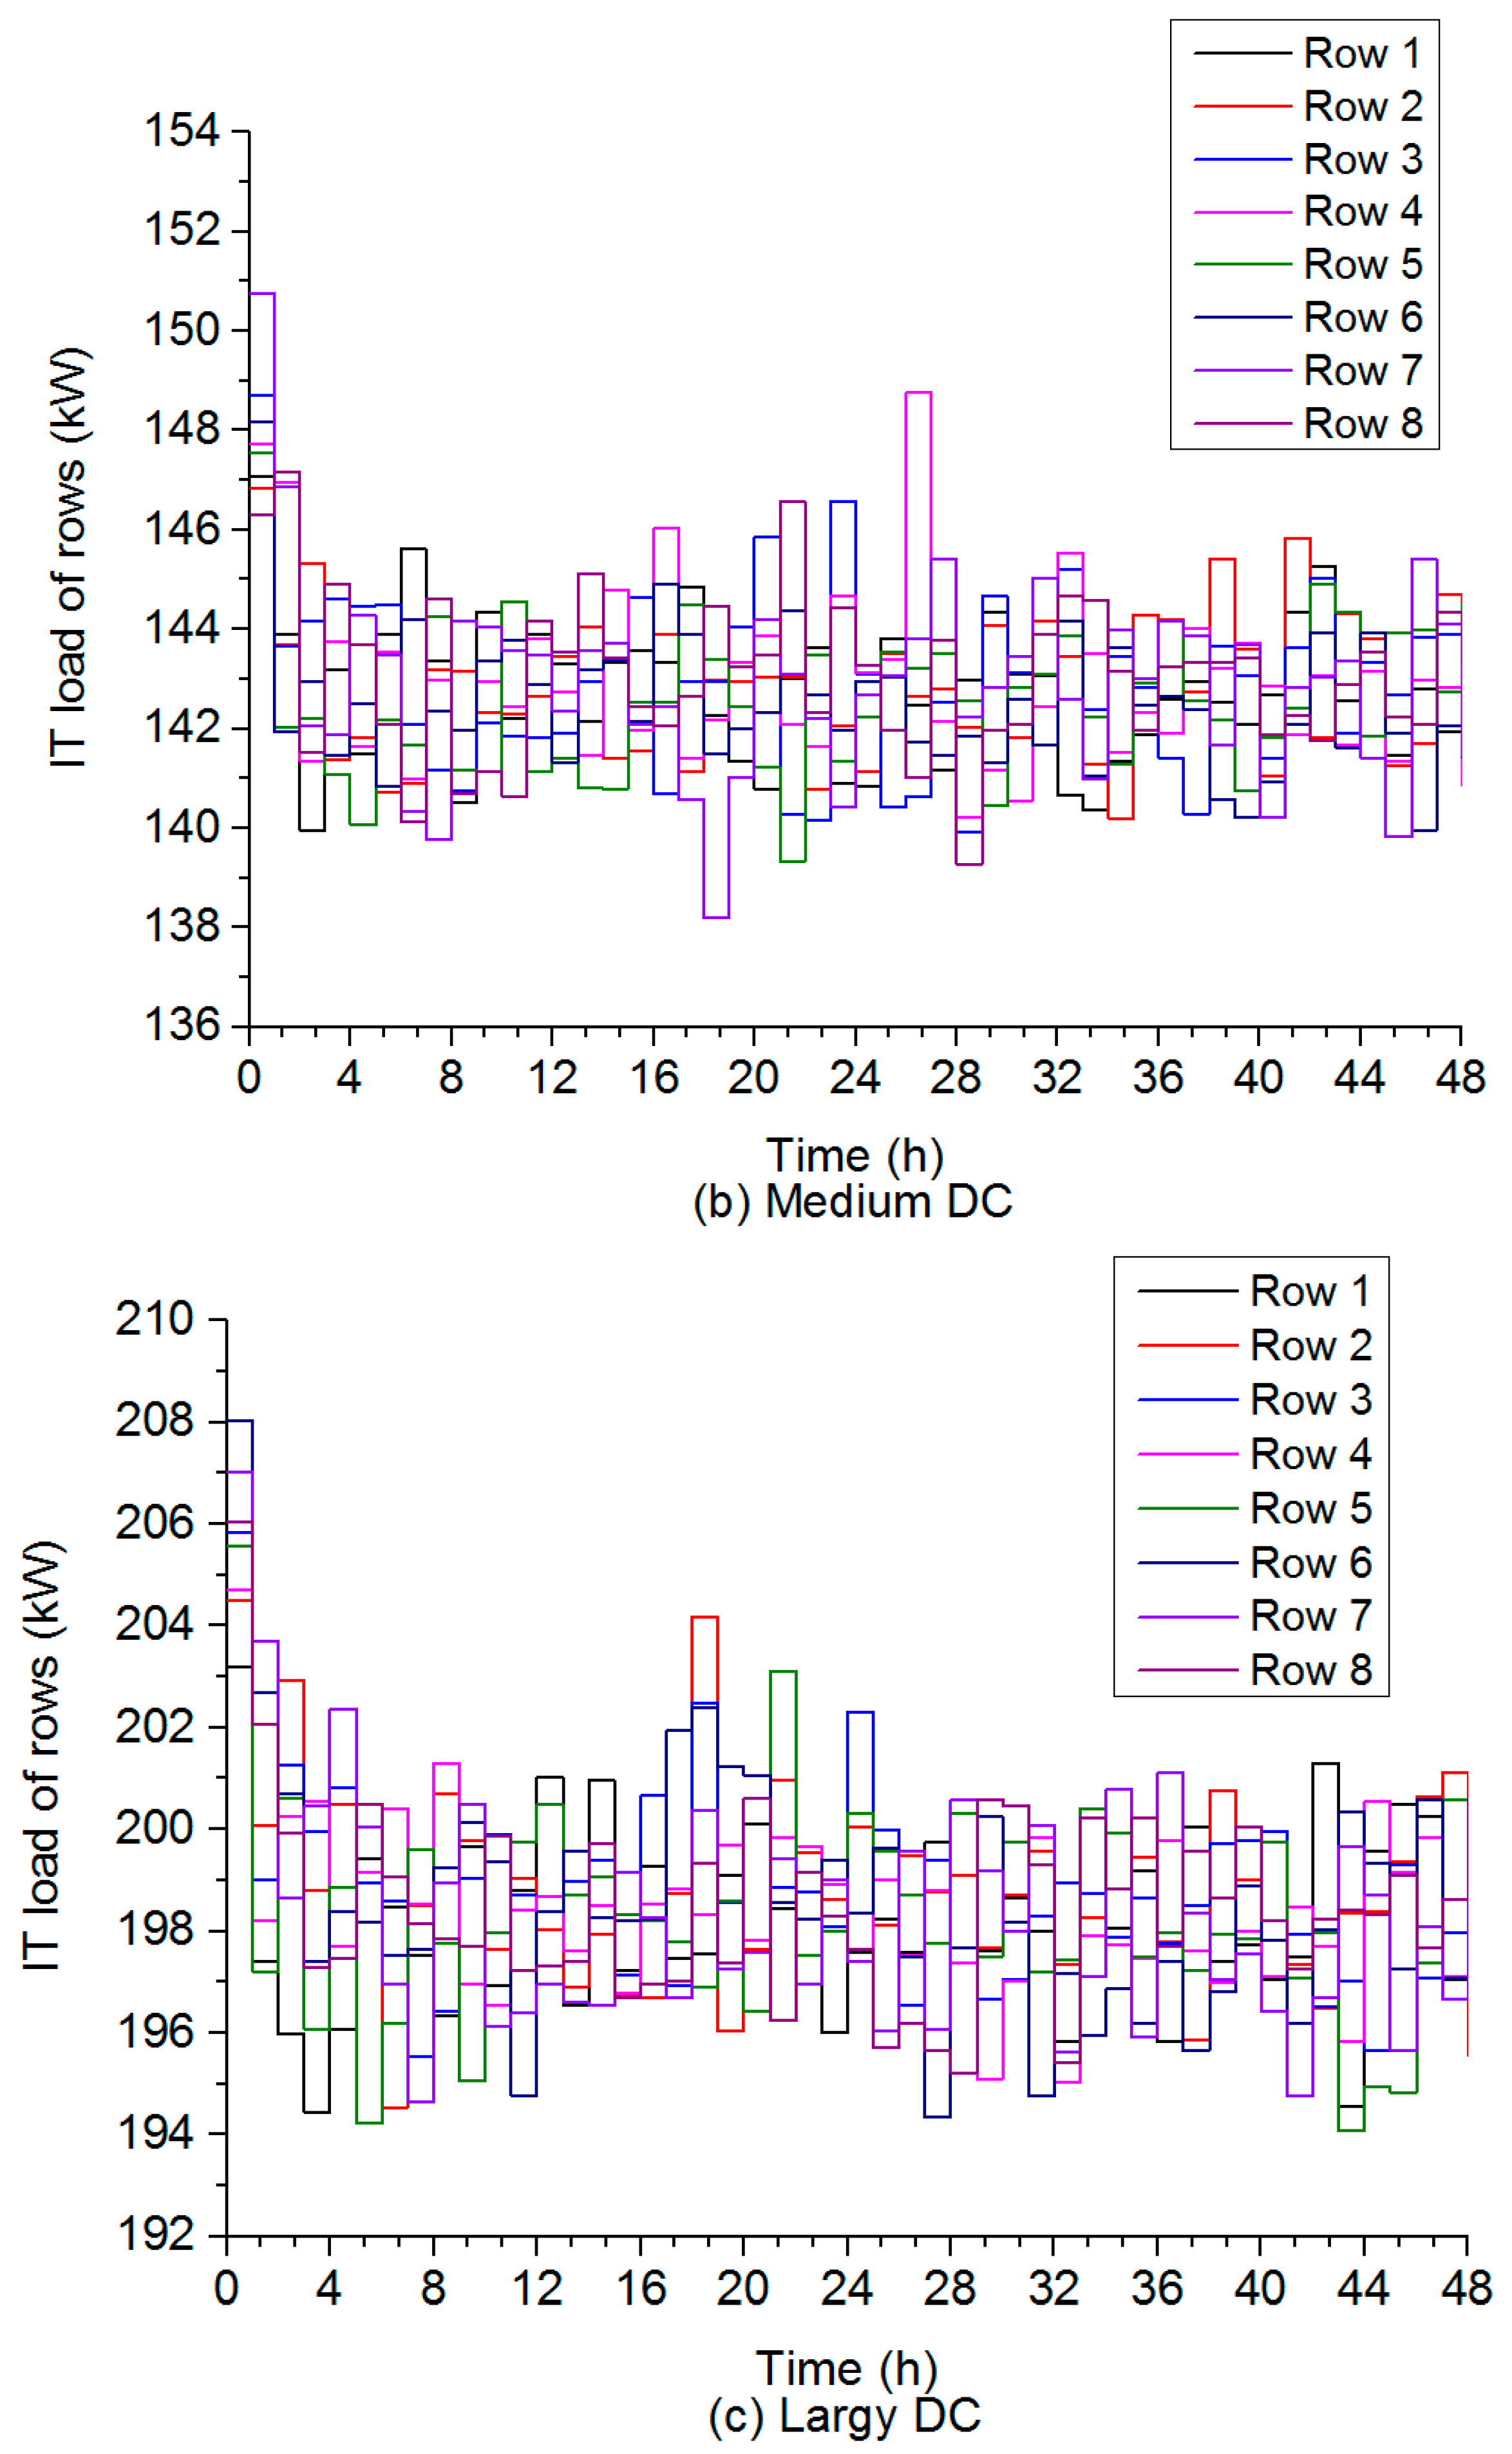
Figure 7.
Cooling demand of different scenarios in four types of DCs.


Table 1.
Comparison of the novel dew point cooling system and existing cooling systems.
| Cooling Systems | Energy Efficiency (COP) | DCs Waste Heat Applicability | Climatic Adaptability | Price | Size |
|---|---|---|---|---|---|
| Novel dew point cooling system | 19–30 (electricity based) | Yes, for air pre-treatment | Yes, with air pre-treatment | Low/Medium | Small/Medium |
| Existing evaporative & existing dew point cooling system | 15–18 (electricity based) | None | None, no air-pre-treatment was made | Low | Medium |
| Ejector cooling | 0.4–0.7 (thermal based) | Partly, need additional heating | Yes | High | Large |
| Absorption/adsorption cooling | 0.6–0.9 (thermal based) | Partly, need additional heating | Yes | High | Large |
| Mechanical vapour compression system | 2–3 (electricity based) | None | Yes | Low/Medium | Small |
Table 2.
The range of thermal environmental specifications recommended by ASHRAE.
| Dry-Bulb Range (°C) | Humidity Range Non-Condensing | Maximum Wet-Bulb (°C) | Maximum Moisture Content (g/kg) | Maximum Enthalpy(kJ/kg) |
|---|---|---|---|---|
| 18–27 | 5.5 °C DP to 60% RH and 15 °C DP | 19.1 | 10.7 | 54.6 |
Table 3.
Summer air conditioning design parameters in different climates.
| Typical City | Climate Areas | Dry Bulb Temperature (°C) | Wet Bulb Temperature (°C) | Dew Point Temperature (°C) | Humidity Ratio (g/kg) | Enthalpy (kJ/kg) |
|---|---|---|---|---|---|---|
| Singapore | Tropical rain forest climate (Af) | 33.2 | 26.4 | 24 | 19.1 | 82.4 |
| Miami | Tropical monsoon climate (Am) | 33.6 | 25.4 | 22.3 | 17.2 | 78 |
| Rio de Janeiro | Tropical wet and dry season climate (Aw) | 34.1 | 25.1 | 21.6 | 16.5 | 76.7 |
| Las Vegas | Desert climate (BWh) | 42.4 | 20.1 | 5.5 | 5.7 | 57.4 |
| Amman | Grassland climate (BSh) | 35.3 | 19.1 | 9.1 | 7.2 | 54.2 |
| Rome | Mediterranean climate (Csa) | 31 | 22.8 | 19.2 | 14.1 | 67.5 |
| Sydney | Humid subtropical climate (Cfa) | 32.8 | 19.6 | 12.1 | 8.9 | 55.9 |
| London | Maritime climate (Cfb) | 28.3 | 18.7 | 13.2 | 9.6 | 53.1 |
| Berlin | Humid continental climate (Dfb) | 29.6 | 19 | 13 | 9.4 | 54 |
| Novosibirsk | Subpolar climate (Dfc) | 29.2 | 19 | 13.2 | 9.6 | 54 |
Table 4.
Classification of DCs in terms of IT equipment load capacity.
| IT equipment Load Capacity of DCs | Classification |
|---|---|
| P ≥ 30,000 kW | Large |
| 10,000 kW < P < 30,000 kW | Medium |
| P ≤ 10,000 kW | Small |
Table 5.
IT equipment arrangements in three types of DCs.
| DC Type | Number of Rows in a DC | Number of Racks in a Row | Number of Servers in a Rack | Power Density (kW/m2) | Load Capacity (kW) |
|---|---|---|---|---|---|
| Large | 100 | 20 | 25 | 1.5 | 30,000 |
| Medium | 90 | 18 | 20 | 1 | 20,000 |
| Small | 80 | 15 | 15 | 0.5 | 10,000 |
Table 6.
Cooling capacity and size of each individual dew point cooler.
| Cooling Capacity | Dehumidification Required | Dehumidification not Required | Application |
|---|---|---|---|
| 50 kW | 1.8 m × 0.7 m × 1.7 m | 1.7 m × 1.2 m × 1.7 m | Small DC |
| 100 kW | 1.8 m × 1.4 m × 1.7 m | 2.4 m × 1.7 m × 1.7 m | Medium DC |
| 150 kW | 2.4 m × 1.4 m × 1.7 m | 2.5 m × 2.4 m × 1.7 m | Large DC |
Table 7.
Total heat emitting and recoverable heat.
| DC Type | Power Capacity (kW) | Recoverable Heat (kW) |
|---|---|---|
| Large | 30,000 | 12,000 |
| Medium | 20,000 | 8000 |
| Small | 10,000 | 4000 |
Table 8.
Assumed product air and indoor parameter.
| Product Air | Return Air | ||
|---|---|---|---|
| Temperature, °C | Humidity ratio, g/kg | Temperature, °C | Humidity ratio, g/kg |
| 27 | 10.7 | 35 | 10.7 |
Table 9.
COPs of the dew point cooler in 10 typical cities.
| City | Singapore (Af) | Miami (Am) | Rio de Janeiro (Aw) | Las Vegas (BWh) | Amman (BSh) | Rome (Csa) | Sydney (Cfa) | London (Cfb) | Berlin (Dfb) | Novosibirsk (Dfc) |
|---|---|---|---|---|---|---|---|---|---|---|
| COP | 25 | 25 | 25 | 28 | 26 | 24 | 22 | 19 | 19 | 19 |
Table 10.
Air state parameters in 4 humid climates.
| City | Parameter Dry Bulb Temperature (°C), Humidity Ratio(g/kg), Enthalpy (kJ/kg) | |||
|---|---|---|---|---|
| Outdoor Air | Indoor Air | Mixed Air | Supply Air | |
| Singapore (Af) | 33.2, 19.1, 82.4 | 35, 10.7, 62.8 | 34.1, 14.9, 72.6 | 27, 10.7, 54.5 |
| Miami (Am) | 33.6, 17.2, 78 | 35, 10.7, 62.8 | 34.3, 14, 70.4 | 27, 10.7, 54.5 |
| Rio de Janeiro (Aw) | 34.1, 16.5, 76.7 | 35, 10.7, 62.8 | 34.5, 13.6, 69.8 | 27, 10.7, 54.5 |
| Rome (Csa) | 31, 14.1, 67.5 | 35, 10.7, 62.8 | 33.6, 11.9, 64.4 | 27, 10.7, 54.5 |
Table 11.
Power consumption of dehumidification.
| City | Cooling Load (kW) | Regenerative Air Mass Flow (kg/s) | Regenerative Heat (kW) | Power Consumption (kWh) |
|---|---|---|---|---|
| Singapore | 50 | 1.95 | 59.51 | 3.6 |
| 100 | 3.89 | 119.03 | 9 | |
| 150 | 5.84 | 178.54 | 18 | |
| Miami | 50 | 1.52 | 46.17 | 2.81 |
| 100 | 3.03 | 92.33 | 7.02 | |
| 150 | 4.55 | 138.50 | 14.04 | |
| Rio de Janeiro | 50 | 1.36 | 41.72 | 2.52 |
| 100 | 2.73 | 83.43 | 6.3 | |
| 150 | 4.09 | 125.15 | 12.6 | |
| Rome | 50 | 0.56 | 17.24 | 1.04 |
| 100 | 1.13 | 34.48 | 2.61 | |
| 150 | 1.69 | 51.73 | 5.22 |
Table 12.
Total cooling demand of different scenarios in three types of DCs in 48 h.
| Cooling Demand | Small DC | Medium DC | Large DC |
|---|---|---|---|
| Reference case (MW·h) | 480 | 960 | 1440 |
| Scenario 2/reference case | 97.6% | 98.5% | 98.7% |
| Scenario 3/reference case | 95.9% | 97.7% | 98.4% |
| Scenario 4/reference case | 95.0% | 97.2% | 98.0% |
Table 13.
Annual electricity consumption of the novel dew point cooler in the 10 climate areas.
| Typical City | Climate Area | Annual Electricity Consumption (MWh) | Electricity Saving Compared to Traditional One (%) | ||
|---|---|---|---|---|---|
| Small DC | Medium DC | Large DC | |||
| Singapore | Af | 3247 | 6644 | 10,048 | 90.6% |
| Miami | Am | 3247 | 6644 | 10,048 | 90.6% |
| Rio de Janeiro | Aw | 3247 | 6644 | 10,048 | 90.6% |
| Las Vegas | BWh | 2899 | 5932 | 8971 | 91.6% |
| Amman | BSh | 3122 | 6388 | 9661 | 91.0% |
| Rome | Csa | 3382 | 6921 | 10,466 | 90.2% |
| Sydney | Cfa | 3689 | 7550 | 11,418 | 89.4% |
| London | Cfb | 4272 | 8742 | 13,221 | 87.7% |
| Berlin | Dfb | 4272 | 8742 | 13,221 | 87.7% |
| Novosibirsk | Dfc | 4272 | 8742 | 13,221 | 87.7% |
© 2017 by the authors. Licensee MDPI, Basel, Switzerland. This article is an open access article distributed under the terms and conditions of the Creative Commons Attribution (CC BY) license (http://creativecommons.org/licenses/by/4.0/).
Share and Cite
MDPI and ACS Style
Bi, Y.; Wang, Y.; Ma, X.; Zhao, X. Investigation on the Energy Saving Potential of Using a Novel Dew Point Cooling System in Data Centres. Energies 2017, 10, 1732. https://doi.org/10.3390/en10111732
AMA Style
Bi Y, Wang Y, Ma X, Zhao X. Investigation on the Energy Saving Potential of Using a Novel Dew Point Cooling System in Data Centres. Energies. 2017; 10(11):1732. https://doi.org/10.3390/en10111732
Chicago/Turabian StyleBi, Yin, Yugang Wang, Xiaoli Ma, and Xudong Zhao. 2017. "Investigation on the Energy Saving Potential of Using a Novel Dew Point Cooling System in Data Centres" Energies 10, no. 11: 1732. https://doi.org/10.3390/en10111732
Note that from the first issue of 2016, this journal uses article numbers instead of page numbers. See further details here.