Supercritical Water Gasification of Biomass in a Ceramic Reactor: Long-Time Batch Experiments


1
Department of Civil, Environmental and Mechanical Engineering, University of Trento, via Mesiano 77, 38123 Trento, Italy
2
Department of Energy Technology, Aalborg University, Pontoppidanstræde 111, 9220 Aalborg Øst, Denmark
3
Institute of Catalysis Research and Technology (IKFT), Karlsruhe Institute of Technology, Hermann-von-Helmholtz-Platz 1, 76344 Eggenstein-Leopoldshafen, Germany
4
Institute of Agricultural Engineering, Conversion Technology and LCA of Renewable Resources, University of Hohenheim, Gerbenstrasse 9, 70593 Stuttgart, Germany
*
Author to whom correspondence should be addressed.
Energies 2017, 10(11), 1734; https://doi.org/10.3390/en10111734
Submission received: 29 September 2017
/
Revised: 23 October 2017
/
Accepted: 26 October 2017
/
Published: 30 October 2017
(This article belongs to the Collection Bioenergy and Biofuel)
Abstract
:Supercritical water gasification (SCWG) is an emerging technology for the valorization of (wet) biomass into a valuable fuel gas composed of hydrogen and/or methane. The harsh temperature and pressure conditions involved in SCWG (T > 375 °C, p > 22 MPa) are definitely a challenge for the manufacturing of the reactors. Metal surfaces are indeed subject to corrosion under hydrothermal conditions, and expensive special alloys are needed to overcome such drawbacks. A ceramic reactor could be a potential solution to this issue. Finding a suitable material is, however, complex because the catalytic effect of the material can influence the gas yield and composition. In this work, a research reactor featuring an internal alumina inlay was utilized to conduct long-time (16 h) batch tests with real biomasses and model compounds. The same experiments were also conducted in batch reactors made of stainless steel and Inconel 625. The results show that the three devices have similar performance patterns in terms of gas production, although in the ceramic reactor higher yields of C2+ hydrocarbons were obtained. The SEM observation of the reacted alumina surface revealed a good resistance of such material to supercritical conditions, even though some intergranular corrosion was observed.
1. Introduction
Today, producing renewable energy is one of the most important challenges for engineering and science. On the one hand, solar and wind energy have acquired a prominent role in the clean and sustainable production of electric power. On the other, biomass is the sole source of renewable carbon, which can be thus utilized for the production of sustainable materials and fuels. The utilization of biomass in the production of fuels can be an excellent way to valorize it [1]. Common thermochemical technologies for biomass energy conversion (pyrolysis, gasification and combustion) are usually limited to dry biomass. This is a strong limitation, since a large amount of low-value biomass presents a considerable water content, sometimes higher than 70%. This is the case, for example, with sewage sludge, the organic fraction of municipal solid waste, and many byproducts from agro-industrial industries.
Supercritical water gasification (SCWG) is a process aimed at the production of renewable fuel gas, especially from wet feedstock [2]. SCWG is a hydrothermal process, i.e., involving the reaction of biomass in hot compressed water above its critical point (374.1 °C, 22.1 MPa). The reasons for operating at high temperatures and pressures may be found in the unique properties of supercritical water, which is able to dissolve non-polar compounds and promote the production of H2 and/or CH4, depending on the selected reaction conditions [3,4]. Water is thus part of the process itself, as it simultaneously represents a solvent, a catalyst, and a reactant, providing an inexpensive source of hydrogen [5]. Several studies have been conducted in the literature concerning SCWG, making use of substrates ranging from wood to low-grade wet by-products [6]. An extensive, up to date review can be found in [7].
Hydrothermal processing involves quite harsh conditions, resulting in the corrosion of the metallic surfaces of the reactors. The high temperature and pressure imply the adoption of costly Ni-based alloys such as Inconel 625 [8], which would considerably increase the investment costs for the process. In particular, if the Ni-alloys applied show corrosion and have a low operating life, this results in unacceptable costs. A solution could be represented by the adoption of ceramic materials, which could have excellent thermal and chemical resistance, even under harsh conditions. Aluminum oxide, also known as alumina (Al2O3), is a widely used technical ceramic, which can withstand extreme conditions. Alumina can be utilized under supercritical water oxidation conditions, which are extremely demanding in terms of corrosion. Boukis and co-workers showed that alumina and alumina-based reactors could be successfully employed under supercritical water conditions. In particular, those reactors showed very limited corrosion after more than 200 h at 465 °C [9,10]. An extensive study on the utilization of ceramics for SCWG was carried out by Richard et al. [11]. They tested a number of different materials during the gasification of concentrated vinasse, under both subcritical and supercritical conditions. Although they found corrosion of Al2O3 at subcritical conditions, generally good stability was shown at supercritical conditions. Al2O3 could thus be considered as a possible candidate in the manufacturing of SCWG materials.
The aforementioned studies focused on the stability of materials intended for reactor design and did not report the results of SCWG tests, in terms of product yields and gas composition. Nevertheless, the reactor material can be crucial to determining the reaction products. The catalytic activity of reactor materials has been documented in the literature [12,13,14]. In a previous study by our group [15], we showed that the catalytic activity of the reactor walls is important even after numerous reaction cycles and even for long-time testing at residence times in the order of 5 h. Additionally, we also showed that the different feeds are subject to the catalytic effects of reactor walls in different ways. The presence of alumina in the reaction environment could influence the reaction products, as its surface obviously does not present metallic active sites, which are important in the C–C bond cleavage [16]. Moreover, it has been documented that the weak acid sites on alumina surfaces are able to promote the cleavage of C–O bonds through dehydration [17].
In the present paper, four biomasses and bio-based products (beech sawdust, municipal solid waste, hydrothermal char, and malt spent grains), as well as two model compounds (glucose and a glucose/phenol mixture), were gasified under supercritical conditions at 400 °C for 16 h. The different biomasses were chosen in order to represent different classes of feeds, both lignocellulosic and non-lignocellulosic. A novel concept of a research autoclave reactor was utilized, which consisted of a stainless steel volume containing an inner alumina inlay. Since the inlay was subjected to the same inner and external pressure, it could overcome the poor mechanical resistance of ceramic materials under these conditions. Further details on the experimental device are provided in Section 3. The experiments were also conducted in two other different small autoclaves, made of stainless steel and Inconel 625, respectively. The selected long-time testing could simultaneously provide sufficient time to test the corrosion and enable the avoidance of transient effects due to the different geometries and construction materials. The yields of the different reaction products were determined, as well as the syngas compositions. The ceramic inlay was also observed before and after the reaction by means of scanning electron microscopy (SEM, DSM 982 Gemini, Carl Zeiss Ltd., Jena, Germany). The surface composition was determined by means of electron dispersion X-ray spectroscopy (EDXS, LINK ISIS 300, Oxford Inst., Oxon, UK).
Alumina turned out to be quite effective as a reactor material, with little effects on the yields and with generally good resistance to the reaction environment.
2. Results and Discussion
This section first focuses on analytical data concerning the feedstock tested. Subsequently, the yields of gaseous, liquid, and solid products are shown. The composition of the produced gas, as well as the yields of the single gaseous species, are also presented and compared with thermodynamic equilibrium predictions, while the energy recovery of the process is quantified. Some considerations are also made on the liquid products, with an analysis of the total organic carbon (TOC). Finally, SEM observations of the alumina reactor surface before and after the reaction are shown.
2.1. Elemental Analysis and Higher Heating Value of the Feedstock
Table 1 shows the elemental composition (dry basis) of the feedstock used in this study. Hydrothermal char is characterized by a carbon content much higher than the other substrates, clearly due to the carbonization pretreatment. This is reflected in the higher heating value (HHV), which, for hydrothermal char, is as high as 30 MJ/kg. Real un-treated biomasses present similar HHVs, in the range of 17.3–20.7 MJ/kg, while the HHVs of model compounds are lower due to their higher oxygenation degree.
2.2. Gas, Liquid and Solid Yields
Table 2 shows the yields of gaseous, solid, and liquid products obtained from the SCWG experiments, expressed on a dry biomass base. The yields of the liquids were calculated by difference, assuming that water, at the considered reaction conditions, is a net reaction product, as was observed in [15]. Indeed, if water was globally converted into other products at the considered reaction conditions, the overall mass balance, expressed on a dry biomass base, would be closed at values higher than 100%.
It is possible to observe that the experiments with biomasses showed comparable yields of gases, between 27.6% and 35%, as also found in similar works [15,18]. The highest production of gases occurred for beech sawdust and municipal waste, while hydrothermal char and malt spent grains provided slightly lower yields. This could be, to some extent, expected for hydrothermal char, which has a higher nonvolatile content that is difficult to convert into gases [18]. For malt spent grains, such lower yields could be related to the significant protein content of this substrate. Interestingly, malt spent grains show the highest liquid yields among the considered real biomasses, testifying a good tendency to liquefaction. However, the conversion of such liquid products to gases is limited by nitrogen-containing compounds. Nitrogen-rich compounds are indeed quite resistant to gasification and tend to give products in the aqueous phase [19]. Moreover, proteins also have an inhibitory effect towards the gasification of carbohydrates [20,21].
The results obtained for real biomasses could also be put into relation with those of the model compounds, i.e., glucose and glucose/phenol mixture. Glucose has been extensively utilized as a model compound for cellulose [22,23,24,25,26], while phenol can be considered a model compound for lignin [19,27,28,29]. Hence, the glucose/phenol mixture adopted in this work can be assumed to be representative of a lignocellulosic biomass [30]. It can be noticed that gas yields from the SCWG of glucose are basically comparable to those of the real biomasses, with values around 30%. Conversely, the amount of gas produced from the glucose/phenol mixture is considerably lower compared to both pure glucose and real biomasses. Correspondingly, glucose/phenol shows a remarkably lower production of compounds in the solid phase and, consequently, very high yields of compounds in the liquid phase. These results are clearly indicative of the refractory behavior of phenol [31], which proves to be very stable in the liquid phase at the considered reaction conditions [30].
From the point of view of the different reactors, no significant differences are shown. Hence, the inner material of the reactor does not play an appreciable role in determining the distribution of the different reaction product phases. This is confirmed by the results of an analysis of variance (ANOVA) test with a significance level of α = 0.05. When the data are grouped per biomass feedstock (hence, the variance associated with the reactor materials is concerned), p-values as low as 6.1 × 10⁻⁷, 2.7 × 10⁻⁵, 2.7 × 10⁻⁵ are obtained for the yields of gas, solids, and liquids, respectively. Since each of these values is much lower than α, the differences among reactor materials are not statistically significant. On the contrary, when grouping the data per reactor material (thus considering the variance due to the feedstock), the p-values much higher than α are obtained (0.38 for gas, 0.37 for solids, 0.63 for liquids), highlighting a significant difference among the considered substrates.
2.3. Gas Composition and Equilibrium Yields
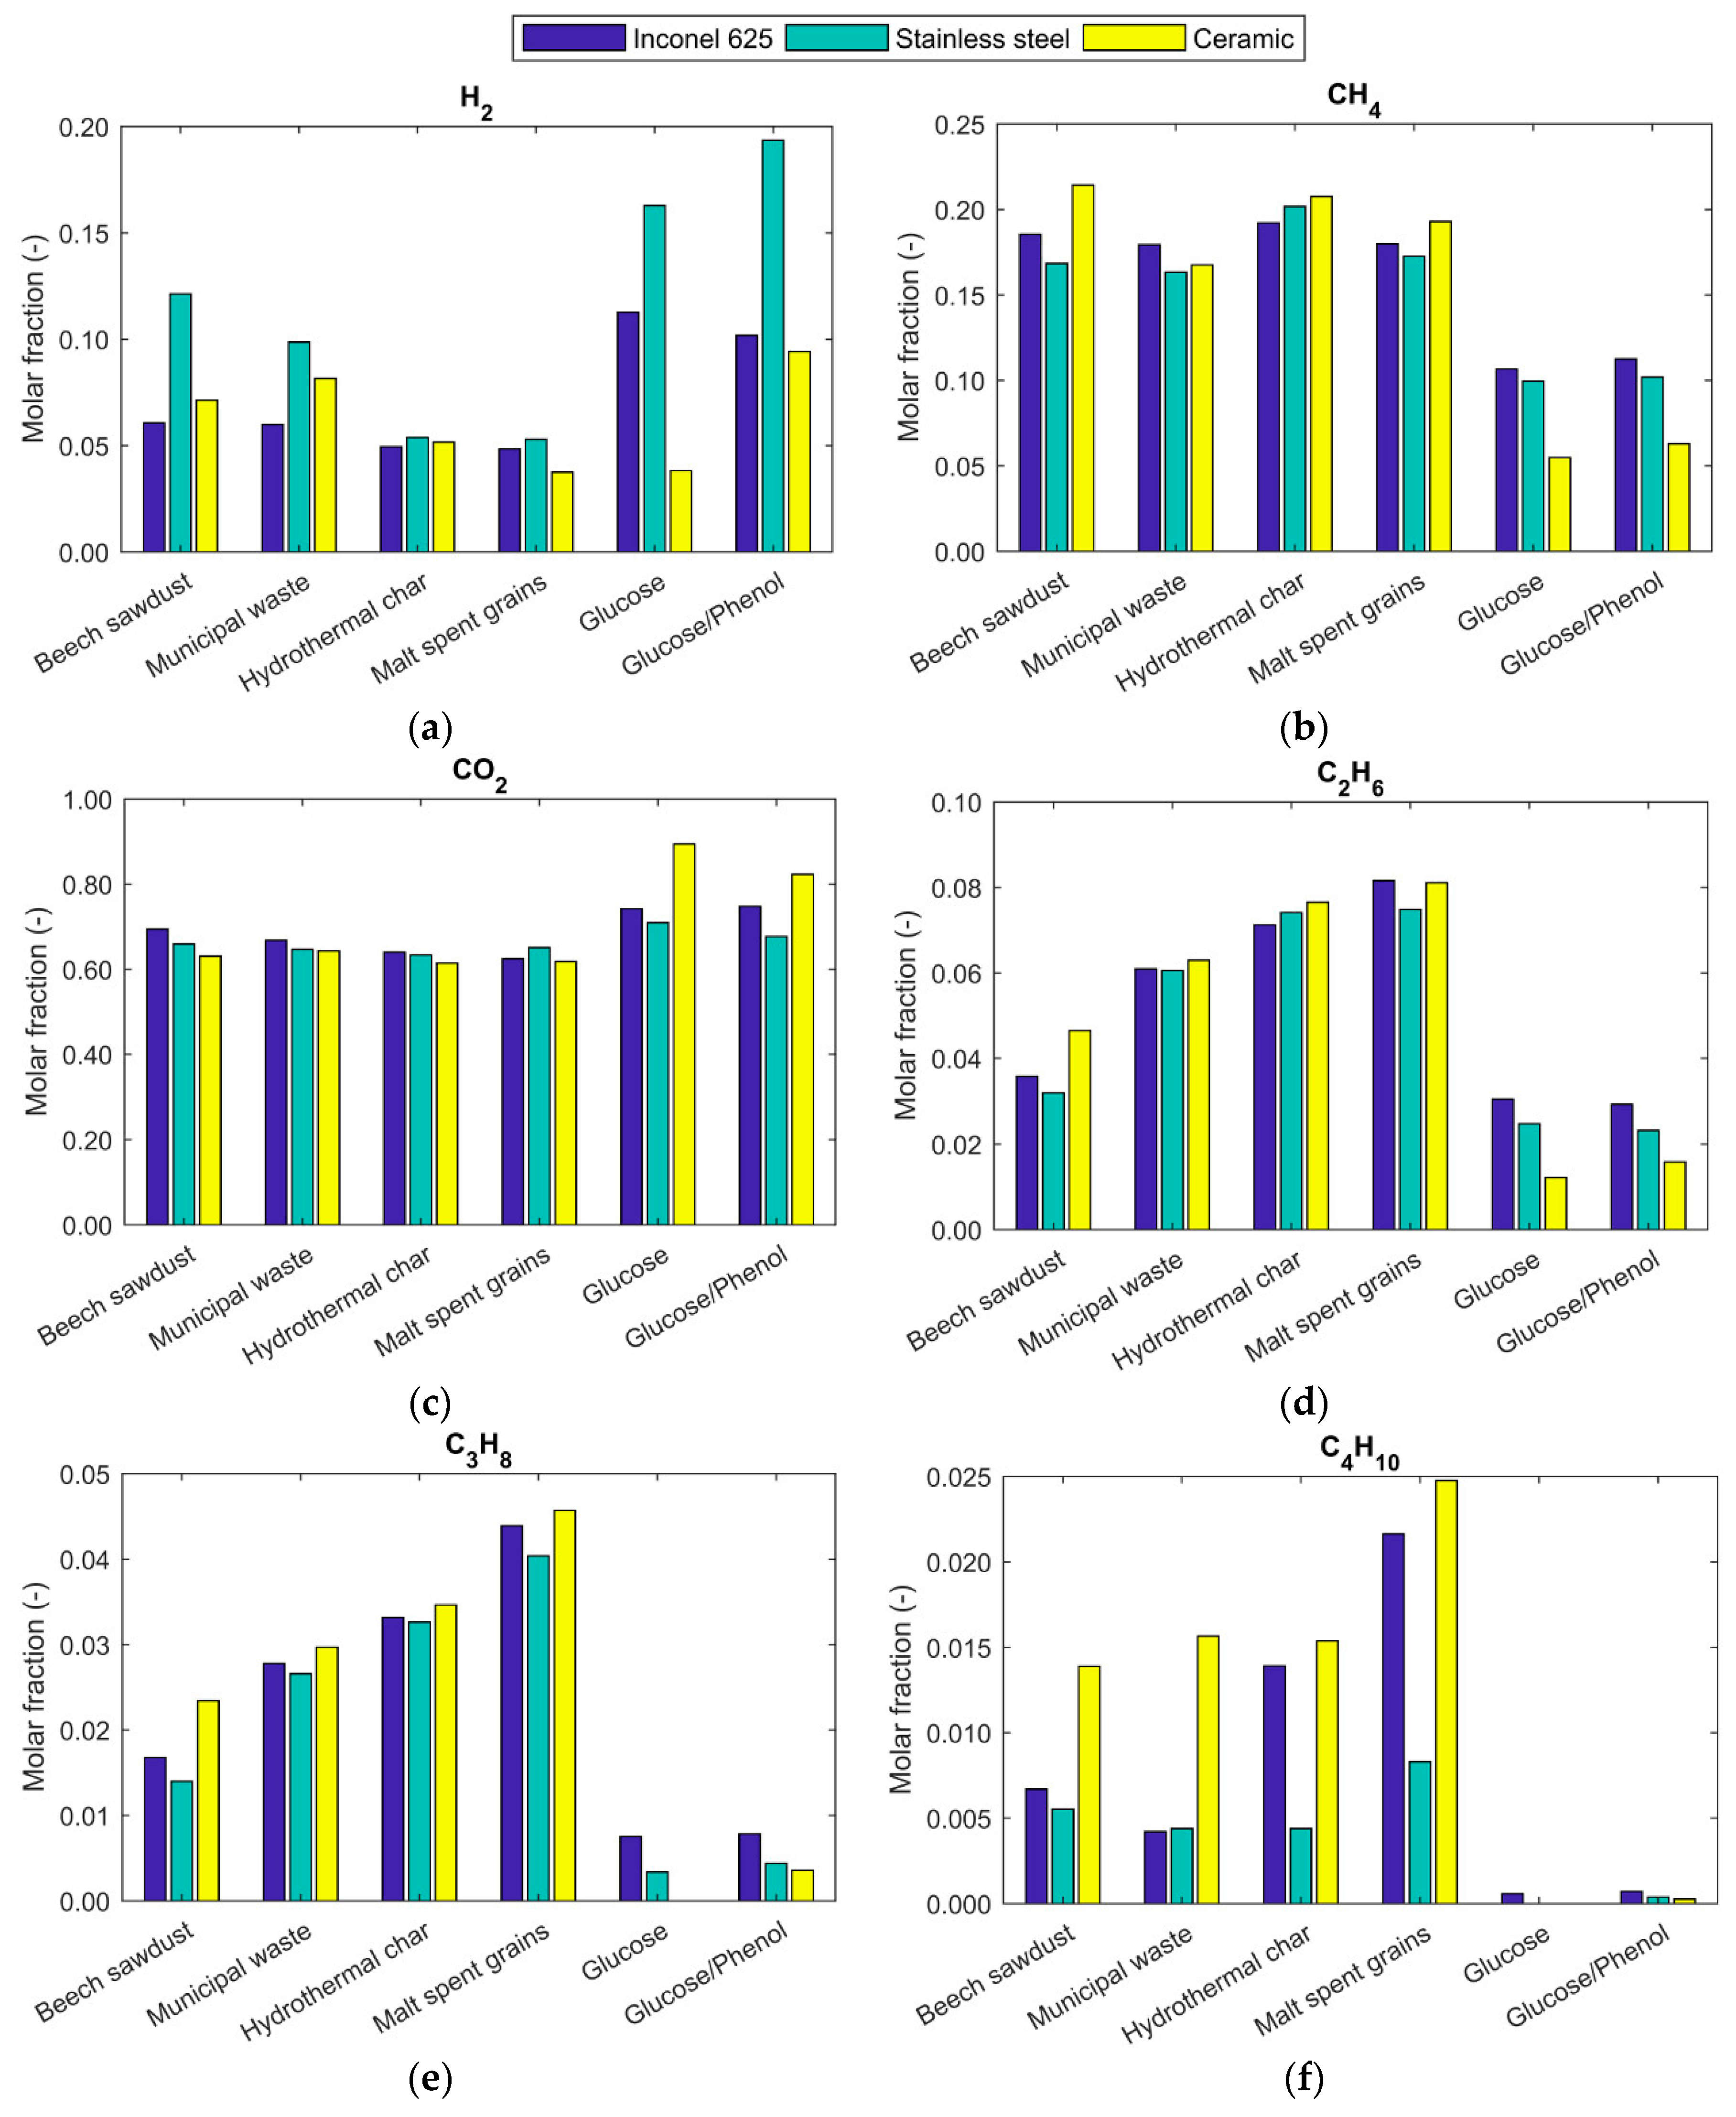
In Figure 1, the composition of the produced gas is reported in terms of molar fractions, as measured by gas chromatography (GC) (see Section 3). The main gas product is CO2, the molar fractions of which are always higher than 0.60 (Figure 1c). A clear difference can be noticed between real biomasses and model compounds. In the former case, CO2 molar fractions are comprised between 0.60 and 0.70. In the case of glucose and glucose/phenol mixtures, such molar fractions are even higher, being nearly always higher than 0.70 with a peak of 0.89, measured for the ceramic reactor.
As far as fuel gases are concerned, it can be observed that both H2 and hydrocarbons are formed. H2 molar fractions (Figure 1a) are influenced by both the reactor material and the biomass type in a remarkable way. The highest H2 contents are obtained in the stainless steel reactor. In such device, the H2 molar fractions can be as high as 0.12 for real biomasses (beech sawdust), while, for model compounds, they even approach 0.20. The difference is evident, especially when the Inconel reactor is taken into account. For such a reactor, the H2 molar fractions are basically constant at around 0.05 for real biomasses and at approximately 0.10 for model compounds. Such observations are in line with the results of a previous study by our group [15]. In that work, we observed that stainless steel is able to catalyze the water-gas shift reaction, while nickel-based alloys like Inconel appear more suitable for the catalysis of the CO methanation reaction. In this framework, the ceramic reactor shows an intermediate behavior for some biomasses (beech sawdust and municipal waste), while for other materials it gives comparable or lower H2 molar fractions.
Methane (Figure 1b) molar fractions are higher than those of hydrogen; here, they are around 0.15–0.20. In general, Inconel is able to give higher molar fraction of CH4 with respect to stainless steel, as was expected due to the catalytic effect of nickel [32]. However, for most real biomasses, the ceramic reactor is able to produce the highest molar fraction of methane. The situation changes for the model compounds, for which the ceramic reactor has the worst performance for CH4 formation among the three devices.
The ceramic reactor is also able to promote the formation of gaseous, heavier hydrocarbons, i.e., ethane (Figure 1d), propane (Figure 1e), and butane (Figure 1f), which can be globally indicated as C2+. Inconel and especially ceramic reactors show the highest concentrations of C2+. In particular, the ceramic reactor presents noticeably higher fractions of C4H10. However, a different behavior can again be observed in model compounds compared to real biomasses. With model compounds, the production of hydrocarbons is much lower, especially for the ceramic reactor. It can therefore be concluded that the alumina ceramic inlay is able to play some catalytic effects, probably enhancing the conversion of some intermediate compounds into hydrocarbons. This could be caused by the ability of Al2O3 to promote cracking reactions [33].
In general, comparable molar fractions can be found in other works using the same reaction temperature. For example, Karayildirim et al. report methane fractions between 0.15 and 0.20 for sawdust, pine cone, artichoke stalk, and cellulose [34]. In their case, however, slightly higher H2 yields and lower CO2 yields were obtained, probably due to the lower biomass concentration they used (10 wt %). Similar molar fractions were also obtained in [15,18].
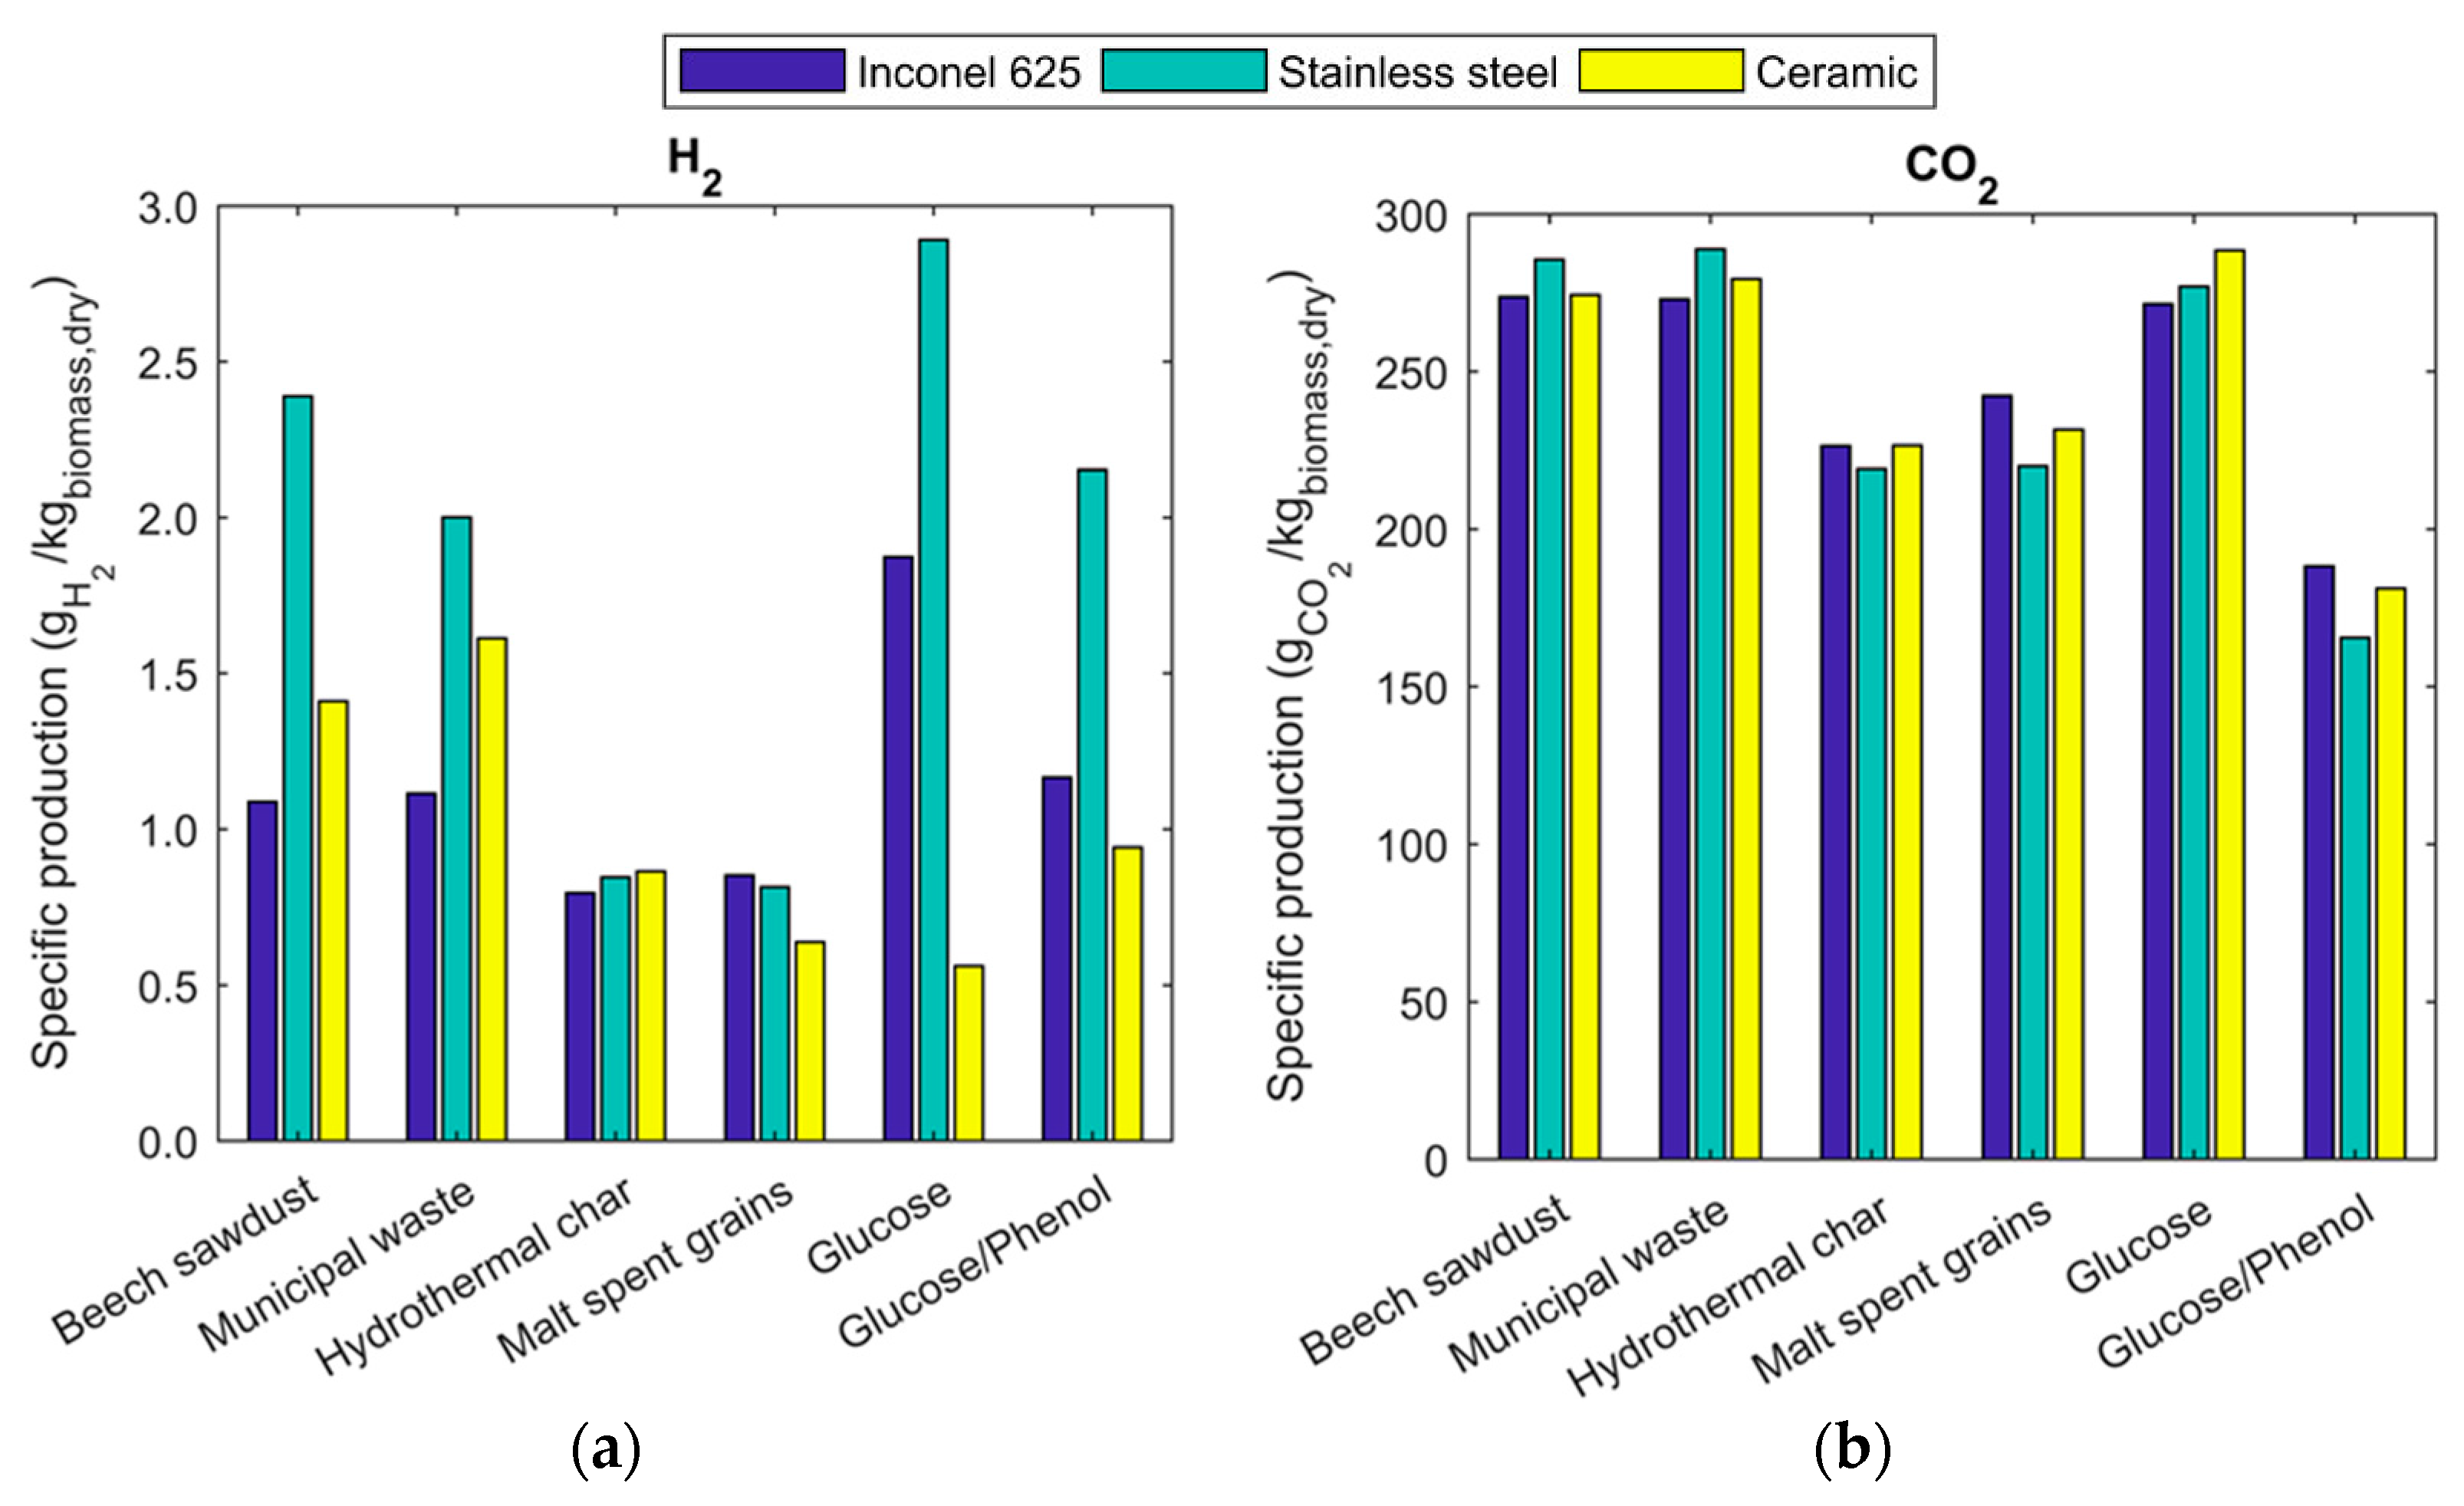
In Figure 2, the specific gas yields are reported in terms of grams of gas per kg of biomass fed. Such representation makes it clear that the preferred product is CO2, the production of which, in terms of yields, can explain the largest amount of gas mass produced. It can be observed that CO2 yields for the ceramic reactor are comparable to those of the other two reactors.
H2 yields are very reduced in terms of mass because of the very low molar mass of such a molecule. On a mass basis, the combustible species showing the highest yields are therefore methane and higher hydrocarbons (C2+). The production of such classes of hydrocarbons is comparable to and even higher than CH4. This is especially the case for the ceramic reactor, which is clearly producing the highest amounts of hydrocarbons, with respect to the other two devices tested. The presence of alumina, therefore, can positively influence the kinetics of hydrocarbon production, although this effect was not observed for glucose and the glucose/phenol mixture.
It is interesting to compare such results with the predictions of thermodynamic equilibrium, especially due to the very long reaction time adopted (16 h). In Table 3, the equilibrium yields for the six investigated feeds are shown, expressed as g of gas per kg of feedstock. Such results were obtained by running a non-stoichiometric thermodynamic equilibrium model developed by our group [4] and based on the minimization of Gibbs energy. The model accounts for 22 chemical species and was run based on the elemental composition of each investigated feedstock.
By comparing Figure 2 and Table 3, it is evident that, in the investigated reaction conditions, the equilibrium yields are not achieved, even after such a long reaction time. The process conditions chosen for this study result in a theoretical prevalent equilibrium production of carbon dioxide and methane. Qualitatively, this is also the case for the experimental data, where CO2 and CH4 (as well as other hydrocarbons) are actually the gases produced the most. From a quantitative point of view, however, equilibrium is very far from being reached for most gaseous species. Methane production is around 10% of the predicted equilibrium value and CO2 is around 30%. Interestingly, it can be observed that H2 yields are largely in line with or even higher than the equilibrium predictions, although the yields of such gases are very low.
Notably, in none of the analyzed experiments was carbon monoxide (CO) measured. When residence times in the order of minutes are adopted, CO can account for even more than 40% on a volume base [30]. Previous results from our group, obtained with a similar methodology, showed that CO is decreasing over time but is still present after 5 h of reaction time when using both beech sawdust and glucose as feedstock [15]. Conversely, other tests performed with hydrothermal char did not show any carbon monoxide production, even after only 1 h of operations [18]. CO is a reactive gas, which is involved in the two most important reactions among the gas-phase species. The first is the water-gas shift reaction [35], which produces hydrogen from water:
CO + H2O → CO2 + H2
The second reaction is CO methanation, producing methane while consuming H2:
CO + 3H2 → CH4 + H2O
Carbon monoxide is a reactant in both reactions, and its role is crucial to promote the rearrangement of gas products. In the considered reaction conditions, CO could produce H2 through reaction (1) and, in turn, give CH4 by reaction (2). Its absence indicates that, probably, a situation of local equilibrium has been reached, with both reactions (1) and (2) shifted to the right. Thus, it could be expected that the composition of the gas will not change over time, unless other products are transferred from the condensed phases to the gaseous phase.
The achievement of equilibrium is therefore hampered by the poor transfer of carbon into the gaseous phase. This is evident by looking at the experimental values of carbon gasification efficiency (CGE) reported in Table 3.
Under thermodynamic equilibrium conditions, CGE should be 100%, since all carbon in the feed is converted into gaseous species, as testified by running our model [4]. The measured values are, instead, always lower than 30%, testifying that equilibrium conditions are far from being achieved. Similar values for CGE are found in studies conducted at the same temperature [2,36]. In addition, Table 3 shows that the reactor material affects CGE to a very limited extent (given the feed, the ranges of the measured CGE are quite narrow), while the type of feed has a remarkable influence on CGE.
This is in accordance with other studies reporting that, especially at low heating rates in batch reactors, equilibrium (i.e., complete gasification) is not reached [37,38,39]. This is usually explained by the formation of less reactive compounds, compared to biomass, during heating-up. One of these less reactive consecutive products is studied here as feedstock, i.e., the product of hydrothermal carbonization [34].
As regards the differences between biomasses and model compounds, it should be considered that biomass usually contains salts acting as catalysts [40]. Despite the long reaction time, catalytic effects seem to be important, leading to higher CGE for biomasses.
2.4. Energy Recovery
An important parameter to be quantified is the energy recovery (ER) of the process, i.e., the amount of energy that can be transferred to the desired gaseous product. This amount can be calculated as the gas yield (Ygas) times the ratio between the higher heating value (HHV) of the product gas and that of the starting biomass.
In Figure 3a, the values of HHVgas are shown, while Figure 3b reports the values of ER. The HHV of the produced gas is quite low, in the range of 8–13 MJ/kg for the real biomasses, and it is even lower for the model compounds. This is a clear consequence of the very high concentration of CO2, which does not contribute to the heating value.
Energy recoveries are, in general, relatively low at the considered reaction conditions. This is a consequence of the fact that the system is very far from equilibrium, and therefore gas productions are very limited. In the best case (municipal waste), ER is around 22%, while, in the worst care (glucose/phenol mixture), ER is as low as 4%.
For real biomasses, the ceramic reactor invariably allowed for the highest values of ER. If the composition of the product gas is considered, such higher energy recoveries are especially due to the higher production of C2+ hydrocarbons characterizing this type of reactor. The higher amount of gases could originate from the cracking of relatively large molecules in the liquid phase. The further decomposition of these hydrocarbons may be hindered by the absence of a metal catalyst.
The trend of ER shows strong differences between real biomasses and model compounds. For glucose and glucose/phenol, ER is substantially lower than for the biomasses. Again, this is caused by the different composition of the product gas from the model compounds, which have higher concentrations of hydrogen and evidently lower concentrations of hydrocarbons. Contrary to the considerations made for the real biomasses, now the ceramic reactor shows the worst performance and the ERs are even lower than 5%. The gas from glucose gasification in the ceramic reactor is indeed richer in CO2, which does not contribute to the HHV. However, ER is quite reduced, which is also the case in the other reactors considered, compared to the tests with real biomasses due to the lower production of hydrocarbons generated by glucose.
2.5. Liquid Products
A measure of the amount of organics dissolved in the liquid—for the sake of clarity: liquid phase obtained after quenching the reactor—can be obtained by means of the total organic carbon (TOC). For soluble substances, e.g., glucose or glucose/phenol, the measure of TOC reveals the conversion of the feedstock itself. TOC is indeed at its maximum at the beginning of the reaction, when all organics are in the liquid phase, and becomes lower as such organics are converted into gaseous and solid products. For insoluble or partially soluble biomasses, TOC has a more complex interpretation because it represents the balance between the amount of feedstock that is solubilized in water and the amount that is converted to the other phases.
In Figure 4, the measured values of TOC are reported. Significant differences can be observed among the various feeds. In the group of real biomasses, the highest values are found for beech sawdust and malt spent grains, with values of TOC of 9 to 10 g/L, while municipal waste and hydrothermal char give lower concentrations (4–5 g/L). Such results are in line with the conclusions of our previous study [18], as well as with other works in the literature [34]. For model compounds, the mixture glucose/phenol results in the highest values of TOC, around 20 g/L, while the pure glucose causes TOC values of around 5 g/L. Such behavior can be explained considering that phenol is relatively inert during gasification and thus remains, to a large extent, unconverted in the liquid phase, contributing to the TOC. Similar values can be found in [30].
In general, the differences in TOC are mostly related to the different biomass types more than to the reactor material. Generally, the ceramic reactor does not show clear differences from the other reactors. Some differences can be observed for the reactions with model compounds, where the ceramic reactor causes higher values of TOC. It can therefore be concluded that, for model compounds, a ceramic reactor results in lower conversions from the liquid phase. However, as shown in Table 2, such lower conversion does not result in a lower gas production but in a lower production of solids. The investigated ceramic reactor is thus able to limit the formation of coke precursors. However, although the production of gas is comparable with that of the other reactors, the gas from the ceramic reactor has a much higher concentration of CO2, revealing that the material is preventing the formation of H2, CH4, and higher hydrocarbons from liquid intermediates. From a stoichiometric point of view, this means that the organic compounds in the liquid phase are more hydrogenated because the lower H2 and CH4 content means less hydrogen in the gas. Hydrogenated organic compounds should be less reactive concerning polymerization [40], which leads to less solid residue by depressed polymerization or improved splitting of the biomass. Further investigation is needed to clarify such reaction kinetics aspects.
2.6. Observation of the Alumina Surface
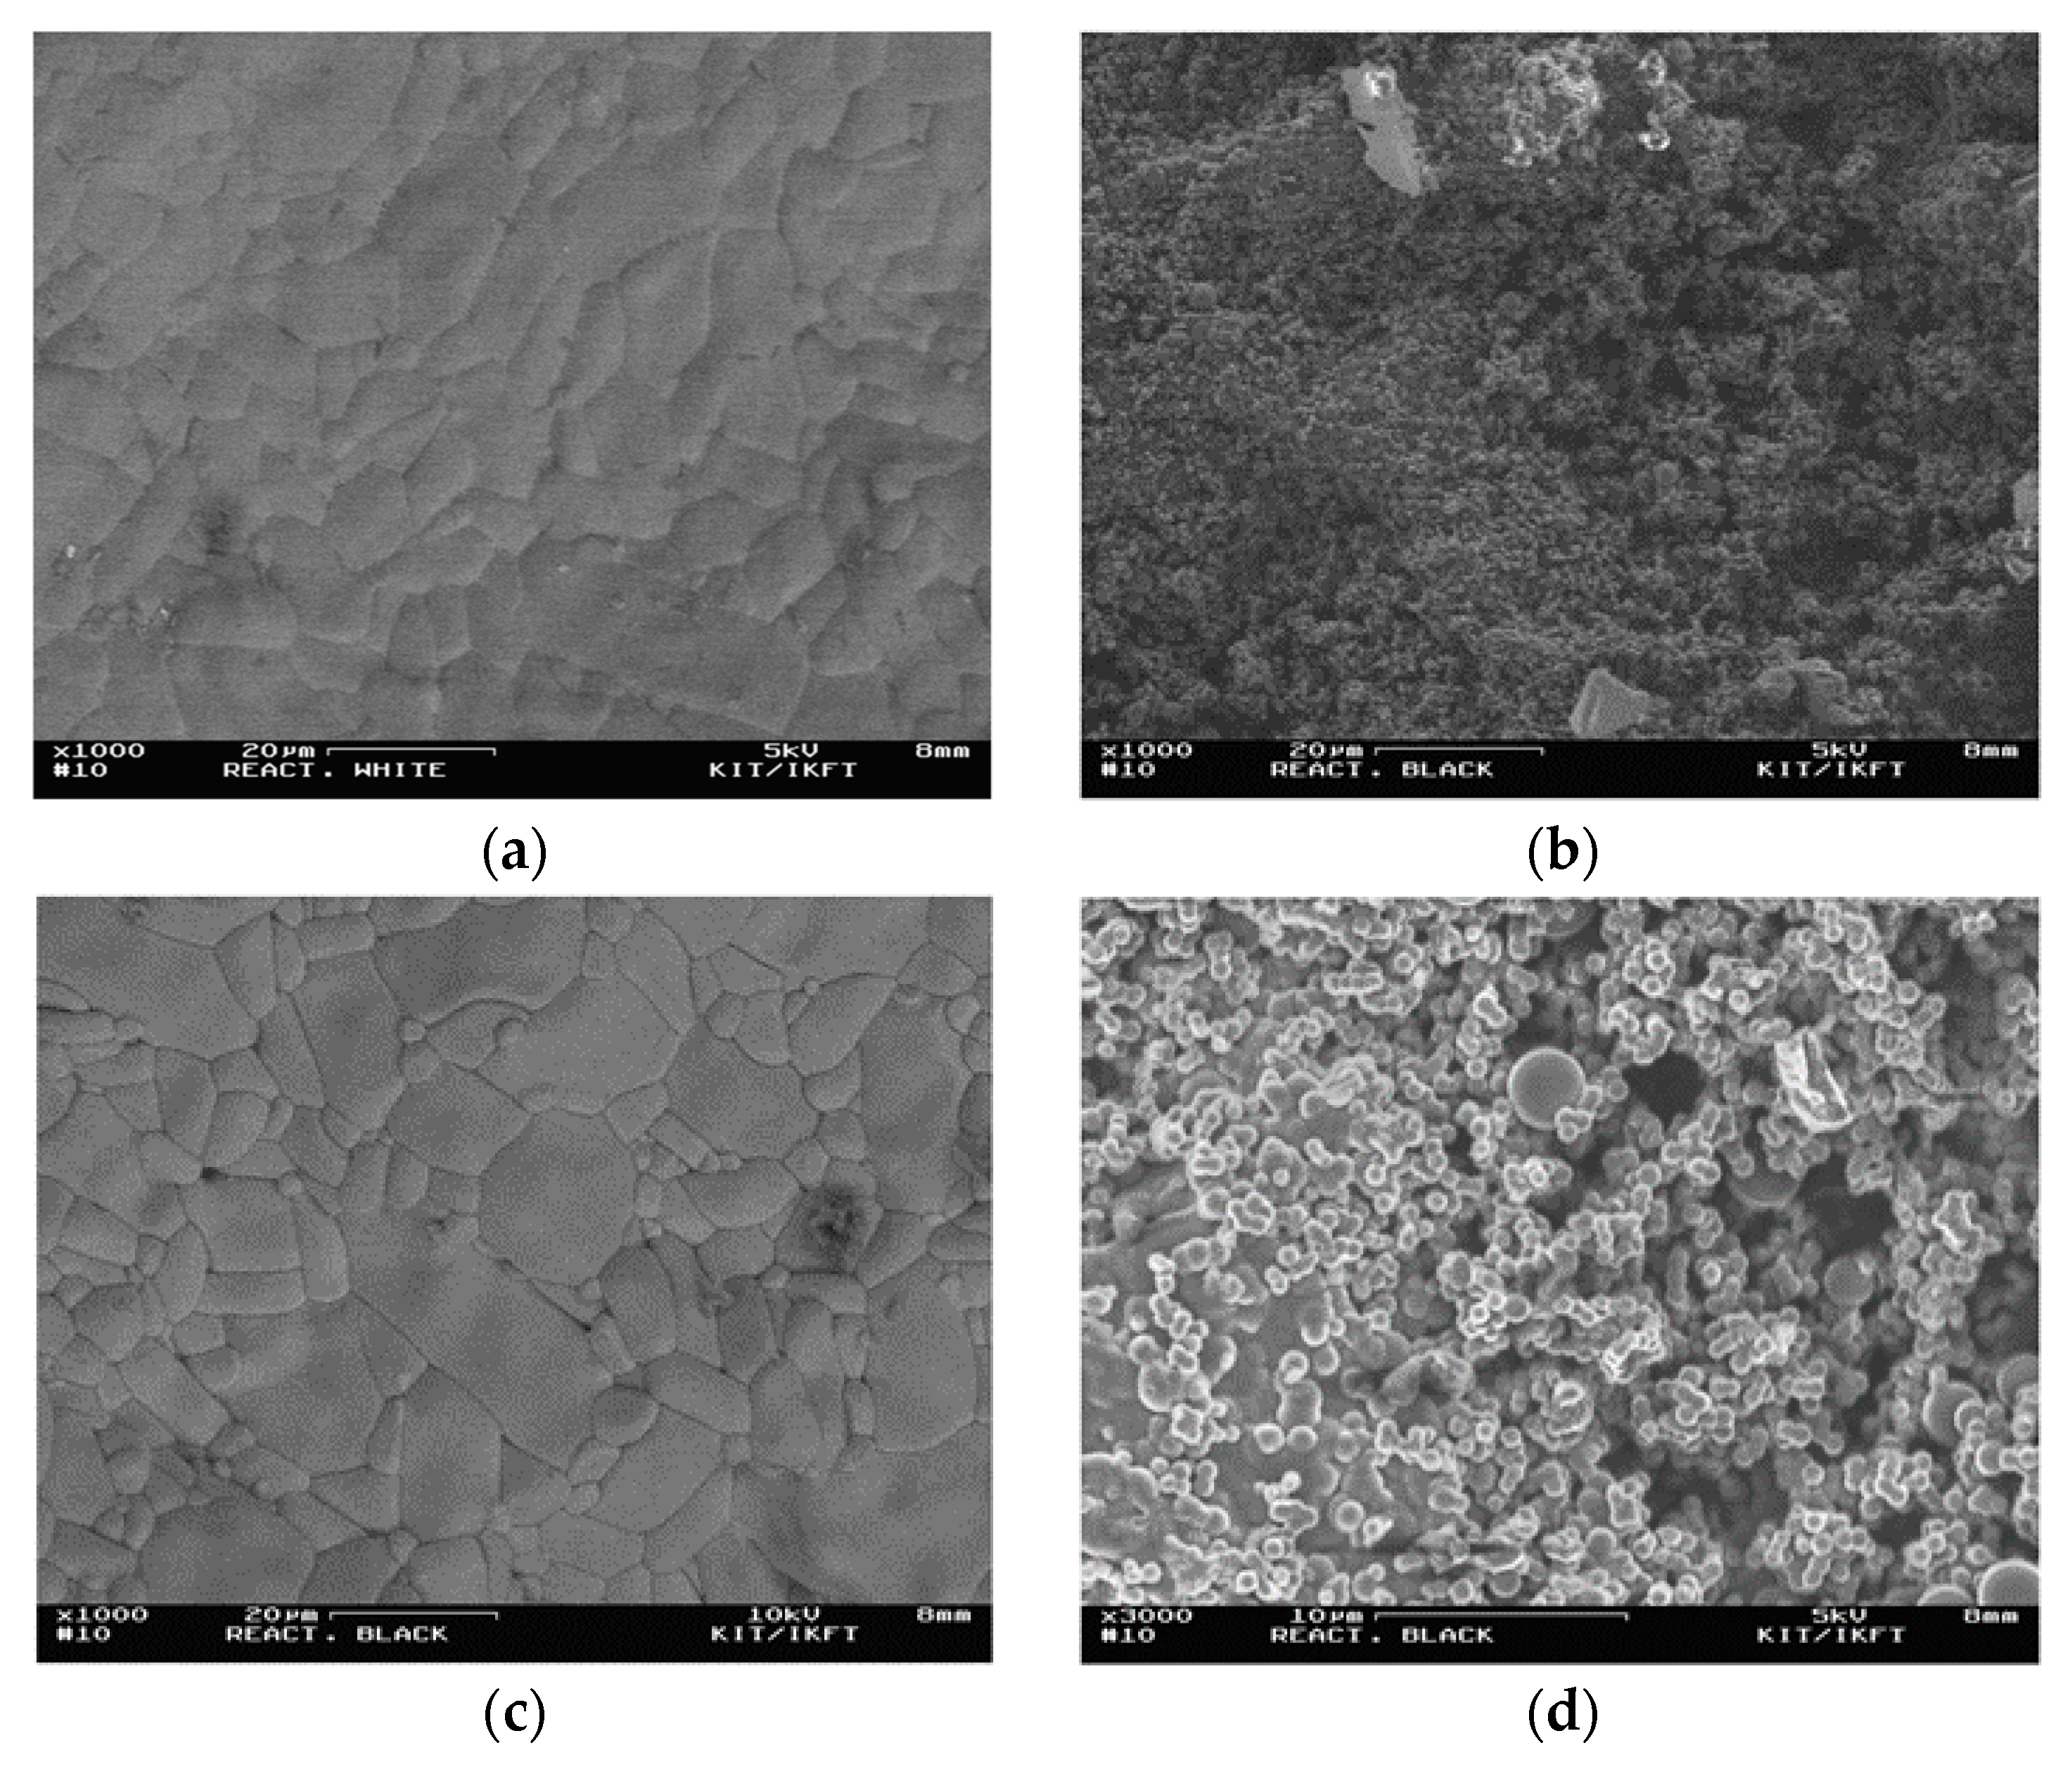
The alumina inlay of the ceramic reactor was examined by means of scanning electron microscopy (SEM) before the experimental campaign and after all the series of experiments. Figure 5 shows the acquired pictures. In Figure 5a, the SEM image of a blank sample, i.e., of the ceramic inlay before reaction, is presented, showing the intimate structure of alumina. On the ceramic surface, it is possible to notice many irregular grains merged together, deriving from the crystallization process during the manufacturing of Al2O3.
After reaction, the ceramic surface visually appeared to be black. The SEM picture (Figure 5b) shows that very small spheres of carbonaceous products were present and covered the surface almost uniformly. Figure 5d shows the carbon layer at higher magnification (3000×). Appreciably, the covering of the surface consisted of a number of microspheres, with very regular shapes. Most of the spheres had a sub-micrometric diameter. Such products derive from the chemical condensation of compounds present in the liquid phase, as opposed to char, which normally possesses the same structure as the starting biomass [34]. The observed microspheres are in line with previous observations [15,18]. Coke forms from the chemical condensation of some precursors, forming polycyclic rings. Aromatics or furfural compounds are considered as possible precursors of coke, even though the reasons for coke formation are normally related to complex interactions among the compounds present in the reaction environment [41]. It is, however, not clear if the formation of such spheres took place during supercritical conditions or at subcritical conditions; for example, during the quenching of the reactor or even during the initial heating ramp.
After cleaning the reactor by washing it with acetone (see Section 3), we found that the carbon layer got detached from some points on the surface, which appeared bright white. These fragments were also observed with SEM. The surface (Figure 5c) exhibited the same structure as the blank sample, with the evident grain structure of alumina. The two pictures appear very similar, showing that the surface is not visibly damaged. However, before reaction (Figure 5a) the grains seemed to be merged together, while after reaction (Figure 5c) the borders between the grains became more evident and sharply defined. This could be indicative of slight intergranular corrosion. Such a phenomenon was already reported by other studies on ceramics in supercritical water [9,11]. Nevertheless, the extent of the phenomenon was very small, and the overall structure of the material was preserved. This suggests that alumina can resist the experimental conditions considered.
The surfaces were also analyzed by means of electron dispersion X-ray spectrometry (EDXS) in order to obtain their elemental composition. The pictures and the measured spectra are shown in Figure 6, while in Table 4 the values of mass composition are reported.
Figure 6a shows the EDXS spectra of the unreacted alumina surface. The surface was found to be composed of oxygen and aluminum, along with a small amount of magnesium. Interestingly, the alumina appeared in a higher oxidized form, with respect to theoretical calculation (Al: 52.9%, O: 47.1%). This could be caused by the presence of some aluminum hydroxide in the ceramic matrix or simply result from the semi-quantitative character of such an analytic technique. The situation after reaction can be seen in Figure 6b, showing the reactor surface. The lower area was fully covered with coke, and the upper area was relatively clear after the detachment of the carbon layer that covered it. The EDXS analysis of the black area showed that only carbon and oxygen could be measured (EDXS cannot detect hydrogen), and the peak for aluminum could hardly be noticed. Therefore, coke was able to cover the surface almost completely. This allows it to be inferred that, probably, the possible catalytic effects played by the reactor’s inner surface would tend to disappear after many cycles of usage.
The analysis of the white surface still revealed the presence of a residual amount of coke, represented by the peak of carbon, but the presence of aluminum and oxygen was completely restored. Assuming that coke has the same composition observed for the ‘black’ area, a coke-free composition could be calculated, with 55.1% oxygen and 44.9% aluminum, in line with the measures in the unreacted surface. Hence, the aluminum surface did not show any significant change in composition after reaction.
3. Materials and Methods
3.1. Reactors and Feedstock
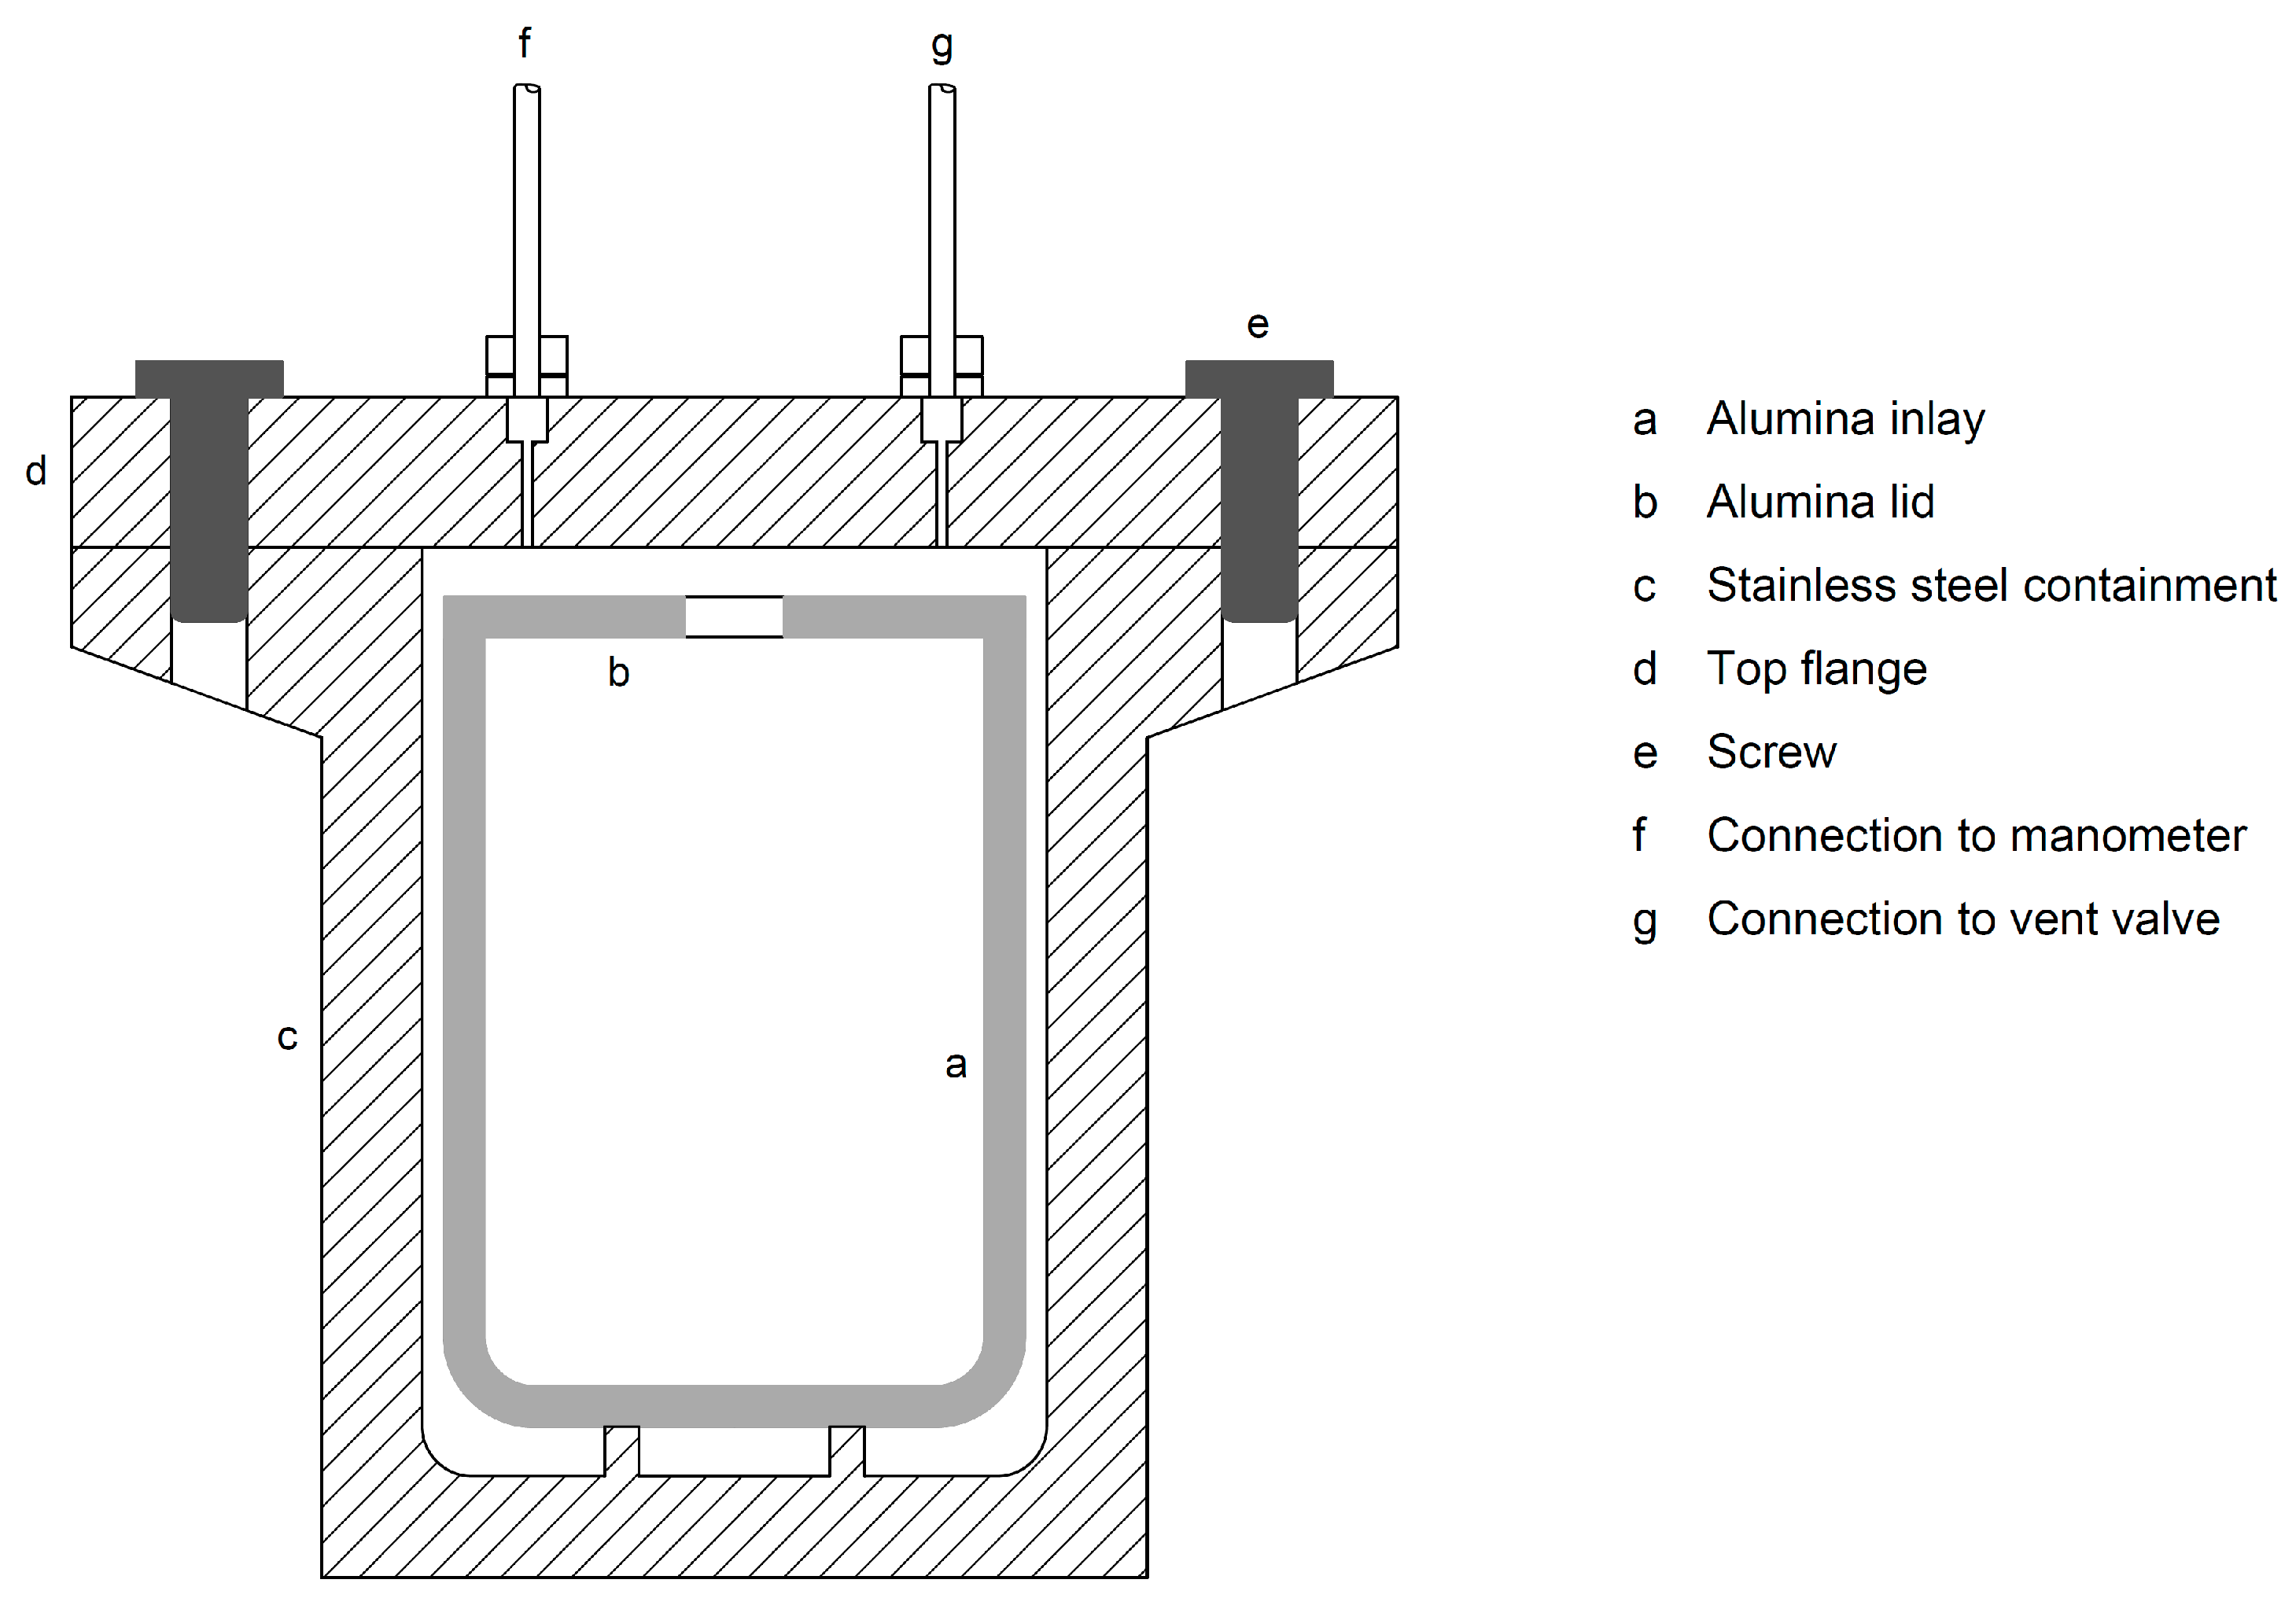
Supercritical water gasification tests were performed by means of a small autoclave reactor. The reactor consisted of an external containment of stainless steel and of an interior inlay of aluminum oxide (alumina, Al2O3), with a volume of 23.6 mL. The reactor was closed on top by a flange, which could be removed to allow reactor loading. On the top of the flange, two sampling ports were present: one, closed with a valve, allowed for gas sampling. The other was used to connect a manometer for the measurement of the actual reactor pressure. In Figure 7, a schematic drawing of the experimental setup is shown.
The utilized feeds are four biomasses and bio-based products (beech sawdust, municipal solid waste, hydrothermal char, and malt spent grains) and two model compounds (glucose and a glucose/phenol mixture). A wide spectrum of materials was thus chosen, ranging from lignocellulosic biomass to agro-industrial and municipal waste. We also considered hydrothermal char, the product of the hydrothermal carbonization (HTC) process [42], originating from corn silage. All biomasses were obtained from local producers in Sothern Germany. Moreover, tests with glucose and a mixture of 75% glucose and 25% phenol were performed, since glucose is a model compound for cellulose and phenol for lignin, the two most important constituents of lignocellulosic biomass. In the preparation of the mixtures, glucose monohydrate (Merck, Darmstadt, Germany) and phenol for synthesis with purity higher than 99% (Merck-Schuchardt, Darmstadt, Germany) were used.
3.2. Experimental Procedure and Analytics
For each test, the alumina reactor was charged with a feed consisting of 15 wt % of biomass, the remaining part being Milli-Q water. The amount of feed (biomass + water) was selected according to steam tables [43] in order to ensure a pressure of 300 bar at 400 °C; the value was calculated as 8.44 g.
The autoclave was put in a GC oven at a temperature of 400 ± 1 °C and was reacted for 16 h. Due to the very long reaction times, it can be reasonably assumed that the reactors reached the set-point temperature and that the overall effect of the thermal transient could be neglected. After 16 h of reaction, the reactor was brought out of the GC oven and was quenched in ice-water in order to instantaneously stop the reactions. Then the gaseous products were extracted by opening the aforementioned valve. The gas volume production was measured by means of a water displacement gas-meter. Such a device consisted of a sealed graduated cylinder immersed in a water vessel, where a vacuum was obtained through a vacuum pump. Gas from the reactor was bubbled inside the cylinder, causing water displacement and thus enabling the correspondent volume of gas produced to be read. A schematic of such a system was reported in [15]. A sample of syngas was also taken by means of a syringe and injected in a gas-chromatographic device for gas composition determination.
The GC apparatus was an Agilent 6890A (Agilent, Santa Clara, CA, USA) with Thermal Conductivity Detector (TCD) and Flame Ionization Detector (FID), Helium as the carrier gas, and columns of Molsieve 5A 80/100 (Restek, Bellefonte, PA, USA) and Porapak Q (Agilent, Santa Clara, CA, USA). The analytical method adopted in this device, however, did not allow small amounts of hydrogen (<20%) to be determined with adequate accuracy. For this reason, a second injection into another GC was done. Such a device was an Agilent 5890 (Agilent, Santa Clara, CA, USA) with a TCD, N2 as the carrier gas, and a packed column ShinCarbon ST 80/100 (Restek, Bellefonte, PA, USA). Hence, the values of CO, CO2, CH4, and C2+ were obtained from Agilent 6890A, while H2 was obtained from Agilent 5890.
Liquid and solid samples were also collected from the reactor after removing the upper flange. The solid/liquid mixture was withdrawn by means of a 2 mL syringe, and the liquid was filtered using a 0.45 μm round filter. The total organic carbon (TOC) of the liquid sample was measured to estimate the amount of organic compounds dissolved in water after reaction. Apparatus Dimatec 2000 (Dimatec, Wolfsburg, Germany), based on the principle of thermo-catalytic oxidation with subsequent IR detection, was used to that end.
To extract the solid, the interior of the reactor was washed three times with acetone because the solid had a tendency to stick to the reactor walls. The obtained liquid was poured in a glass beaker and put in a dryer at 105 °C overnight. Then, the sample was weighed and the amount of solids was determined gravimetrically, using the procedure detailed in [15,18].
For the other batch autoclaves, i.e., the stainless steel and the Inconel 625, the experimental procedure was similar, apart from the amount of loaded feed, which was 1.79 g. Comprehensive details about the experimental procedure for such autoclaves can be found in our previous publication [15].
After the experimental tests, the ceramic inlay was extracted from the reactor. Fragments of the inlay were observed by scanning electron microscopy (SEM) in order to appreciate the surface phenomena. The device was a Field Emission (FE)-SEM DSM 982 Gemini (Carl Zeiss Ltd., Oberkochen, Germany), equipped with an Energy Dispersive X-ray Spectrometry (EDXS), with a 30 mm2 Pentafet Si (Li) detector (Oxford Instruments, Abingdon, UK).
The yields of gas and solids were calculated on a dry biomass basis:
In order to determine the density of the gas after expansion, the ideal gas law was utilized, provided that the gas volume was measured at room conditions, i.e., a temperature of 25 °C and a pressure of 1 bar.
The mass balance was written as:
Therefore, the yield of liquid product Yliquid was calculated by difference.
The elemental composition of the utilized biomasses was measured using a Vario EL III elemental analyzer (Elementar Analysensysteme, Langenselbold, Germany). The higher heating value of the feedstock was calculated using the Dulong-Petit formula:
where C, H, O, and S are the mass fractions of carbon, hydrogen, oxygen, and sulphur in the feedstock, respectively. The HHV of the syngas was computed from its composition and the HHVs of the single gaseous species.
The experiment’s reproducibility was checked by means of repeated selected experiments performed using the ceramic reactor. The experimental error was quantified as the standard deviation of the values obtained from such repeated experiments.
Data concerning the yields of gas, liquids, and solids were statistically analyzed by means of an ANOVA, with a significance level of α = 0.05. To this purpose, the ‘Data Analysis’ tool in Microsoft Excel was utilized, choosing the function ‘Anova: Two-factor without replication’. The two factors were represented by the reactor material (three levels) and the biomass type (six levels).
4. Conclusions
Long-time batch tests of supercritical water gasification of real biomasses and model compounds were conducted in a novel research reactor featuring an alumina inlay. The tests were also conducted at the same conditions with two other small autoclaves made of stainless steel and Inconel 625, respectively. On the one hand, the adoption of the alumina surface to contain the reaction environment did not result in strong differences with respect to the other metal surfaces in terms of the yields of gaseous, solid, and liquid products. On the other hand, the results showed appreciable differences in the distribution of permanent gases. The ceramic surface seemed to favor the formation of hydrocarbons, especially those higher than methane. As a matter of fact, such an effect was only experienced with real biomasses, while with glucose and glucose/phenol mixtures the ceramic reactor produced a gas consisting almost exclusively of carbon dioxide. The fact that the mixture is rich in higher hydrocarbons is beneficial to the heating value of the produced gas, allowing a higher energy recovery in the analyzed reaction conditions. The utilized alumina inlay showed quite good resistance to supercritical reaction conditions, even though microscopic observation revealed the occurrence of slight intergranular corrosion. These results allow us to conclude that alumina could be considered as material for SCWG reactors, where it could be utilized as a coating on the walls of a metallic vessel.
Acknowledgments
The authors gratefully acknowledge the staff of Institute of Catalysis Research and Technology (IKFT), Karlsruhe Institute of Technology (KIT) for their important technical support of the experiments and their analytical work. Special thanks are given to Matthias Pagel, Wilhelm Habicht, Armin Lautenbach, and Alexandra Boehm. The authors also acknowledge the Lifelong Learning Program / Erasmus Placement Program of the European Commission, for partial funding of Daniele Castello’s mobility.
Author Contributions
Daniele Castello and Andrea Kruse conceived and designed the experiments. Daniele Castello and Birgit Rolli performed the experiments and analyzed the data; Daniele Castello, Andrea Kruse, and Luca Fiori wrote the paper.
Conflicts of Interest
The authors declare no conflicts of interest. The funding sponsors had no role in the design of the study; in the collection, analyses, or interpretation of data; in the writing of the manuscript; or in the decision to publish the results.
References
- Molino, A.; Chianese, S.; Musmarra, D. Biomass gasification technology: The state of the art overview. J. Energy Chem. 2016, 25, 10–25. [Google Scholar] [CrossRef]
- Matsumura, Y.; Minowa, T.; Potic, B.; Kersten, S.; Prins, W.; van Swaaij, W.; van de Beld, B.; Elliott, D.; Neuenschwander, G.; Kruse, A.; et al. Biomass gasification in near- and super-critical water: Status and prospects. Biomass Bioenergy 2005, 29, 269–292. [Google Scholar] [CrossRef]
- Dinjus, E.; Kruse, A. Hot compressed water—A suitable and sustainable solvent and reaction medium? J. Phys. Condens. Matter 2004, 16, S1161–S1169. [Google Scholar] [CrossRef]
- Castello, D.; Fiori, L. Supercritical water gasification of biomass: Thermodynamic constraints. Bioresour. Technol. 2011, 102, 7574–7582. [Google Scholar] [CrossRef] [PubMed]
- Kruse, A. Hydrothermal biomass gasification. J. Supercrit. Fluids 2009, 47, 391–399. [Google Scholar] [CrossRef]
- Molino, A.; Migliori, M.; Blasi, A.; Davoli, M.; Marino, T.; Chianese, S.; Catizzone, E.; Giordano, G. Municipal waste leachate conversion via catalytic supercritical water gasification process. Fuel 2017, 206, 155–161. [Google Scholar] [CrossRef]
- Yakaboylu, O.; Harinck, J.; Smit, K.G.; de Jong, W. Supercritical water gasification of biomass: A literature and technology overview. Energies 2015, 8, 859–894. [Google Scholar] [CrossRef]
- Boukis, N.; Habicht, W.; Franz, G.; Dinjus, E. Behavior of Ni-base alloy 625 in methanol-supercritical water systems. Mater. Corros. 2003, 54, 326–330. [Google Scholar] [CrossRef]
- Boukis, N.; Claussen, N.; Ebert, K.; Janssen, R.; Schacht, M. Corrosion Screening Tests of High-Performance Ceramics in Supercritical Water Containing Oxygen and Hydrochloric Acid. J. Eur. Ceram. Soc. 1997, 17, 71–76. [Google Scholar] [CrossRef]
- Schacht, M.; Schacht, M.; Boukis, N.; Dinjus, E. Corrosion of alumina ceramics in acidic aqueous solutions at high temperatures and pressures. J. Mater. Sci. 2000, 35, 6251–6258. [Google Scholar] [CrossRef]
- Richard, T.; Poirier, J.; Reverte, C.; Aymonier, C.; Loppinet-Serani, A.; Iskender, G.; Pablo, E.-B.; Marias, F. Corrosion of ceramics for vinasse gasification in supercritical water. J. Eur. Ceram. Soc. 2012, 32, 2219–2233. [Google Scholar] [CrossRef]
- Vogel, F.; DiNaro Blanchard, J.L.; Marrone, P.A.; Rice, S.F.; Webley, P.A.; Peters, W.A.; Smith, K.A.; Tester, J.W. Critical review of kinetic data for the oxidation of methanol in supercritical water. J. Supercrit. Fluids 2005, 34, 249–286. [Google Scholar] [CrossRef]
- Boukis, N.; Diem, V.; Galla, U.; Dinjus, E. Methanol reforming in supercritical water for hydrogen production. Combust. Sci. Technol. 2006, 178, 467–485. [Google Scholar] [CrossRef]
- Antal, M.J., Jr.; Allen, S.G.; Schulman, D.; Xu, X.; Divilio, R.J. Biomass gasification in supercritical water. Ind. Eng. Chem. Res. 2000, 39, 4040–4053. [Google Scholar] [CrossRef]
- Castello, D.; Kruse, A.; Fiori, L. Biomass gasification in supercritical and subcritical water: The effect of the reactor material. Chem. Eng. J. 2013, 228. [Google Scholar] [CrossRef]
- Tanksale, A.; Beltramini, J.N.; Lu, G.M. A review of catalytic hydrogen production processes from biomass. Renew. Sustain. Energy Rev. 2010, 14, 166–182. [Google Scholar] [CrossRef]
- Flego, C.; Carati, A.; Perego, C. Methanol interaction with mesoporous silica-aluminas. Microporous Mesoporous Mater. 2001, 44–45, 733–744. [Google Scholar] [CrossRef]
- Castello, D.; Kruse, A.; Fiori, L. Supercritical water gasification of hydrochar. Chem. Eng. Res. Des. 2014, 92, 1864–1875. [Google Scholar] [CrossRef]
- DiLeo, G.J.; Neff, M.E.; Kim, S.; Savage, P.E. Supercritical Water Gasification of Phenol and Glycine as Models for Plant and Protein Biomass. Energy Fuels 2008, 22, 871–877. [Google Scholar] [CrossRef]
- Kruse, A.; Krupka, A.; Schwarzkopf, V.; Gamard, C.; Henningsen, T. Influence of Proteins on the Hydrothermal Gasification and Liquefaction of Biomass. 1. Comparison of Different Feedstocks. Ind. Eng. Chem. Res. 2005, 44, 3013–3020. [Google Scholar] [CrossRef]
- Kruse, A.; Maniam, P.; Spieler, F. Influence of proteins on the hydrothermal gasification and liquefaction of biomass. 2. Model compounds. Ind. Eng. Chem. Res. 2007, 46, 87–96. [Google Scholar] [CrossRef]
- Byrd, A.J.; Pant, K.K.; Gupta, R.B. Hydrogen production from glucose using Ru/Al2O3 catalyst in supercritical water. Ind. Eng. Chem. Res. 2007, 46, 3574–3579. [Google Scholar] [CrossRef]
- Hao, X.H.; Guo, L.J.; Mao, X.; Zhang, X.M.; Chen, X.J. Hydrogen production from glucose used as a model compound of biomass gasified in supercritical water. Int. J. Hydrogen Energy 2003, 28, 55–64. [Google Scholar] [CrossRef]
- Muangrat, R.; Onwudili, J.A.; Williams, P.T. Influence of alkali catalysts on the production of hydrogen-rich gas from the hydrothermal gasification of food processing waste. Appl. Catal. B Environ. 2010, 100, 440–449. [Google Scholar] [CrossRef]
- Williams, P.; Onwudili, J. Composition of products from the supercritical water gasification of glucose: A model biomass compound. Ind. Eng. Chem. Res. 2005, 44, 8739–8749. [Google Scholar] [CrossRef]
- Knezevic, D.; van Swaaij, W.P.M.; Kersten, S.R.A. Hydrothermal Conversion of Biomass: I, Glucose Conversion in Hot Compressed Water. Ind. Eng. Chem. Res. 2009, 48, 4731–4743. [Google Scholar] [CrossRef]
- Huelsman, C.M.; Savage, P.E. Reaction pathways and kinetic modeling for phenol gasification in supercritical water. J. Supercrit. Fluids 2013, 81, 200–209. [Google Scholar] [CrossRef]
- Yong, T.L.-K.; Matsumura, Y. Kinetics analysis of phenol and benzene decomposition in supercritical water. J. Supercrit. Fluids 2014, 87, 73–82. [Google Scholar] [CrossRef]
- DiLeo, G.J.; Neff, M.E.; Savage, P.E. Gasification of Guaiacol and Phenol in Supercritical Water. Energy Fuels 2007, 21, 2136–2340. [Google Scholar] [CrossRef]
- Castello, D.; Kruse, A.; Fiori, L. Low temperature supercritical water gasification of biomass constituents: Glucose/phenol mixtures. Biomass Bioenergy 2015, 73, 84–94. [Google Scholar] [CrossRef]
- Weiss-Hortala, E.; Kruse, A.; Ceccarelli, C.; Barna, R. Influence of phenol on glucose degradation during supercritical water gasification. J. Supercrit. Fluids 2010, 53, 42–47. [Google Scholar] [CrossRef]
- Fujita, S.; Terunuma, H.; Kobayashi, H.; Takezawa, N. Methanation of carbon monoxide and carbon dioxide over nickel catalyst under the transient state. React. Kinet. Catal. Lett. 1987, 33, 179–184. [Google Scholar] [CrossRef]
- Busca, G. Acid catalysts in industrial hydrocarbon chemistry. Chem. Rev. 2007, 107, 5366–5410. [Google Scholar] [CrossRef] [PubMed]
- Karayıldırım, T.; Sınağ, A.; Kruse, A. Char and Coke Formation as Unwanted Side Reaction of the Hydrothermal Biomass Gasification. Chem. Eng. Technol. 2008, 31, 1561–1568. [Google Scholar] [CrossRef]
- Chianese, S.; Fail, S.; Binder, M.; Rauch, R.; Hofbauer, H.; Molino, A.; Blasi, A.; Musmarra, D. Experimental investigations of hydrogen production from CO catalytic conversion of tar rich syngas by biomass gasification. Catal. Today 2016, 277, 182–191. [Google Scholar] [CrossRef]
- Chakinala, A.G.; Brilman, D.W.F.; van Swaaij, W.P.M.; Kersten, S. Catalytic and non-catalytic supercritical water gasification of microalgae and glycerol. Ind. Eng. Chem. Res. 2010, 49, 1113–1122. [Google Scholar] [CrossRef]
- Matsumura, Y.; Harada, M.; Nagata, K.; Kikuchi, Y. Effect of heating rate of biomass feedstock on carbon gasification efficiency in supercritical water gasification. Chem. Eng. Commun. 2006, 193, 649–659. [Google Scholar] [CrossRef]
- Sinag, A.; Kruse, A.; Rathert, J. Influence of the Heating Rate and the Type of Catalyst on the Formation of Key Intermediates and on the Generation of Gases During Hydropyrolysis of Glucose in Supercritical Water in a Batch Reactor. Ind. Eng. Chem. Res. 2004, 43, 502–508. [Google Scholar] [CrossRef]
- Louw, J.; Schwarz, C.E.; Burger, A.J. Catalytic supercritical water gasification of primary paper sludge using a homogeneous and heterogeneous catalyst: Experimental vs. thermodynamic equilibrium results. Bioresour. Technol. 2016, 201, 111–120. [Google Scholar] [CrossRef] [PubMed]
- Kruse, A.; Faquir, M. Hydrothermal Biomass Gasification—Effects of Salts, Backmixing and Their Interaction. Chem. Eng. Technol. 2007, 30, 749–754. [Google Scholar] [CrossRef]
- Chuntanapum, A.; Matsumura, Y. Char formation mechanism in supercritical water gasification process: A study of model compounds. Ind. Eng. Chem. Res. 2010, 49, 4055–4062. [Google Scholar] [CrossRef]
- Lucian, M.; Fiori, L. Hydrothermal Carbonization of Waste Biomass: Process Design, Modeling, Energy Efficiency and Cost Analysis. Energies 2017, 10, 211. [Google Scholar] [CrossRef]
- Wagner, W.; Pruß, A. The IAPWS formulation 1995 for the thermodynamic properties of ordinary water substance for general and scientific use. J. Phys. Chem. Ref. Data 2002, 31, 387–535. [Google Scholar] [CrossRef]
Figure 1.
Gas composition (molar fractions, dry basis) of the gas produced in the SCWG experiments: (a) H2; (b) CH4; (c) CO2; (d) C2H6; (e) C3H8; (f) C4H10.
Figure 1.
Gas composition (molar fractions, dry basis) of the gas produced in the SCWG experiments: (a) H2; (b) CH4; (c) CO2; (d) C2H6; (e) C3H8; (f) C4H10.

Figure 2.
Specific production of gases (gGAS/kgFEED,DRY) for the considered SCWG experiments. (a) H2; (b) CO2; (c) CH4; (d) C2+.
Figure 2.
Specific production of gases (gGAS/kgFEED,DRY) for the considered SCWG experiments. (a) H2; (b) CO2; (c) CH4; (d) C2+.

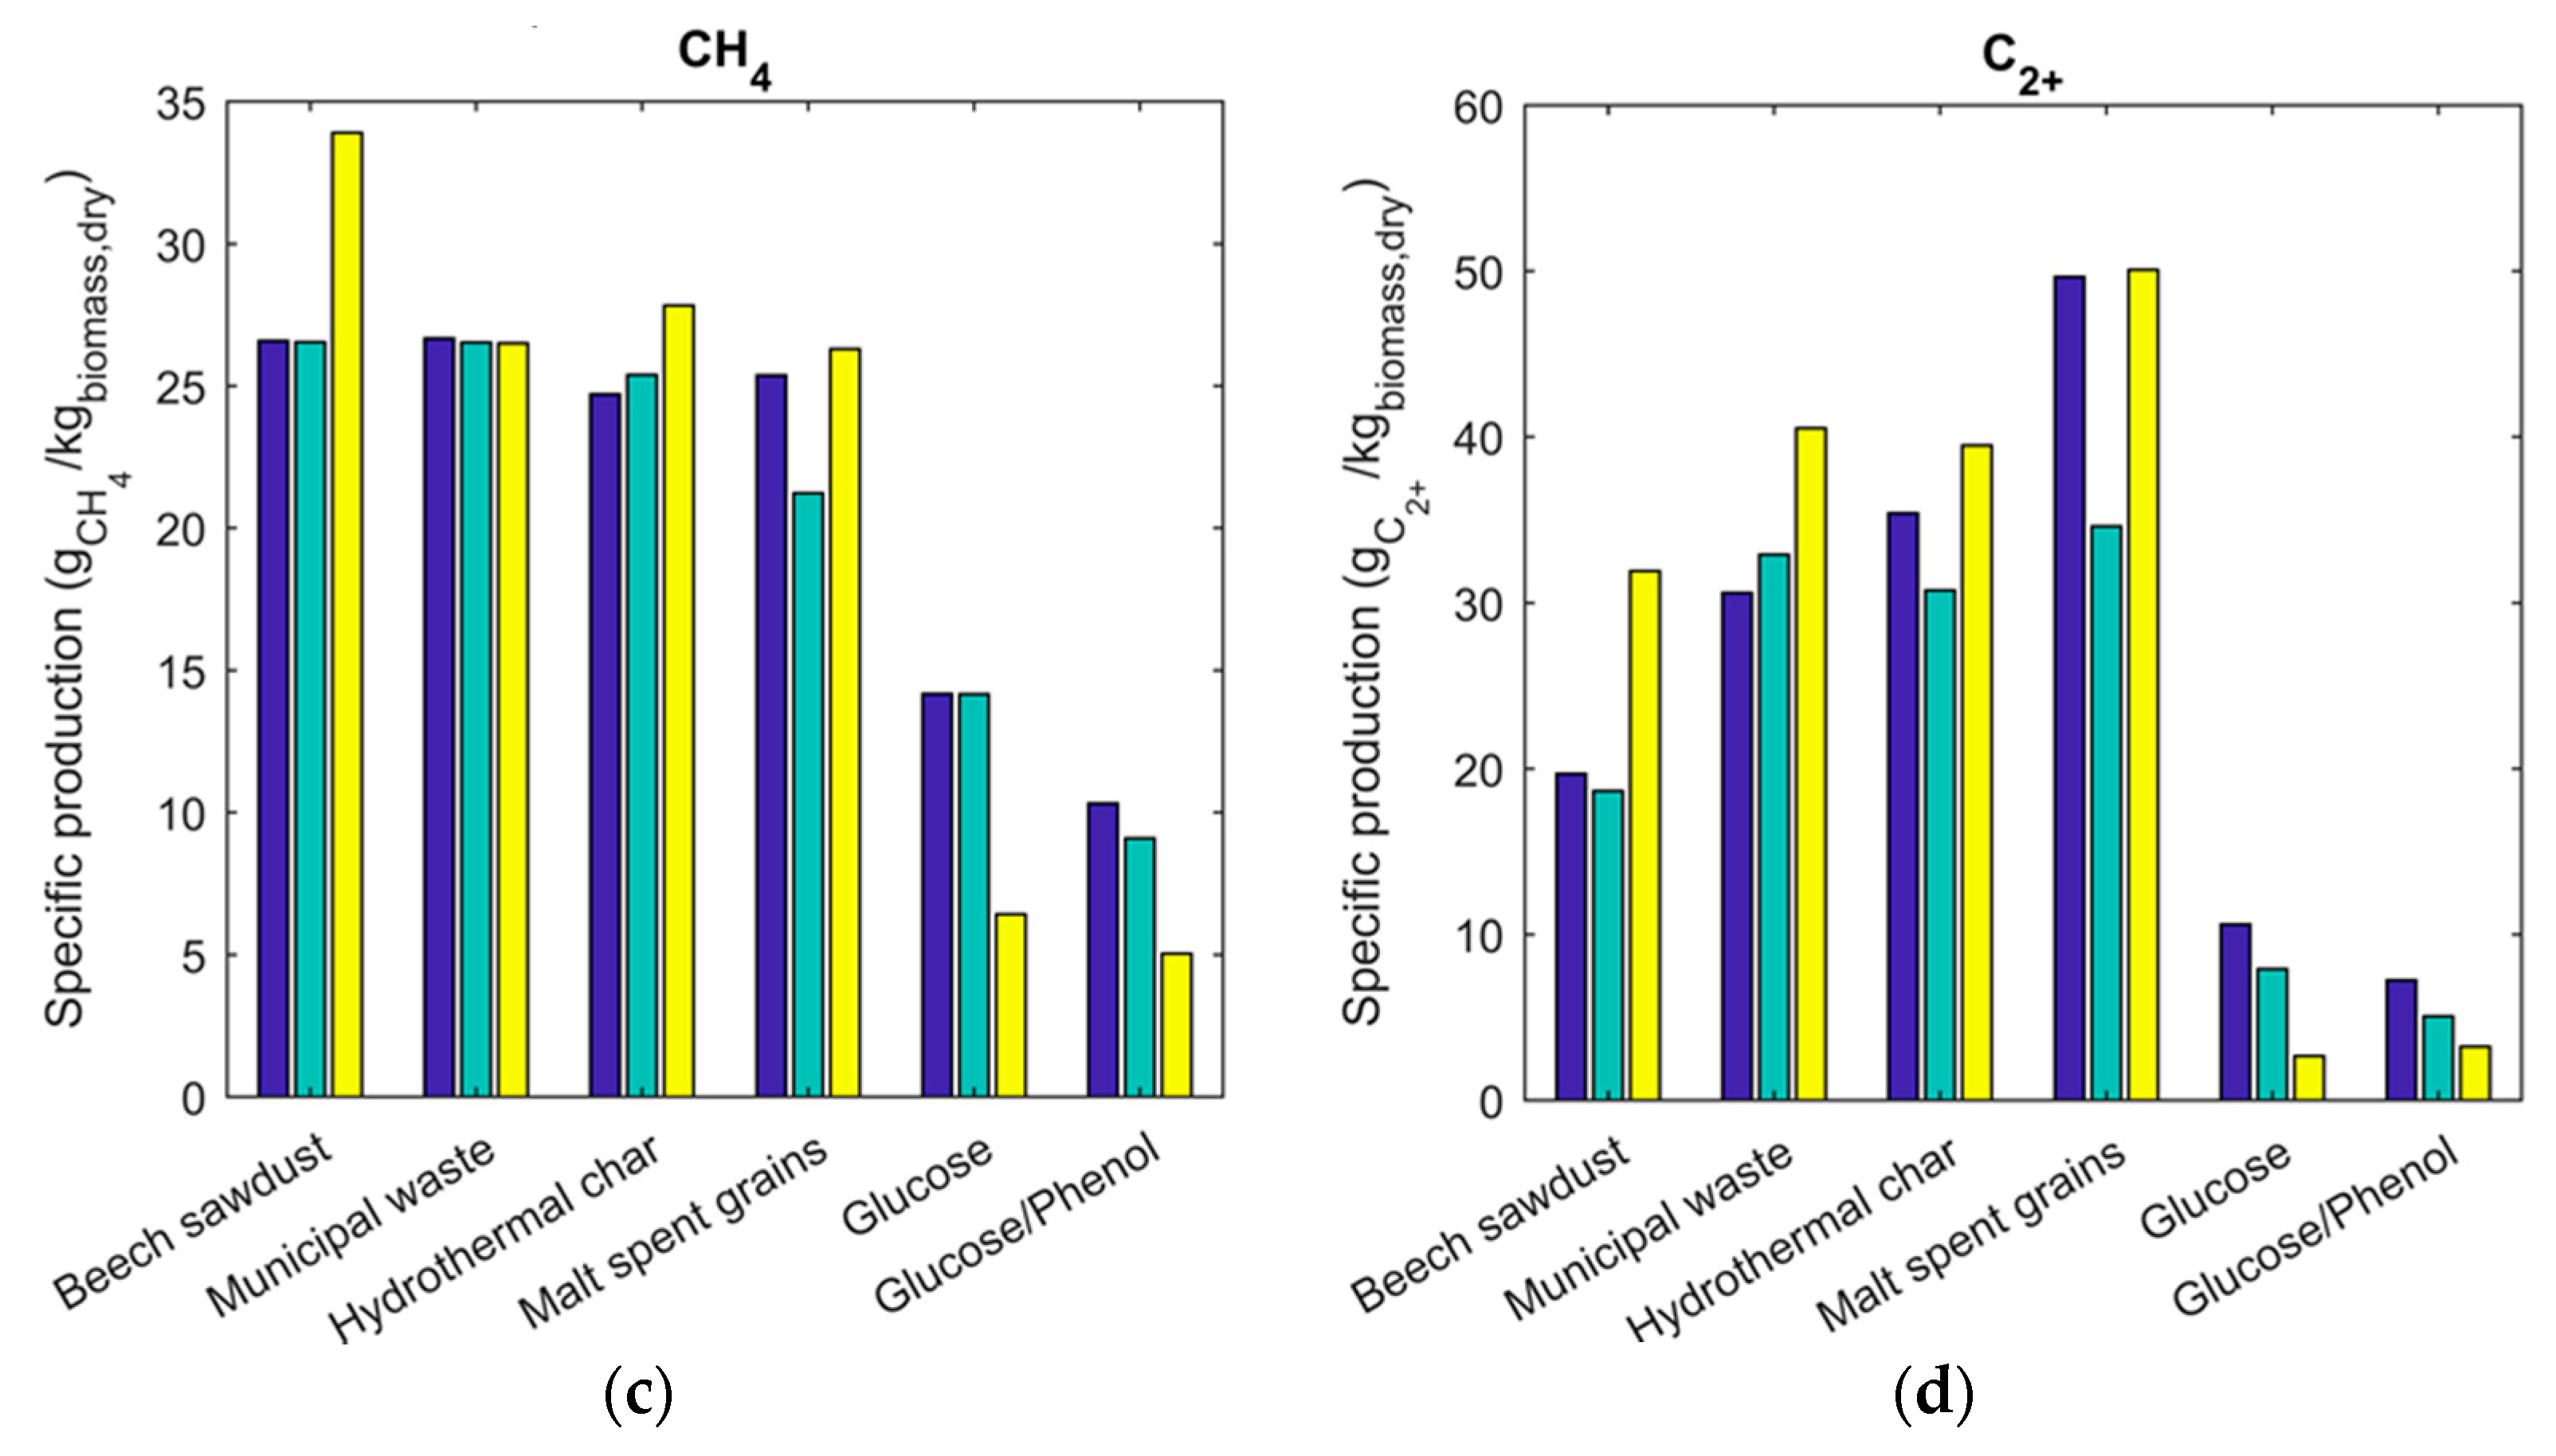
Figure 3.
(a) Higher heating value of the produced gas; (b) Energy recovery in the gas phase for the considered biomasses and model compounds.
Figure 3.
(a) Higher heating value of the produced gas; (b) Energy recovery in the gas phase for the considered biomasses and model compounds.
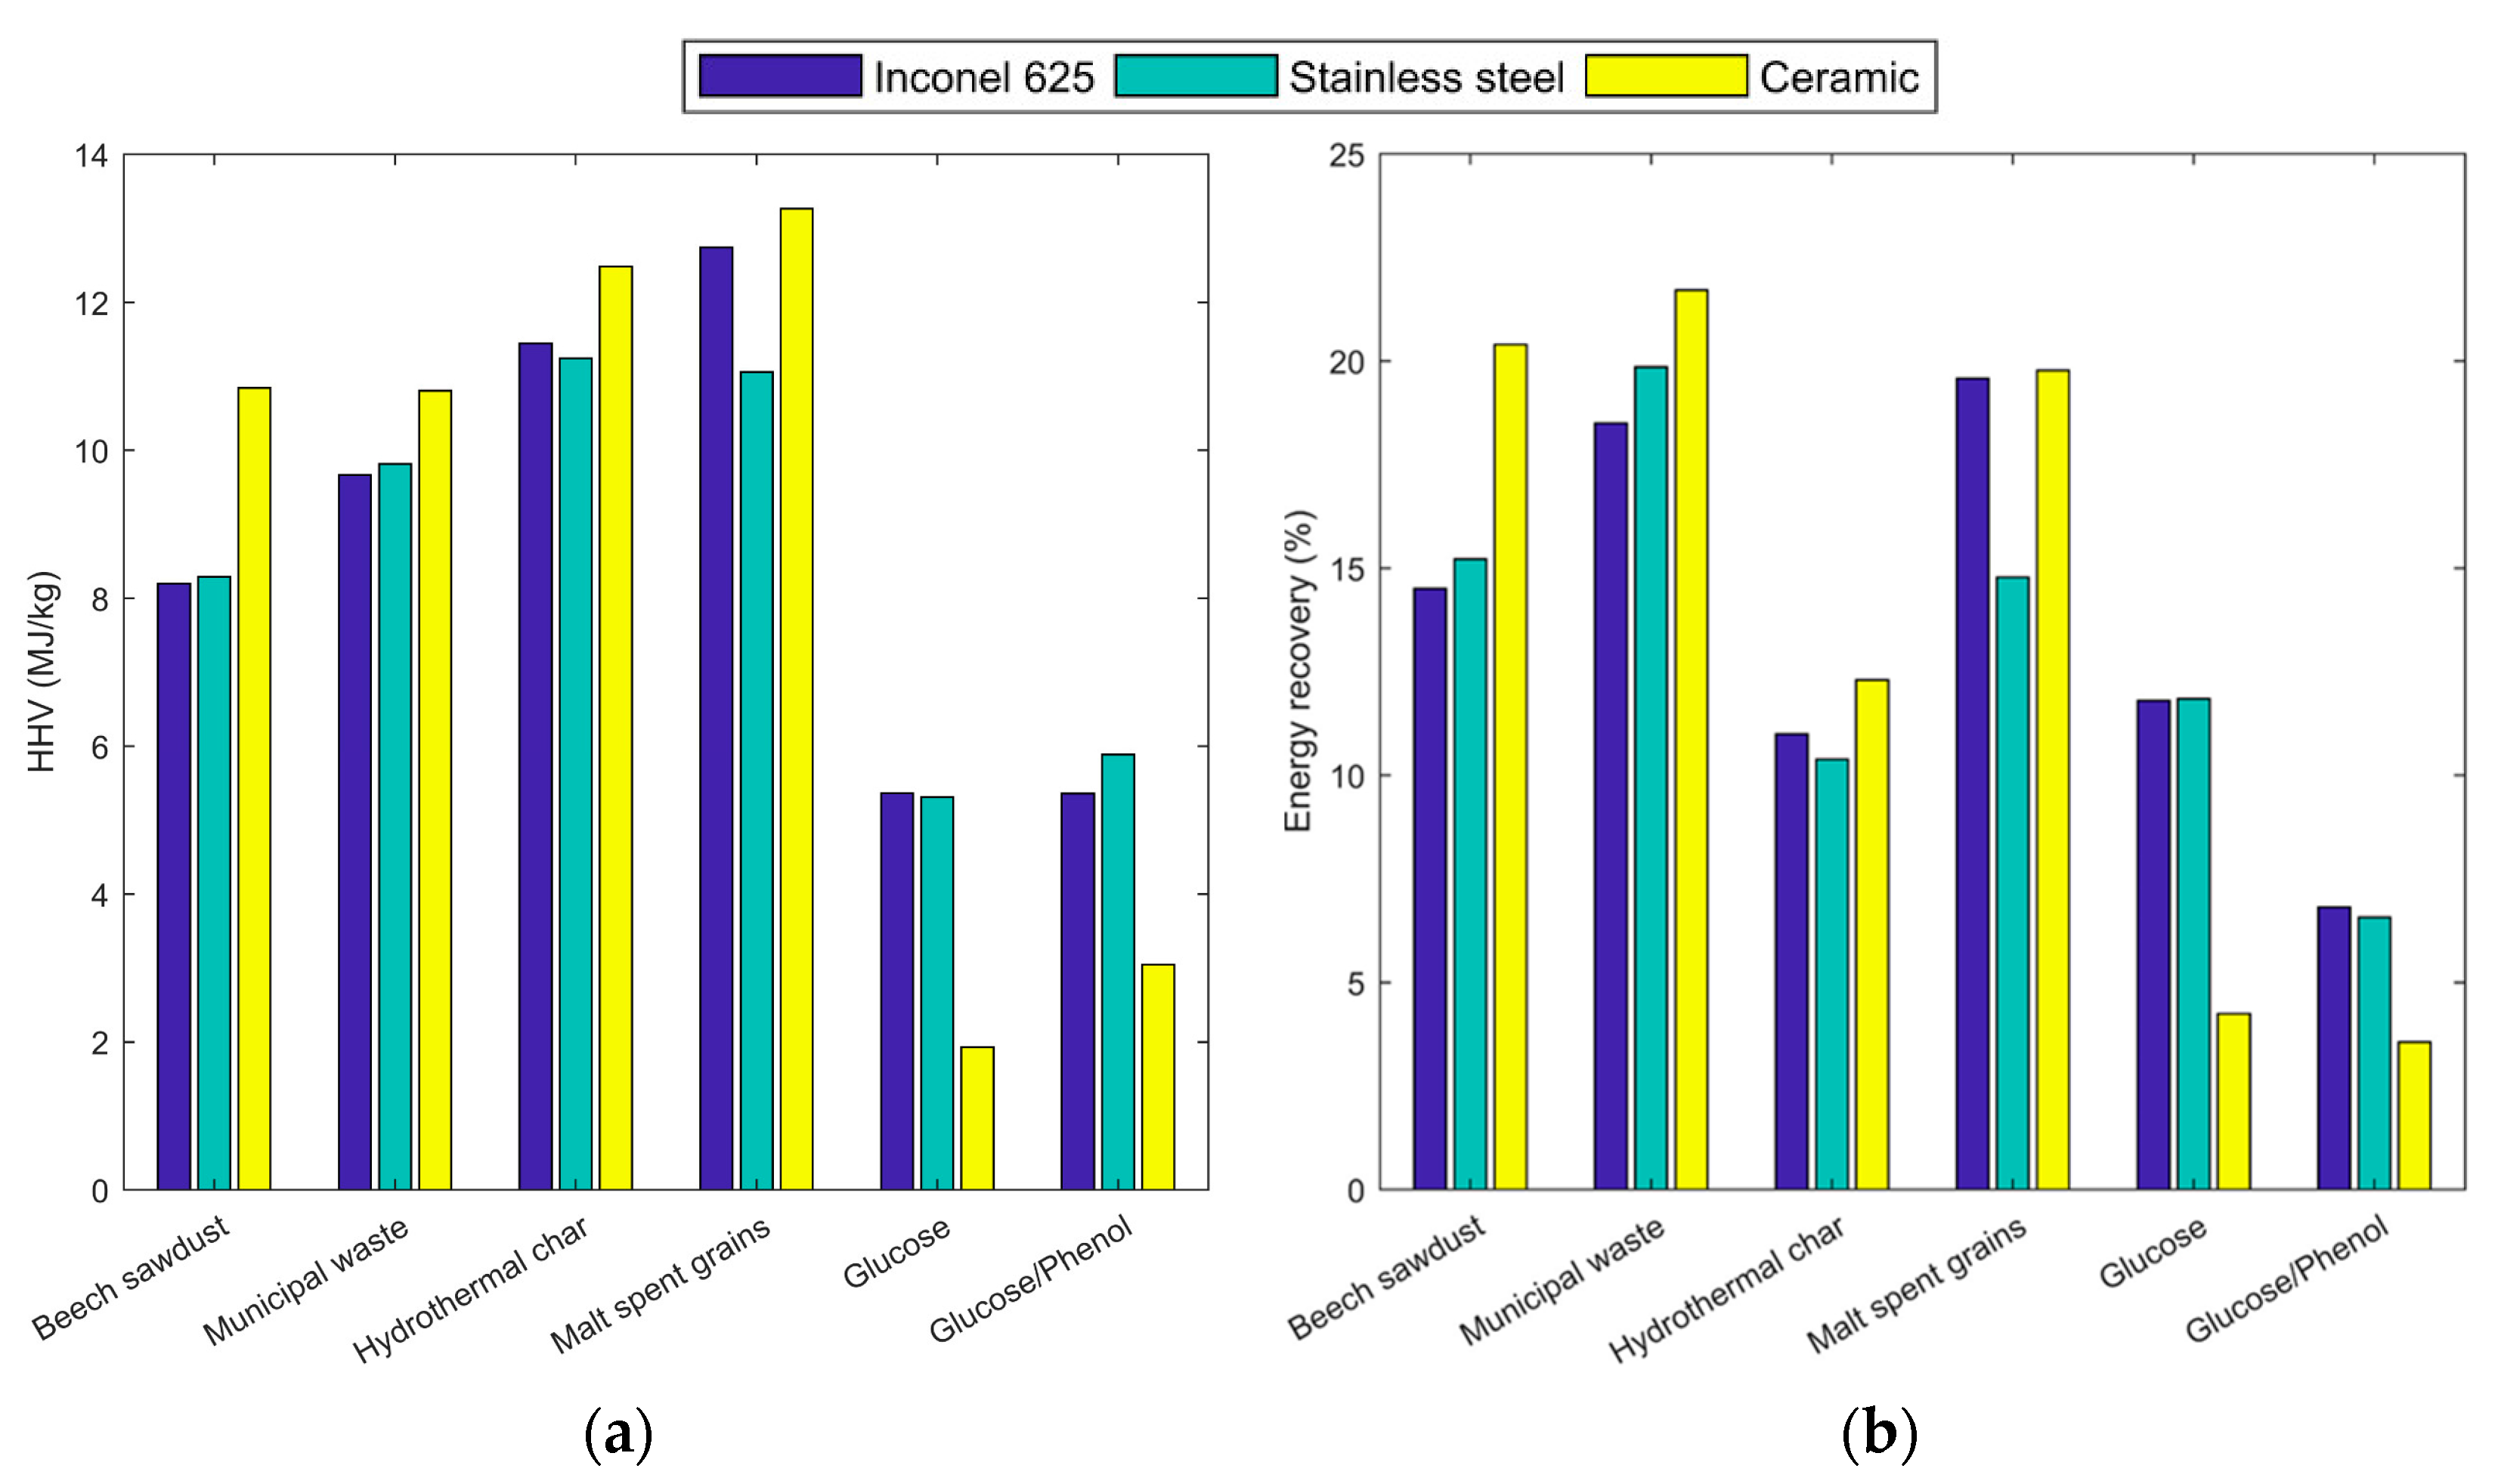
Figure 4.
Total organic carbon (TOC) of the liquid phase from the SCWG of the considered samples.
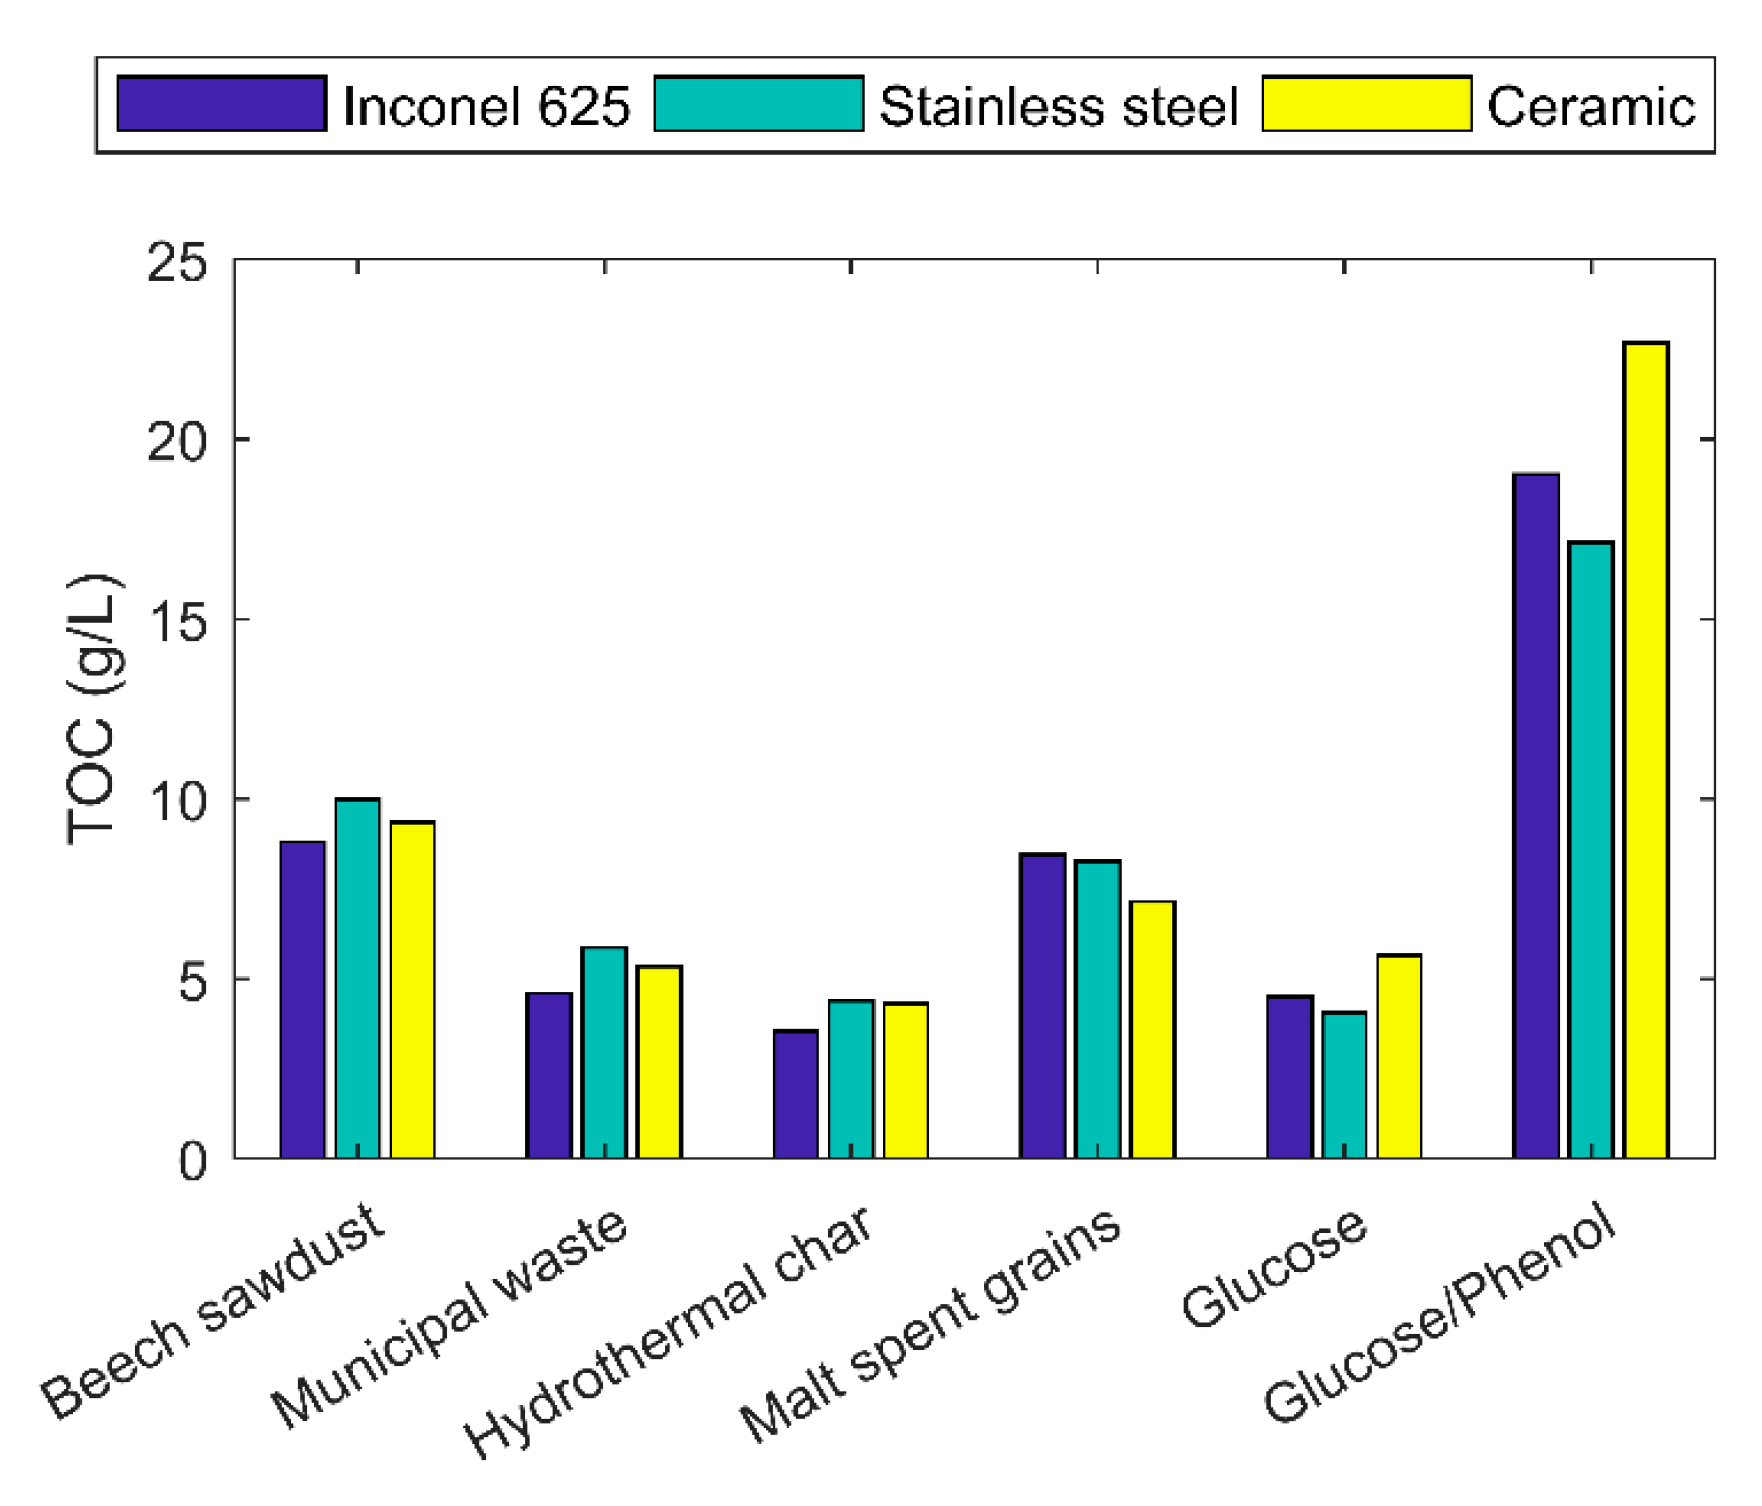
Figure 5.
Scanning electron microscopy (SEM) image of the inner part of the ceramic inlay before and after the experimental campaign: (a) surface before the campaign (1000×); (b) surface after the campaign, black area (1000×); (c) surface after the campaign, white area (1000×); and (d) surface after the campaign, black area (3000×).

Figure 6.
SEM images and Energy Dispersive X-ray Spectrometry (EDXS) spectra of the reacted surfaces: (a) Alumina reactor before reactions; (b) Alumina reactor after reaction.
Figure 6.
SEM images and Energy Dispersive X-ray Spectrometry (EDXS) spectra of the reacted surfaces: (a) Alumina reactor before reactions; (b) Alumina reactor after reaction.
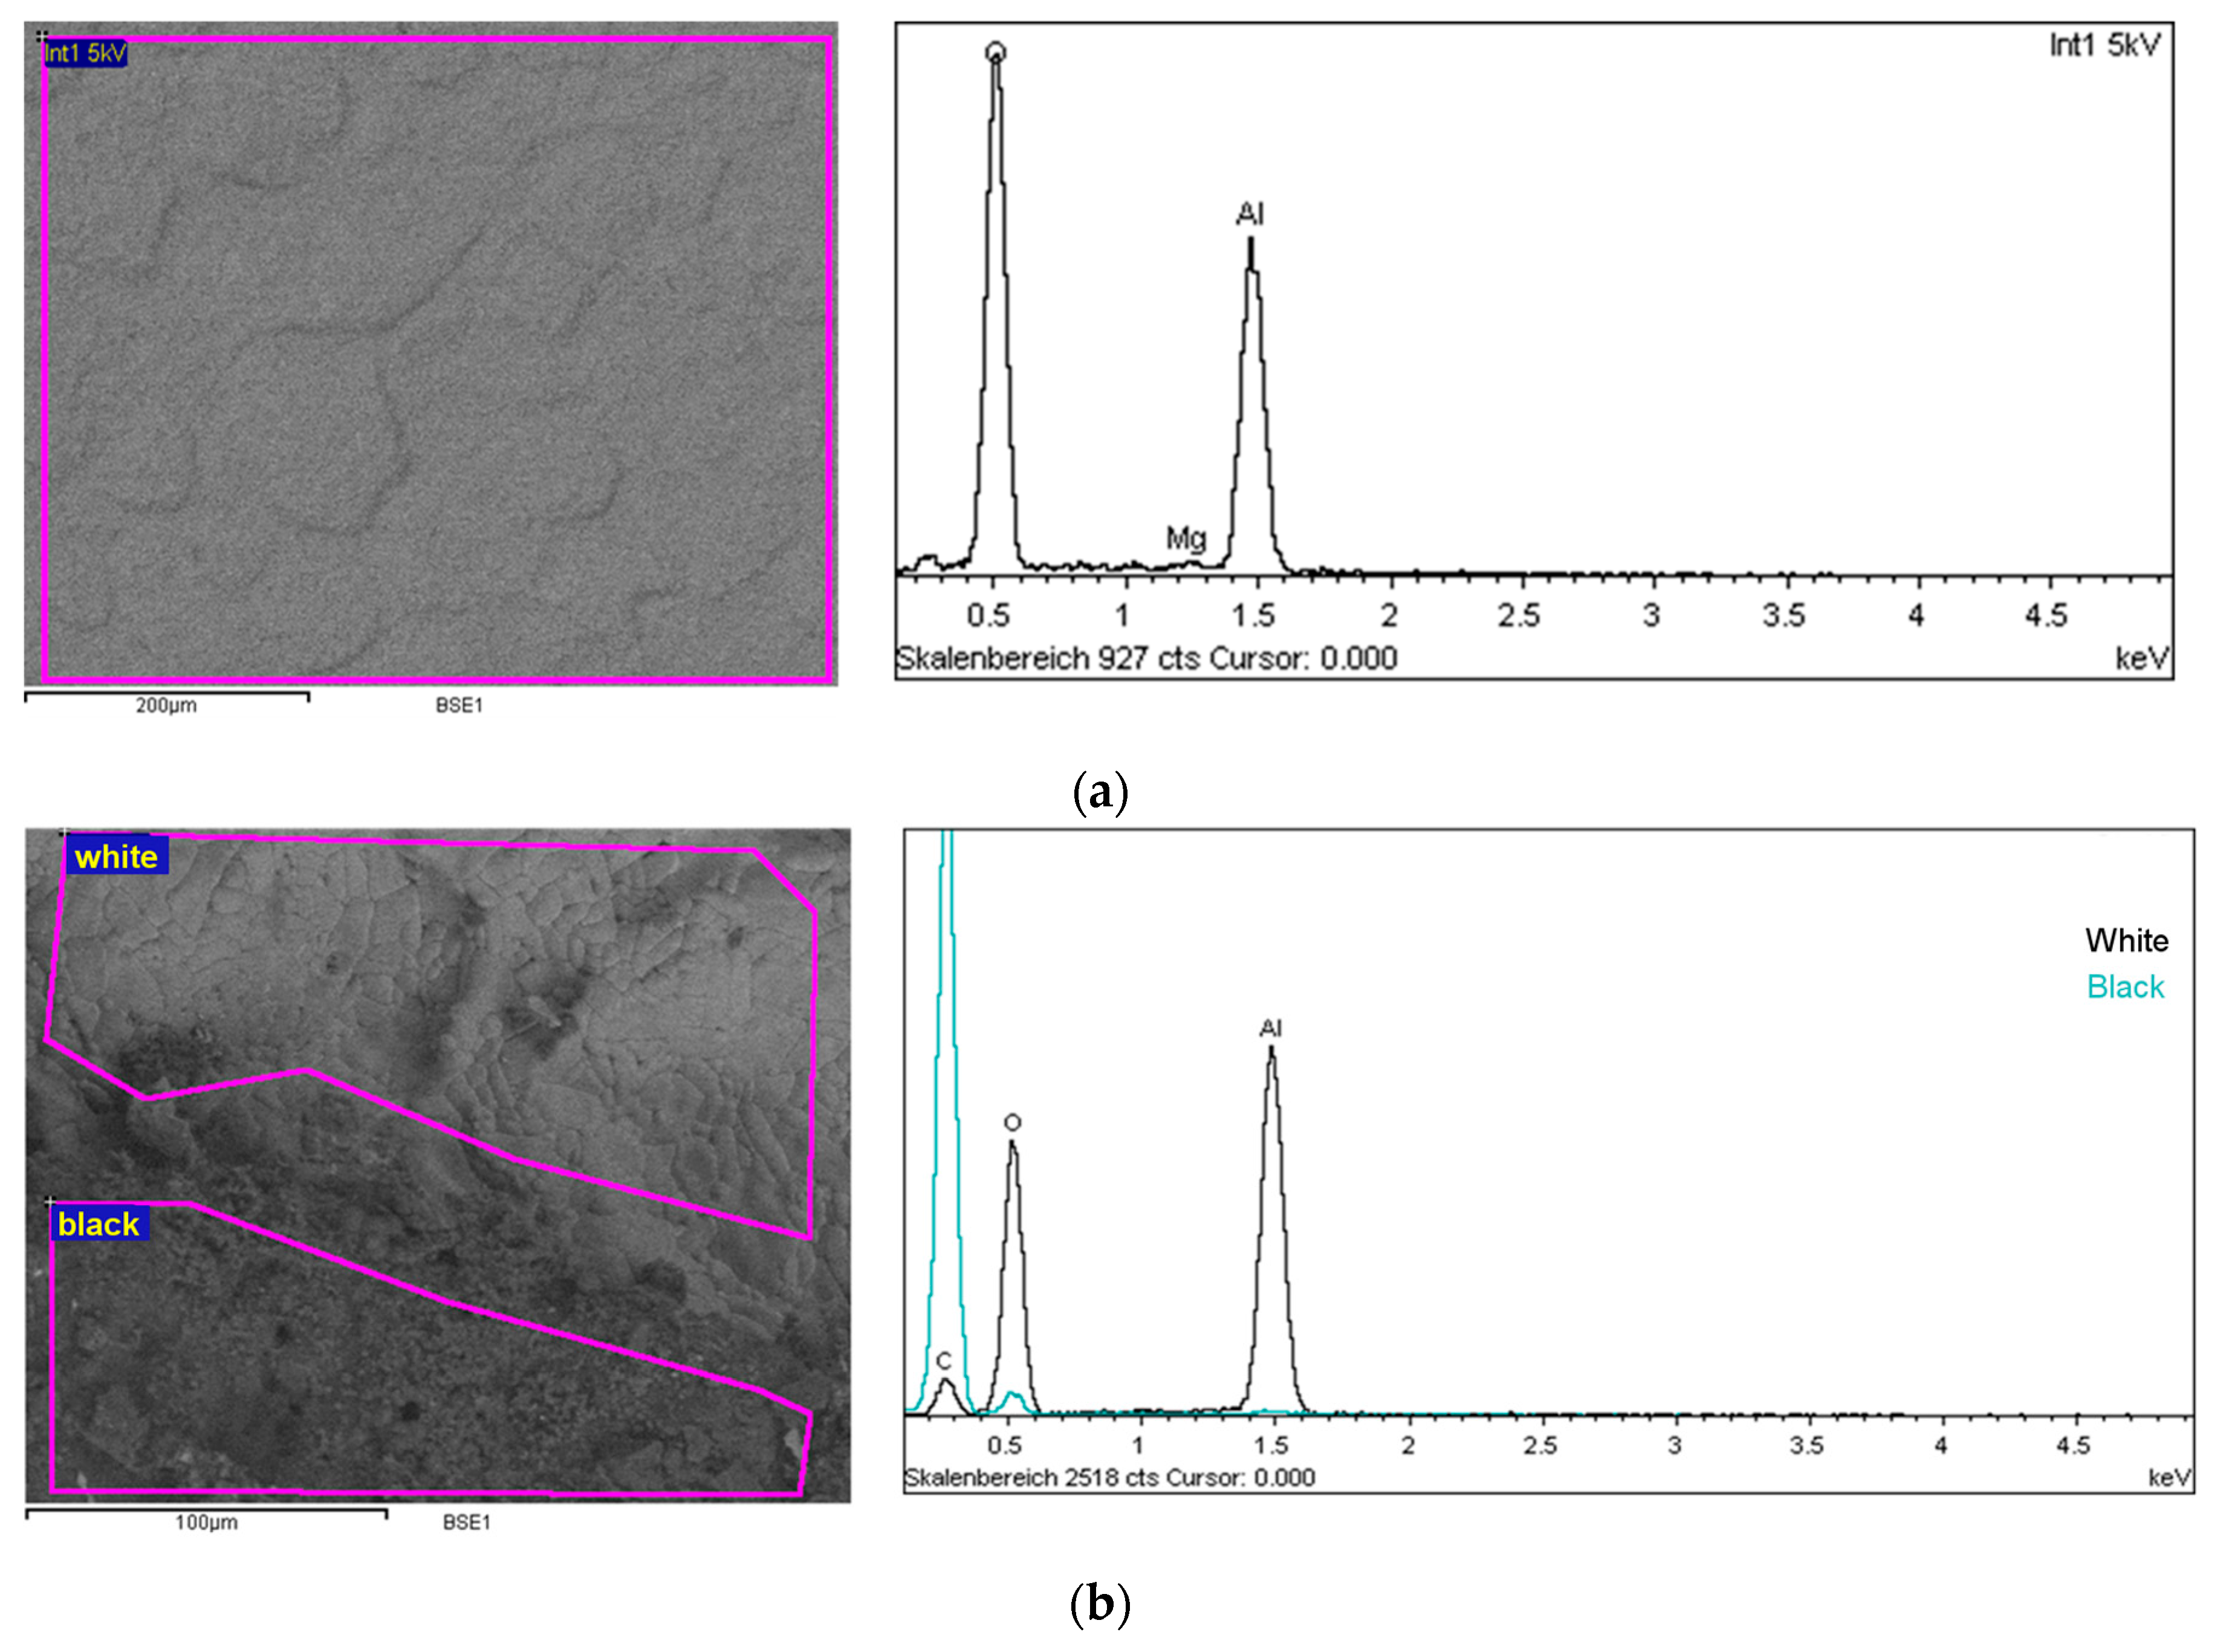
Figure 7.
Schematic representation of the ceramic autoclave utilized in the present study.


Table 1.
Elemental analysis and higher heating value (HHV) of the feedstock. HHVs were calculated by means of the Dulong-Petit correlation (see Section 3).
Table 1.
Elemental analysis and higher heating value (HHV) of the feedstock. HHVs were calculated by means of the Dulong-Petit correlation (see Section 3).
| Feedstock | Elemental Composition (wt %) | HHV (MJ/kg) | ||||
|---|---|---|---|---|---|---|
| C | H | N | S | O | ||
| Beech sawdust | 48.93 | 6.17 | 1.03 | 0.10 | 40.61 | 18.2 |
| Municipal waste | 45.21 | 6.61 | 2.06 | 0.22 | 41.83 | 17.3 |
| Hydrothermal char | 69.68 | 6.82 | 1.06 | 0.10 | 19.71 | 29.9 |
| Malt spent grains | 49.72 | 6.94 | 4.33 | 0.30 | 34.25 | 20.7 |
| Glucose | 40.00 | 6.67 | − | − | 53.33 | 13.5 |
| Glucose + phenol | 45.43 | 6.62 | − | − | 47.95 | 16.3 |
Table 2.
Yields of gas, solids, and liquids for the performed experimental tests. Values are expressed in wt %. Liquid is calculated by difference. Experimental error: gas: ±0.4; solid: ±2.0; liquid: ±1.5.
Table 2.
Yields of gas, solids, and liquids for the performed experimental tests. Values are expressed in wt %. Liquid is calculated by difference. Experimental error: gas: ±0.4; solid: ±2.0; liquid: ±1.5.
| Feedstock | Reactor | Gas | Solid | Liquid |
|---|---|---|---|---|
| Beech sawdust | Inconel | 32.1 | 26.1 | 41.8 |
| Stainless steel | 33.3 | 22.0 | 44.7 | |
| Ceramics | 34.2 | 21.3 | 44.5 | |
| Municipal waste | Inconel | 33.1 | 25.4 | 41.5 |
| Stainless steel | 35.0 | 23.5 | 41.5 | |
| Ceramics | 34.8 | 20.5 | 44.7 | |
| Hydrothermal char | Inconel | 28.7 | 49.3 | 22.0 |
| Stainless steel | 27.6 | 48.1 | 24.2 | |
| Ceramics | 29.5 | 47.8 | 22.7 | |
| Malt spent grains | Inconel | 31.8 | 18.9 | 49.3 |
| Stainless steel | 27.7 | 18.7 | 53.7 | |
| Ceramics | 30.9 | 23.1 | 46.1 | |
| Glucose | Inconel | 29.8 | 28.8 | 41.3 |
| Stainless steel | 30.2 | 38.5 | 31.3 | |
| Ceramics | 29.8 | 23.0 | 47.2 | |
| Glucose + phenol | Inconel | 20.7 | 19.5 | 59.8 |
| Stainless steel | 18.2 | 23.8 | 58.0 | |
| Ceramics | 19.0 | 19.9 | 61.0 |
Table 3.
Equilibrium products for the SCWG of the considered feedstock at 15%, 400 °C, and 30 MPa. Values are in gGAS/kgFEEDSTOCK.
Table 3.
Equilibrium products for the SCWG of the considered feedstock at 15%, 400 °C, and 30 MPa. Values are in gGAS/kgFEEDSTOCK.
| Feedstock | Equilibrium Prod. (g/kg) | Measured CGE (wt %) | ||
|---|---|---|---|---|
| H2 | CH4 | CO2 | ||
| Beech sawdust | 2.2 | 355.0 | 957.3 | 22.6–25.8 |
| Municipal waste | 2.2 | 338.9 | 872.0 | 26.4–28.5 |
| Hydrothermal char | 2.6 | 561.6 | 1180.0 | 14.9–16.5 |
| Malt spent grains | 2.4 | 398.5 | 892.0 | 20.9–25.2 |
| Glucose | 2.0 | 262.6 | 811.6 | 21.4–23.3 |
| Glucose + phenol | 2.2 | 311.0 | 883.4 | 12.3–14.3 |
Table 4.
Elemental composition (wt %) of the alumina surfaces obtained from EDXS analysis and referred to the surfaces in Figure 6.
Table 4.
Elemental composition (wt %) of the alumina surfaces obtained from EDXS analysis and referred to the surfaces in Figure 6.
| Surface of the Reactor | C | O | Al | Mg |
|---|---|---|---|---|
| Unreacted surface | - | 54.4 | 45.1 | 0.5 |
| Reacted surface (black) | 89.7 | 10.0 | 0.3 | - |
| Reacted surface (white) | 13.4 | 48.4 | 38.2 | - |
© 2017 by the authors. Licensee MDPI, Basel, Switzerland. This article is an open access article distributed under the terms and conditions of the Creative Commons Attribution (CC BY) license (http://creativecommons.org/licenses/by/4.0/).
Share and Cite
MDPI and ACS Style
Castello, D.; Rolli, B.; Kruse, A.; Fiori, L. Supercritical Water Gasification of Biomass in a Ceramic Reactor: Long-Time Batch Experiments. Energies 2017, 10, 1734. https://doi.org/10.3390/en10111734
AMA Style
Castello D, Rolli B, Kruse A, Fiori L. Supercritical Water Gasification of Biomass in a Ceramic Reactor: Long-Time Batch Experiments. Energies. 2017; 10(11):1734. https://doi.org/10.3390/en10111734
Chicago/Turabian StyleCastello, Daniele, Birgit Rolli, Andrea Kruse, and Luca Fiori. 2017. "Supercritical Water Gasification of Biomass in a Ceramic Reactor: Long-Time Batch Experiments" Energies 10, no. 11: 1734. https://doi.org/10.3390/en10111734
Note that from the first issue of 2016, this journal uses article numbers instead of page numbers. See further details here.