Article

The Effects of Additives on the Dehydrogenation of Amorphous Manganese Borohydride and Its Crystalline Form after Solvent Filtration/Extraction

by
Robert A. Varin
1,*,
Deepak K. Mattar
1,
Marek Polanski
2,
Amirreza Shirani Bidabadi
1 and
Leszek Stobinski
3
1
Department of Mechanical and Mechatronics Engineering and Waterloo Institute for Nanotechnology, University of Waterloo, 200 University Ave. W., Waterloo, ON N2L 3G1, Canada
2
Faculty of New Technologies and Chemistry, Military University of Technology, 2 Kaliskiego Str., 00-908 Warsaw, Poland
3
Faculty of Materials Science and Engineering, Graphene Laboratory, Warsaw University of Technology, Warynskiego 1, 00-645 Warsaw, Poland
*
Author to whom correspondence should be addressed.
Energies 2017, 10(11), 1741; https://doi.org/10.3390/en10111741
Submission received: 4 October 2017 / Revised: 24 October 2017 / Accepted: 27 October 2017 / Published: 30 October 2017
(This article belongs to the Section D: Energy Storage and Application)

Abstract

:
A non-stoichiometric, amorphous a-Mn(BH4)(2x) hydride, accompanied by a NaCl-type salt, was mechanochemically synthesized from the additive-free mixture of (2NaBH4 + MnCl2), as well as from the mixtures containing the additives of ultrafine filamentary carbonyl nickel (Ni), graphene, and LiNH2. It is shown that both graphene and LiNH2 suppressed the release of B2H6 during thermal gas desorption, with the LiNH2 additive being the most effective suppressor of B2H6. During solvent filtration and extraction of additive-free, as well as additive-bearing, (Ni and graphene) samples from diethyl ether (Et2O), the amorphous a-Mn(BH4)(2x) hydride transformed into a crystalline c-Mn(BH4)2 hydride, exhibiting a microstructure containing nanosize crystallites (grains). In contrast, the LiNH2 additive most likely suppressed the formation of a crystalline c-Mn(BH4)2 hydride during solvent filtration/extraction. In a differential scanning calorimeter (DSC), the thermal decomposition peaks of both amorphous a-Mn(BH4)(2x) and crystalline c-Mn(BH4)2 were endothermic for the additive-free samples, as well as the samples with added graphene and Ni. The samples with LiNH2 exhibited an exothermic DSC decomposition peak.

1. Introduction

One of the major challenges facing the world in this century is a transition from a fossil fuels-based economy to one based on renewable, environmentally-friendly resources, such as hydrogen [1,2,3,4]. During this transformation, the widespread adoption and usage of fuel cells, in which hydrogen gas (H2) in contact with oxygen (O2) is converted into electrical energy, must be necessary to realize a world hydrogen economy. Effective H2 generation and storage are important considerations for the hydrogen economy. The most attractive—albeit the most challenging—method of storing hydrogen is in solid hydrides [3,4,5]. Unfortunately, for the automotive sector, solid-state H2 storage in hydrides has serious constraints, the most important of which is the inability to meet the need for “on board” rehydrogenation [3]. So far, this and other very serious constraints preclude a full implementation of solid state H2 storage in the automotive sector [5].
However, some commercial market applications for solid-state hydrogen storage systems may not critically require “on board” rehydrogenation. Such H2 storage/generation systems can utilize disposable H2 cartridges of various sizes that could be regenerated “off board” after being dehydrogenated. In our recent review [5], we listed such possible applications as auxiliary devices in air transportation, drones, off-road vehicles (forklifts, street sweepers, etc.), stationary auxiliary power systems, submarines, coastal and international shipping, locomotives, lawn mowers, portable electronic devices such as smartphones, long duration and low power military devices (e.g., WFC20 soldier power system: http://www.ardica.com), and bulk hydrogen storage, among many others.
In the recent past, we have studied composite hydride systems based on crystalline manganese borohydride (Mn(BH4)2), whose crystallographic structure was first identified by Černý et al. [6]. Crystalline c-Mn(BH4)2 can be effectively synthesized by a mechanochemical activation synthesis (MCAS), using two reactants, LiBH4 and MnCl2 [3,4,5,6,7,8,9,10]. Crystalline c-Mn(BH4)2 is capable of generating hydrogen (H2) at a low temperature range of 100–140 °C, accompanied by a small quantity of diborane gas (B2H6). The latter is very undesirable, since at a sufficient concentration, it can damage the Nafion membrane of a proton exchange membrane (PEM) fuel cell. Diborane must be largely eliminated during the thermal decomposition of Mn(BH4)2.
Recently, we have discovered quite a peculiar phase transformation, in which an originally non-stoichiometric, amorphous a-Mn(BH4)2-type hydride, accompanied by a NaCl-type by-product that was synthesized using a NaBH4 precursor, transformed into a crystalline c-Mn(BH4)2 hydride upon solvent filtration/extraction, which was carried out to remove the NaCl-type by-product [11]. This is in contrast to the LiBH4 precursor, which always forms crystalline c-Mn(BH4)2 [6,7,8,9,10]. Furthermore, more recently, Song et al. [12] reported that an addition of LiNH2 eliminated the release of diborane (B2H6) gas from the LiBH4/MnF2 mixture upon its thermal decomposition.
In this work, we explore the effects of non-metal and metal additives, such as graphene, lithium amide (LiNH2), and ultrafine filamentary carbonyl nickel (Ni), on the gas desorption rate, apparent activation energy of desorption, and suppression of dioborane (B2H6) gas release from an NaBH4/MnCl2 mixture after ball milling and its solvent filtration/extraction process.

2. Results

2.1. Amorphous a-Mn(BH4)2-Type Hydride after Mechanochemical Synthesis by Ball Milling (BM)

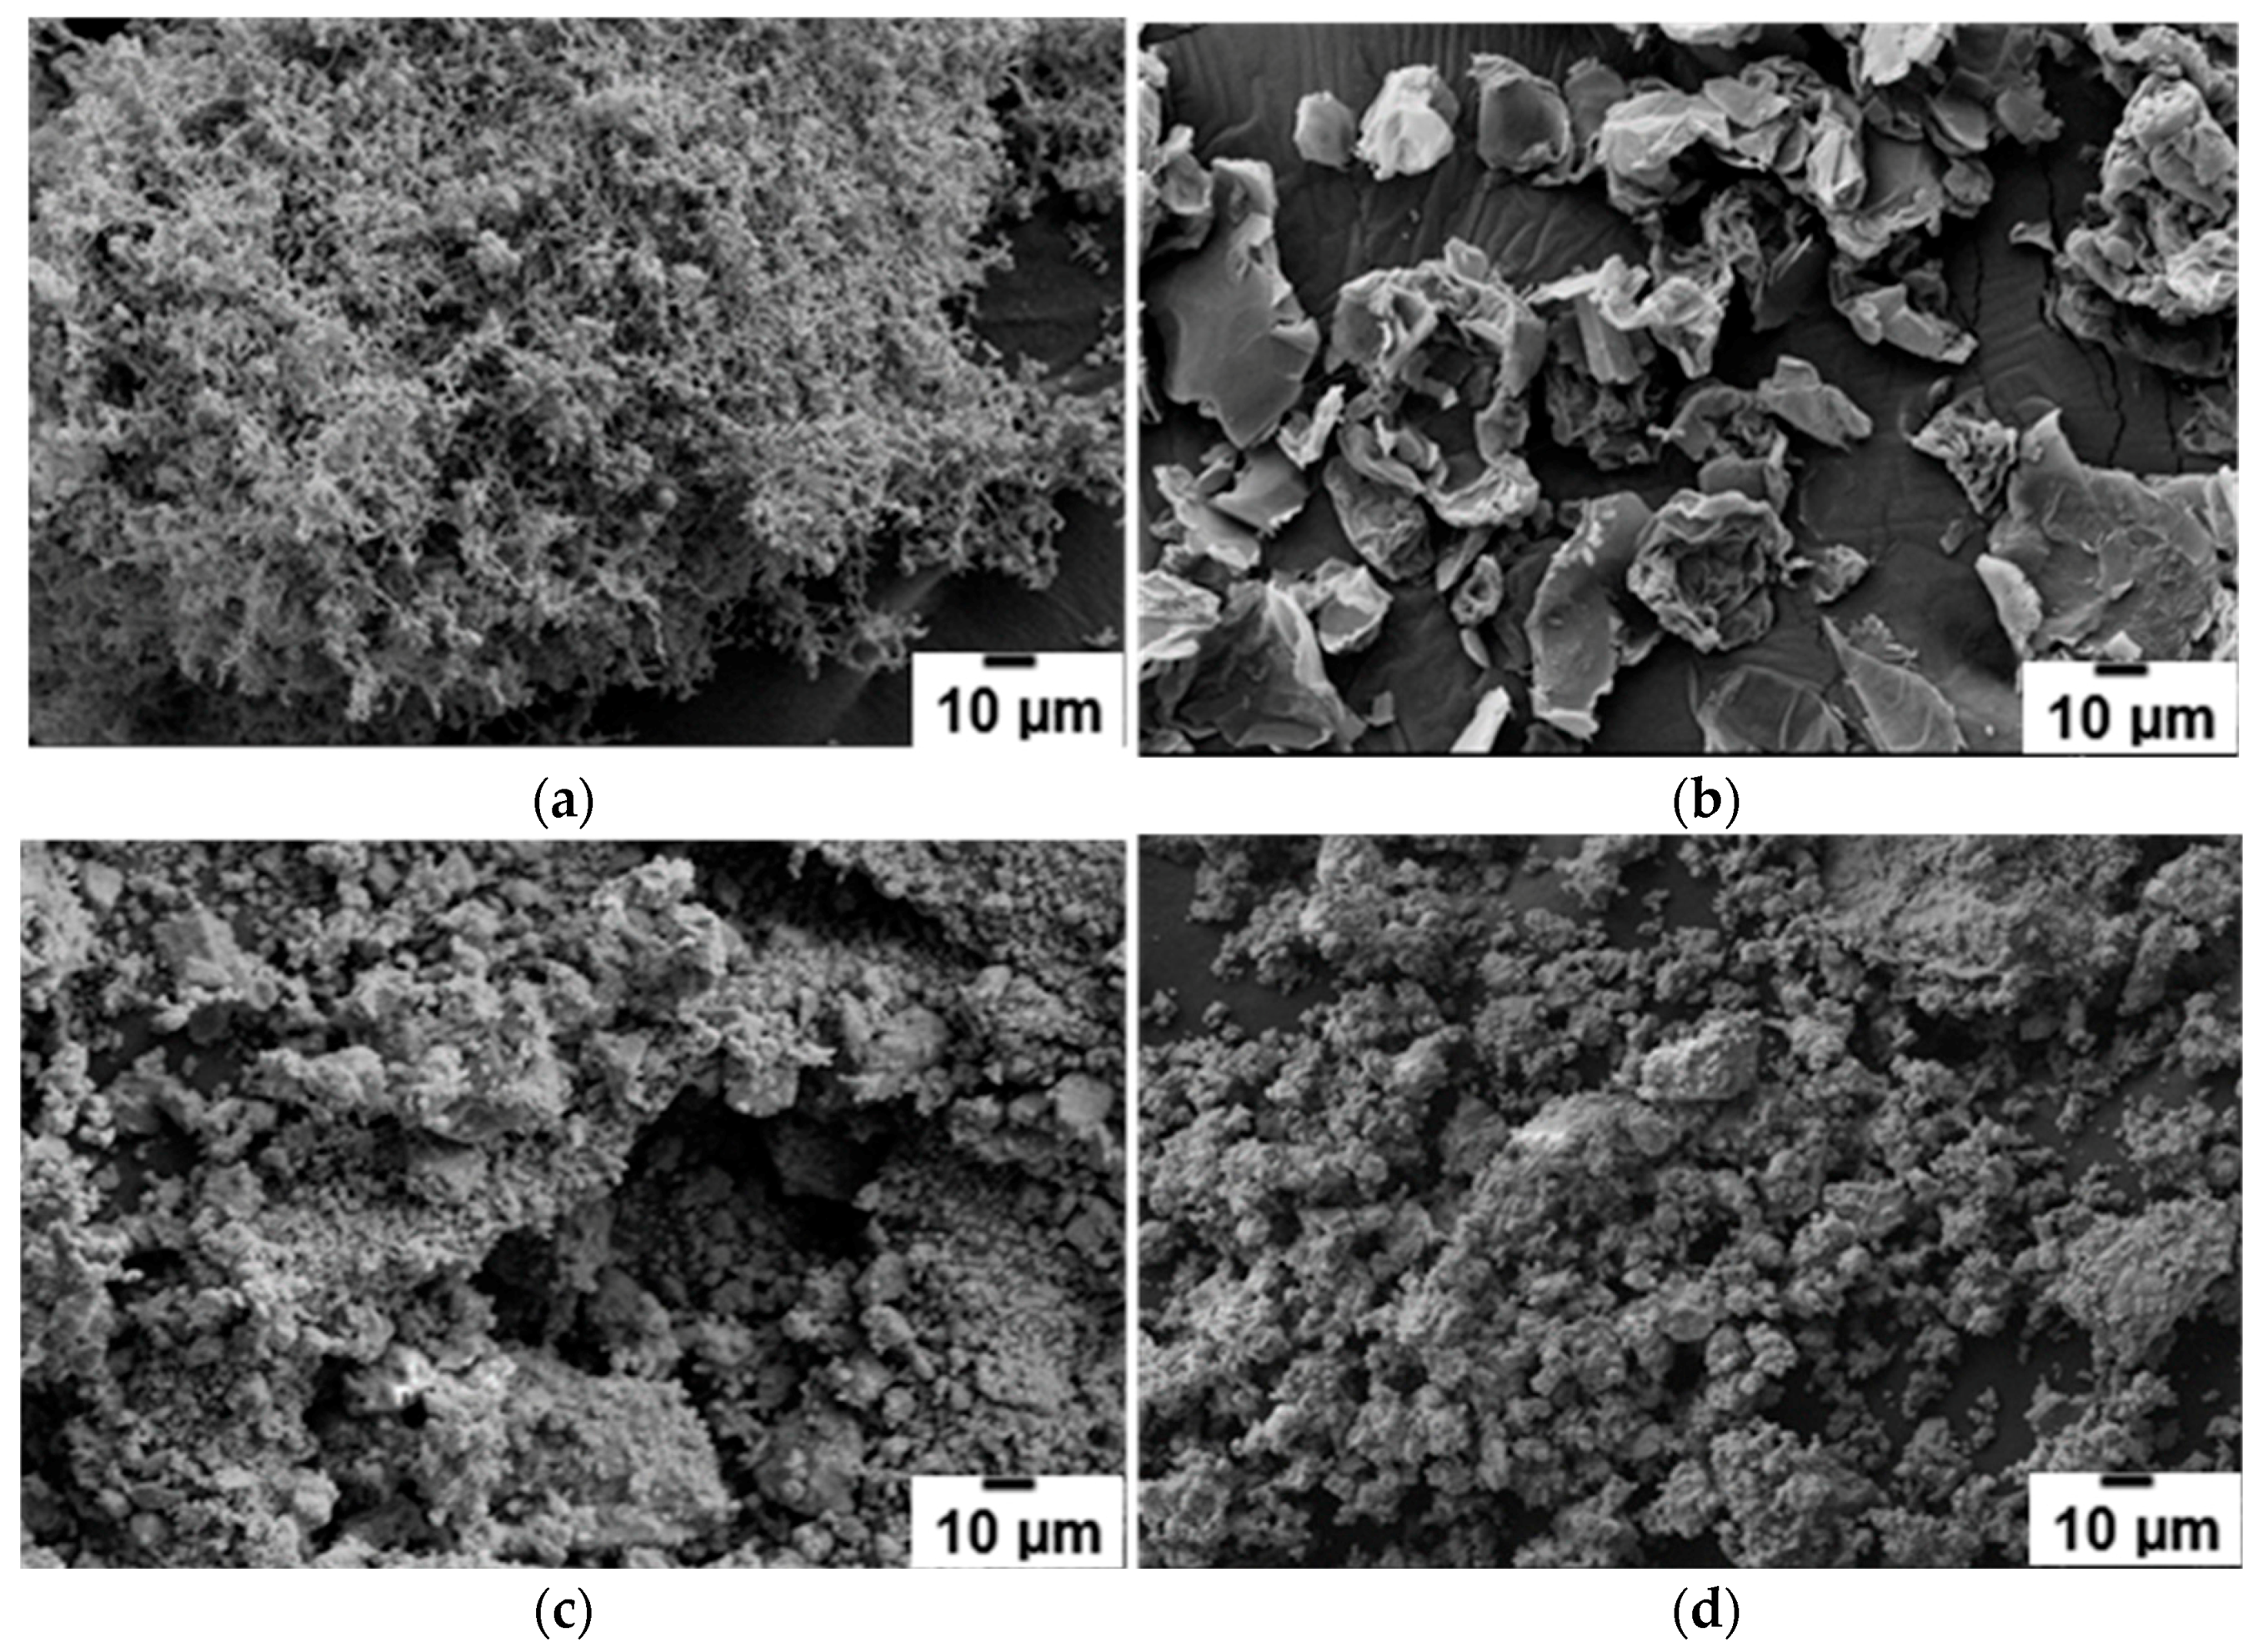
The SEM micrographs of the morphology of the as-received ultrafine filamentary Ni and graphene additives are shown in Figure 1a,b, respectively. The agglomerated and entangled filamentary nature of the Ni additive can be clearly seen in Figure 1a. However, plate-like graphene powder particles are rather well dispersed (Figure 1b). The SEM micrographs for the as-received NaBH4 and MnCl2 primary reactants were reported by Varin et al. [11] and are not shown here. Suffice it to say that both primary reactants are very coarse, with a globular morphology [11].
Changing the angular positions of one or two strong NdFeB magnets and altering the number of hard steel balls in a milling vial can control the milling energy in the magneto ball mill Uni-Ball-Mill 5 [3,7,8,9,10,13]. As recently reported by Parviz et al. [13], the quantity of milling energy, QTR(R) per unit mass·hour (kJ/gh), which was injected into and stored in a milled powder for each particular milling mode with a fixed ball-to-powder mass ratio, R, in the magneto ball mill Uni-Ball-Mill 5, can be calculated via a semi-empirical method. In the present work, we solely used the milling mode IMP68-4B-R132 for 0.5 and 1 h with the constant total milling energy input, QTR = 36.4 and 72.8 kJ/g, respectively (see Table 5 [13]).
Figure 1c,d show the evolution during ball milling of the powder morphology for the additive-free (2NaBH4 + MnCl2), ((2NaBH4 + MnCl2) + 5 wt. % graphene) and ((2NaBH4 + MnCl2) + 5 wt. % Ni) samples, respectively. A refinement of the initial powder mixture with some pronounced agglomerations can be seen, in comparison with the large-size of the as-received NaBH4 and MnCl2 particulates, already shown by Varin et al. [11]. However, it appears from Figure 1c that the entangled filamentary Ni morphology is preserved during ball milling to an extent, and does not disperse into individual, smaller particles of Ni as expected. Figure 1d suggests that the graphene additive is quite thoroughly and intimately milled with the reactants.
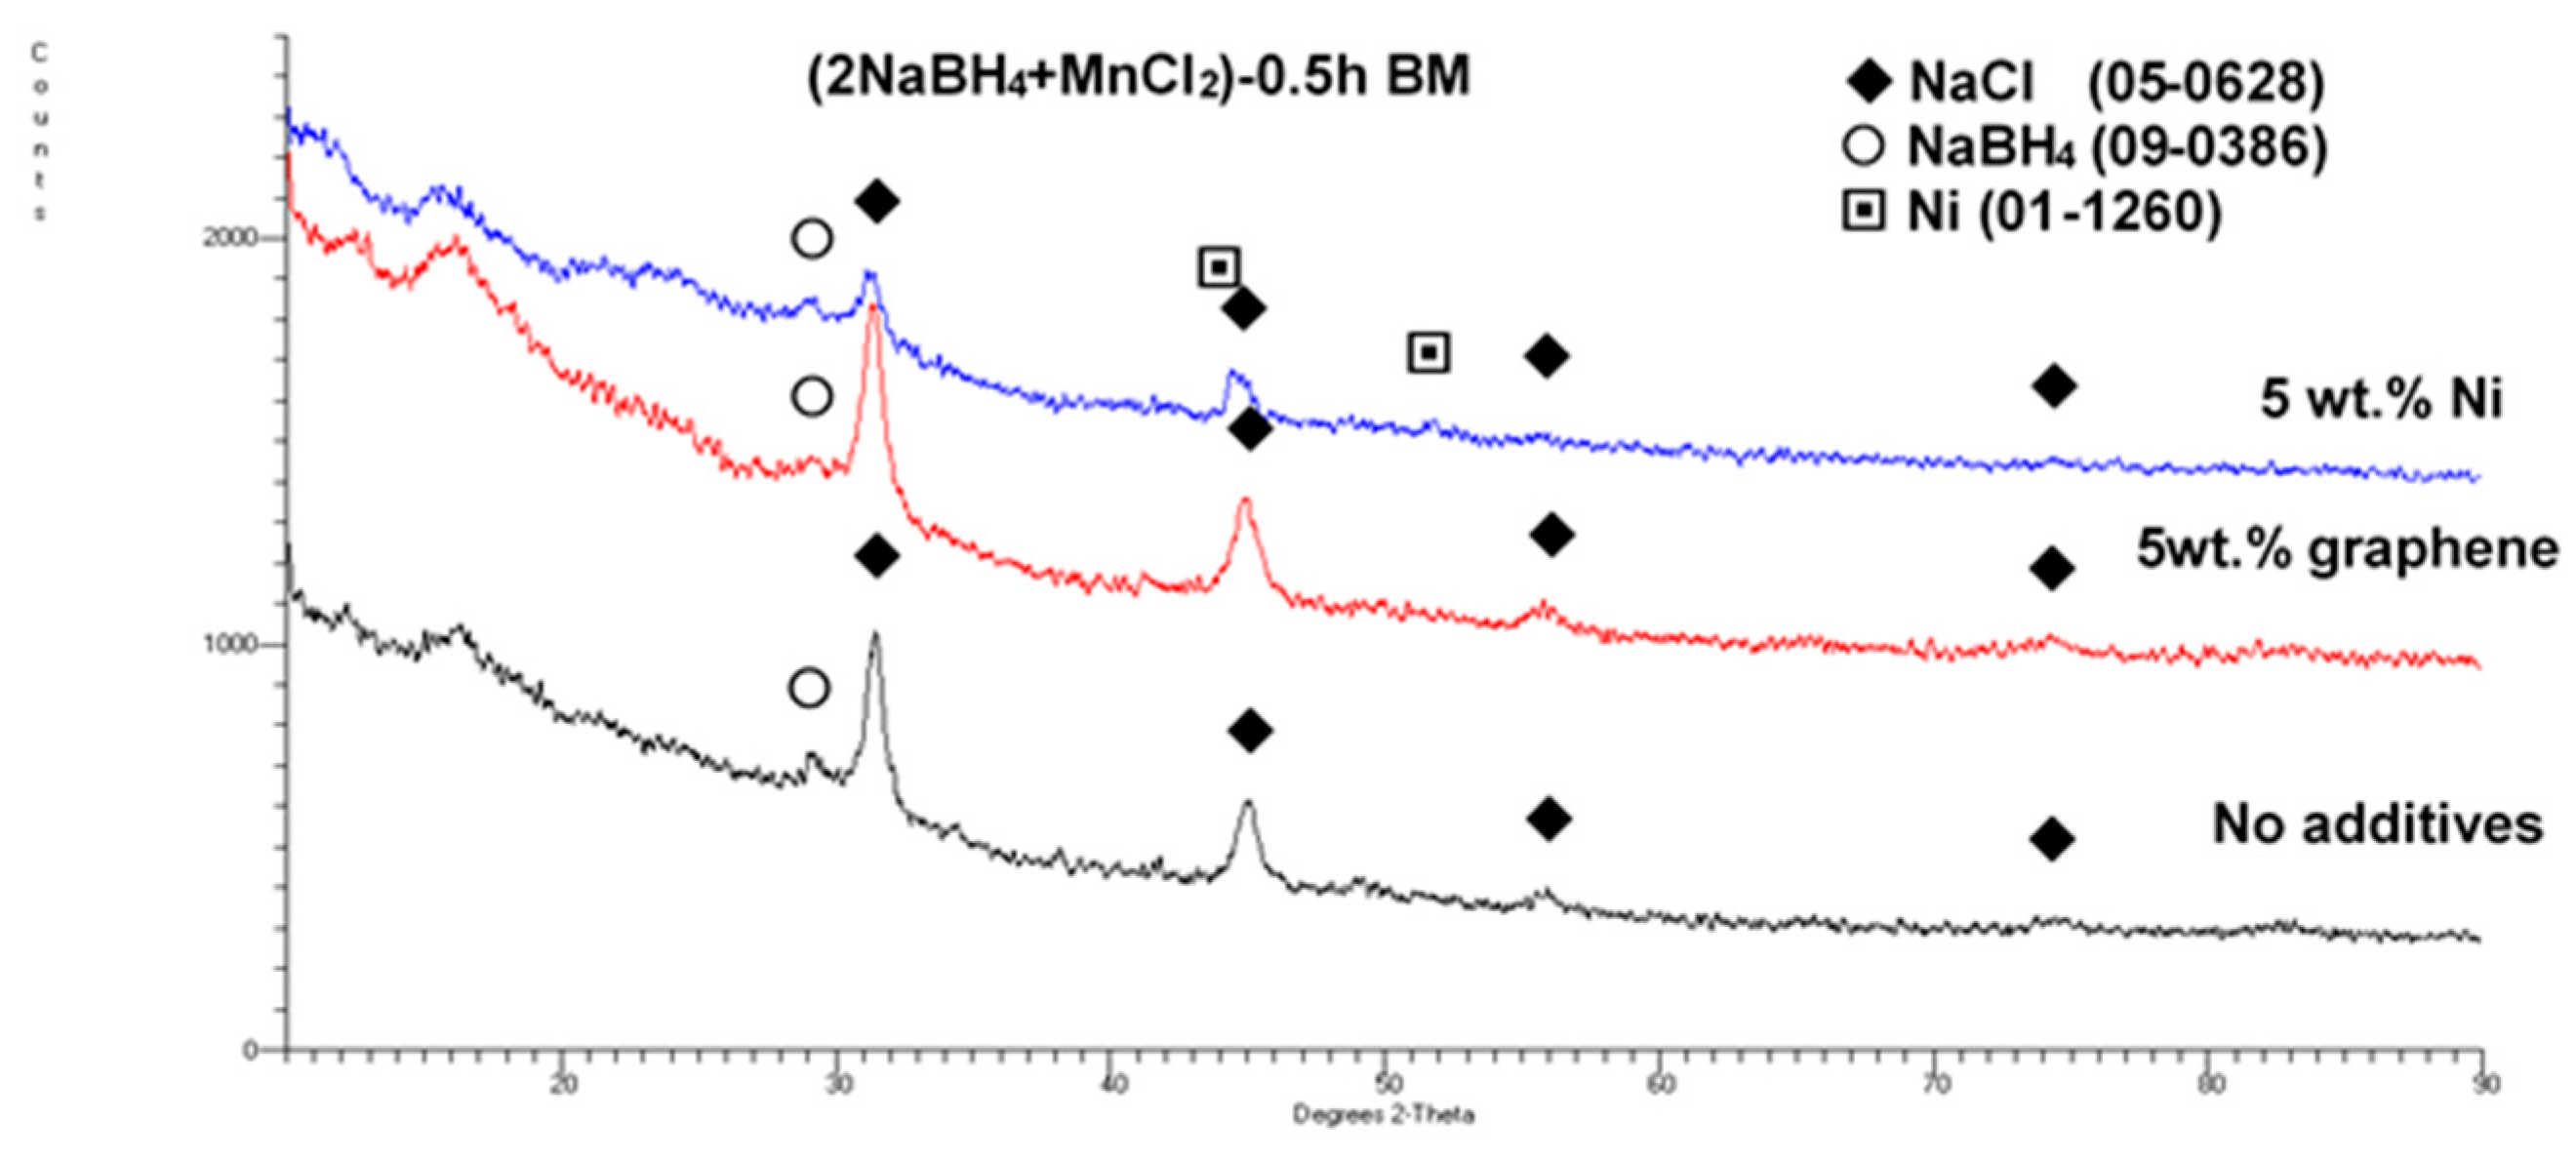
Figure 2 shows the XRD patterns of the (2NaBH4 + MnCl2) mixture ball milled (BM) together with 5 wt. % of the graphene and filamentary Ni additives, as compared to an XRD pattern for an additive-free sample. Only the very strong NaCl-based diffraction peaks and a weak diffraction peak of retained NaBH4 can be clearly seen. These are accompanied by the discernible Ni peaks in this particular sample. Apparently, a mechanochemical reaction occurred between the NaBH4 and MnCl2 reactants during ball milling, which produced a NaCl-type salt accompanied by an amorphous a-Mn(BH4)2-type hydride, as reported by Varin et al. [11]. This issue will be discussed in more detail later.
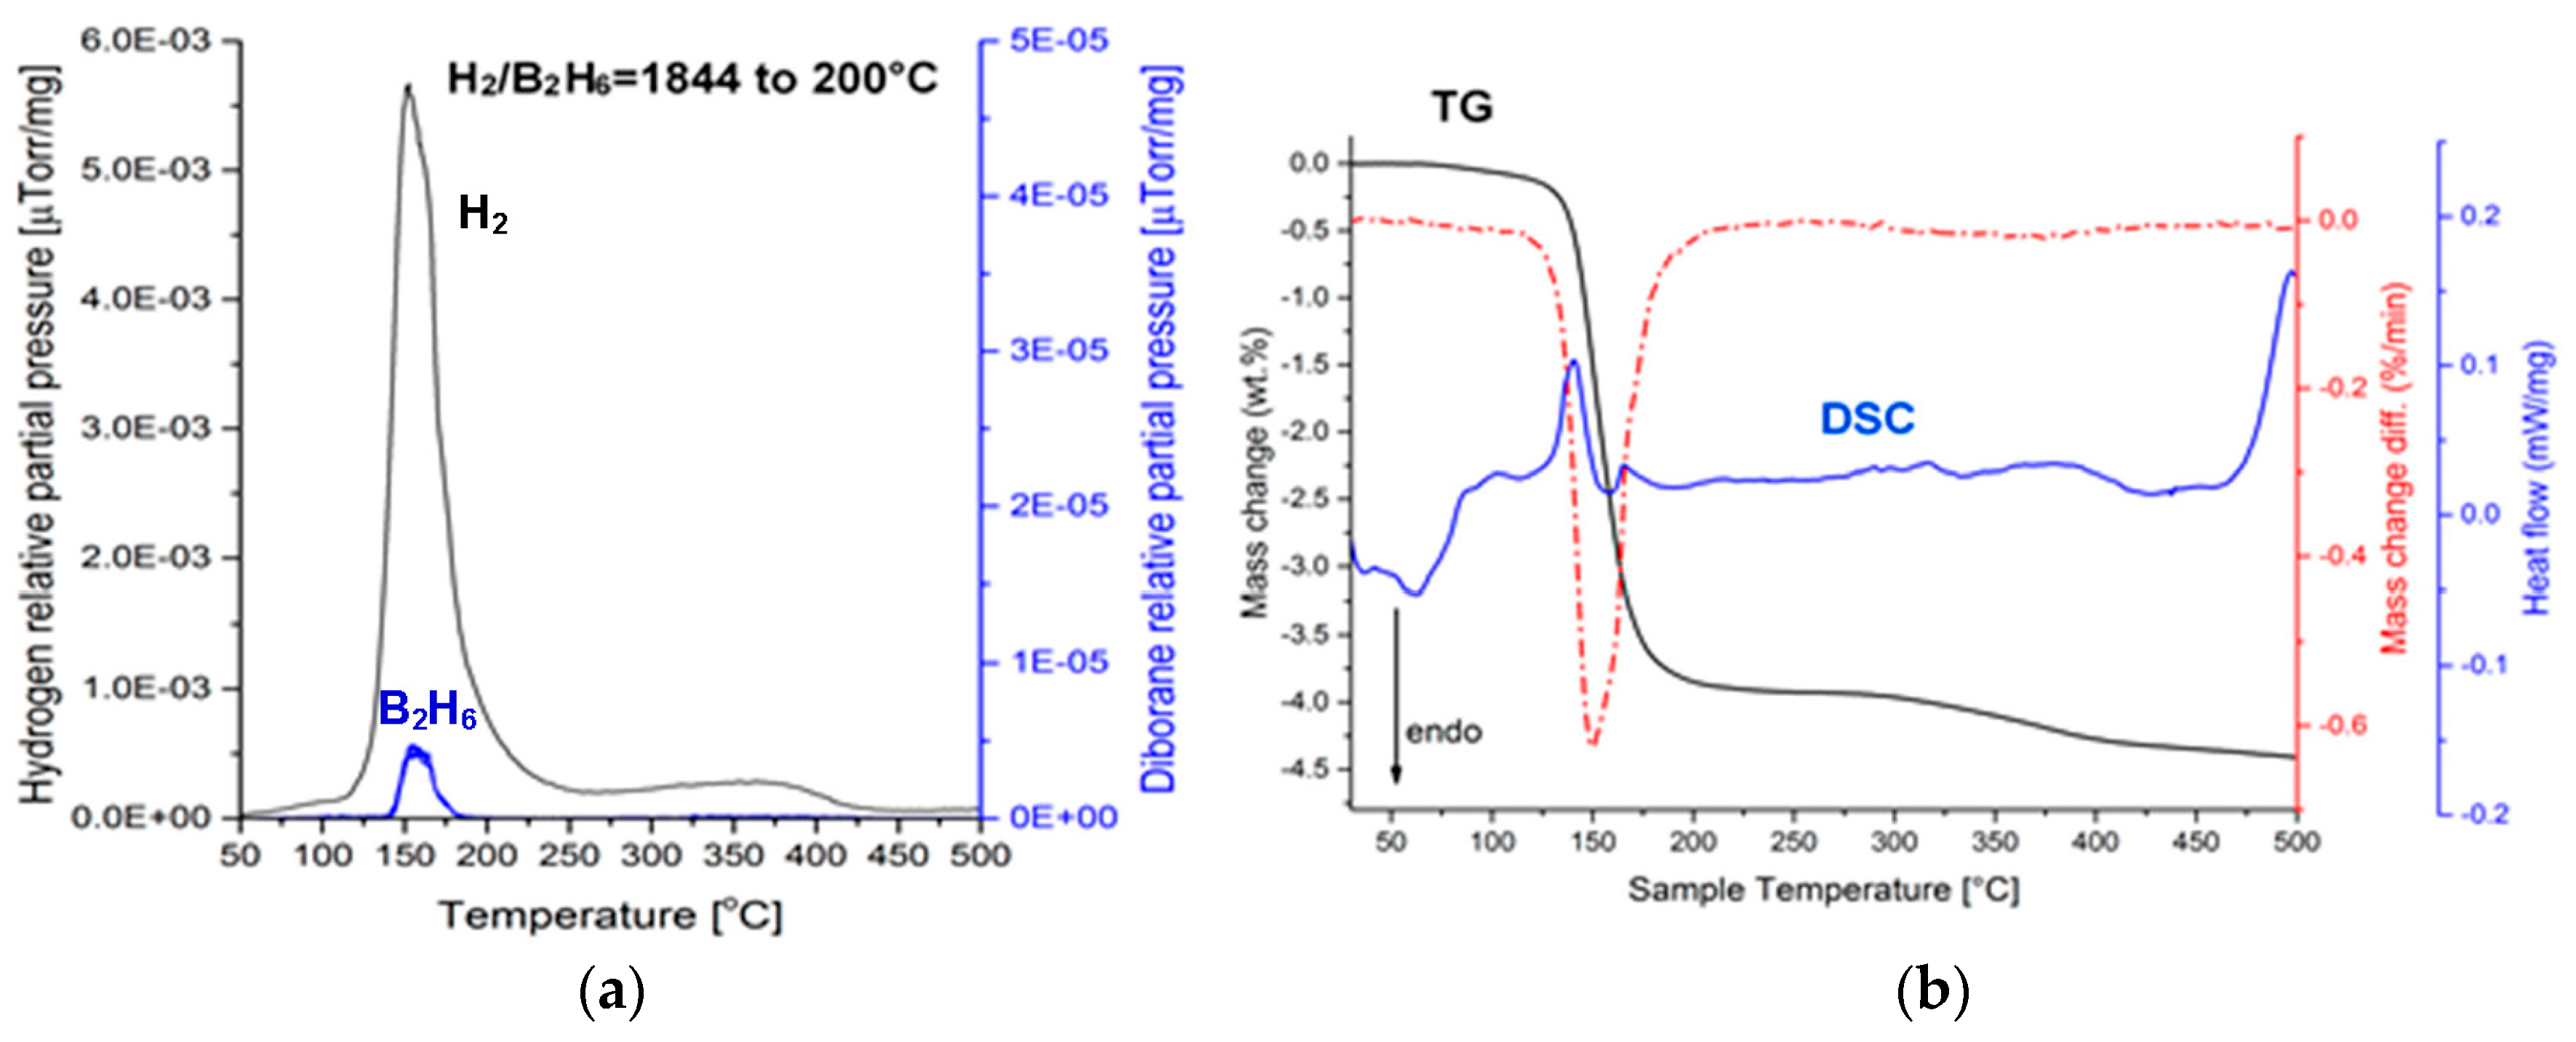
Figure 3a shows the mass spectrometry (MS) gas desorption spectra for a ((2NaBH4 + MnCl2) + 5 wt. % graphene) sample synthesized for 0.5 h (QTR = 36.4 kJ/g). It is seen that the principal peak corresponds to H2 within the range from ~100 to 200 °C (a maximum at ~160 °C), which is accompanied by a very small peak of diborane (B2H6) that commences at ~135 °C and terminates at ~180 °C, with a peak maximum at ~160 °C. The intensity ratio of the MS H2/B2H6 signal up to 200 °C (the threshold temperature for the end of the B2H6 release) equals 1844, which can be compared to the ratio of 948 for the additive-free 0.5 h BM (2NaBH4 + MnCl2) sample that was investigated by Varin et al. [11]. This shows that the quantity of B2H6 released up to ~200 °C, from the sample with graphene, is smaller than that released from an additive-free sample. The curves in Figure 3b show thermogravimetric (TG) and DSC results for a sample with a 5 wt. % graphene additive, which was extracted from the 0.5 h BM sample. A black curve in Figure 3 shows that a rapid TG mass loss, which attains 3.84 wt. % up to 200 °C, is observed within a narrow temperature range of 150–175 °C. Nevertheless, a slow TG mass loss is still observable beyond 200 °C, which is most likely related to a gradual decomposition of retained NaBH4 (Figure 2), albeit without the release of B2H6, which already terminated at ~200 °C. At ~160 °C, one can see a small endothermic peak on a DSC curve (blue). A range of temperatures within which the mass loss occurs is indicated very well by a first derivative of the TG line (dTG/dT where T-temperature) (broken red line in Figure 3b). It clearly shows that the occurrence of the endothermic peak at ~160 °C is linked to the TG mass loss in Figure 3b. For the powder with 5 wt. % graphene that was ball milled for 0.5 h, we investigated a second, random sample that could unequivocally confirm the correctness of the MS and TGA/DSC results in Figure 3b. We found that the TGA/DSC curves for the second sample (a plot not included here) were nearly identical to Figure 3, and exhibited a mass loss of 4.09 wt. % up to 200 °C, for which a DSC curve also showed an endothermic event. In addition, this second sample exhibited a very similar MS pattern (an MS plot not included here) to that in Figure 3a, having the MS peak intensity ratio H2/B2H6 = 1256, again, much higher than that reported for the additive-free material [11].
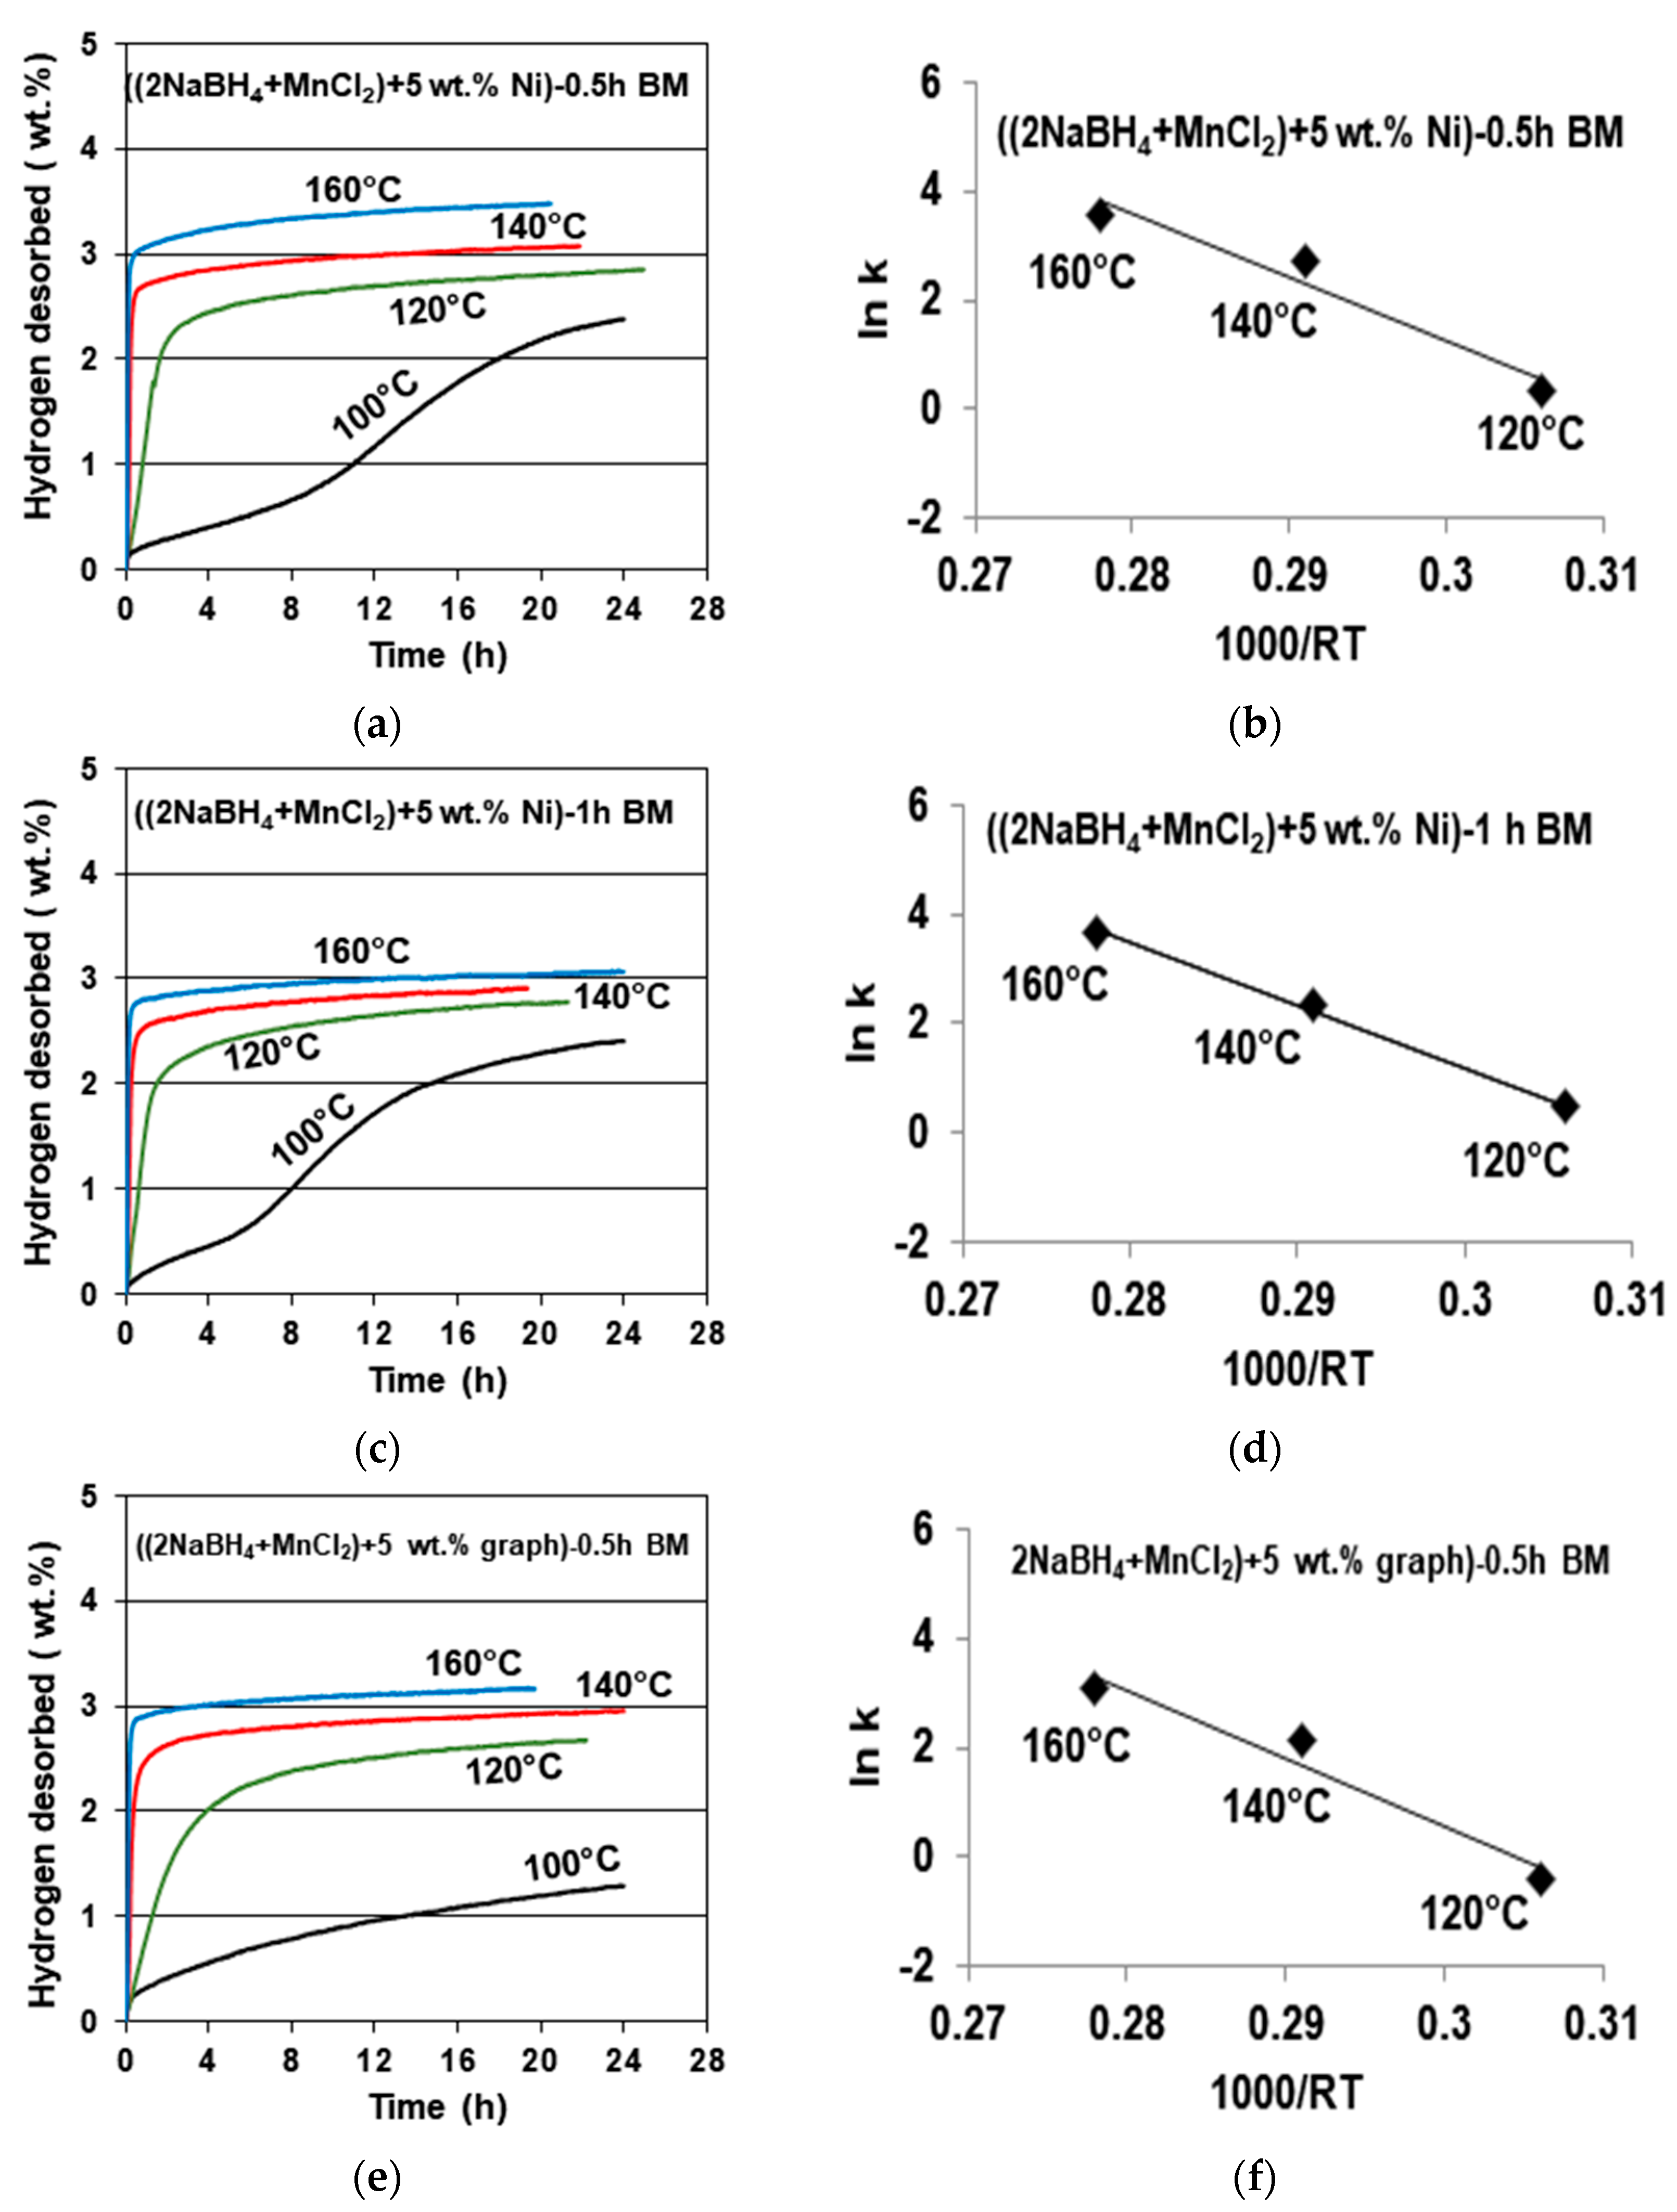
Figure 4 shows examples of gas desorption curves for the samples containing a 5 wt. % Ni additive ball milled for 0.5 (Figure 4a) and 1 h (Figure 4c), together with accompanying Arrhenius plots for the estimate of the apparent activation energy (AAE) of desorption (Figure 4b,d). A desorption curve for a sample with a 5 wt. % graphene additive ball milled for 0.5 h (Figure 4e) with an accompanying Arrhenius plot for the AAE (Figure 4f) is also shown. It must be pointed out that, as stated earlier, the released gas contained a miniscule quantity of B2H6. It was so small that, for simplicity, the y axis for the gas desorption curves in Figure 4 is designated as desorbing solely H2. In all three cases, gas desorption at 100 °C is very sluggish, and that particular curve was not taken into consideration for the AAE calculations. It is also seen that for the 5 wt. % Ni sample, the duration of ball milling for either 0.5 or 1 h has no measurable effect on both the quantity of desorbed H2 (3–3.5 wt. %) and the values of the AAE for desorption, which are equal to 116.68 for a 0.5 h BM sample, and 115.19 kJ/mol for a 1 h BM sample (with an error of ±15.1 kJ/mol).
The desorption curves for the sample with a 5 wt. % graphene additive (Figure 4e) shows the same H2 desorption capacity of about 3 wt. %, and a slightly higher AAE of about 125.93 kJ/mol (Figure 4f), with an estimated error of ±13.4 kJ/mol. For comparison, the AAE values for the additive-free samples ball milled for 0.5 and 1 h were reported as 118.21 and 123.09 kJ/mol, respectively [11]. Apparently, the additives of filamentary Ni and graphene do not measurably affect the AAE of desorption.
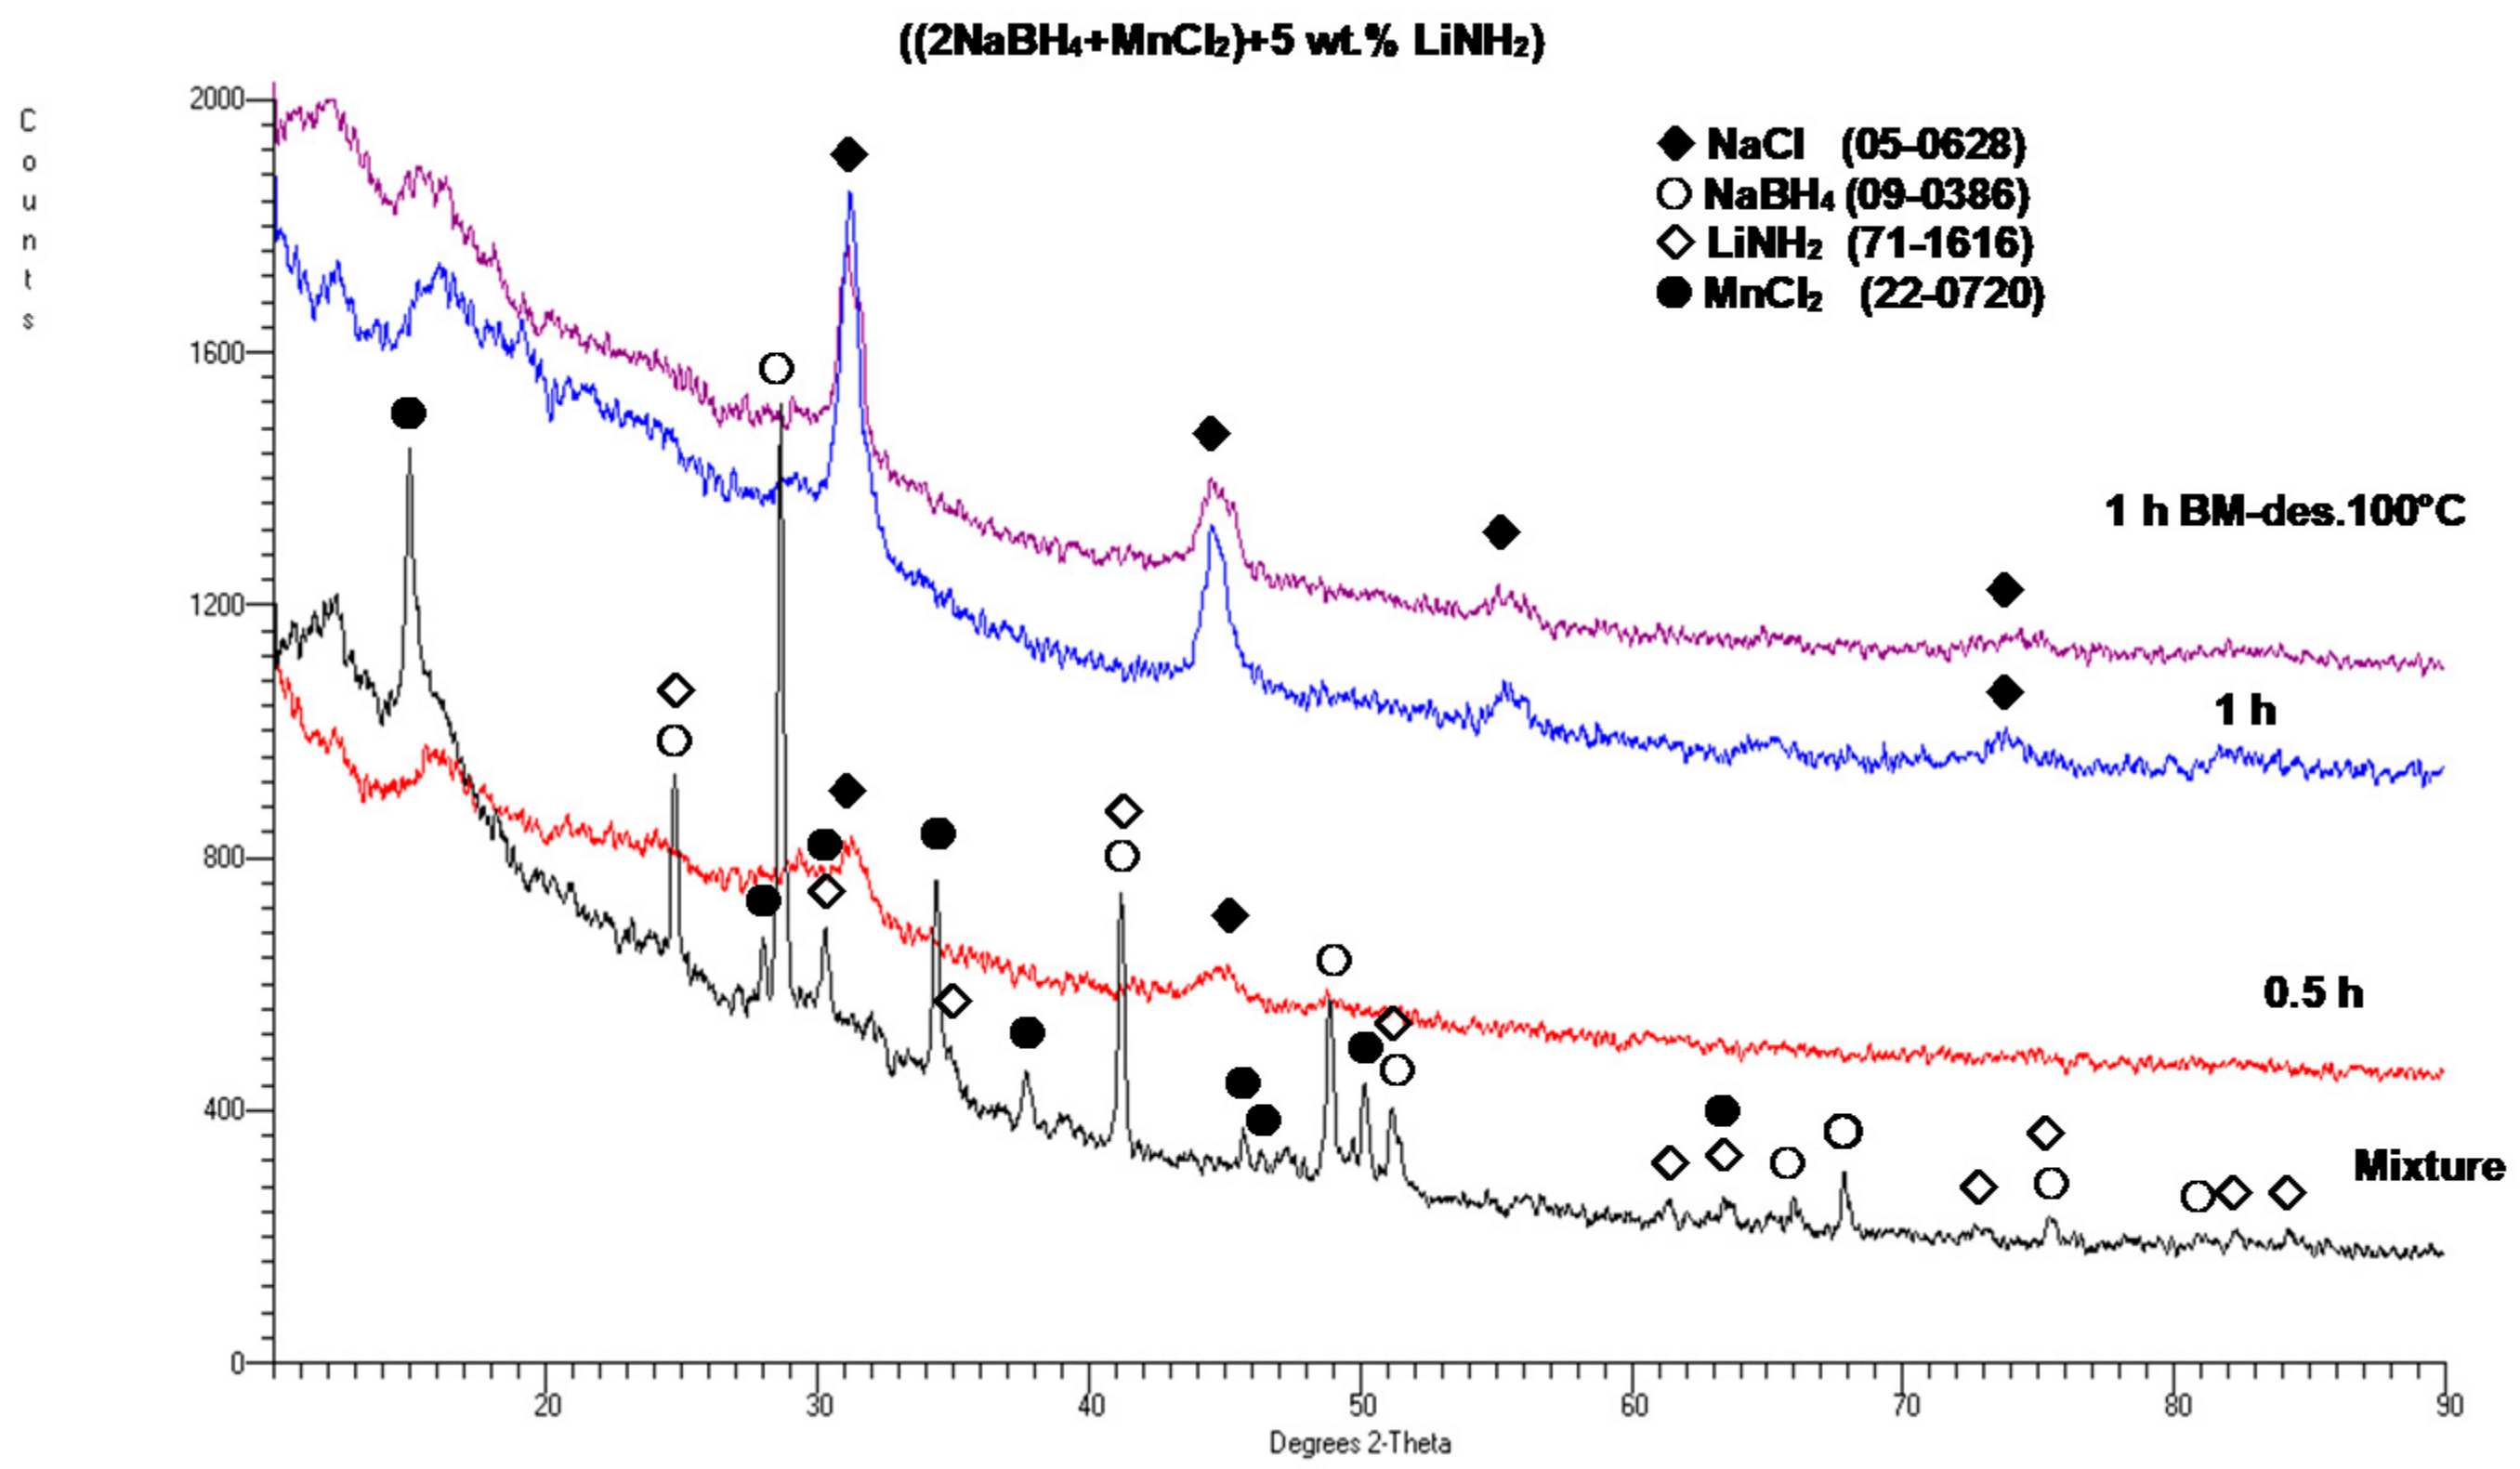
Figure 5 shows the XRD patterns for a sample with a 5 wt. % LiNH2 additive after 0.5 and 1 h BM, as compared to the XRD patterns for the initial reactants NaBH4 and MnCl2. For comparison, an XRD pattern for the 1 h synthesized sample after desorption at 100 °C for 36 h is also shown, and no change in the XRD pattern is observed. However, as will be shown later, the synthesized sample released some quantity of H2 gas. It is observed that after barely 0.5 h of BM, the diffraction peaks of the reactants disappear, and the new diffraction peaks of the NaCl-type salt appear. This clearly confirms that a mechanochemical reaction must have occurred during ball milling between the NaBH4 and MnCl2 reactants, which produced a NaCl-type salt accompanied by an amorphous a-Mn(BH4)2-type hydride in the same way as reported by Varin et al. [11]. This behavior is apparently common to the (2NaBH4 + MnCl2) additive-free samples [11] and those with the 5 wt. % graphene and filamentary Ni additives (Figure 2). In addition, the LiNH2 diffraction peaks, which are visible in a mixture of reactants and additives, disappeared after BM, which indicates that the LiNH2 additive was likely amorphized during BM.
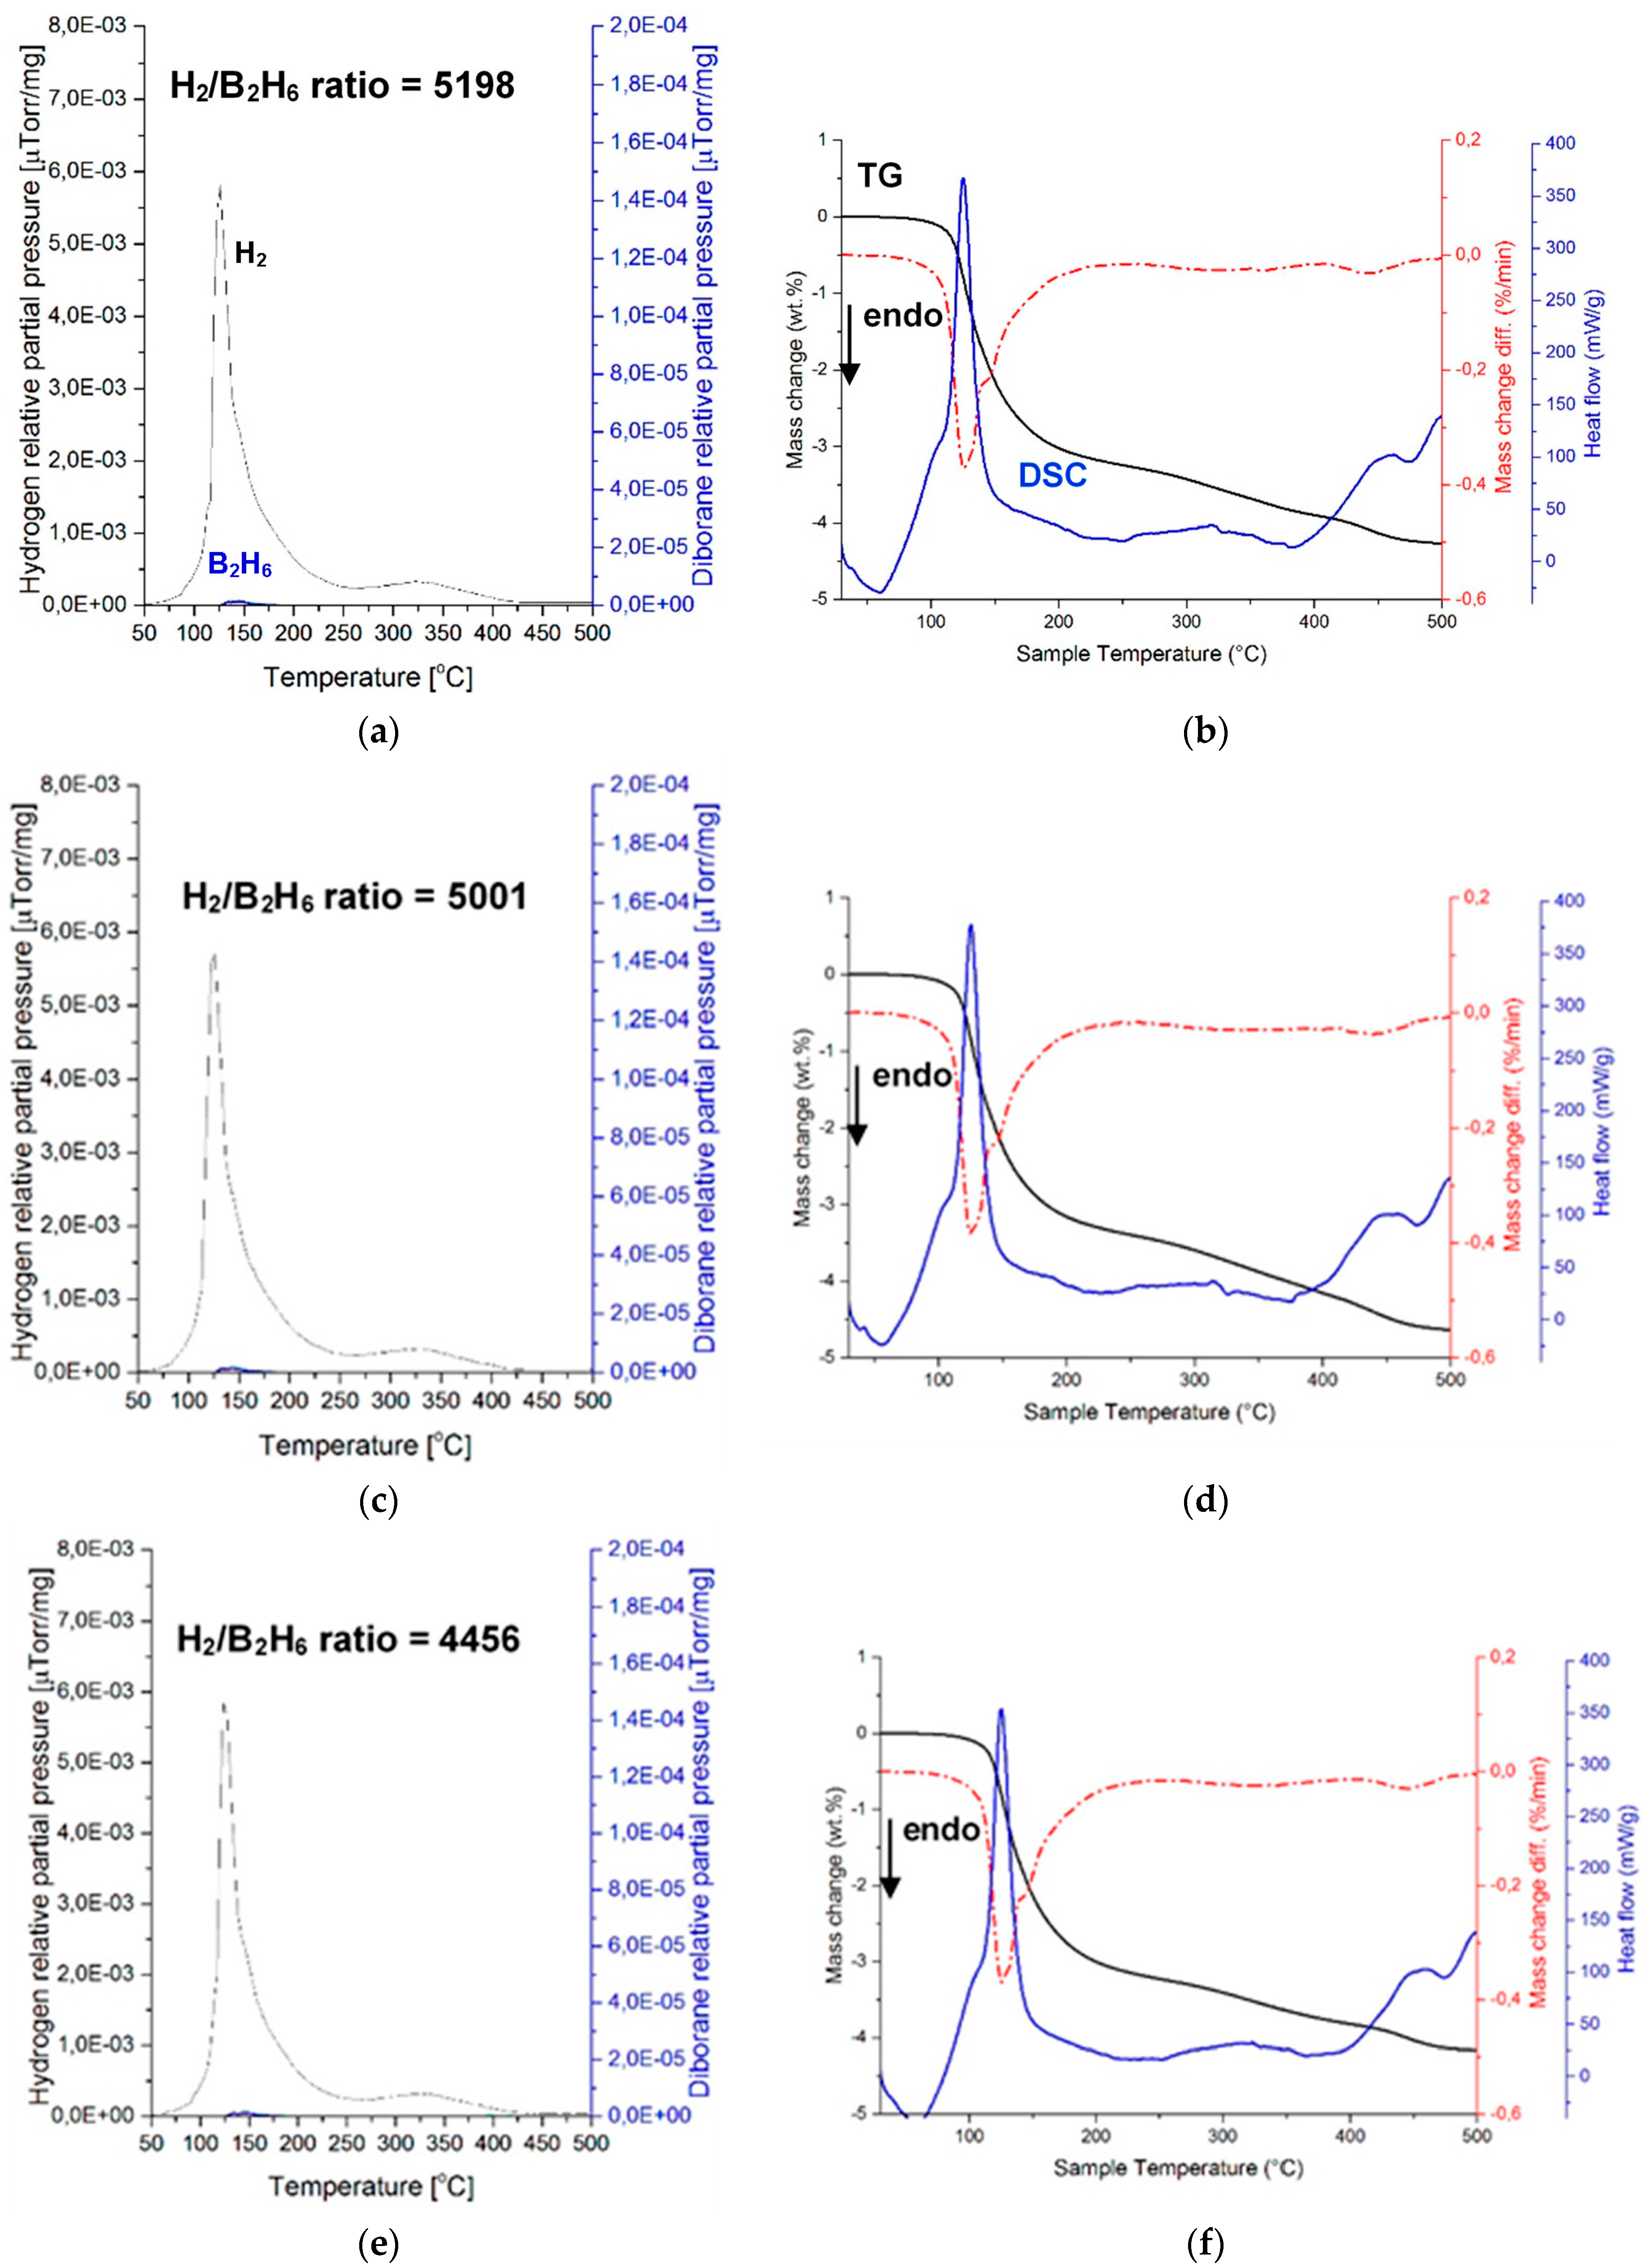
Figure 6 shows the mass spectrometry (MS) results of a (H2 + B2H6) gas mixture and the corresponding TGA and DSC curves during gas desorption for three samples of a ((2NaBH4 + MnCl2) + 5 wt. % LiNH2) composition, ball milled for 0.5 h (QTR = 36.4 kJ/g). MS of gas desorption is quite remarkable, since it clearly shows nearly no presence of B2H6. The intensity ratios of the MS H2/B2H6 signal up to 200 °C are 5198, 5001, and 4456 for samples 1, 2, and 3, respectively. Apparently, the LiNH2 additive is a very potent suppressor of B2H6, as already reported by Song et al. [12] for a LiBH4/MnF2 mixture upon its thermal decomposition. The same effect of LiNH2 is confirmed for the first time for a mechanochemically reacted system of (2NaBH4 + MnCl2).

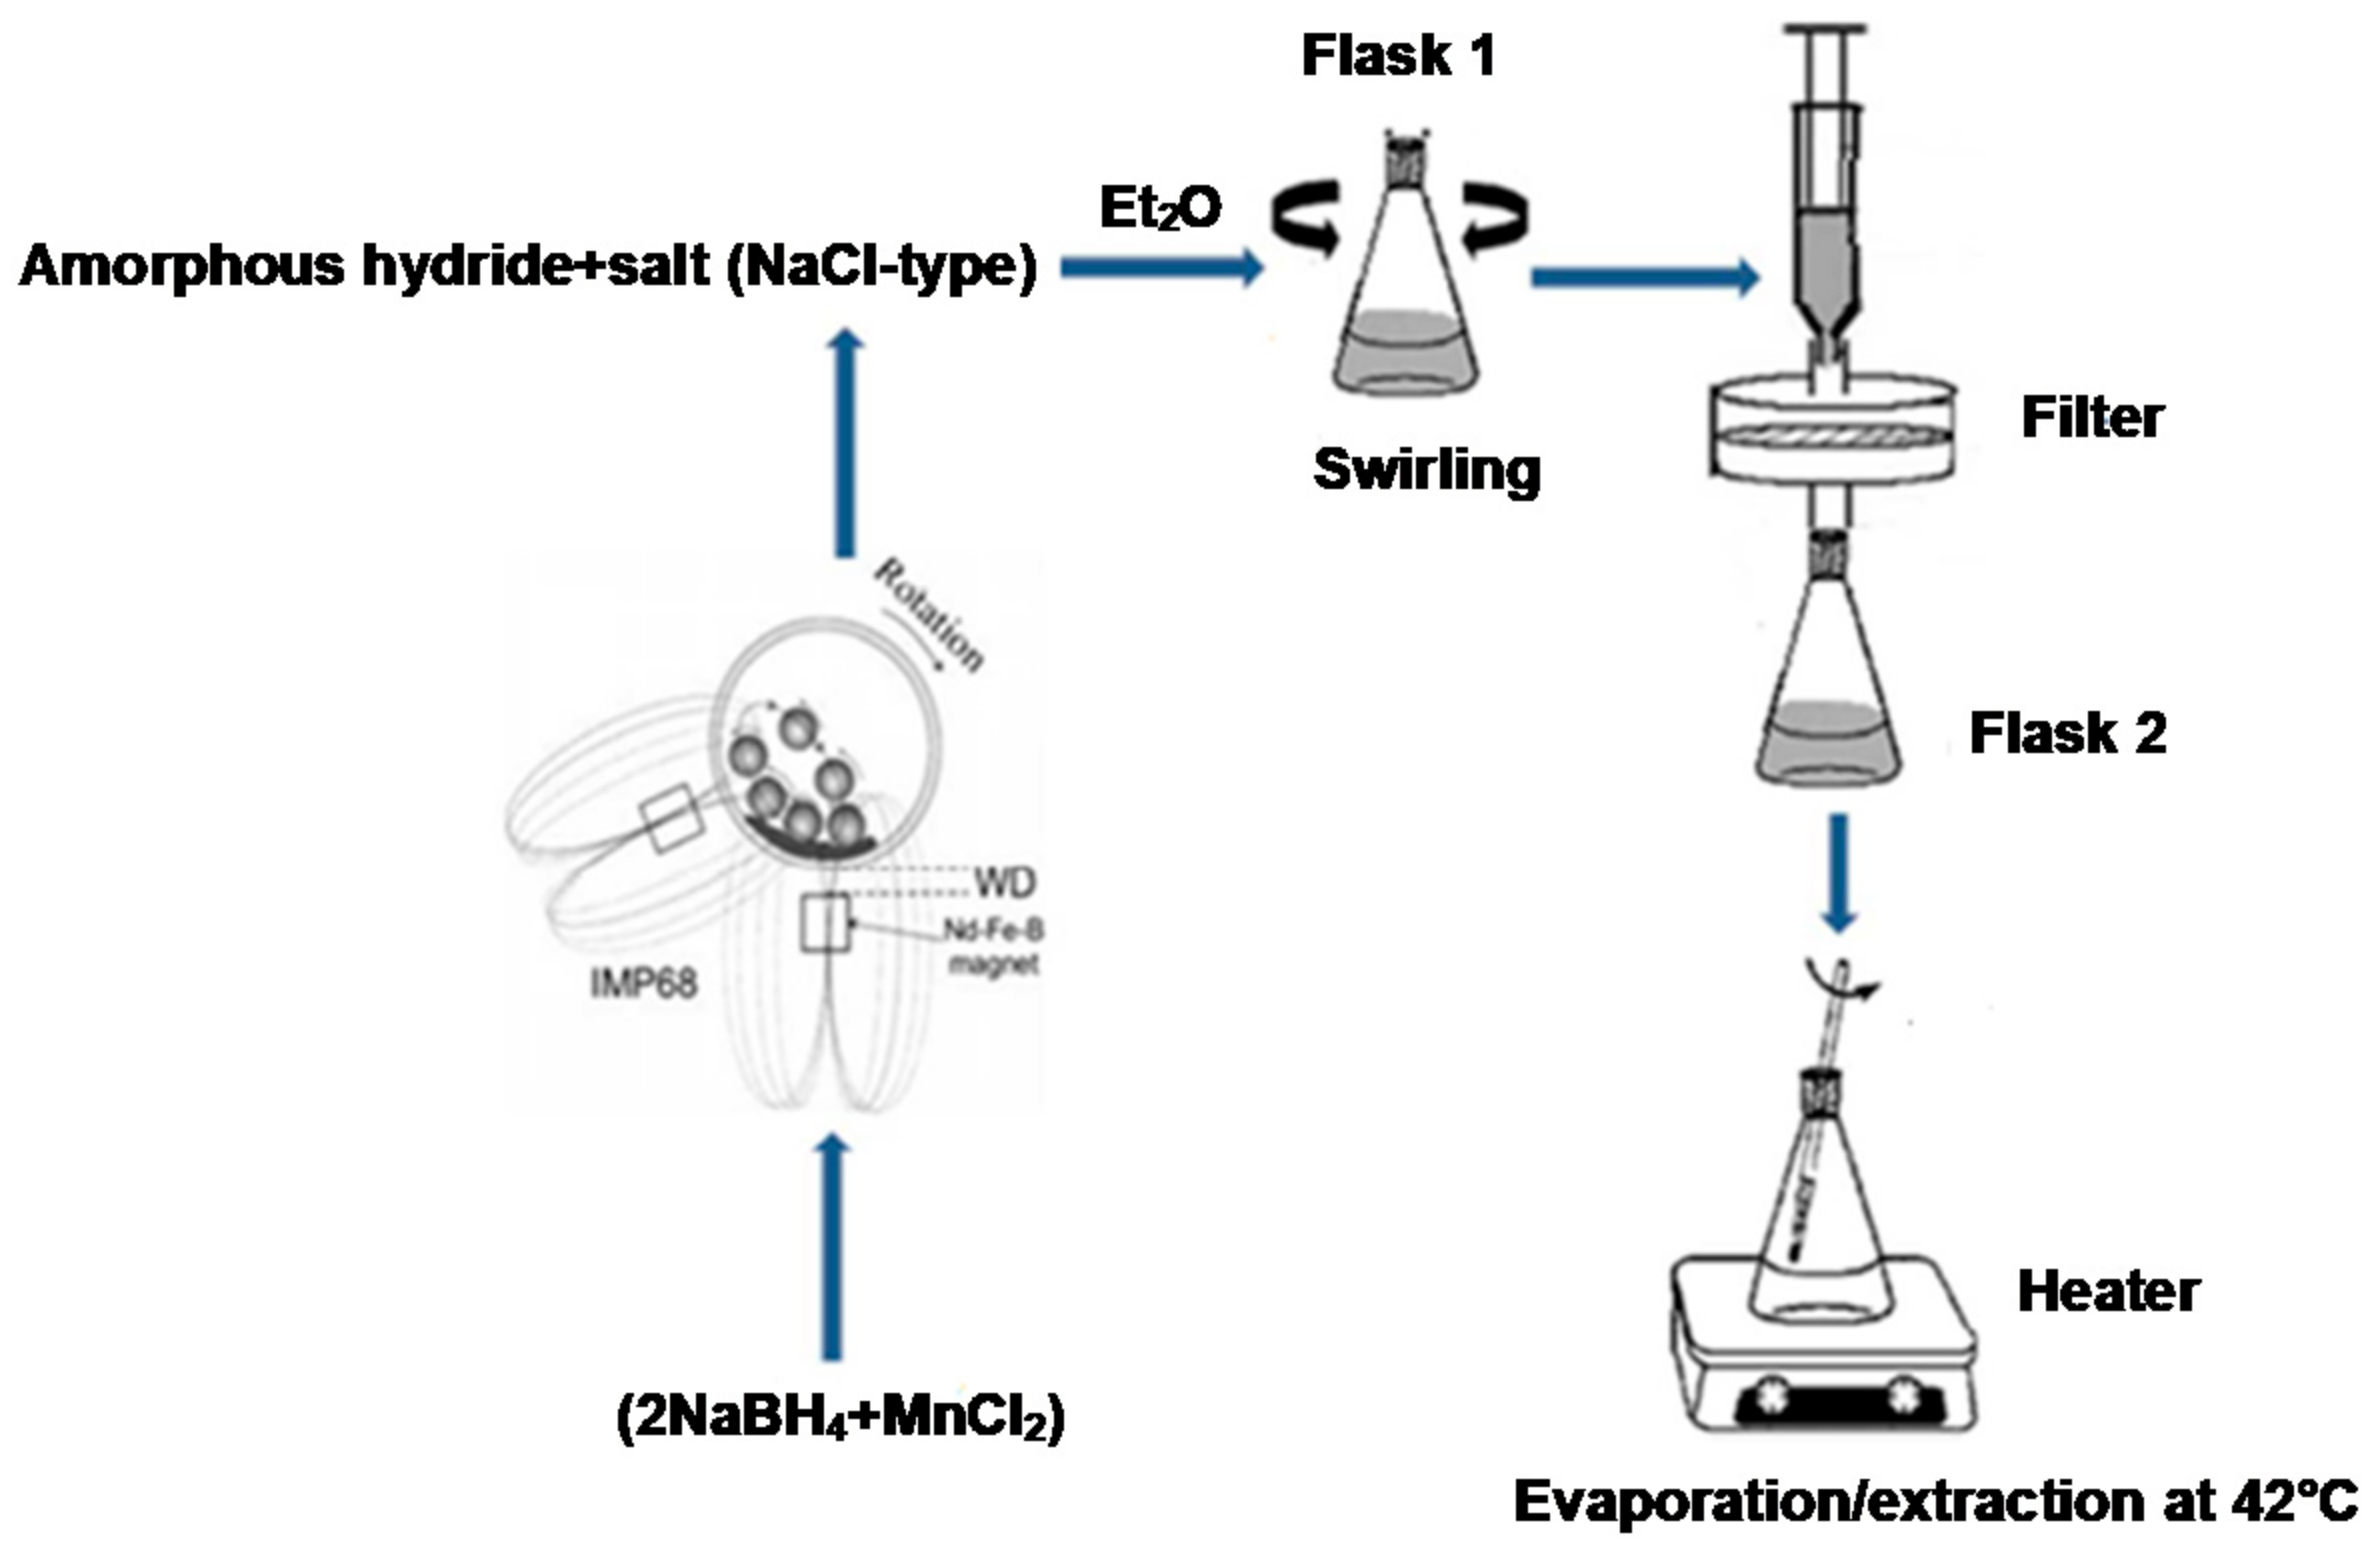
2.2. Crystalline c-Mn(BH4)2 after Solvent Filtration/Extraction

The NaCl-type salt that is formed as a by-product of the mechanochemical reaction during ball milling of the additive-free (2NaBH4 + MnCl2) [11], or the samples containing the additives, as in this work, is completely useless because it is a “dead-weight” that adds up to the total molecular weight of the system.
In contrast to the pale brown color of the ball milled mixture, the dry powder obtained after solvent filtration extraction (see Materials and Methods) had a light grey color, which is a completely different color from the pale yellow of the Mn(BH4)2-NaCl mixture obtained in the final drying step of the solvent synthesis route [14]. 
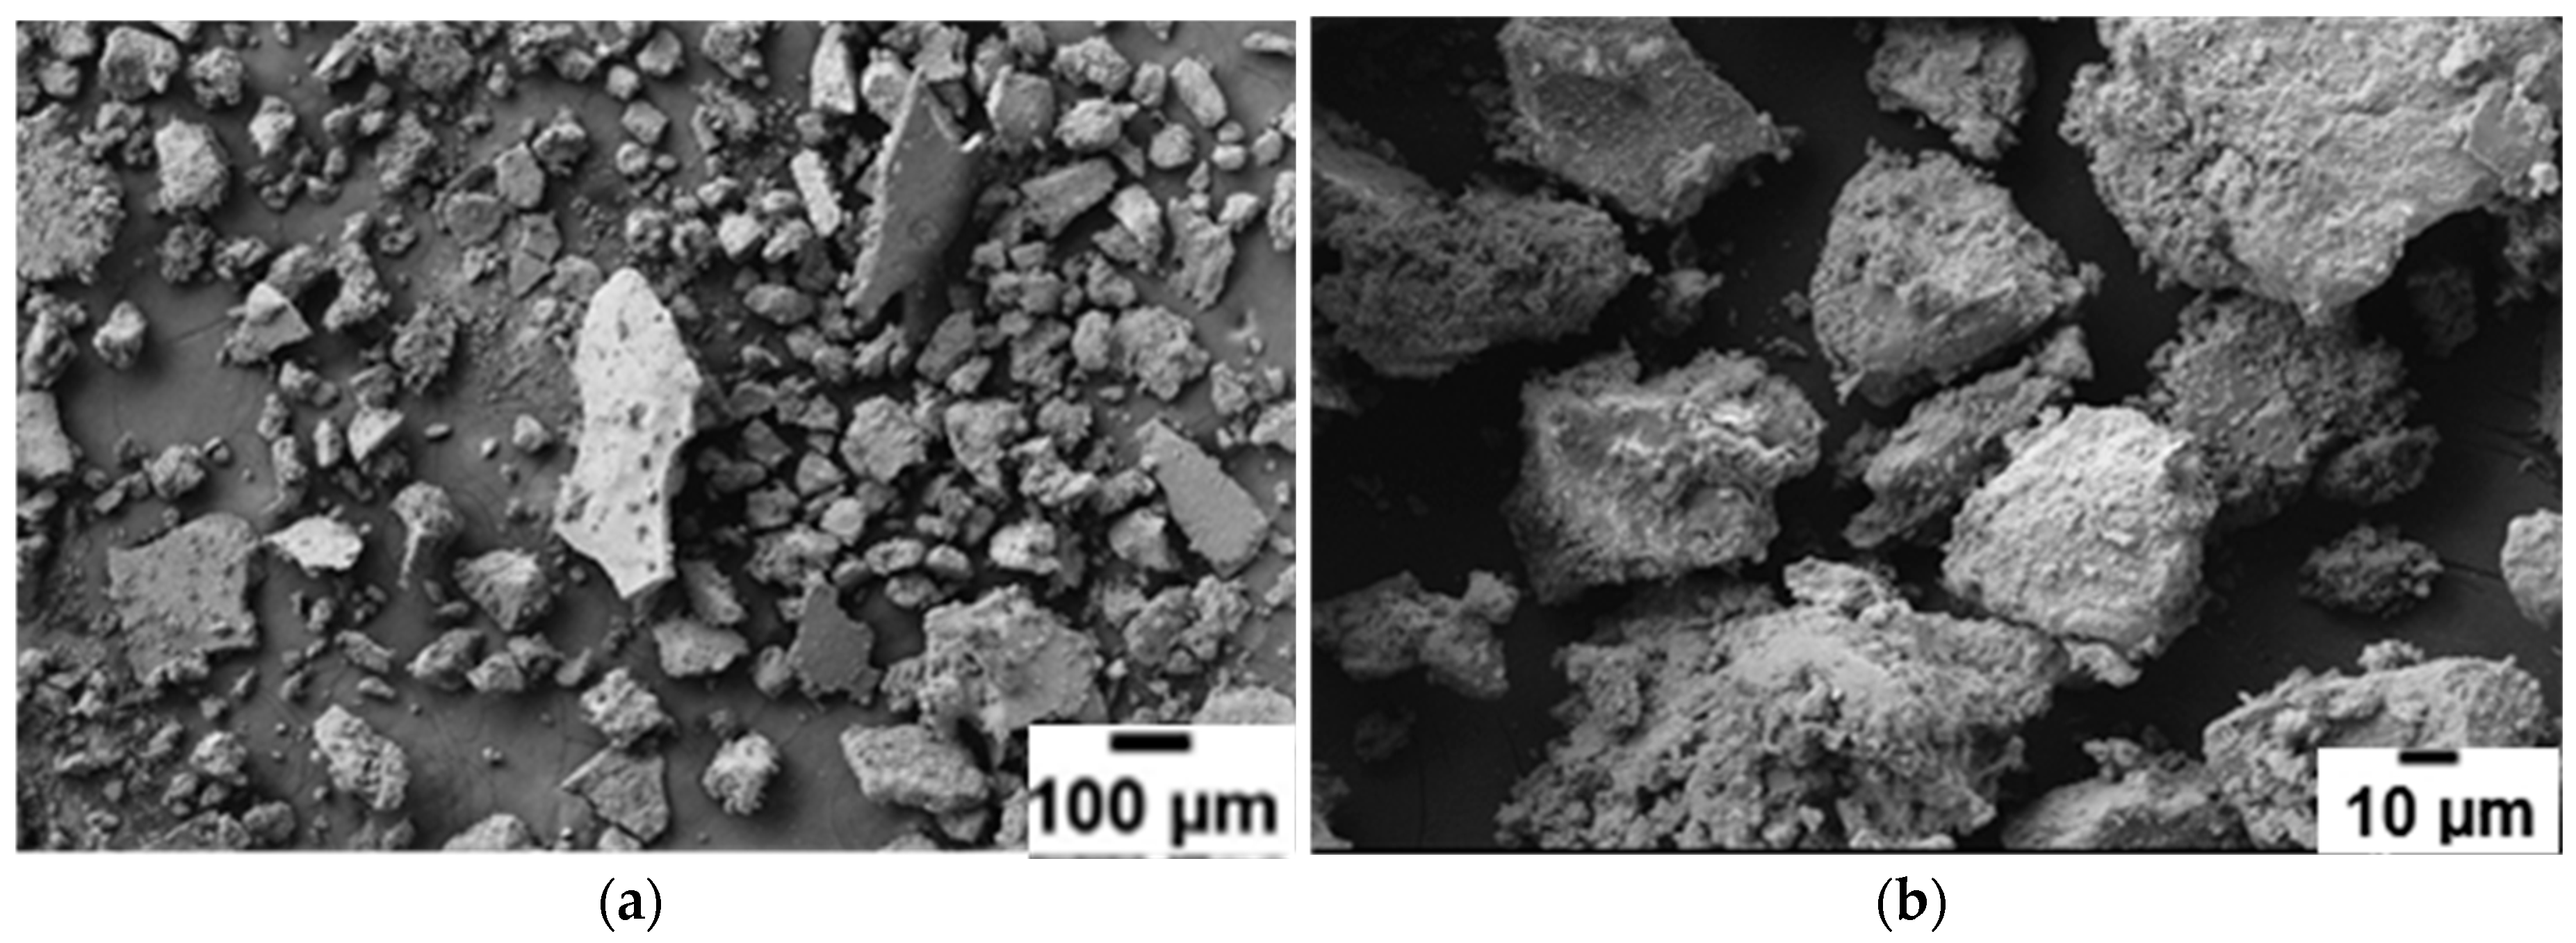
Figure 7 shows the scanning electron micrographs of the extracted, additive-free (2NaBH4 + MnCl2) sample. Very characteristic thin “slabs” resembling highly compacted powder can be seen at both magnifications.
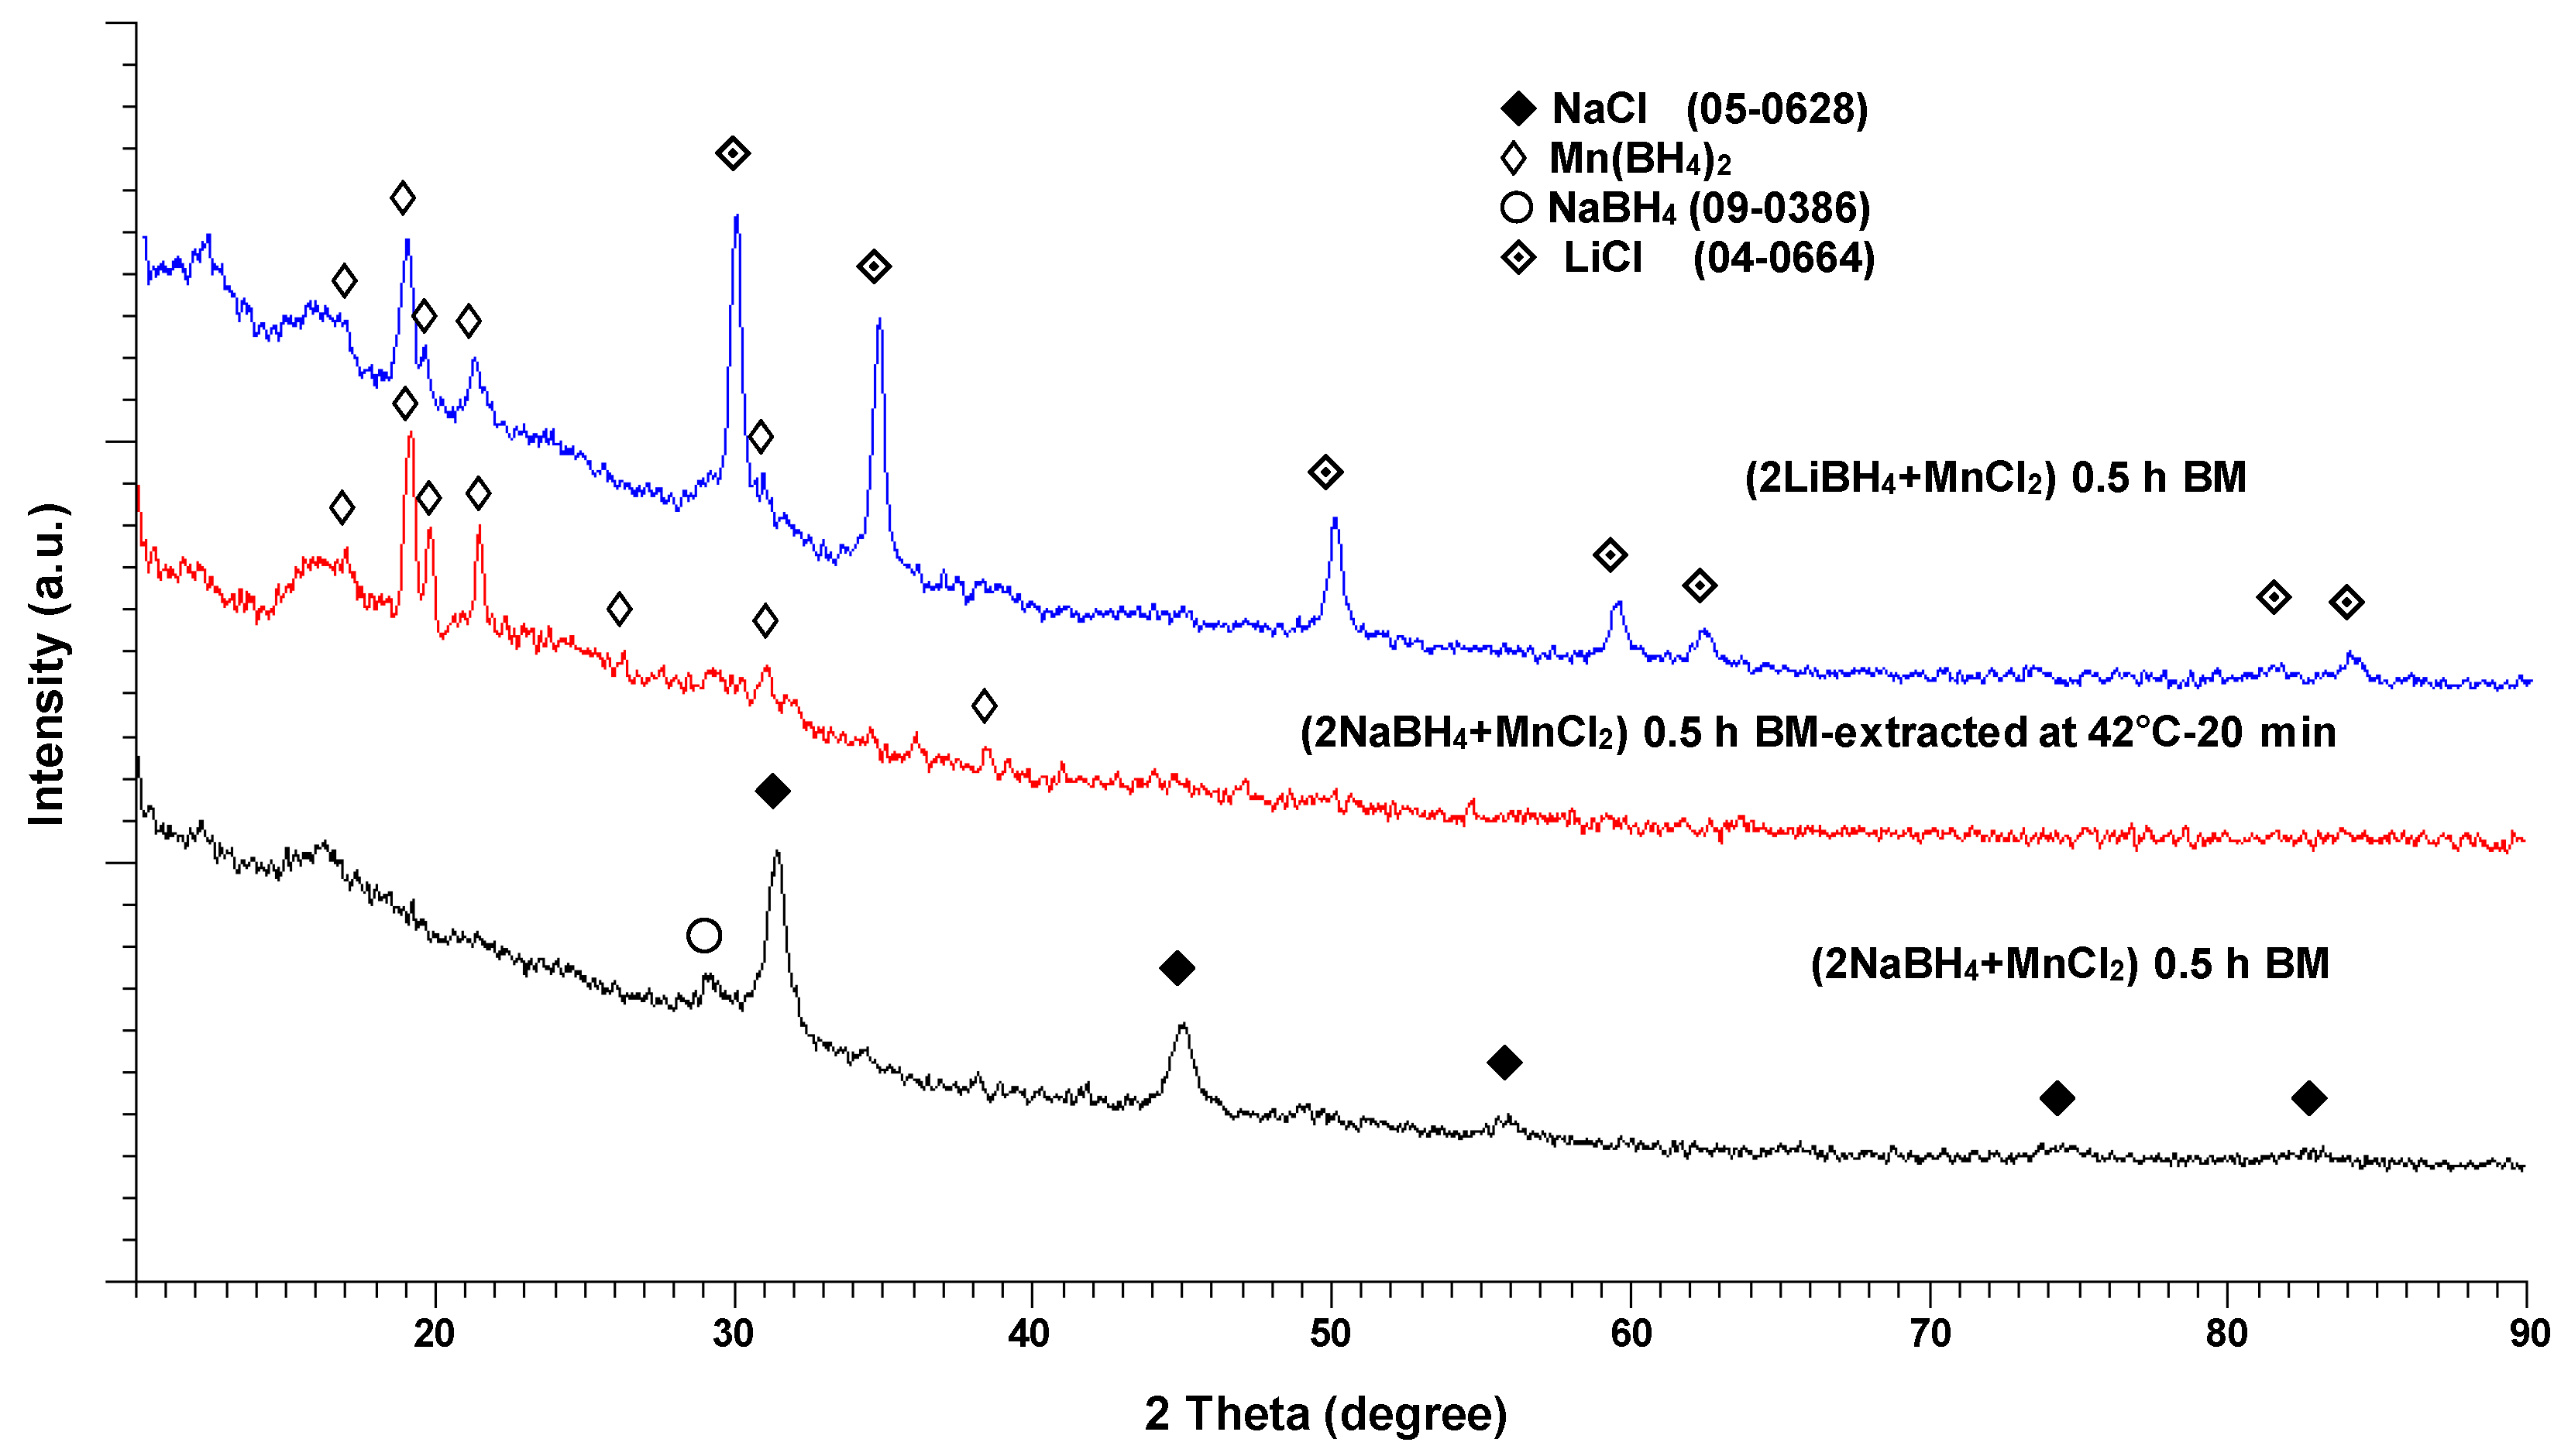
The XRD pattern for the ball milled (2NaBH4 + MnCl2) sample is shown at the bottom of Figure 8. The pattern in the center is for the same sample after solvent filtration/extraction at 42 °C (as reported by Varin et al. [11]). For comparison, the XRD pattern for the ball milled (2LiBH4 + MnCl2) mixture is also included at the top of Figure 8.
Solely the NaCl-type diffraction peaks accompanied by a weak, singular NaBH4 peak can be seen in the BM (2NaBH4 + MnCl2) XRD pattern (bottom), as already reported by Varin et al. [11]. The center XRD pattern in Figure 8, which belongs to the same sample after solvent filtration/extraction, is very similar to the XRD pattern of the BM (2LiBH4 + MnCl2) mixture containing the crystalline c-Mn(BH4)2 hydride co-existing with a LiCl salt [3,4,5,6,7,8,9,10] (a top XRD pattern). The NaCl-type salt was effectively filtered during the filtration stage, and therefore, no NaCl-type diffraction peaks are discernible in Figure 8 in the XRD pattern for the solvent extracted sample (center). These findings clearly show that an amorphous a-Mn(BH4)2-type hydride, that was formed through ball milling, was transformed into a crystalline c-Mn(BH4)2 hydride during solvent filtration/extraction. When the 1 h ball milled (2NaBH4 + MnCl2) sample was used, we observed identical results (the XRD patterns are not shown here).
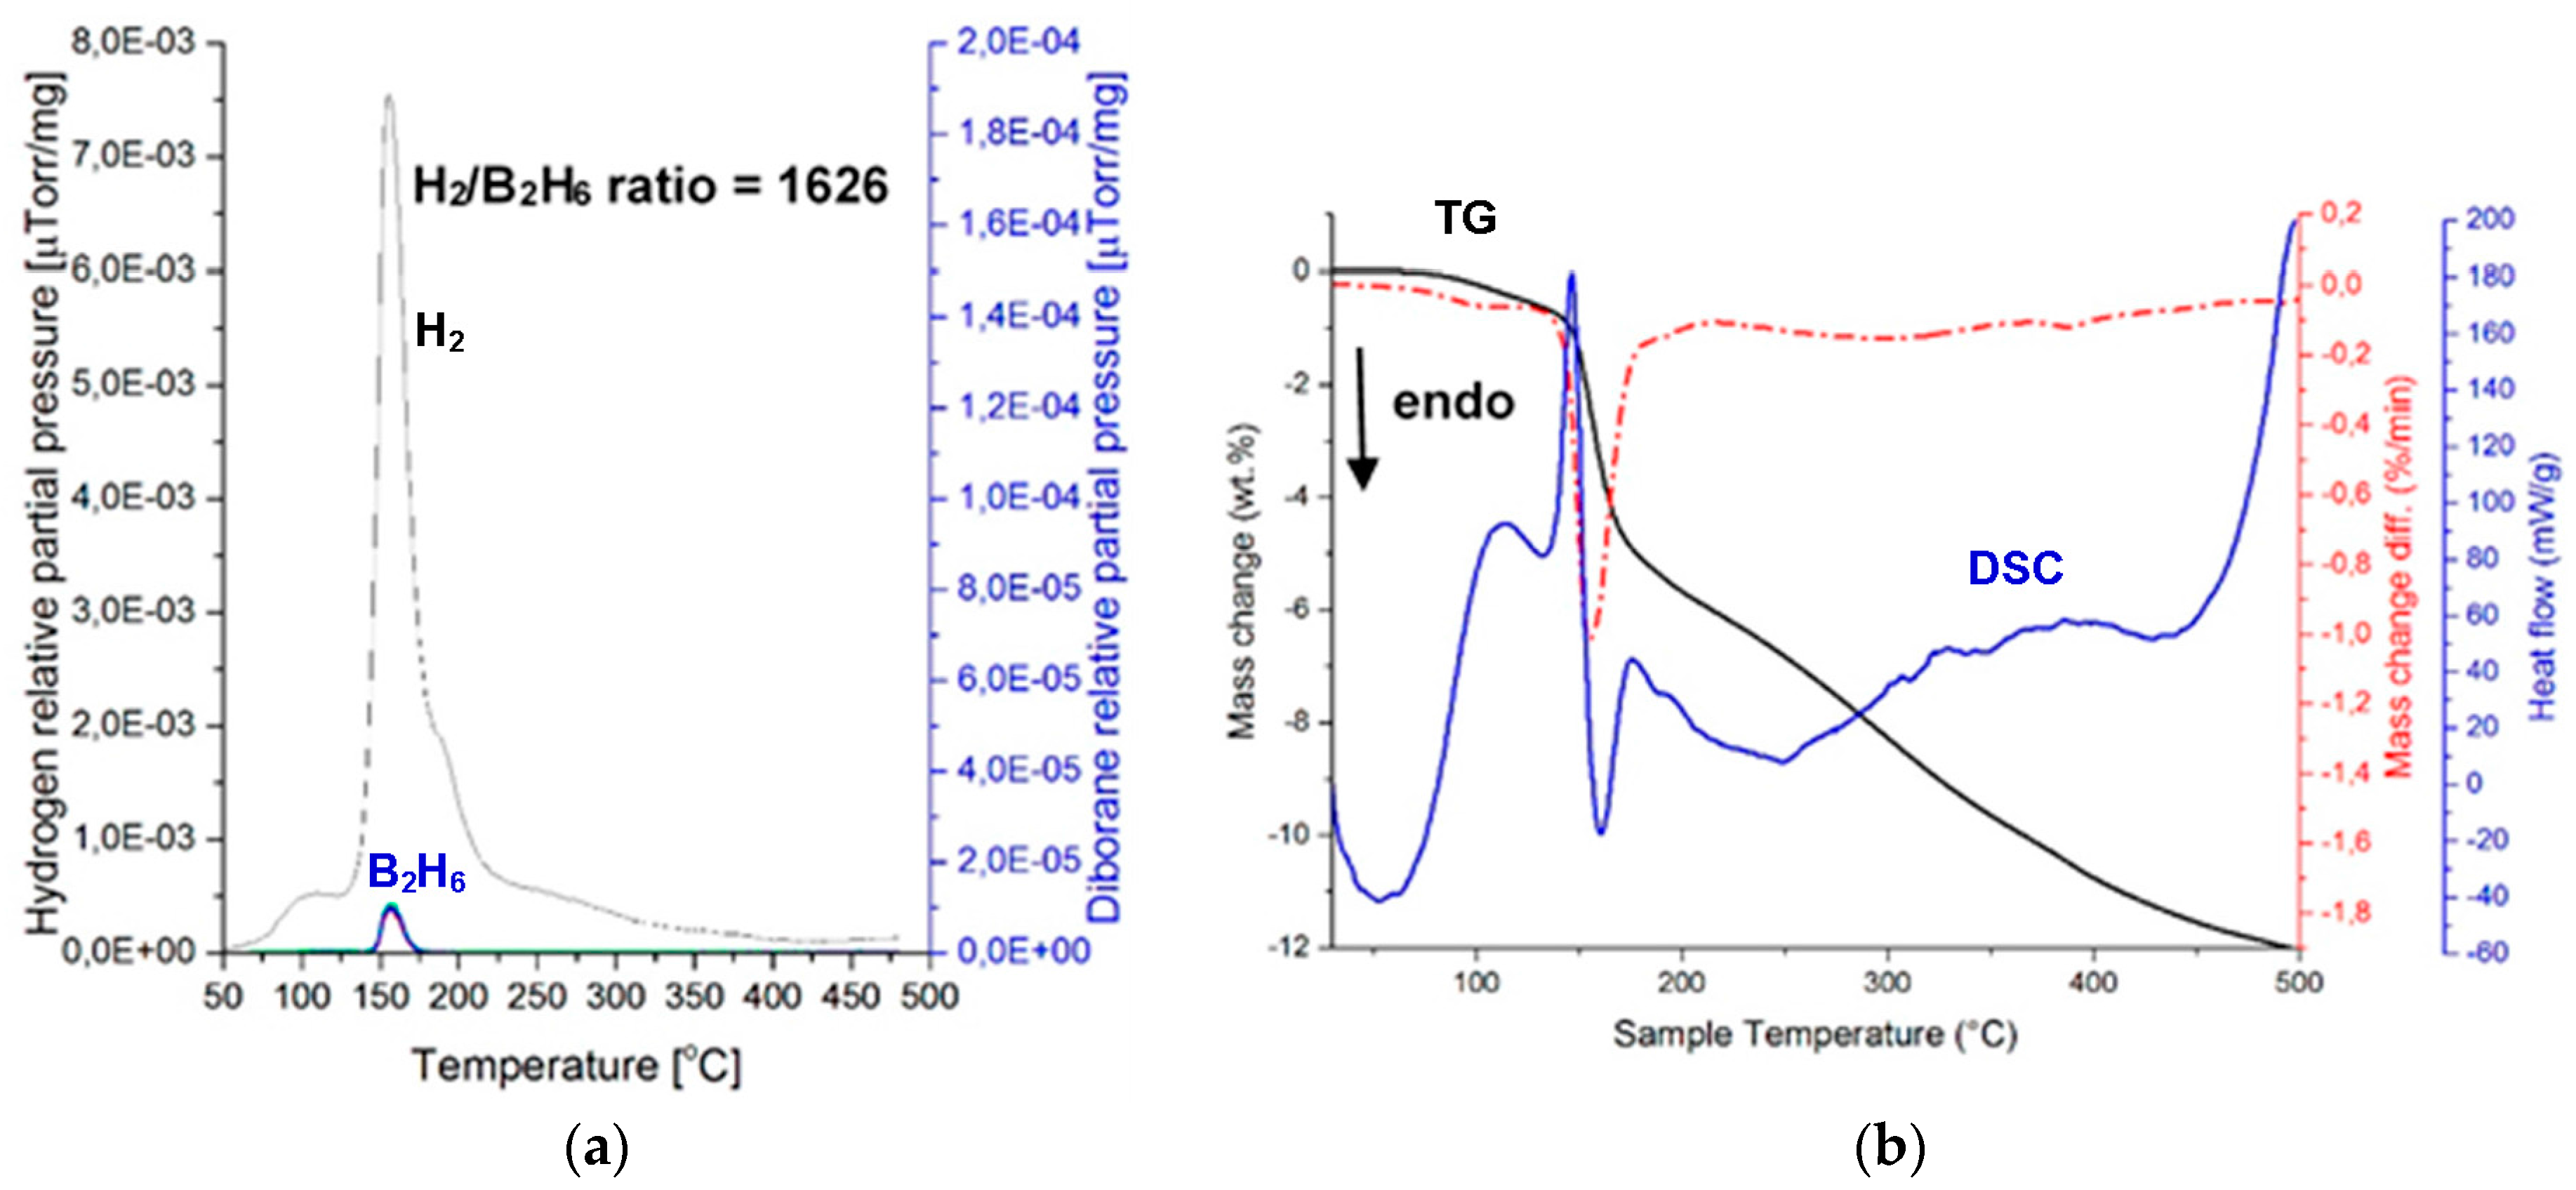
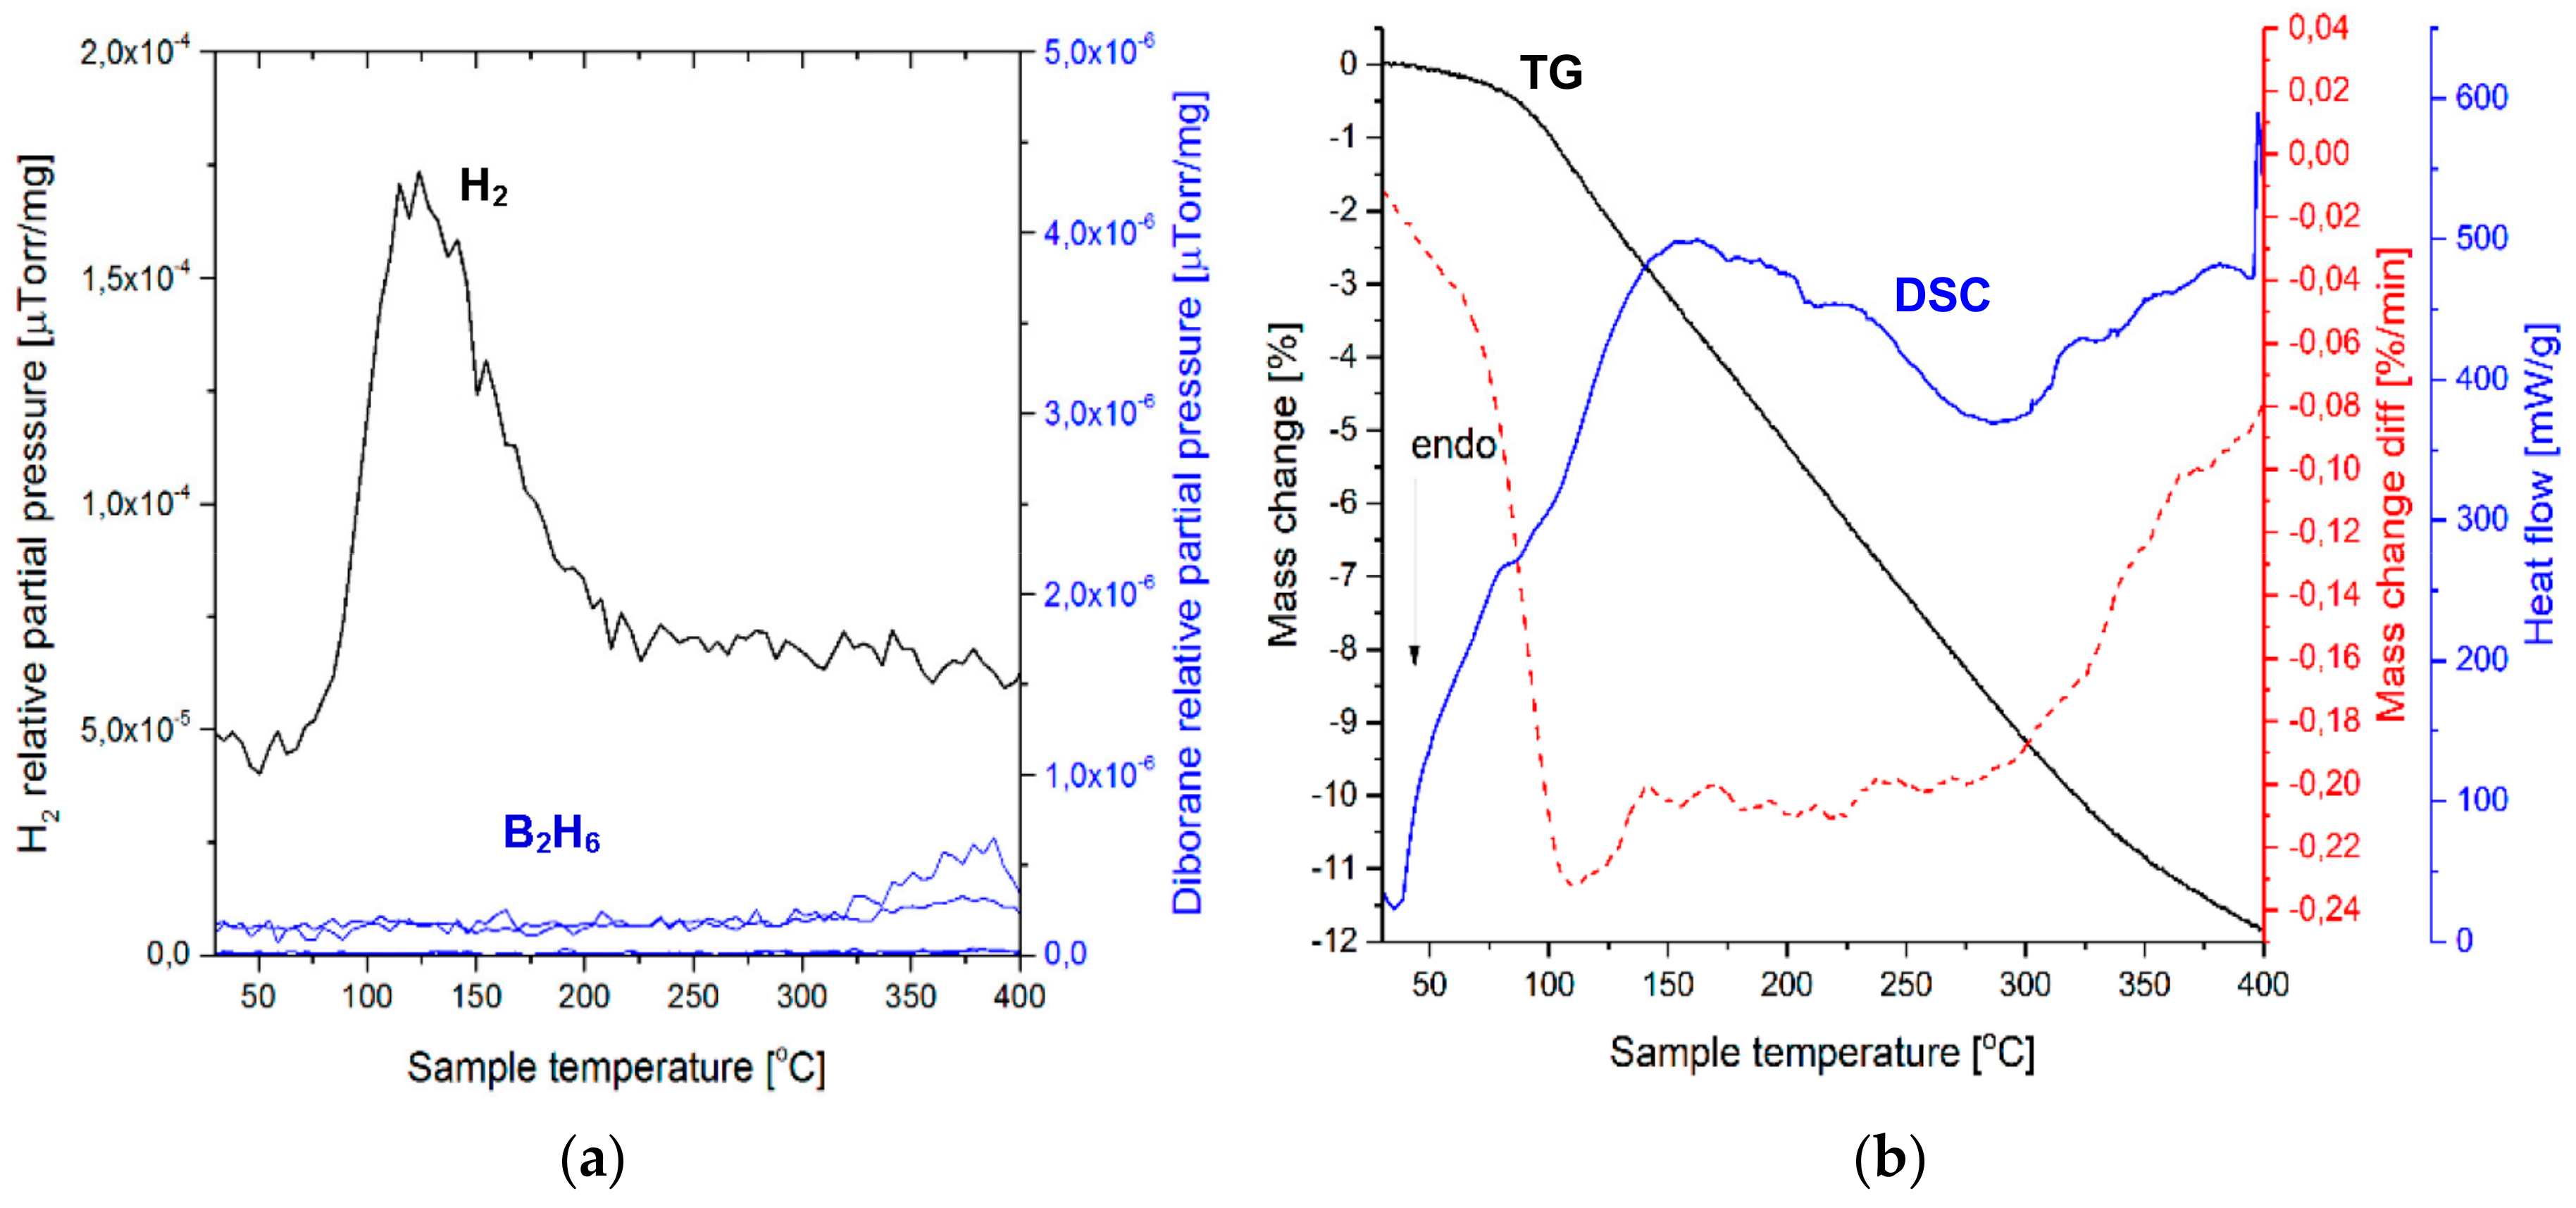
Figure 9 shows MS (gas desorption spectra) of a (H2 + B2H6) mixture (Figure 9a) and the corresponding TGA and DSC thermal decomposition curves (Figure 9b) for the (2NaBH4 + MnCl2) sample ball milled for 1 h (QTR = 72.8 kJ/g), and then extracted at 42 °C. The intensity ratio of the MS H2/B2H6 signal up to 200 °C equals 1626, which is much higher than 948 for a ball milled (2NaBH4 + MnCl2) counterpart [11], and also much higher than the ratio of 200–600 for a ball milled (2LiBH4 + MnCl2)[8]. The second extracted sample, which was investigated by MS, exhibited the MS ratio H2/B2H6 = 1546, which confirms a very low quantity of released B2H6 from the extracted crystalline c-Mn(BH4)2. Apparently, the crystalline c-Mn(BH4)2 hydride that was extracted from the ball milled, additive-free (2NaBH4 + MnCl2), has a very low release of B2H6 during thermal decomposition, which is nearly on par with the ((2NaBH4 + MnCl2) + 5 wt. % graphene) in Figure 3a. Furthermore, as shown in Figure 9b, the DSC decomposition curve for the extracted crystalline c-Mn(BH4)2 hydride still has an endothermic character. The TG curve is also quite peculiar, as it shows a rapid mass loss of about 5.7 wt. % until 200 °C, and then a slower second stage with the total mass loss of about 8 wt. % up to 300 °C. This is rather consistent with the MS curve in Figure 9a, which shows a rapid H2 loss up to ~200 °C and then a slower H2 release up to 300 °C. However, the mass loss still continuous up to 500 °C with a total of 12 wt. % mass loss. The MS curve in Figure 9b also shows slight H2 release between 300 and 500 °C. It is possible that the H2 release/mass loss between 300 and 500 °C is due to decomposition of a small amount of residual NaBH4 whose remnant diffraction peak is observed after ball milling in Figure 8. The residual NaBH4 could have been extracted together with c-Mn(BH4)2 during solvent filtration/extraction.
A similar result was observed when the ball milled ((2NaBH4 + MnCl2) + 5 wt. % Ni) was filtered/extracted (the XRD patterns are not shown here). The same types of peaks associated with crystalline c-Mn(BH4)2 were observed. Interestingly, no Ni peaks were observed in the XRD patterns, which strongly suggests that the ultrafine filamentary Ni did not pass through the syringe filter during filtration. Thus, the catalytic effect of Ni was not observed in the thermal desorption process of the sample containing filamentary Ni.
It must be pointed out that from the Full Width at Half Maximum (FWHM) for the Bragg diffraction peaks for crystalline c-Mn(BH4)2, obtained from three filtered/extracted powder samples, like those in Figure 8, we calculated corresponding crystallite (grain) sizes residing in the powder particles. The results are shown in Table 1.
Experimentally obtained lattice spacings, d(hkl), for crystalline c-Mn(BH4)2, that was solvent extracted from the 0.5 and 1 h ball milled (2NaBH4 + MnCl2) samples, are listed in Table 2. For comparison, the d(hkl) values calculated from synchrotron radiation as reported by Varin et al. [8], and those obtained from selected area electron diffraction pattern (SAEDP) [10], are also included for comparison. The agreement between the d(hkl) values in this work and those reported by Varin et al. [8] and Shirani Bidabadi [10] is very good. Since different precursors and methods for the Mn(BH4)2 synthesis were used in the present work than those reported by Varin et al. [8] and Shirani Bidabadi [10], some small differences in the lattice spacings are expected.
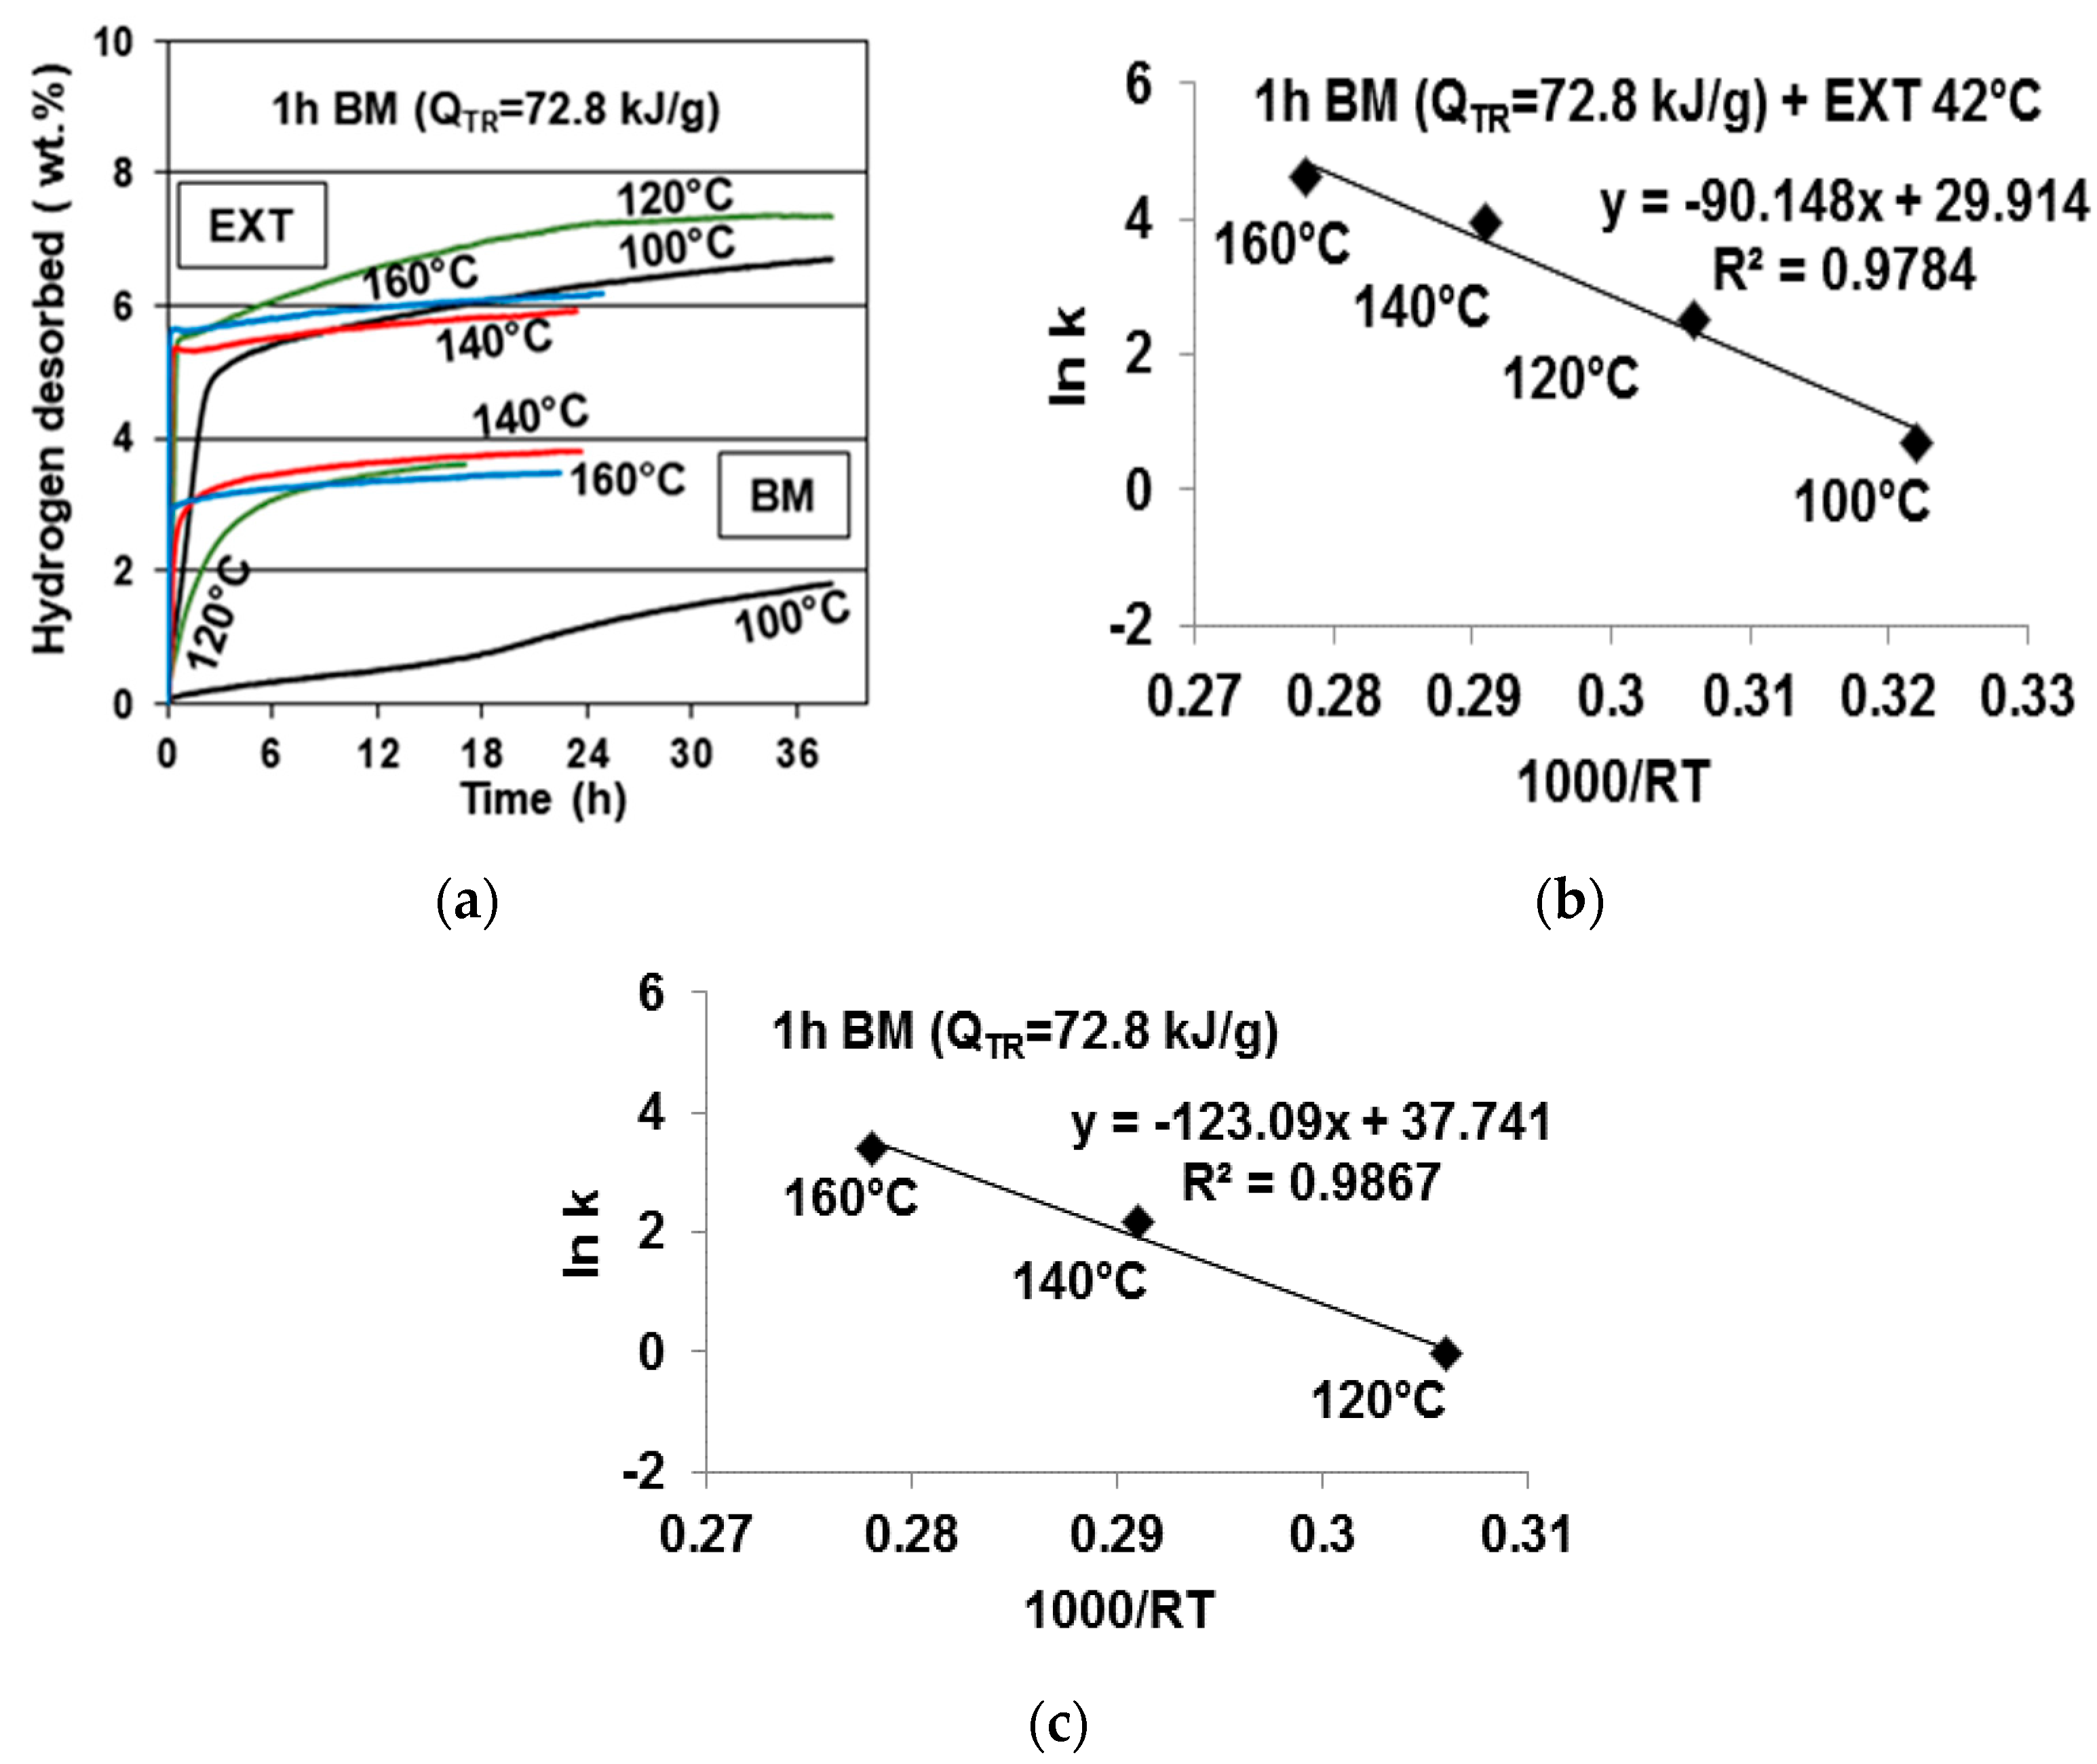
Figure 10a shows a comparison of the thermal desorption curves at four temperatures for the filtered/extracted sample (EXT), and the same (2NaBH4 + MnCl2) sample ball milled (BM) for 1 h before filtration/extraction. It is apparent that all of the desorption curves for each temperature for the filtered/extracted sample (EXT) are located much above their BM counterparts, which indicates a much higher H2 capacity released from the filtered/extracted sample. Within an experimental scatter, the desorption curves approach about 7–7.5 wt. % H2 (as mentioned earlier, due to a very small quantity of released B2H6 (Figure 9a), the y axis for the gas desorption curves in Figure 10a is designated as desorbing solely H2). Desorption at 140 °C and 160 °C seems to be suppressed, for some reasons, after an initial rapid stage as compared with that at 100 °C and 120 °C. Also, the H2 desorption at 100 °C is much faster than that for their ball milled counterpart. Figure 10b shows the Arrhenius plot for the filtered/extracted sample with the estimated AAE of 90.15 kJ/mol. This can be compared with a higher AAE of 123.09 kJ/mol for its ball milled counterpart (Figure 10c [11]). It is quite obvious that the c-Mn(BH4)2 hydride formed after filtration/extraction has much better thermal desorption characteristics than its amorphous a-Mn(BH4)2-type precursor, which was synthesized during ball milling. 
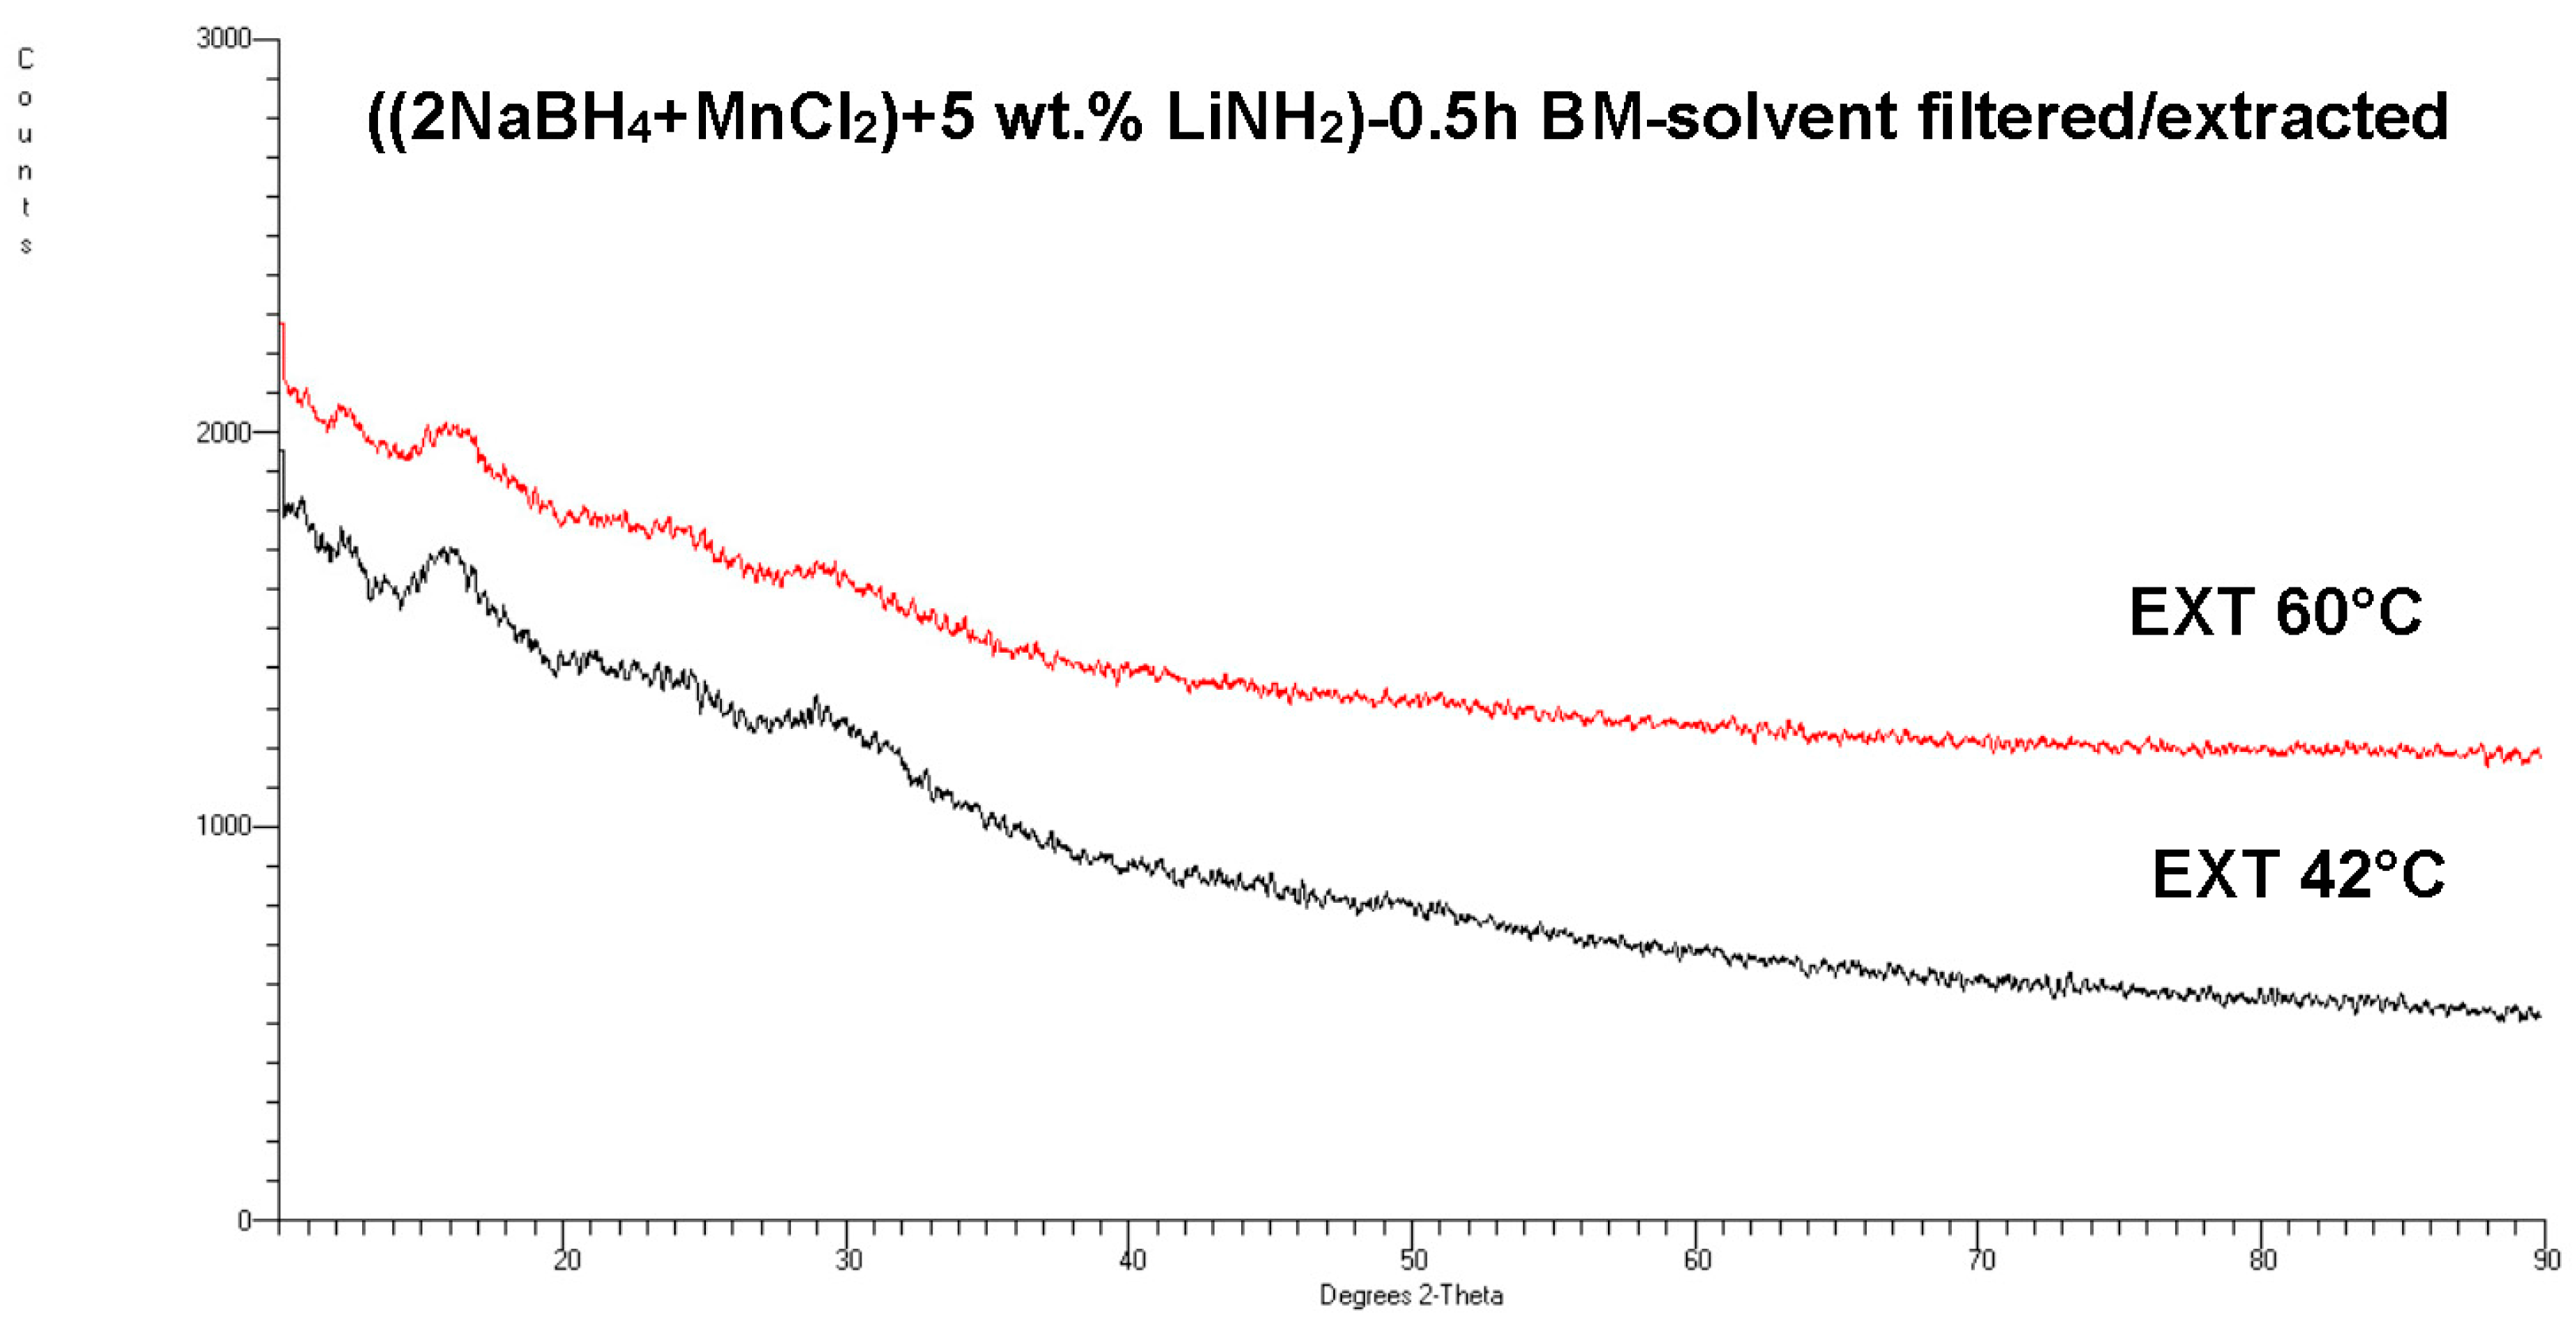
Figure 11 shows an XRD pattern for the 0.5 h BM ((2NaBH4 + MnCl2) + 5 wt. % LiNH2) sample (QTR = 36.4 kJ/g), after filtration/extraction at 42 °C and 60 °C. No diffraction peaks for crystalline c-Mn(BH4)2 are present in Figure 11, which is similar to Figure 8 for an additive-free sample. This result is very striking, since it strongly suggests that the LiNH2 additive suppressed the transformation of an amorphous Mn(BH4)2-type hydride into a crystalline Mn(BH4)2 hydride during solvent extraction.
Figure 12 shows the MS (Figure 12a) and TGA/DSC (Figure 12b) thermal behavior for the same ((2NaBH4 + MnCl2) + 5 wt. % LiNH2) sample, whose XRD pattern is shown in Figure 11. MS shows no presence of desorbed diborane (B2H6), although simultaneously, the H2 capacity is also reduced for reasons that are not clear. However, a complete elimination of B2H6 from the released gas is striking.

3. Discussion

We reported [11] that a mechanochemical reaction occurred during ball milling of NaBH4 and MnCl2. As a result, there was a formation of a solid solution of NaBH4 in NaCl with approximate stoichiometry Na(Cl)x(BH4)(1−x) where 0 < x ≤ 1, which was accompanied by the formation of an amorphous manganese borohydride along the following reaction steps [11]:
2NaBH4 + MnCl2 → BM → a-Mn(BH4)(2x) + 2[Na(Cl)x(BH4)(1−x)] + [(2 − 2x)Cl]
where a-Mn(BH4)(2x) is an amorphous manganese borohydride mechanochemically synthesized during ball milling. This amorphous manganese borohydride is apparently non-stoichiometric, and this non-stoichiometry could prevent attaining a stoichiometric, crystalline structure during the formation of the borohydride by a mechanochemical activation synthesis during ball milling [11]. A full stoichiometry would occur for x = 1, for which the theoretical capacity of reaction (1) would approach 4 wt. % H2. In addition, since x in Equation (1) is expected to be close to 1, the Cl quantity would be miniscule.
As can be seen in Figure 2 and Figure 5, the formation of a non-stoichiometric, amorphous a-Mn(BH4)(2x) hydride through mechanochemical synthesis during ball milling is not affected in any way by additives such as filamentary Ni, graphene, and LiNH2.
The additives of graphene and filamentary Ni do not measurably affect the kinetics of H2 thermal desorption from an amorphous a-Mn(BH4)(2x) synthesized in the ball milled ((2NaBH4 + MnCl2) + 5 wt. % graphene/Ni) samples (Figure 4).
The graphene additive substantially suppresses the quantity of diborane (B2H6) in the gas mixture released thermally up to 200 °C from an amorphous a-Mn(BH4)(2x) mechanochemically synthesized in the 0.5 h BM ((2NaBH4 + MnCl2) + 5 wt. % graphene) sample, to such an extent that the ratio H2/B2H6 = 1844 (Figure 3a) is much higher than the ratio H2/B2H6 = 948 for the additive-free 0.5 h BM (2NaBH4 + MnCl2) sample [11]. The suppression mechanism is not clear yet.
It is found that the most effective suppressor of B2H6 released from an amorphous a-Mn(BH4)(2x) hydride in the ball milled mixtures is the LiNH2 additive. The MS H2/B2H6 intensity ratio increases to a whopping value of about 5000 during thermal release of gas from a-Mn(BH4)(2x) synthesized in a ball milled ((2NaBH4 + MnCl2) + 5 wt. % LiNH2) sample (Figure 6a,c,e).
As shown earlier, the LiNH2 additive is a powerful suppressor of B2H6 released from the ball milled—as well as filtered/extracted—amorphous a-Mn(BH4)(2x), since B2H6 is nearly completely eliminated in all practical terms (Figure 6a,c,e and Figure 12a). We hypothesize that two reactions could be responsible for suppressing the release of B2H6 during thermal decomposition of amorphous hydride:
2LiNH2 + B2H6 → 2LiH + 2BN + 4H2
LiNH2 + B2H6 → LiBH4 + BN + 2H2
Furthermore, one can calculate the standard enthalpy (heat) of reactions (2) and (3), ΔH°(reaction), which is given as the difference between the standard enthalpies (heats) of formation of the products, and the reactants [15] in the following form:
ΔH°(reaction) = ΣΔHf°(products) − ΣΔHf°(reactants)
where ΔHf° represents the standard molar enthalpy of a formation, at 25 °C, of the products and reactants in Equation (4). It should be pointed out that, by definition, the standard enthalpy of the formation of a chemical element in its standard state is zero, ΔHf° = 0 [15]. Taking the standard molar enthalpies of the compound formation from [16,17]: ΔH°f(LiNH2) = −182.12 kJ/mol (−43.5 kcal/mol [17]), ΔH°f (B2H6) = 35.56 kJ/mol, ΔH°f(LiH) = −90.63 kJ/mol, ΔH°f(BN) = −254.39 kJ/mol, ΔH°f(LiBH4) = −190.46 kJ/mol, we obtain
  • For (2), ΔH°(reaction) = [2(−254.39) + 2(−90.63)] − [2(−182) + 35.56] = −361.6 kJ/mol
  • For (3), ΔH°(reaction) = [(−254.39) + (−190.46)] − [(−182) + 35.56] = −298.41 kJ/mol.
For both reactions, the standard enthalpy (heat) is negative, which indicates an exothermic nature of both reactions. This agrees well with the exothermic character of the DSC curve for the sample with the LiNH2 additive in Figure 6b,d,f, for the non-stoichiometric, amorphous a-Mn(BH4)(2x) hydride, synthesized by ball milling. In addition, it agrees well with the exothermic character of the DSC curve for the same LiNH2-bearing sample with a DSC plot in Figure 12b, which shows a broad exothermic curve for an amorphous a-Mn(BH4)(2x) hydride retained after solvent extraction (Figure 11). However, reactions (2) and (3), even if they thermodynamically agree with the exothermic character of the experimental DSC curves, still require a formation of compounds, such as LiH (Equation (2)), LiBH4 (Equation (3)), and BN (both) after desorption. The diffraction peaks of those compounds are not observed in the XRD pattern in Figure 5 for the (2NaBH4 + MnCl2) + 5 wt. % LiNH2) sample, which was ball milled for 0.5 and 1 h, and subsequently desorbed at 100 °C for 36 h. It could be hypothesized that LiH, LiBH4, and BN were formed as amorphous compounds. Still, more studies are required to confirm that hypothesis.
In general, the crystalline c-Mn(BH4)2 hydride, which was formed during a solvent filtration/extraction process, releases a lower quantity of B2H6 (Figure 9a) than its amorphous a-Mn(BH4)(2x) counterpart [11].
The endothermic character of thermal gas desorption reaction in DSC is preserved regardless of the type of hydride, whether either amorphous a-Mn(BH4)(2x) in the additive-free, ball milled (2NaBH4 + MnCl2) samples [11], or that ball milled with the graphene additive (Figure 3b), or c-Mn(BH4)2 in the filtered/extracted sample (Figure 9b). That confirms that it is still a Mn(BH4)2-type hydride, regardless of it being amorphous or crystalline.
Surprisingly, as shown in Figure 11, the LiNH2 additive seems to suppress the formation of a crystalline c-Mn(BH4)2 hydride upon a phase transformation occurring during hydride extraction from the Et2O solvent. The extracted hydride apparently still remains an amorphous a-Mn(BH4)(2x) hydride. However, the extracted amorphous hydride still releases H2 upon its thermal decomposition, as shown in Figure 12a. However, the quantity of desorbed H2 is smaller than that observed for both additive-free and additive-bearing ball milled amorphous a-Mn(BH4)(2x) (Figure 4a,c,e and Figure 10a-BM curves) and extracted crystalline c-Mn(BH4)2 (Figure 10a-EXT curves). At the moment, it’s hard to propose any reasonable mechanism by means of which the LiNH2 additive could suppress the transformation of a non-stoichiometric, amorphous a-Mn(BH4)(2x) hydride into its crystalline form upon extraction from the Et2O solvent. More studies are needed.
Finally, it must be pointed out that the crystalline c-Mn(BH4)2 hydride is, in reality, nanocrystalline, having nanograins (Table 1) embedded within the “slabs” shown in Figure 7.

4. Materials and Methods

Manganese chloride (MnCl2) (purity 99.99%) and sodium borohydride (NaBH4) (purity 98%) were purchased from Alfa Aesar Canada. The powders were mixed in a 2:1 molar ratio. The pre-mixed mixture was ball milled for 0.5 and 1 h in the magneto mill, Uni-Ball-Mill 5 [3,18,19,20], which is manufactured by A.O.C. Scientific Engineering Pty Ltd. (Wollongong, Australia). Cover atmosphere in the vial was provided using ultra-high purity hydrogen gas (purity 99.999%: O2 < 2 ppm; H2O < 3 ppm; CO2 < 1 ppm; N2 < 6 ppm; CO < 1 ppm; THC < 1 ppm) at 450 kPa pressure. The milling process was carried out using the strong impact mode (IMP68) with two magnets positioned at 6 and 8 o’clock, at a distance of 10 and 2 mm from the vial, respectively. An air-tight milling vial with an O-ring and a pressure valve mounted on the lid was loaded with a powder mixture for ball milling. The vial contained four hardened steel balls, which resulted in a ball-to-powder weight ratio (R) of 132. The rotational speed of the milling vial was set to 200 rpm. During the milling process, two fans were continuously cooling the vial. The pressure increase in the milling vial was measured every few minutes using a pressure gauge (with an accuracy of ±0.1 wt. % H2) in order to monitor the release of hydrogen (if any) during ball milling.
Three other mixtures were prepared using the same 2:1 molar ratio of NaBH4 and MnCl2. The first mixture was made with the addition of 5 wt. % ultrafine filamentary carbonyl nickel (Ni) supplied by Canadian New Energy/Electronic Materials Corporation (Cnem Corp) (Mississauga, Canada) and referred to as “filamentary Ni” in the text. The second one was prepared with the addition of 5 wt. % flake-reduced graphene oxide (FL-rGO), referred to as “graphene”, obtained from Nanomaterials (http://www.nanomaterials.pl). The FL-rGO product consists of two to three stacked nanostructure graphene layers, and contains ~9.6 wt. % % of oxygen and ~1 wt. % H2 (the exact chemical elemental analysis can be found at http://www.nanomaterials.pl). The graphene product is amorphous and contains 26–30 at. % of oxygen. A third mixture containing 5 wt. % LiNH2 (95% purity) obtained from Sigma Aldrich with a purity of 95% was also prepared.
All of the processes during preparation of the samples were handled in a glove box containing moisture-absorbing Drierite granulated compound, which greatly prevented undesirable reactions between the powder samples and moisture or oxygen in air. Before handling, the glove box was purged a few times with high purity argon gas (99.999% purity) in order to minimize any possible contamination.
A schematic of the solvent filtration/extraction method performed in this work is shown in Figure 13. The ball milled (2NaBH4 + MnCl2) powder was mixed with diethyl ether (Et2O) in a 1:28 mass ratio (1:16.5 for the mixture with LiNH2) in Flask 1, and Flask 1 subsequently was swirled for 20–22 min in order to dissolve the newly formed amorphous a-Mn(BH4)2 hydride in the Et2O solvent and separate it from NaCl. A rubber stopper was used during this dissolution process.
The suspension after swirling was injected into a 60 mL BD type syringe with a central nozzle and conical end (a Henke-Sass Wolf (HSW) type, 60 mL syringe with flat end and a central nozzle was used for the sample with LiNH2). Subsequently, a 0.2 µm syringe was used for filtering the suspension into Flask 2. As a result of filtering, NaCl was collected at the filter, and the suspended Mn(BH4)2-type hydride was allowed to pass through the filter. In turn, the solid Mn(BH4)2-type hydride was obtained by evaporation of Et2O from the suspension. The evaporation process of filtered suspension contained in Flask 2 was carried out on a hot plate at a temperature of 42 °C for 20–25 min (6–7 min for the mixture with the LiNH2 additive), accompanied by a simultaneous vigorous stirring at 1000 rpm to agitate the solution. A yield of 49.6% of the crystalline c-Mn(BH4)2 hydride was obtained from the additive-free and graphene/Ni-containing samples. The solvent extraction procedure was carried out entirely in the glove box that was purged and subsequently filled up with high purity argon gas (99.999% purity).
A second generation volumetric Sieverts-type apparatus [3,21] custom-built by A.O.C. Scientific Engineering Pty Ltd., Wollongong, Australia was used for the evaluation of thermal gas desorption. A powder sample was loaded into a stainless steel reactor of this apparatus, which was built entirely of 316 austenitic stainless steel, in a glove box under high purity argon. A subsequent transfer to the main unit of the volumetric Sieverts apparatus was done in a sealed reactor without any exposure to the environment. In desorption measurements, the samples with the masses of 30–40 mg were used. Before initiation of the desorption test, ultra-high purity hydrogen was used for purging the inner tubing of the apparatus, usually four times. The furnace of the apparatus was heated separately to the desired test temperature and subsequently inserted onto a tightly sealed powder sample reactor, inside which an atmospheric pressure of 1 bar H2 was kept. Normally, the powder sample in the reactor reached the furnace temperature of 100–200 °C within the period of ~400 s, which is negligible compared to desorption completion time, and makes the test isothermal. The plotted desorption curves were corrected for the hydrogen gas expansion due to the increase in temperature. The quantity of desorbed hydrogen in wt. % with respect to the total weight of powder sample was calculated from the ideal gas law, as described by Varin et al. [3]. The calibrated accuracy of desorbed hydrogen capacity was about ±0.1 wt. % H2, while the accuracy of temperature reading and stabilization was ±0.1 °C.
A simple Arrhenius equation [3] was used for the calculation of the apparent activation energy for volumetric hydrogen desorption, using the registered dehydrogenation curves, as reported by Sandrock et al. [22]:
k = k 0 e Ea RT
where k is the slope of the linear portion of volumetric hydrogen desorption curves (rate of hydrogen desorption-wt. % H2/h) recorded by the Sieverts-type apparatus, Ea is the apparent activation energy in kJ/mol, R is the gas constant (8.314472 J/mol/K), T is absolute temperature (K), and k0 is a constant. The measured rates were plotted in the Arrhenius form as ln k vs. 1000/RT.
The crystalline structure of the powders was characterized by a Bruker D8 X-ray diffractometer using a monochromated Cu Kα1 radiation (λ = 0.15406 nm) with an accelerating voltage of 40 kV and a current of 30 mA. The scan range was from 2Θ = 10° to 90° at the rate of 1.2°/min, with a step size of 0.02°. The powder sample was loaded in the glove box into a homemade brass holder with Cu/glass plates and a polymeric Kapton window transmittable to X-ray in the upper part of the sample holder. The crystallite (grain) size of the crystalline c-Mn(BH4)2 obtained from solvent extraction was estimated by a well-known Scherrer method [3] using the four to five strongest diffraction peaks of the Mn(BH4)2 pattern.
The LEO 1550 high resolution, field emission scanning electron microscope (FESEM) working in a secondary electron mode (SE) with the accelerating voltage of 10 kV was used to study the morphology of the powders. After dispersing the powders on a sticky carbon tape in a glove box filled with high purity argon, the tapes were quickly transferred to the SEM sample holder.
The differential scanning calorimetry (DSC) analysis was conducted simultaneously with the thermogravimetric analysis (TGA) on a Setaram Sensys Evo 3d analyzer (France). The analyzer was coupled with a quadrupole mass spectrometer Hiden Analytical (United Kingdom). Each powdered sample (10–30 mg) was loaded into an alumina crucible of 100 µL volume and covered with alumina powder almost to the top of the crucible to prevent the oxidation and hydrolysis during the quick transfer to the analyzer, and also to avoid a volatile foaming and flowing out of the crucible if the powder sample melted. After loading to the analyzer, each sample was flushed with high purity helium gas (<10 ppm O2 and H2O, BIP quality, Air Products) for 90 min, and after that, heating of sample was performed from 30 to 500 °C with the rate of 5 °C/min. Carrier helium gas flow was set to 28 mL/min. For the assessment of the levels of H2 and B2H6, the Hiden Analytical mass spectrometer was set up to analyze the intensity of ions exhibiting the following ratios of m/z: 2 (H2), 27 (B2H6), 26 and 24. The last two correspond to the species that may form during the decomposition of B2H6. For graph plotting, the measured pressure of released gases was normalized by the mass of the powder sample, as first reported by Varin et al. [11]. Such an approach allows a direct qualitative comparison of the released gas peak intensities on the MS graphs. The normalizing approach avoids misleading differences in signal intensities, which can be caused by varying the masses of the samples.

Acknowledgments

This research was supported by a Natural Sciences and Engineering Research Council (NSERC) of Canada Discovery grant to Robert A. Varin which is gratefully acknowledged. The authors also thank John Shu (CEO) from Cnem Corp. Canada for donating ultrafine filamentary carbonyl Ni.

Author Contributions

Robert A. Varin and Deepak K. Mattar conceived and designed the experiments; Deepak K. Mattar, Marek Polanski, Amirreza Shirani Bidabadi and Leszek Stobinski performed the experiments; Robert A. Varin, Deepak K. Mattar and Marek Polanski analyzed the data; Leszek Stobinski contributed graphene; Robert A. Varin wrote the paper.

Conflicts of Interest

The authors declare no conflict of interest. The founding sponsors had no role in the design of the study; in the collection, analyses, or interpretation of data; in the writing of the manuscript, and in the decision to publish the results.

References

  1. Scott, D.S. Smelling Land-The Hydrogen Defense against Climate Catastrophe; Canadian Hydrogen Association: Westmount, QC, Canada, 2007. [Google Scholar]
  2. Bockris, J.O.M. Will lack of energy lead to the demise of high technology countries in this century? Int. J. Hydrogen Energy 2007, 32, 153–158. [Google Scholar] [CrossRef]
  3. Varin, R.A.; Czujko, T.; Wronski, Z.S. Nanomaterials for Solid State Hydrogen Storage; Springer Science and Business Media: New York, NY, USA, 2009. [Google Scholar]
  4. Varin, R.A.; Wronski, Z.S. Progress in hydrogen storage in complex hydrides. In Renewable Hydrogen Technologies, Production, Purification, Storage, Applications and Safety; Gandia, I.M., Arzamendi, G., Dieguez, P.M., Eds.; Elsevier: Amsterdam, The Netherlands, 2013; Chapter 13; pp. 293–332. [Google Scholar]
  5. Varin, R.A.; Shirani Bidabadi, A.R. Nanostructured, complex hydride systems for hydrogen generation. AIMS Energy 2015, 3, 121–143. [Google Scholar] [CrossRef]
  6. Černý, R.; Penin, N.; Hagemann, H.; Filinchuk, Y. The first crystallographic and spectroscopic characterization of a 3d-metal borohydride: Mn(BH4)2. J. Phys. Chem. C 2009, 113, 9003–9007. [Google Scholar] [CrossRef]
  7. Varin, R.A.; Zbroniec, L. The effects of ball milling and nanometric nickel additive on the hydrogen desorption from lithium borohydride and manganese chloride (3LiBH4+MnCl2) mixture. Int. J. Hydrogen Energy 2010, 35, 3588–3597. [Google Scholar] [CrossRef]
  8. Varin, R.A.; Zbroniec, L.; Polanski, M.; Filinchuk, Y.; Černý, R. Mechano-chemical synthesis of manganese borohydride (Mn(BH4)2) and inverse cubic spinel (Li2MnCl4) in the (nLiBH4+MnCl2) (n = 1, 2, 3, 5, 9 and 23) mixtures and their dehydrogenation behavior. Int. J. Hydrogen Energy 2012, 37, 16056–16069. [Google Scholar] [CrossRef]
  9. Varin, R.A.; Shirani Bidabadi, A.R. The effect of milling energy input during mechano-chemical activation synthesis (MCAS) of the nanocrystalline manganese borohydride (Mn(BH4)2) on its thermal dehydrogenation properties. Int. J. Hydrogen Energy 2014, 39, 11620–11632. [Google Scholar] [CrossRef]
  10. Shirani Bidabadi, A.R.; Korinek, A.; Botton, G.A.; Varin, R.A. High resolution transmission electron microscopy (TEM), energy-dispersive X-ray spectroscopy (EDS) and X-ray diffraction studies of nanocrystalline manganese borohydride (Mn(BH4)2) after mechano-chemical synthesis and thermal dehydrogenation. Acta Mater. 2015, 100, 392–400. [Google Scholar] [CrossRef]
  11. Varin, R.A.; Mattar, D.K.; Shirani Bidabadi, A.; Polanski, M. Synthesis of amorphous manganese borohydride in the (NaBH4–MnCl2) system, its hydrogen generation properties and crystalline transformation during solvent extraction. J. Energy Chem. 2017, 26, 24–34. [Google Scholar] [CrossRef]
  12. Song, Y.; Fang, F.; Li, Y.; Zhao, Q.; Sun, D.; Zhang, Q.; Ouyang, L.; Zhu, M. Promoted hydrogen release from 3LiBH4/MnF2 composite by doping LiNH2: Elimination of diborane release and reduction of decomposition temperature. Int. J. Hydrogen Energy 2012, 37, 18074–18079. [Google Scholar] [CrossRef]
  13. Parviz, R.; Varin, R.A. Combined effects of molar ratio and ball milling energy on the phase transformations and mechanical dehydrogenation in the lithium amide-magnesium hydride (LiNH2 + nMgH2) (n = 0.5–2.0) nanocomposites. Int. J. Hydrogen Energy 2013, 38, 8313–8327. [Google Scholar] [CrossRef]
  14. Tumanov, N.; Safin, D.; Richter, B.; Łodziana, Z.; Jensen, T.; Garcia, Y.; Filinchuk, Y. Challenges in the synthetic routes to Mn(BH4)2: Insight into intermediate compounds. Dalton Trans. 2015, 44, 6571–6580. [Google Scholar] [CrossRef] [PubMed]
  15. Chemistry LibreTexts. Available online: http://chemwiki.ucdavis.edu/Physical_Chemistry/Thermodynamics/State_Functions/Enthalpy/Standard_Enthalpy_Of_Formation (accessed on 24 October 2017).
  16. Standard Thermodynamic Values at 25 °C (for B2H6, LiH, BN and LiBH4). Available online: http://chemistry-reference.com/standard%20thermodynamic%20values.pdf (accessed on 24 October 2017).
  17. (For LiNH2). FMC Lithium. Available online: http://www.fmclithium.com/Portals/FMCLithium/content/docs/DataSheet/QS-PDS-011%20r1.pdf (accessed on 24 October 2017).
  18. Calka, A.; Radlinski, A.P. Universal high performance ball-milling device and its application for mechanical alloying. Mater. Sci. Eng. A 1991, 134, 1350–1353. [Google Scholar] [CrossRef]
  19. Ninham, B.W.; Calka, A. Ball Milling Apparatus and Method, and Production of Metallic Amorphous Materials. Patent WO9104810, US5383615, CA2066740, EP0494899, AU643949, 3 October 1991. [Google Scholar]
  20. Calka, A.; Varin, R.A. Application of Controlled Ball Milling in Materials Processing. In International Symposium on Processing and Fabrication of Advanced Materials IX (PFAM IX); Srivatsan, T.S., Varin, R.A., Khor, M., Eds.; ASM International: Materials Park, OH, USA, 2001; pp. 263–287. [Google Scholar]
  21. Varin, R.A.; Li, S.; Wronski, Z.; Morozova, O.; Khomenko, T. The effect of sequential and continuous high-energy impact mode on the mechano-chemical synthesis of nanostructured complex hydride Mg2FeH6. J. Alloys Compd. 2005, 390, 282–296. [Google Scholar] [CrossRef]
  22. Sandrock, G.; Gross, K.; Thomas, G.; Jensen, C.; Meeker, D.; Takara, S. Engineering consideration in the use of catalyzed sodium alanates for hydrogen storage. J. Alloys Compd. 2002, 330–332, 696–701. [Google Scholar] [CrossRef]
Figure 1. Scanning electron micrographs (SEM) of (a) as-received ultrafine filamentary Ni; (b) as-received graphene (flake-reduced graphene oxide-(FL-rGO)); (c) 1 h BM ((2NaBH4 + MnCl2) + 5 wt. % Ni) mixture and (d) 0.5 h BM ((NaBH4 + MnCl2) + 5 wt. % graphene) mixture.
Energies 10 01741 g001
Figure 2. X-ray diffraction (XRD) patterns for the (2NaBH4 + MnCl2) sample additive-free, and with 5 wt. % additives of filamentary Ni and graphene, ball milled (BM) for 0.5 h.
Energies 10 01741 g002
Figure 3. (a) Mass spectrometry (MS) (gas desorption spectra) of a (H2 + B2H6) gas mixture for a ((2NaBH4 + MnCl2) + 5 wt. % graphene) sample, ball milled (BM) for 0.5 h (QTR = 36.4 kJ/g). (b) TGA and differential scanning calorimeter (DSC) curves during desorption. Heating rate 5 °C/min.
Energies 10 01741 g003
Figure 4. Desorption curves for the (2NaBH4 + MnCl2) samples milled with additives: (a) filamentary Ni for 0.5 h BM; QTR = 36.4 kJ/g; (b) corresponding Arrhenius plot of rate constant k with temperature for estimation of the apparent activation energy (AAE) of hydrogen desorption for 0.5 h BM 5 wt. % Ni: y = −116.68 + 36.24, R2 = 0.948; (c) filamentary Ni for 1 h BM; QTR = 72.8 kJ/g; (d) corresponding Arrhenius plot for 1 h BM 5 wt. % Ni: y = −115.19 + 35.759; R2 = 0.998; (e) graphene for 0.5 h BM; QTR = 36.4 kJ/g; (f) corresponding Arrhenius plot for the 0.5 h BM 5 wt. % graphene sample: y = −125.93 + 38.323; R2 = 0.996.
Energies 10 01741 g004
Figure 5. X-ray diffraction (XRD) patterns for the (2NaBH4 + MnCl2) + 5 wt. % LiNH2), ball milled (BM) for 0.5 and 1 h and the 1 h BM sample after desorption at 100 °C for 36 h, as compared to the XRD patterns for the initial mixture of reactants NaBH4 and MnCl2.
Energies 10 01741 g005
Figure 6. Mass spectrometry (MS) (gas desorption spectra) of a (H2 + B2H6) mixture, and the TGA and DSC curves during gas desorption for a ((2NaBH4 + MnCl2) + 5 wt. % LiNH2) sample, BM for 0.5 h (QTR = 36.4 kJ/g). Heating rate 5 °C/min. (a,b) sample 1, (c,d) sample 2, and (e,f) sample 3.
Energies 10 01741 g006
Figure 7. Scanning electron micrographs (SEM) of the 1 h BM (2NaBH4 + MnCl2) sample, subsequently filtered/extracted at 42 °C. (a) Low and (b) high magnification.
Energies 10 01741 g007
Figure 8. XRD patterns of the 0.5 h BM sample, solvent extracted at 42 °C for 20 min (center) in comparison to the XRD patterns of the 0.5 h BM (2NaBH4 + MnCl2) (bottom) and (2LiBH4 + MnCl2) (top) samples. From Varin et al. [11].
Energies 10 01741 g008
Figure 9. (a) Mass spectrometry (MS) (gas desorption spectra) of a (H2 + B2H6) mixture for a (2NaBH4 + MnCl2) sample, ball milled (BM) for 1 h (QTR = 72.8 kJ/g) and subsequently extracted at 42 °C/25 min using solvent filtration method. (b) TGA and DSC curves during desorption. Heating rate 5 °C/min.
Energies 10 01741 g009
Figure 10. (a) H2 desorption curves for a pre-milled and filtered/extracted (2NaBH4 + MnCl2) sample (EXT) as compared with the same ball 1 h (QTR = 72.8 kJ/g) ball milled sample (BM). (b) The Arrhenius plot of rate constant k with temperature for the estimation of the apparent activation energy (AAE) of hydrogen desorption from the filtered/extracted sample. (c) The Arrhenius plot for the same sample just after 1 h BM [11].
Energies 10 01741 g010
Figure 11. XRD pattern for the ((2NaBH4 + MnCl2) + 5 wt. % LiNH2) sample, ball milled for 0.5 h (QTR = 36.4 kJ/g) and subsequently filtered/extracted (EXT) at 42 °C and 60 °C using an evaporation time of 6–7 min.
Energies 10 01741 g011
Figure 12. (a) Mass spectrometry (MS) (gas desorption spectra) for a ((2NaBH4 + MnCl2) + 5 wt. % LiNH2) sample ball milled for 0.5 h (QTR = 36.4 kJ/g) and then extracted at 42 °C/6–7 min evaporation time, using solvent filtration method. (b) TGA and DSC curves during desorption. Heating rate 5 °C/min.
Energies 10 01741 g012
Figure 13. A schematic explaining the solvent extraction methodology employed in the present work used for a separation of crystalline c-Mn(BH4)2 from the mixture with NaCl-type salt.
Energies 10 01741 g013
Table 1. Results of the calculations of grain (crystallite) size for the filtered/extracted crystalline c-Mn(BH4)2, from three extracted (2NaBH4 + MnCl2) samples. The Bragg diffraction peak positions 2θ (deg) and full width at half maximum (FWHM) for a corresponding Bragg peak and crystallite (grain) size, D, are listed.
Sample #2θ (deg)FWHM β (deg)D (nm)
119.1770.230335.02
19.7950.179145.02
21.4230.204739.57
22.2670.179145.20
23.0601.63744.94
29.3381.22806.70
219.0720.204739.43
19.7050.204739.47
21.3300.179145.21
29.1140.614013.37
319.1710.204739.43
19.7270.179145.06
21.3980.179145.12
29.1460.307026.76
Table 2. Experimental lattice spacings, d(hkl), for filtered/extracted, crystalline c-Mn(BH4)2 obtained in this work from the 0.5 and 1h ball milled (2NaBH4 + MnCl2) samples, compared to d(hkl) values calculated from synchrotron radiation [8] and to the experimental ones obtained from SAEDP (selected area electron diffraction pattern) by Shirani Bidabadi et al. [10].
Calculated d(hkl) (Å) for Crystalline Mn(BH4)2 in (2LiBH4+MnCl2) from the Bragg’s Law Using Data and λ = 0.73065 Å for Synchrotron Radiation [8]Experimental d(hkl) (Å) for Crystalline Mn(BH4)2 from SAED [10] in (2LiBH4+MnCl2)Experimental d(hkl) (Å) for Extracted Crystalline Mn(BH4)2 in (2NaBH4+MnCl2) 0.5h BM; Extr. 42 °C-20 min [11]Experimental d(hkl) (Å) for Extracted Crystalline Mn(BH4)2 in (2NaBH4+MnCl2) 1 h BM; Extr. 42 °C-25 min (this work)
8.883-----
---5.310
5.242---5.2075.184
---4.887
4.689---4.6234.635
4.552---4.4764.487
4.185---4.1344.148
3.961----3.984
---3.888
3.4613.46--
3.4383.433.389-
2.9232.892.8722.881

