Analysis of the Optimum Solar Collector Installation Angle from the Viewpoint of Energy Use Patterns


1
Architectural Engineering Major, Division of Urban, Architecture and Civil Engineering, Dong-Eui University, Busan 47340, Korea
2
Department of Architectural Engineering, ERI, Gyeongsang National University, Jinju 52828, Korea
3
Department of Architectural Engineering, Pusan National University, Busan 46241, Korea
*
Author to whom correspondence should be addressed.
Energies 2017, 10(11), 1753; https://doi.org/10.3390/en10111753
Submission received: 8 September 2017
/
Revised: 21 October 2017
/
Accepted: 21 October 2017
/
Published: 2 November 2017
(This article belongs to the Section D: Energy Storage and Application)
Abstract
:While solar energy is the most efficient energy source for heating, many problems can occur when the capacity selection of the system is wrong: a definite possibility in a place where the seasonal climate change is large, such as Korea. For example, if a system is designed for use in the winter, the system will be overloaded if it does not discard the energy it collects during the summer months. Conversely, if the capacity of the system is in accordance with the summer season demand, it will be necessary to input supplementary energy in the winter season. Solar energy also depends on the altitude and azimuth of the sun, and the amount of energy collected on the slope depends on the latitude of the area in which it is installed. Therefore, this study is divided into investigating the collection energy, heat radiation energy and auxiliary energy input according to the installation angle of the solar collector and the capacity of the heat storage tank according to latitude of the installation area. To this end, we formulate appropriate energy equations. Simulation coding was performed to track the temperature changes in each part. Additionally, we considered the amount of solar energy that can be effectively used, not simply the amount of solar energy collected, by substituting the actual hot water usage schedule.
1. Introduction
Worldwide energy use has recently been trending upward and in most cases fossil fuels are still being used as the main energy sources. However, using fossil fuels has its limitations and there is active research to develop measures that can cope with the increasing greenhouse effect and the environmental destruction arising from fossil fuel use [1].
Solar energy, among the various alternative types of new and renewable energy, is highly efficient and serviceable because solar radiation energy can be utilized directly for heating [2]. However, the efficiency and performance of the solar hot water supply system depends largely on the incident angle of solar energy [3]. In order to solve this problem, studies are being performed to determine the optimum installation and solar azimuth angles of the solar collector, for a specific installation latitude of the system. To find the optimum installation angle according to the latitude of the place where the solar hot water supply system would be installed, Jo and Kang [4] arbitrarily chose an area then measured the global solar radiation incident on the inclined surfaces of the solar collector. This was regularly assessed every hour for 9 years and 5 months between August 1996 and December 2005. Afterward, the amounts of solar radiation on the inclined surfaces were measured and the results of the experiment were compared with the estimated amount of the direct solar radiation and the diffuse solar radiation, the values of which were calculated separately. Khorasanizadeh et al. [5] proposed an algorithm for calculating the solar radiation on inclined surfaces according to the installation angle of the solar collector in Tabass, Iran. Corredor [6] measured the solar radiation on inclined surfaces in seven areas of Columbia and then compared the measured results with the results calculated from simulations. Soteris et al. [7] calculated the thermal performance of a solar hot water supply system using TRNSYS (TYPE 45, University of Wisconsin, Nicosia, Cyprus) and then, based on thermal performance, analyzed its life cycle. Using a commercial energy simulation program, Loutzenhiser et al. [8] performed a research study that aimed to predict the performance of a solar hot water supply system for buildings according to the installation angle of the solar collector. Al-Rawahi et al. [9] proposed an algorithm for calculating the solar radiation on inclined surfaces on an hourly basis. Maleki et al. [10] reviewed several equations for calculating the solar radiation on inclined surfaces.
Whereas Zhang and Hwang [11] studied how to calculate the global solar radiation by means of weather observation variables (the dry-bulb temperature, the relative humidity, the sunshine hours, and the cloud cover), Kim et al. [12] proposed a modified correlation equation for estimating the sunlight resource quantity without any cloud cover information. This was motivated by the fact that many weather stations in Korea do not measure the cloud cover. Yoon et al. [13] studied algorithms for calculating the cloud cover in order to compute the solar energy that reaches the ground surface after passing through the atmosphere.
Previous research on the energy simulation of solar thermal systems has also been conducted in a variety of ways. Montoya-Marquez et al. [14] measured the inlet and outlet temperature according to the installation angle of the solar collector and predicted the efficiency through simulation. Assilzadeh et al. [15] performed an efficiency and temperature simulation of a LiBr solar absorption cooling system using a vacuum tube type solar collector and the TRNSYS program. Afonso et al. [16] established an energy equation and performed an air movement and temperature simulation of the solar chimney. They compared their simulation results with the experimental data. Amori et al. [17] established a momentum equation and an energy equation for the internal gas flow of a solar collector and studied it using CFD. Morrison et al. [18] used CFD to study the fluid movement in an integrated solar water heater. Yan et al. [19] studied heat transfer by establishing an energy equation for a vacuum tube type solar collector. Guoying et al. [20] investigated the efficiency of a solar–air heat source heat pump by establishing the energy equilibrium form. Aklogirou [21] performed an energy simulation of a PV-thermal hybrid solar system using the TRNSYS program. Aklogirou’s method for predicting the system efficiency according to load variation [21] is particularly relevant in the present study.
In the case of a country like Korea where there are four seasons, so if a system has been designed based on the energy demand in the winter, then the solar heat storage system will become overheated in the summer. This is because the heating and hot water supply energy consumption decreases rapidly in summer. Solutions to prevent overheating include covering the solar collector panel with a sun shade, discharging overheated water from the heat storage tank, or operating a heat sink cooling fan (the latter is displayed in Figure 1) [22]. Bai et al. [23] researched limiting temperature rises by adjusting the angle of the reflector to prevent a double vacuum tube type solar collector from overheating. Aside from this, due to wintry or rainy weather conditions, the temperature of the solar heat storage tank could fail to rise to the temperature level needed for the hot water supply. In that case, an auxiliary heat source must be employed to enable hot water use, thus requiring electricity or fossil fuel. Choi et al. [24] carried out a performance simulation of a solar hot water supply system in which electricity was used as an auxiliary heat source. Slaman et al. [25] have suggested improving structure of the collector to prevent overheating of the solar hot water supply system, and Salwa et al. [26] have warned of the danger of overheating in the summer season.
In the previous studies, research was conducted on the optimum installation angles of the solar collector solely from the perspective of collecting solar energy. However, further research is required to determine the optimum installation angles of the solar collector from the perspective of requiring an auxiliary heat source. Such a heat source may be required either because energy needs to be released for the protection of the system in the summer, or because of rainy weather or rapidly decreasing temperatures, as can occur in area like Korea where the weather changes across the four seasons are apparent.
Therefore, the first step was to create an algorithm for estimating the hourly solar irradiance on the slope without requiring information on the cloudiness. The next step was to verify estimated solar irradiance on the slope with measured data in the same condition. Then, an energy equation for transforming solar irradiation into collected solar energy was developed. For this purpose, we have developed an algorithm that can calculate the temperature at each position of the solar system. Within the program for calculating solar energy collection, we selected seven representative areas in Korea and then assigned solar irradiation observations for each region. Next, we examined: the energy accumulated by the solar heating system for the year, the energy dissipated during the summer season, and the energy lacking during the winter season. To determine the optimum installation angles of the solar collectors from the viewpoint of the purely usable energy amount (as opposed to the maximum collected energy), we also considered the installation angle of the solar collectors excluding the summer season (June, July, and August), in which there is less demand for hot water energy. Also, the capacity of the heat storage tank with the most available energy was considered. In this study, a program that simulates the use of solar heat to produce freshwater in a seawater desalination system was modified to simulate the solar hot water system [27]. Since the verification of the code that simulates solar heat collection was covered in previous research, this study presents a simplified review of code reliability.
2. System Configuration
2.1. Simulation Apparatus
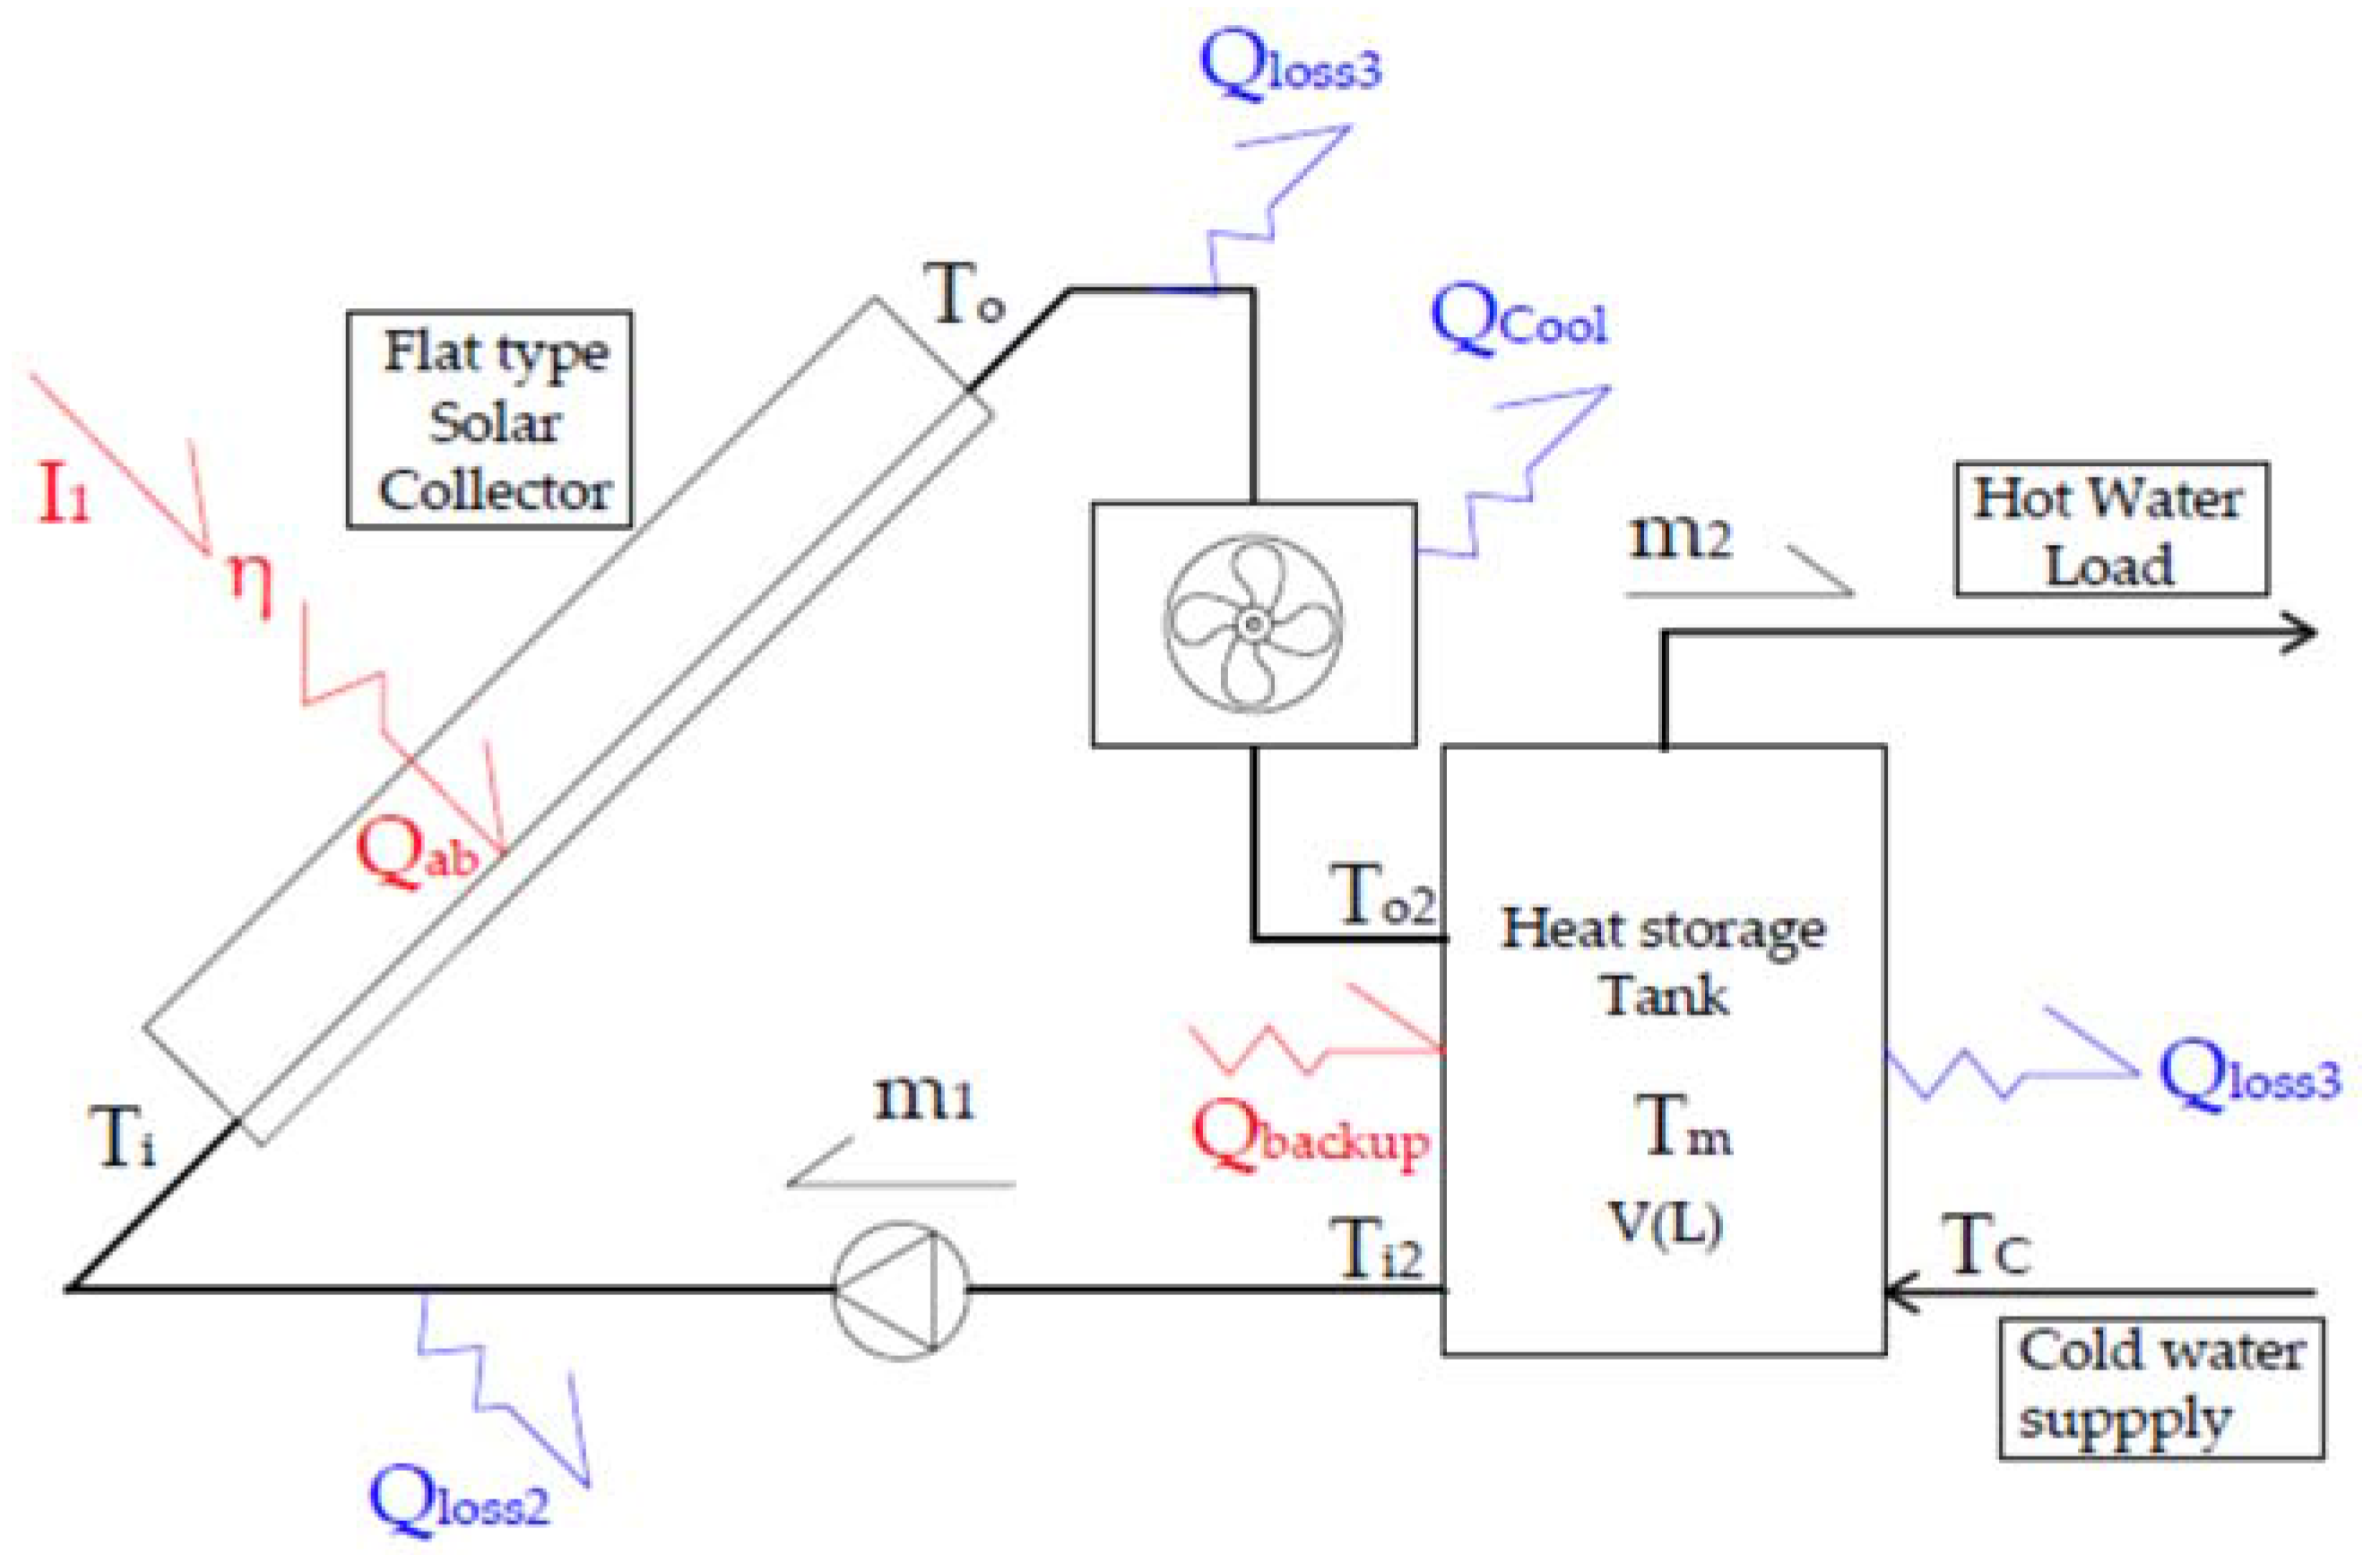
The system diagram devised for the present study is shown in Figure 2. The system consists of solar collectors for compiling solar heat, a solar heat storage tank for storing solar heat which is to be used for the hot water supply or heating, and a heat sink cooling fan for releasing the overheated energy in case the solar heat storage tank is overheated above the allowable temperature level.
The energy equation for the system is [20]:
The solar energy collected by the solar collector () during n hour(s) can be obtained from the efficiency of the solar collector ( and the solar irradiance on the inclined surface (. The correction formula devised by Park et al. [28] is used on the solar irradiance on the inclined surface (Equation (2)). This is to compensate for the lack of meteorological data (cloud information was not provided as mentioned in the introduction). Figure 3 shows the geometric model for calculating the solar irradiance on the inclined surface:
The equation describing the efficiency of the solar collector is:
In this case, it is possible to estimate the heat collecting efficiency of the solar collector by using a quadratic expression formed with its inlet and outlet temperatures and the solar radiation striking it [23]:
The coefficients used Equation (4) are listed in Table 1.
In order to avoid errors due to circular referencing, the inlet and outlet temperatures of the solar collector that were used were the temperature values from the (n − 1) hour. The temperature difference between the inlet and outlet of the collector can be obtained from the collected solar energy:
The heat loss of the whole system is:
The heat loss of the heat storage tank is:
The heat loss of the supply and return pipe are:
Convective heat transfer coefficients, h1 and h2, are calculated with the equations given below [29]:
The sum of the heat losses at the inlet and outlet pipes is given by:
At this time, the temperature of the lower side of the storage tank () can be derived by taking the weighted average of the temperature of the incoming cold water and the average temperature of the heat storage tank (). This is also calculated using the average temperature of the heat storage tank at the same (n − 1) hour as used before to avoid errors due to circular referencing:
The average temperature of the heat storage tank is calculated using the temperature of upper side ( and lower side ( of the heat storage tank:
In order to avoid circular reference, the average temperature value of the storage tank () that was used was the value from the (n − 1) hour. In order to reduce the calculation error, () was updated using the temperature ( of the upper side of the heat storage tank and the temperature ( of the lower side of the storage tank, and the calculation was performed again. The iteration was repeated until the minimum value of the iteration error was less than 10%. When the error was less than 10%, the next time was considered. The calculation flow chart is shown in Figure 4. This iteration method that uses the data values from one hour ago was drawn from the study by Zhai et al. [30].
The auxiliary heat energy input into the heat storage tank is calculated by:
If the average temperature of the heat storage tank is greater than the overheating temperature ( > ), the solar thermal system is judged to have become overheated and, thus, energy is released by using a heat sink or by discharging high-temperature water from the system. The present study calculated the overheating temperature () of the system to be 65 °C. This is because 65 °C is 1.5 times higher than 40 °C (the apparent discrepancy in the arithmetic arises because of the effect of the expansion pressure due to volume expansion resulting from the temperature rise in the heat storage tank). The temperature obtained through mixture with the tap water temperature of the office building is close to the operating temperature of hot water supply. The operating temperature of hot water supply was set at 40 °C, and the occupancy rates () on an hourly basis are as shown in Table 2.
To calculate the hourly hot water consumption, Design Builder’s Occupancy Library, a commercial energy analysis program, was used to determine the occupancy rate for the hot water consumption. In this case, data from schools and offices were used with respect to the use of buildings. As solar hot water supply systems are most commonly applied in school buildings in Korea, the occupancy rates of school buildings were employed to provide useful information in calculating hourly hot water consumption.
The simulation starts from 0:00 on 1 January, and the initial condition of the temperature of each point is the supply water temperature of the corresponding time.
A simulation program that uses the energy equation was modified to fit the storage system of the program and the algorithm that was developed in a previous study [27].
2.2. Simulation Verification
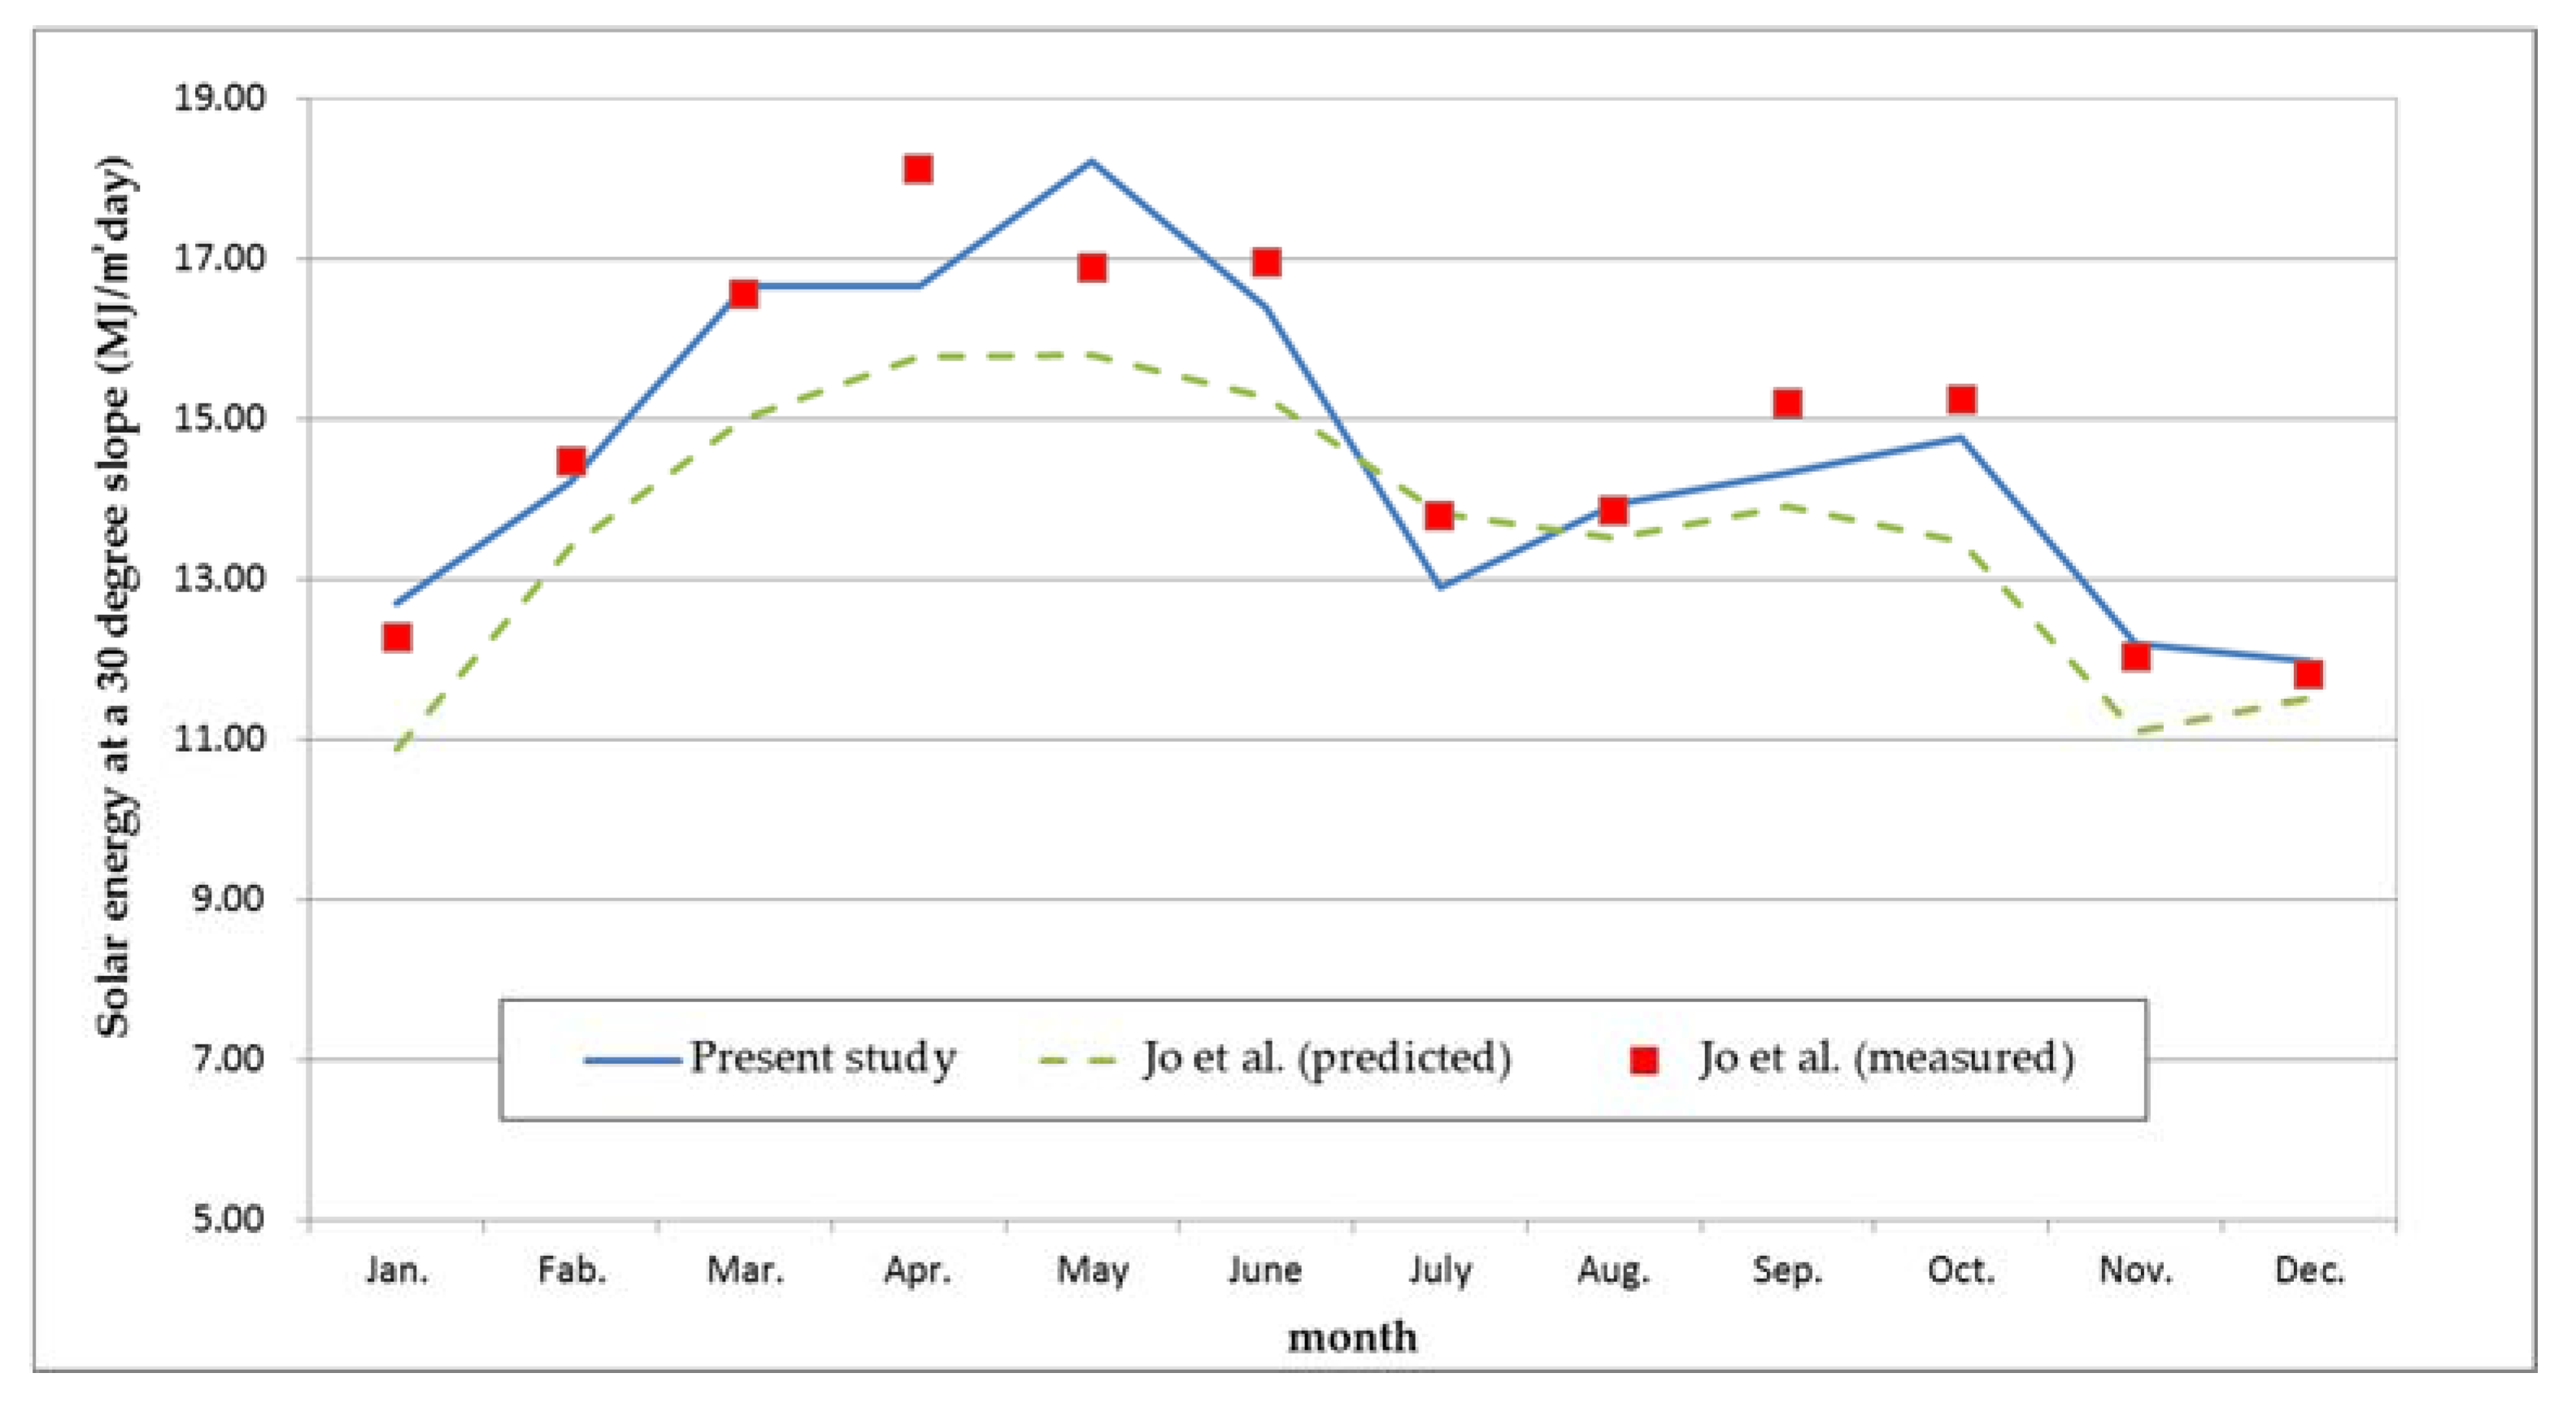
Jo et al. [31] measured the solar radiation on inclined surfaces directly at an angle of 30° in Daejeon. They then divided the global solar radiation on horizontal surfaces into the diffuse and direct solar radiation. They compared the findings with the predicted solar radiation on inclined surfaces. The present study estimated the solar radiation on inclined surfaces only through a geometrical analysis of the global solar radiation on horizontal surfaces, without dividing it into the diffuse and direct solar radiation. Figure 5 shows that the results of this study have come closer to the actual measurement data presented by Jo et al. on the solar radiation on inclined surfaces. The method used by Jo et al. [31] required accurate information on both the cloud cover and the reflectance, which together determine the diffusion rate in the algorithm used for dividing the global solar radiation into the diffuse and direct solar radiation. These findings also point out that the uncertainty in predicting cloud cover hinders the accuracy of the data obtained by dividing global solar radiation into diffuse and direct solar radiation, as it is impossible to call up such relevant information from the accurate weather data.
Lee et al. [32] conducted both a TRNSYS simulation and an experiment on the changes in the heat collecting efficiency of the solar heat storage tank according to the type of heat exchanger it uses. They revealed that its heat collecting efficiency was not great when there were changes in the flow conditions (of the flow through the solar collector). The mean efficiency of the solar collector was found to be 48.5%, in a system that collected energy from the solar radiation on inclined surfaces (with an installation angle of 45°, in Daejeon, in September, and with a solar heat collection area of 6 m2).
In the results of the present study, heat collecting efficiency was found to be 48%, in collecting solar radiation on inclined surfaces in September under the same conditions, thus validating the reliability of the simulation results with respect to the amount of collected heat. The energy released due to the system overheating deduced by means of the energy equilibrium equation, is as shown in Table 3.
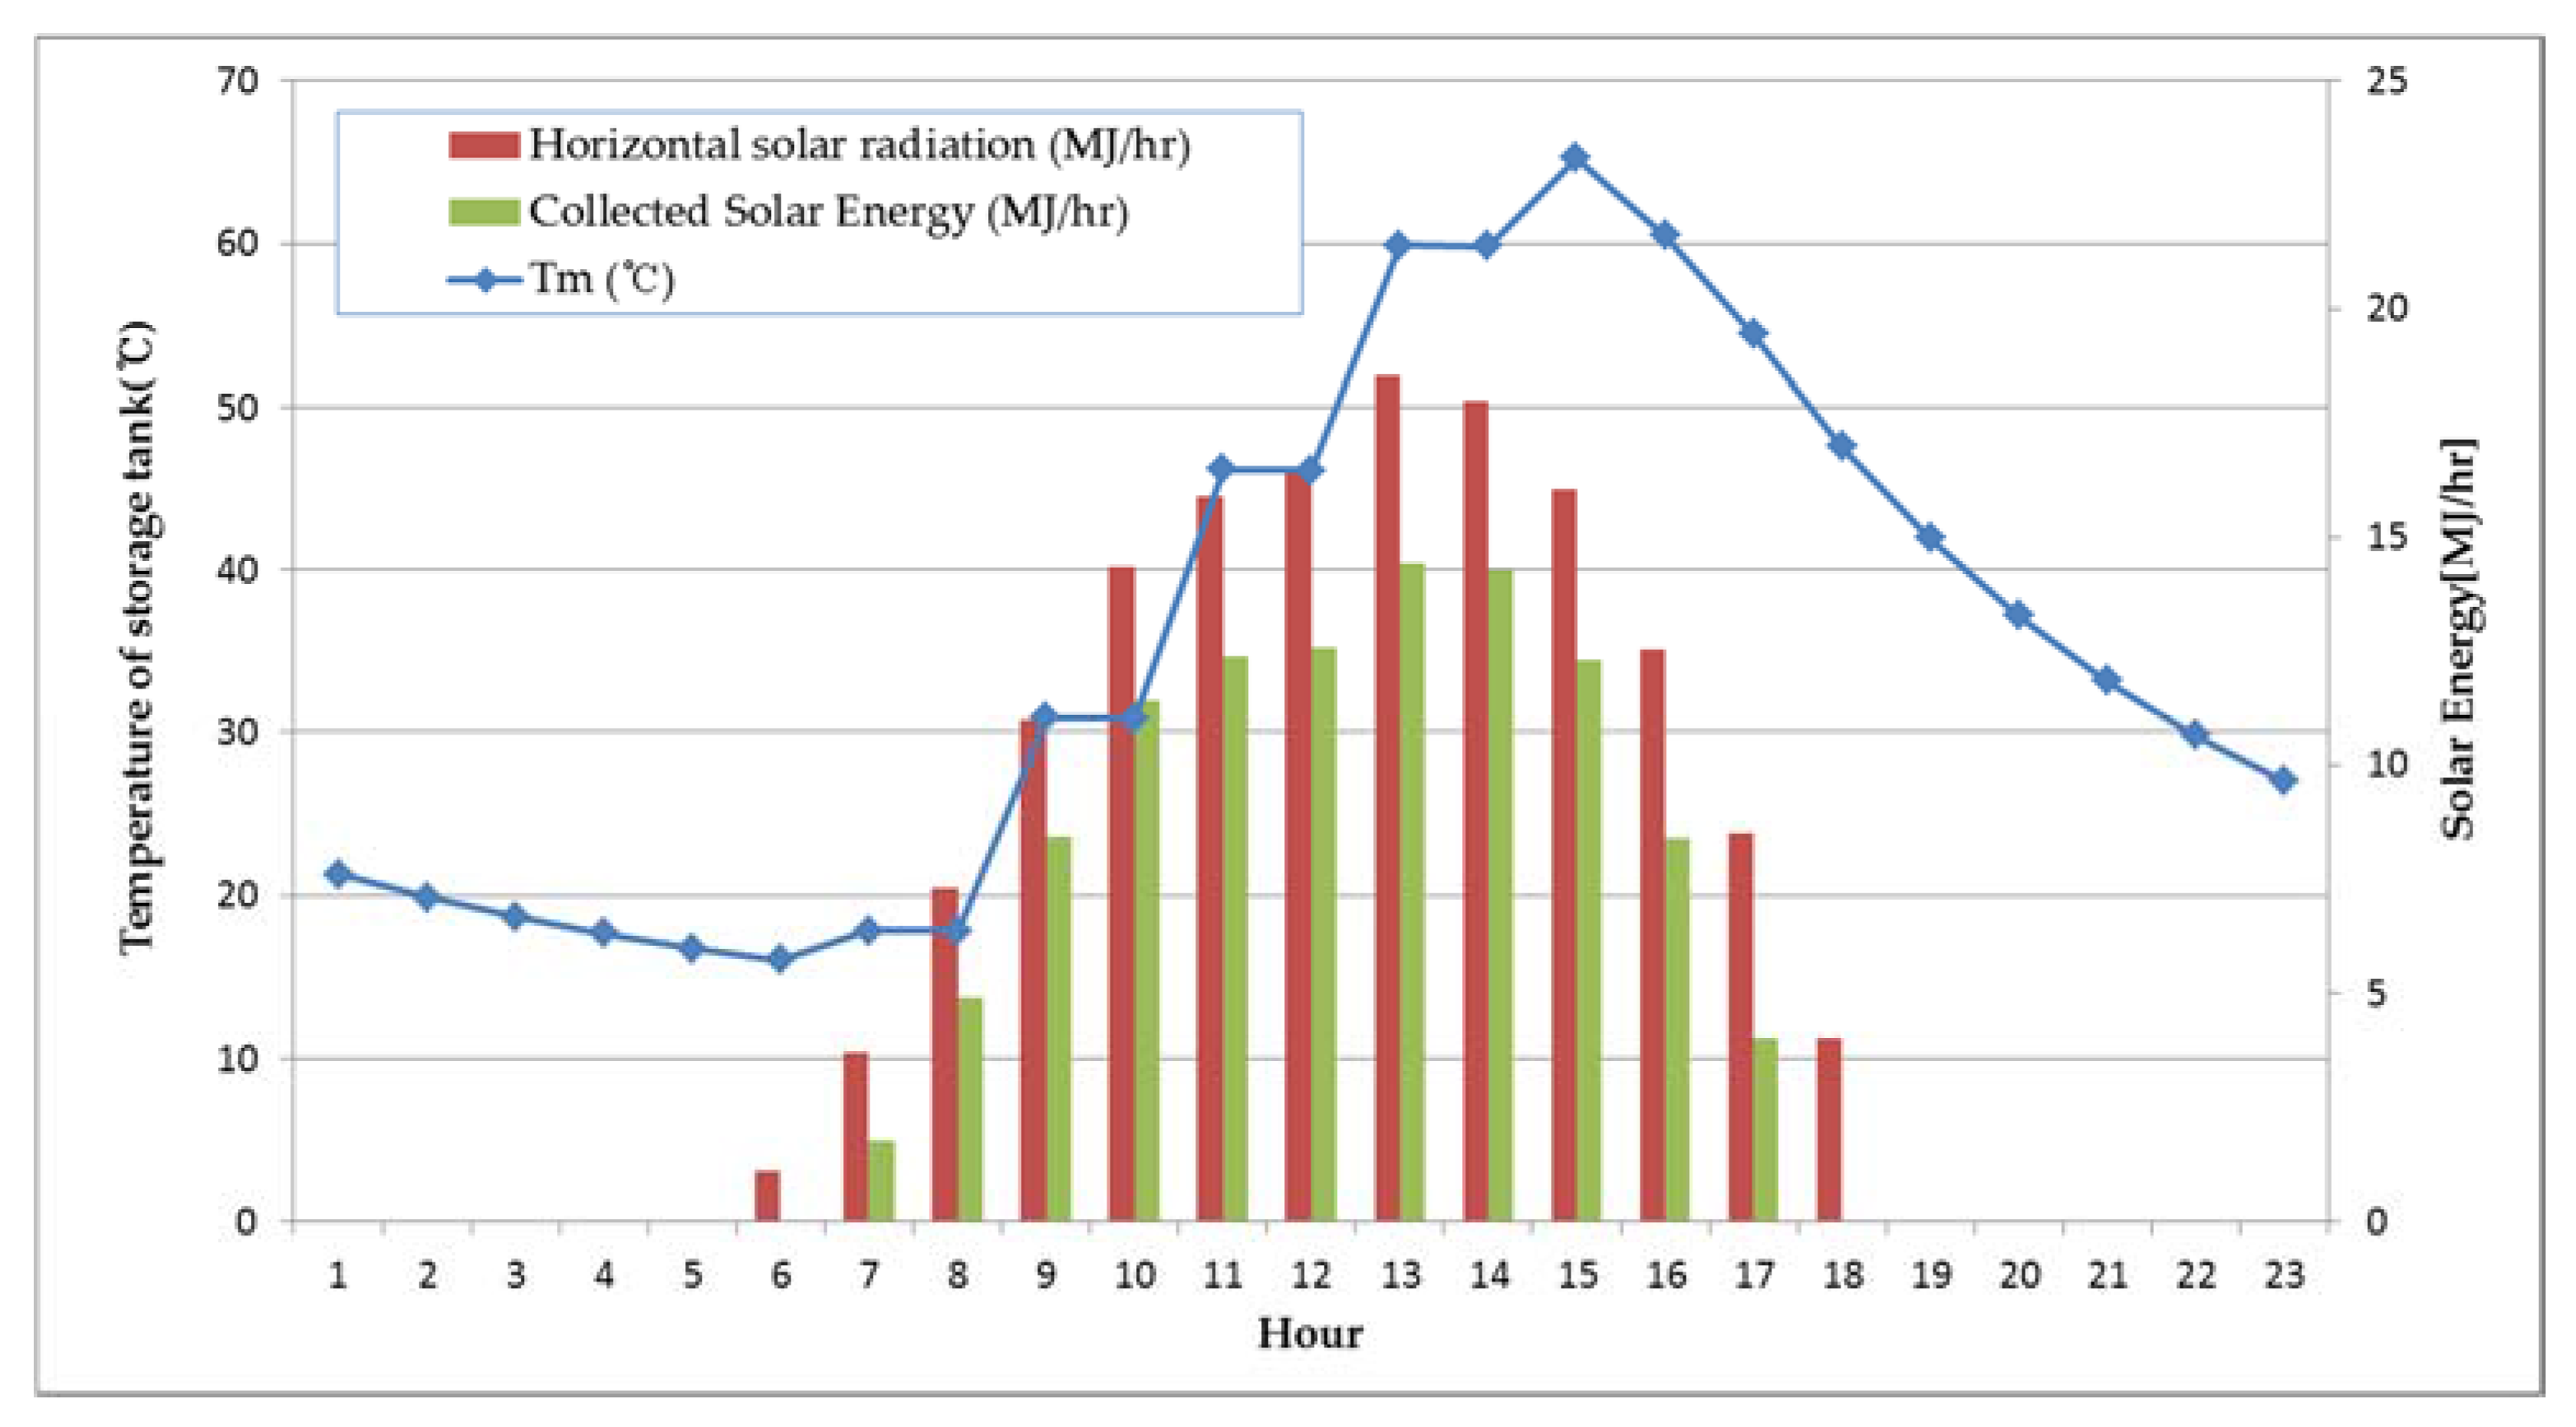
The amount of heat released due to system overheating was discovered to be about 4.884 kJ per year, when the installation angle of the collector was 45°. This was attributable to complex causes including the efficiency of the collector varying due to changes in the solar radiation, the tap water temperature, and/or the outdoor air temperature. The solar radiation, the amount of collected solar heat, and the temperature distribution of the heat storage tank are as shown in Figure 6. These quantities are from 16 May 2017 when the release of heat occurred.
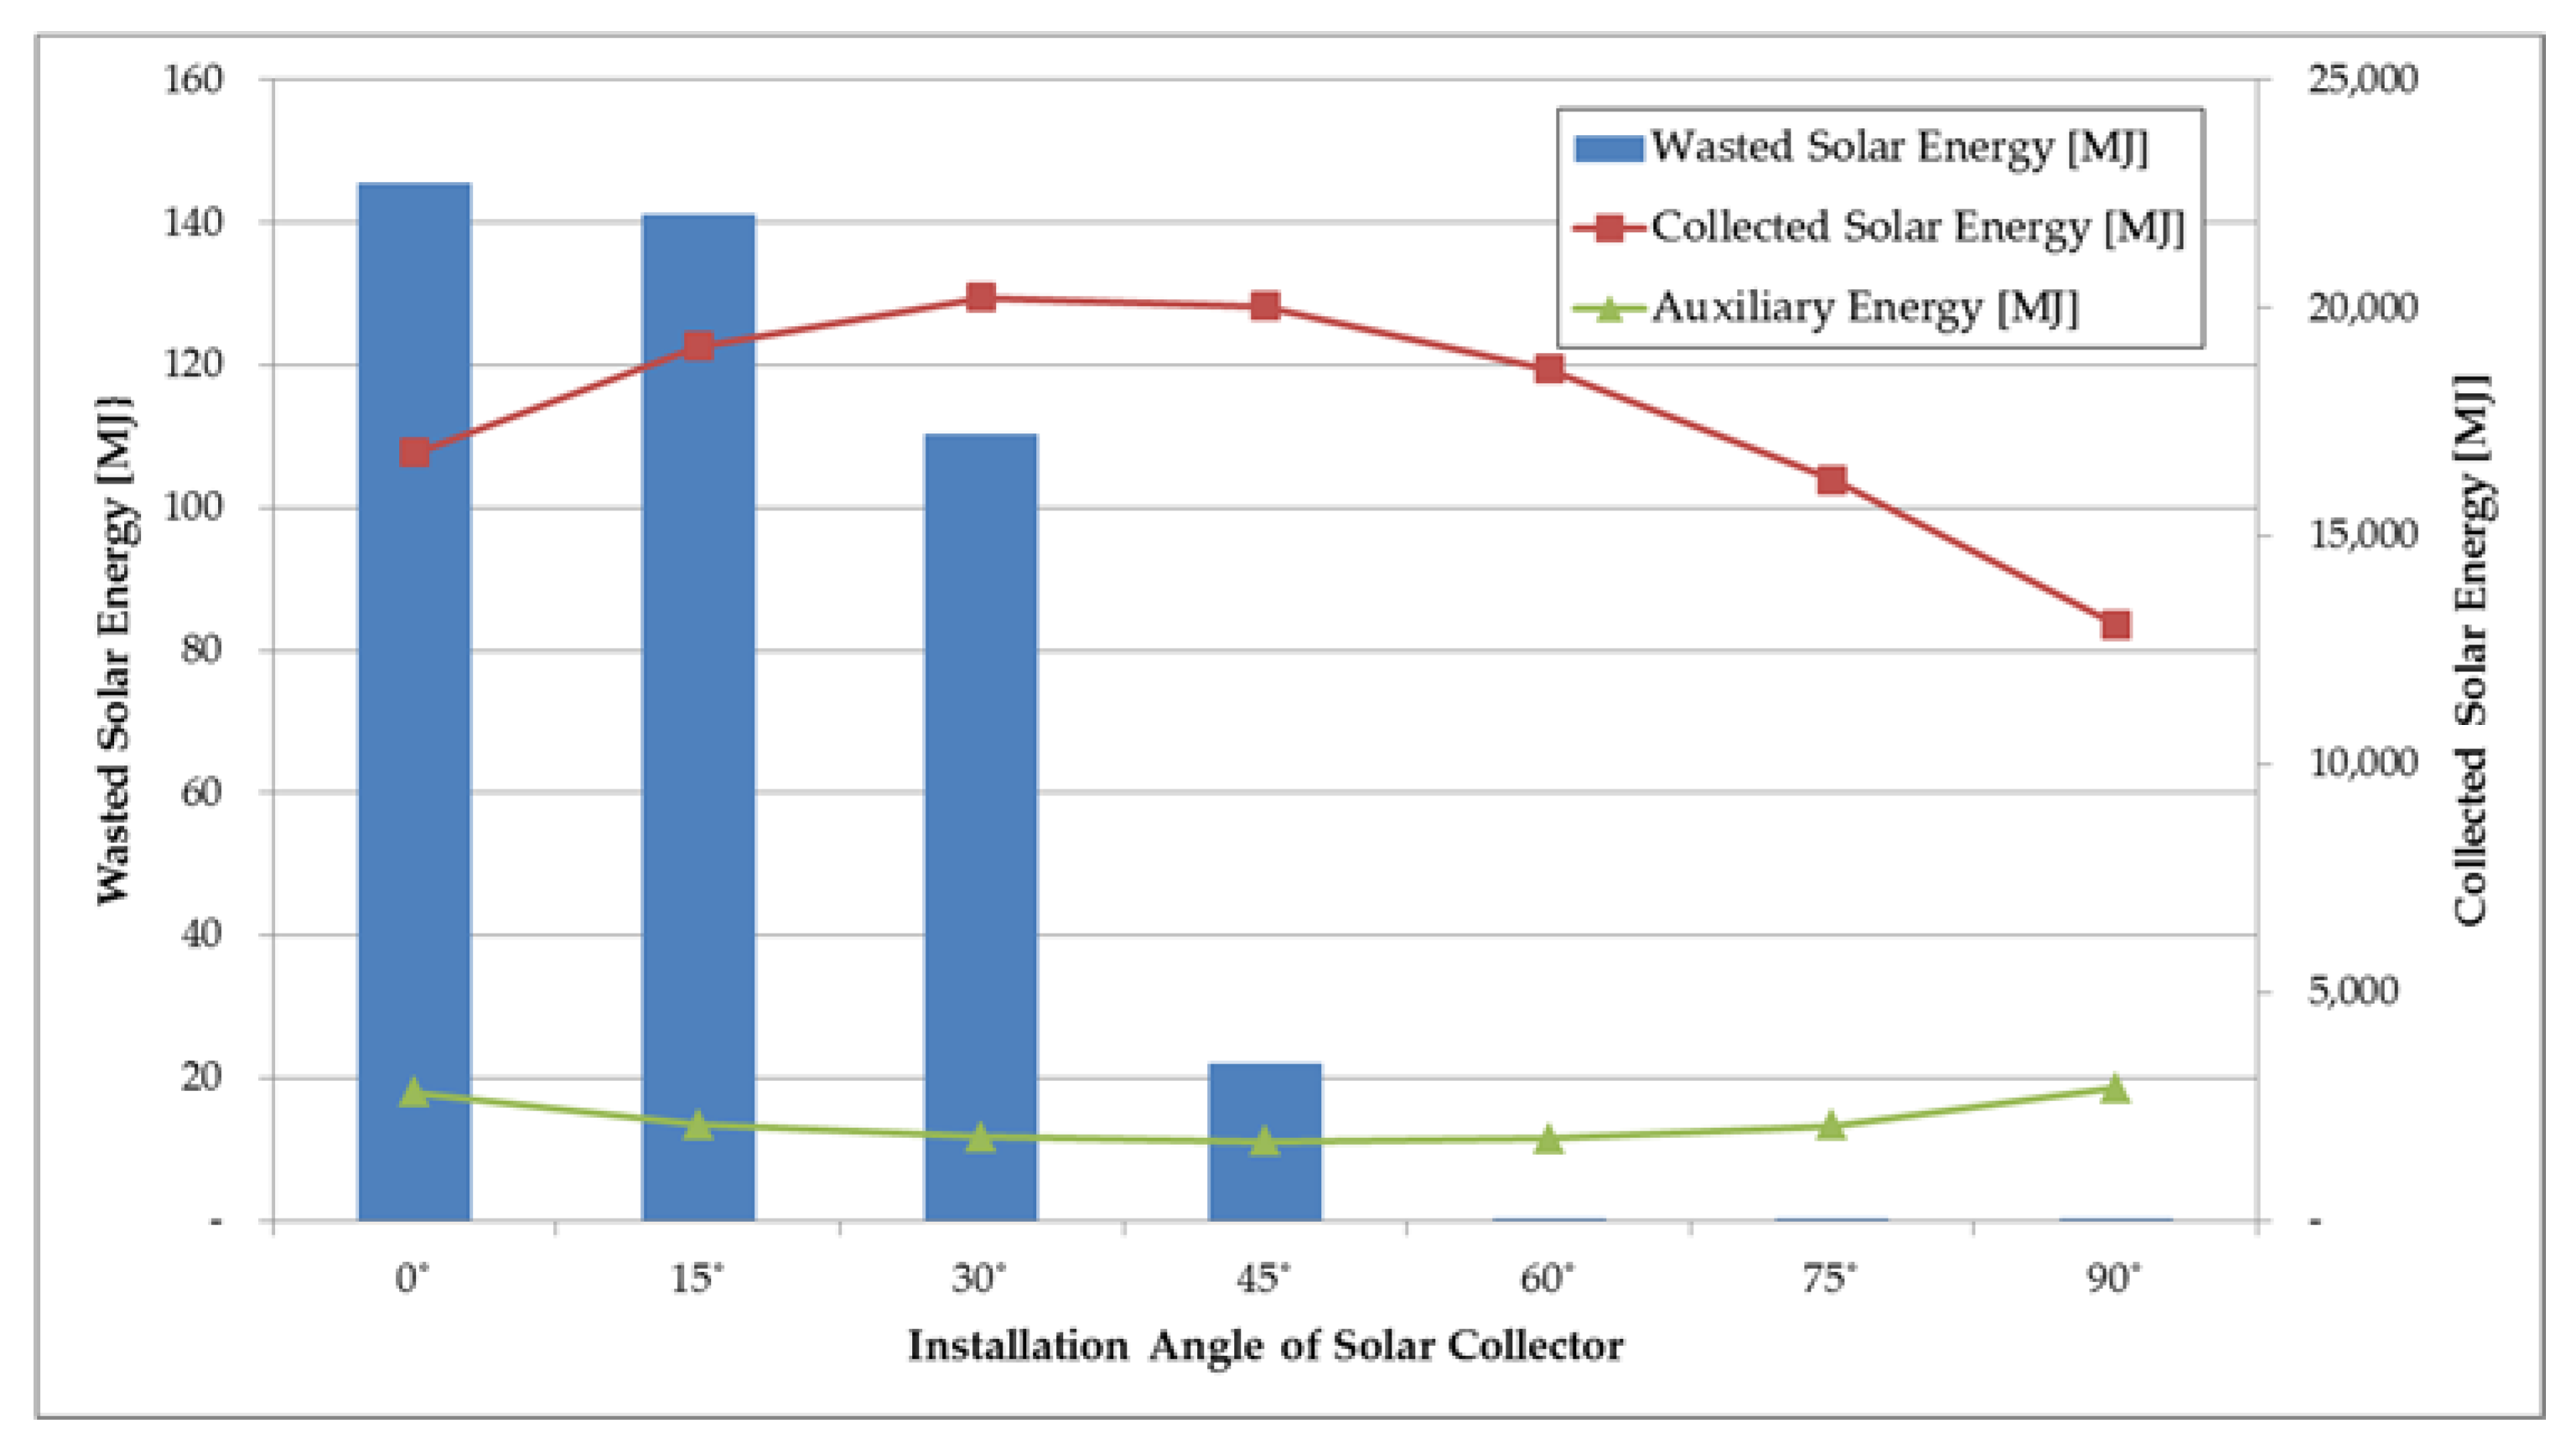
The annual mean amounts of collected solar energy and thermal energy released due to the system overheating for a specified installation angle of the solar collector in Daejeon is shown in Figure 7. The amount of collected solar heat was greatest when the installation angle was between 30 and 45°, whereas the amount of released heat was found to be greatest when the installation angle was between 0 and 30°. This is because the solar radiation received from a high solar altitude in summer is greater at a smaller angle of the solar collector. This also shows that when the installation angle becomes greater, it is possible to increase the amount of solar heat collected in winter and decrease the amount of overheating which occurs in summer.
2.3. Simulation Conditions
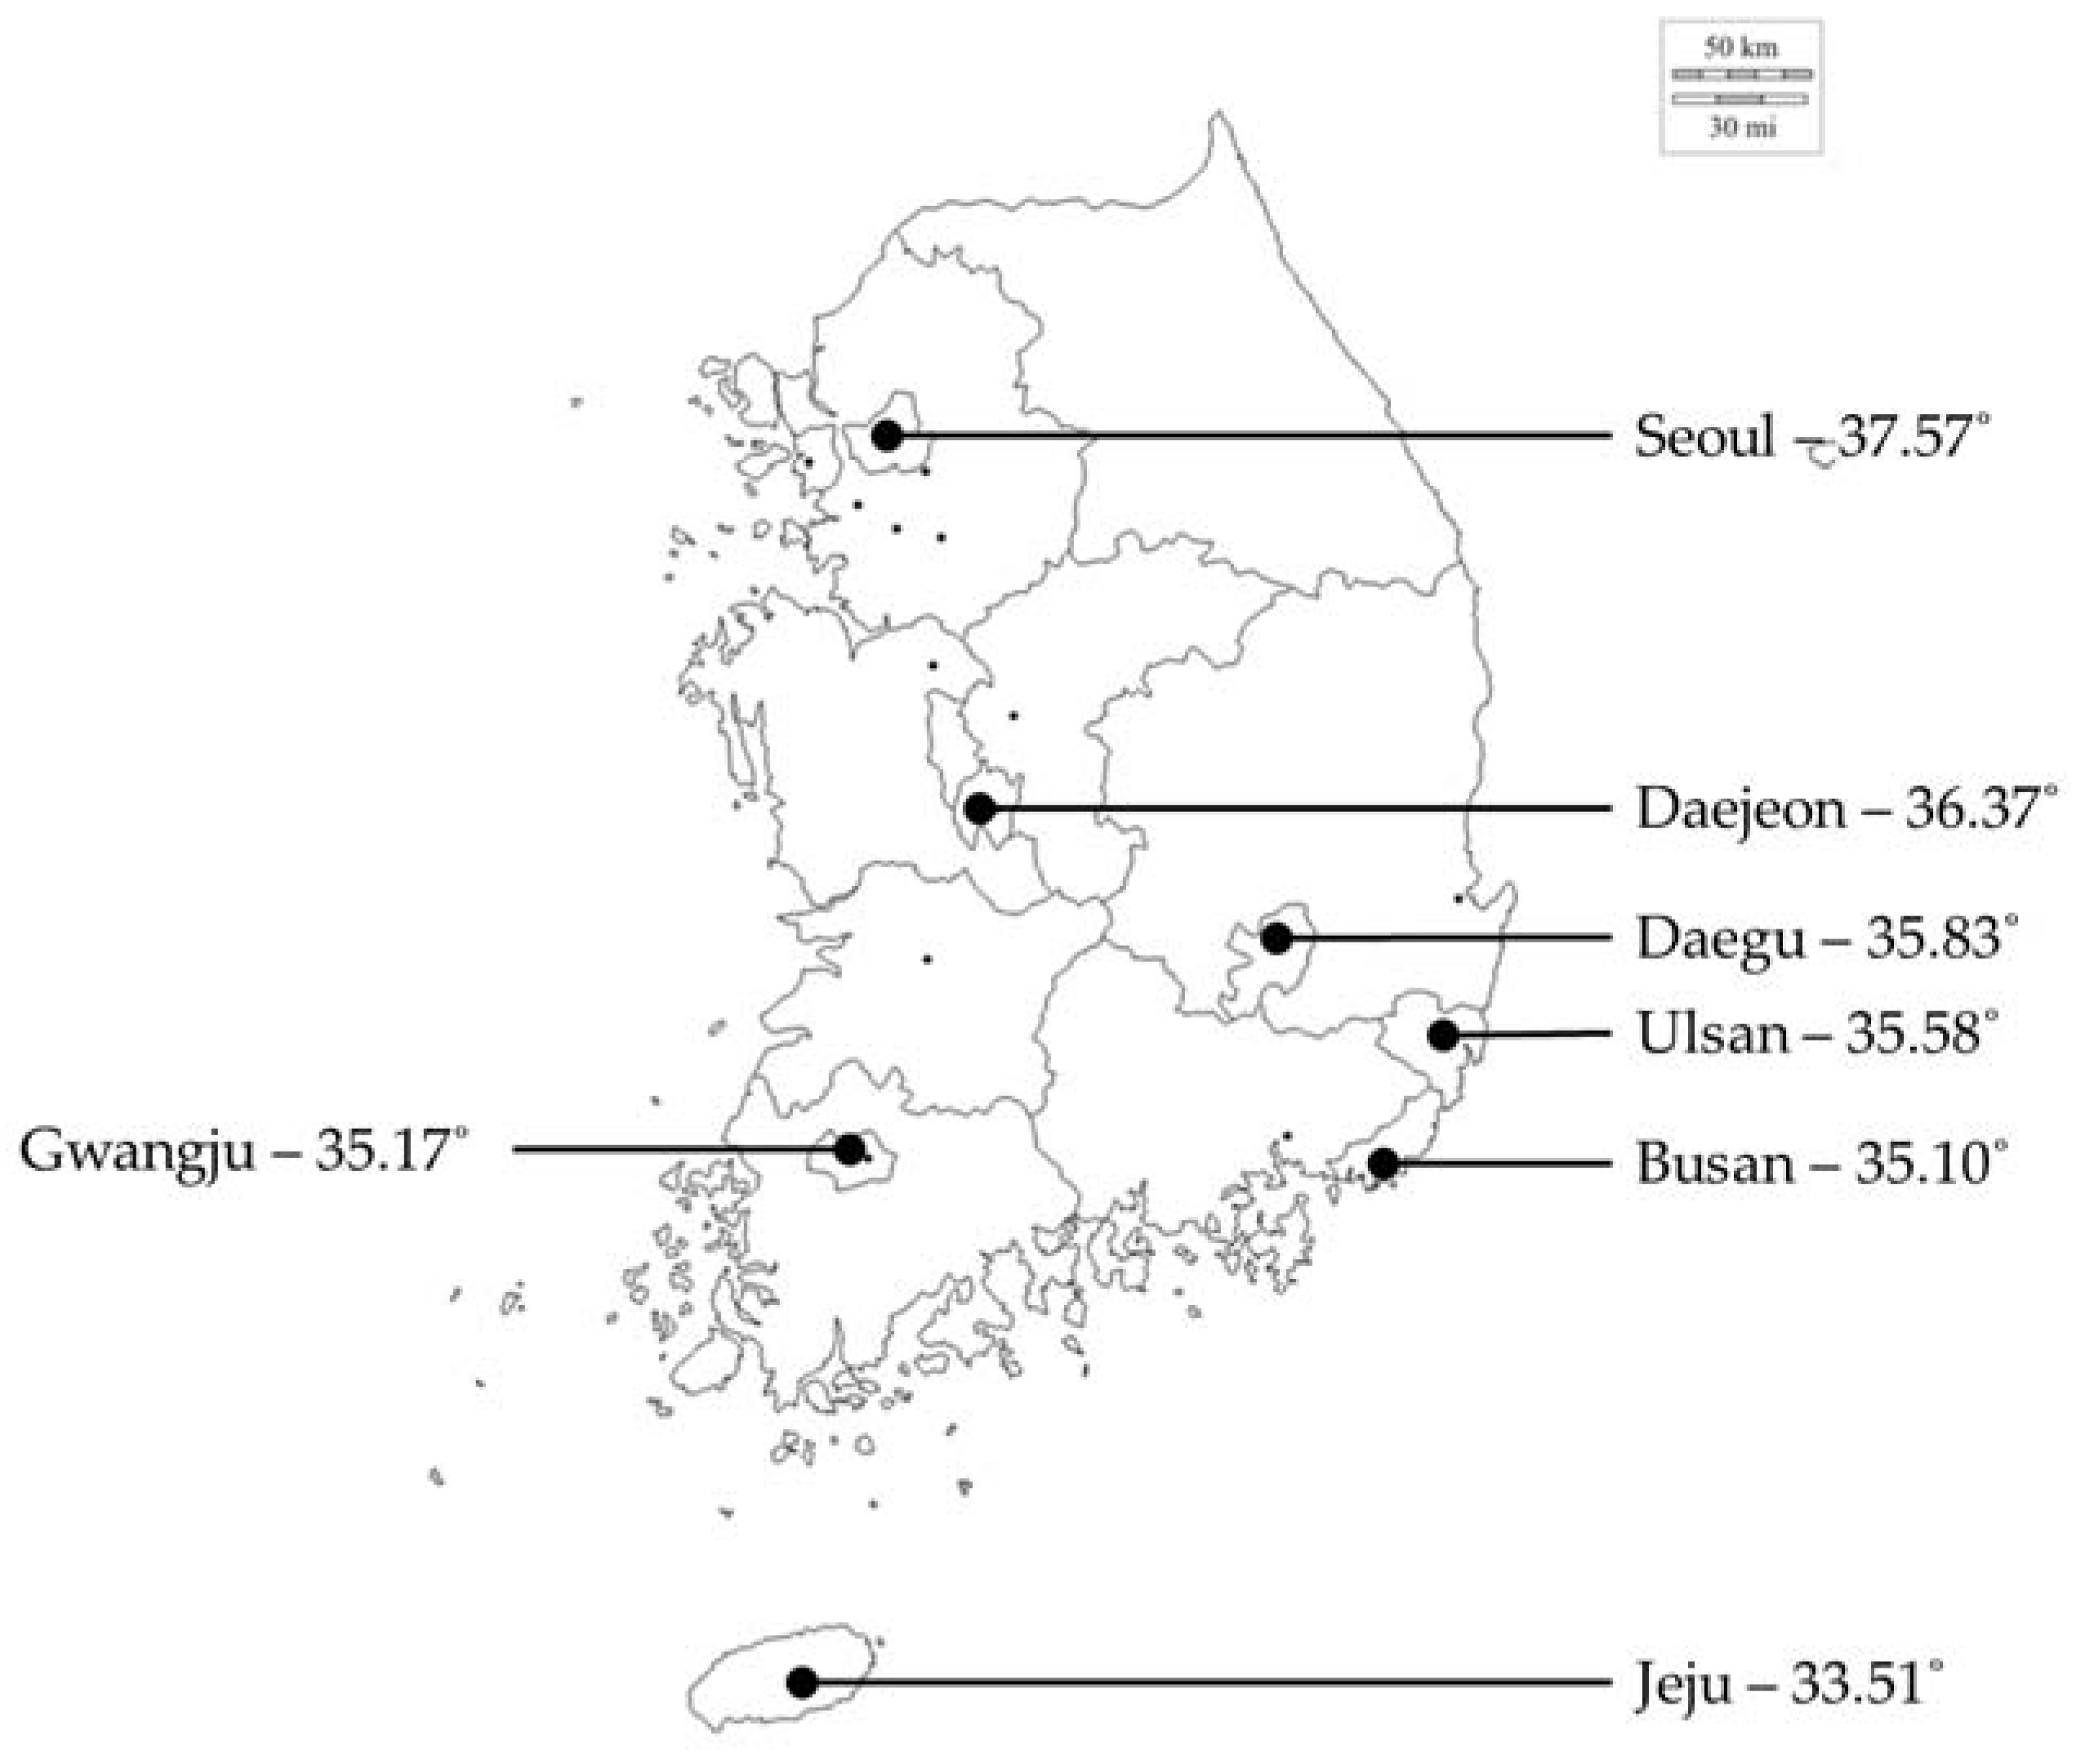
The present study selected seven representative regions in Korea and then calculated the amounts of collected solar heat and the amounts of released solar heat. The quantity of required the auxiliary heat was also calculated (the extra heat needed to be input into the hot water supply when solar collection is insufficient). The respective locations and latitudes of the representative regions are as shown in Figure 8.
The selection of solar collectors and solar heat storage tanks in the buildings that were covered by the performed simulations is as shown in Table 4. Since the present study performed each energy simulation from the perspective of considering solar energy release to prevent overheating of the solar thermal system, the size of the solar heat storage tank played a decisive role in any temperature rise in the system. Therefore, this study carried out energy simulations with relation to the size of the solar heat storage tank: the capacity of the tank used in the unit heat collection area is classed into Cases A–C.
Table 5 shows the monthly irradiance on the horizontal surface in each region. The month with the highest amount of solar radiation is May, and the lowest month is December. Daegu is the region with the highest amount of solar radiation in May, and Jeju is the region with the lowest amount of solar radiation in December. Jeju is the lowest latitude area, but the conditions are not considered good due to the heavy rainfall in the island area. Daegu is a good example of an area with typical conditions.
3. Simulation Results
3.1. Collected Solar Energy
The amount of collected solar heat in each region, based on tank size and installing angle, is shown in Table 6. It should be noted that these figures were calculated without considering the use of the solar heat. The installation angle showing the greatest amount of collected solar heat was 30°, with the exception of Seoul in Case C, where it was 45°. These results are similar to those of the previous studies [31]. The unusual result of Case C in Seoul, can be explained because Case C has the greatest heat storage tank capacity and Seoul is located at the highest latitude. Furthermore, the temperature of the tank is lower if its capacity is greater and this result is directly related to the efficiency of the solar collector. In any other case, it is evident that any change in the amount of collected solar heat due to the decreasing temperature of the heat storage tank is not as big as the effect of choosing an installation angle of 30° or 45° for the solar collector.
3.2. Amount of Auxiliary Heat Source Usage
If the temperature of the heat storage tank cannot reach the hot water supply temperature, the auxiliary heat source needs to heat the hot water. Table 7 shows the amount of supplementary heat used per installation angle in each condition. From the perspective of auxiliary heat source usage, for Case A tanks, the amount of usage was smallest at an installation angle of 60° in Seoul and at an installation angle of 15° in Daejeon. For Case B tanks, the amount of auxiliary heat source usage was smallest at an installation angle of 30° in Jeju. Finally, for Case C tanks, the amount of auxiliary heat source usage was smallest at an installation angle of 30° in Seoul, Daejeon and Gwangju. The amount of collected solar heat and the amount of auxiliary heat source usage cannot be directly related to each other. Since this result was obtained by calculating the annual total amount of collected heat and the entire amount of auxiliary heat source usage, if the amount of collected heat in summer is greater than necessary, the compiled solar energy may be insufficient in a season when the large quantity of hot water supply energy is in demand.
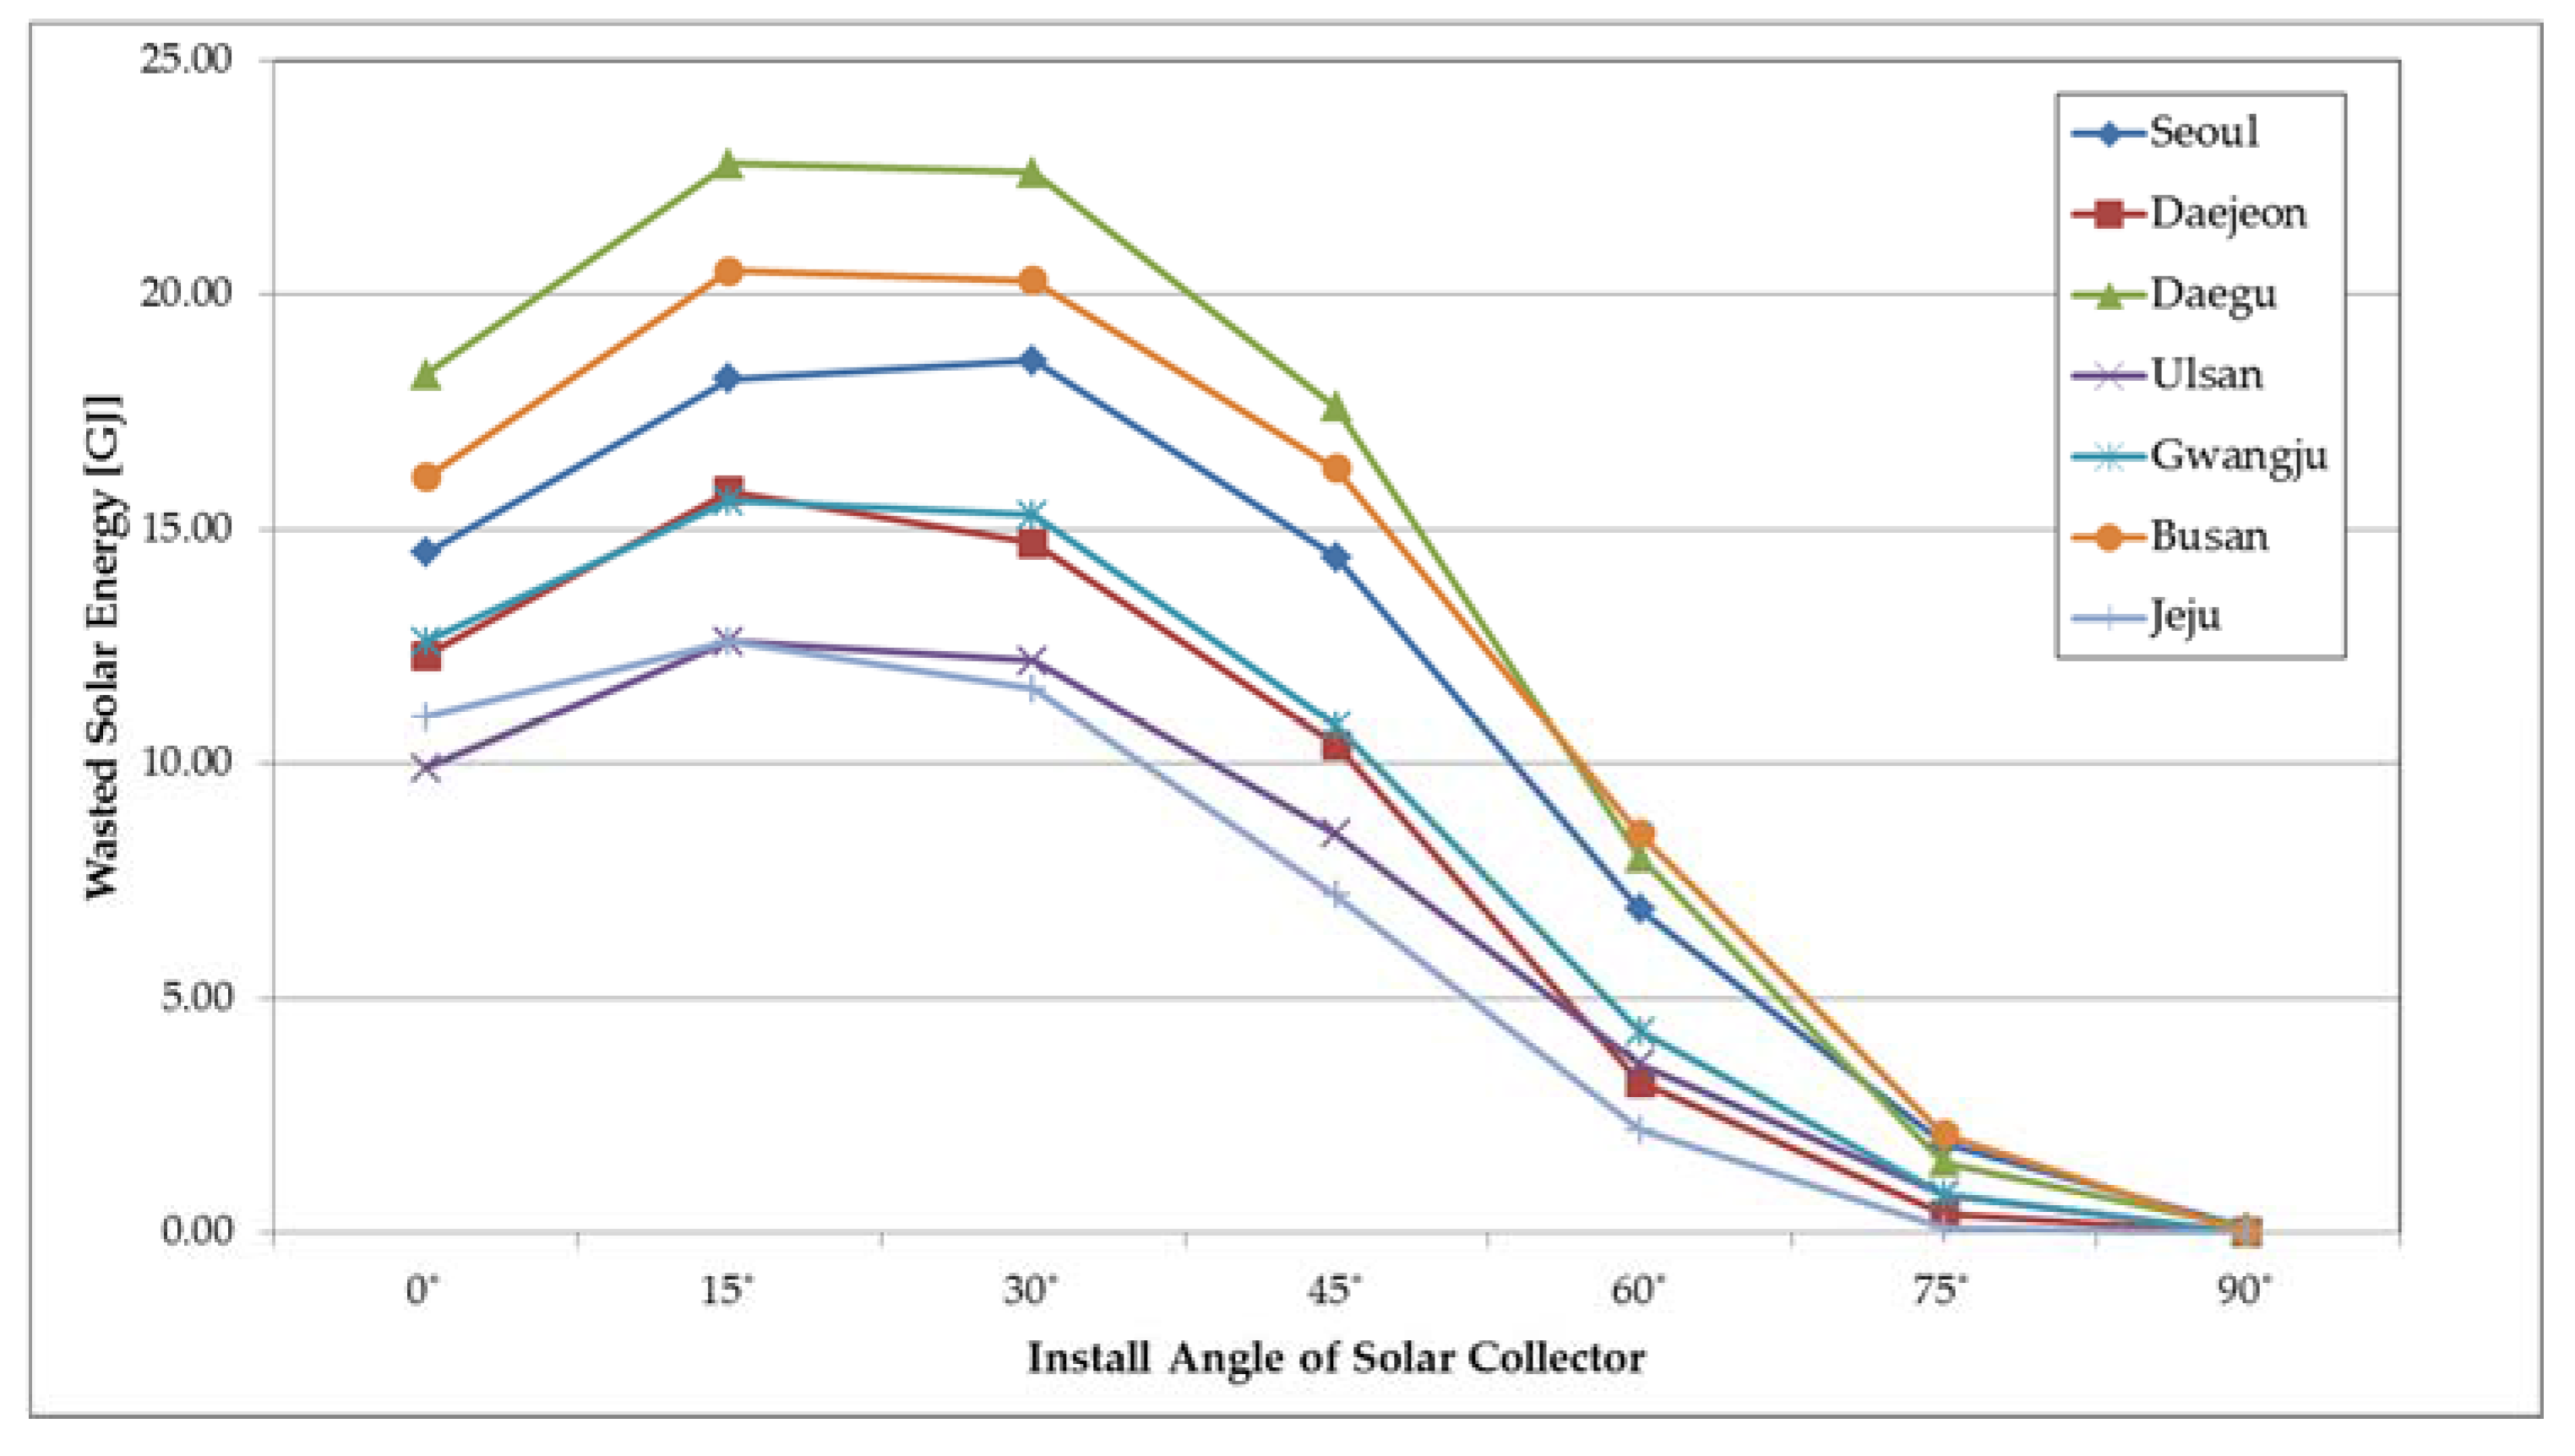
3.3. Amount of Released Heat
The amount of collected solar heat may be greater than necessary thus causing system overload. In this case, the heat sink cooling fan begins to operate or the overheated water is discharged urgently to protect the system. This may result in the use of energy such as using electrical energy for the heat sink cooling fan and the pump, and more water may be required due to the discharged water. This additional energy and water use is a very important consideration when designing a solar hot water supply system. The amount of heat released due to system overheating in each case is shown in Table 8.
It is worth noting that although an installation angle of 30° for the solar collector appears to result in excellent performance in general (from the perspective of the amount of collected solar heat), the amount of energy released due to the system overheating is highest when the solar collector has been installed at an angle of 15°. This indicates a similarity to a quadratic function where the highest value is at its vertex. Therefore, if it is necessary to consider not only the amount of collected heat but also the released solar energy, 45° is more favorable than 30° for the installation angle of a solar collector. Figure 9 is a diagrammatic representation of Case A. It is likely that the system overheats mostly because the capacity of the heat storage tank is the smallest compared to the heat collection area in Case A.
3.4. Effective Amount of Heat Collection
The purely effective energy is equal to the solar energy collected by the system minus the amount of energy from the auxiliary heat source minus the amount of solar energy released due to the system overheating. The purely effective energy is shown in Table 9.
In general, the effective energy in the system seems to be highest at an installation angle of the solar collector of 45°. The effective energy was discovered to be highest at an installation angle of the solar collector of 30° in Jeju for Case B systems. For Case C systems, the highest effective energy was at an installation angle of the solar collector of 30° in Ulsan, Gwangju, Busan, and Jeju.
The most effective installation angles, capacities of the heat storage tanks by region are the 1st step values in Table 10. In general, the amount of accumulated effective solar energy was greatest when the heat storage capacity was 50 L/m2, and in this case the largest amount of collected effective solar heat was mainly obtained with an installation angle of 45° in the high-latitude areas, and mainly obtained with an installation angle of 30° in the low-latitude areas. The most optimum installation angles, for a particular heat storage capacity, are shown in Table 10 in the 2nd step columns. These were calculated by a trial and error method that considered all installation angles with a step size of one degree. Since the value of the effective heat collection is shown to be highest using a heat storage capacity of 50 L/m2 in each of the five regions except Daejeon and Jeju, the capacity of the heat storage tank was fixed to be 50 L/m2, and then the optimum installation angles in the seven regions were calculated (see Table 11).
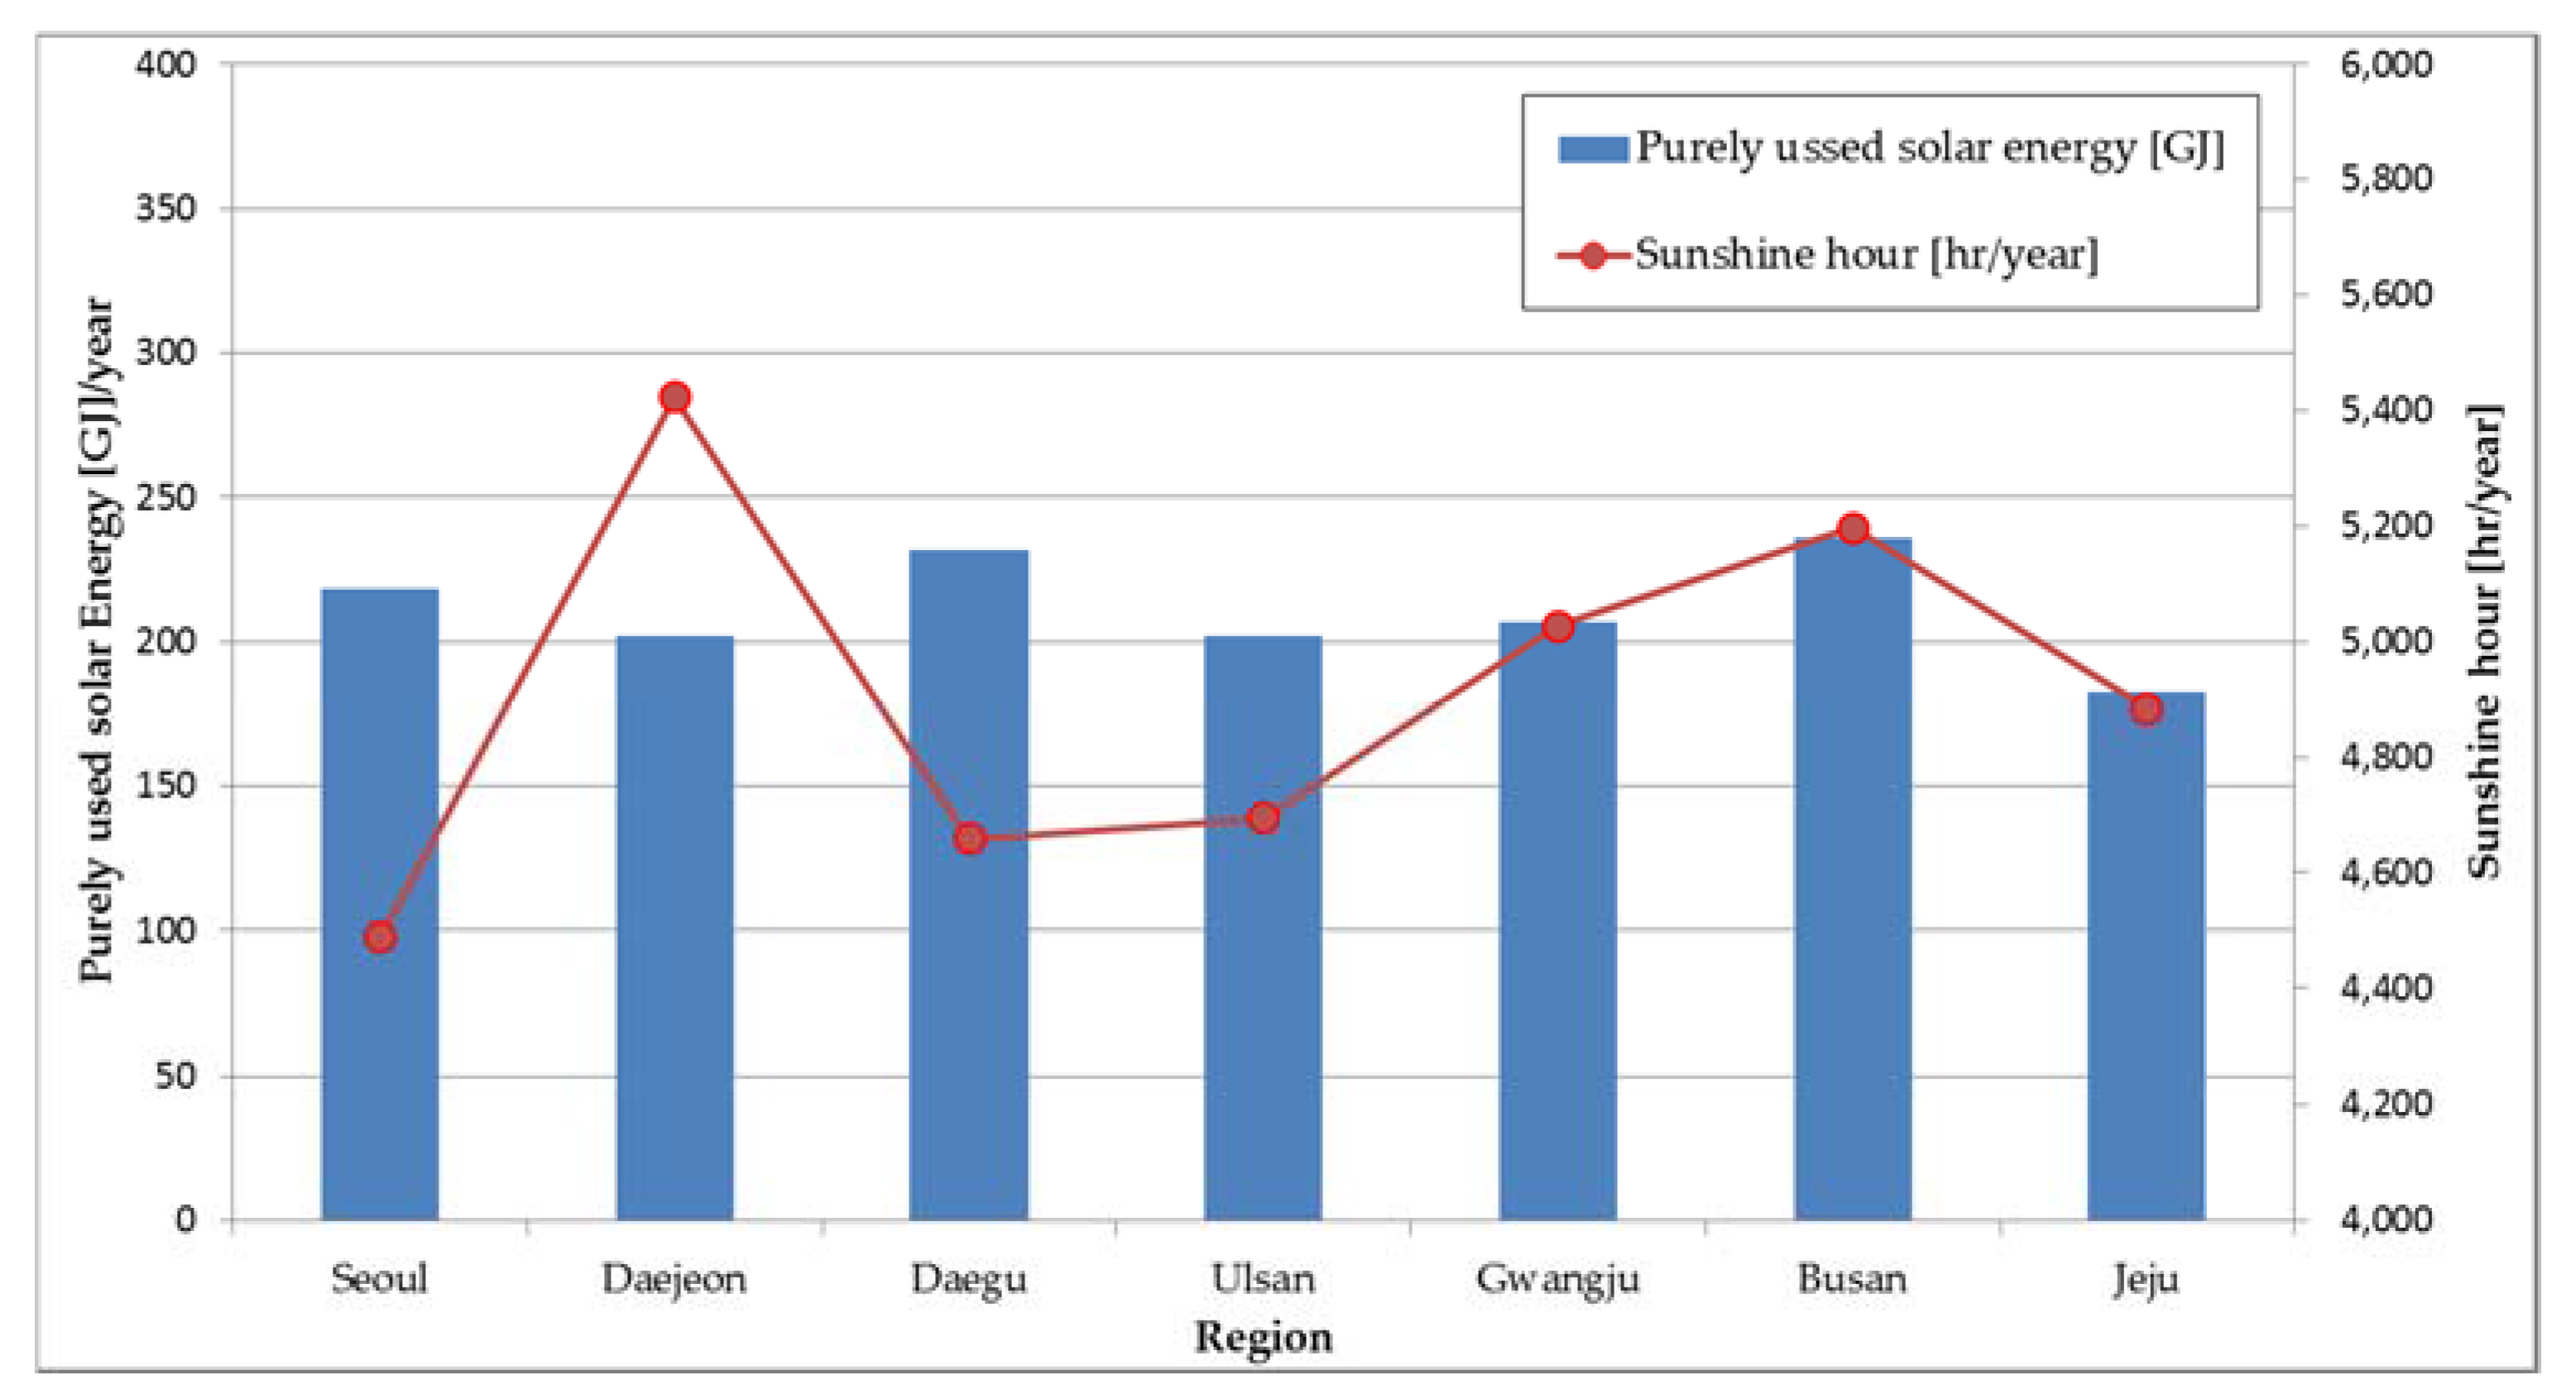
The optimum installation angle in each region was found to be between 1.4 and 3.2 at the latitude of the relevant region. The amounts of effective solar heat collection by region are shown in Figure 10.
When the heat storage tank was installed under the optimum conditions, the amount of effective solar heat usage was revealed to be the highest in Busan and Daegu whereas it was shown to be lowest in Jeju. The line indicates the annual sunshine hours, and it is worth noting that the arithmetic size of the annual solar radiation resource and the amount of the effective solar heat collection present different patterns. This confirms that it is impossible to accurately estimate the effective solar energy by taking only the solar radiation into consideration.
3.5. Prediction of the Amount of Effective Solar Heat Collection except in Summer
In fact, the respective amounts of heating and hot water load decrease rapidly in summer. However, the amount of heat released from the solar heat storage tank increases. Thus, the results shown in Table 12 were obtained with the assumption that the system operation is at a standstill in summer (July–September).
The predicted optimum installation angle (angle yielding the highest efficiency of the solar collector) for each installation location while omitting summer, was an angle that is between 2.5° to 6.2° higher than the latitude of the installation area. This is because when the solar collector is installed at a higher angle it can collect more solar energy in the winter, and the hot water supply energy can be used more effectively as the solar altitude becomes lower when the season comes closer to winter. Since the low angles of solar collector (at which greatest amounts of heat can be collected in summer when the solar altitude angle is high) were excluded, it shows that the optimum installation angle increased when summer was not considered (compared to the results from considering the entire year).
4. Conclusions
The present study performed energy simulations to find the installation angle of a solar collector that enables the relevant solar hot water supply system to operate at the highest efficiency. In the study, not only were the amounts of energy wasted from the high-temperature solar heat storage tank (which could overheat the system in summer) calculated, but the amounts of auxiliary heat source that were used due to insufficient sunshine conditions or weather problems were also calculated. This study also calculated the combination of both the installation angle of the solar collector and the capacity of the solar heat storage tank which enabled the system to display its highest performance in each installation area. This was achieved by computing only the energy being used effectively out of the entire amount of solar energy accumulated by the solar collector.
- (1)
- In most locations, among the tilt angles for installation in the selected seven regions, the amount of solar heat collected at inclined surfaces was found to be highest at an installation angle of 30°, and these study results coincide with existing previous study results.
- (2)
- The amount of heat released due to the system overheating was found to be highest when the installation angle of the solar collector was 15°. This directly affects the safety of the system and results in energy waste.
- (3)
- The installation angle at which resulted in the lowest required amount of auxiliary heat source (for making up for the shortage of energy) was 45° in most cases, and this is also related to the capacity of the heat storage tank.
- (4)
- Since the amount of effective solar heat collection was found to be high in general when the capacity of the solar heat storage tank was 50 L/m2, the optimum installation angle of the solar collector was determined for this capacity. It was found to be 1.4–3.2° higher than the latitude of the installation area, with a mean value of 2.1°.
- (5)
- When summer, the time with the least amount of hot water load demand, was not considered, the optimum installation angle of the solar collector was found to be 2.5–6.2° higher than the latitude of the relevant installation area, with a mean value of 4.26°.
Acknowledgments
This research was supported by Basic Science Research Problem through the National Research Foundation of Korea (NRF) funded by the Ministry of Education (2016R1D1A1B03932661).
Author Contributions
Kyung-Soon Park led all research process, Young-Hak Song conceived and designed the simulation program, Dae-Young Kim analyzed the data, Yong-Joon Jun made the simulation code and wrote the paper.
Conflicts of Interest
The authors declare no conflict of interest.
Nomenclature
| Qab | Collected heat flux (W) |
| Qloss | Flux of heat loss (W) |
| Qcool | Released heat flux (W) |
| Qbackup | Auxiliary heat flux (W) |
| Solar constant (1367 W/m2) | |
| Solar radiation on inclined surfaces (W/m2) | |
| A | Area of solar collectors (m2) |
| Tdb,n | Drybulb temperature at n time (°C) |
| RH | Relative humidity (%) |
| uw | wind velocity (m/s) |
| tds | sunshine durations (h) |
| h | Convective heat transfer coefficient (W/m2·K) |
| r1 | Inner diameter of pipe (m) |
| r2 | Outer diameter of pipe (m) |
| k1 | Heat transfer coefficient of pipe (W/m∙K) |
| k2 | Heat transfer coefficient of storage tank insulation (W/m∙K) |
| L | Length of pipe (m) |
| d | Diameter of storage tank (m) |
| H | Height of storage tank (m) |
| Ch | Specific heat of heat medium (kJ/kg·K) |
| Cw | Specific heat of water (kJ/kg·K) |
| TH | Temperature of Heated water (K) |
| TC | Temperature of Cold water (K) |
| Ta | Temperature of air (K) |
| To | Outlet temperature of solar collector (K) |
| Ti | Inlet temperature of solar collector (K) |
| Tm | Temperature of Heat storage tank (K) |
| TSF | Safety Temperature of H storage tank (K) |
| V | Volume of storage tank (m3) |
| m1 | Mass flow rate of heat medium (kg/h) |
| m2 | Mass flow rate of water (kg/h) |
Greek Symbols
| α | Solar altitude angle (°) |
| γ | Solar azimuth angle (°) |
| ρw | Density of water (kg/m3) |
| ϕ | Inclined angle of solar collector (°) |
| η | Efficiency of solar collector (%) |
Subscripts
| n | n h |
| n − 1 | (n − 1) h |
Superscripts
| k | (k)th iteration step |
| k + 1 | (k + 1)th iteration step |
References
- Park, Y.M.; Hong, S.K.; Choi, A.S. A study on the comparison of the PV module generation from daylight irradiation and indoor lighting savings with lighting simulation. J. Korean Inst. Illum. Electr. Install. Eng. 2010, 24, 17–24. [Google Scholar] [CrossRef]
- Choi, J.S.; Ko, J.S.; Chung, D.H. Efficiency analysis of PV tracking system with PSA algorithm. J. Korean Inst. Illum. Electr. Install. Eng. 2009, 23, 36–44. [Google Scholar]
- Park, S.H.; Seo, J.H. A study on the photovoltaic module layout considering the azimuth and inclination in region. Korea J. Air Cond. Refrig. Eng. 2012, 24, 461–466. [Google Scholar] [CrossRef]
- JO, D.K.; Yun, C.Y.; Kim, K.D.; Kang, Y.H. A study on the estimating solar radiation using hours of bright sunshine for the installation of photovoltaic system in Korea. J. Korean Sol. Energy Soc. 2011, 31, 72–79. [Google Scholar] [CrossRef]
- Khorasanizadeh, H.; Mohammadi, K.; Mostafaeipour, A. Establishing a diffuse solar radiation model for determining the optimum tilt angle of solar surfaces in Tabass. Iran. Energy Convers. Manag. 2014, 78, 805–814. [Google Scholar] [CrossRef]
- Corredor, L.M. Estimation of Solar Radiation Incident on Horizontal and Tilted Surfaces for 7 Colombian Zones. Int. J. Eng. Res. 2013, 2, 362–366. [Google Scholar]
- Soteris, A.K.; Christos, P. Modeling of a thermosyphon solar water heating system and simple model validatinon. Renew. Energy 2000, 21, 471–493. [Google Scholar]
- Loutzenhiser, P.G.; Manz, H.; Felsmann, C.; Strachan, P.A.; Frank, T.; Maxwell, G.M. Empirical validation of models to compute solar irradiance on inclined surfaces for building energy simulation. Sol. Energy 2007, 81, 254–267. [Google Scholar] [CrossRef] [Green Version]
- Al-Rawahi, N.Z.; Zurigat, Y.H.; Al-Azri, N.A. Prediction of hourly solar radiation on horizontal and inclined surfaces for Muscat/Oman. J. Eng. Res. 2011, 8, 19–31. [Google Scholar] [CrossRef]
- Maleki, S.A.M.; Hizam, H.; Gomes, C. Estimation of Houly, Daily and Monthly Global Solar Radiation on Inclined Surfaces: Models Re-Visited. Energies 2017, 10, 134. [Google Scholar] [CrossRef]
- Zhang, Q.; Huang, J.; Lang, S. Development of typical year weather data for Chinese locations/Discussion. ASHRAE Trans. 2002, 108, 1063. [Google Scholar]
- Kim, H.Y.; Kim, J. Correlation to Predict Global Solar Insolation and Evaluation of that Correlation for Korea (I). New Renew. Energy 2016, 10, 30–35. [Google Scholar] [CrossRef]
- Cho, Y.; Kim, Y.; Chung, K.S. A study of Optimum Slope Angles of Fixed and Azimuth Tracking Solar Collectors by Region, Period and Year. In Proceedings of the SAREK Summer Annual Conference, Pyungchang, Korea, 23–25 June 2010. [Google Scholar]
- Orlando, M.M.; Jose, J.F.P. The Effect of the Angle of Inclination on the Efficiency in Medium-Temperature Flat Plate Solar Collector. Energies 2017, 10, 71. [Google Scholar]
- Assilzadeh, F.; Kalogirou, S.A.; Ali, Y.; Sopian, K. Simulation and optimization of a LiBr solar absorption cooling system with evacuated tube collectors. Renew. Energy 2005, 30, 1143–1159. [Google Scholar] [CrossRef]
- Afonso, C.; Oliveira, A. Solar chimneys: Simulation and experiment. Energy Build. 2000, 32, 71–79. [Google Scholar] [CrossRef]
- Amori, K.E.; Mohammed, S.W. Experimental and numerical studies of solar chimney for natural ventilation in Iraq. Energy Build. 2012, 47, 450–457. [Google Scholar] [CrossRef]
- Morrison, G.L.; Budihardjo, I.; Bahnia, M. Measurement and simulation of flow rate in a water-in-glass evacuated tube solar water heater. Sol. Energy 2005, 78, 257–267. [Google Scholar] [CrossRef]
- Gao, Y.; Zhang, Q.; Fan, R.; Lin, X.; Yu, Y. Effects of thermal mass and flow rate on forced-circulation solar hot-water system: Comparison of water-in-glass and U-pipe evacuated-tube solar collectors. Sol. Energy. 2013, 98, 290–301. [Google Scholar] [CrossRef]
- Guoying, X.; Xiaoson, Z.; Shiming, D. A simulation study on the operating performance of a solar-air source heat pump water heater. Appl. Therm. Eng. 2006, 26, 1257–1265. [Google Scholar]
- Kalogirou, S.A. Use of TRNSYS for modeling and simulation of a hybrid pv-thermal solar system for Cyprus. Renew. Energy 2001, 23, 247–260. [Google Scholar] [CrossRef]
- Hwang, H.C.; Chi, R.G.; Lee, G.B.; Lee, S.H. A study of geothermal heat pump for solar collectors overheat protection. J. Korea Acad. Ind. Coop. Soc. 2016, 17, 616–622. [Google Scholar]
- Bai, S.E.; Bai, C.H.; Nam, H.K.; Shin, K.Y. A study on reducing temperature rise of twin-glass evacuated tube solar collector during summer time. J. Korea Sol. Energy Soc. 2013, 33, 1598–6411. [Google Scholar] [CrossRef]
- Choi, B.S.; Bong, J.L.; Kang, C.; Hong, H. Verification experiment and analysis for 6kW solar water heating system (Part 3: Optimum design and economic evaluation). Korea J. Air Cond. Refrig. Eng. 2005, 17, 16–24. [Google Scholar]
- Slaman, M.; Griessen, S. Solar collector overheating protection. Sol. Energy 2009, 83, 982–987. [Google Scholar] [CrossRef]
- Salwa, B.; Mehdi, F.; Mohamed, M.O.; Amenallah, G.; Abdelhamid, F. Enhancement of latent heat storage in a rectangular cavity: Solar water heater case study. Energy Convers. Manag. 2014, 78, 904–912. [Google Scholar]
- Jun, Y.J.; Song, Y.H.; Park, K.S. A study on the prediction of the optimum performance of a small-scale desalination system using solar heat energy. Energies 2017, 10, 1274. [Google Scholar] [CrossRef]
- Park, S.M.; Kim, J. Correlation to Predict Global Solar Insolation and Evaluation of that Correlation for Korea (II). New Renew. Energy 2016, 12, 24–29. [Google Scholar] [CrossRef]
- Jürges, W. Der Warmeubergang an Einer Ebenen Wand, 2nd ed.; R. Oldenbourg: München, Germany, 1924. [Google Scholar]
- Zhai, Z.; Chen, Q. Solution characters of iterative coupling between energy simuilation and CFD program. Energy Build. 2003, 35, 493–505. [Google Scholar] [CrossRef]
- Jo, D.K.; Kang, Y.H. Analysis of maximum solar radiation on inclined surfaces for the installation of solar thermal systems in Korea using the optimum installation angle. J. Korean Sol. Energy Soc. 2009, 29, 1598–6411. [Google Scholar]
- Lee, K.H.; Baek, N.C. A modified efficiency equation of solar collectors. Energy Procedia 2014, 48, 145–149. [Google Scholar] [CrossRef]
Figure 1.
Solar safety devices for preventing system overheating: (a) Cooling fan; (b) Covering solar collector.
Figure 1.
Solar safety devices for preventing system overheating: (a) Cooling fan; (b) Covering solar collector.
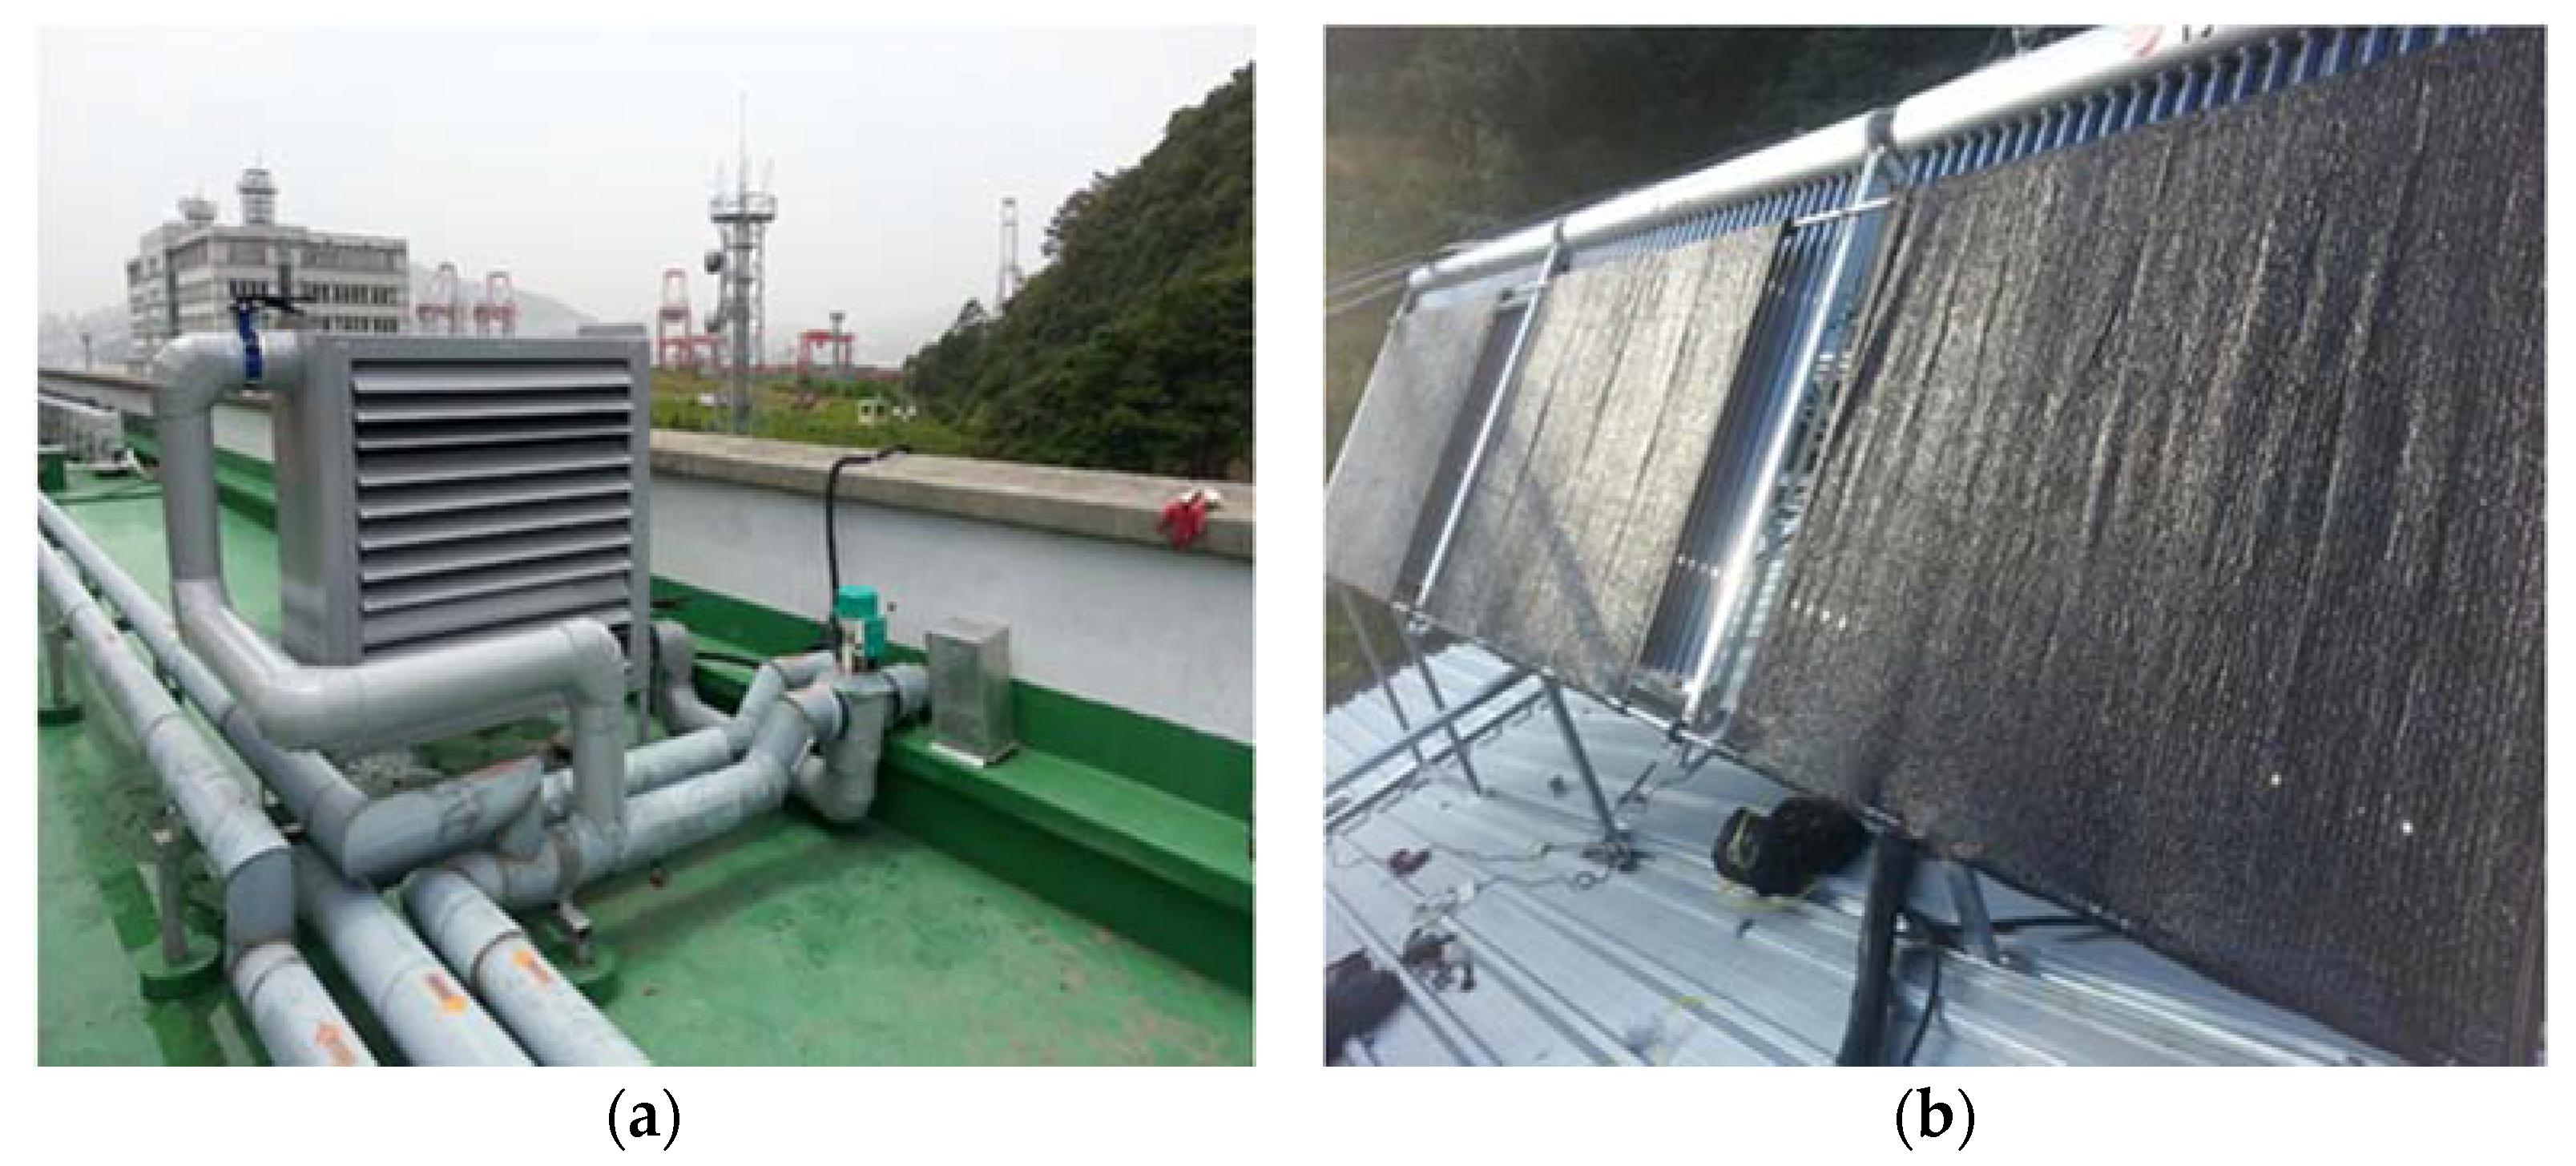
Figure 2.
Schematic diagram of solar water heating system in this study.

Figure 3.
Radiation by solar altitude and azimuth.
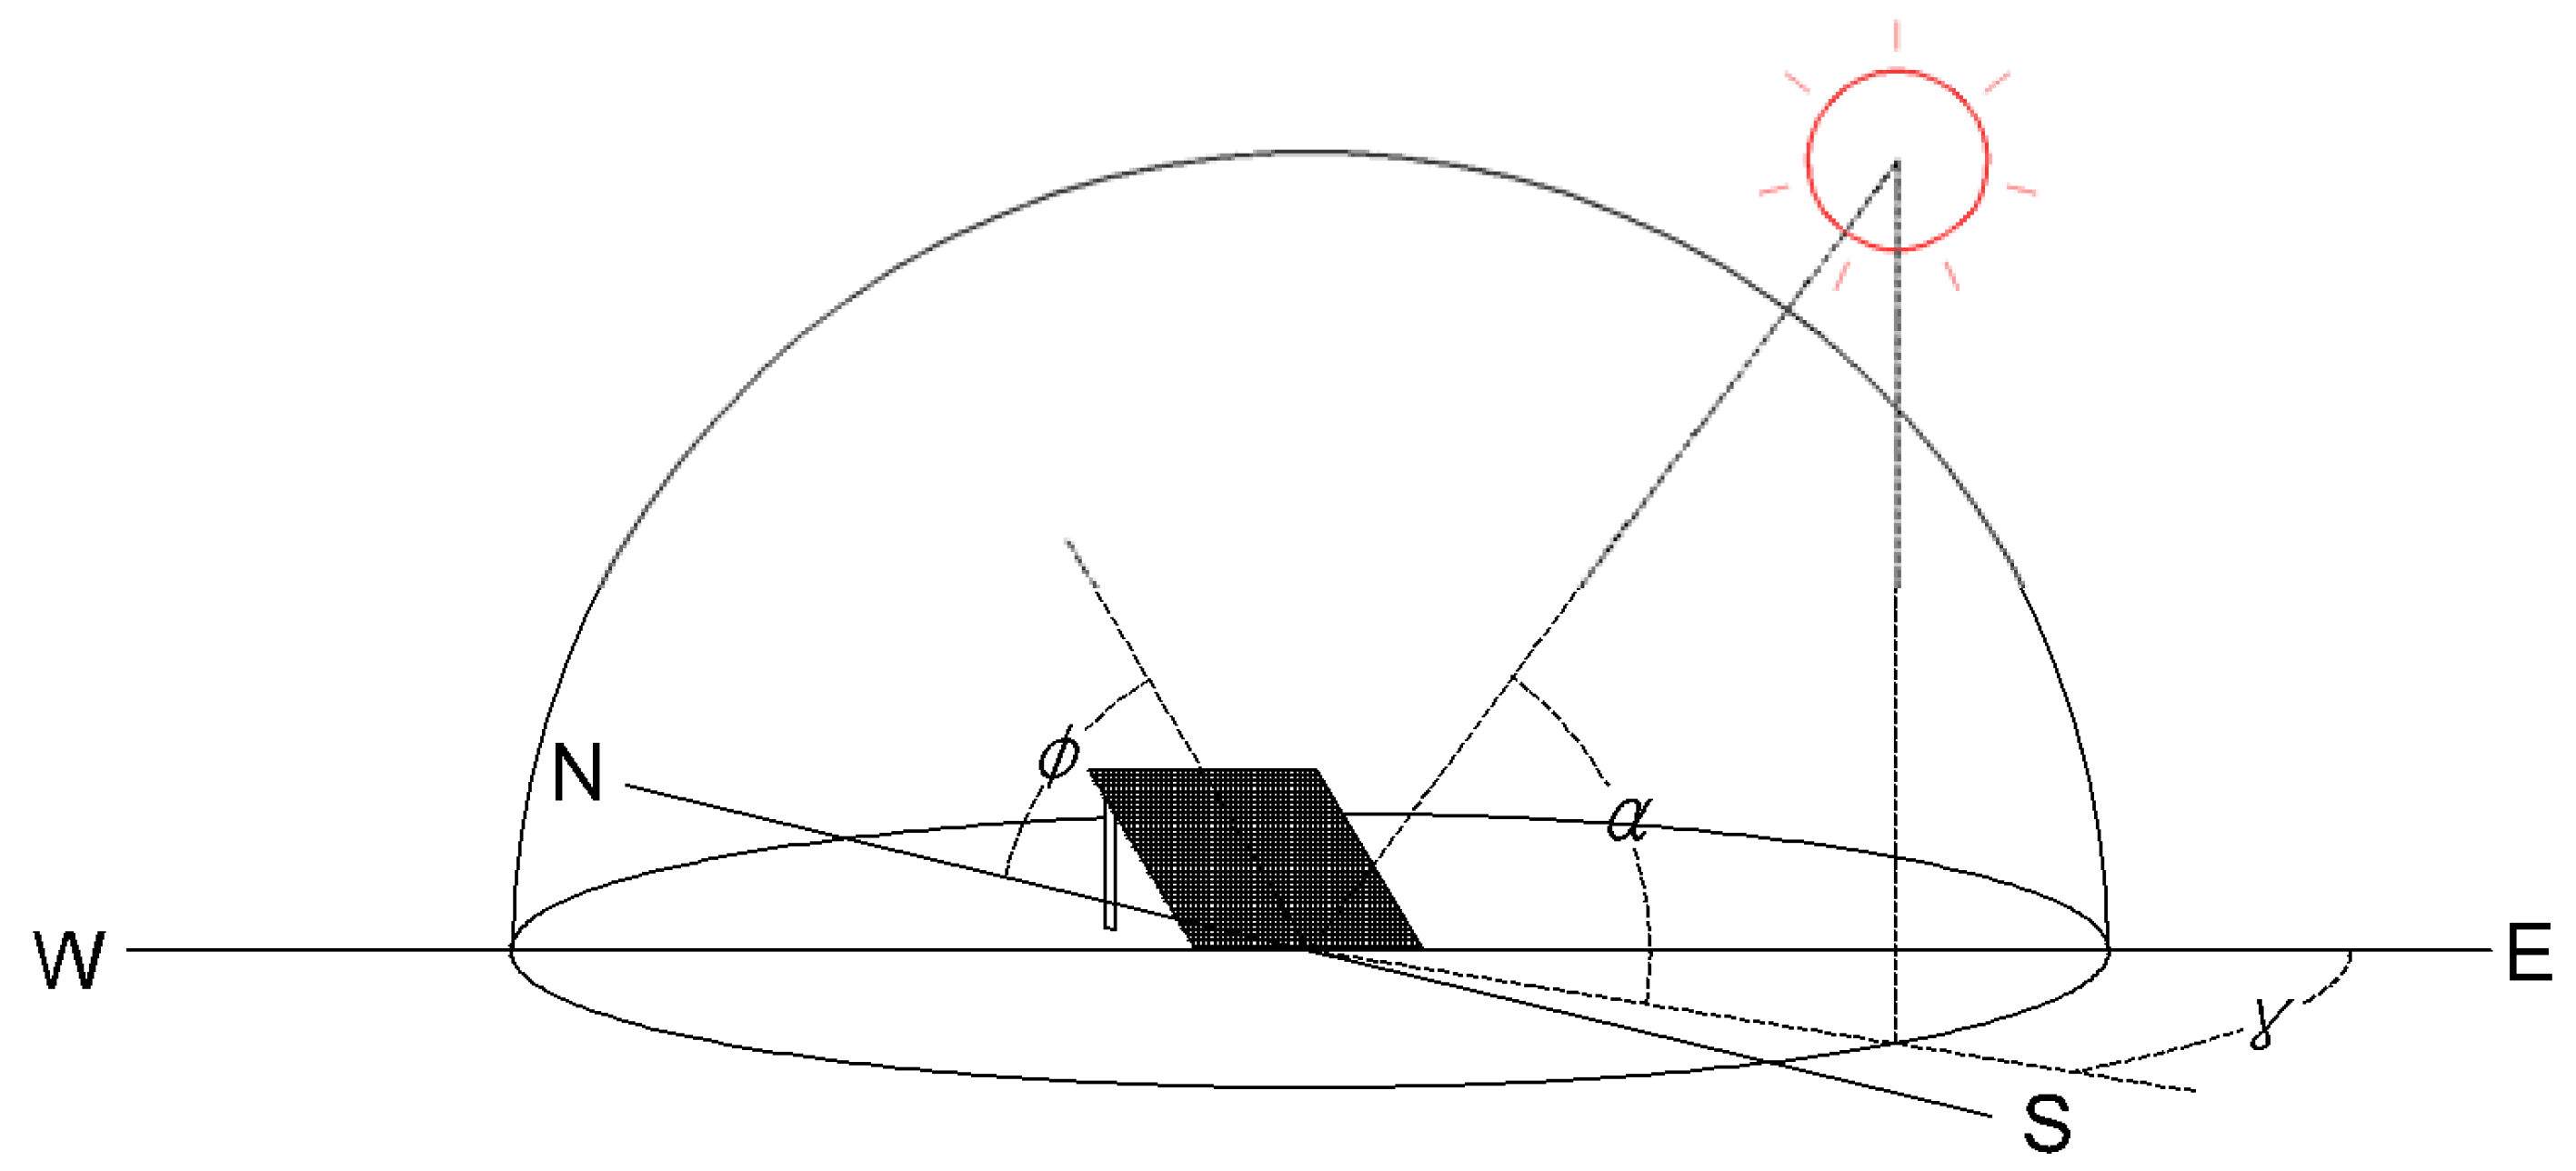
Figure 4.
Iteration calculation flow chart.
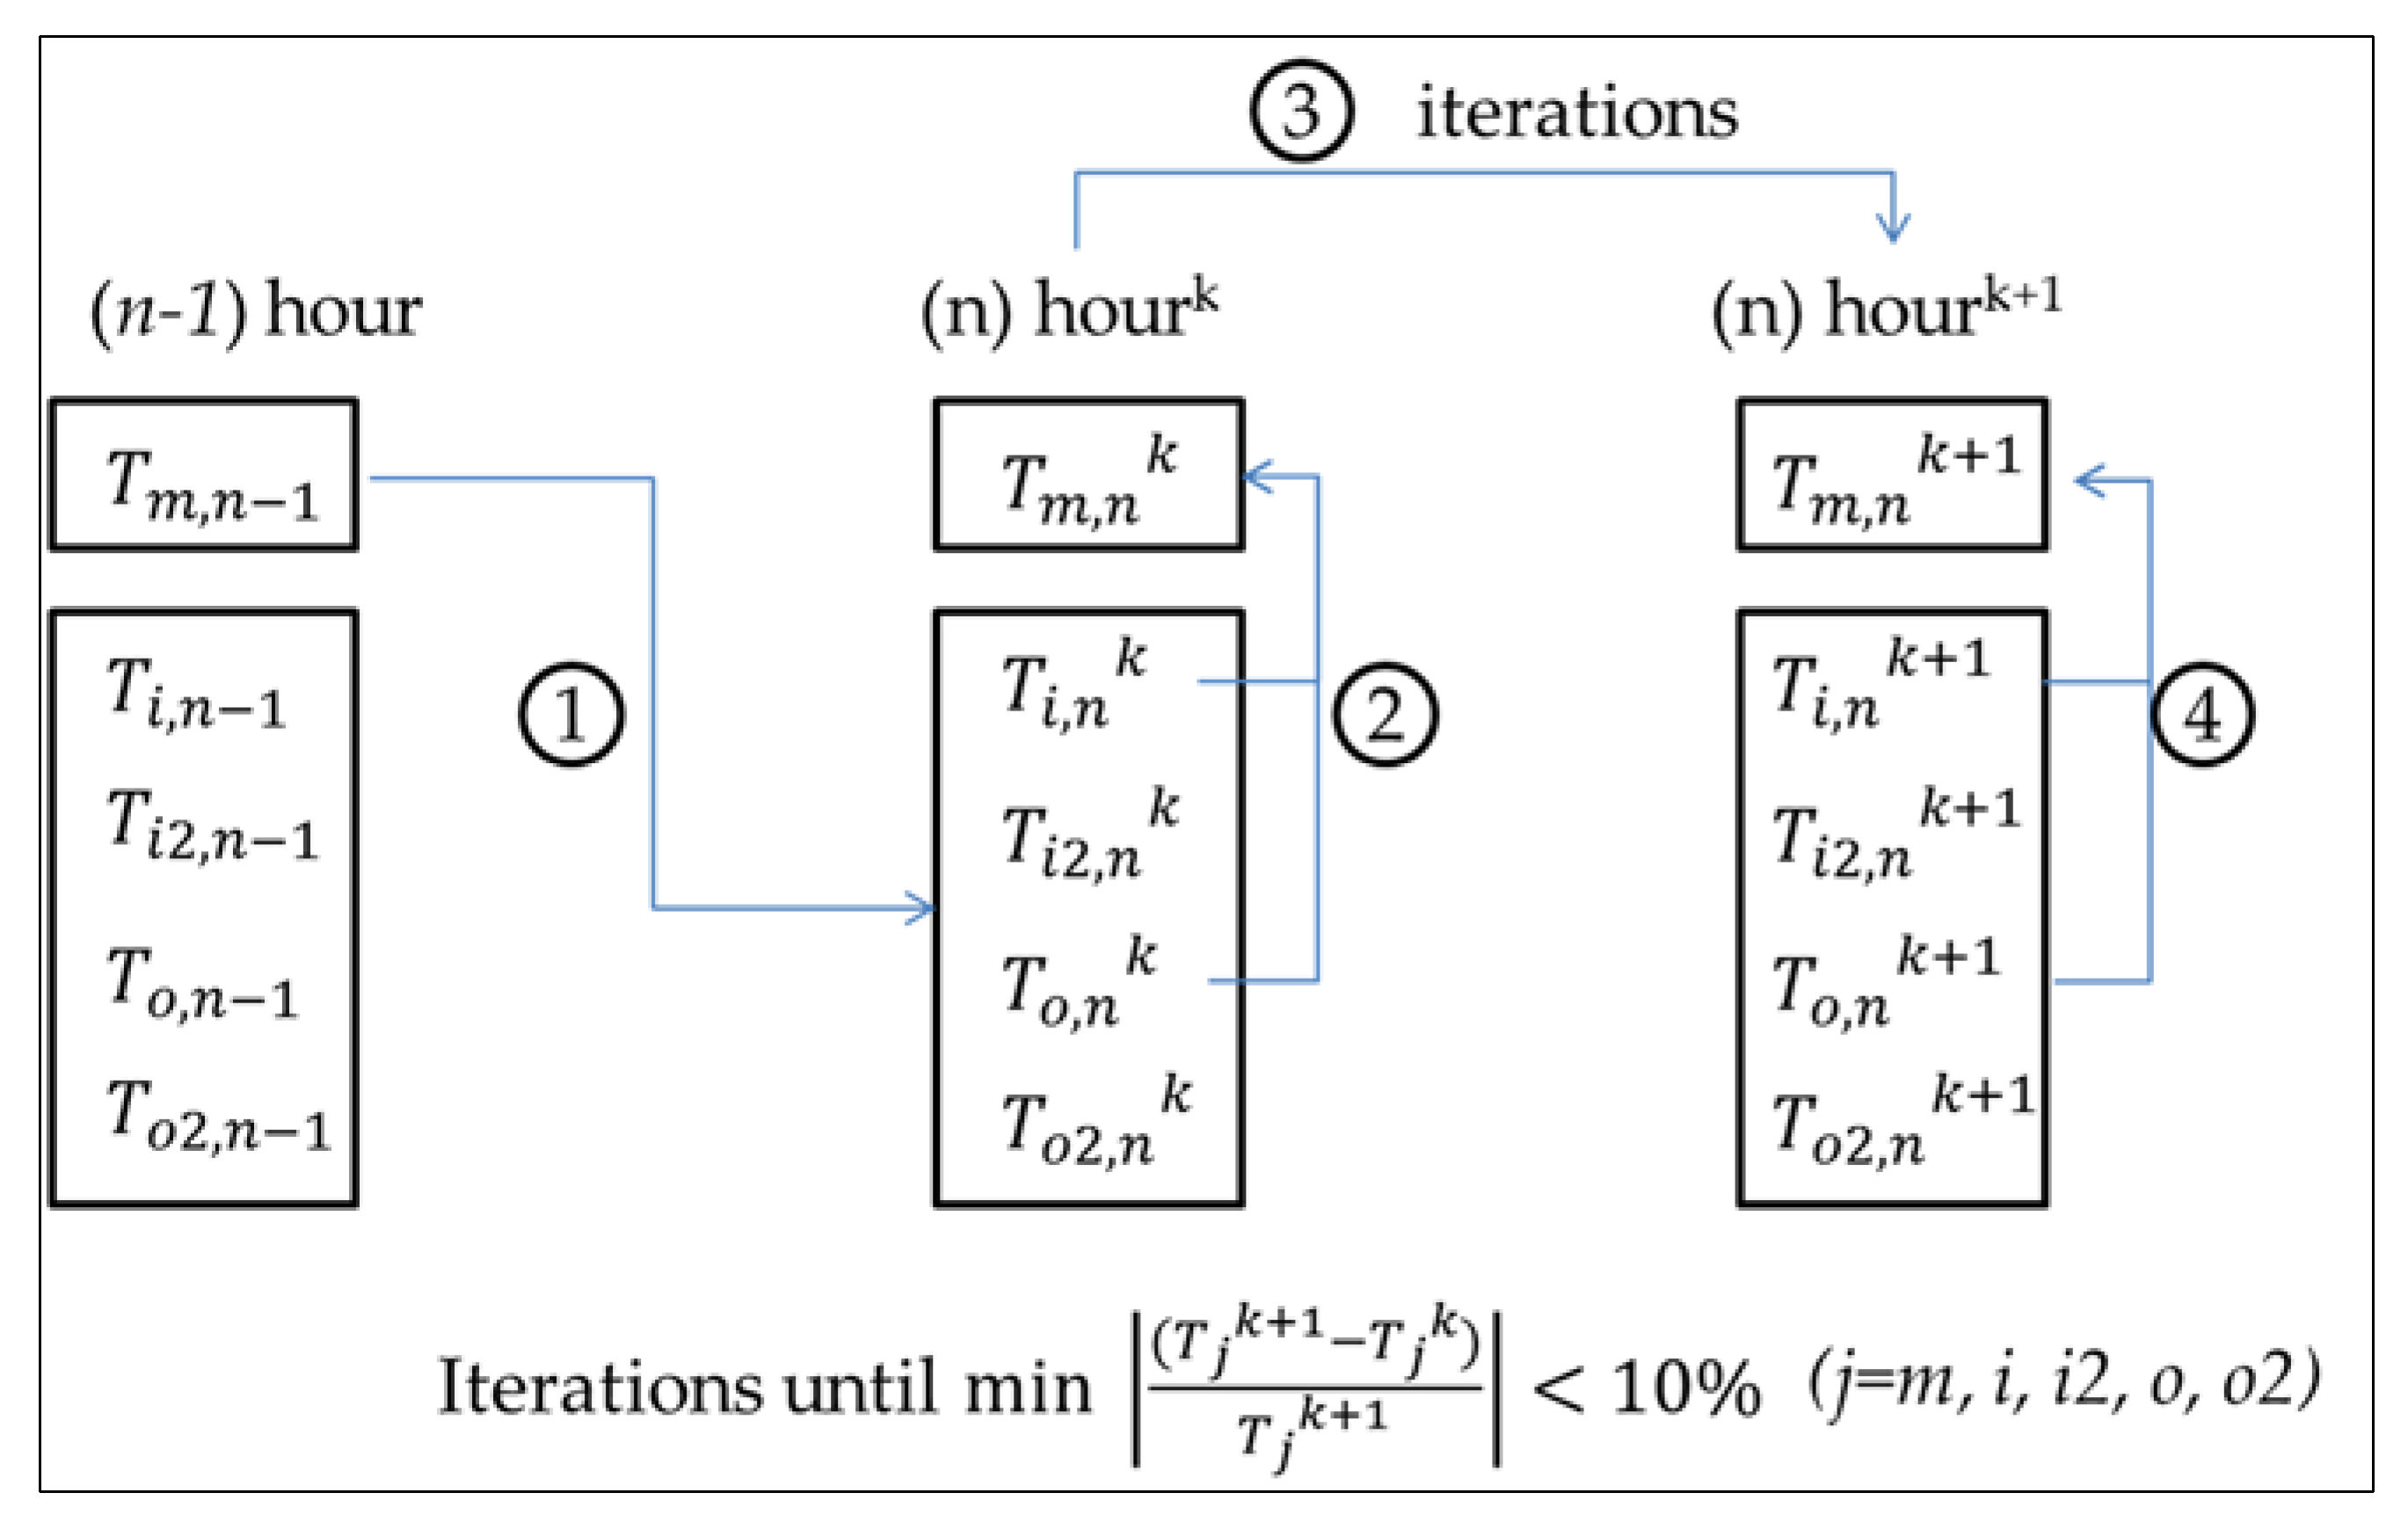
Figure 5.
Comparison of solar energy at a 30° angle vs. a previous study [31] (MJ/m2·d).
Figure 5.
Comparison of solar energy at a 30° angle vs. a previous study [31] (MJ/m2·d).

Figure 6.
Temperatures of the solar storage tank and the collected solar energy overtime (16 May 2017).
Figure 6.
Temperatures of the solar storage tank and the collected solar energy overtime (16 May 2017).

Figure 7.
Amounts of collected and released solar energy vs. installation angle.

Figure 8.
Locations and latitudes of representative regions in South Korea.

Figure 9.
Released solar energy by region and installation angle [GJ/year].

Figure 10.
Purely usable solar energy and sunshine hours by region.

Table 1.
Efficiency formula of the KS (Korean Industrial Standards) standard for collector types.
| Item | Flat-Plate Type | Single Vacuum Tube | Reflector Double Vacuum Tube |
|---|---|---|---|
| 0.771 ± 0.058 | 0.721 ± 0.007 | 0.664 ± 0.078 | |
| 5.091 ± 0.611 | 1.483 ± 0.758 | 2.829 ± 1.996 | |
| 0.0048 ± 0.0071 | 0.0055 ± 0.0047 | −0.0005 ± 0.0126 |
Table 2.
Occupancy rates (school and office building data from Design Builder Libraries).
| Hour | 8 | 9 | 10 | 11 | 12 | 13 | 14 | 15 | 16 | 17 | 18 | Other Time |
|---|---|---|---|---|---|---|---|---|---|---|---|---|
| Occupancy ( | 0.1 | 0.25 | 0.75 | 1 | 1 | 0.5 | 0.5 | 1 | 1 | 0.5 | 0.5 | 0 |
Table 3.
Simulation results under the same condition as the previous study.
| Month | Daily Mean Solar Radiation (MJ/m2·d) Present Study | Mean Efficiency (η) | Amount of Heat Collection (MJ/m2·d) | Amount of Heat Released due to Overheating (kJ) | Remarks |
|---|---|---|---|---|---|
| 1 | 15.19 | 0.44 | 6.75 | - | Heat collection area: 6 Capacity of the heat storage tank: 300 L |
| 2 | 16.22 | 0.46 | 7.45 | - | |
| 3 | 18.29 | 0.48 | 8.75 | - | |
| 4 | 17.76 | 0.49 | 8.62 | - | |
| 5 | 19.08 | 0.50 | 9.47 | 1.628 | |
| 6 | 16.81 | 0.48 | 8.14 | - | |
| 7 | 13.38 | 0.47 | 6.29 | - | |
| 8 | 14.75 | 0.49 | 7.27 | 1.628 | |
| 9 | 15.50 | 0.48 | 7.47 | 1.628 | |
| 10 | 16.54 | 0.47 | 7.80 | - | |
| 11 | 14.32 | 0.45 | 6.47 | - | |
| 12 | 14.47 | 0.43 | 6.23 | - | |
| Avg./Sum | 16.03 (Avg.) | 0.47 (Avg.) | 7.56 (Avg.) | 4.884 (Sum) |
Table 4.
Simulated specifications of parts.
| Classification | Details | |
|---|---|---|
| Installation angle | 0, 15°, 30°, 45°, 60°, 75°, 90° | |
| Heat release capacity | 14,000 kcal/h | |
| Solar collector | Type | Flat type |
| Size | 1180 mm × 2400 mm × 92 mm | |
| Quantities | 40 EA | |
| Glass | Low-iron glass (transmit rate: 91.7%) with 4 mm thickness | |
| Absorber | Titanium coated copper plate (emission rate: 4 ± 1%, Absorption rate: 95 ± 1%) with 0.2 mm thickness | |
| Insulation | Glass wool 0.040 W/mK with 40 mm thickness (bottom) PE form 0.035 W/mK with 15 mm thickness (side) | |
| Pipe | ϕ 22.2 mm * 2 EA and ϕ 8 mm × 10 EA | |
| Solar storage tank | Case A: 30 L/ (ϕ 1300 × 1200 H) Case B: 40 L/ (ϕ 1500 × 1200 H) Case C: 50 L/ (ϕ 1680 × 1200 H) (100 mm glass wool insulation) | |
| Supply and Return Pipe | 40 mm copper pipe with 40 mm insulation Length of supply pipe: 40 m Length of return pipe: 40 m | |
Table 5.
Horizontal surface irradiation (weather data, MJ/d).
| Region | 1 | 2 | 3 | 4 | 5 | 6 | 7 | 8 | 9 | 10 | 11 | 12 | Total |
|---|---|---|---|---|---|---|---|---|---|---|---|---|---|
| Seoul | 8.5 | 12.3 | 15.2 | 17.6 | 21.0 | 20.2 | 14.3 | 15.0 | 14.5 | 12.4 | 8.4 | 7.7 | 167.0 |
| Daejeon | 7.7 | 11.4 | 14.4 | 16.9 | 20.4 | 19.0 | 14.7 | 14.7 | 13.1 | 11.2 | 7.8 | 7.0 | 158.5 |
| Daegu | 9.8 | 12.5 | 15.5 | 18.2 | 21.8 | 18.8 | 16.7 | 15.4 | 13.6 | 12.3 | 9.2 | 8.4 | 172.3 |
| Ulsan | 8.2 | 11.7 | 14.5 | 17.2 | 20.2 | 17.2 | 14.5 | 14.4 | 13.8 | 11.9 | 8.4 | 7.2 | 159.3 |
| Gwangju | 8.6 | 12.1 | 14.6 | 16.5 | 19.1 | 18.5 | 13.2 | 14.0 | 13.7 | 12.2 | 8.6 | 7.8 | 158.9 |
| Busan | 10.4 | 12.8 | 15.4 | 17.8 | 20.0 | 16.5 | 16.5 | 16.4 | 14.4 | 12.8 | 9.9 | 9.3 | 172.3 |
| Jeju | 6.5 | 9.9 | 13.3 | 16.2 | 18.6 | 13.8 | 16.3 | 15.5 | 13.0 | 10.9 | 7.5 | 5.9 | 147.4 |
Table 6.
Collected solar energy (GJ/year).
| Case | Region | 0° | 15° | 30° | 45° | 60° | 75° | 90° |
|---|---|---|---|---|---|---|---|---|
| A | Seoul | 179.1 | 209.2 | 226.6 | 226.2 | 212.6 | 186.5 | 148.4 |
| Daejeon | 174 | 198.4 | 214 | 213.5 | 199.2 | 173.4 | 137.1 | |
| Daegu | 193.2 | 225.2 | 238.4 | 236.4 | 220.6 | 193.2 | 154 | |
| Ulsan | 171.7 | 199.8 | 213 | 211.2 | 196.3 | 170 | 134 | |
| Gwangju | 179.2 | 203.2 | 218.2 | 215.9 | 200.9 | 175.2 | 138.7 | |
| Busan | 197.3 | 228 | 240.2 | 237.9 | 222 | 194 | 155.2 | |
| Jeju | 168.9 | 186.6 | 195.5 | 190.8 | 177.3 | 152.2 | 118.2 | |
| B | Seoul | 190.5 | 216.9 | 235.5 | 235.4 | 220.4 | 192 | 152 |
| Daejeon | 184.1 | 209.3 | 223.3 | 221.2 | 206.1 | 177.6 | 136.8 | |
| Daegu | 202.6 | 232.1 | 248.3 | 246.5 | 229.7 | 200 | 155.8 | |
| Ulsan | 181.5 | 205.6 | 220.7 | 218.3 | 202.6 | 174.5 | 135.1 | |
| Gwangju | 191.1 | 213.7 | 227.2 | 224.8 | 208.5 | 179.8 | 140.1 | |
| Busan | 202.7 | 236.1 | 250.6 | 248.2 | 231.3 | 201 | 160.3 | |
| Jeju | 172.5 | 194.1 | 203.9 | 200.5 | 184.3 | 156.5 | 121.6 | |
| C | Seoul | 195.3 | 224.1 | 237.1 | 238.9 | 224.1 | 193.7 | 148.5 |
| Daejeon | 189 | 212.3 | 222.1 | 221.6 | 206.1 | 175.9 | 133.3 | |
| Daegu | 209.2 | 237 | 252 | 251 | 233.4 | 200.2 | 153.7 | |
| Ulsan | 187.1 | 212.9 | 223.3 | 221.7 | 205.5 | 174.5 | 131.5 | |
| Gwangju | 195.1 | 217.6 | 227.5 | 226.8 | 209.5 | 178.9 | 135.8 | |
| Busan | 210.8 | 239.5 | 255.5 | 253.2 | 235.6 | 203.3 | 159.1 | |
| Jeju | 179.9 | 200.4 | 208.6 | 203.6 | 186.5 | 158.6 | 121.2 |
Table 7.
Auxiliary energy for water heating (GJ/year).
| Case | Region | 0 | 15° | 30° | 45° | 60° | 75° | 90° |
|---|---|---|---|---|---|---|---|---|
| A | Seoul | 13.8 | 10.7 | 10.5 | 9.9 | 9.9 | 10.8 | 13.4 |
| Daejeon | 15.6 | 11.1 | 11.3 | 11.1 | 11.3 | 12.3 | 15.8 | |
| Daegu | 12.1 | 10.8 | 9.6 | 8.9 | 9 | 9.9 | 12.7 | |
| Ulsan | 14.3 | 11.9 | 10.9 | 10.4 | 10.4 | 11.6 | 15.8 | |
| Gwangju | 13.7 | 10.5 | 10.8 | 10.4 | 10.6 | 11.9 | 15.6 | |
| Busan | 11.5 | 10 | 8.6 | 8.1 | 8.2 | 9.1 | 12.3 | |
| Jeju | 14.7 | 10.7 | 10.1 | 9.6 | 10.7 | 12.4 | 16.9 | |
| B | Seoul | 28 | 17 | 16.6 | 15.7 | 16 | 17.9 | 23.4 |
| Daejeon | 29.1 | 20.8 | 18.8 | 17.8 | 18.6 | 20.6 | 25.1 | |
| Daegu | 21.9 | 16.1 | 15.3 | 14.5 | 14.8 | 16.9 | 20.5 | |
| Ulsan | 27.2 | 17.7 | 17.1 | 16.1 | 16.7 | 19.5 | 26 | |
| Gwangju | 27.3 | 18.4 | 17.4 | 16.9 | 17.5 | 19.8 | 25.7 | |
| Busan | 18.1 | 15.7 | 14 | 13.1 | 13.6 | 15.5 | 21.9 | |
| Jeju | 22.9 | 18 | 16.9 | 17.4 | 18.5 | 21.6 | 30.5 | |
| C | Seoul | 40.6 | 26.9 | 20.7 | 21.2 | 22.5 | 25.1 | 29.7 |
| Daejeon | 42.4 | 28.3 | 21.8 | 21.9 | 23.2 | 26.2 | 31.7 | |
| Daegu | 34.1 | 22.5 | 20.1 | 19.8 | 20.4 | 22.4 | 26.8 | |
| Ulsan | 40.6 | 28.7 | 22.7 | 22 | 23.7 | 26.8 | 33.3 | |
| Gwangju | 39.3 | 26.2 | 21.2 | 21.8 | 22.9 | 26.2 | 32.1 | |
| Busan | 29.2 | 20.4 | 18.9 | 18.2 | 19.1 | 22 | 29.5 | |
| Jeju | 37.6 | 28.5 | 25.4 | 24.7 | 27 | 32.4 | 42.9 |
Table 8.
Released solar energy (GJ/year).
| Case | Region | 0 | 15° | 30° | 45° | 60° | 75° | 90° |
|---|---|---|---|---|---|---|---|---|
| A | Seoul | 14.5 | 18.2 | 18.6 | 14.4 | 6.9 | 1.9 | 0.1 |
| Daejeon | 12.3 | 15.8 | 14.7 | 10.4 | 3.2 | 0.4 | 0 | |
| Daegu | 18.3 | 22.8 | 22.6 | 17.6 | 8 | 1.5 | 0.1 | |
| Ulsan | 9.9 | 12.6 | 12.2 | 8.5 | 3.6 | 0.8 | 0 | |
| Gwangju | 12.6 | 15.6 | 15.3 | 10.8 | 4.3 | 0.8 | 0 | |
| Busan | 16.1 | 20.5 | 20.3 | 16.3 | 8.5 | 2.1 | 0 | |
| Jeju | 11 | 12.6 | 11.6 | 7.2 | 2.2 | 0.1 | 0 | |
| B | Seoul | 5.5 | 7.4 | 7.8 | 4.9 | 1.6 | 0.2 | 0 |
| Daejeon | 4.9 | 6.1 | 4.8 | 1.9 | 0.2 | 0 | 0 | |
| Daegu | 9 | 10.2 | 9.7 | 5.6 | 1.3 | 0 | 0 | |
| Ulsan | 2.8 | 3.4 | 3.8 | 1.8 | 0.7 | 0 | 0 | |
| Gwangju | 5 | 6 | 5.4 | 2.7 | 0.6 | 0 | 0 | |
| Busan | 6.6 | 8.8 | 8.5 | 5.5 | 1.5 | 0.2 | 0 | |
| Jeju | 4.5 | 4.9 | 3.9 | 1.8 | 0.1 | 0 | 0 | |
| C | Seoul | 1.4 | 2.2 | 1.7 | 0.8 | 0.1 | 0 | 0 |
| Daejeon | 1.3 | 1.6 | 0.7 | 0.1 | 0 | 0 | 0 | |
| Daegu | 3.2 | 4.1 | 2.8 | 0.9 | 0 | 0 | 0 | |
| Ulsan | 0.5 | 0.6 | 0.5 | 0.2 | 0 | 0 | 0 | |
| Gwangju | 1.2 | 1.9 | 1.1 | 0.3 | 0 | 0 | 0 | |
| Busan | 2.6 | 3.4 | 2.5 | 1.2 | 0.2 | 0 | 0 | |
| Jeju | 1.8 | 2.1 | 1.2 | 0.3 | 0 | 0 | 0 |
Table 9.
Purely usable solar energy (GJ/year).
| Case | Region | 0 | 15° | 30° | 45° | 60° | 75° | 90° |
|---|---|---|---|---|---|---|---|---|
| A | Seoul | 150.8 | 180.4 | 197.5 | 202 | 195.8 | 173.8 | 135 |
| Daejeon | 146.1 | 171.6 | 188.1 | 192 | 184.6 | 160.7 | 121.3 | |
| Daegu | 162.8 | 191.7 | 206.2 | 209.9 | 203.7 | 181.8 | 141.3 | |
| Ulsan | 147.5 | 175.3 | 189.9 | 192.3 | 182.3 | 157.6 | 118.2 | |
| Gwangju | 152.9 | 177.1 | 192.2 | 194.8 | 186 | 162.5 | 123.2 | |
| Busan | 169.7 | 197.5 | 211.3 | 213.5 | 205.3 | 182.8 | 142.9 | |
| Jeju | 143.2 | 163.3 | 173.9 | 174.1 | 164.4 | 139.7 | 101.3 | |
| B | Seoul | 157 | 192.5 | 211.1 | 214.8 | 202.9 | 173.9 | 128.6 |
| Daejeon | 150.1 | 182.5 | 199.6 | 201.5 | 187.3 | 157 | 111.7 | |
| Daegu | 171.7 | 205.8 | 223.3 | 226.4 | 213.5 | 183.1 | 135.2 | |
| Ulsan | 151.5 | 184.5 | 199.9 | 200.4 | 185.2 | 155.1 | 109.2 | |
| Gwangju | 158.8 | 189.3 | 204.3 | 205.1 | 190.4 | 160 | 114.4 | |
| Busan | 177.9 | 211.7 | 228.1 | 229.5 | 216.2 | 185.2 | 138.4 | |
| Jeju | 145.2 | 171.2 | 183.1 | 181.2 | 165.7 | 134.9 | 91.1 | |
| C | Seoul | 153.3 | 195 | 214.7 | 216.9 | 201.6 | 168.5 | 118.8 |
| Daejeon | 145.3 | 182.3 | 199.6 | 199.6 | 182.9 | 149.6 | 101.5 | |
| Daegu | 172 | 210.4 | 229.1 | 230.3 | 213 | 177.8 | 126.9 | |
| Ulsan | 146 | 183.6 | 200.1 | 199.5 | 181.8 | 147.7 | 98.2 | |
| Gwangju | 154.5 | 189.5 | 205.2 | 204.6 | 186.6 | 152.7 | 103.6 | |
| Busan | 179 | 215.6 | 234 | 233.8 | 216.3 | 181.3 | 129.6 | |
| Jeju | 140.5 | 169.8 | 182 | 178.6 | 159.5 | 126.2 | 78.3 |
Table 10.
The most efficient installation angle and capacity of the heat storage tank.
| 1st Step | 2nd Step | ||||
|---|---|---|---|---|---|
| Region | Capacity (L/) | Optimum Angle (°) | Effective Amount of Heat Collection (GJ/year) | Optimum Angle (°) | Effective Amount of Heat Collection (GJ/year) |
| Seoul | 50 | 45 | 216.9 | 39 | 218.3 |
| Daejeon | 40 | 45 | 201.5 | 39 | 202.8 |
| Daegu | 50 | 45 | 230.3 | 38 | 232.0 |
| Ulsan | 50 | 45 | 200.4 | 37 | 202.4 |
| Gwangju | 50 | 30 | 205.2 | 36 | 207.1 |
| Busan | 50 | 30 | 234.0 | 38 | 236.3 |
| Jeju | 40 | 30 | 183.1 | 37 | 184.2 |
Table 11.
Differences between the latitudes and the most efficient installation angles by region.
| Region | Latitude (°) | Optimum Angle (°) | Effective Amount of Heat Collection (GJ) | Difference in Angle (°) |
|---|---|---|---|---|
| Seoul | 37.57 | 39 | 218.3 | 1.4 |
| Daejeon | 36.37 | 38 | 202.1 | 1.6 |
| Daegu | 35.83 | 39 | 232.0 | 3.2 |
| Ulsan | 35.58 | 37 | 202.4 | 1.4 |
| Gwangju | 35.17 | 38 | 207.1 | 2.8 |
| Busan | 35.10 | 38 | 236.3 | 2.9 |
| Jeju | 33.51 | 35 | 182.7 | 1.5 |
| Mean | - | - | - | 2.1 |
Table 12.
Difference between latitude and most efficiency installation angle by region (excluding summer time).
Table 12.
Difference between latitude and most efficiency installation angle by region (excluding summer time).
| Region | Latitude (°) | Angle (°) | Effective Amount of Heat Collection (GJ/Year) | Difference in Angle (°) |
|---|---|---|---|---|
| Seoul | 37.6 | 41 | 165.5 | 3.4 |
| Daejeon | 36.4 | 41 | 150.1 | 4.6 |
| Daegu | 35.8 | 42 | 154.9 | 6.2 |
| Ulsan | 35.6 | 40 | 152.8 | 4.4 |
| Gwangju | 35.2 | 40 | 154.8 | 4.8 |
| Busan | 35.1 | 39 | 179.6 | 3.9 |
| Jeju | 33.5 | 36 | 128.3 | 2.5 |
| Average | - | - | - | 4.26 |
© 2017 by the authors. Licensee MDPI, Basel, Switzerland. This article is an open access article distributed under the terms and conditions of the Creative Commons Attribution (CC BY) license (http://creativecommons.org/licenses/by/4.0/).
Share and Cite
MDPI and ACS Style
Jun, Y.-J.; Song, Y.-H.; Kim, D.-Y.; Park, K.-S. Analysis of the Optimum Solar Collector Installation Angle from the Viewpoint of Energy Use Patterns. Energies 2017, 10, 1753. https://doi.org/10.3390/en10111753
AMA Style
Jun Y-J, Song Y-H, Kim D-Y, Park K-S. Analysis of the Optimum Solar Collector Installation Angle from the Viewpoint of Energy Use Patterns. Energies. 2017; 10(11):1753. https://doi.org/10.3390/en10111753
Chicago/Turabian StyleJun, Yong-Joon, Young-Hak Song, Dae-Young Kim, and Kyung-Soon Park. 2017. "Analysis of the Optimum Solar Collector Installation Angle from the Viewpoint of Energy Use Patterns" Energies 10, no. 11: 1753. https://doi.org/10.3390/en10111753
Note that from the first issue of 2016, this journal uses article numbers instead of page numbers. See further details here.