Case Library Construction Technology of Energy Loss in Distribution Networks Considering Regional Differentiation Theory

1
College of Information and Electrical Engineering, China Agricultural University, Beijing 100083, China
2
State Grid Gansu Electric Power Company, Lanzhou 730046, China
*
Author to whom correspondence should be addressed.
Energies 2017, 10(11), 1861; https://doi.org/10.3390/en10111861
Submission received: 28 September 2017
/
Revised: 5 November 2017
/
Accepted: 10 November 2017
/
Published: 14 November 2017
(This article belongs to the Special Issue Emerging Power Electronics Technologies for Power Systems and Machine Drives)
Abstract
:The grid structures, load levels, and running states of distribution networks in different supply regions are known as the influencing factors of energy loss. In this paper, the case library of energy loss is constructed to differentiate the crucial factors of energy loss in the different supply regions. First of all, the characteristic state values are selected as the representation of the cases based on the analysis of energy loss under various voltage classes and in different types of regions. Then, the methods of Grey Relational Analysis and the K-Nearest Neighbor are utilized to implement the critical technologies of case library construction, including case representation, processing, analysis, and retrieval. Moreover, the analysis software of the case library is designed based on the case library construction technology. Some case studies show that there are many differences and similarities concerning the factors that influence the energy loss in different types of regions. In addition, the most relevant sample case can be retrieved from the case library. Compared with the traditional techniques, constructing a case library provides a new way to find out the characteristics of energy loss in different supply regions and constitutes differentiated loss-reducing programs.
1. Introduction
With the extensive construction and the transformation of distribution networks in China, the ratio of energy loss has become one of the decisive factors of the benefit of power supply enterprises. However, with regard to the energy loss analysis, the differences of grid structures, load characteristics, operating conditions, and equipment states in urban and rural distribution networks have chronically been neglected by the traditional methods. These differences, which are associated with the development of distribution networks, should be considered according to the regional differentiation theory. Therefore, it is necessary to study the effect factors and their effect degrees in different types of distribution networks.
Nowadays, some researchers have made considerable research on loss analysis and loss-reducing methods in distribution networks and have acquired a lot of valuable results. In fact, previous papers have already proposed alternatives to the loss factors. Reference [1] proposed adopting the average demand as the main information for loss estimation and using a load profile correction parameter to account for load variations. Reference [2] presented that energy losses could be estimated using information about the mean and variation components of the load curve. The method is more accurate in reference [3], in which a model, named as the loss coefficient mode, has been developed to estimate hourly and annual losses and their value. References [4,5] put forward approaches to analyze energy loss in distribution networks with the gray system theory. Generally, the differences and similarities of energy loss in several supply regions have not received attention because the traditional methods do not provide a way to compare the energy loss in different regions [6,7]. The application of the case library makes it possible to connect the different conditions of energy loss for comprehensive analysis.
The case library construction is mainly based on the Case-based Reasoning (CBR) theory, which is extensively applied in various realms. Reference [8] proposes that Software Case Library could provide real and attractive software cases in the practical projects of students. The grid technology is utilized to implement virtual integration of heterogeneous case libraries dispersed in different geographical regions in reference [9]. In addition, the case library is also applied in performance improvement, condition assessment, emergency management [10,11,12], and so on. Predictably, the application of the case library on energy loss will provide rich experience and cases for the decision makers of the loss-reducing programs.
Regarding the energy loss analysis, the calculation methods of energy loss and the loss-reducing measures have been studied thoroughly. However, in engineering practice, the loss-reducing programs are still developed according to personal experience and subjective judgment. In this paper, the construction of a case library is perceived as an effective way to combine theoretical research with the engineering practice. By using the analysis and comparison function of the case library, the factors that influence the energy loss in different supply regions are distinguished and the implemented loss-reducing programs could be regarded as references.
The data concerning the grid structure, the load characteristics, and the equipment configuration of distribution networks in several representative days are collected and utilized to create the analysis scenes of energy-loss cases in this paper. Then, the specific characteristic state values (CSVs) of the cases are determined and computed. By discussing the ways of analyzing and retrieving the cases, the methods of Grey Relational Analysis (GRA) and the K-Nearest Neighbor (KNN) are utilized respectively. On this basis, the construction technology of the case library is realized to reflect how the region differentiation influences the energy loss.
2. The Theory of Regional Differentiation
2.1. Concept of Regional Differentiation
The region refers to the result of the artificial division of a certain area according to natural environment or administrative policy [6]. Under the influence of environmental, historical, and political factors, it is apparent that different regions have been developed unevenly over time, which is called regional differentiation. In China, the regional differentiation can be described from following aspects [13].
- The economic difference between the east and the west;
- the environmental difference between the north and the south;
- the positioning differentiation between urban and rural regions.
2.2. Impact of Regional Differentiation on Energy Loss
In general, the regional differentiation is reflected in the economy, culture, infrastructure and environment to some extent. Further, the development of distribution networks in specific supply regions is directly or indirectly affected by all of the mentioned aspects, as shown in Figure 1.
There are many differences in load characteristics, equipment configuration, policy environments, planning standards, and grid structures in the distribution networks due to the regional differentiation. Therefore, the distribution networks should be classified for further analysis of the influence factors related to energy loss and their corresponding influence degrees.
2.3. Analysis Method Considering Regional Differentiation
In this paper, the regional differentiation of distribution networks is presented in two dimensions, namely, the types of supply regions and the voltage levels. On the one hand, the supply regions are classified according to the load density, which is thought to be directly associated with the conditions of distribution networks. On the other hand, it is conventional to divide the entire distribution networks up into various voltage classes while investigating the energy loss.
2.3.1. Types of Supply Regions
In general, a whole urban district or county is divided into several supply regions and the types of these supply regions are different. As shown in Figure 2, according to the classification standards of the supply regions applied by State Grid in China [6], the supply regions are classified into six types.
2.3.2. Types of Voltage Levels
The factors which influence the energy loss are significantly related to the voltage levels of distribution networks. As a result, the cases of different voltage levels should be created in different forms separately. The classification result is shown in Table 1 [7].
Therefore, the cases library consists of three forms of cases: the cases in the form of supply region, MV distribution line and LV transformer district. Then, different forms of cases are further divided into six types according to the load density.
3. Theoretical Foundation of Case Library Construction
3.1. Principle of Case Library
Case-based Reasoning theory is an inferential model which retrieves most similar cases for new problems in the case library, contrasts the new one with the sample case and provides a solution. So far, the theory of CBR has been widely applied to path planning, fault recovery, equipment analysis, and so on [8,9,10,11,12]. The construction of the case library can effectively reveal the similarities and dissimilarities of different cases for reference.
3.2. Building Process of the Case Library
The building process of the case library is shown in Figure 3. Firstly, the basic features of the distribution networks in all six types of supply regions are thought over during the process of constructing the case library. Then, the principles of data compilation and data processing are confirmed, respectively. The various CSVs, which are computed as the data basis of the case library, provide valuable and needed information to case analysis and case retrieval mechanisms. These critical technologies are implemented with the methods of GRA and KNN. On the basis of the case library construction technology, the frameworks of database and software are designed. Finally, the case library analysis software is developed and applied to constitute differentiated loss-reducing programs.
3.3. Critical Technologies of Case Library Construction
It is essential to combine the key problems and solutions of analyzing energy loss with the current research findings of the case library construction. Some relevant countermeasures are put forward to determine how to describe, analyze, and retrieve the cases. In this foundation, several critical technologies of case library construction are proposed in Figure 4.
As shown above, the case library construction technology of the energy loss includes five critical technologies. The meanings of these critical technologies are expounded as follows.
- Case representation technology: To study the methods for establishing different forms of energy-loss cases, including the CSVs of cases, the computing method of CSVs, the simulation scenes of cases and the organizational method of CSVs.
- Case data processing technology: To explain the engineering data which are required to be collected in advance and the process of computing these data to get the CSVs of cases.
- Case analysis technology: To provide the theoretical way to evaluate the effect degree of each CSV based on the method of GRA for further research.
- Case retrieval mechanism: To clarify the process of matching up the most similar sample cases from the case library, during which the cases in the same form are analyzed with GRA and KNN.
- Loss-reducing programs decision: To offer several suggestions with regard to the loss-reducing measures, which are prebuilt and contained in the case library, according to the results of the case retrieval mechanism.
In the premise of building up the case library, the research is carried out on the key steps and optimal solutions of these critical technologies.
4. CSVs of Cases
4.1. Definition of CSVs
CSVs are defined as a series of status values that are used for case representation, analysis and retrieval mechanism in this paper. It is obvious that these values should be simple and practicable enough to be computed with the engineering data and to describe the characteristics of cases. As the connected bridge of the mentioned two theories, the CSVs of different forms of cases are determined according to the influence factors of energy loss. They are utilized to represent the regional differentiation and create different forms of energy-loss cases.
4.2. Selection of CSVs
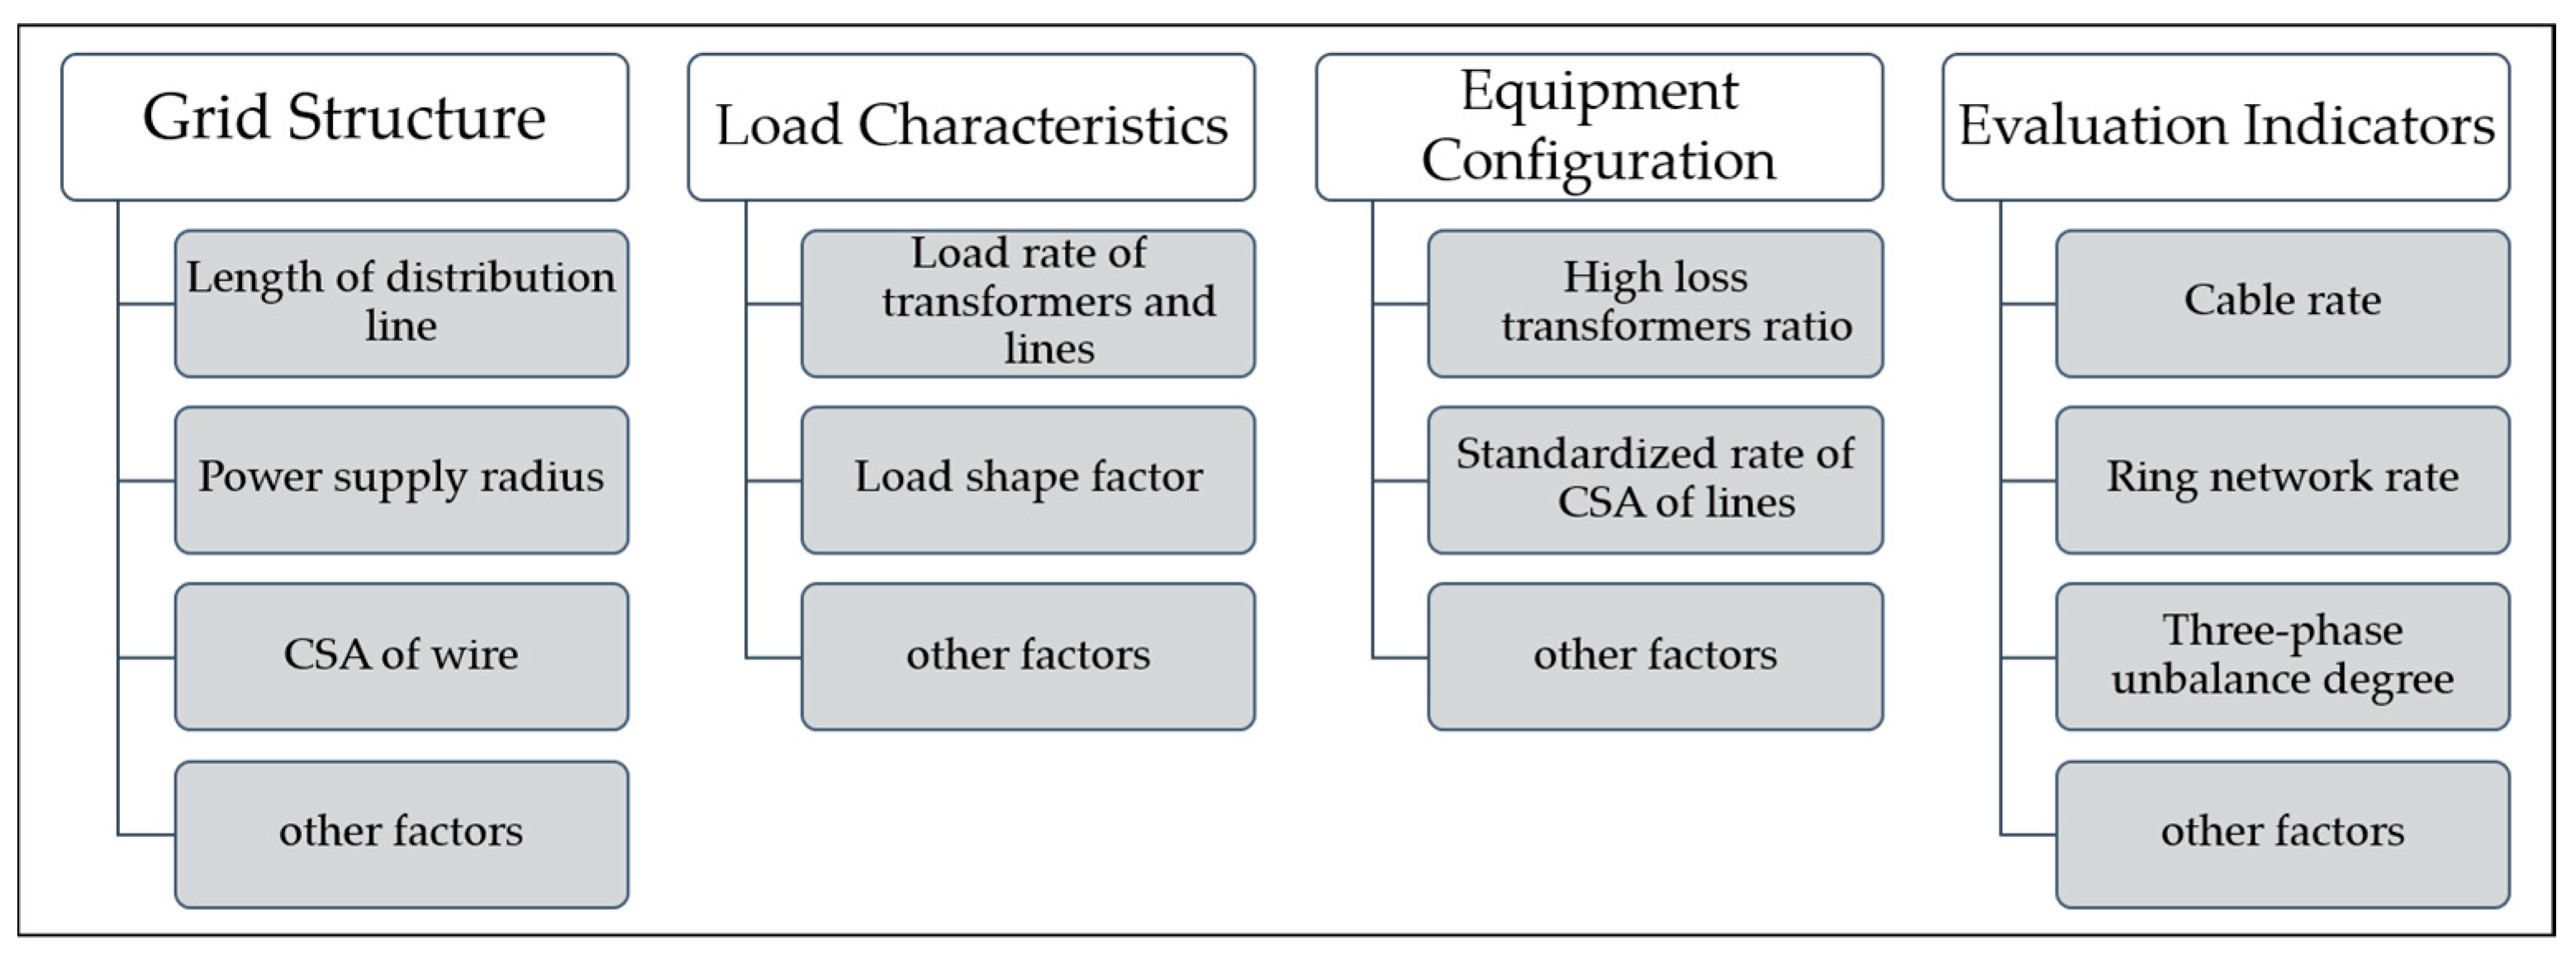
The influence factors of energy loss are mainly divided into four categories, as shown in Figure 5. In the process of analyzing energy loss, an important theme should be noticed. Whatever the type of supply region is, the influence factors have common impact on the energy loss in distribution networks, but the influence degrees are multifarious.
The CSVs are associated with, but not equal to, the factors shown in Figure 5. When selecting the values, the apparent differences of distribution networks on the individual voltage levels should be considered. However, the types of supply regions, which only impact the influence degree of effect factors directly, are unrelated to the selection of the CSVs. Therefore, the CSVs are selected according to the forms of cases, as shown in Table 2.
4.3. Case Data Collecting and Processing
In order to evaluate the similarity and dissimilarity more clearly, the requisite data, which should be collected in advance, are divided into three parts. They are used for the computation of the CSVs of cases, as shown in Table 3.
In this case library, there are several analysis scenes in a case for further research. Generally, a representative day is thought to be an independent analysis scene. After the collection of the primary data from power supply enterprises, it is necessary to complete preprocessing operations so as to acquire CSVs in several years. A database is selected to manage the requisite data, which is accessed by an application programming interface and serves as the repository for all device management information.
5. Case Analysis and Case Retrieval Mechanism
5.1. Case Analysis Based on GRA
The selection of CSVs is followed by the analysis of a typical case to construct the energy-loss case library. From a data-processing perspective, to assess the influence degree between influence factors and the major variable, some data analysis methods could be used. The method of GRA is applied to case analysis in this paper, which is a basic method of the grey system theory for systems analysis [14].
For the n analysis scenes which are generated by multiple running situations, taking a case in the form of MV distribution line as an example, the energy-loss rate is the main factor sequence A, and the CSVs mentioned in Table 2 are set as the reference factors sequences Bi. These sequences can be expressed, respectively, as
The main factors sequence A is standardized according to
where min a(k) is the minimum value and max a(k) is the maximum value of the main factors sequence A. The standard procedures of the reference factors sequences Bi are similar.
Then, the differences, symbolized by ∆i(k), between the standardized reference factor sequences Bi′ and the standardized main factor sequence A′ can be computed, respectively, from
Further, the extreme value of ∆i(k) could be acquired, symbolized by ∆max and ∆min respectively, according to
On this basis, the relational factors γi(k) can be expressed as
where ρ is the distinguishing coefficient of each characteristic state value in the method of GRA, which is predetermined to be 0.5 in this paper.
After the standard procedure and grey relational analysis, the grey relational factors, symbolized by γi, are finally solved in
Therefore, the larger the value of γi is, the more effective the corresponding CSV will be.
5.2. Case Retrieval Mechanism
As mentioned above, the case retrieval mechanism, defined as the way to match up to the most similar cases from the case library, is the nucleus of the case library construction technology. The application of KNN for the case retrieval mechanism in the case library is introduced as follows.
Firstly, the matrices of grey relational factors of these CSVs combined by the method of GRA are applied to the selected case and the sample cases. Then the similarities between the selected case and each of the sample cases are computed in turn. When the value of similarity is the minimum or less than the default, the corresponding sample case will be selected from the case library as a reference. The computing formulate of KNN is shown in
where m is the number of CSVs of cases. In addition, γi-se and γi-sa symbolize the CSVs of the selected case and a sample case respectively.
5.3. Loss-Reducing Programs Decision
Each loss-reducing measure, which is prebuilt and contained in the case library, corresponds to one CSV in Table 2 [15,16,17,18]. Taking a MV case in type B of supply region as an example, its CSVs are preprocessed with GRA. Then the method of KNN is applied to match the MV cases in the same type of supply regions. Moreover, only when the result of KNN is evaluated to be primary or secondary according to the Figure 6 can the sample case be chosen as the reference. Finally, loss-reducing measures can be suggested according to the relatively effective CSVs of the most similar case.
6. Implementation and Application of Case Library
The methods of GRA and KNN are applied, by which the critical technologies of the case library could be implemented. Based on the case library construction technology, the analysis software is developed and applied for data classification, arrangement, modification and analysis.
6.1. Implementation of Case Library
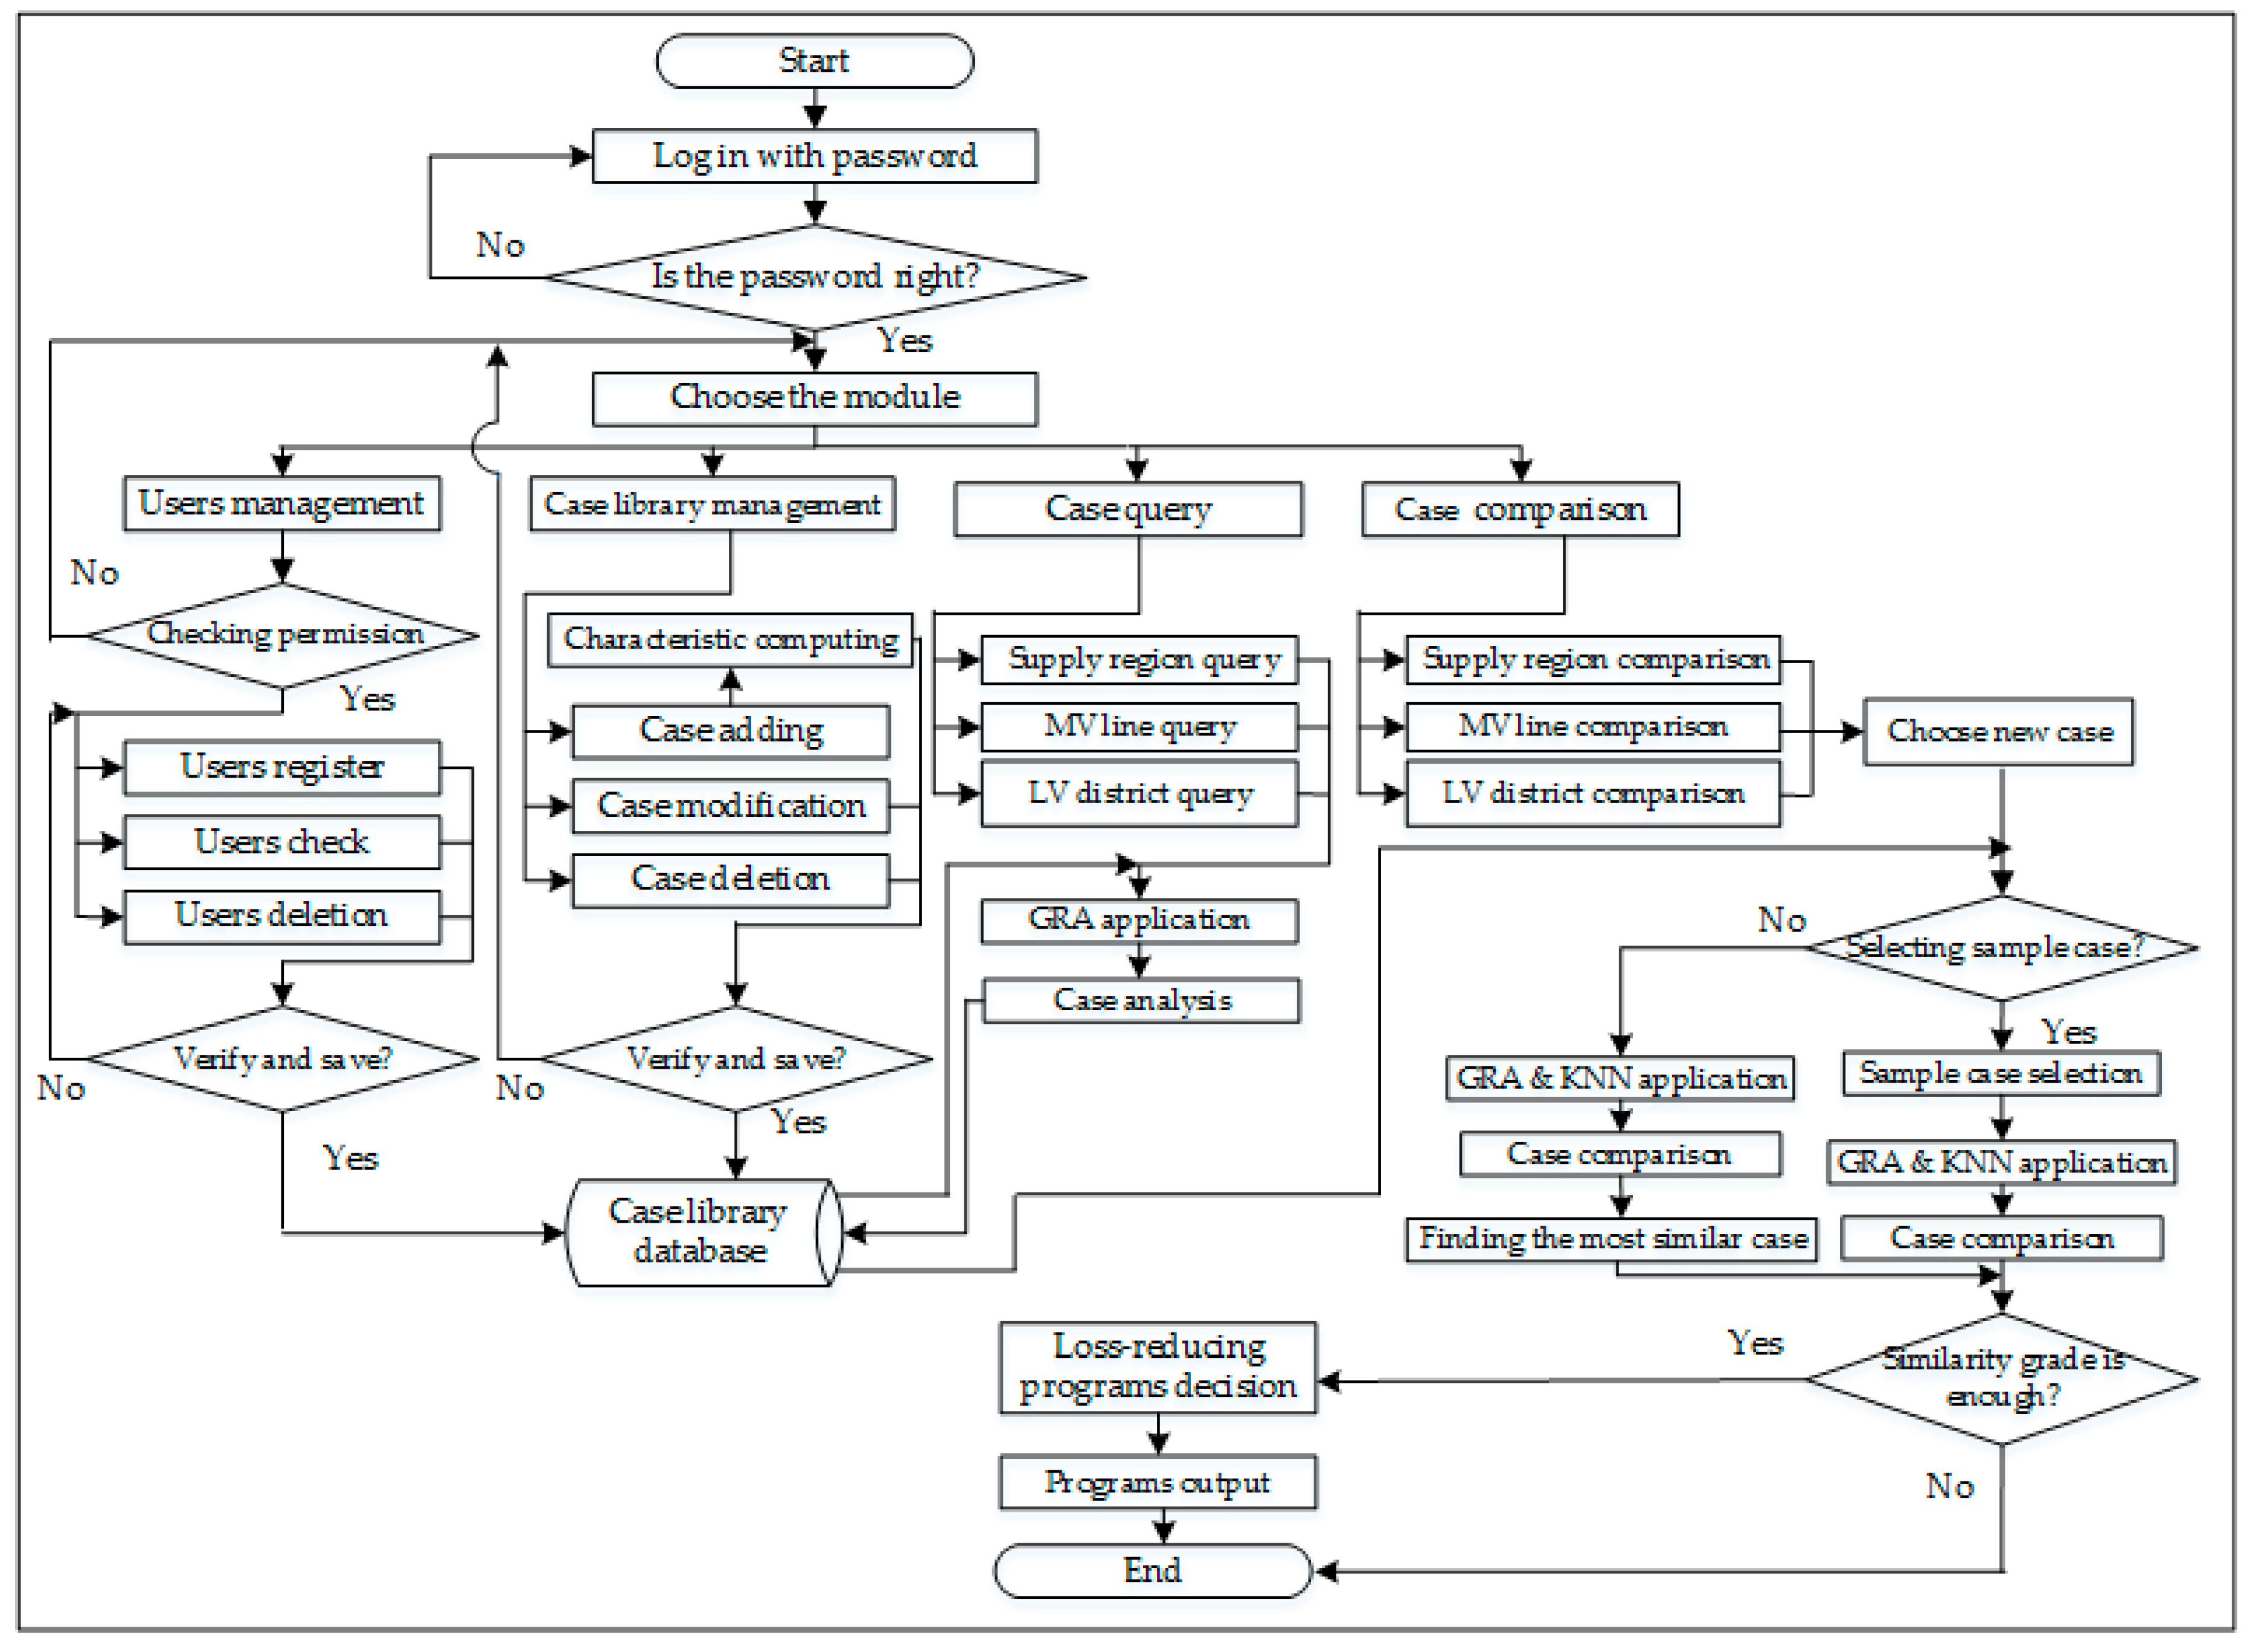
The analysis software of the case library, which is coded in C#, is developed in Microsoft Visual Studio environment. Microsoft Access is selected as the database management tool. The software mainly consists of five functional modules as follows.
- Users management module: To guarantee the security and stability of the software, including the login, logout, register and deletion of users.
- Case library management module: To achieve case information management functionality including adding, modifying, deleting and exporting information.
- Case query module: To provide three ways to query for different forms of cases.
- Case comparison module: To select the most similar sample cases from the case library, which are used as a reference for making loss-reducing decision.
- Help module: To offer some essential function description, guided aids and copyright notice.
The operational process of the software is shown in Figure 7.
6.2. Distribution of Cases in Case Library
The engineering data of distribution networks from six counties in five provinces were collected and applied to construct the case library in this paper. There were 83 cases in total. It is evident that the amount of cases has obvious influence on the accuracy of case retrieval result, but almost no influence on the progress of case analysis. In order to obtain drastically more accurate retrieval results, it is necessary to establish more energy-loss cases in different forms. Figure 8 shows the distribution of cases in the case library.
More data are required to create cases in form of supply regions, which are relatively few. Because of the complete data management platform, there are more MV cases in type A of supply regions than those in other types of supply regions. Conversely, the energy loss in LV districts accounts for a far higher proportion of the entire energy loss in the type D of supply regions with low load density. Therefore, the amount of LV cases increases with load density decreasing. In the next step, the engineering data in the supply regions of type A+ and type E should be gathered to cover all the six types of supply regions and insure the universality of the cases library.
6.3. Crucial Effect Factors of Energy Loss
For example, the case library consists of 34 cases in the form of MV distribution lines from three counties in two provinces. Based on the analysis of these cases, the significant differentiation of energy loss in different types of supply regions becomes obvious. To illustrate the whole condition of energy loss in different supply regions, the average grey relational factors of CSVs are summarized in Table 4.
Table 4 shows that the types of supply regions are associated with crucial factors affecting energy loss of the cases in the form of MV distribution lines. The 34 MV cases are analyzed with GRA in turn and the corresponding analyzing results are obtained. With the cases in a typical supply region increasing, the grey relational factors, symbolized by γi, between each CSV and the energy-loss rate of a MV case are summed and averaged. According to the computation of grey relational factors, the most effective CSV in a type of supply region is discoverable. Compared with the distribution lines in type A of supply regions, for example, the total effect of distribution transformers is greater than that of MV distribution line and supply radius in type D of supply regions. As a result, distribution transformers should be paid more attention to while making loss-reducing programs on MV distribution line in type D of supply regions. However, reducing energy loss in distribution lines is more effective in type A of supply regions, accordingly.
In conclusion, energy-loss cases prove that the effect factors are strongly correlated with types of supply regions. The regional differentiation theory combined with CBR has a significant effect on the energy loss analysis. The different kinds of sample cases included in the case library can be referenced in minute detail.
6.4. Case Study about MV Distribution Line
6.4.1. Basic Data Collecting and Processing
Taking a case in the form of MV distribution line in type A of supply region as an example, the CSVs of this case, named Longshanyi Line, are shown in Table 5.
6.4.2. Case Analysis with Case Query Module
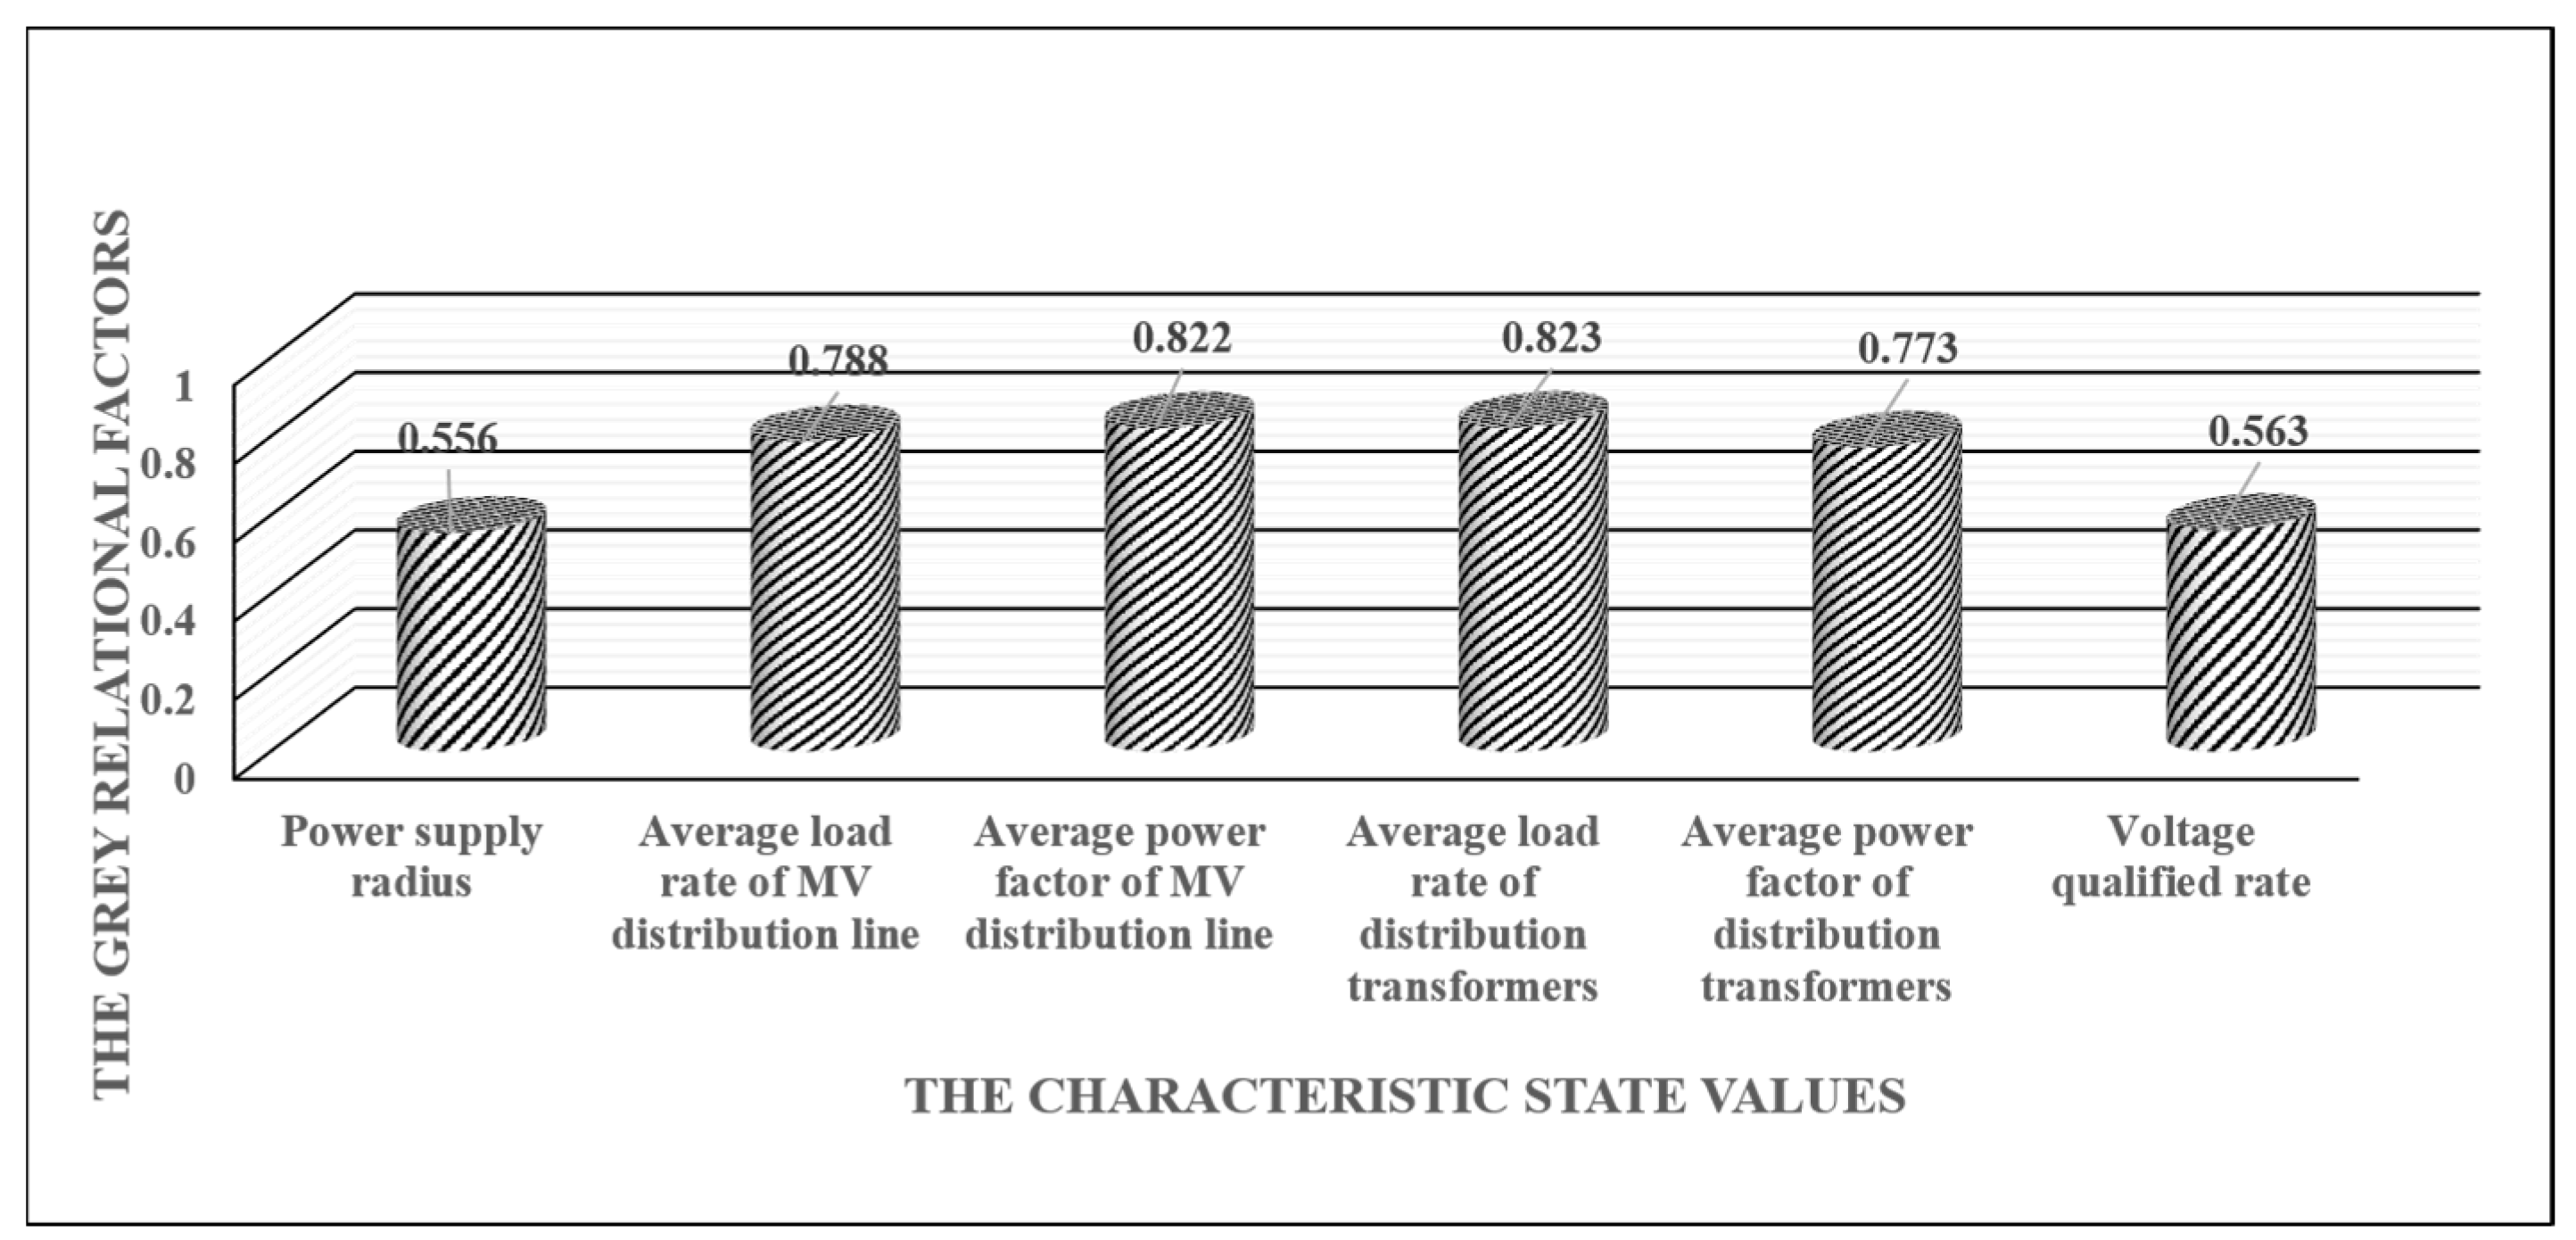
As the analysis scenes are aligned according to time sequences, Table 5 shows that with the lapse of time, the energy loss rate of the selected case increases slowly. To find the most significant factors that influence the energy loss in this MV line, the operation of the case analysis software is shown in Figure 9. And the result of case analysis is shown in Figure 10.
According to the analysis result shown in Figure 10, the CSVs have different influences on the energy loss, of which the relative significant influence factors are average load, rate of distribution transformers, and average power factor of MV distribution line. For further research, the cases comparison module of analysis software is applied to find out the most similar sample case in the case library.
6.4.3. Case Retrieval Result of the Case Library
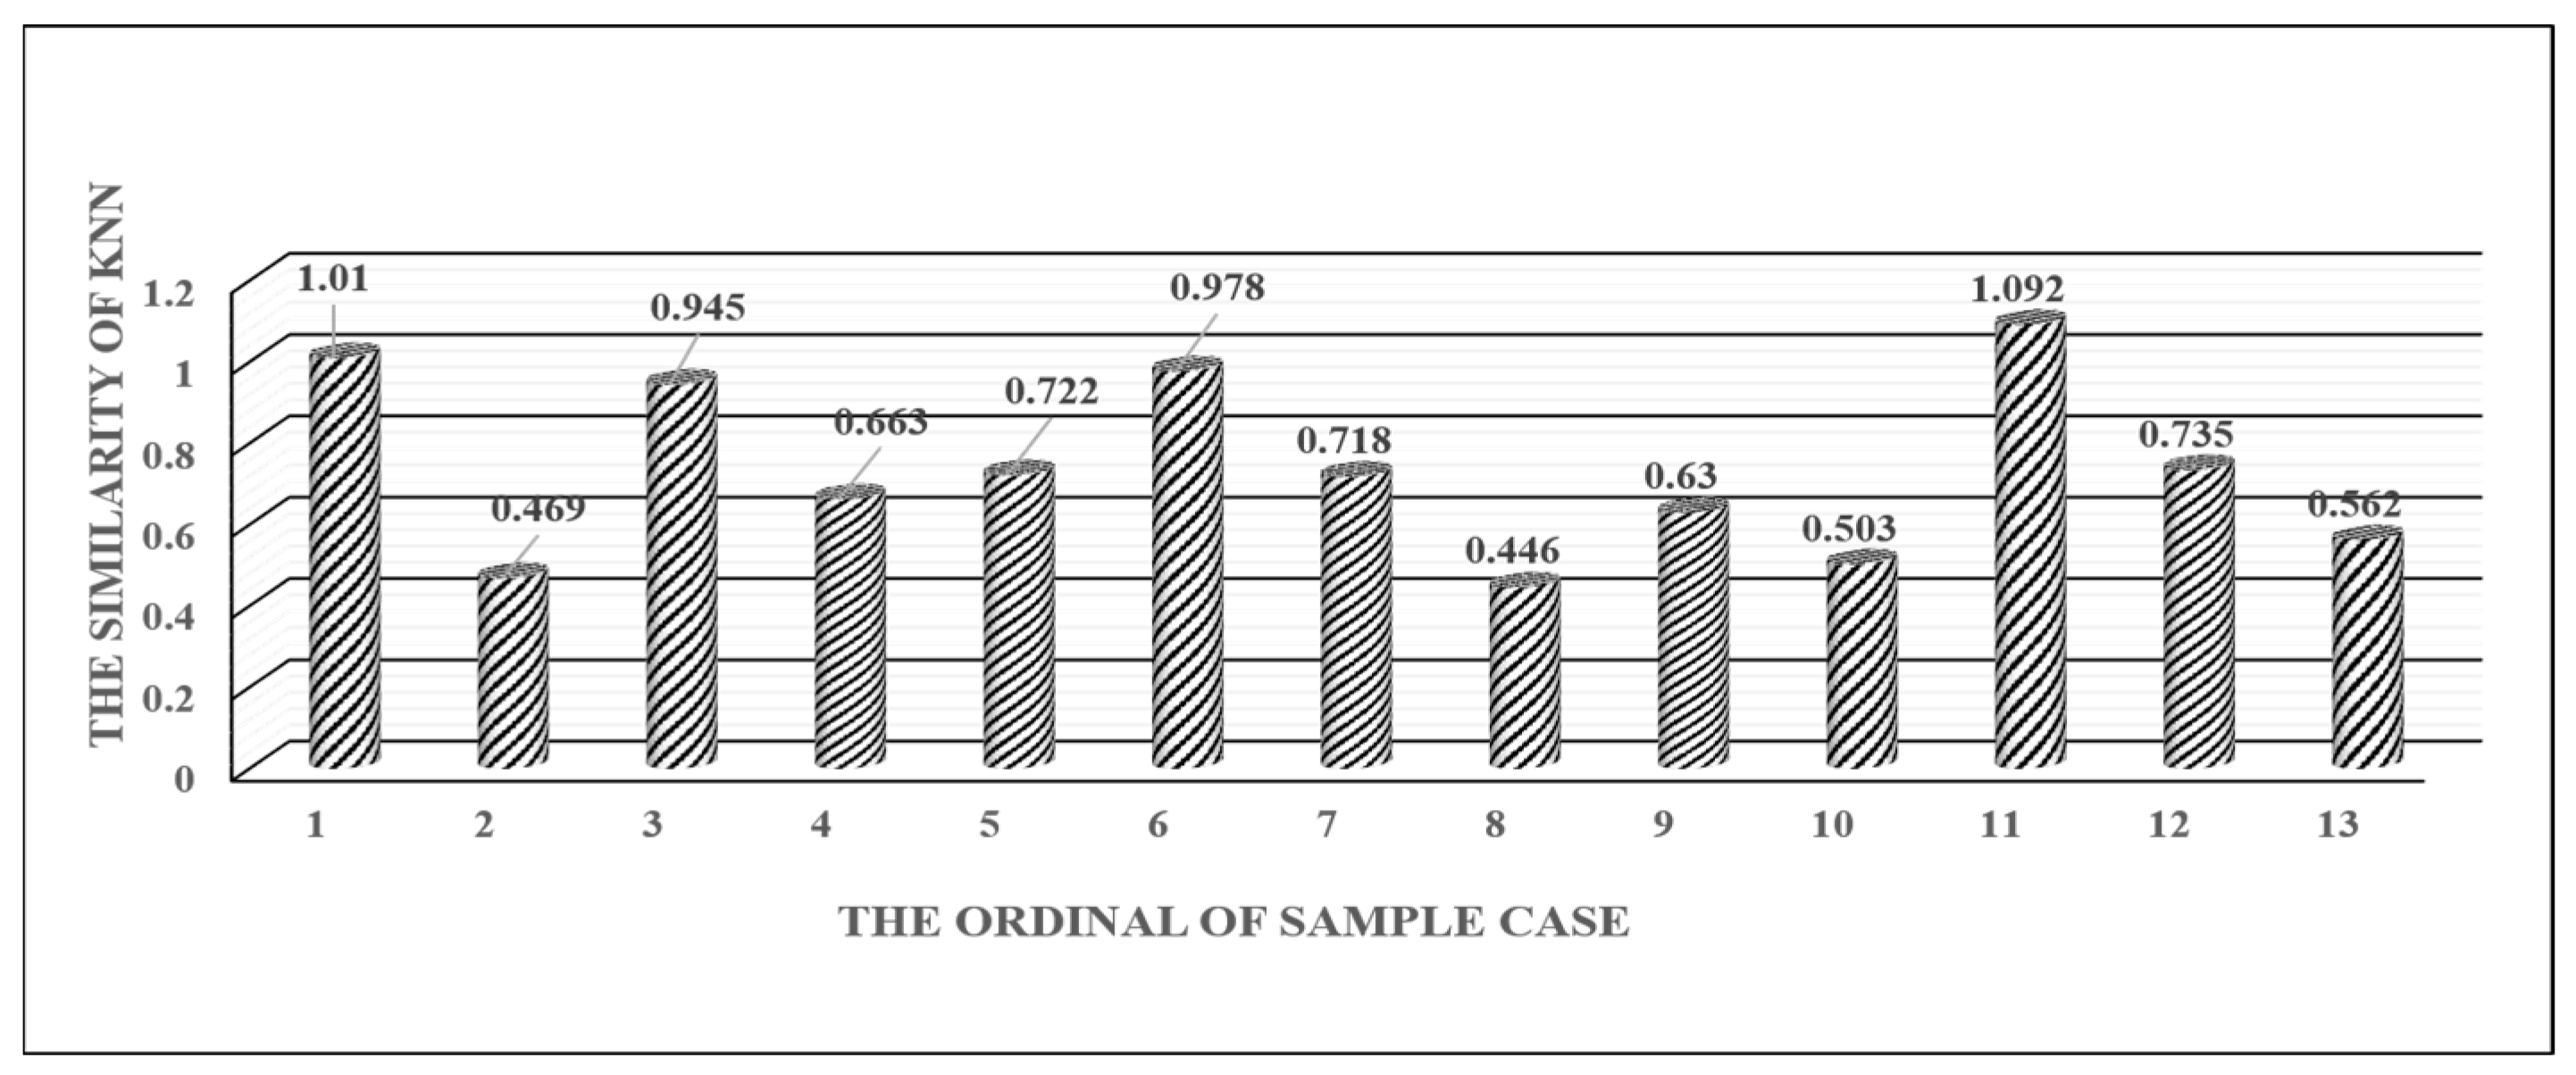
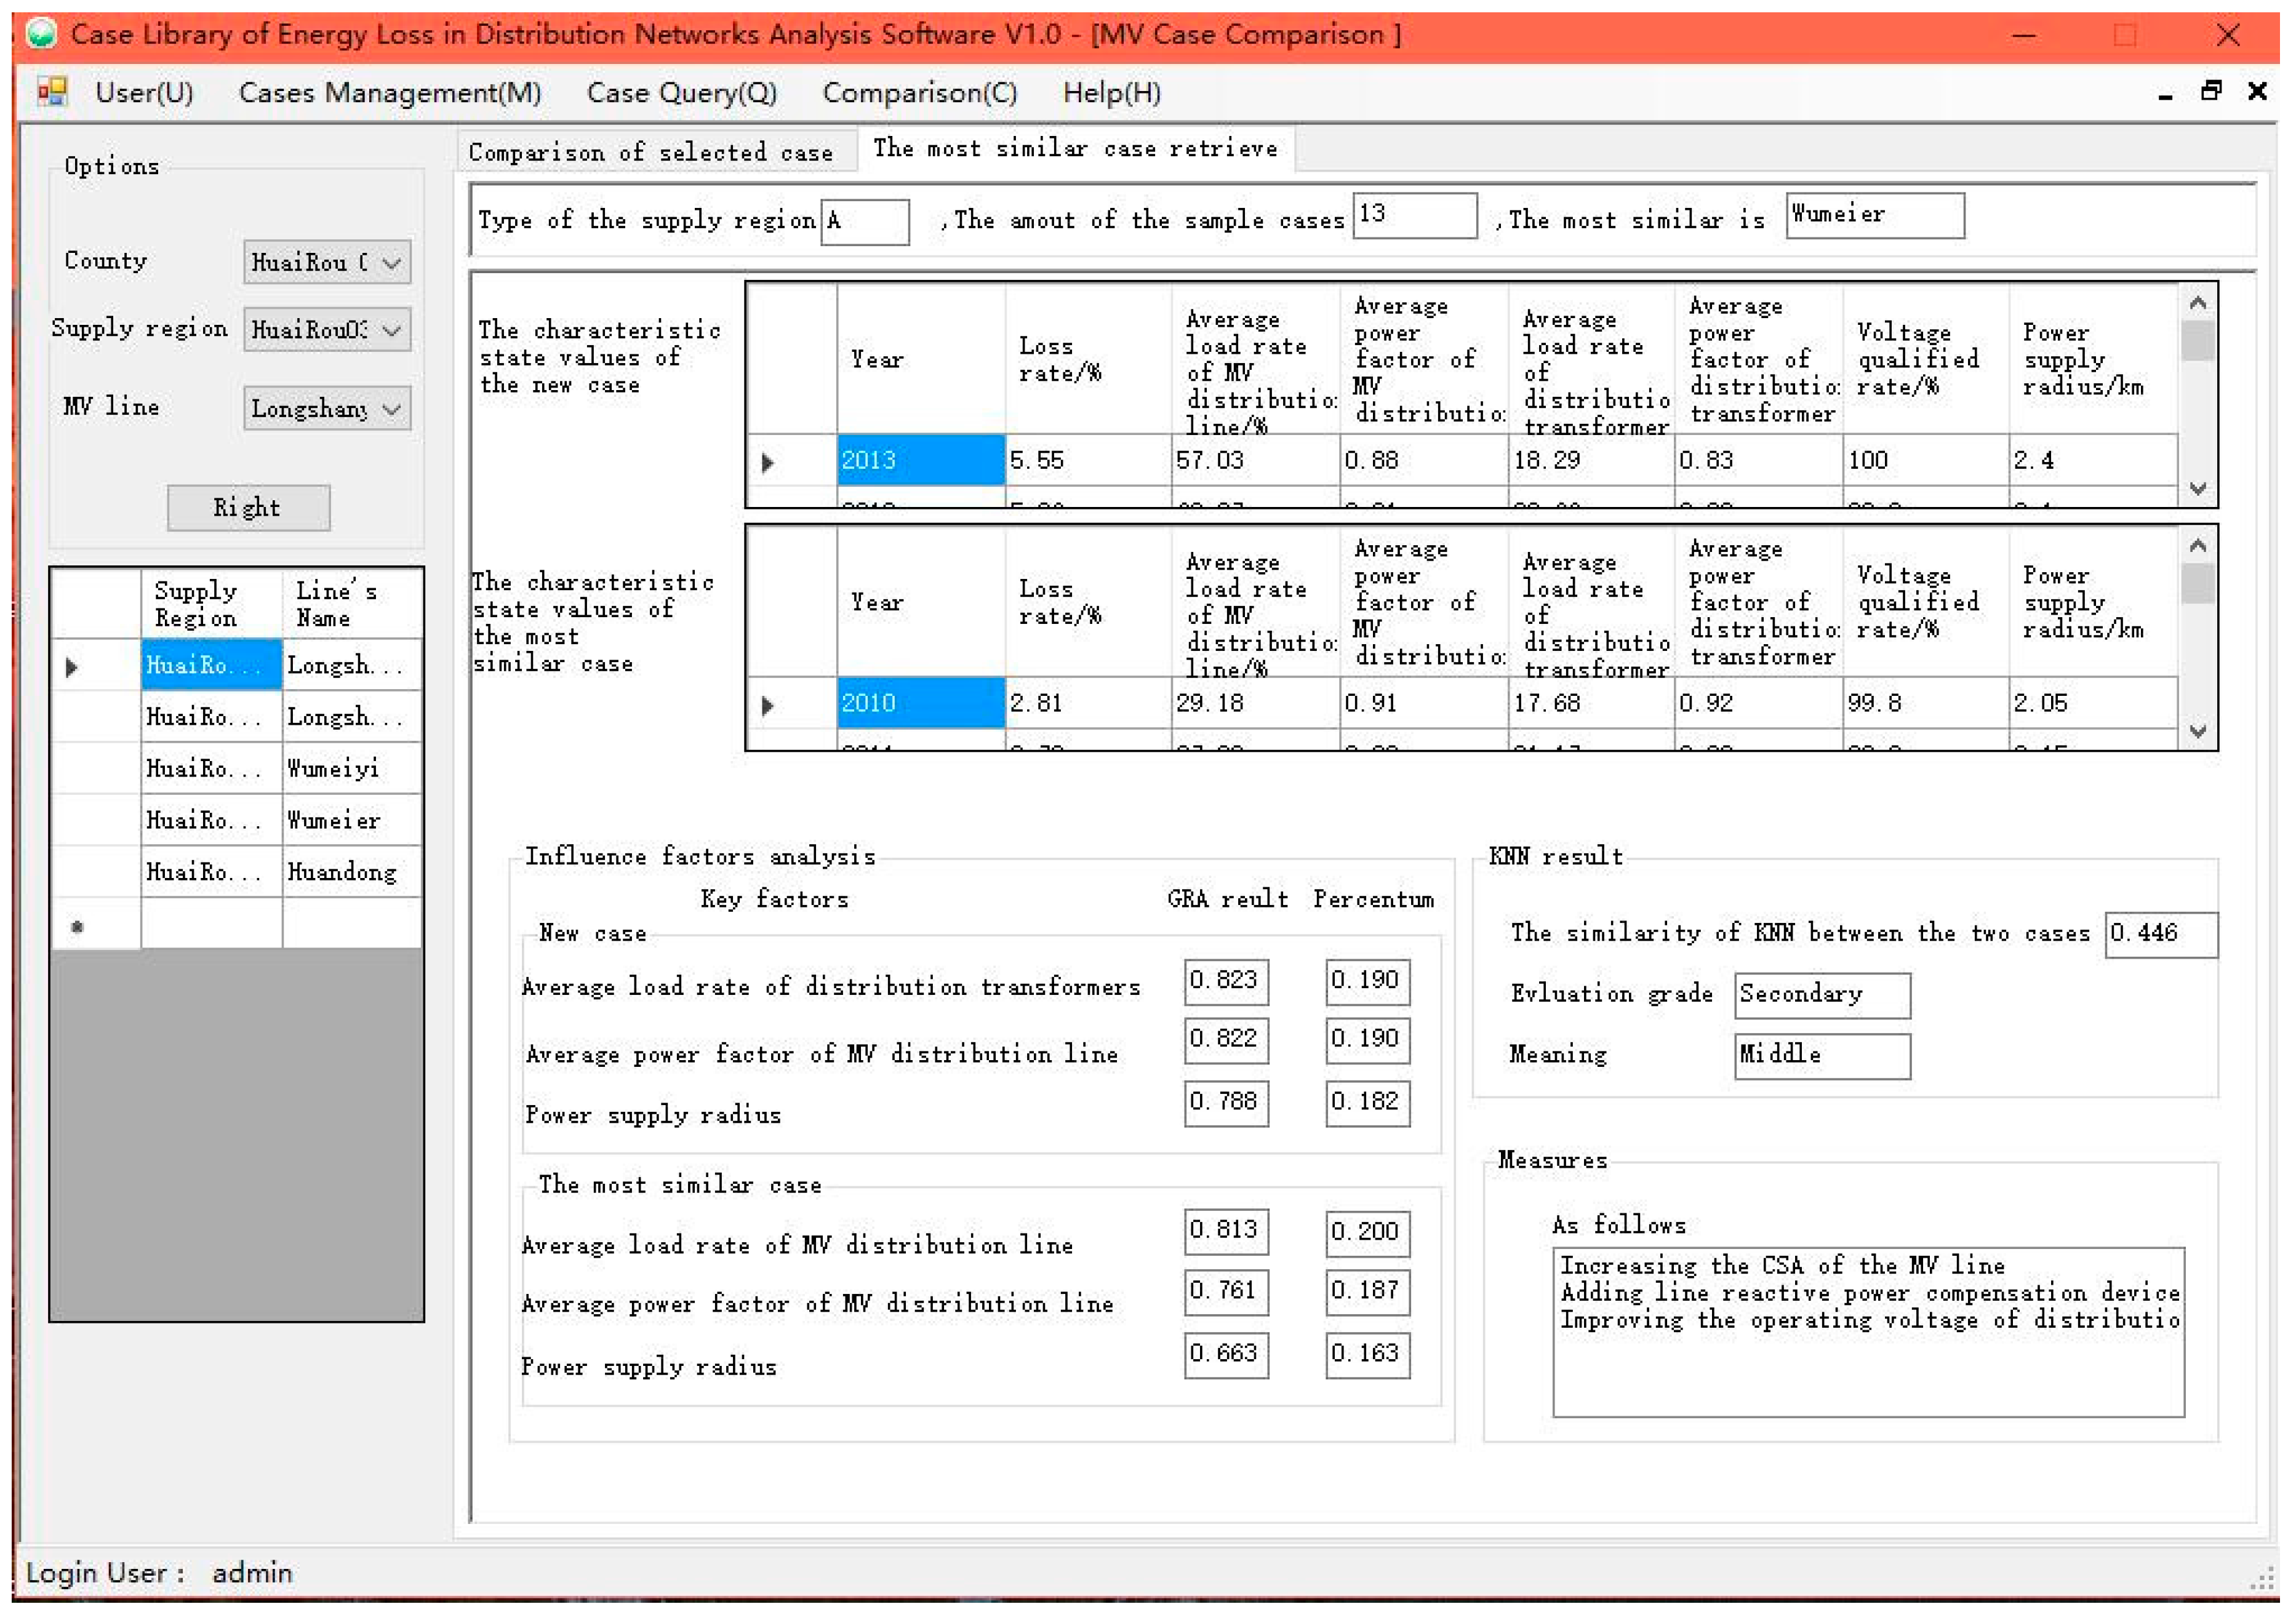
As shown in Table 6, the method of GRA is applied to all the sample cases in type A of supply regions except for the selected case named Longshanyi Line in turn. Then, these cases are compared with the selected one through the KNN realized in case comparison module of the software. Figure 11 shows the case retrieval result of the selected case.
According to the evaluation criterion in the case retrieval mechanism established above, the most similar sample case is Sample 8. Its similarity rate is only 0.446 and corresponding degree of correlation is evaluated as secondary. As a result, the loss-reducing measures, which have been implemented in Sample 8, about average power factor and load rate of MV distribution line will be used as an example for illustration.
6.4.4. Loss-Reducing Programs Decision
Through the case retrieval, the most similar sample case in case library could be selected and its implemented loss-reducing programs are a helpful reference for the operators to draw up appropriate programs and limit values of the energy loss ratio, which were generally based on personal and historical experience.
For example, the CSA of the head conductor of MV distribution line in Sample 8 was increased from 120 mm2 to 185 mm2 in 2012. This reconstruction project contributed to improving current carrying capacity. And the terminal wire was also replaced to solve the problems of voltage low in rural distribution networks. Therefore, the CSA of the wire in MV distribution line of the selected case is suggested to be increased properly. In addition, Sample 8 indicates that the application of reactive compensation devices in power supply lines in the on-pole transformer have experienced significant increases in average power factor of MV distribution line.
7. Conclusions
The analysis and comparison of energy loss in distribution networks are discussed in this paper. The main point of this paper is to explore how the regional differentiation theory in combination with CBR is applied in the case library construction technology. The conclusions of this paper are as follows:
- In this paper, the regional differentiation of distribution networks is presented in two dimensions, which are the types of supply regions and the voltage levels. Therefore, the cases library consists of three forms of cases: The cases in the form of supply region, MV distribution line and LV transformer district. Then, different forms of cases are further divided into six types according to the load density. So far, the engineering data of distribution networks from six counties in five provinces were collected and 83 cases in different forms were established in total.
- The case library construction technology of energy loss is divided into five crucial parts. The CSVs of different forms of cases are utilized to establish and represent the effect factors of energy loss. Moreover, the methods of GRA and KNN are applied to analyze and retrieve the sample cases synthetically.
- The crucial factors of energy loss in MV cases in different types of supply regions are summarized to illustrate the whole condition of energy loss in different supply regions. According to the computation in Table 4, the total effect of distribution lines is greater than that of transformers in type A of supply regions. However, with the load density of supply regions decreases, the distribution transformer plays a more important role in energy loss.
- The case library software is developed to implement the case library construction technology. Through examples, the most similar sample case is selected compared with the selected case named Longshanyi Line. The similarity rate of Sample 8 is only 0.446 and corresponding degree of correlation is evaluated as secondary. Then, it is necessary to refer to the implemented loss-reducing programs in Sample 8, including the replacement of head conductor and the terminal wire, for suggestions about loss-reducing measures in Longshanyi Line. Finally, the CSA of the wire in MV distribution line of the selected case is suggested to be increased properly and the application of reactive compensation devices is also feasible according to the the implemented loss-reducing programs in Sample 8.
Acknowledgments
This work is financially supported by the Science and Technology Project of State Grid Corporation of China (27KJ040399C1014520150000).
Author Contributions
The paper was a collaborative effort among the authors. Ze Yuan conceived and implemented the case library construction technology; Jianhua Yang contributed to the application of GRA and KNN; Jing Peng, Weizhou Wang and Fuchao Liu provided the engineering data for the case library; Ze Yuan and Jianhua Yang wrote the paper.
Conflicts of Interest
The authors declare no conflict of interest.
Nomenclature
| GRA | Grey Relational Analysis |
| KNN | K-Nearest Neighbor |
| CBR | Case-based Reasoning |
| HV | High Voltage |
| MV | Medium Voltage |
| LV | Low Voltage |
| CSA | Cross-sectional Area |
| CSV | Characteristic State Value |
References
- Madrigal, M.; Rico, J.J.; Uzcategui, L. Distribution system losses calculated by percent loading. IEEE Trans. Power Syst. 1988, 3, 1263–1269. [Google Scholar]
- Leonardo, M.O.; Maricio, A.R.; Celso, C.; Christiano, L. Energy Losses Estimation in Power Distribution Systems. IEEE Trans. Power Syst. 2012, 27, 1879–1887. [Google Scholar]
- Kinnunen, M.; Lakervi, E.; Karkkainen, S. Estimation and Role of Distribution System Losses in Open Markets. In Proceedings of the International Conference on Power System Technology, Kunming, China, 13–17 October 2002; Yunnan Science & Technology Press: Kunming, China, 2002. [Google Scholar]
- Wang, B.Y. Research on Loss Analysis and Reducing Technology Choosing Method in Urban MV/LV Distribution Network. Master’s Thesis, Chongqing University, Chongqing, China, 2014. [Google Scholar]
- Qiu, Z.J.; Xiang, T.X.; Chen, H.K.; Yin, J. Evaluation of Distribution Network Loss Reduction Potential Based on Improved Gray Relation. China Rural Water Hydropower 2013, 4, 106–109. [Google Scholar]
- Niu, Y.S. Power Network Loss Reduction and Energy Saving Technological Applications and Cases Analysis, 1st ed.; China Electric Power Press: Beijing, China, 2014; pp. 190–215. ISBN 978-7-5123-3569-1. [Google Scholar]
- Yang, J.H. Steady-State Analysis and Economic Operation of Power System, 1st ed.; China Electric Power Press: Beijing, China, 2013; pp. 11–13. ISBN 978-7-5123-4325-2. [Google Scholar]
- Yu, C.Y.; Ma, J.; Zhao, Y.Y. Design and Implementation of Software Case Library Supporting Software Capability Training. In Proceedings of the 2016 International Conference on Educational Innovation through Technology, Tainan, Taiwan, 22–24 September 2016. [Google Scholar]
- Zhu, H.; Wang, D.M.; Zhou, W.G.; Liu, X.; Hu, P. Research on the Application of the Case Library Based on Grid Using Particle Swarm Optimization. In Proceedings of the 2006 IEEE International Conference on Networking, Sensing and Control, Ft. Lauderdale, FL, USA, 23–25 April 2006; IEEE: Piscataway, NJ, USA, 2006. [Google Scholar]
- Sun, J.M.; Wang, C.L.; Zhang, C.G.; Wang, C.G.; Lei, S.M. The design of emergency management plan library for urban fuel gas system using case-based reasoning method. In Proceedings of the 2016 Chinese Control and Decision Conference, Yinchuan, China, 28–30 May 2016. [Google Scholar]
- Han, Z.X. Research on Construction of Case Base for Grid Repair Emergency Respond Facing Emergency. Master’s Thesis, Harbin Institute of Technology, Harbin, China, 2012. [Google Scholar]
- Olili, S. A case-base sampling method for estimating recurrent event intensities. Lifetime Data Anal. 2016, 22, 589–605. [Google Scholar]
- Wang, G.G.; Wang, M.L.; Wang, J.M.; Yang, C. Spatio-Temporal Characteristics of Rural Economic Development in Eastern Coastal China. Sustainability 2015, 7, 1542–1557. [Google Scholar] [CrossRef]
- Niu, D.X.; Dai, S.Y. A Short-Term Load Forecasting Model with a Modified Particle Swarm Optimization Algorithm and Least Squares Support Vector Machine Based on the Denoising Method of Empirical Mode Decomposition and Grey Relational Analysis. Energies 2017, 10, 408. [Google Scholar] [CrossRef]
- Gu, J.W.; Wang, C. Study on the development and construction of tourism management case library. Environ. Pollut. Control 2011, 31, 86–89. [Google Scholar]
- Juelsgaard, M.; Andersen, P.; Wisniewski, R. Distribution Loss Reduction by Household Consumption Coordination in Smart Grids. IEEE Trans. Smart Grid 2014, 5, 2133–2144. [Google Scholar] [CrossRef]
- Nutt, D. Reducing energy losses when transformers are lightly loaded. IET Electr. Power Appl. 2007, 1, 847–850. [Google Scholar] [CrossRef]
- Zhou, L.; Ding, X.Q.; Zhang, Z.F. The Research and Implement of Integrated Solution for Loss Reducing and Energy Saving in Power Network. In Proceedings of the 2009 International Conference on Industrial and Information Systems, Peradeniya, Sri Lanka, 28–31 December 2009; IEEE: Piscataway, NJ, USA, 2009. [Google Scholar]
Figure 1.
How the regional differentiation influences the distribution networks.
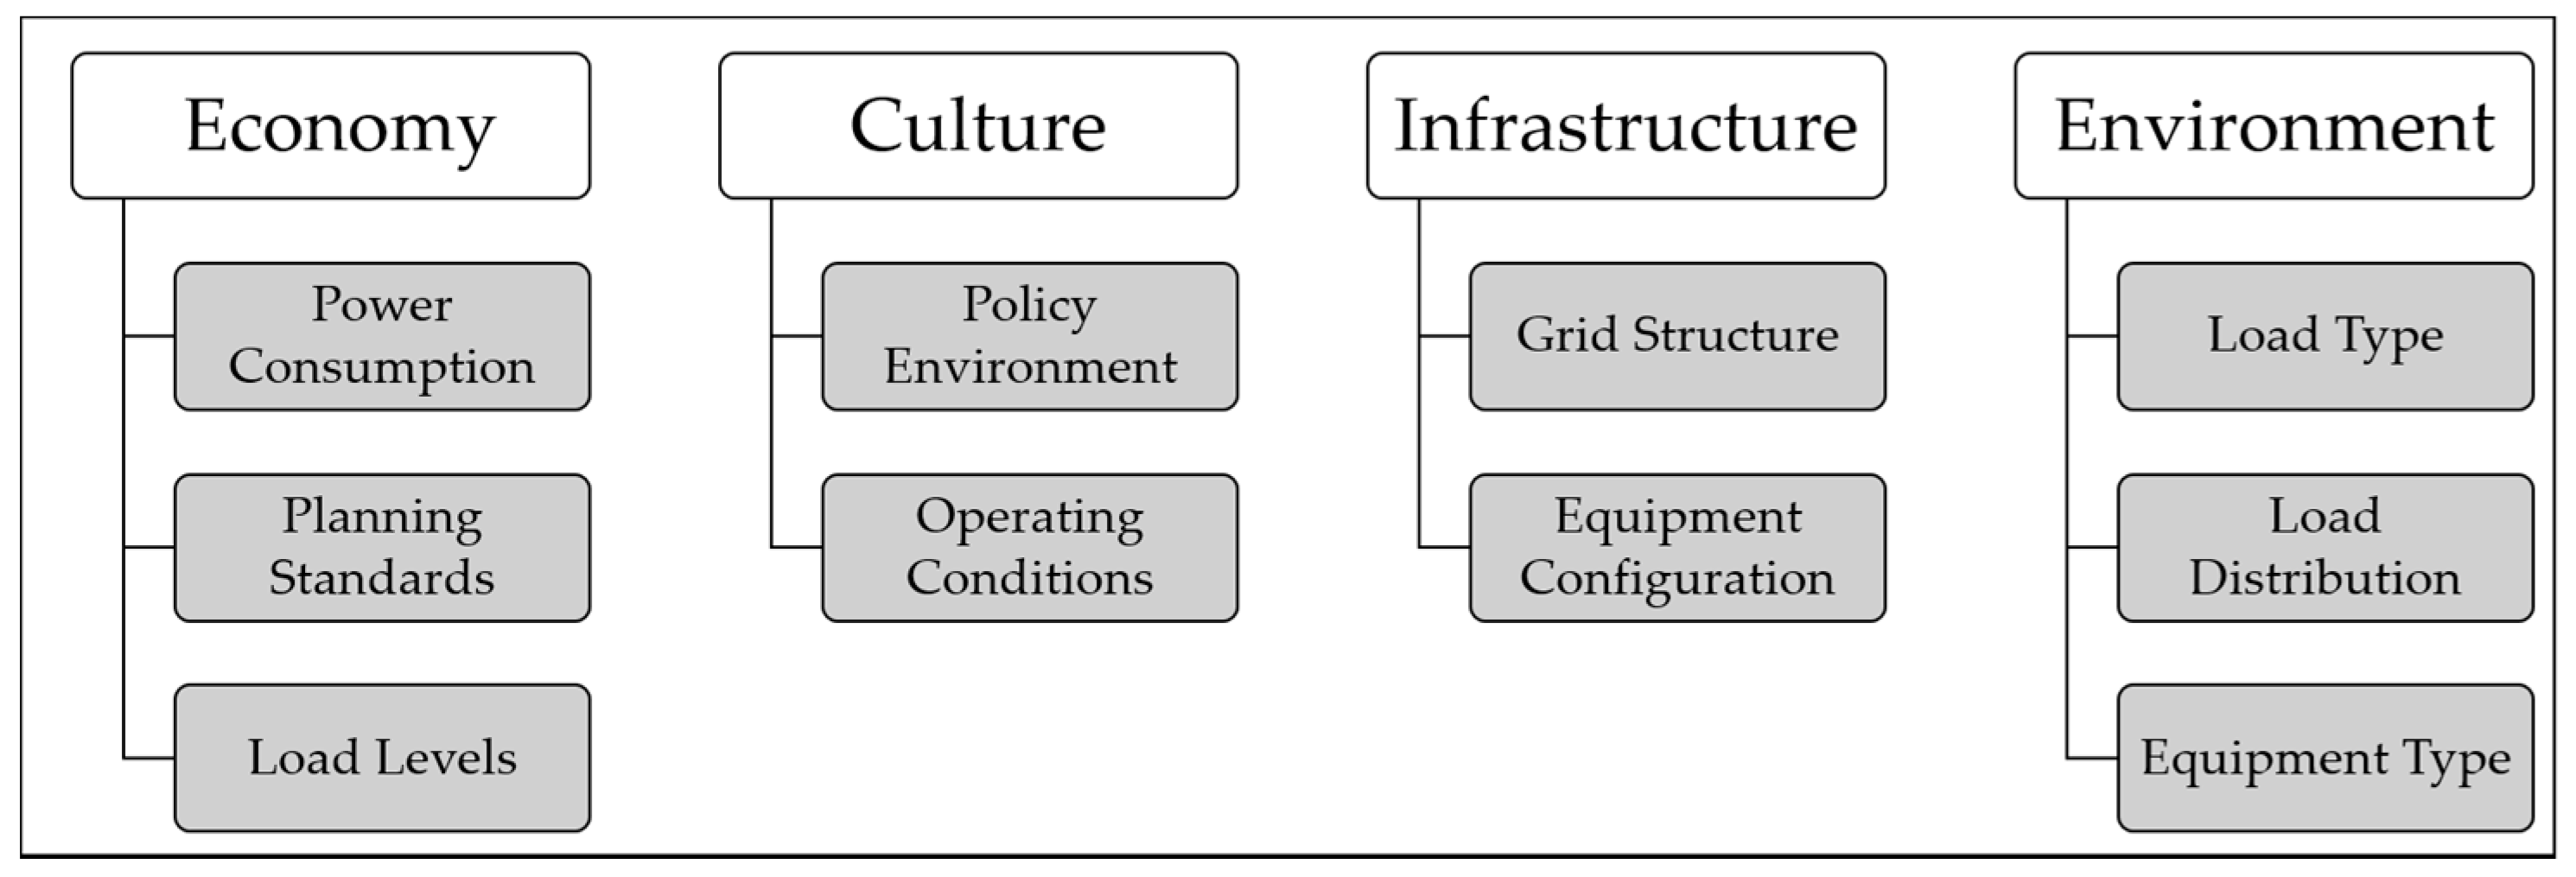
Figure 2.
The types of supply regions based on the load density.
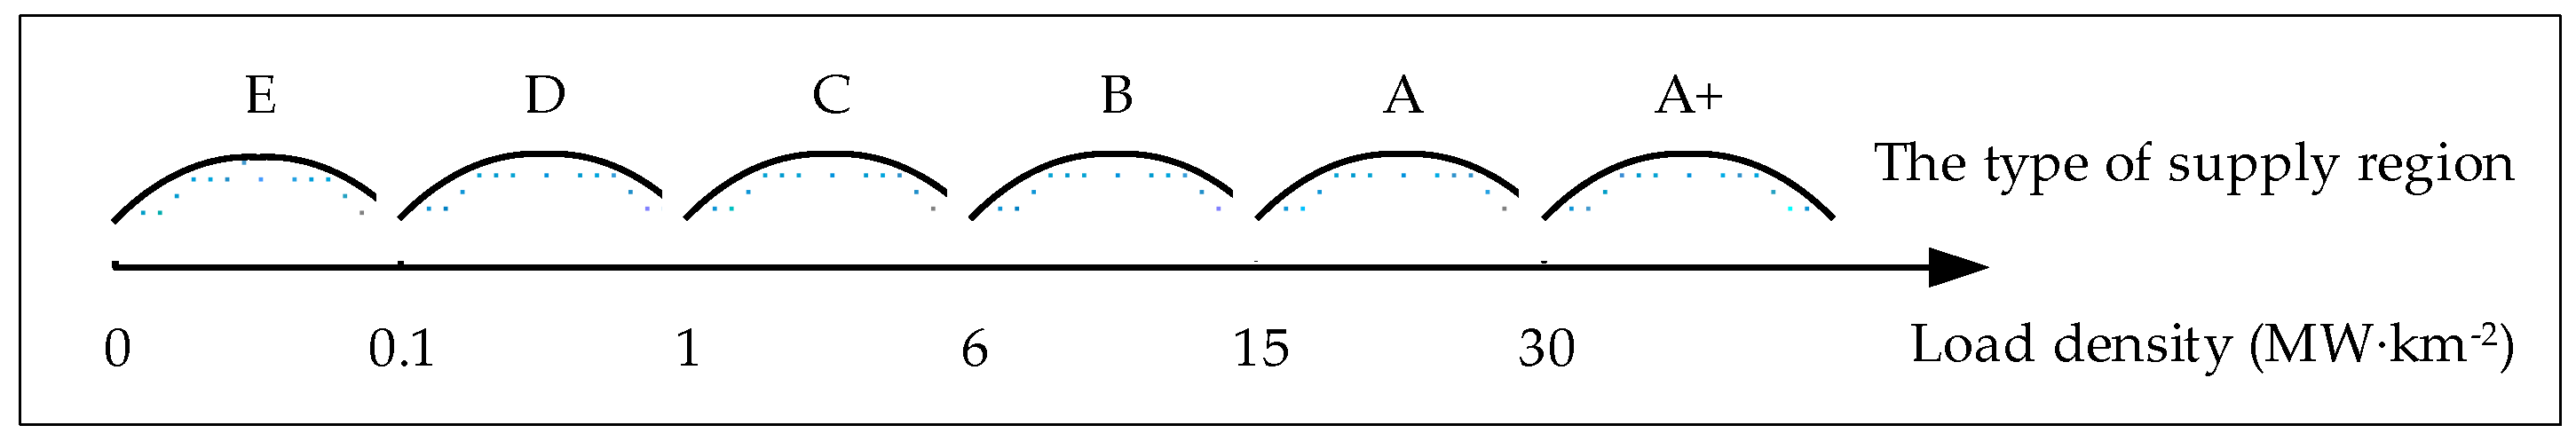
Figure 3.
The building process of case library.

Figure 4.
Several critical technologies of the case library construction.
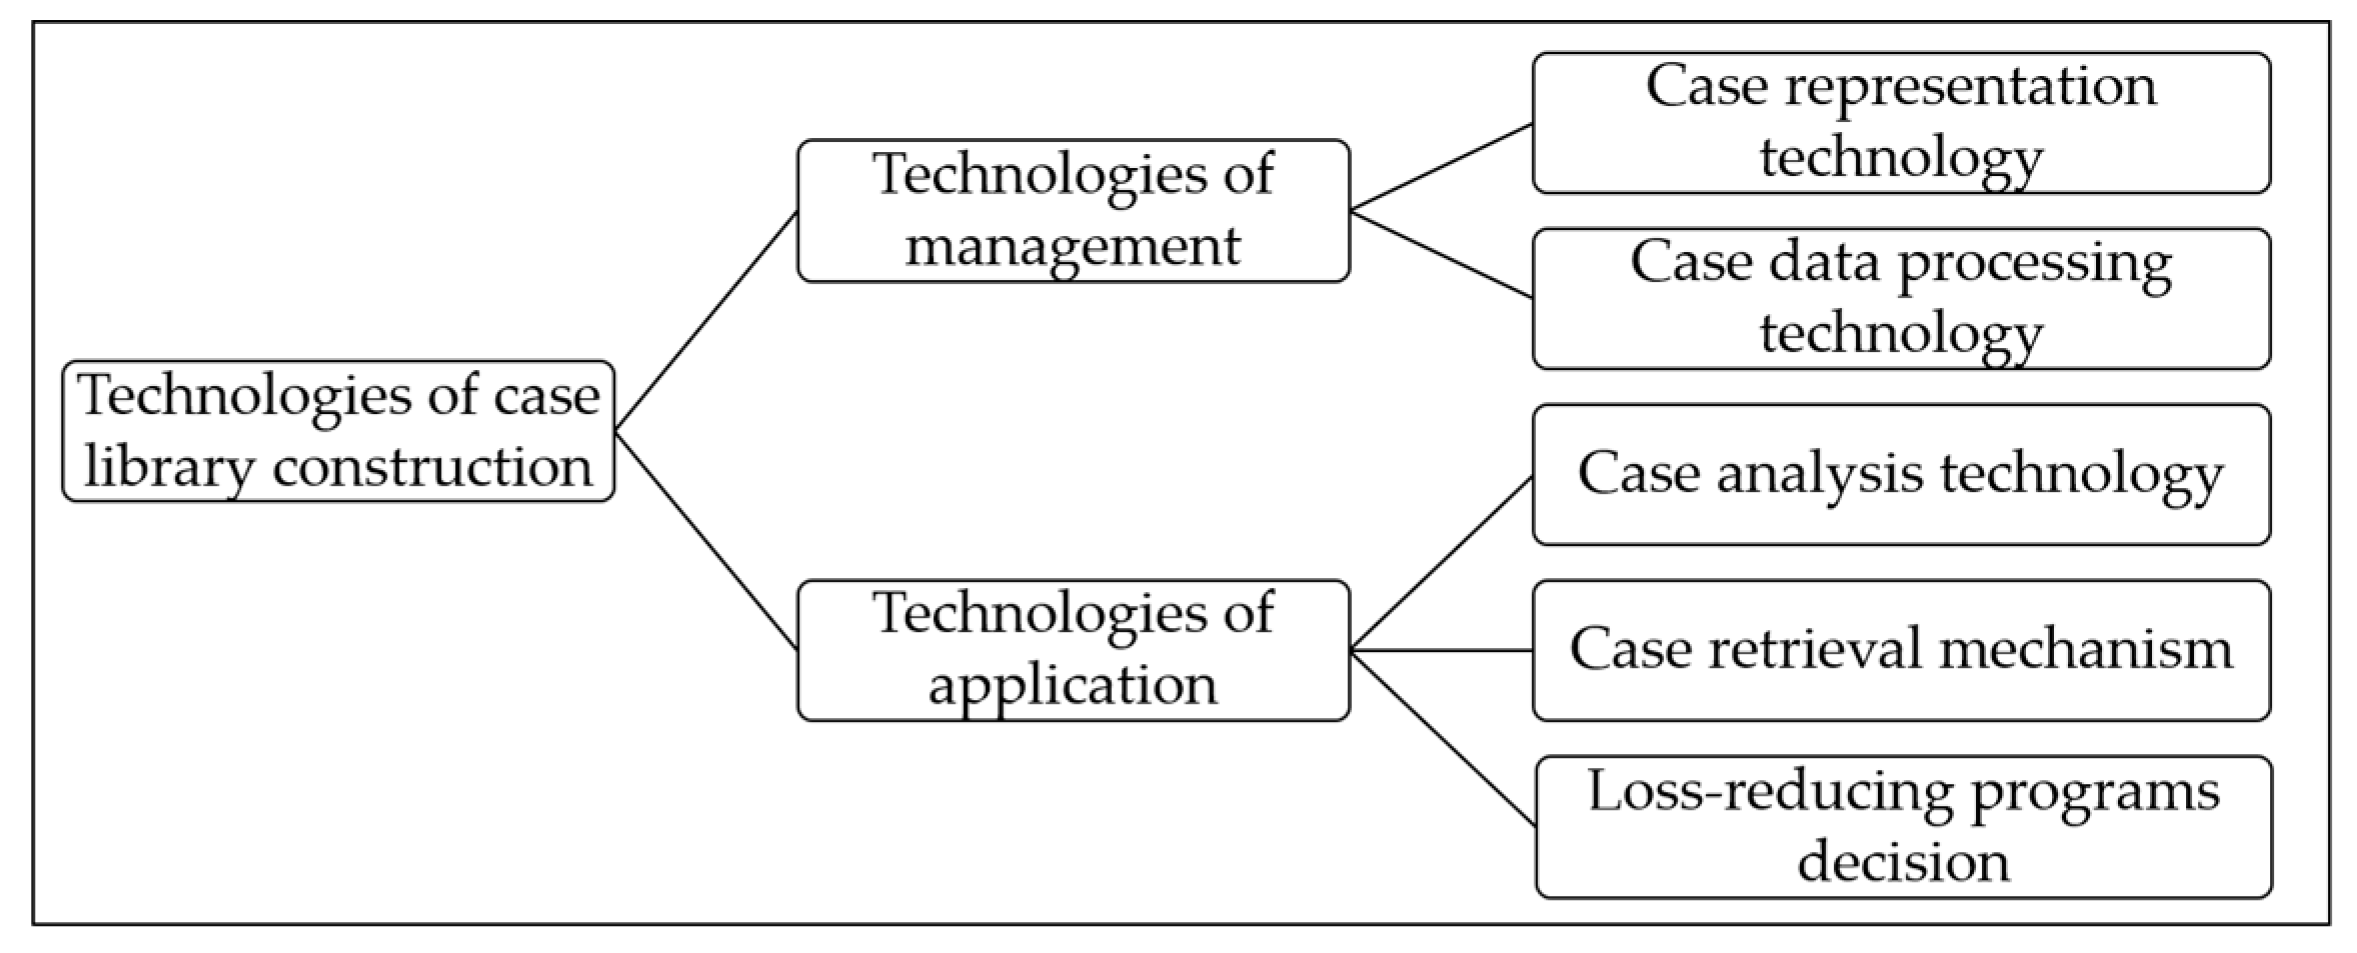
Figure 5.
The influence factors of energy loss in distribution networks.

Figure 6.
The evaluation grade of the similarity calculated by K-Nearest Neighbor (KNN).
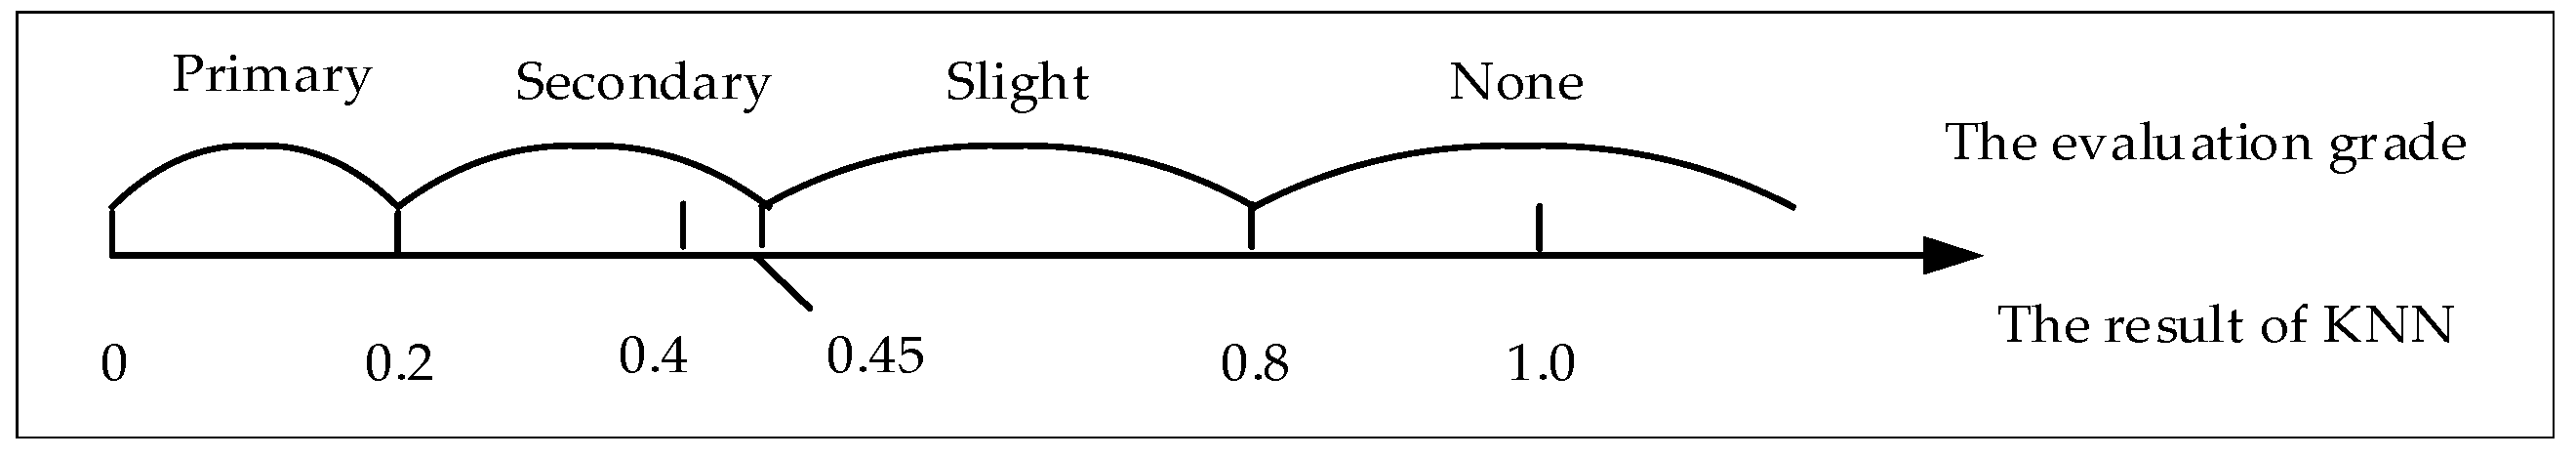
Figure 7.
The operational process of the analysis software.

Figure 8.
The operational process of the analysis software.
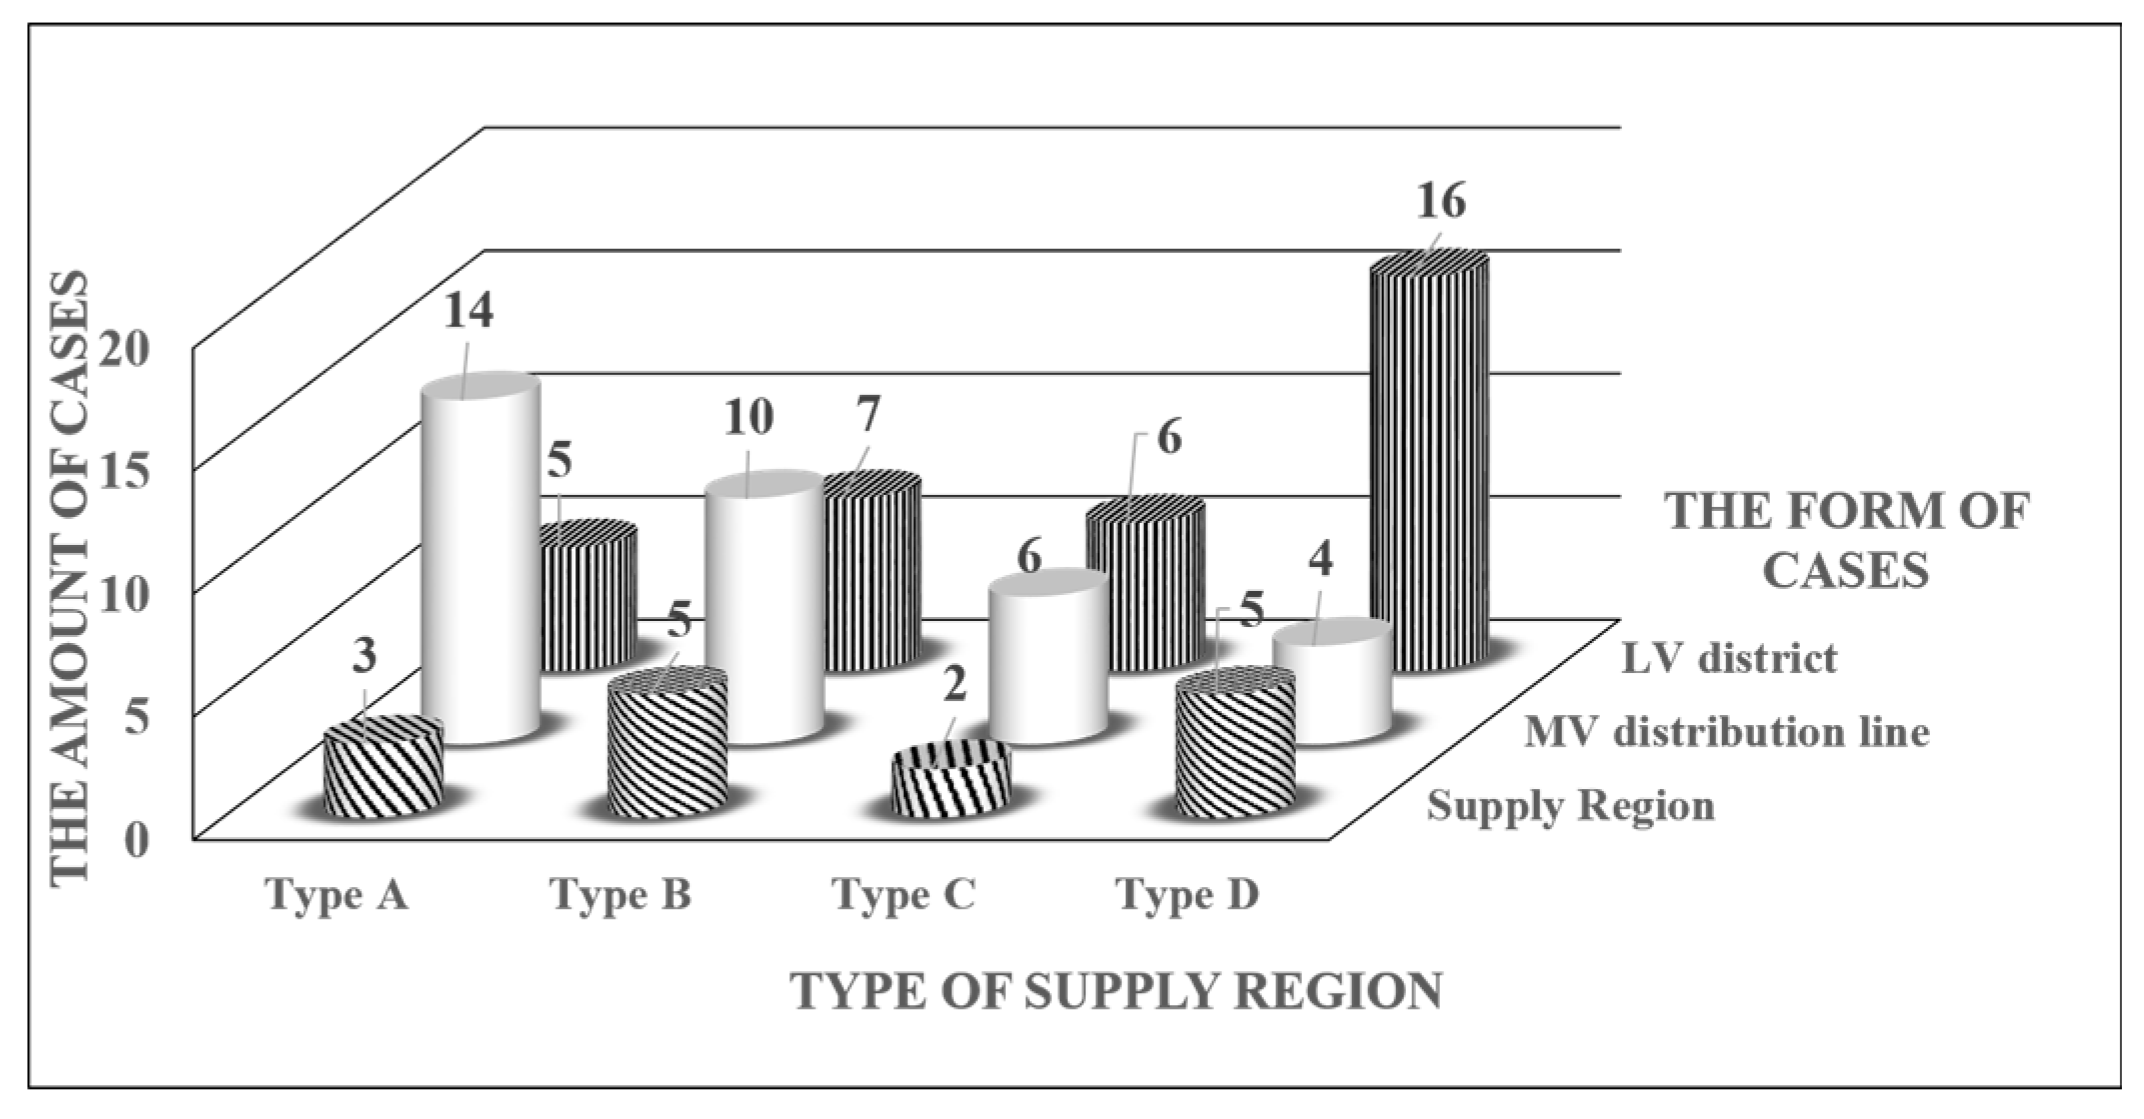
Figure 9.
The process of retrieving the most similar case with the analysis software of case library.
Figure 9.
The process of retrieving the most similar case with the analysis software of case library.

Figure 10.
The case analysis result of the selected case called Longshanyi Line.

Figure 11.
The case analysis result of the selected case called Longshanyi Line.

Table 1.
The types of voltage levels.
| Voltage Level | Magnitude of Voltage Included | The Corresponding Form of Case |
|---|---|---|
| High Voltage (HV) | 35~110 kV | Supply region |
| Medium Voltage (MV) | 6~10 kV | MV distribution line |
| Low Voltage (LV) | 0.38 kV | LV transformer district |
Table 2.
The characteristic state values (CSVs) of the different forms of the cases.
| The Form of Cases | The CSVs for Case Representation |
|---|---|
| Supply region | Average distribution line length; cable rate; ring network rate; Average load rate of distribution transformers; average load rate of distribution lines; standardized rate of the cross-sectional area (CSA) of lines. |
| MV distribution line | Power supply radius(α) 1; average load rate of MV distribution line(δ); average power factor of MV distribution line (ε); average load rate of distribution transformers(ζ); average power factor of distribution transformers(η); voltage qualified rate(θ). |
| LV transformer district | Power supply radius 2; CSA of LV wires; power factor of LV distribution lines; average load rate of LV distribution lines; load shape factor; three-phase unbalance degree. |
1 The Greek letters in the parentheses are used as the symbols for the CSVs in this paper; 2 The power supply radius of MV distribution line is defined as the furthest distance from substation to load point of this distribution line and its unit is kilometer. However, for the LV transformer district, the power supply radius is defined as the furthest distance from the distribution transformer to load point of the transformer district and its unit is the meter.
Table 3.
The requisite data to compute the CSVs of the cases.
| The Type of Data | The Sources of Data | The Data Specification |
|---|---|---|
| Basic data of supply region | The offering report forms and program schedules | a. The type and number of supply region; b. loss-reducing programs implemented in a county; c. the historic data of energy loss. |
| Constructional data of distribution networks | The electric diagrams and spreadsheet | a. The specific data of electric equipment, including overhead line, power cables, distribution transformers and so on; b. the electric diagrams of distribution networks in various voltage classes. |
| Operating data of distribution networks | The historic monitoring data of smart meters in representative days | a. The load curves in representative days; b. the parameters which is related to the energy loss include voltage curve, current curve, power factor, apparent power and power consumption, etc. |
Table 4.
Analysis of the cases in the form of Medium Voltage (MV) distribution lines.
| The Types of Supply Regions | The Average Grey Relational Factors of CSVs | |||||
|---|---|---|---|---|---|---|
| α | δ | ε | ζ | η | θ | |
| Type A | 0.664 | 0.649 | 0.720 | 0.717 | 0.702 | 0.657 |
| Type B | 0.763 | 0.749 | 0.725 | 0.813 | 0.730 | 0.740 |
| Type C | 0.717 | 0.764 | 0.755 | 0.722 | 0.764 | 0.644 |
| Type D | 0.744 | 0.701 | 0.742 | 0.789 | 0.758 | 0.688 |
Table 5.
The known information about Longshanyi Line.
| The Ordinal of Analysis Scenes | Energy Loss Rate (%) | The CSVs in Analysis Scenes | |||||
|---|---|---|---|---|---|---|---|
| α (km) | δ (%) | ε | ζ (%) | η | θ (%) | ||
| 1 | 5.26 | 2.1 | 68.97 | 0.91 | 20.66 | 0.92 | 99.8 |
| 2 | 5.17 | 2.15 | 69.23 | 0.91 | 21.65 | 0.88 | 99.9 |
| 3 | 5.41 | 2.25 | 58.89 | 0.94 | 17.81 | 0.94 | 100 |
| 4 | 5.55 | 2.4 | 57.03 | 0.88 | 18.29 | 0.83 | 100 |
Table 6.
GRA analysis of the sample cases in the form of MV distribution lines.
| The Ordinal of the Sample Cases | The Symbols for the CSVs | |||||
|---|---|---|---|---|---|---|
| α | δ | ε | ζ | η | θ | |
| 1 | 0.778 | 0.587 | 0.736 | 0.567 | 0.743 | 0.778 |
| 2 | 0.599 | 0.742 | 0.649 | 0.683 | 0.712 | 0.567 |
| 3 | 0.743 | 0.626 | 0.585 | 0.850 | 0.589 | 0.709 |
| 4 | 0.723 | 0.680 | 0.714 | 0.663 | 0.711 | 0.506 |
| 5 | 0.639 | 0.542 | 0.932 | 0.695 | 0.741 | 0.687 |
| 6 | 0.614 | 0.531 | 0.648 | 0.597 | 0.641 | 0.693 |
| 7 | 0.546 | 0.546 | 0.630 | 0.659 | 0.692 | 0.592 |
| 8 | 0.583 | 0.663 | 0.761 | 0.660 | 0.813 | 0.592 |
| 9 | 0.521 | 0.625 | 0.680 | 0.712 | 0.731 | 0.700 |
| 10 | 0.788 | 0.778 | 0.778 | 0.901 | 0.638 | 0.561 |
| 11 | 0.778 | 0.569 | 0.589 | 0.778 | 0.616 | 0.778 |
| 12 | 0.653 | 0.625 | 0.778 | 0.671 | 0.630 | 0.698 |
| 13 | 0.778 | 0.778 | 0.775 | 0.778 | 0.796 | 0.778 |
© 2017 by the authors. Licensee MDPI, Basel, Switzerland. This article is an open access article distributed under the terms and conditions of the Creative Commons Attribution (CC BY) license (http://creativecommons.org/licenses/by/4.0/).
Share and Cite
MDPI and ACS Style
Yuan, Z.; Wang, W.; Peng, J.; Liu, F.; Yang, J. Case Library Construction Technology of Energy Loss in Distribution Networks Considering Regional Differentiation Theory. Energies 2017, 10, 1861. https://doi.org/10.3390/en10111861
AMA Style
Yuan Z, Wang W, Peng J, Liu F, Yang J. Case Library Construction Technology of Energy Loss in Distribution Networks Considering Regional Differentiation Theory. Energies. 2017; 10(11):1861. https://doi.org/10.3390/en10111861
Chicago/Turabian StyleYuan, Ze, Weizhou Wang, Jing Peng, Fuchao Liu, and Jianhua Yang. 2017. "Case Library Construction Technology of Energy Loss in Distribution Networks Considering Regional Differentiation Theory" Energies 10, no. 11: 1861. https://doi.org/10.3390/en10111861
Note that from the first issue of 2016, this journal uses article numbers instead of page numbers. See further details here.