The Techno-Economics of Small-Scale Residential Heating in Low Carbon Futures


Department of Chemical Engineering, Imperial College London, Exhibition Road, London SW7 2AZ, UK
*
Author to whom correspondence should be addressed.
Energies 2017, 10(11), 1915; https://doi.org/10.3390/en10111915
Submission received: 19 September 2017
/
Revised: 16 October 2017
/
Accepted: 12 November 2017
/
Published: 21 November 2017
(This article belongs to the Section I: Energy Fundamentals and Conversion)
Abstract
:Existing studies that consider the techno-economics of residential heating systems typically focus on their performance within present-day energy systems. However, the energy system within which these technologies operate will need to change radically if climate change mitigation is to be achieved. This article addresses this problem by modelling small-scale heating techno-economics in the context of significant electricity system decarbonisation. The current electricity market price regime based on short run marginal costs is seen to provide a very weak investment signal for electricity system investors, so an electricity price regime based on long run marginal energy costs is also considered, using a case study of the UK in 2035. The economic case for conventional boilers remains stronger in most dwelling types. The exception to this is for dwellings with high annual heat demand. Sensitivity studies demonstrate the impact of factors such as price of natural gas, carbon intensity of the central grid and thermodynamic performance. Fuel cell micro combined heat and power shows most potential under the long run electricity price regime, and heat pumps under the short run electricity price regime. This difference highlights the importance of future electricity market structure on consumer choice of heating systems in the future.
1. Introduction
The decarbonisation of heat provision is one of the main challenges of broader climate change mitigation [1]. Heat is a significant end-use, for example in the UK space and water heating makes up 23% of final energy consumption and 55% of non-transport energy consumption [2]. It is also typically relatively carbon intensive, relying on fossil fuels such as natural gas [1], and is underpinned by long-established and low-cost incumbent technology such as boilers serving demand [3]. While alternative technology and fuel options certainly exist for heating, they are generally either significantly costlier [4], or require infrastructure build in the form of district level heat networks as installing components that cater to individual houses is not economically viable [5].
This range of factors makes heat difficult to decarbonise, and therefore an important area of energy research. This is reflected in the literature, with a range of studies exploring the engineering challenges and performance of different heating technologies [6,7,8,9,10,11,12,13,14,15,16,17,18]. The vast majority of the studies that consider techno-economics do so in the context of the present-day energy system. However, the energy system within which heating technologies operate is expected to change significantly in the coming decades [19,20]. In particular, decarbonisation of electricity is seen as a cornerstone of any system-wide climate change mitigation strategy [21]. Therefore, it is important and timely to consider heating technologies in the context of this changing system.
One of the developments in a low carbon future that is of importance is the evolution of electricity prices. If the market follows the status quo and is driven by short run marginal cost, it is seen to provide very weak economic incentives for investment in the electricity system. Therefore, it cannot represent a sustainable price to consumers. It is clear that new electricity market signals will be necessary in the future. Generators will need to mitigate the risk associated with low utilization and low market prices in order to remain viable. One way that risk is currently handled by low carbon generators is through the use of instruments such as Contract for Difference. This provides the low carbon generator with a stable revenue stream in the face of uncertainty. Since such solutions are critical to ensure smooth operation of the electricity grid, this study introduces the use of a fixed power purchase agreement. Generators receive a constant charge for all power they inject into the grid. If this charge is priced by accounting for upfront costs and capacity factor, the revenue generated will able to recover the money invested. This presents a simple and arguably a reasonable way forward for all generators participating in the market. More complex instruments are possible, the design of which is beyond the scope of this article.
This article considers the techno-economics of small-scale residential heating technologies within a changing energy system. It develops a technology-rich model of a range of small-scale heating systems, and considers their economic performance in scenarios of broader energy system change drawn from a new dispatch model of the electricity system. By bringing these models together new insights can be drawn into the primary factors that impact upon the success of approaches to residential heat decarbonisation.
The primary novel contributions of this study are highlighted as follows. The key contribution is the analysis of individual residential heating systems in the context of electricity system decarbonisation, through the combination of an electricity dispatch model with an individual residential heating system model. This article incorporates Equivalent Annual Cost (EAC) as the performance index which drives technology selection in contrast to existing works which compare primary energy consumption and emissions. This is done since economic viability is seen to be the most important factor from the consumer’s perspective. This analysis also required characterisation of an electricity price regime that is based on long run marginal electricity costs. Hence this work has developed an electricity price regime that incorporates capital costs and annual utilization, analogous to the cost of power purchase agreement or similar market instruments suitable for low carbon generators.
The article is structured as follows: the next section presents the background context to this problem, reviewing the challenge and studies to date. This is followed by the methodology applied herein to characterise small scale heating and the possible energy systems it could operate within. The results are then presented and discussed, leading to conclusions.
2. Background
Heat decarbonisation measures can be broadly classified into four groups: Behavioural and efficiency measures, electric heating, low carbon gases and district heating networks. Behavioural and efficiency measures can reduce demand through the use of insulation [22], orientation [23], heating controls [24] high efficiency boilers [25] and changes in behaviour or attitudes towards heating [26]. Another approach to efficiency is the use of micro combined heat and power (micro-CHP) to produce both electricity and heat onsite [27]. Low carbon electricity is also a key contender, as the electricity grid begins to incorporate higher shares of wind, solar and other low carbon sources. Heat pumps present an opportunity to consume this electricity and reduce carbon emissions in the process [28]. Bioenergy can reduce GHG emissions by processing renewable materials such as wastewater into useful fuels, most commonly through anaerobic digestion [29]. Synthetic natural gas and hydrogen are other possible alternatives to natural gas [30,31], and can be applied in conventional technologies such as boilers or alternatives such as fuel cell based micro-CHP. Furthermore, larger-scale heat production coupled with a heat distribution network, also offers opportunities to decarbonise heating at various levels ranging from community to city wide projects [32].
Many studies consider specific options for the decarbonisation of heat. Combined heat and power, heat networks and fuel substitution are seen to be options that can potentially decrease carbon emissions in industry [33]. A wide range of other options are also present in the literature: Energy efficiency is likely to be part of the future regardless of the end-use technology and supply source chosen, and hence clear goals must be set to encourage their adoption [34]. Heat pumps are another option. Although entailing high capital cost, heat pumps are seen produce considerable emission savings [17], though this clearly depends on prevailing conditions such as the carbon intensity of the national electricity grid [35]. District heating is also seen to show great promise to reduce emissions but is highly dependent on policy or regulatory support in order to support coordinated roll out and uptake [36]. Direct use of hydrogen is an option with the added benefit of possibly using existing gas network infrastructure, but would require network adaptation and consumers to switch appliances [37]. Although many options exist, most are there exists no comparison between technologies with the status quo in terms of investment and operating cost in a future scenario. Thus, the challenge of decarbonising heat is far from solved. In this study we consider options that an individual consumer can choose to install without requiring changes in heat network infrastructure or in the supply side.
It is important to recognise that the decarbonisation of heat will take place within broader energy system decarbonisation, a point that has not been comprehensively studied. The authors have shown in [38] that decarbonisation of the power sector leads to changes in electricity prices. Therefore, it is important to consider the economic performance of heating technologies within this changing energy landscape. Typically, such cross-system interactions are investigated via use of whole energy system models. For example, the intersection between broader energy systems and the supply of heat has been studied in [39,40,41,42]. Recent applications of such models focus on identification of optimal pathways of energy system change [19]. These tools typically operate at the national, regional or global level, and as such are necessarily coarsely temporally and spatially-resolved [43]. Though they are suitable for macro-level analysis, the characteristics of individual entities are lost during aggregation, and more detailed highly-resolved and investor-centric models are needed to explore and test the potential solutions that they present.
While many articles in the literature consider a single heating technology, relatively few are devoted to the comparison of heating options. The references summarised in Table 1 are closest to the scope of this article. The main distinctions between them are related to whether a current or future energy system is considered, the heating system control strategy used, and the types of models that define operation and system description. References that use a representation of individual consumers are limited to the present-day energy system [15,16], with the exception of [17,18] where the discussion of the future is limited to the change in carbon intensity of electricity generation. Aggregated representations [44,45] do not provide information about the performance of an individual household. Therefore, such models cannot showcase the impact of technology adoption on the individual consumer.
It is worth noting that the studies that deal with individual consumers in Table 1 focus on primary energy consumption and carbon emissions as an indicator of performance. Consumer adoption of a new technology is not decided by these factors but by whether the technology is economically viable or not. Hence, the methodology described in this work adds a critical dimension to the assessment of small scale heating systems of the future.
3. Methodology
3.1. Model Overview
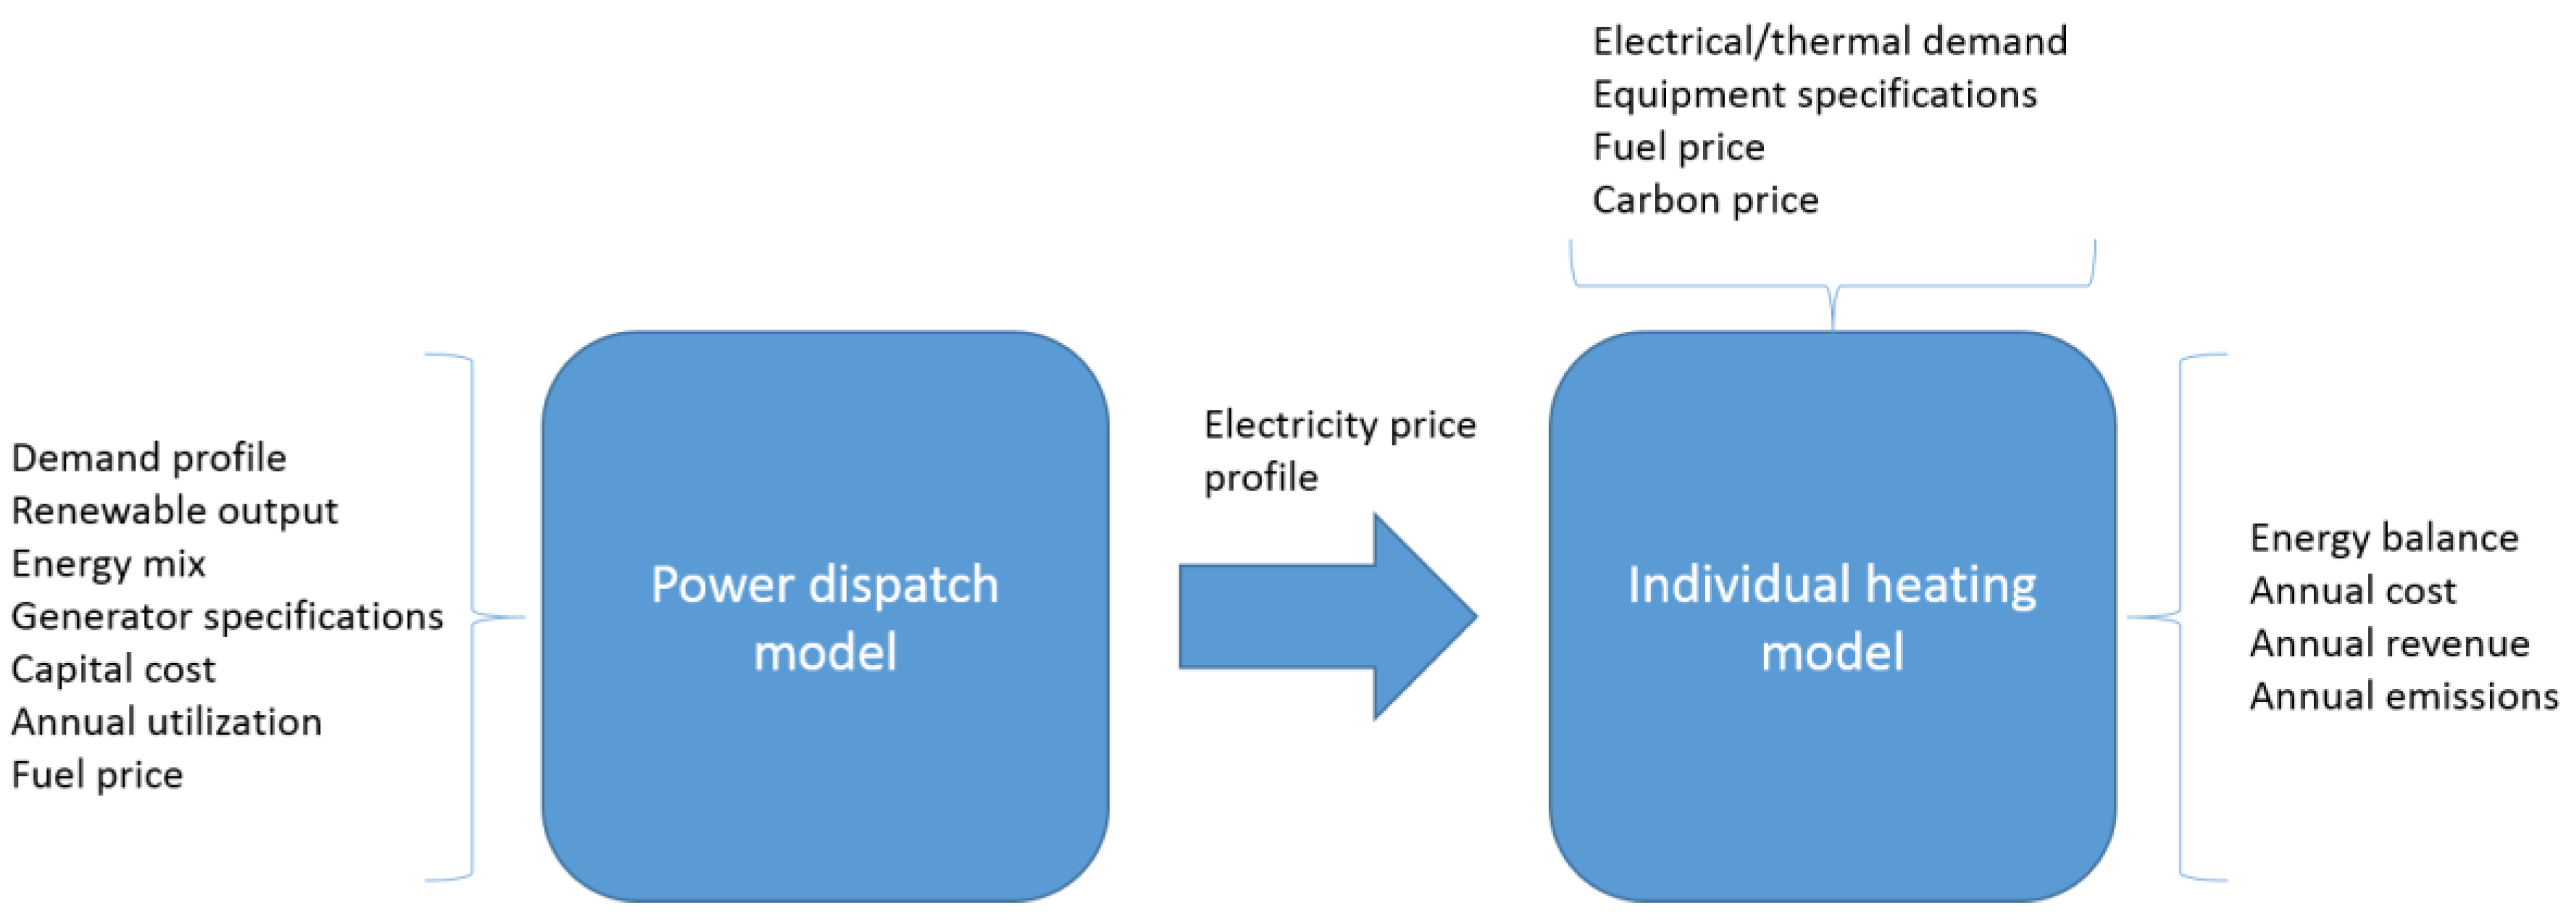
The main objective of this work is to evaluate the impact of high penetration of low carbon sources on the techno-economics of heating technologies in individual households. To this end it combines a macro national level electricity system model with the operation of a micro level individual consumer model to simulate heating system operation in the year 2035. The macro level model simulates power dispatch of all generators in a power grid and the micro level model simulates the heating system in an individual household as shown in Figure 1. The main link between these two models is the electricity price profile. This is a time varying parameter that is dependent upon the energy mix and the electricity price regime adopted by the electricity grid.
3.2. Power Dispatch Model
The dispatch model used here is based on two possible electricity price regimes. The first is based on the status quo in electricity markets, which is driven by the short run marginal cost (SRMC) of generation [46]. A detailed discussion of model equations and validation can be found in [38]. The objective minimises the total electricity generation cost which is a combination of fuel, carbon and start-up costs:
subject to:
Supply demand balance is maintained by Equation (2). Equation (3) represents a group of constraints that govern start-up, shut down, component limits and ramping limits. Equation (4) represents a group of constraints related to storage capacity, charging limits, discharging limits and inter-temporal relations.
It was shown in [38] that the mean value of wholesale price of electricity is nearly halved when there is a high penetration of low carbon sources. Such low electricity price signals provide very weak economic incentives to investors in the electricity system. Therefore, a second electricity price regime driven by the long run marginal cost of generation has been introduced. The main difference is that the cost now includes the annualised capital cost and annual utilization of different technologies. This is derived from the Average Energy Cost defined by Stoft [47] which is a function of fixed cost, capacity factor and variable cost as shown in Equation (5):
The long run marginal cost used in this work substitutes the fixed cost with the amortised value of the overnight cost per unit capacity. The variable cost is replaced by the short run marginal cost of electricity. This representation of electricity cost is analogous to what might be expected in a power purchase agreement auction for long carbon sources [48,49].
Since the dispatch of units is dependent on the capacity factor which is in turn dependent on dispatch, straight forward substitution is not possible, a recursive loop is used as explained below.
The cost component related to annualised capital cost divided by capacity factor is called the capital-utilization factor or CU cost. The renewable components only have a CU cost and do not have other associated costs. The conventional generators have additional components related to fuel, carbon, start-up, operation and maintenance cost. As the loop progresses, utilization of different conventional generators change. The utilization of renewables remains constant since cost of renewables is still lower than the conventional sources even with the capital-utilization cost. If the utilization of a conventional generator increases, its CU cost decreases and thus its likelihood of dispatch increases. As dispatch is non-linear process involving start-up and ramping, the loop continues until the CU costs converge for all technologies. The objective function is shown in Equation (6):
Both electricity price regimes are applied to a future scenario in the UK with high penetration of renewables in the year 2035. The comparison between the present day and the future scenario used in this article is presented in Table 2. The future scenario details are the same as those used in [38], using the National Grid Gone Green scenario as a basis [50]. This scenario features a five-fold increase in renewables and the total phasing out of coal so that the UK’s carbon and renewable targets are met on time.
3.3. Individual Heating Technology Model
3.3.1. System Description
This model represents the operation of different heating technologies within a household. The different options considered are summarised in Table 3. The interactions between each of these components is shown in Figure 2.
The system is exposed to time varying electricity prices, import is charged at retail price and export attracts revenue at wholesale price. The inputs from the power dispatch model provide the wholesale price. Wholesale prices are uplifted by taxes, fuel duties and policy cost recovery based on data from the UK government [51] to calculate retail prices.
3.3.2. Model Equations
Heating system control is determined by the solution of an optimization problem. Like the electricity system dispatch model, it is based on a mixed integer linear program. This is in contrast to the heat/electricity led operation and analytical simulation equations often used in existing literature. There are two factors which make an optimisation approach better suited to the current problem: (1) Time varying nature of electricity prices and (2) presence of thermal energy storage. The optimisation problem is able to calculate the best strategy that will result in the most value to the consumer. This can be through the usage of the thermal energy storage to reduce operational cost or through increase in on-site generation to export electricity during periods of high prices to increase revenue. The optimization approach is meant to be implemented with feedback about the state of charge of the storage unit and electricity price. Hence the operating strategy is subject to change unlike a heat/electricity led strategy which follows demand irrespective of other variations. Another distinction with existing literature is the type of model used. The focus of this article is the evaluation of economic viability of a technology through the use of dynamic optimal operating strategies and steady state models, while the focus of references like [16,18] is the use of detailed component level models to evaluate performance with predetermined demand-led operating strategies. The model is applied to four representative days in a year (one for each season). Each day is divided into five minute intervals. The results from each day are weighted approximately equally to calculate the annual performance indices used for comparison. The structure of the problem can be summarised as:
- Objective:
- ○
- Minimise operating cost (for CHP this includes the revenue gained from electricity export)
- Subject to:
- ○
- Electrical load balance
- ○
- Thermal load balance
- ○
- Heat to power ratio (for CHP)
- ○
- Thermal energy storage operation
- ○
- Component operational limits
Details regarding mathematical modelling of these constraints are presented in the Supplementary Materials.
3.3.3. Performance Indicators
This study focuses on the comparison of economic and environmental performance. Economic performance is measured in terms of the Equivalent Annual Cost (EAC) which is defined as the export revenue subtracted from the sum of annualized capital and operational costs. Revenue and operational costs are weighted according to sample weights of representative days. Environmental performance is measured in terms of annual carbon emissions. This value is also weighted according to sample weights of representative days. Net emission for each sample day is defined as credit received for on-site generation subtracted from the sum of emissions from natural gas consumptions and electricity import. Equations for each of these indicators are present in the Supplementary Materials.
3.4. Data Used in the Simulations
Capital costs of different generator types are from a tool developed by the UK government [52]. Lifespan values for generator types are from [53]. Assumptions in the future electricity system scenario such as energy mix, fuel prices and renewable output are the same as those used in [38], using the National Grid Gone Green scenario as a basis. The intensity of carbon emissions for electricity generation for the year 2035 is from the same National Grid reference [50] used in [38]. Natural gas prices are from the UK governments projections for the year 2035 [51]. Carbon prices are based on the non-traded price of carbon data in the UK government’s valuation of energy use and greenhouse gas emissions [54]. The carbon intensity of natural gas is from a report on greenhouse gas reporting released by the UK government [55]. The uplift of wholesale price to give retail price is based on projections generated by the UK government [51]. Capital costs for heating technologies in the year 2035 are within the ranges specified in [56] and cross-referenced with the UK TIMES model [20]. Technology learning for the fuel cell, Stirling engine and heat pump has been discussed in existing literature [56,57,58]. As these learning curve forecasts tend to be especially optimistic about reduction in capital cost, this article makes use of realistic estimates used in the UK TIMES model [20].Further details and individual values are presented in the Supplementary Materials.
4. Results and Discussion
4.1. Power Dispatch Model
4.1.1. Comparison of Wholesale Electricity Price Distribution
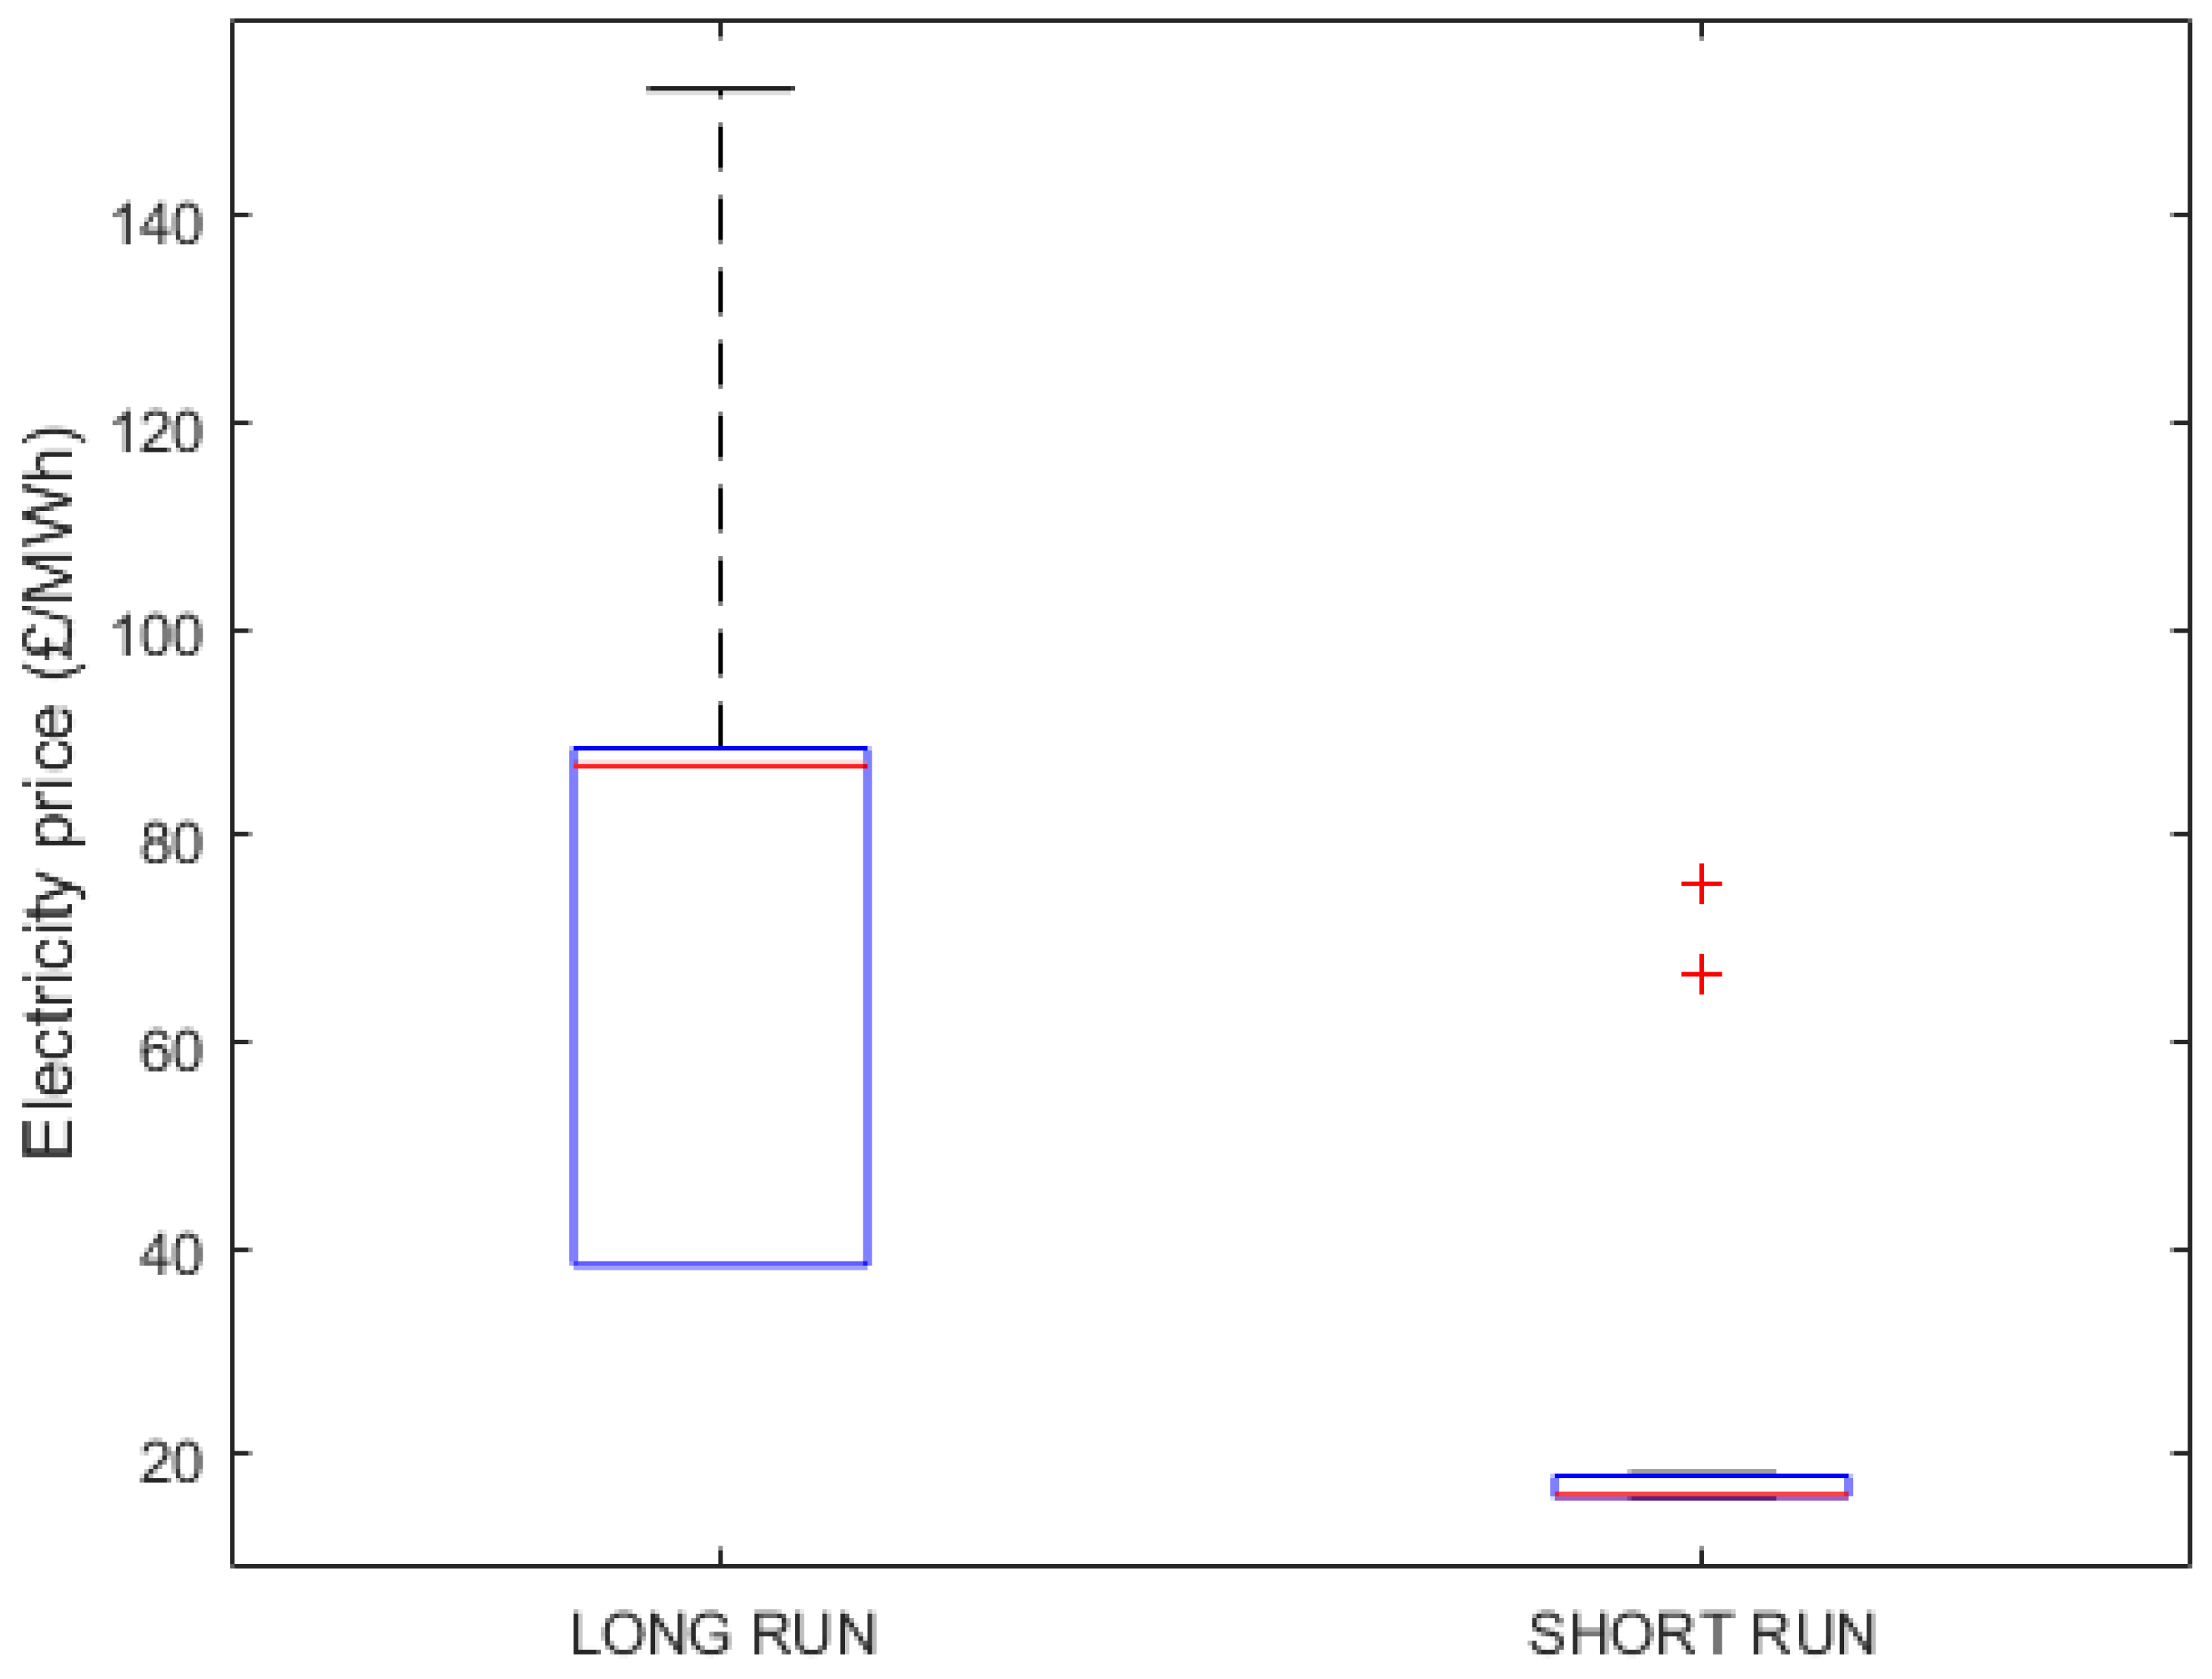
The dispatch problem calculates which generators are online at various points during the day. This selection is based on long run and short run costs depending on the regime used. The inclusion of capital cost significantly changes the distribution of prices as shown in Figure 3. Mean of prices under the long run regime is around 70 £/MWh and mean under the short run regime is close to 20 £/MWh. The low short run prices are due a five-fold increase in renewable capacity in the overall electricity grid in the UK. Therefore the amount of zero short run marginal cost power being injected into the grid is considerably larger in the low carbon scenario. The mean electricity price encountered in the UK in the present day is around 50 £/MWh. Hence, a sixty percent decrease in electricity prices weakens the economic case for generators. They will not be able to pay back their capital costs if such low prices were to persist. The long run cost, which is analogous to the price one would expect in low carbon generation power purchase agreement auctions, is arguably a more reflective representation of future electricity prices.
4.1.2. Analysis of Wholesale Electricity Price Variation
This section deals with the factors that drive prices in the two electricity price regimes. Both regimes are based on marginal prices. This means that the overall price is the marginal cost of the most expensive generator online at any point of time. The dispatch of generators is based on different costs in the two regimes. As explained earlier, long run costs have an additional term related to the amortised upfront costs. Thus renewable sources also have an associated cost.
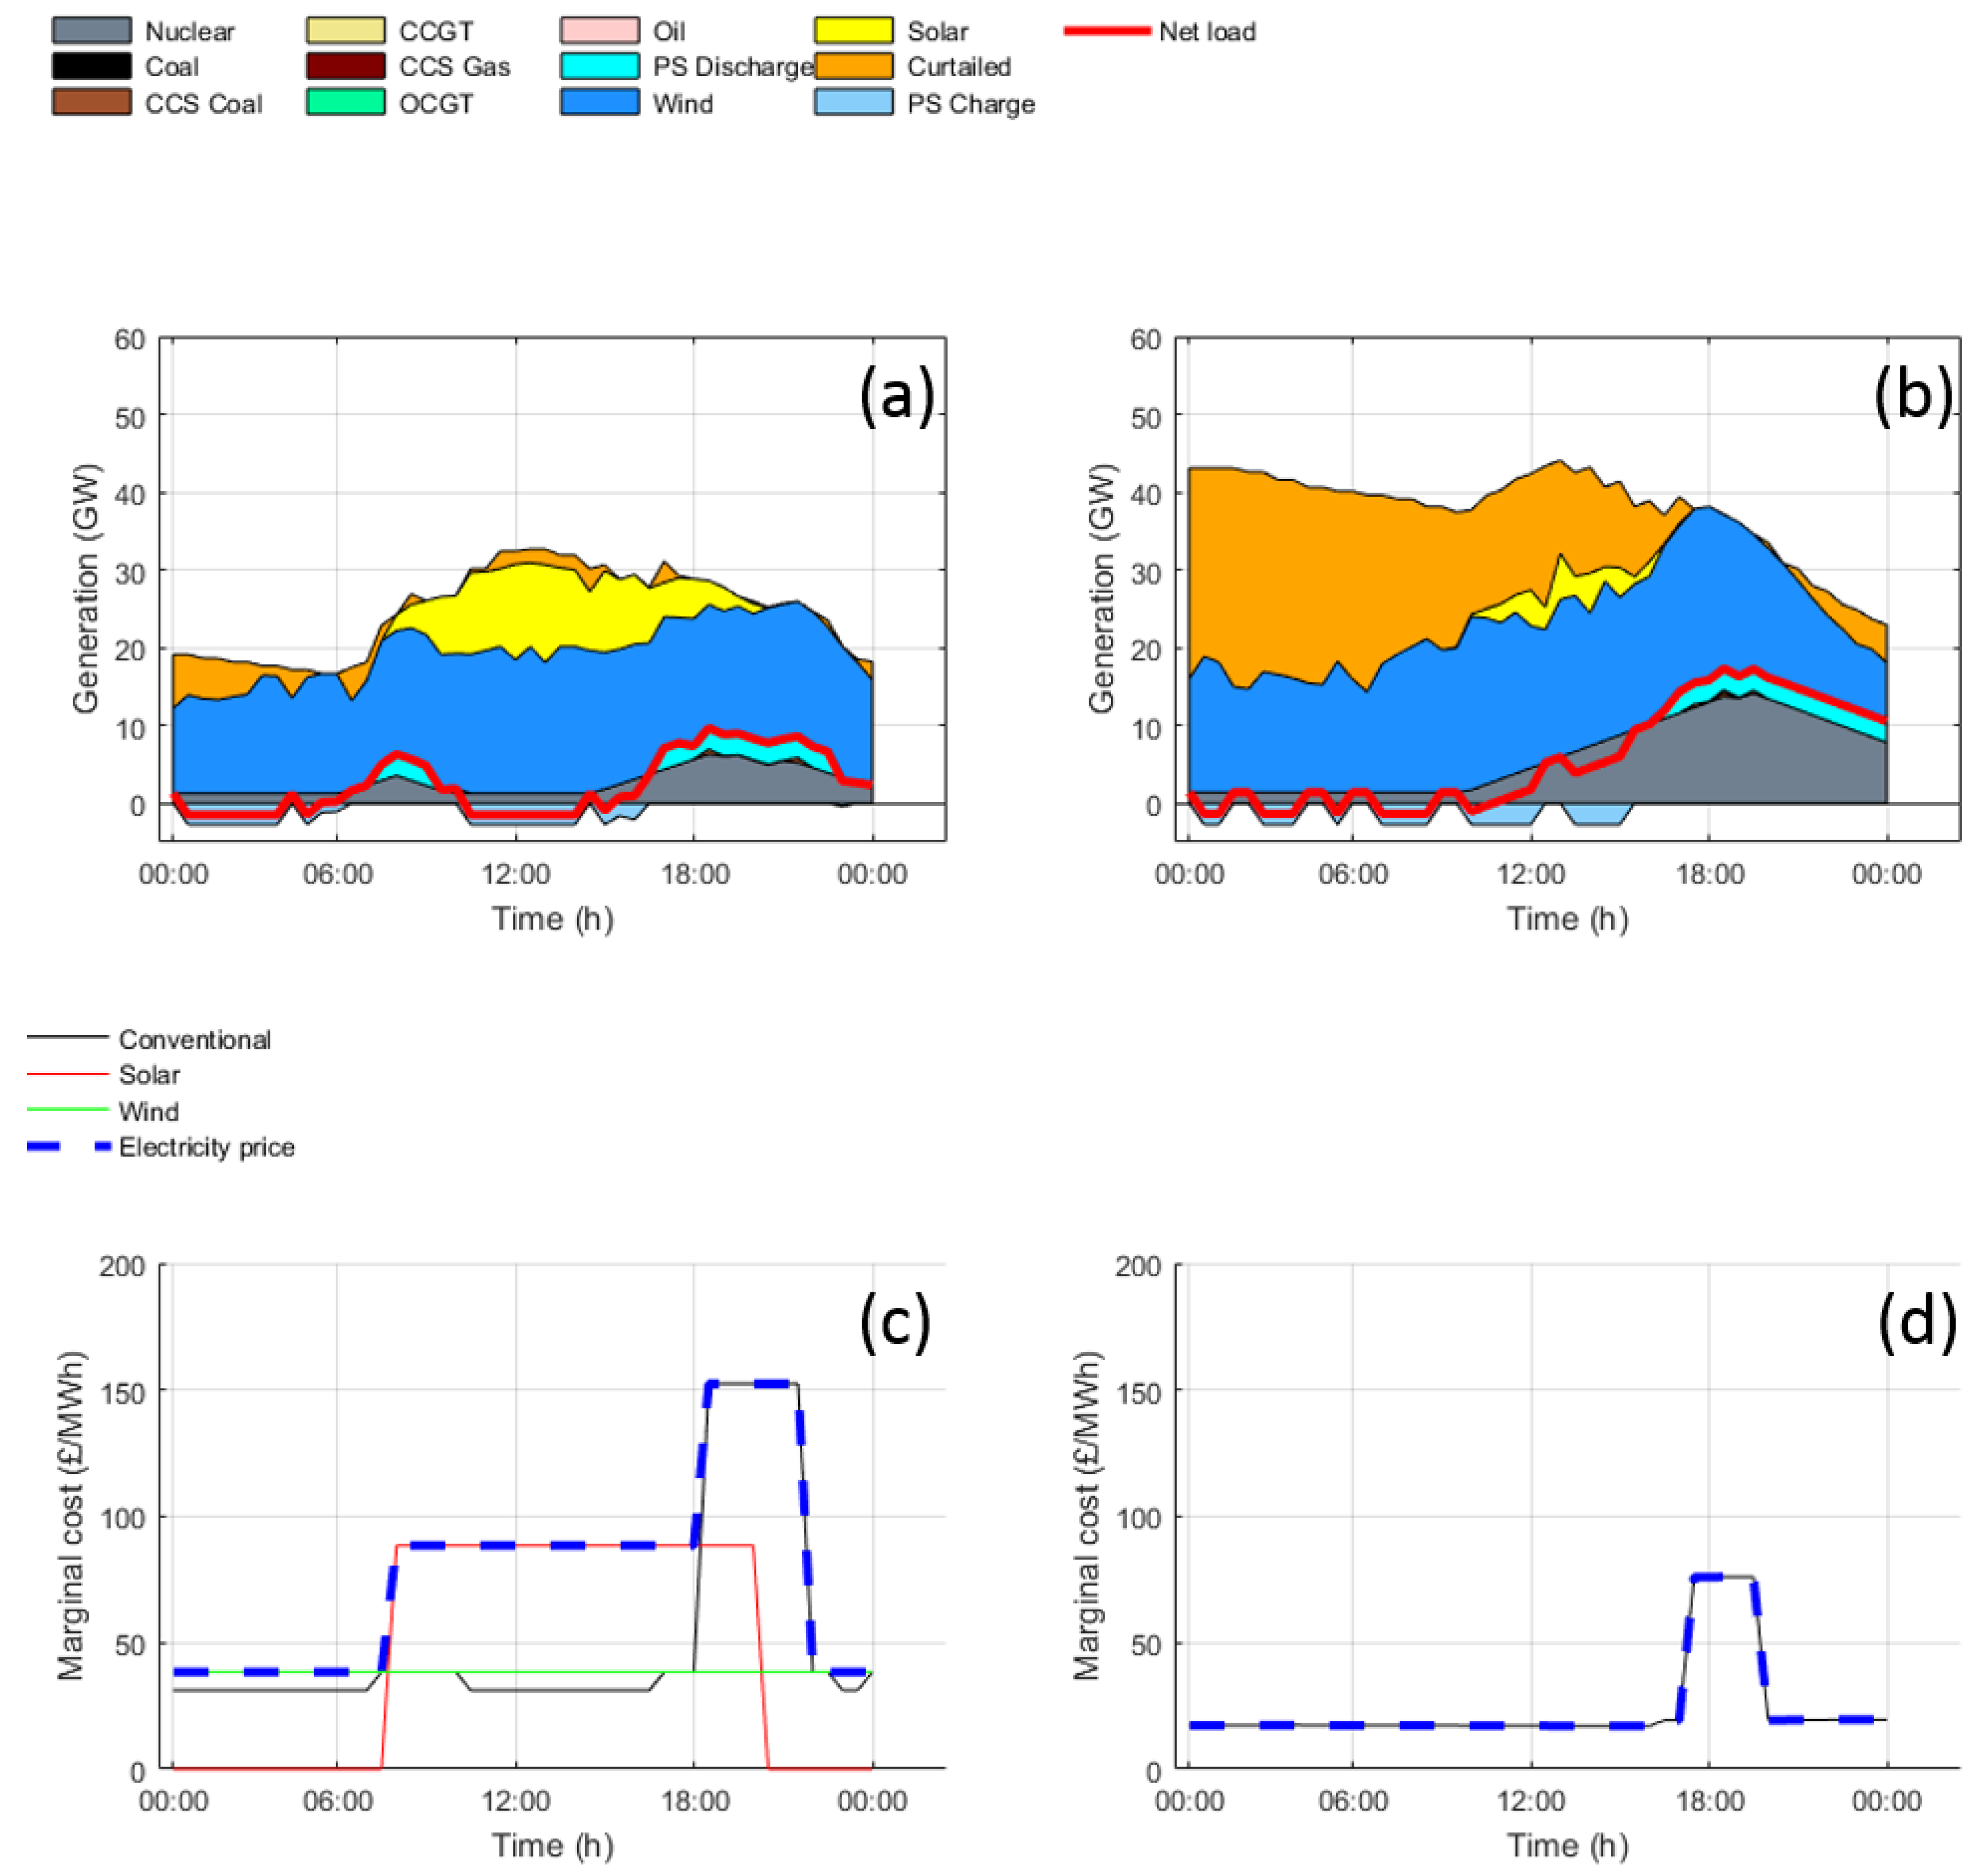
Operation of the long run regime on a spring day is shown in Figure 4a,c. There is plenty of sunlight and wind as seen in Figure 4a. Fossil fuel generators are not necessary except after 6 PM since sunlight dies down in the evening. The operation of nuclear and wind till 7 AM results in relatively low values of electricity price as seen in Figure 4c. Injection of solar power increases price towards mid-day. The marginal cost of solar power is larger than wind due to a lower value of capacity factor. A further increase in electricity price is seen beyond 6 PM due to the dispatch of Coal units fitted with Carbon Capture and Storage (CCS). As utilization of conventional generators decreases significantly in a low carbon future, their marginal cost is larger.
Operation of the short run regime on a winter day in shown in Figure 4b,d. There is lesser sunlight in winter as seen in Figure 4b, but since these is no dearth of wind, the electricity price remains low through most of the day. The electricity price increases due to a brief appearance of Coal units fitted with CCS around 6 PM. But the magnitude of electricity price does not cross the 100 £/MWh.
It is also clear from Figure 4c,d that the short run electricity price regime involves much lower prices when compared to the long run electricity price regime. Thus the long run electricity price regime is more likely to provide an appropriate price signal to generators necessary to maintain system security.
4.2. Performance of Heating Systems
The operation of the heating system is simulated by the optimization problem described in Section 3.3.2. Representative demand profiles for three house sizes: small, medium and large are used. The demand profiles used for this representation are sourced from [59], and depict four seasons using a highly temporally-resolved diurnal profile for each. Annual values of electric and heat demand for each house are presented in Table 4. Five different heating system options are compared: Boiler, electric heater, air source heat pump, fuel cell micro CHP and Stirling engine micro CHP. All options are compared to incumbent technology in the UK, which is a boiler for providing heat, with electricity from the central grid to serve the electricity demand.
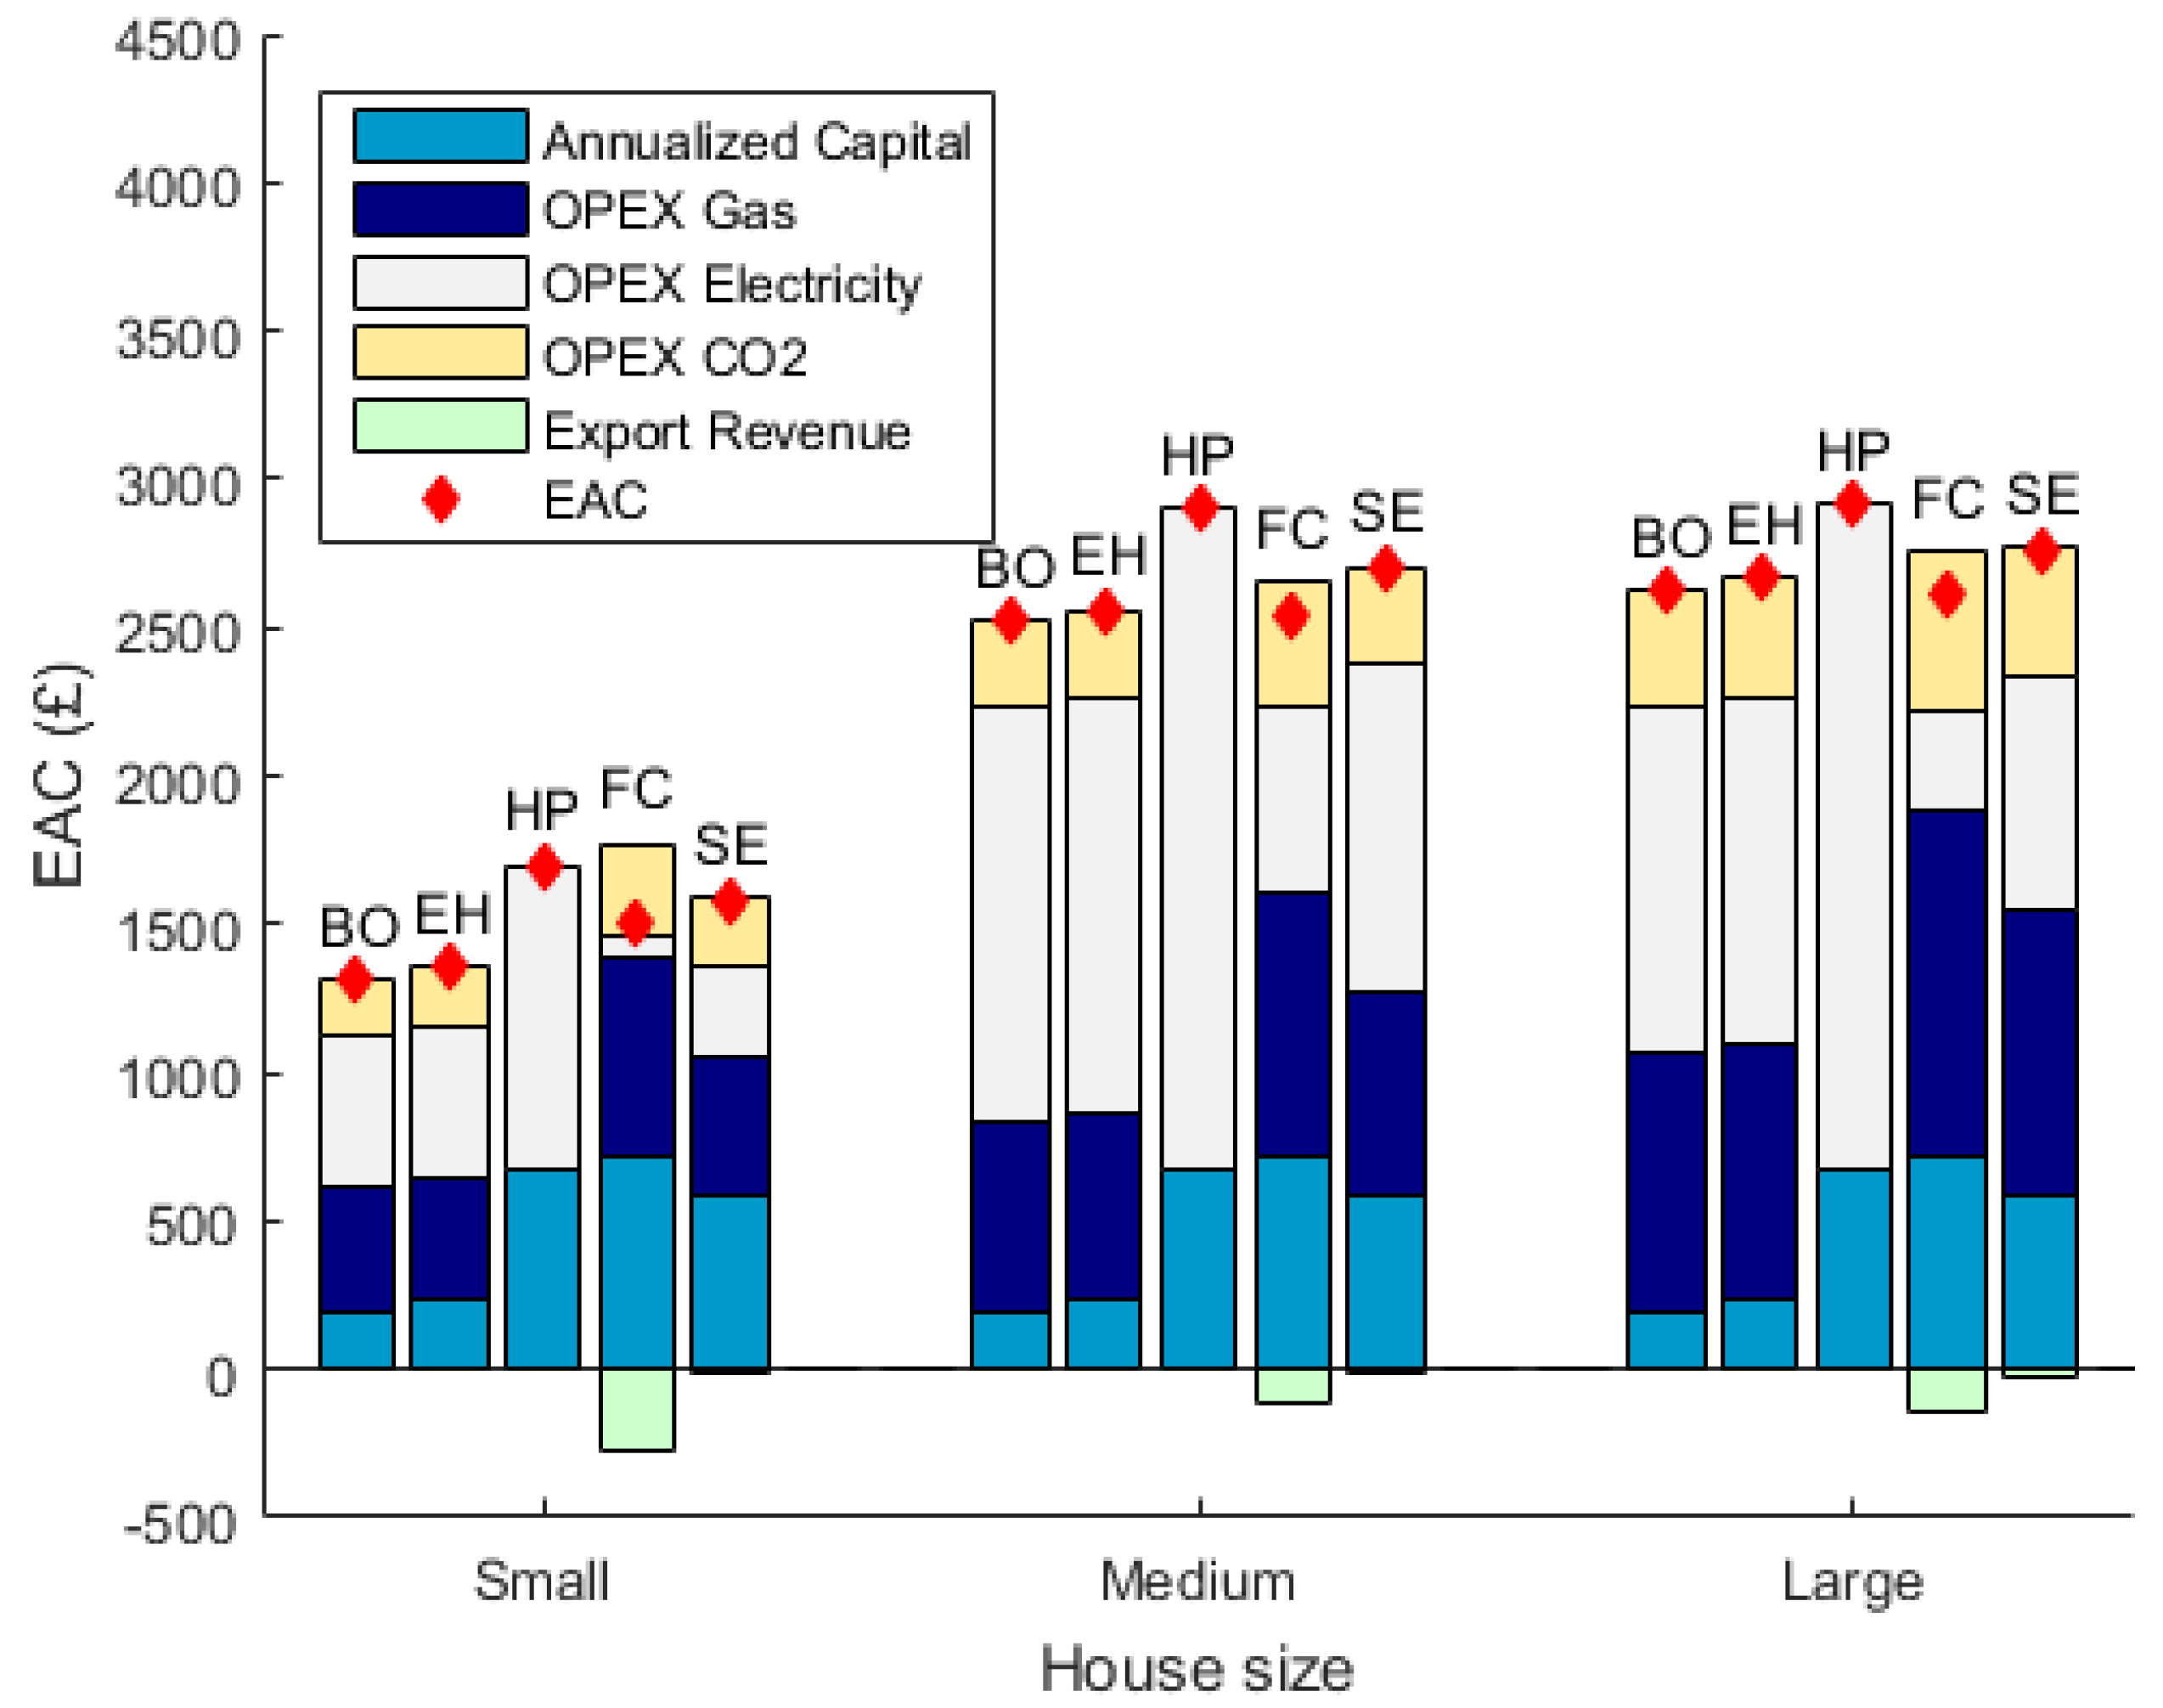
4.2.1. Equivalent Annual Cost (EAC)
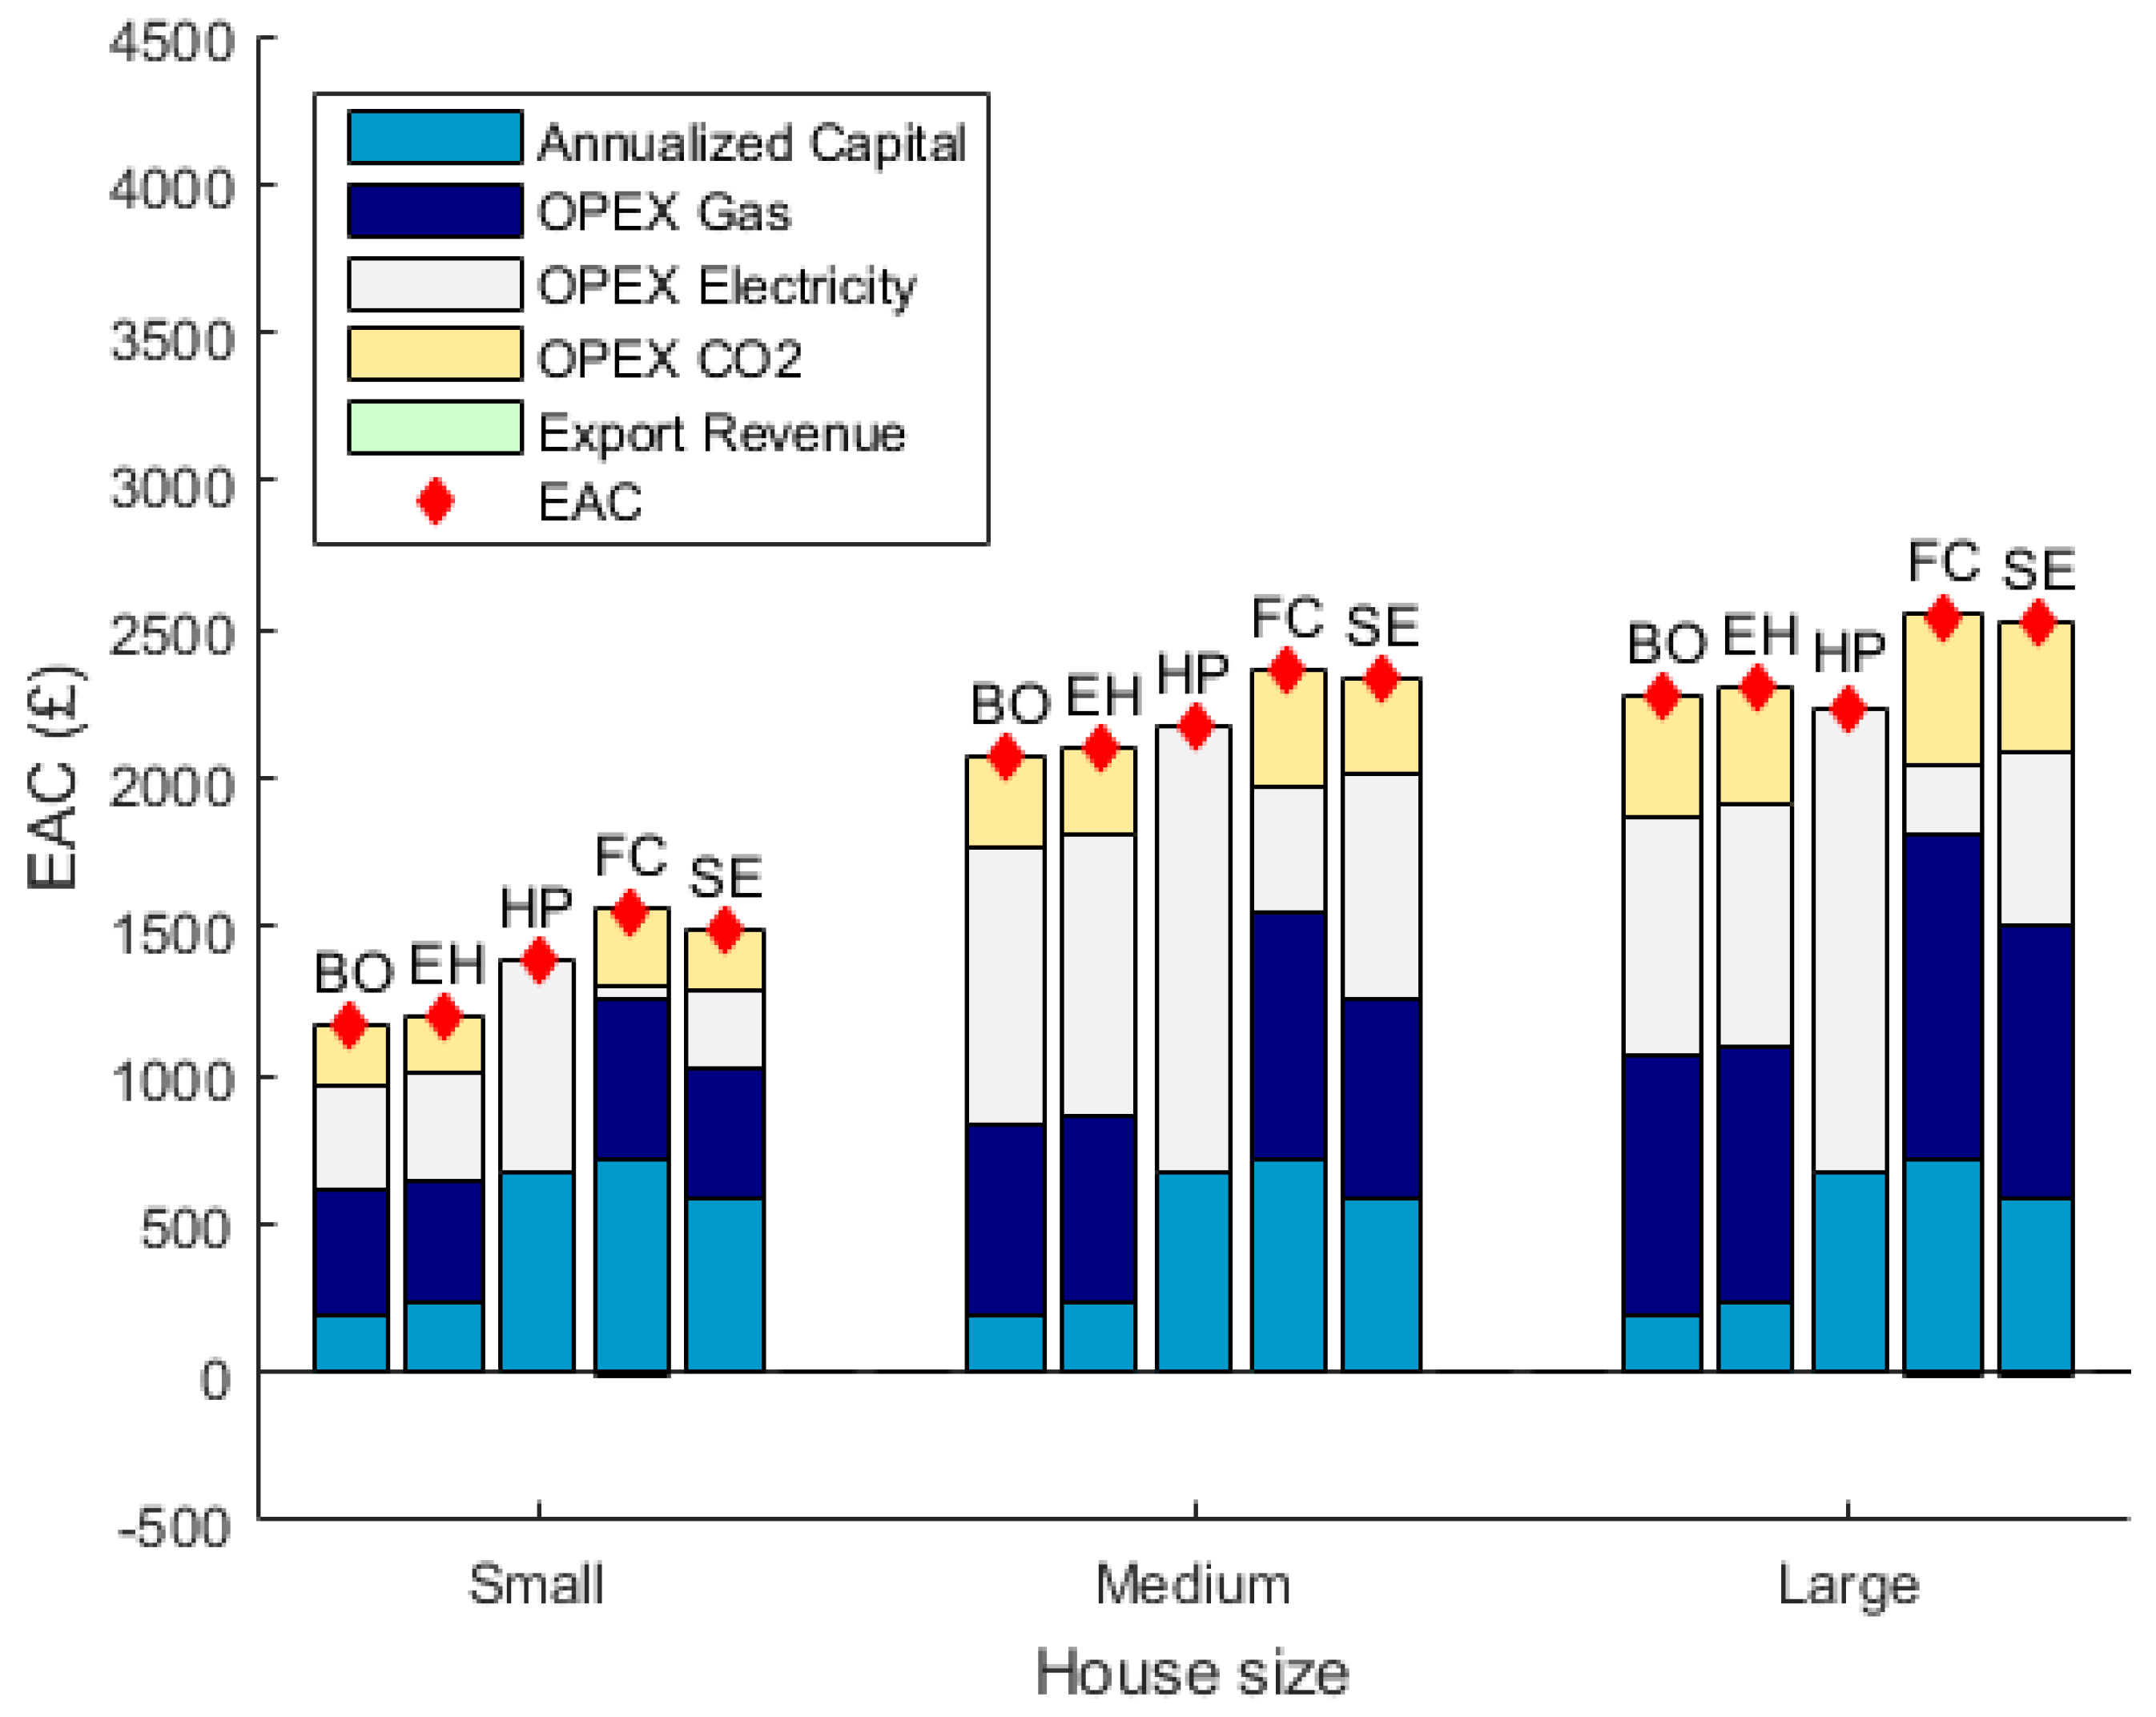
The EAC for each of the cases are presented in Figure 5 and Figure 6. A technology option is said to be economically viable if its EAC is lower than the baseline case involving the boiler and central grid. Figure 5 shows that there is little difference in EAC under the short run regime. The decrease in annual electricity costs (in comparison to the baseline) in the fuel cell and Stirling engine cases is due to onsite generation. This decrease is seen to be larger with the fuel cell, which is due to its higher utilization. Higher utilization leads to more savings, but the savings are still not enough to offset the additional capital expense. None of the options are seen to be viable in the short run regime except the heat pump in the large house. The heat pump is different from the baseline in two aspects: the absence of gas and carbon costs due to reliance on electricity and the inclusion of a thermal storage unit. Every kWh of thermal demand requires 4.5 p for gas and 2.08 p for carbon costs in the baseline case. Serving an equivalent heat demand with the heat pump is related to the retail price of electricity, which is 13.57 p/kWh, divided by the coefficient of performance of the heat pump resulting in 4.52 p/kWh of thermal demand. So the savings increase as the annual heat demand increases and the heat pump is able to offset the capital costs in the case of the large house.
Higher electricity prices in the long run regime in Figure 6 change the outcome. The higher electricity prices push the heat pump EACs to levels higher than the reference case. High electricity prices and future gas prices are conducive for on-site generation. The higher wholesale price in the long run regime also incentivises micro-CHP to export electricity, further lowering the EACs for these technologies. The fuel cell is able to perform better than the Stirling engine since its low heat-to-power ratio allows for higher utilisation, apparent in the higher level of export and lower consumption of grid electricity. Since micro-CHP units are not allowed to discard excess heat production, the low heat to power ratio of the fuel cell allows for more on-site generation while the high heat to power ratio of the Stirling engine limits its performance. None of the options are cost-competitive except the fuel cell in the large house. As with the short run regime, the savings in operational costs of the fuel cell are enough to offset capital costs only with a large value of annual heat demand.
The electrical demand for the heat pump in the medium and large house are seen to be similar in Figure 5 and Figure 6. This can be attributed to the increase in heat demand being offset by the lower electrical demand in the large house. The composition of costs related to electricity for the heat pump are presented in Table 5 and Table 6.
It is worth noting that the electric heater is identical to the baseline case. This was included to investigate if there was any scope to make use of variability in electricity prices to buffer energy in the thermal energy storage. The results indicate that electric heater utilization was not significant.
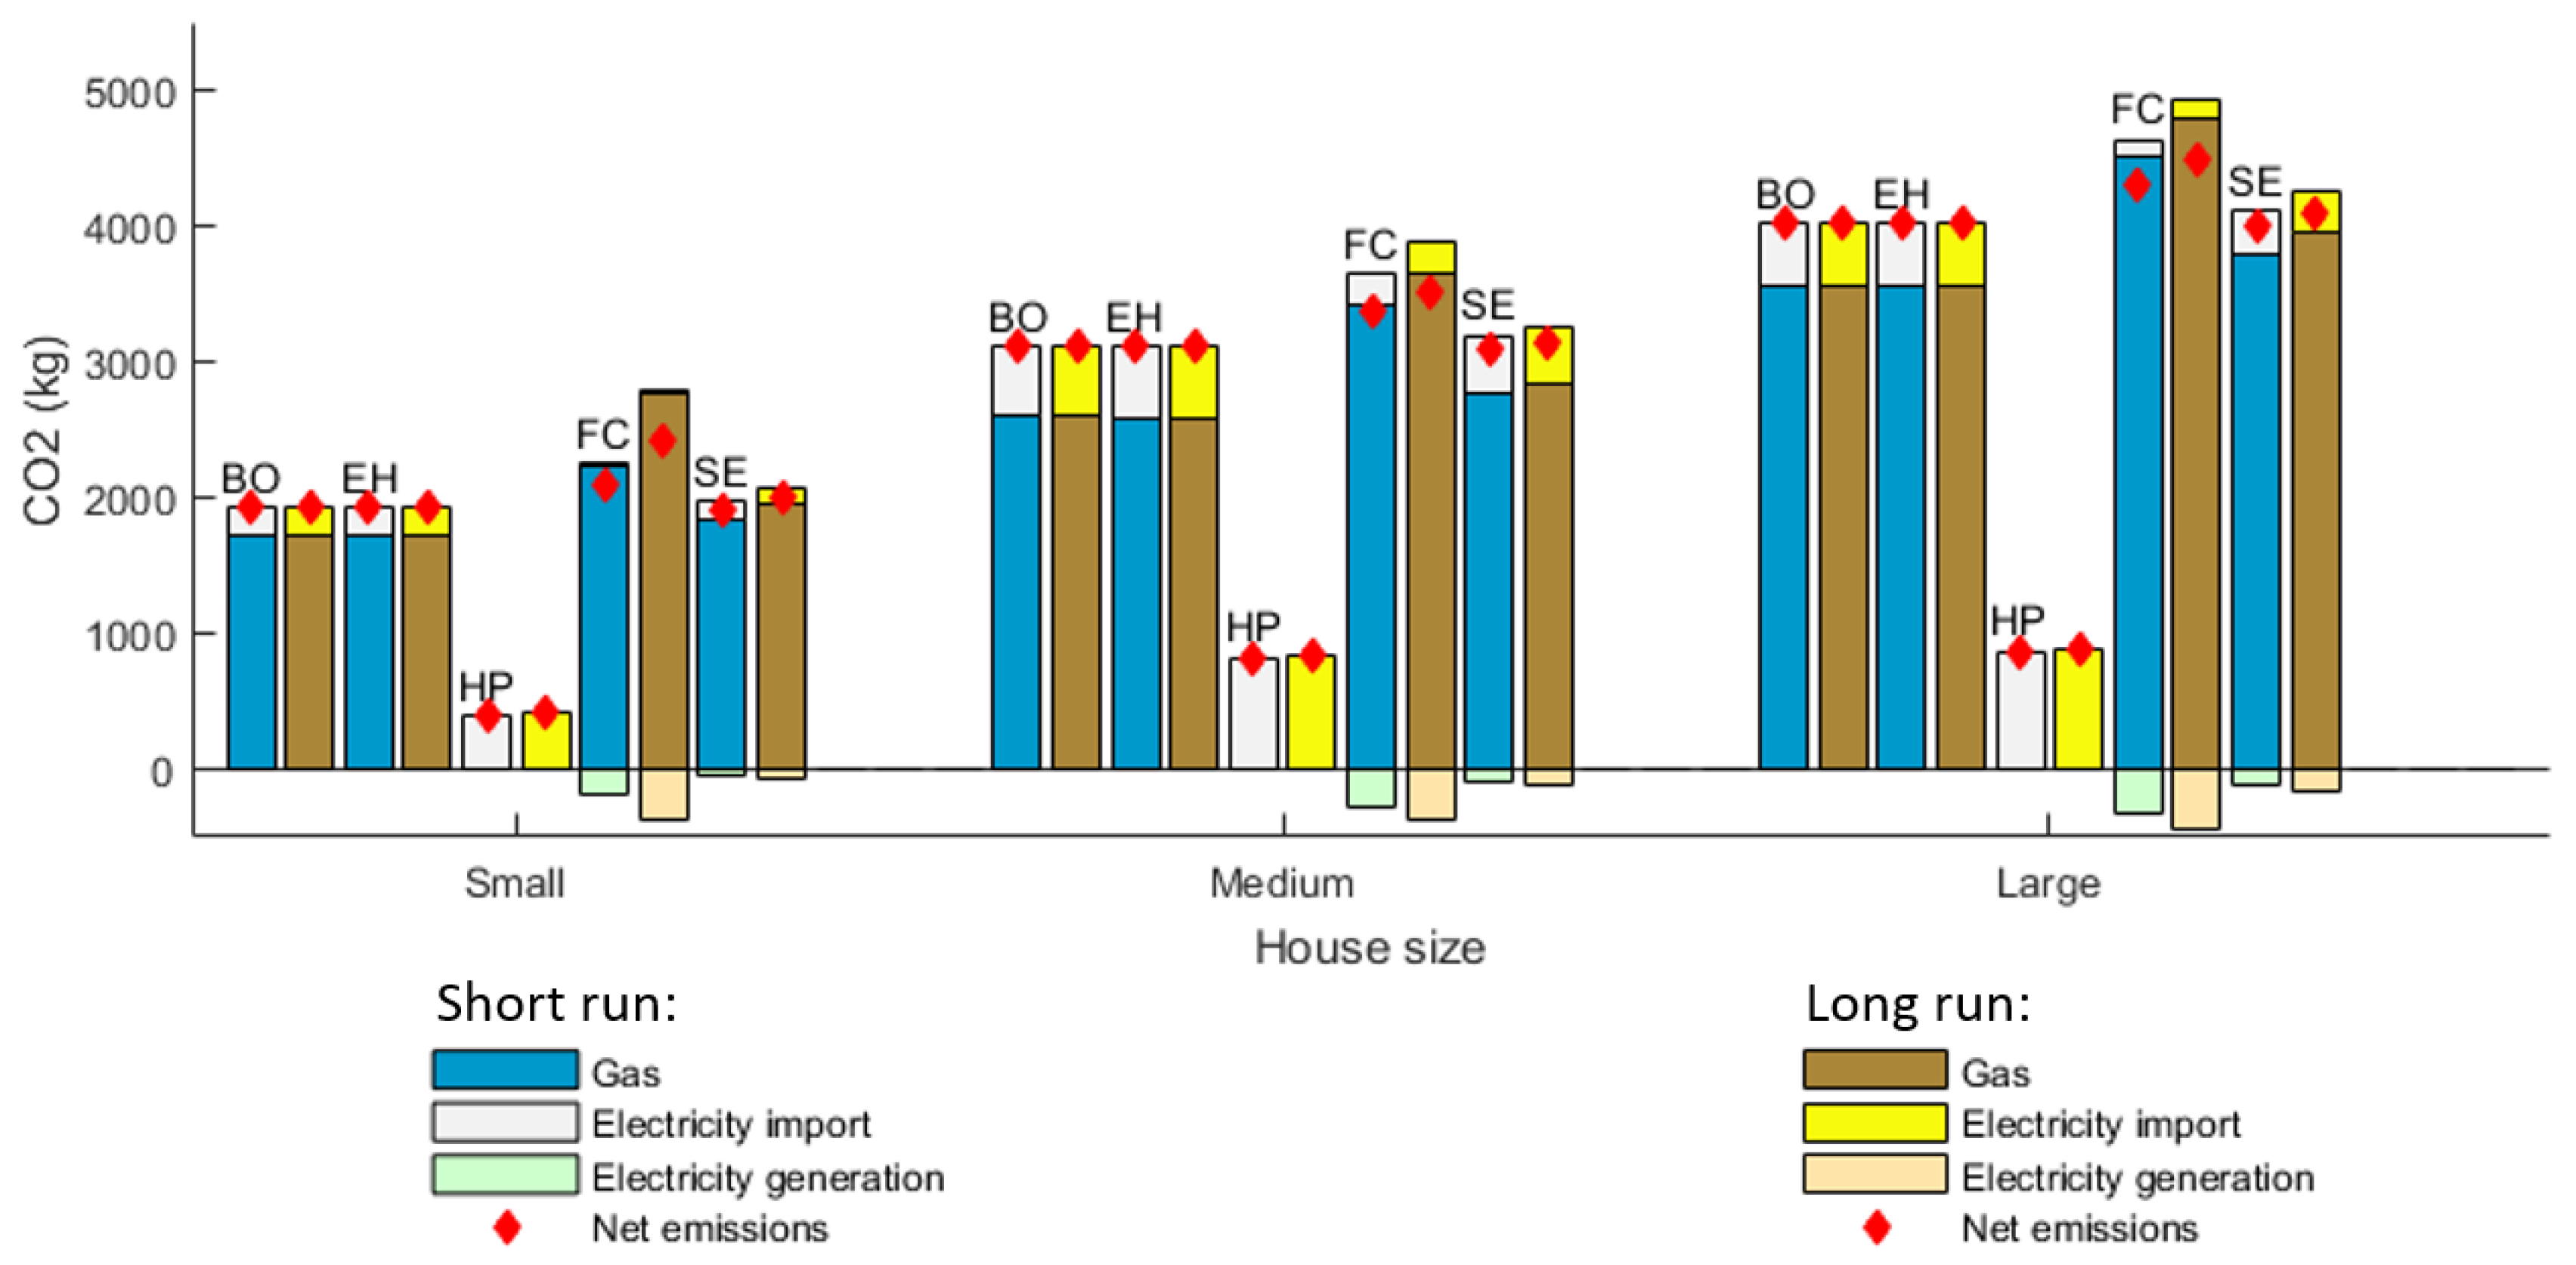
4.2.2. Carbon Emissions
Comparison of the environmental performance of the systems is shown in Figure 7. The heat pump is seen to perform better in both electricity price regimes. This is due to the low carbon intensity associated with electricity grid in the low carbon future scenario. The situation changes when the heating system includes micro CHP units. Co-generation of electricity and heat is more cost effective. But this increases natural gas usage. The net emissions after deducting the amount generated on-site is still higher than the baseline for the fuel cell under both regimes. Emissions from the Stirling engine are slightly lower than the baseline in the short run regime. The economic objective function and the low heat to power ratio of the fuel cell leads to higher onsite generation than the Stirling engine. This leads to higher emissions. As seen before, the electric heater is identical to the baseline due to low heater utilization.
4.3. Sensitivity Analysis
The results presented in Section 4.2 are closely tied to certain parameters. In this section we study the impact of the most critical parameters which affect the results presented earlier. The two parameters which are most likely to change the environmental and economic performance are carbon intensity of electricity grid and natural gas prices. Analysis of the model equations reveals that a unit change in natural gas price would have the same effect as a corresponding change in the carbon price. Hence, the sensitivities related to natural gas price also apply to corresponding changes in carbon price. Finally this section also discusses the influence of thermodynamic performance criteria on EAC and emissions.
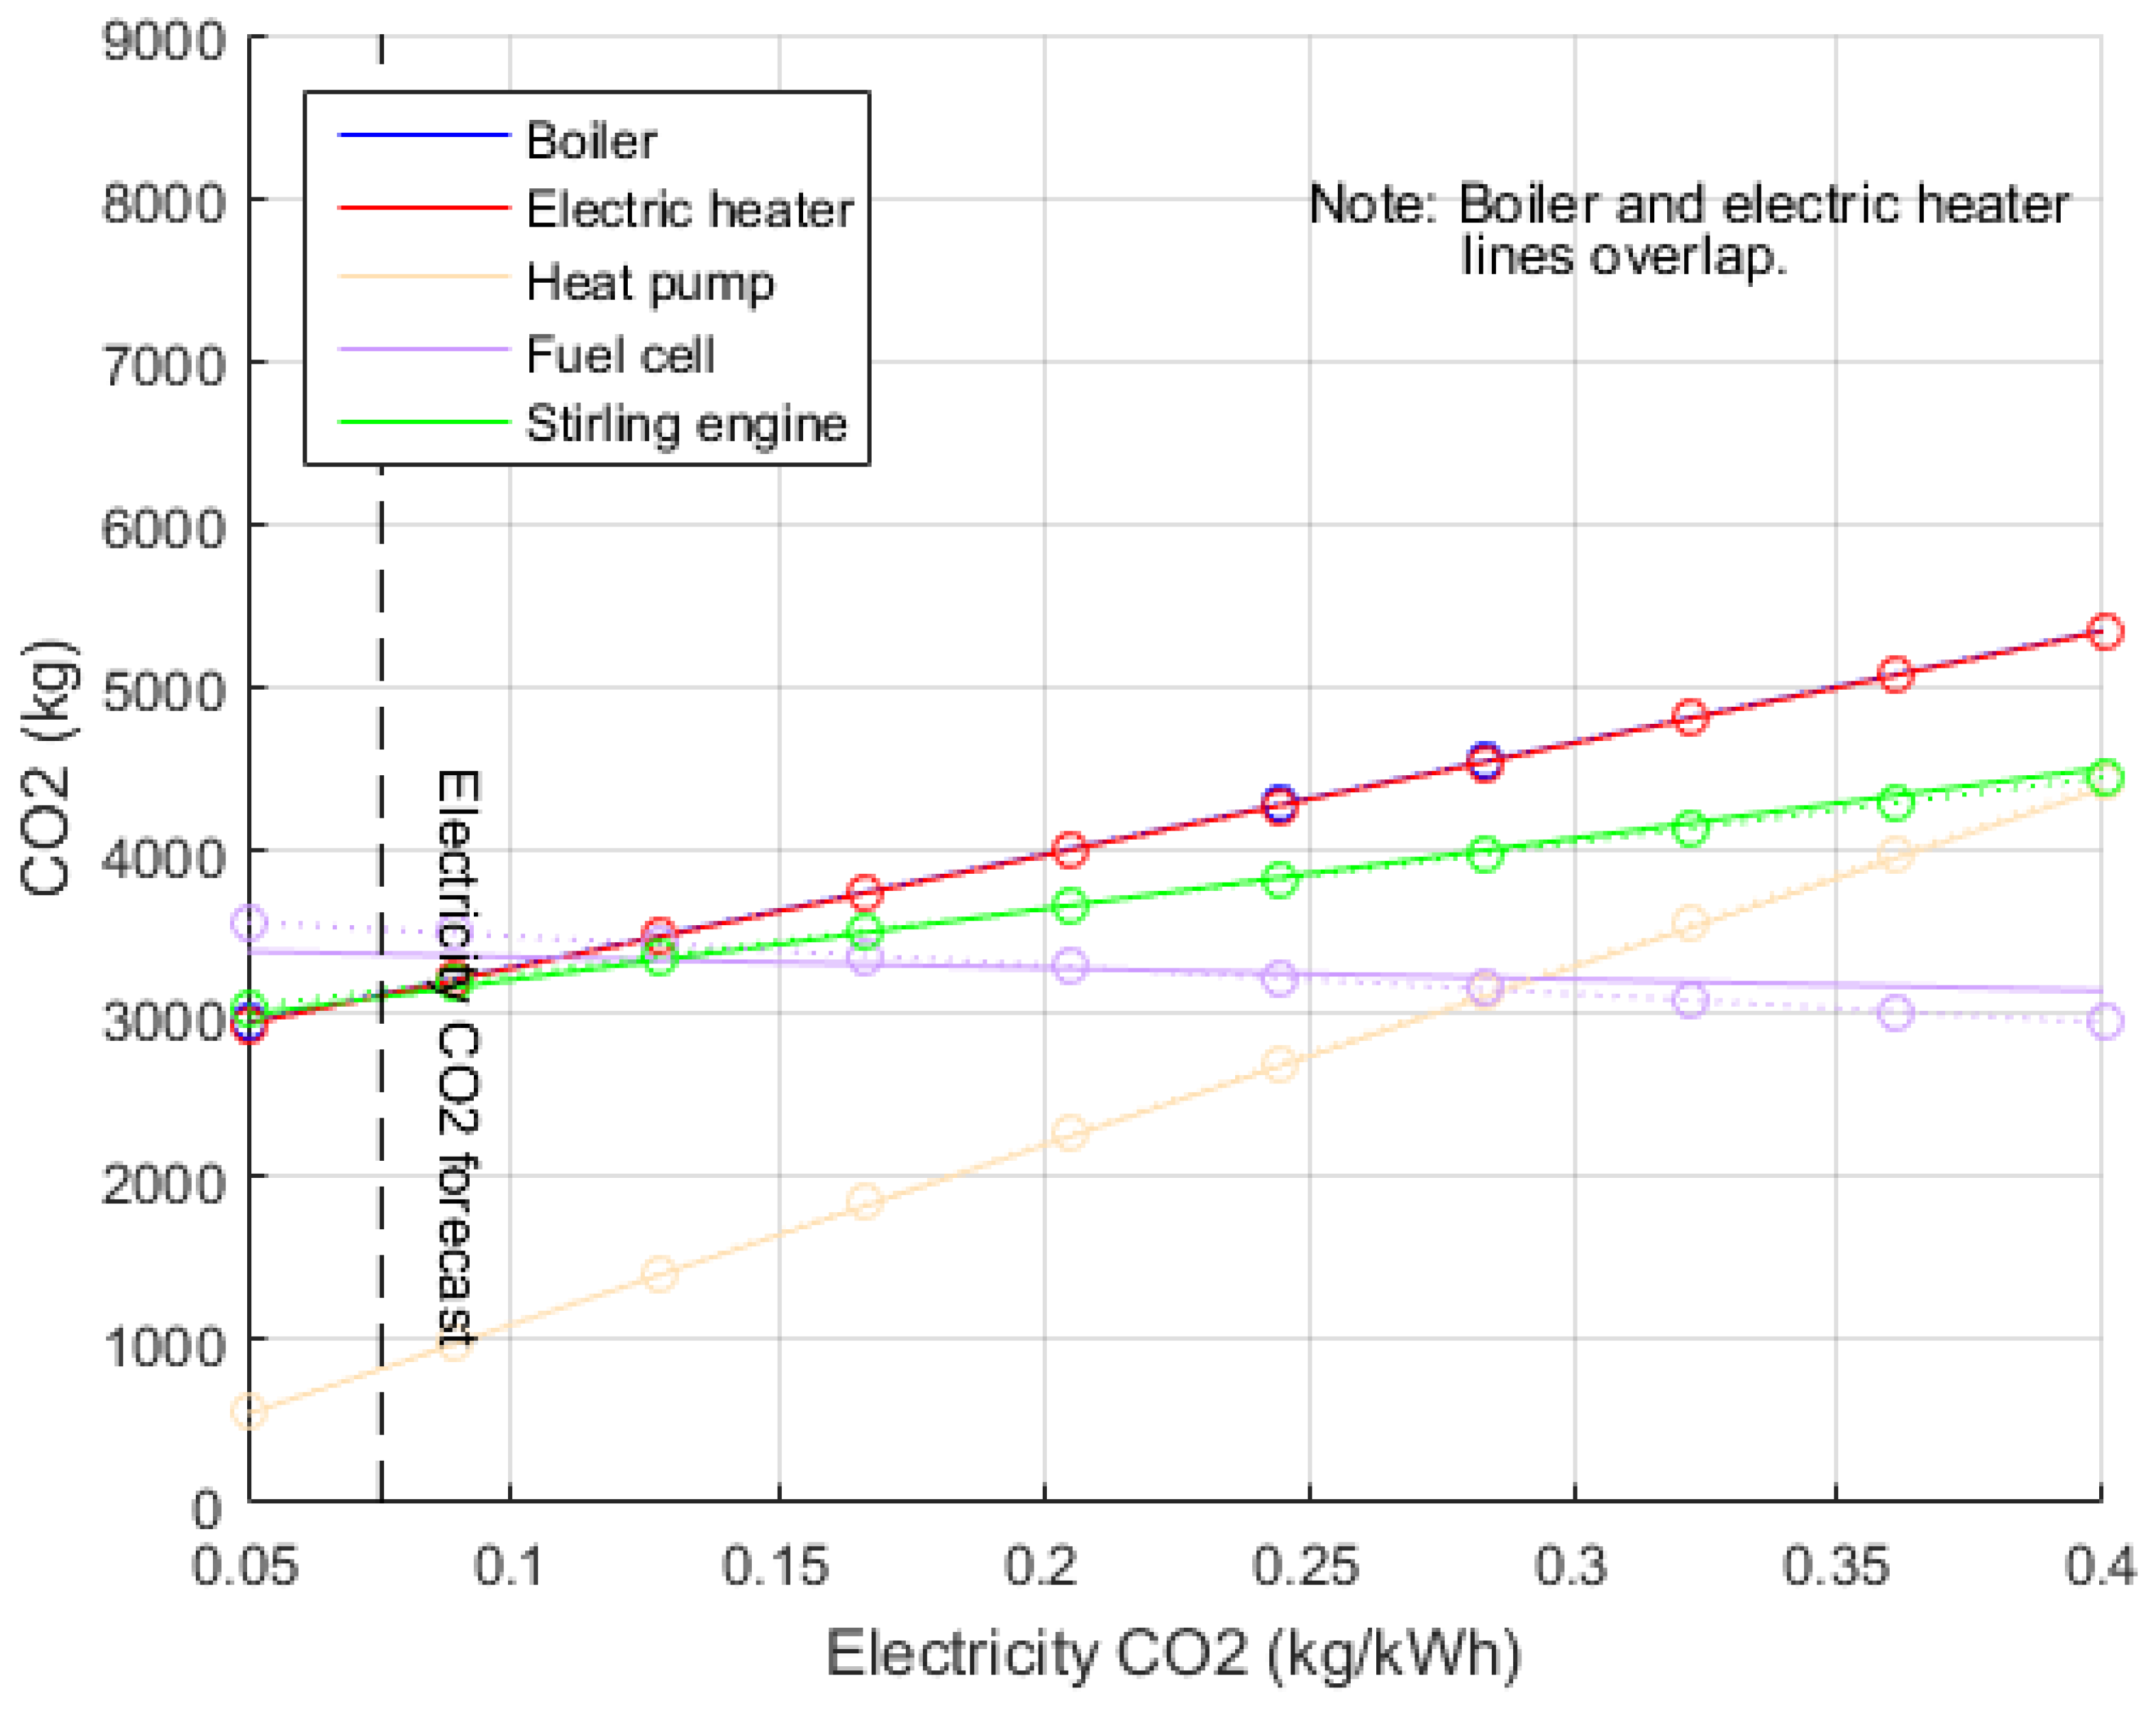
4.3.1. Emission Sensitivity
The impact of varying the carbon intensity of electricity grid on annual emissions of a typical medium sized house are shown in Figure 8. It can be seen that the forecast for the carbon intensity of the electricity grid is on the lower end due to the high penetration of low carbon sources.
It can be seen that the solid (short run) and dotted (long run) lines overlap in all cases other than the fuel cell. This is due to the fact that only the fuel cell displays significant change in operation when the electricity price regimes are changed. The boiler and electric heater overlap each other due to low utilization of the electric heater. The slope of the Stirling engine line is less steep in comparison to the boiler since the net emissions account for electricity export. The heat pump is the best performer until 0.28 kgCO2/kWh beyond which the fuel cell takes over as it gets more credit for on-site generation.
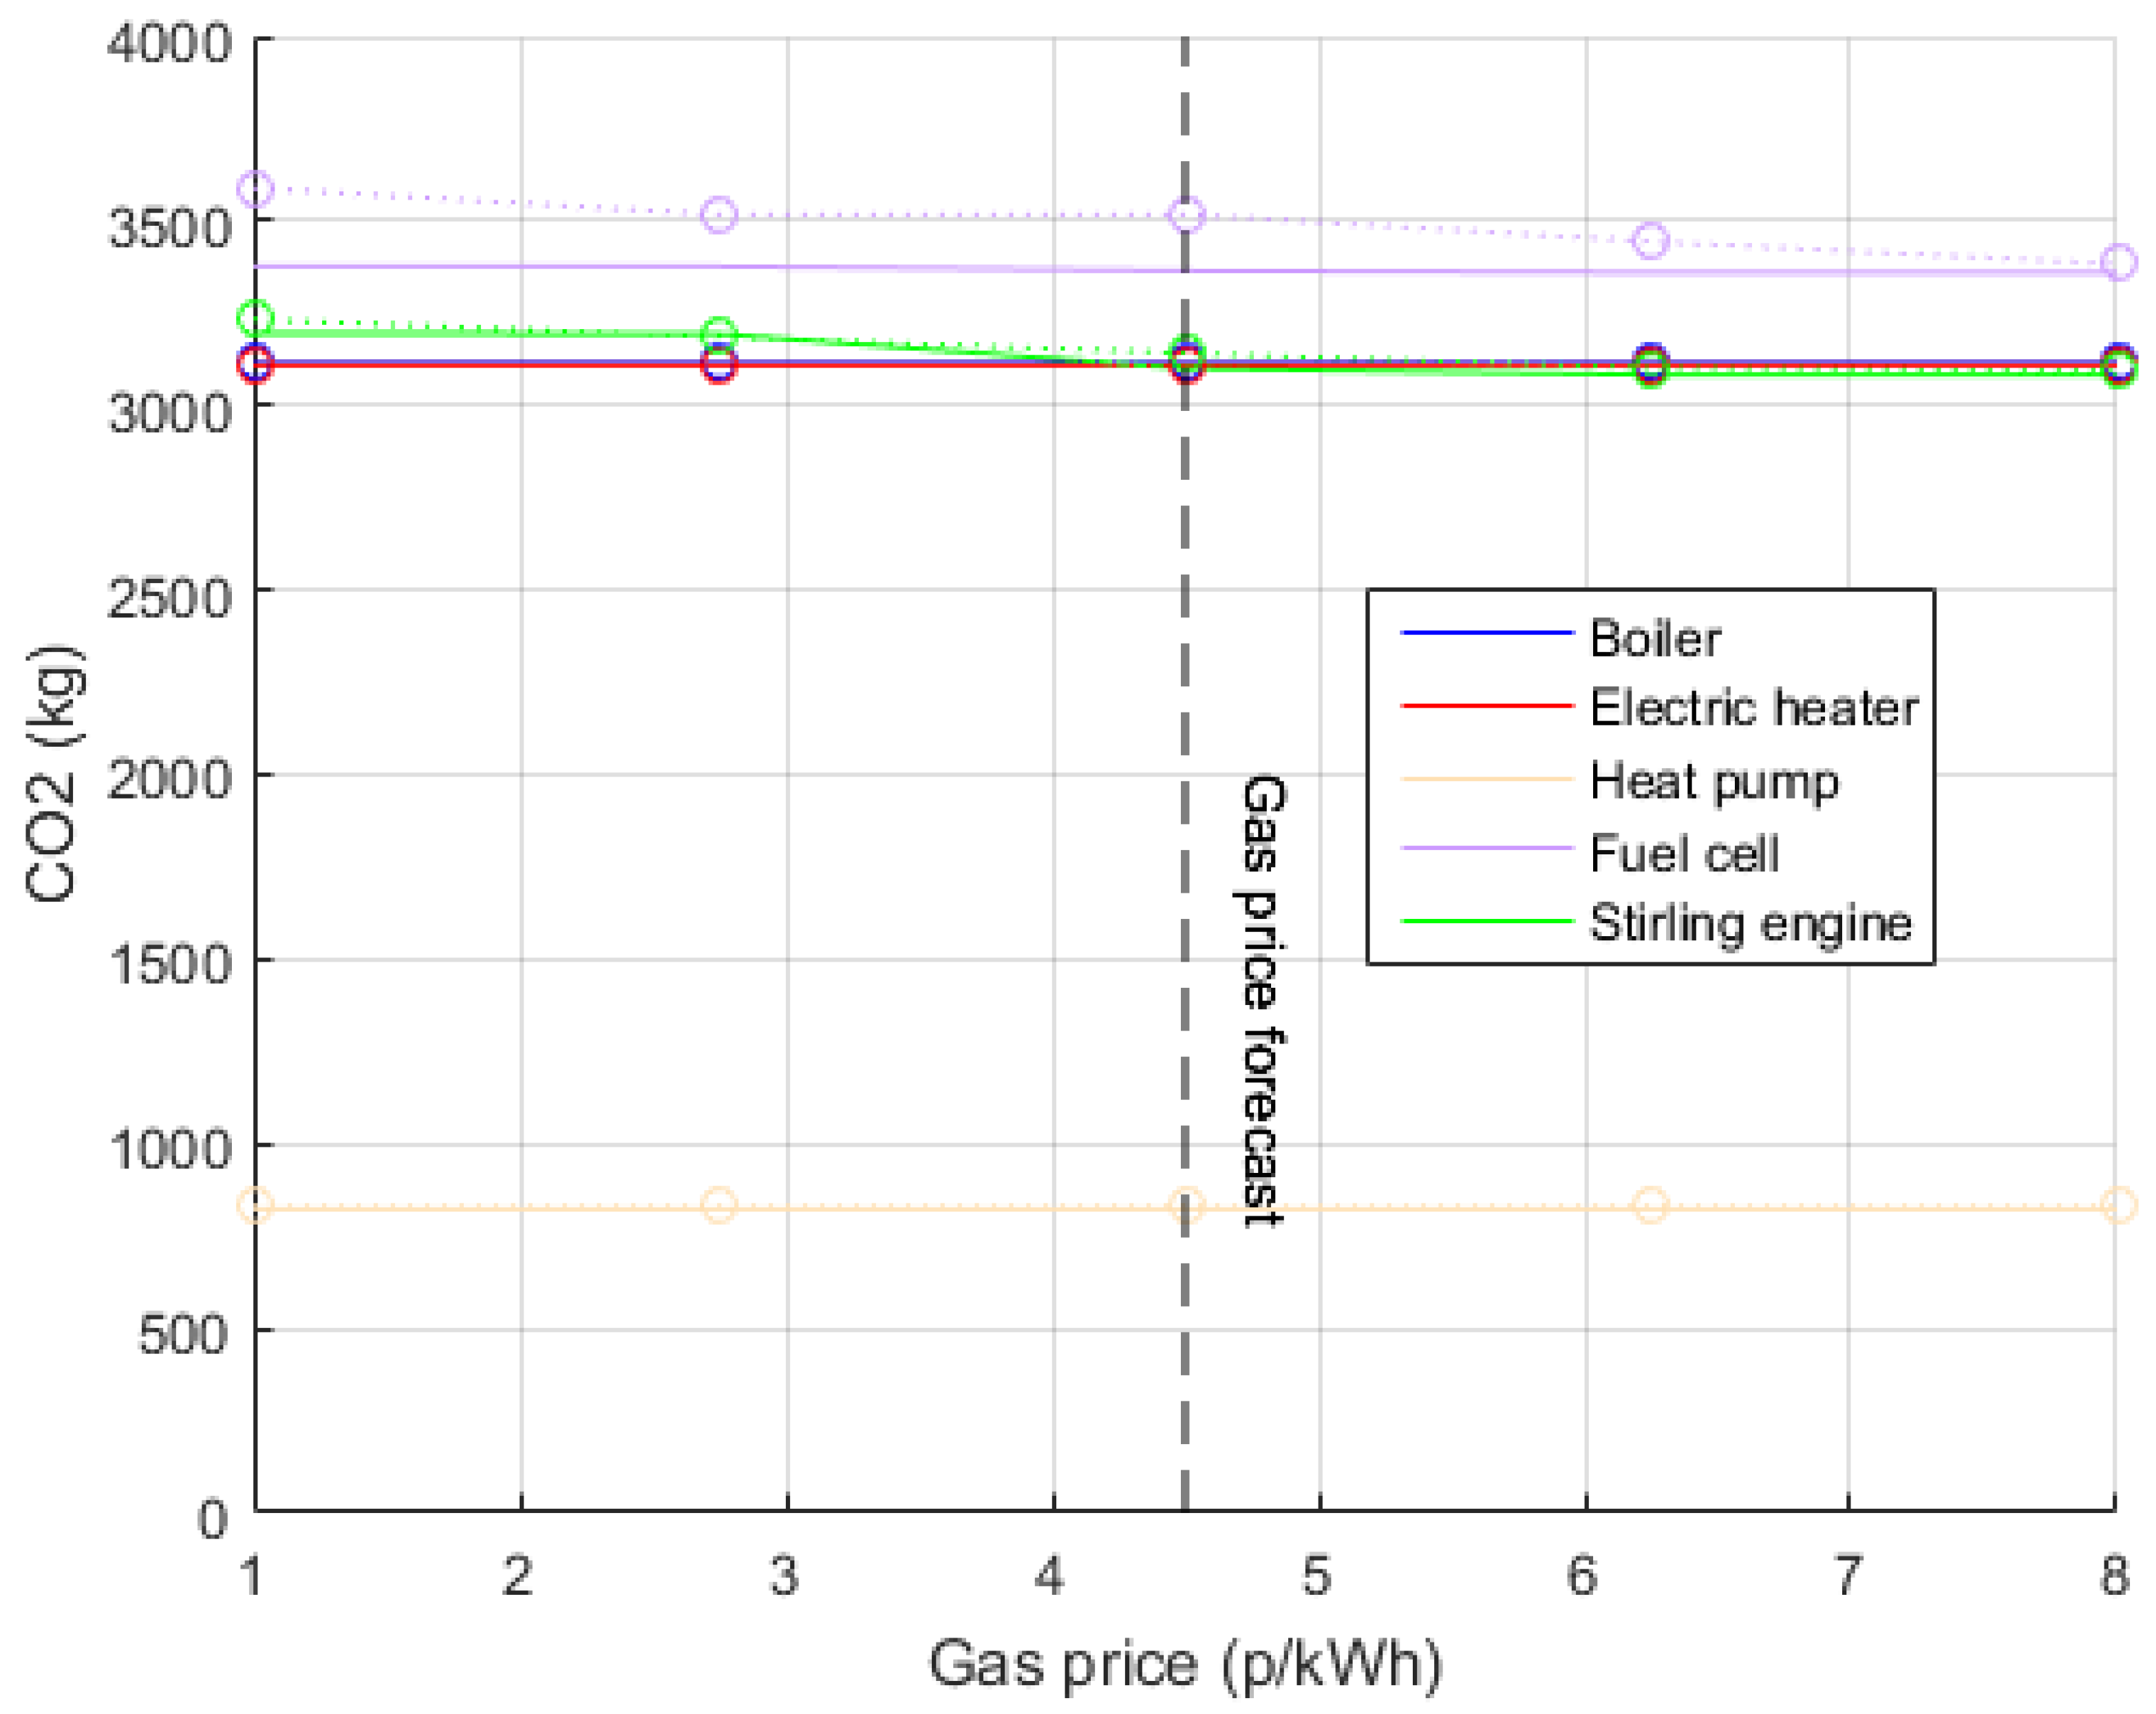
Another factor that has an indirect impact on annual emissions is the price of natural gas. This parameter has an effect on emissions since a change in gas prices results in a change in operation. Results of the sensitivity analysis are shown in Figure 9. As seen earlier, the difference between the regimes is only clear in the fuel cell case. Low utilization results in overlapping lines for the boiler, electric heater and Stirling engine at higher gas prices. Low gas prices leads to greater on site generation for both the fuel cell and Stirling engine causing an increase in emissions. The fuel cell tends to generate more in the long run regime to export electricity which further increases its emissions. Higher gas prices tend to decrease on-site generation, hence also decreasing emissions.
4.3.2. Equivalent Annual Cost Sensitivity
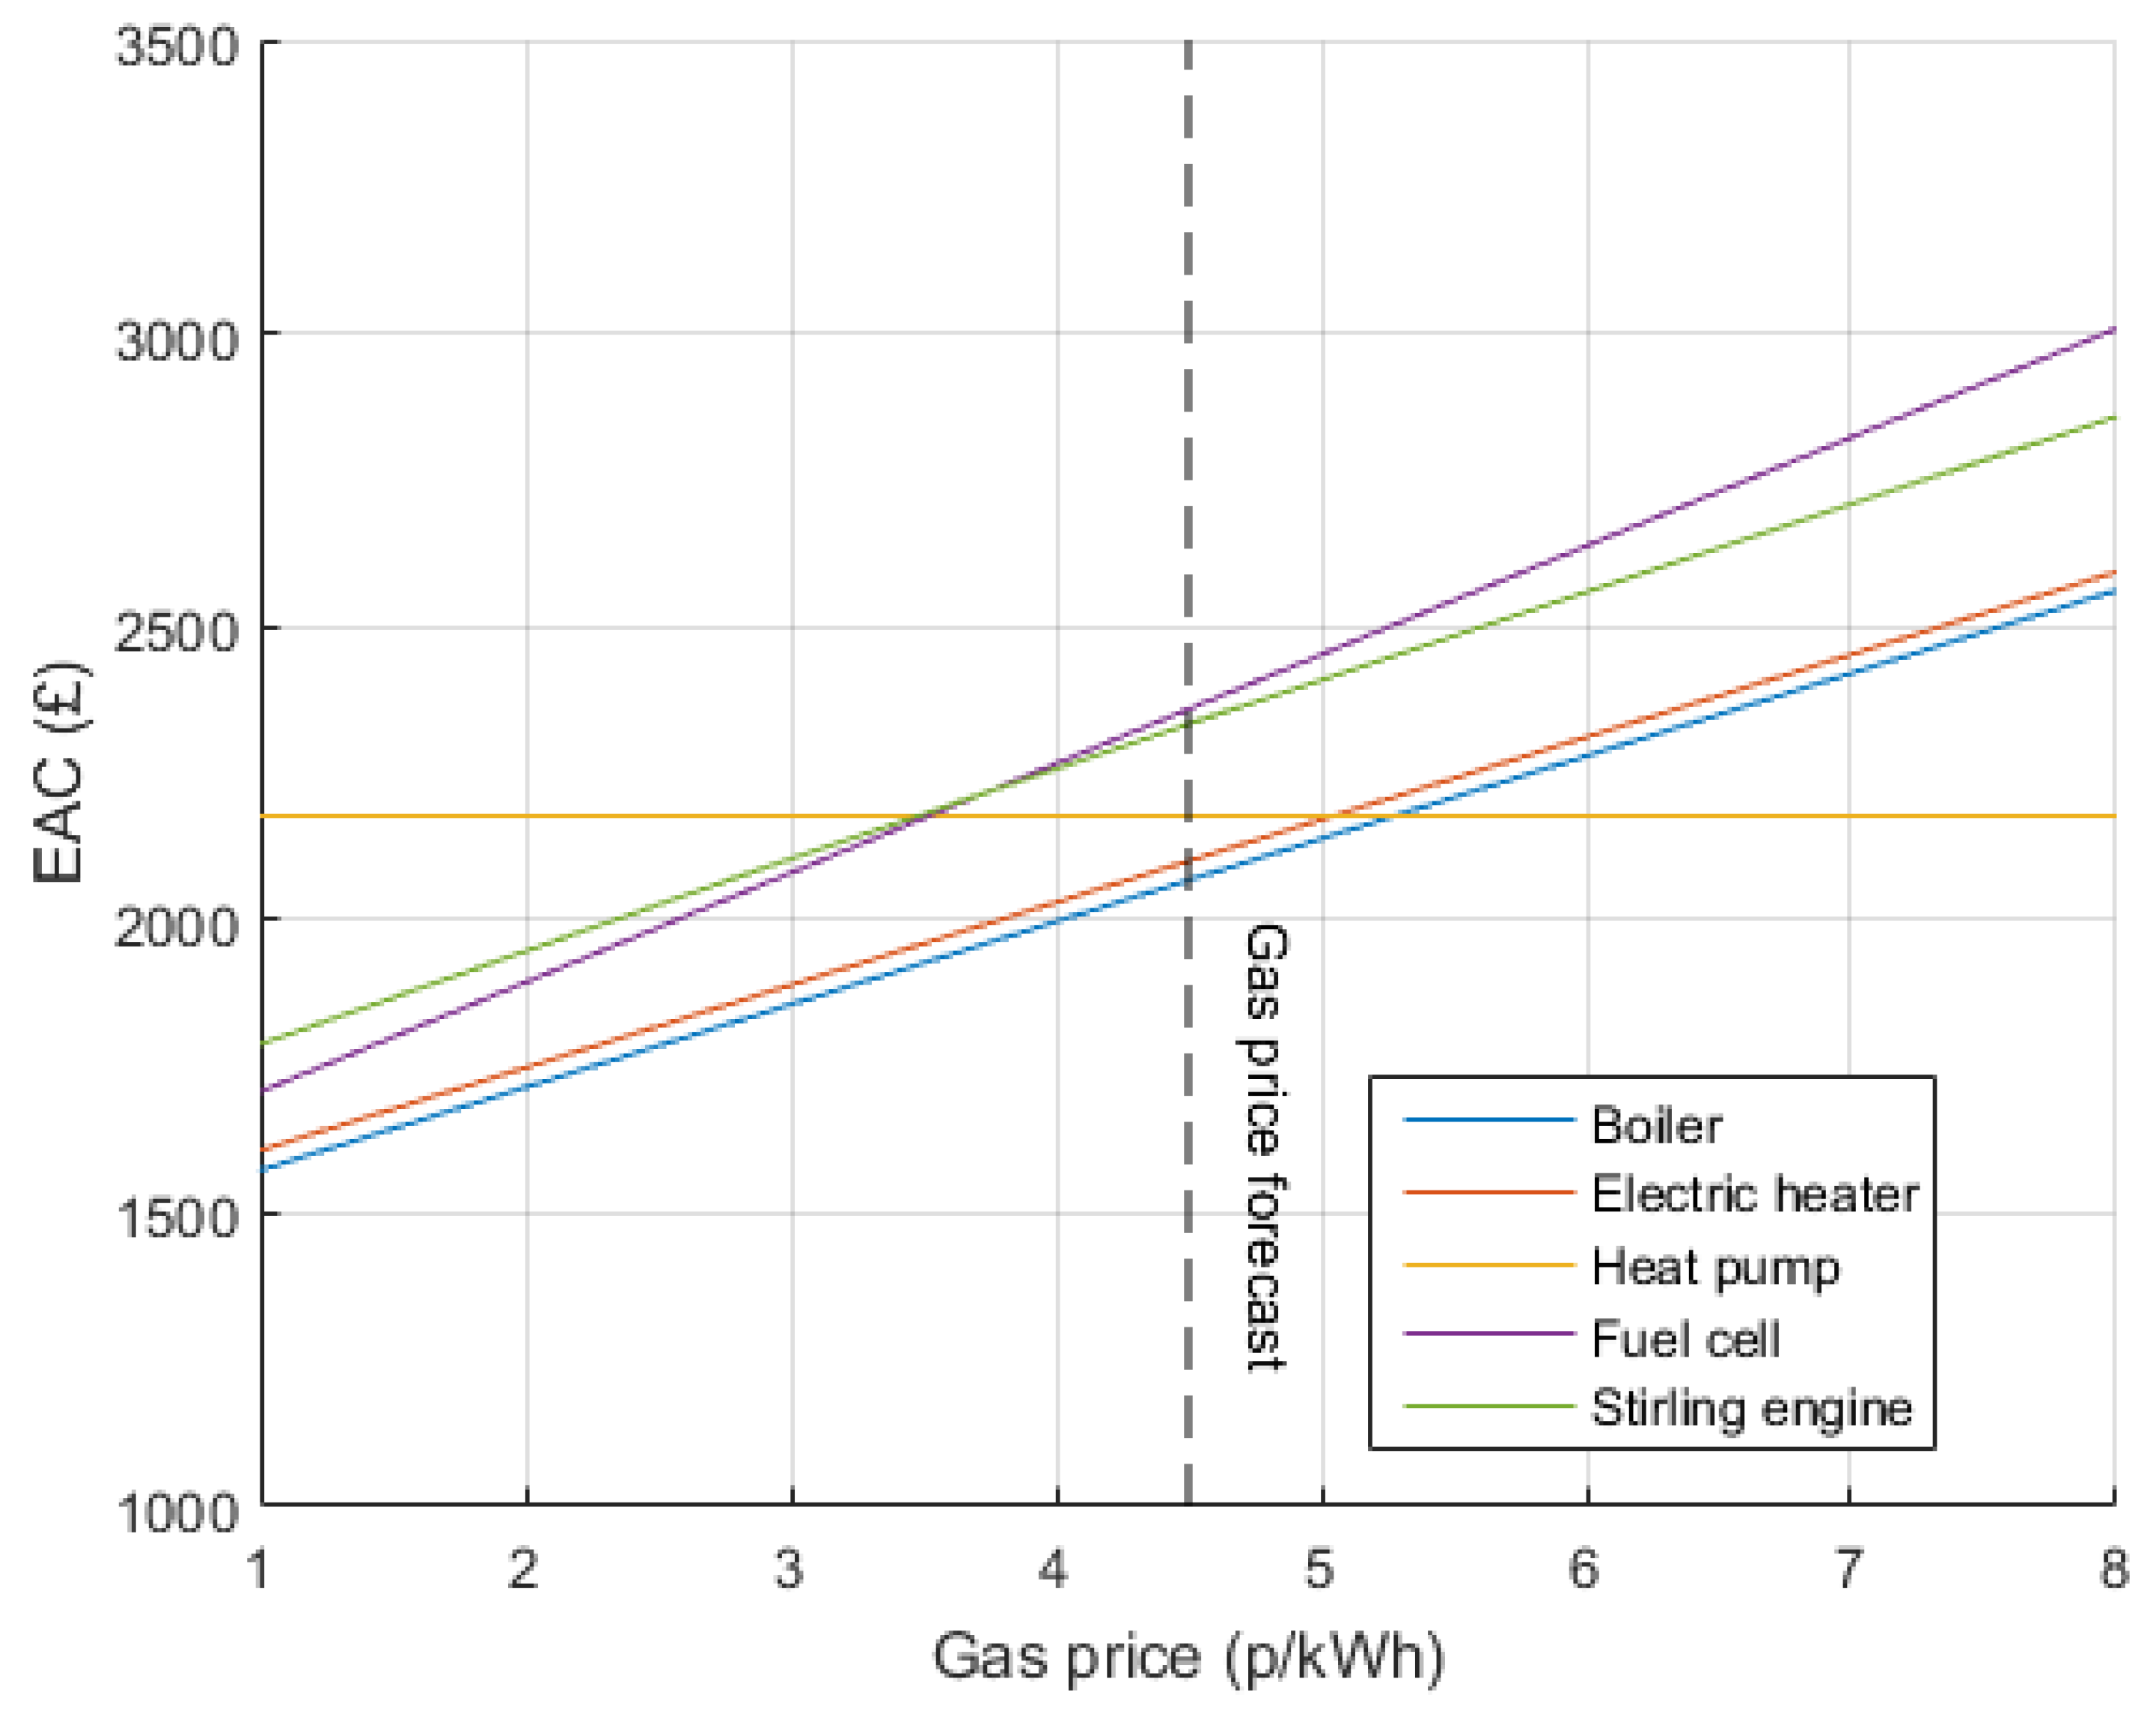
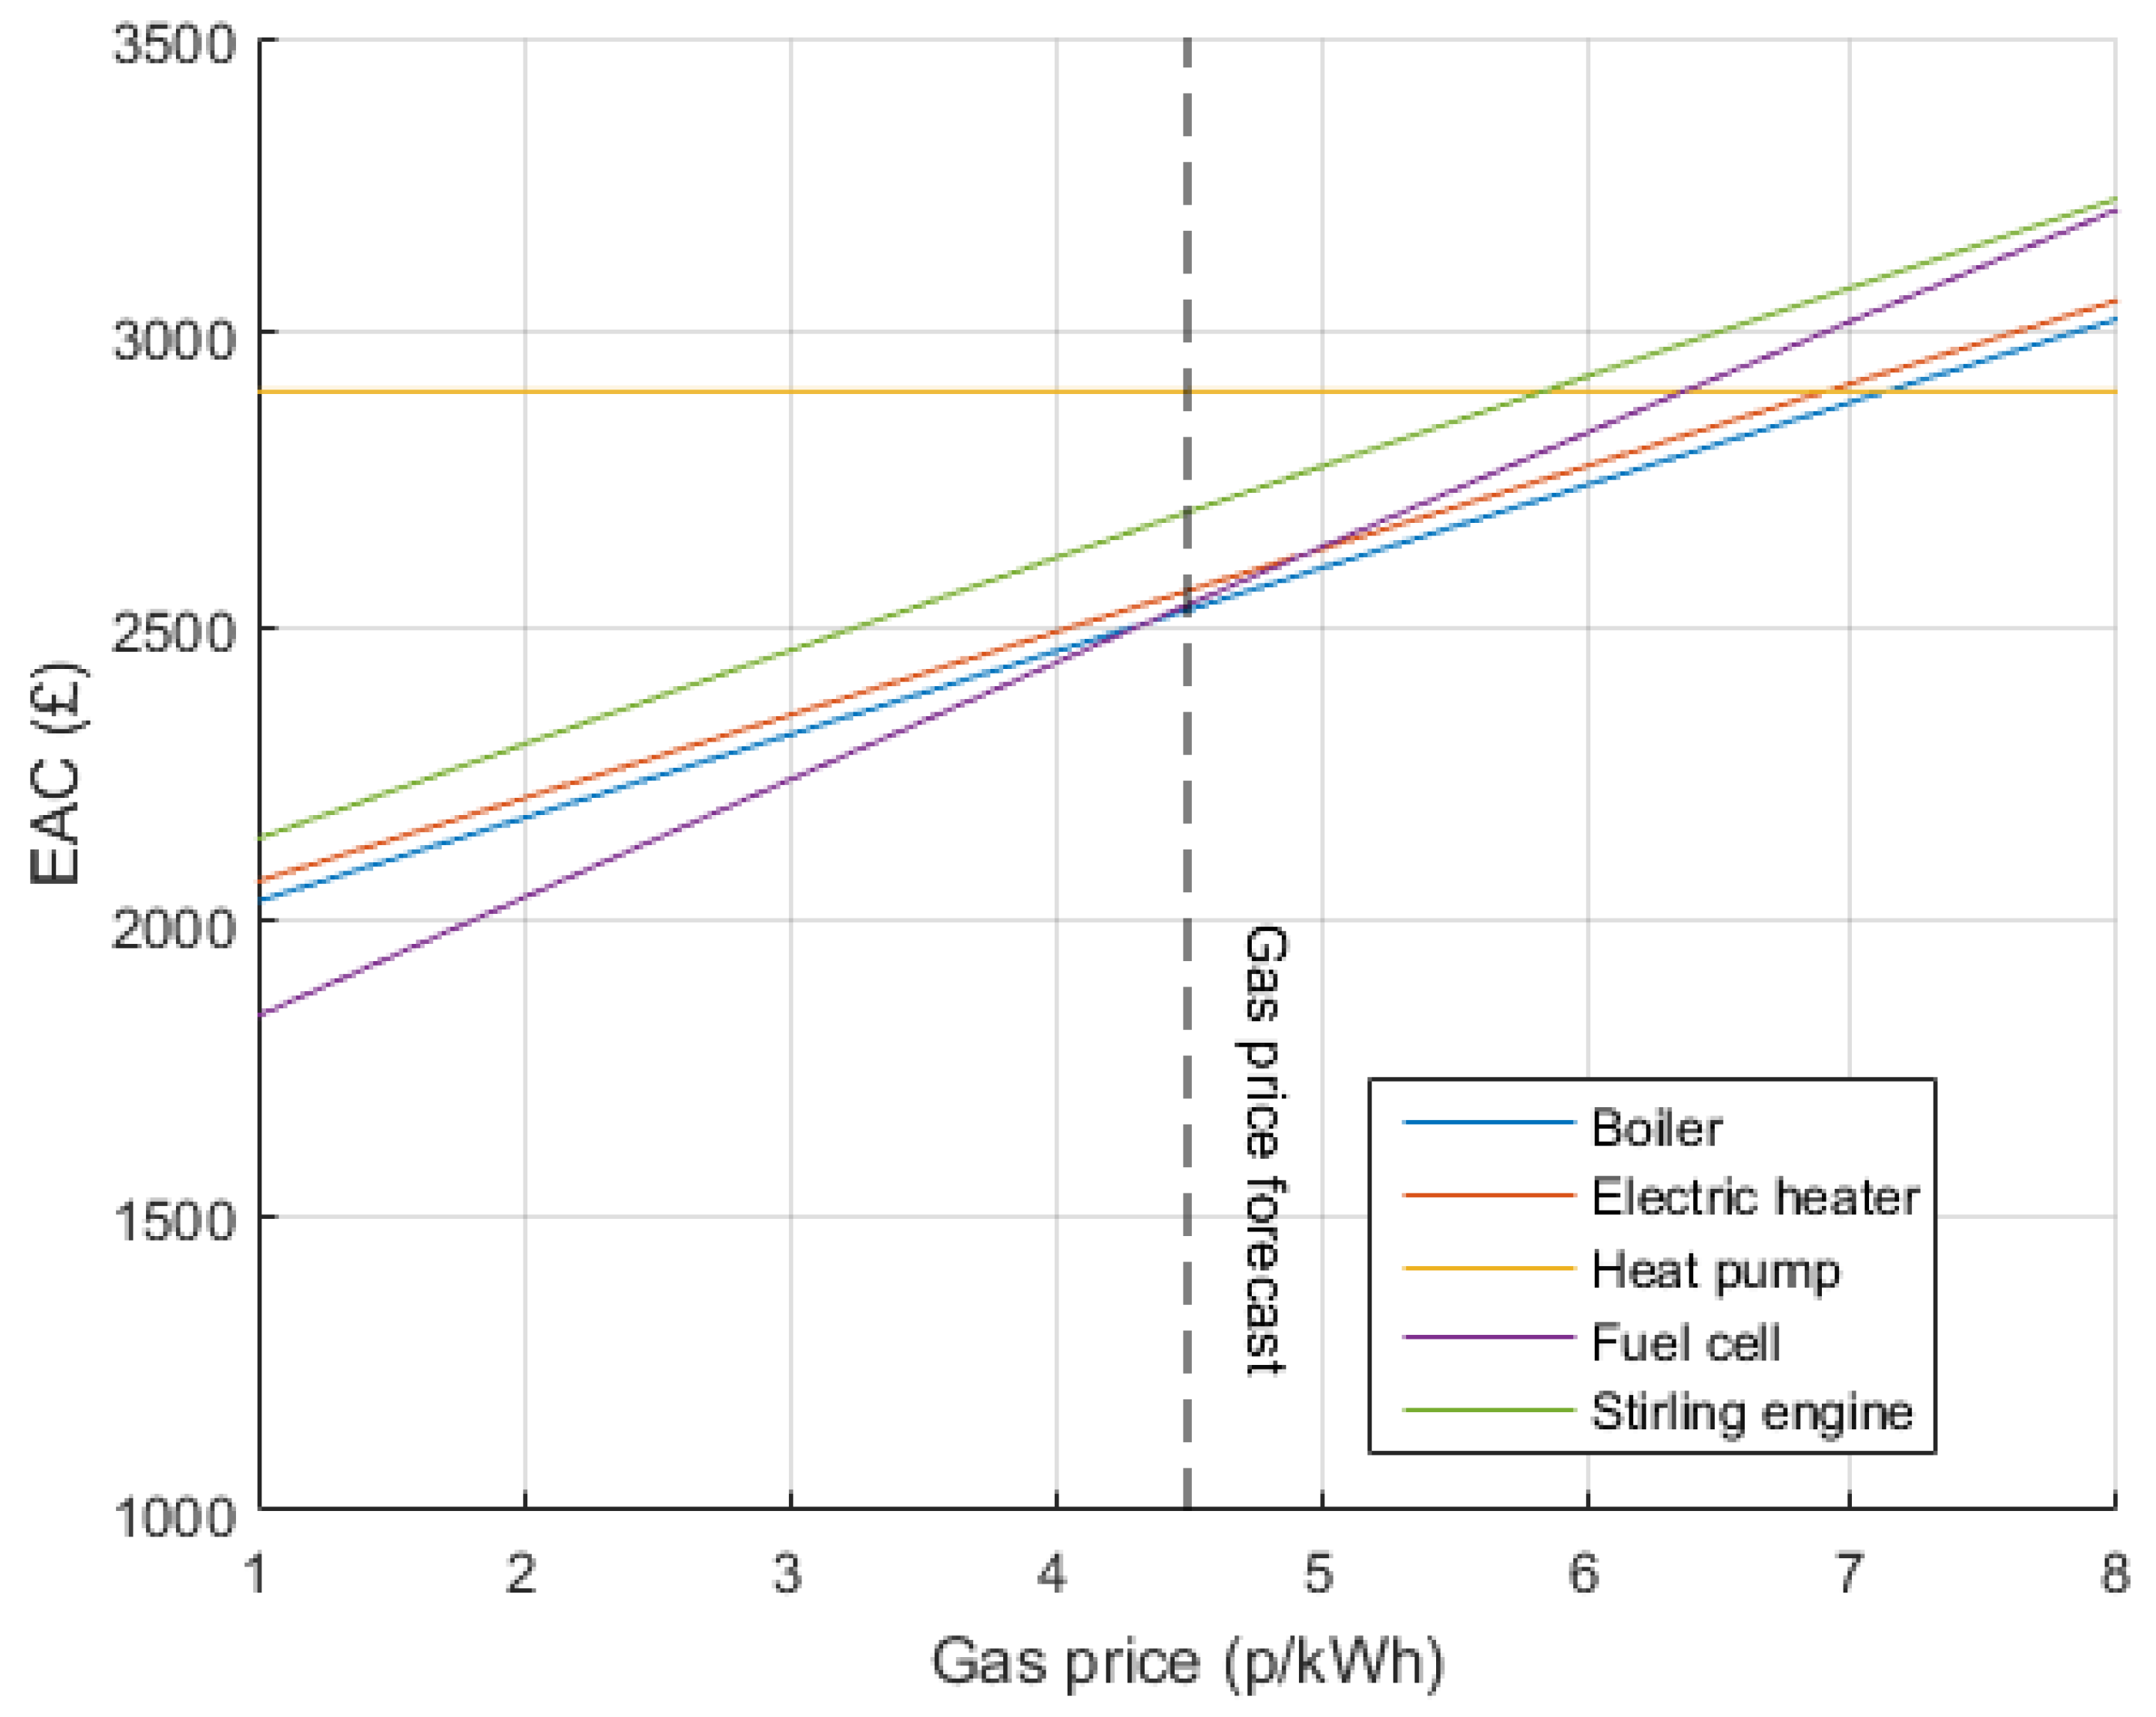
Natural gas price is very closely tied to the economic performance of the heating system. The changes in EAC under various natural gas prices are shown in Figure 10 and Figure 11. In general, the EACs of all technologies except the heat pump increase with an increase in natural gas prices. This is due to an increase in operational cost for all technologies using natural gas and a decrease in export revenue for micro CHPs. The EACs encountered in the long run regime are higher than those of the corresponding technologies in the short run regime. This can be attributed to higher electricity prices. The Stirling engine and electric heater are not viable for any of the natural gas prices considered in both regimes. The fuel cell is not viable in the short run regime but is found to be useful below a natural gas price of 4.25 p/kWh in the long run regime. This goes to show that export revenue plays a major role in the techno-economics of fuel cells in the long run regime. Export is not as attractive in the short run regime because of lower electricity prices. The inability of the Stirling engine to export much electricity impairs its economic case, even with low natural gas prices in the long run regime. The heat pump operation is not affected by natural gas prices. But its viability is tied to an increase in baseline cost due to an increase in natural gas price. This happens beyond approximately 5.25 p/kWh in the short run electricity price regime and beyond approximately 7.25 p/kWh in the long run electricity price regime.
4.3.3. Maximum Additional Capital Cost Sensitivity
The maximum additional capital cost that can be incurred to purchase an alternative technology (i.e., alternative to the conventional technology, a boiler) can be calculated by comparing the equivalent annual cost of the boiler baseline with the operational cost and revenue generated by the technology under consideration. This represents the additional annualised capital cost that could be paid for the alternative technology and still break even with the boiler only option.
The maximum allowable capital cost values for all technologies are shown in Figure 12. It is clear that the heat pump is better suited for the short run regime and micro-CHP is better suited for the long run regime. This can be inferred from the fact that the solid lines representing the long run regime are above the dotted ones representing the short run regime in the case of the fuel cell and Stirling engine. The inverse is true for the heat pump with the dotted line appearing above the solid one. The solid line in the heat pump is even below zero for natural gas prices below 2.5 p/kWh. This means that heat pumps would not be viable in the long run regime even if they were distributed for free in these cases. High natural gas prices work in favour of heat pumps by pushing up the baseline costs and drive allowable capital costs above the forecast beyond 5.5 p/kWh in the short run regime and beyond 7.25 p/kWh in the long run regime. Micro-CHP utilization is higher under the long run regime and hence produces larger allowable capital cost values. The maximum allowable capital cost of a fuel cell in the long run regime is above the forecast when natural gas prices are low. But the same is not true beyond 4.5 p/kWh in the long run regime and not at all in the short run regime. The allowable capital cost for the Stirling engine is below the forecast under both electricity price regimes.
4.3.4. Engineering Design Parameters
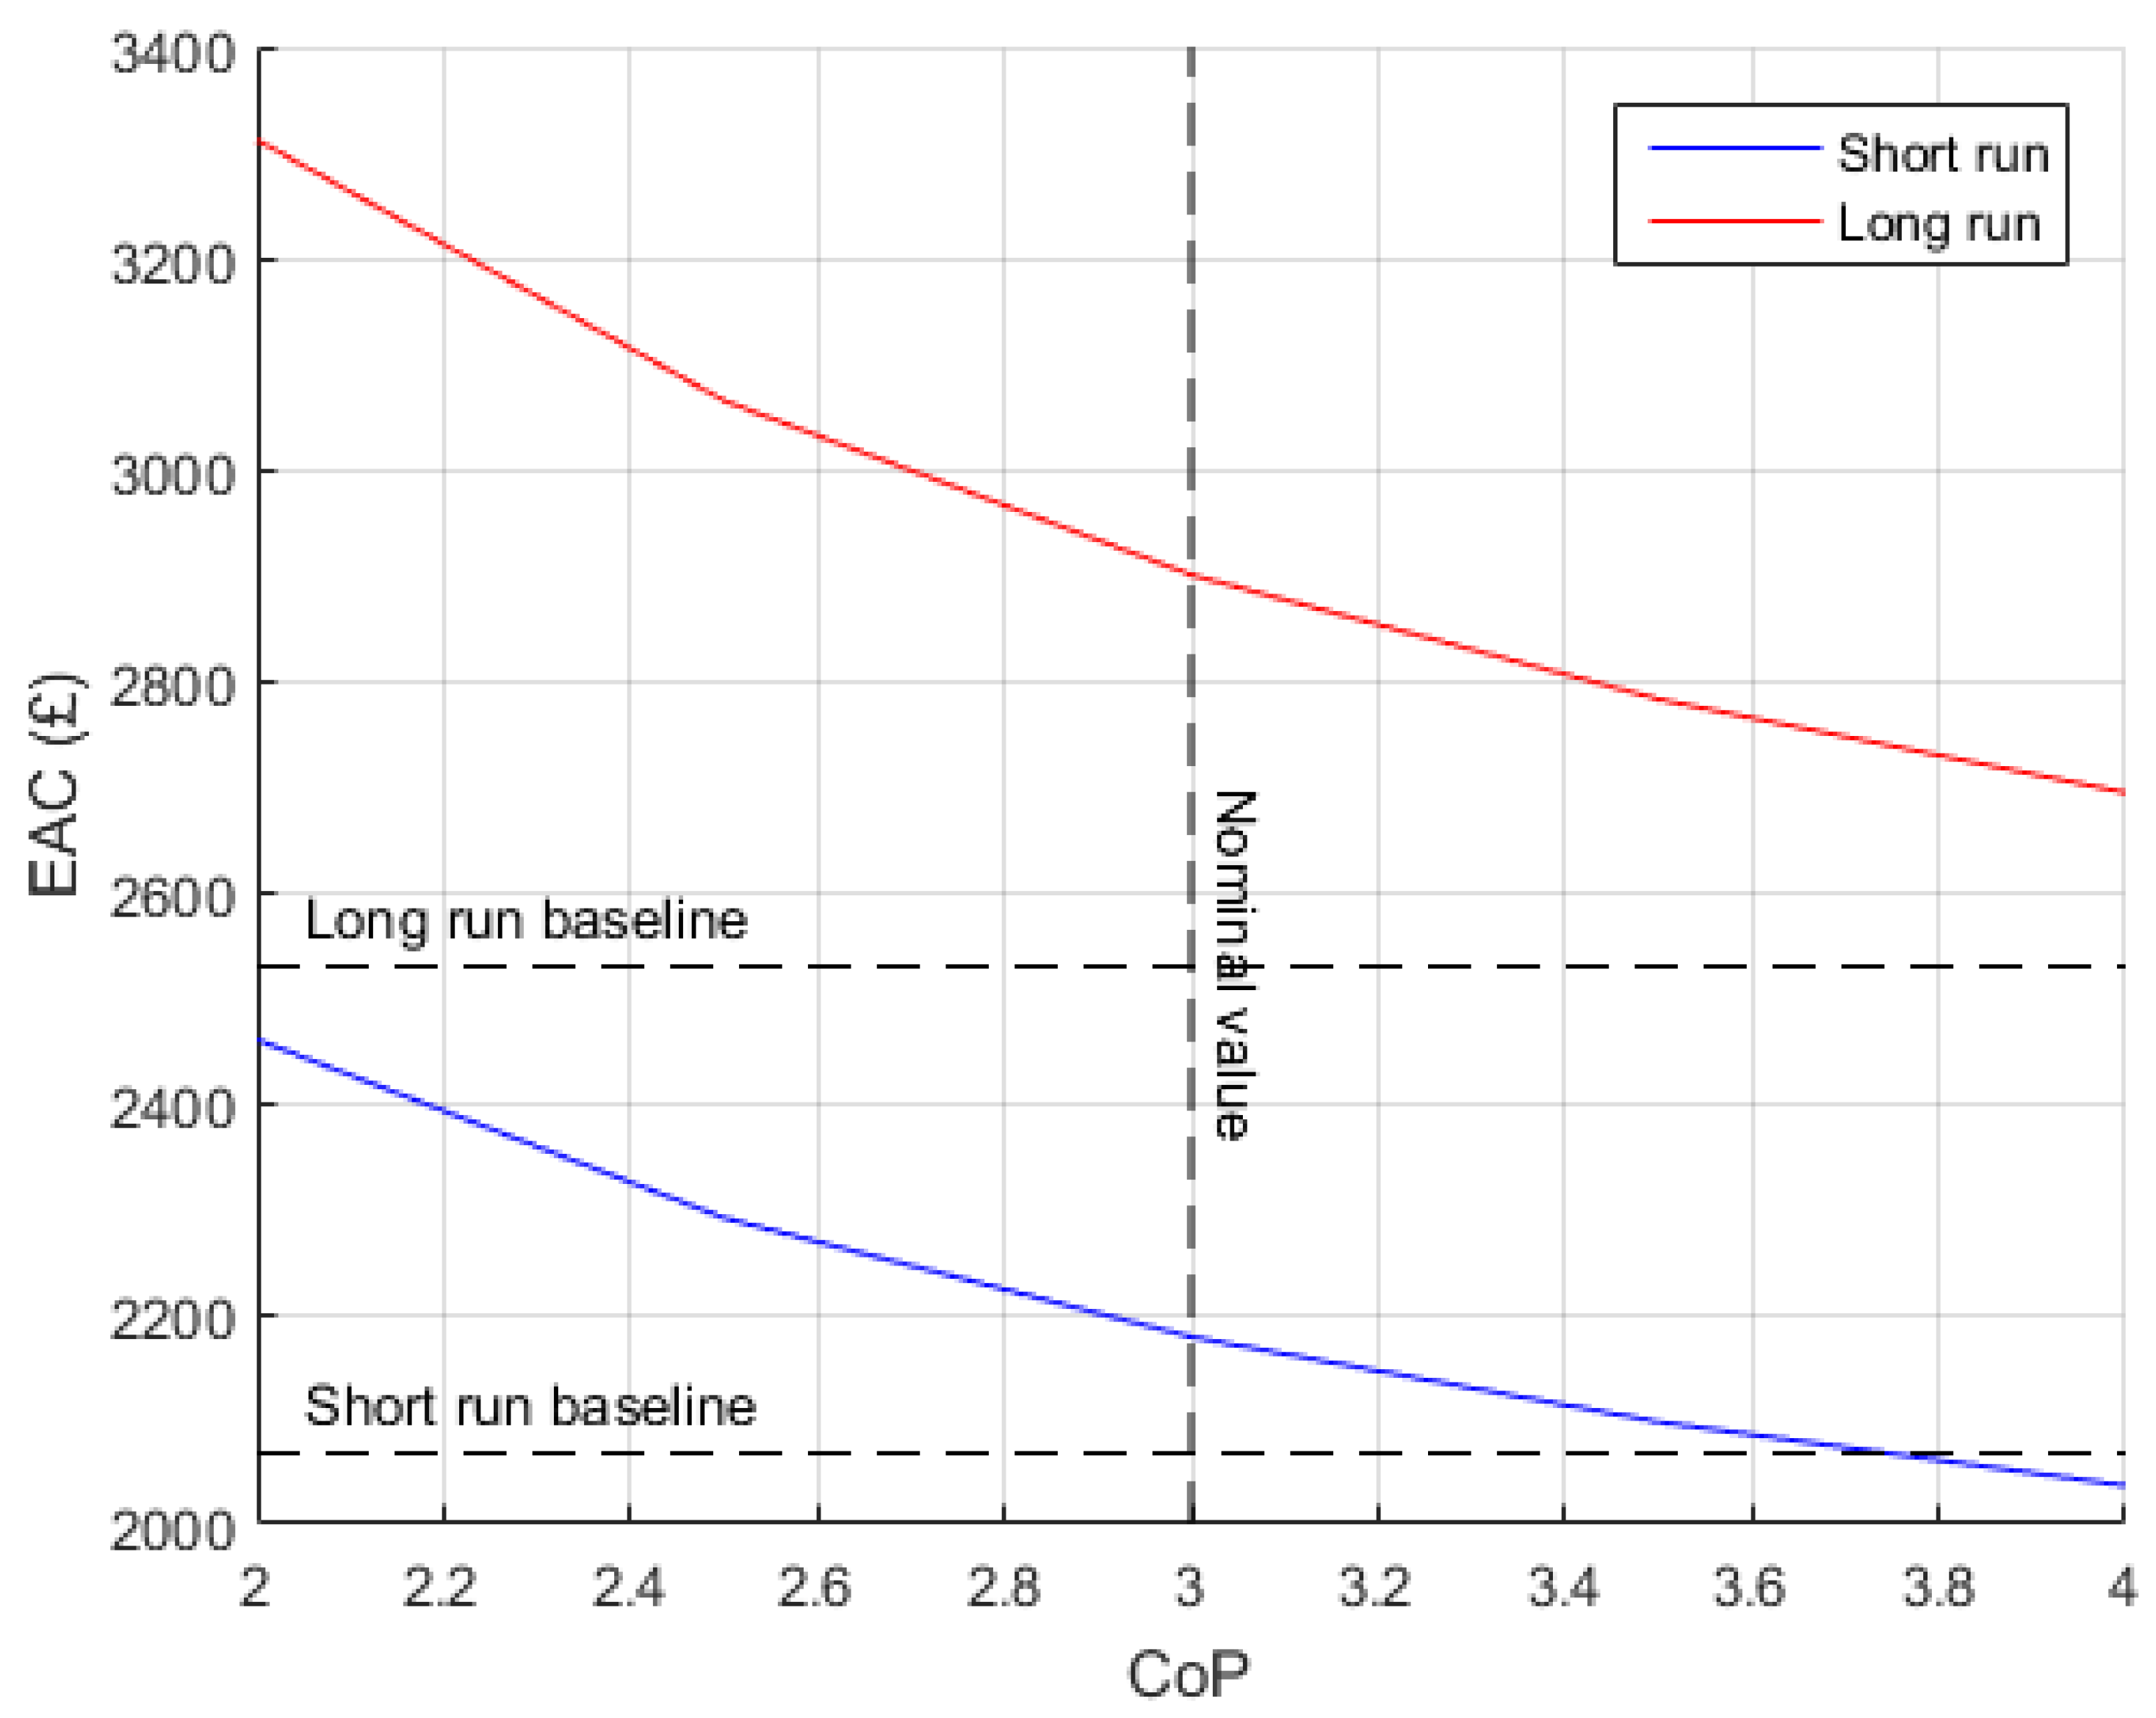
EAC and emissions are also linked to parameters such as Coefficient of Performance (CoP) and efficiency. Hence this section is devoted to quantifying the effect of variation in these parameters on economic and environmental performance. Figure 13 and Figure 14 show that impact of heat pump design on economic performance is larger than environmental performance. Increase in CoP results in a reduction in electricity imported. This leads to a greater decrease in EAC than emissions since the emissions associated with grid electricity is a low value. The heat pump is not economically viable for any of the CoP values considered except when CoP approaches four in the short run regime.
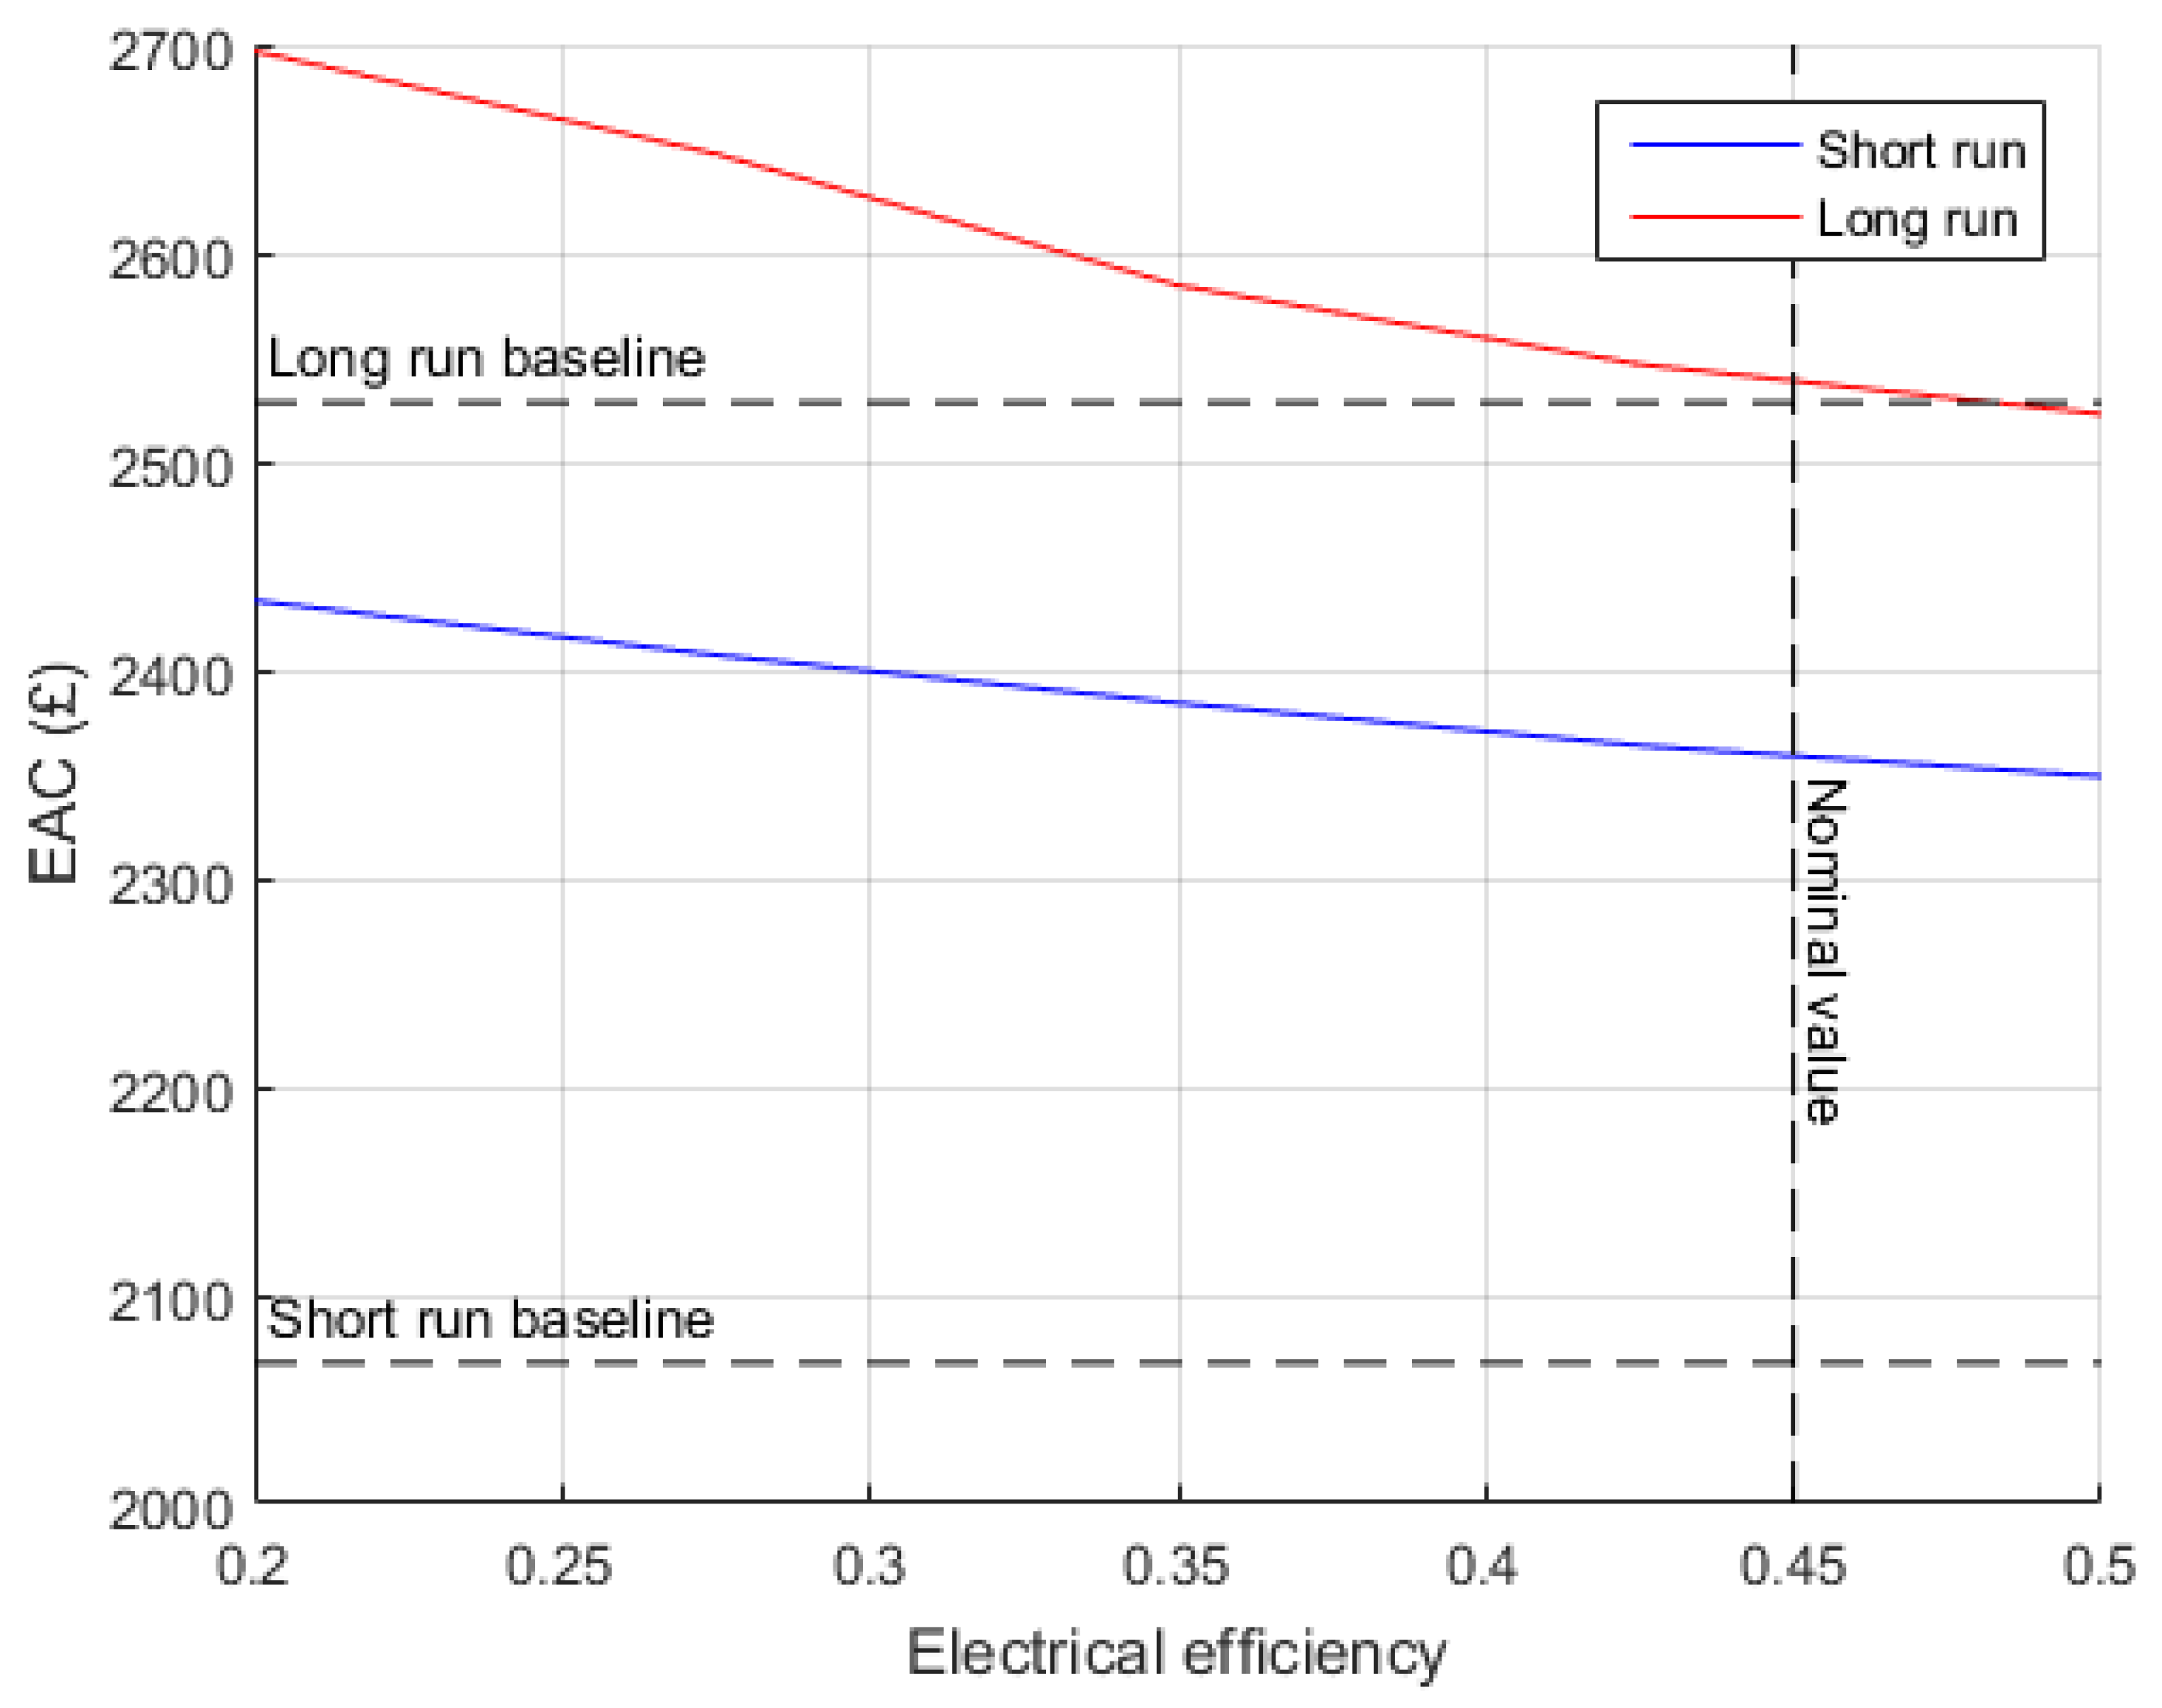
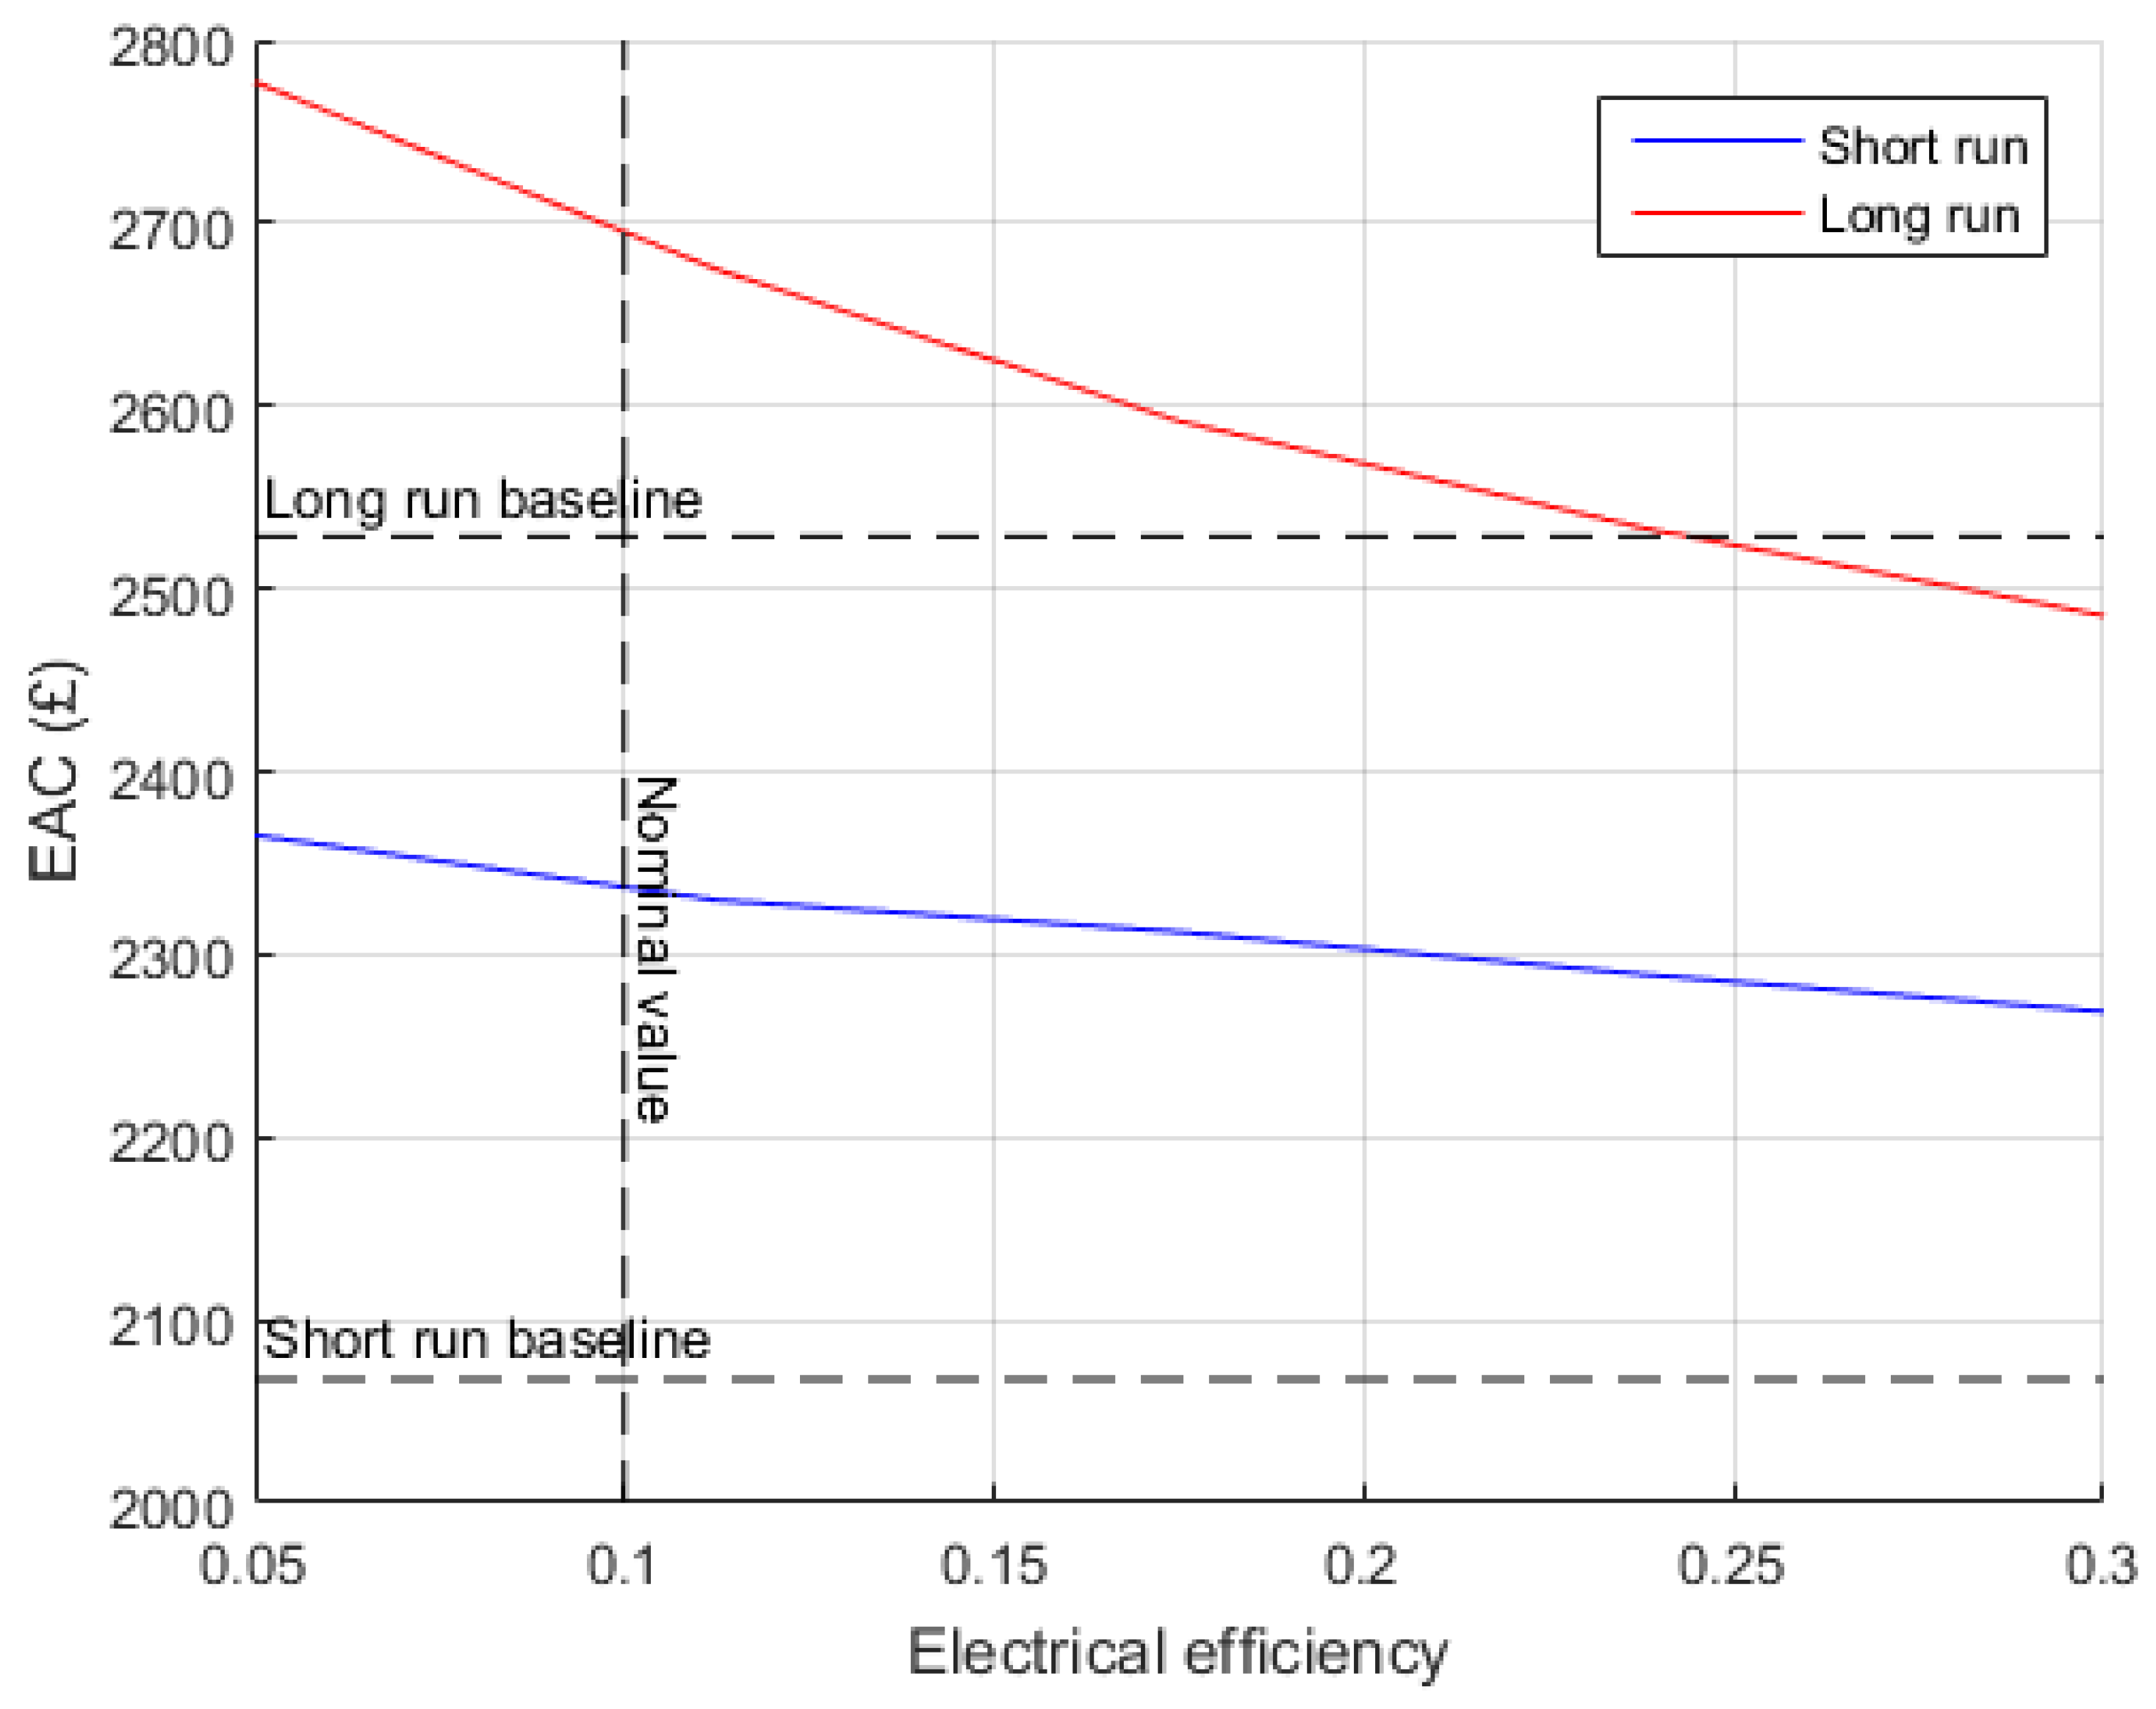
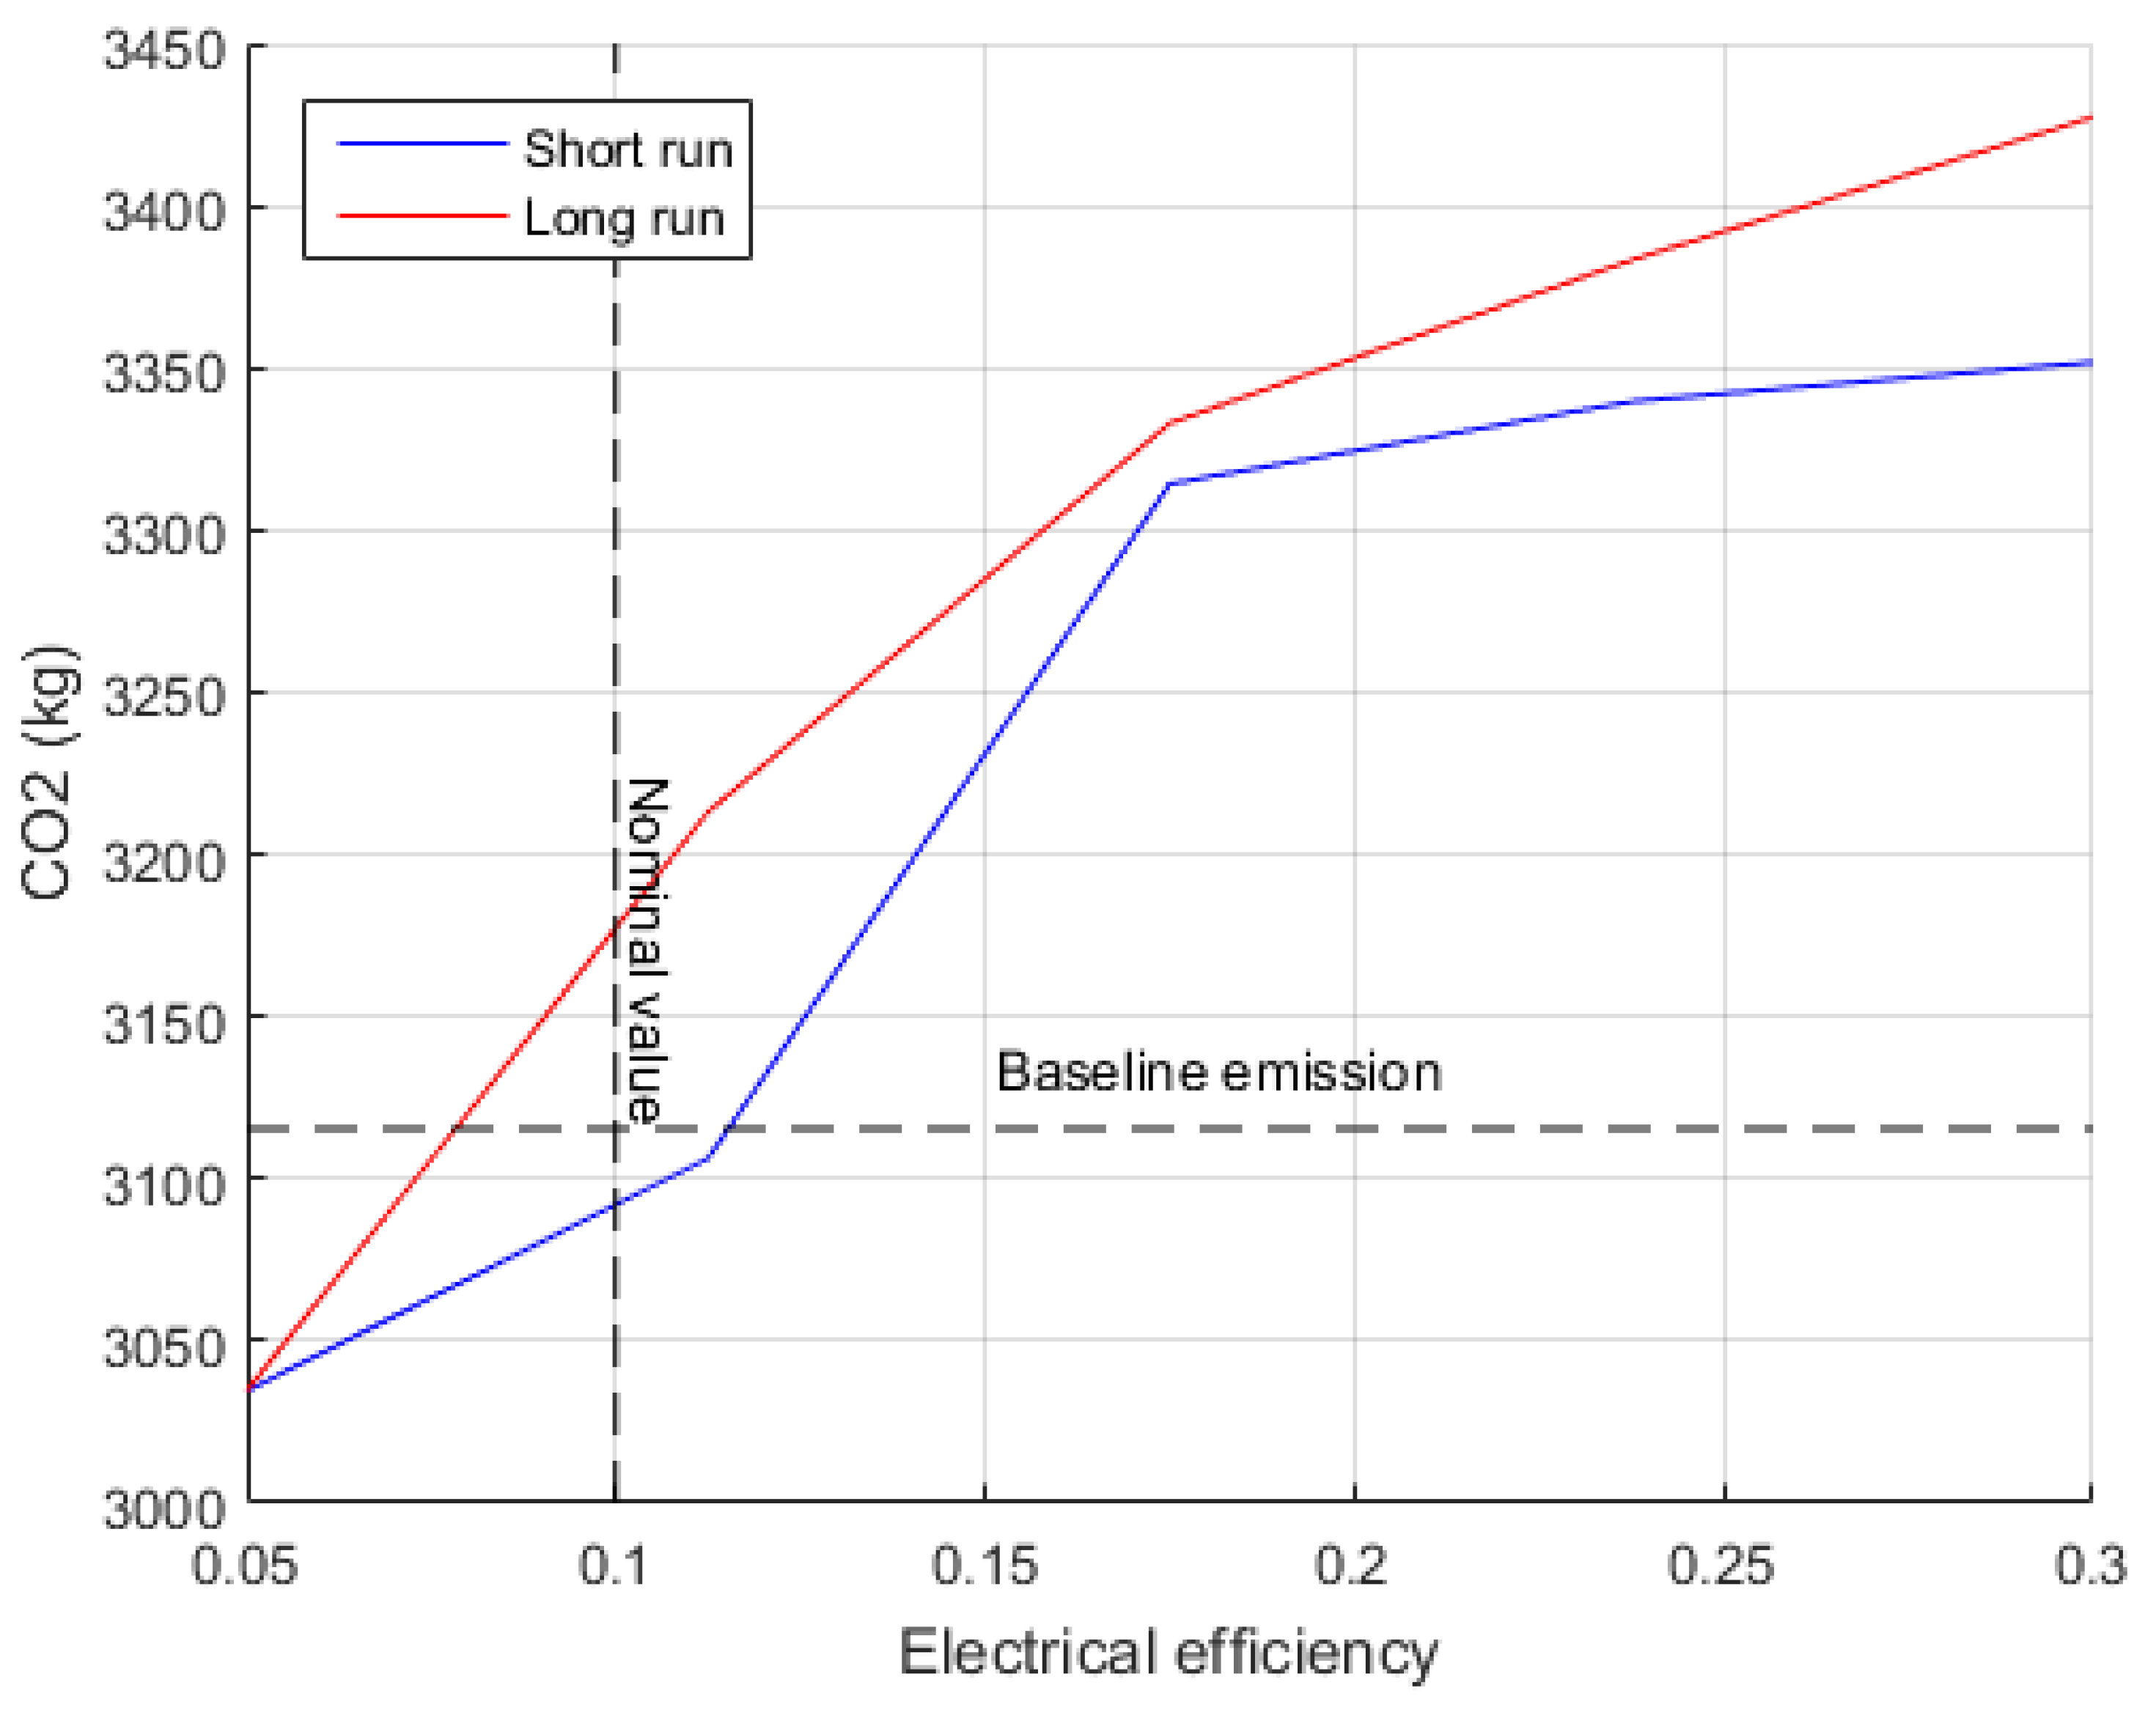
A similar analysis for micro-CHP units involves the variation of electrical efficiency. The overall efficiency is kept constant at 90%. The results are shown in Figure 15, Figure 16, Figure 17 and Figure 18.
The trends shown are similar for both fuel cell and Stirling engine. As electrical efficiency increases, EAC decreases and carbon emission increases. As the electrical efficiency increases, the heat to power ratio decreases allowing the micro-CHP to serve a larger portion of demand in the house. An increase in utilization results in a corresponding increase in the savings and natural gas consumption explaining the patterns seen in Figure 15, Figure 16, Figure 17 and Figure 18.
5. Conclusions
In this paper a novel modelling approach to analysing the impact of power system decarbonisation on the techno-economics of low carbon heating systems has been presented. Since high penetration of low carbon sources in the electricity system is seen to weaken the economic case for investment in generation capacity, an electricity regime based on long run costs instead of short run costs is introduced. In addition to this an optimization model that determines operating strategies to handle time varying electricity prices and energy balance of thermal energy storage is also discussed. The different sections come together to evaluate technology viability in a future scenario with high penetration of solar, wind and nuclear sources.
The different heating technologies considered are quite similar in terms of annualised cost effectiveness even with optimal operating strategies. Success is likely to be driven by evolution of market conditions, the carbon intensity of the central grid and design improvements in technologies, all of which have been covered in the sensitivity studies. Fuel cells show the most potential under the long run electricity price regime and heat pumps show the most potential under the short run electricity price regime. Technology adoption may also be influenced by factors not central to economic or environmental performance such as perceived comfort and relative inconvenience of installation. Such factors are beyond the scope of this article and are flagged as directions for future research.
The energy requirement of small and medium houses are not sufficient to warrant the installation of new technologies. The savings in operational cost begins to add value for the consumer only when the technologies are installed in dwellings with high values of annual heat demand.
If carbon abatement is the top priority, heat pumps outperform all other options considered in this paper. However, their economic case is weakened by high capital costs, or by the higher electricity prices observed in the long run electricity pricing regime. Therefore, achieving deep reductions in residential space heating emissions will likely require stronger policy instruments in the medium term; the non-traded carbon price forecast at the time of writing is not sufficient.
Overall it is evident from the results that the best performing heating technology in the future is closely tied to the electricity price regime. The means the electricity market arrangements that determine how price is formed for the consumer will have a significant impact on heating techno-economics. The model described here is a useful tool to evaluate heating systems of the future from the consumer perspective.
Supplementary Materials
The Supplementary Materials are available online at www.mdpi.com/1996-1073/10/11/1915/s1.
Acknowledgments
The authors would like to thank Airbus Group Innovations for providing financial support over the course of this project. Support was also provided by EPSRC via the FITS-LCD project (EP/N021479/1).
Author Contributions
Authors contributed equally in preparing this manuscript.
Conflicts of Interest
The authors declare no conflict of interest.
References
- Chaudry, M.; Abeysekera, M.; Hosseini, S.H.R.; Jenkins, N.; Wu, J. Uncertainties in decarbonising heat in the UK. Energy Policy 2015, 87, 623–640. [Google Scholar] [CrossRef]
- BEIS. Energy Consumption in the UK; BEIS: London, UK, 2016.
- Eyre, N.; Baruah, P. Uncertainties in future energy demand in UK residential heating. Energy Policy 2015, 87, 641–653. [Google Scholar] [CrossRef]
- Allen, S.R.; Hammond, G.P.; McManus, M.C. Prospects for and barriers to domestic micro-generation: A United Kingdom perspective. Appl. Energy 2008, 85, 528–544. [Google Scholar] [CrossRef]
- Jalil-Vega, F.; Hawkes, A.D. Spatially resolved model for studying decarbonisation pathways for heat supply and infrastructure trade-offs. Appl. Energy 2017. [Google Scholar] [CrossRef]
- Hawkes, A.; Leach, M. Cost-effective operating strategy for residential micro-combined heat and power. Energy 2007, 32, 711–723. [Google Scholar] [CrossRef]
- Hawkes, A.; Staffell, I.; Brett, D.; Brandon, N. Fuel cells for micro-combined heat and power generation. Energy Environ. Sci. 2009, 2, 729–744. [Google Scholar] [CrossRef]
- Herrando, M.; Markides, C.N. Hybrid PV and solar-thermal systems for domestic heat and power provision in the UK: Techno-economic considerations. Appl. Energy 2016, 161, 512–532. [Google Scholar] [CrossRef]
- Liu, X.; Lau, S.-K.; Li, H.; Shen, H. Optimization and analysis of a multi-functional heat pump system with air source and gray water source in cooling mode. Energy Build. 2017, 149, 339–353. [Google Scholar] [CrossRef]
- Basso, G.L.; Nastasi, B.; Salata, F.; Golasi, I. Energy retrofitting of residential buildings—How to couple Combined Heat and Power (CHP) and Heat Pump (HP) for thermal management and off-design operation. Energy Build. 2017, 151, 293–305. [Google Scholar] [CrossRef]
- Carlon, E.; Schwarz, M.; Golicza, L.; Verma, V.K.; Prada, A.; Baratieri, M.; Haslinger, W.; Schmidl, C. Efficiency and operational behaviour of small-scale pellet boilers installed in residential buildings. Appl. Energy 2015, 155, 854–865. [Google Scholar] [CrossRef]
- Asaee, S.R.; Ugursal, V.I.; Beausoleil-Morrison, I. An investigation of the techno-economic impact of internal combustion engine based cogeneration systems on the energy requirements and greenhouse gas emissions of the Canadian housing stock. Appl. Therm. Eng. 2015, 87, 505–518. [Google Scholar] [CrossRef]
- González-Pino, I.; Pérez-Iribarren, E.; Campos-Celador, A.; Las-Heras-Casas, J.; Sala, J.M. Influence of the regulation framework on the feasibility of a Stirling engine-based residential micro-CHP installation. Energy 2015, 84, 575–588. [Google Scholar] [CrossRef]
- Jing, Z.X.; Jiang, X.S.; Wu, Q.H.; Tang, W.H.; Hua, B. Modelling and optimal operation of a small-scale integrated energy based district heating and cooling system. Energy 2014, 73, 399–415. [Google Scholar] [CrossRef]
- Good, N.; Ceseña, E.A.M.; Zhang, L.; Mancarella, P. Techno-economic and business case assessment of low carbon technologies in distributed multi-energy systems. Appl. Energy 2016, 167, 158–172. [Google Scholar] [CrossRef]
- Pineau, D.; Rivière, P.; Stabat, P.; Hoang, P.; Archambault, V. Performance analysis of heating systems for low energy houses. Energy Build. 2013, 65, 45–54. [Google Scholar] [CrossRef]
- Cockroft, J.; Kelly, N. A comparative assessment of future heat and power sources for the UK domestic sector. Energy Convers. Manag. 2006, 47, 2349–2360. [Google Scholar] [CrossRef]
- Dorer, V.; Weber, A. Energy and CO2 emissions performance assessment of residential micro-cogeneration systems with dynamic whole-building simulation programs. Energy Convers. Manag. 2009, 50, 648–657. [Google Scholar] [CrossRef]
- Fifth Assessment Report—CLIMATE CHANGE 2014 Synthesis Report. IPCC, 2014. Available online: http://www.ipcc.ch/report/ar5/syr/ (accessed on 14 November 2017).
- Daly, H.; Fais, B. UK TIMES Model Overview; UCL Energy Institute: London, UK, 2014. [Google Scholar]
- Kannan, R. Uncertainties in key low carbon power generation technologies—Implication for UK decarbonisation targets. Appl. Energy 2009, 86, 1873–1886. [Google Scholar] [CrossRef]
- Jelle, B.P. Traditional, state-of-the-art and future thermal building insulation materials and solutions—Properties, requirements and possibilities. Energy Build. 2011, 43, 2549–2563. [Google Scholar] [CrossRef]
- Laustsen, J. Energy Efficiency Requirements in Building Codes, Energy Efficiency Policies for New Buildings; International Energy Agency: Paris, France, 2008. [Google Scholar]
- Cockroft, J.; Cowie, A.; Samuel, A.; Strachan, P. Potential energy savings achievable by zoned control of individual rooms in UK housing compared to standard central heating controls. Energy Build. 2017, 136, 1–11. [Google Scholar] [CrossRef]
- Labanca, N.; Suerkemper, F.; Bertoldi, P.; Irrek, W.; Duplessis, B. Energy efficiency services for residential buildings: Market situation and existing potentials in the European Union. J. Clean. Prod. 2015, 109, 284–295. [Google Scholar] [CrossRef]
- Parkhill, K.; Demski, C.; Butler, C.; Spence, A.; Pidgeon, N. Transforming the UK Energy System: Public Values, Attitudes and Acceptability: Synthesis Report; UKERC: London, UK, 2013. [Google Scholar]
- Murugan, S.; Horák, B. A review of micro combined heat and power systems for residential applications. Renew. Sustain. Energy Rev. 2016, 64, 144–162. [Google Scholar] [CrossRef]
- Carmo, C.; Detlefsen, N.; Nielsen, M. Smart Grid Enabled Heat Pumps: An Empirical Platform for Investigating how Residential Heat Pumps can Support Large-scale Integration of Intermittent Renewables. Energy Procedia 2014, 61, 1695–1698. [Google Scholar] [CrossRef]
- Weiland, P. Biogas production: current state and perspectives. Appl. Microbiol. Biotechnol. 2010, 85, 849–860. [Google Scholar] [CrossRef] [PubMed]
- Haro, P.; Johnsson, F.; Thunman, H. Improved syngas processing for enhanced Bio-SNG production: A techno-economic assessment. Energy 2016, 101, 380–389. [Google Scholar] [CrossRef]
- Dodds, P.E.; Staffell, I.; Hawkes, A.D.; Li, F.; Grünewald, P.; McDowall, W.; Ekins, P. Hydrogen and fuel cell technologies for heating: A review. Int. J. Hydrogen Energy 2015, 40, 2065–2083. [Google Scholar] [CrossRef]
- Connolly, D.; Lund, H.; Mathiesen, B.V.; Werner, S.; Möller, B.; Persson, U.; Boermans, T.; Trier, D.; Østergaard, P.A.; Nielsen, S. Heat Roadmap Europe: Combining district heating with heat savings to decarbonise the EU energy system. Energy Policy 2014, 65, 475–489. [Google Scholar] [CrossRef]
- BEIS. Decarbonisation of Heat in Industry; A Review of the Research Evidence; BEIS: London, UK, 2013.
- Next Steps for UK Heat Policy. Committee on Climate Change, 2016. Available online: https://www.theccc.org.uk/publication/next-steps-for-uk-heat-policy/ (accessed on 14 November 2017).
- Hanna, R.; Parrish, B.; Gross, R. Best Practice in Heat Decarbonisation Policy: A Review of the International Experience of Policies to Promote the Uptake of Low-Carbon Heat Supply; UKERC: London, UK, 2016. [Google Scholar]
- Foster, S.; Love, J.; Walker, I. Research on District Heating and Local Approaches to Heat Decarbonisation; Element Energy Ltd.: Cambridge, UK, 2015. [Google Scholar]
- Dodds, P.E.; Demoullin, S. Conversion of the UK gas system to transport hydrogen. Int. J. Hydrogen Energy 2013, 38, 7189–7200. [Google Scholar] [CrossRef]
- Vijay, A.; Fouquet, N.; Staffell, I.; Hawkes, A. The value of electricity and reserve services in low carbon electricity systems. Appl. Energy 2017, 201, 111–123. [Google Scholar] [CrossRef]
- Merkel, E.; Fehrenbach, D.; McKenna, R.; Fichtner, W. Modelling decentralised heat supply: An application and methodological extension in TIMES. Energy 2014, 73, 592–605. [Google Scholar] [CrossRef]
- Chiodi, A.; Gargiulo, M.; Rogan, F.; Deane, J.P.; Lavigne, D.; Rout, U.K.; Gallachóir, B.P.Ó. Modelling the impacts of challenging 2050 European climate mitigation targets on Ireland’s energy system. Energy Policy 2013, 53, 169–189. [Google Scholar] [CrossRef]
- Henning, D. MODEST—An energy-system optimisation model applicable to local utilities and countries. Energy 1997, 22, 1135–1150. [Google Scholar] [CrossRef]
- Kannan, R.; Strachan, N. Modelling the UK residential energy sector under long-term decarbonisation scenarios: Comparison between energy systems and sectoral modelling approaches. Appl. Energy 2009, 86, 416–428. [Google Scholar] [CrossRef]
- Pfenninger, S.; Hawkes, A.; Keirstead, J. Energy systems modeling for twenty-first century energy challenges. Renew. Sustain. Energy Rev. 2014, 33, 74–86. [Google Scholar] [CrossRef]
- Henning, H.-M.; Palzer, A. A comprehensive model for the German electricity and heat sector in a future energy system with a dominant contribution from renewable energy technologies—Part I: Methodology. Renew. Sustain. Energy Rev. 2014, 30, 1003–1018. [Google Scholar] [CrossRef]
- Lund, R.; Mathiesen, B.V. Large combined heat and power plants in sustainable energy systems. Appl. Energy 2015, 142, 389–395. [Google Scholar] [CrossRef]
- Eager, D.; Hobbs, B.F.; Bialek, J.W. Dynamic Modeling of Thermal Generation Capacity Investment: Application to Markets with High Wind Penetration. IEEE Trans. Power Syst. 2012, 27, 2127–2137. [Google Scholar] [CrossRef]
- Stoft, S. Power System Economics: Designing Markets for Electricity; Wiley-IEEE Press: Hoboken, NJ, USA, 2002. [Google Scholar]
- Roques, F.A.; Newbery, D.M.; Nuttall, W.J. Fuel mix diversification incentives in liberalized electricity markets: A Mean–Variance Portfolio theory approach. Energy Econ. 2008, 30, 1831–1849. [Google Scholar] [CrossRef]
- Salci, S.; Jenkins, G.P. An economic analysis for the design of ipp contracts for grid-connected renewable energy projects. Renew. Sustain. Energy Rev. 2017. [Google Scholar] [CrossRef]
- UK Future Energy Scenarios. National Grid, 2015. Available online: http://www2.nationalgrid.com/UK/Industry-information/Future-of-Energy/FES/Documents-archive/ (accessed on 14 November 2017).
- BEIS. Updated Energy and Emissions Projections: 2016; BEIS: London, UK, 2016.
- 2050 Pathways—The 2050 Calculator. BEIS, 2013. Available online: https://www.gov.uk/guidance/2050-pathways-analysis (accessed on 28 July 2017).
- Tidball, R.; Bluestein, J.; Rodriguez, N.; Knoke, S. Cost and Performance Assumptions for Modeling Electricity Generation Technologies; ICF International: Fairfax, VA, USA, 2010. [Google Scholar]
- BEIS. Green Book Supplementary Guidance: Valuation of Energy Use and Greenhouse Gas Emissions for Appraisal; BEIS: London, UK, 2017.
- BEIS. Greenhouse Gas Reporting—Conversion Factors; BEIS: London, UK, 2016.
- Research on the Costs and Performance of Heating and Cooling Technologies. Sweett Group for DECC, 2013. Available online: https://www.gov.uk/government/uploads/system/uploads/attachment_data/file/204275/Research_on_the_costs_and_performance_of_heating_and_cooling_technologies__Sweett_Group_.pdf (accessed on 15 November 2017).
- Staffell, I.; Green, R. The cost of domestic fuel cell micro-CHP systems. Int. J. Hydrogen Energy 2013, 38, 1088–1102. [Google Scholar] [CrossRef] [Green Version]
- Weiss, M.; Junginger, M.; Patel, M.K.; Blok, K. A review of experience curve analyses for energy demand technologies. Technol. Forecast. Soc. Chang. 2010, 77, 411–428. [Google Scholar] [CrossRef]
- Micro CHP Accelerator—Final Report. Carbon Trust, 2011. Available online: https://www.carbontrust.com/resources/reports/technology/micro-chp-accelerator/ (accessed on 14 November 2017).
Figure 1.
Model description.

Figure 2.
Heating system schematics (a) Reference (b) Electric heater (c) Air source heat pump (d) Micro-CHP.
Figure 2.
Heating system schematics (a) Reference (b) Electric heater (c) Air source heat pump (d) Micro-CHP.
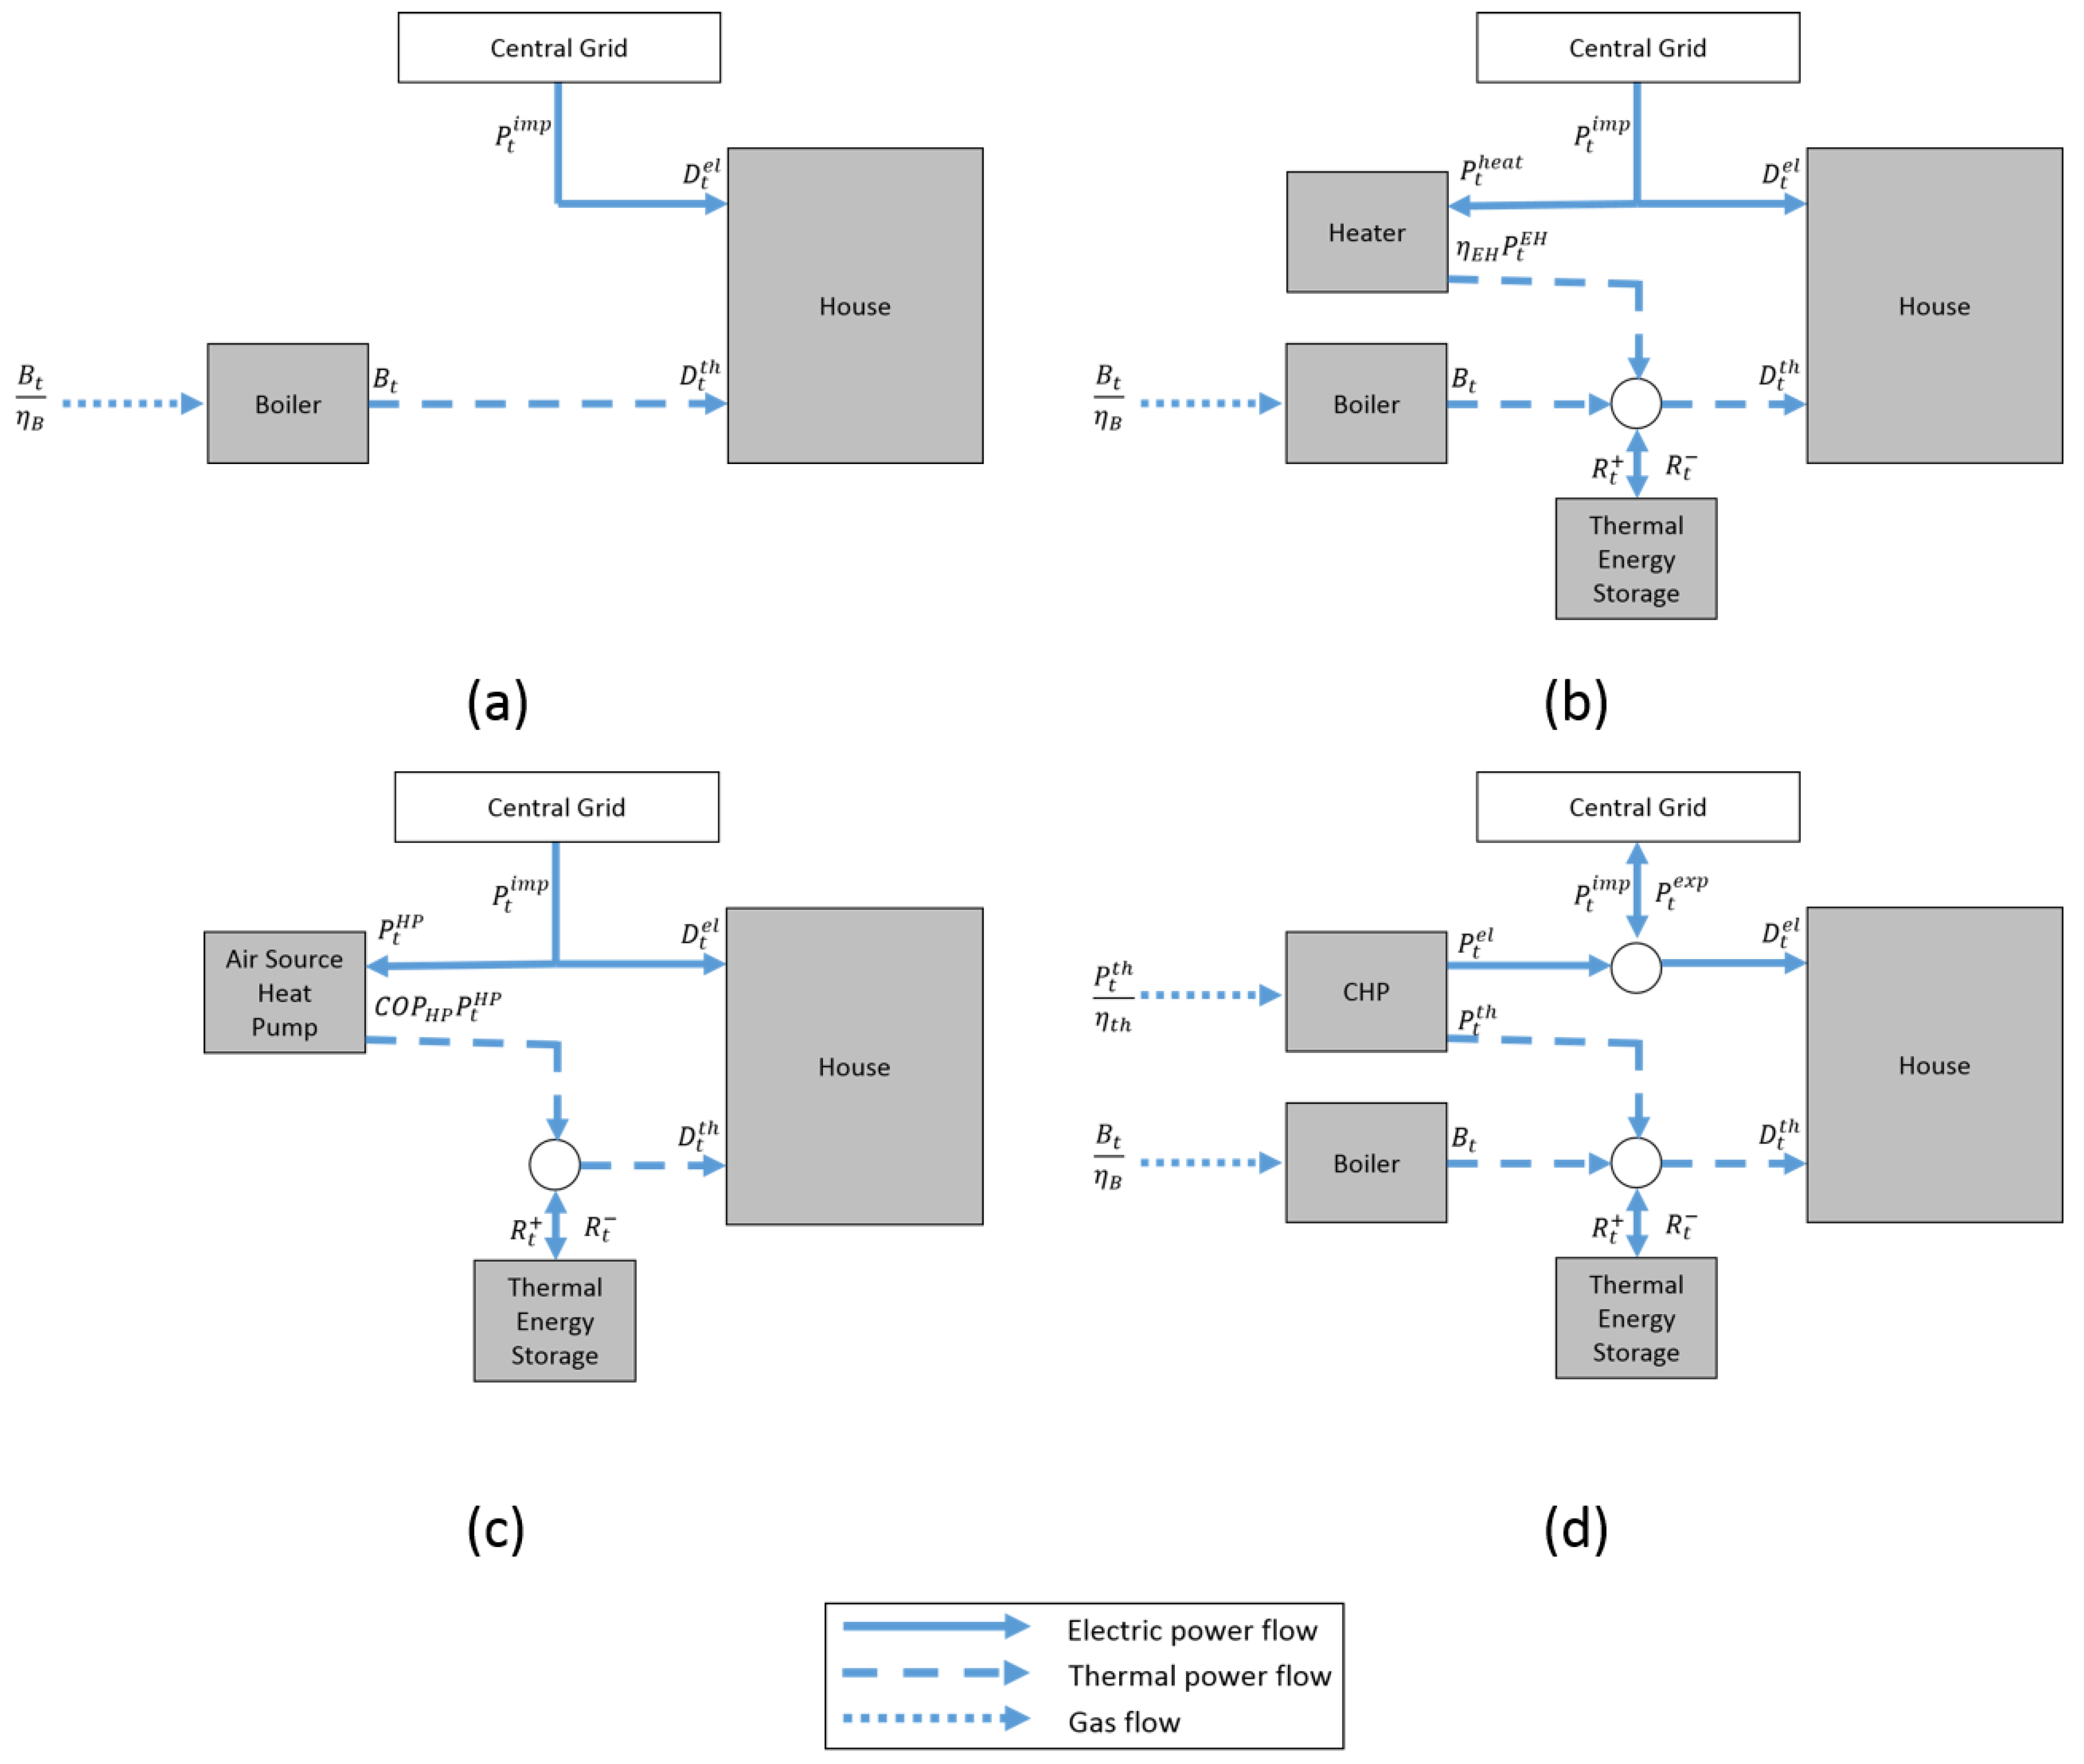
Figure 3.
Comparison of electricity price distribution. (The top and bottom edges of the blue box are the third and first quartiles of the distribution. The distance between them is the Inter-Quartile Range (IQR). The red line inside the box is the median. The red crosses are outliers, they are points that are either more than 3 × IQR above the third quartile or 3 × IQR below the first quartile. The horizontal black lines are the maximum and minimum values within the 3 × IQR distance specified above).

Figure 4.
Analysis of electricity prices (a) Dispatch on a spring day in the long run electricity price regime (b) Dispatch on a winter day in the short run electricity price regime (c) Marginal costs on a spring day in the long run electricity price regime (d) Marginal costs on a winter day in the short run electricity price regime.

Figure 5.
Equivalent Annual Costs in the short run electricity price regime (BO—Boiler, EH—Electric heater, HP—Heat pump, FC—Fuel cell micro CHP, SE—Stirling engine micro CHP).
Figure 5.
Equivalent Annual Costs in the short run electricity price regime (BO—Boiler, EH—Electric heater, HP—Heat pump, FC—Fuel cell micro CHP, SE—Stirling engine micro CHP).

Figure 6.
Equivalent Annual Costs in the long run electricity price regime (BO—Boiler, EH—Electric heater, HP—Heat pump, FC—Fuel cell micro CHP, SE—Stirling engine micro CHP).
Figure 6.
Equivalent Annual Costs in the long run electricity price regime (BO—Boiler, EH—Electric heater, HP—Heat pump, FC—Fuel cell micro CHP, SE—Stirling engine micro CHP).

Figure 7.
Annual carbon emissions in the short run and long run electricity price regime (BO—Boiler, EH—Electric heater, HP—Heat pump, FC—Fuel cell micro CHP, SE—Stirling engine micro CHP).
Figure 7.
Annual carbon emissions in the short run and long run electricity price regime (BO—Boiler, EH—Electric heater, HP—Heat pump, FC—Fuel cell micro CHP, SE—Stirling engine micro CHP).

Figure 8.
Emission sensitivity to carbon intensity of the electricity grid in the short run (solid lines) and long run (dotted lines with circle markers) regimes.
Figure 8.
Emission sensitivity to carbon intensity of the electricity grid in the short run (solid lines) and long run (dotted lines with circle markers) regimes.

Figure 9.
Emission sensitivity to natural gas price in the short run (solid lines) and long run (dotted lines with circle markers) regimes.
Figure 9.
Emission sensitivity to natural gas price in the short run (solid lines) and long run (dotted lines with circle markers) regimes.

Figure 10.
Equivalent Annual Cost sensitivity to natural gas price in the short run electricity price regime.
Figure 10.
Equivalent Annual Cost sensitivity to natural gas price in the short run electricity price regime.

Figure 11.
Equivalent Annual Cost sensitivity to natural gas price in the long run electricity price regime.
Figure 11.
Equivalent Annual Cost sensitivity to natural gas price in the long run electricity price regime.

Figure 12.
Capital cost sensitivity to natural gas price in the short run (dotted lines) and long run (solid lines) electricity price regime.
Figure 12.
Capital cost sensitivity to natural gas price in the short run (dotted lines) and long run (solid lines) electricity price regime.
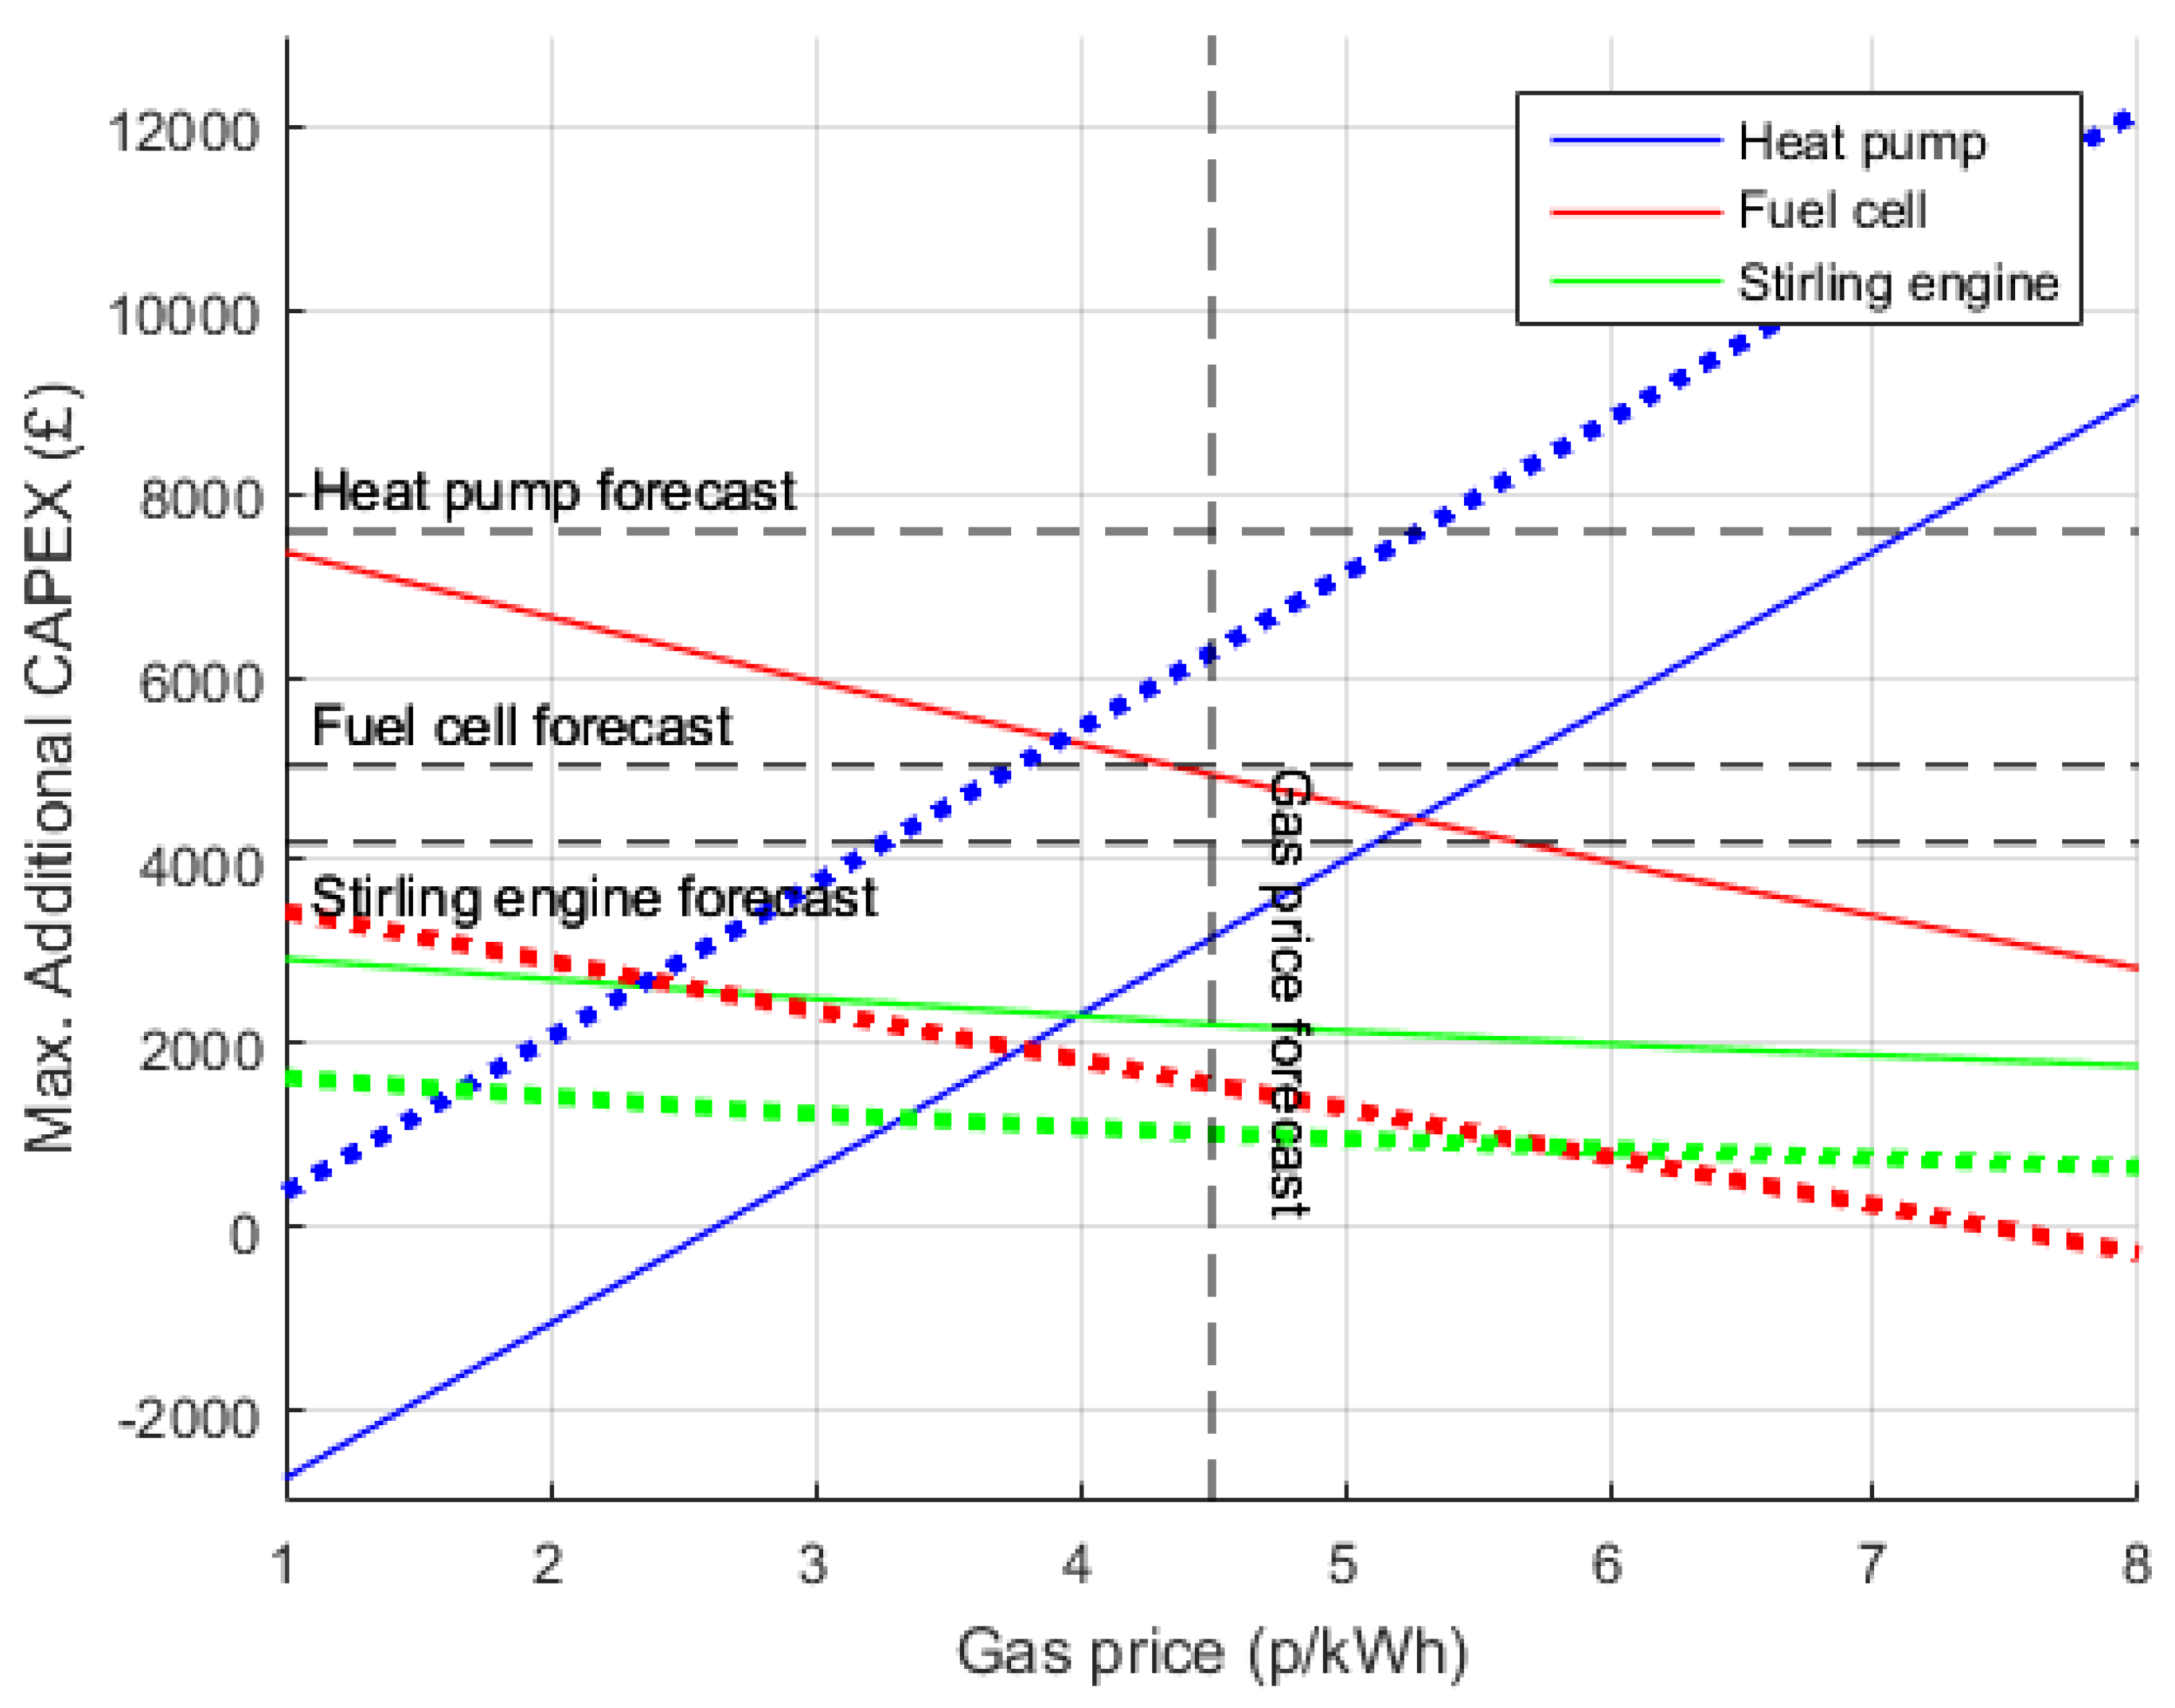
Figure 13.
Influence of heat pump design on economic performance.

Figure 14.
Influence of heat pump design on environmental performance.
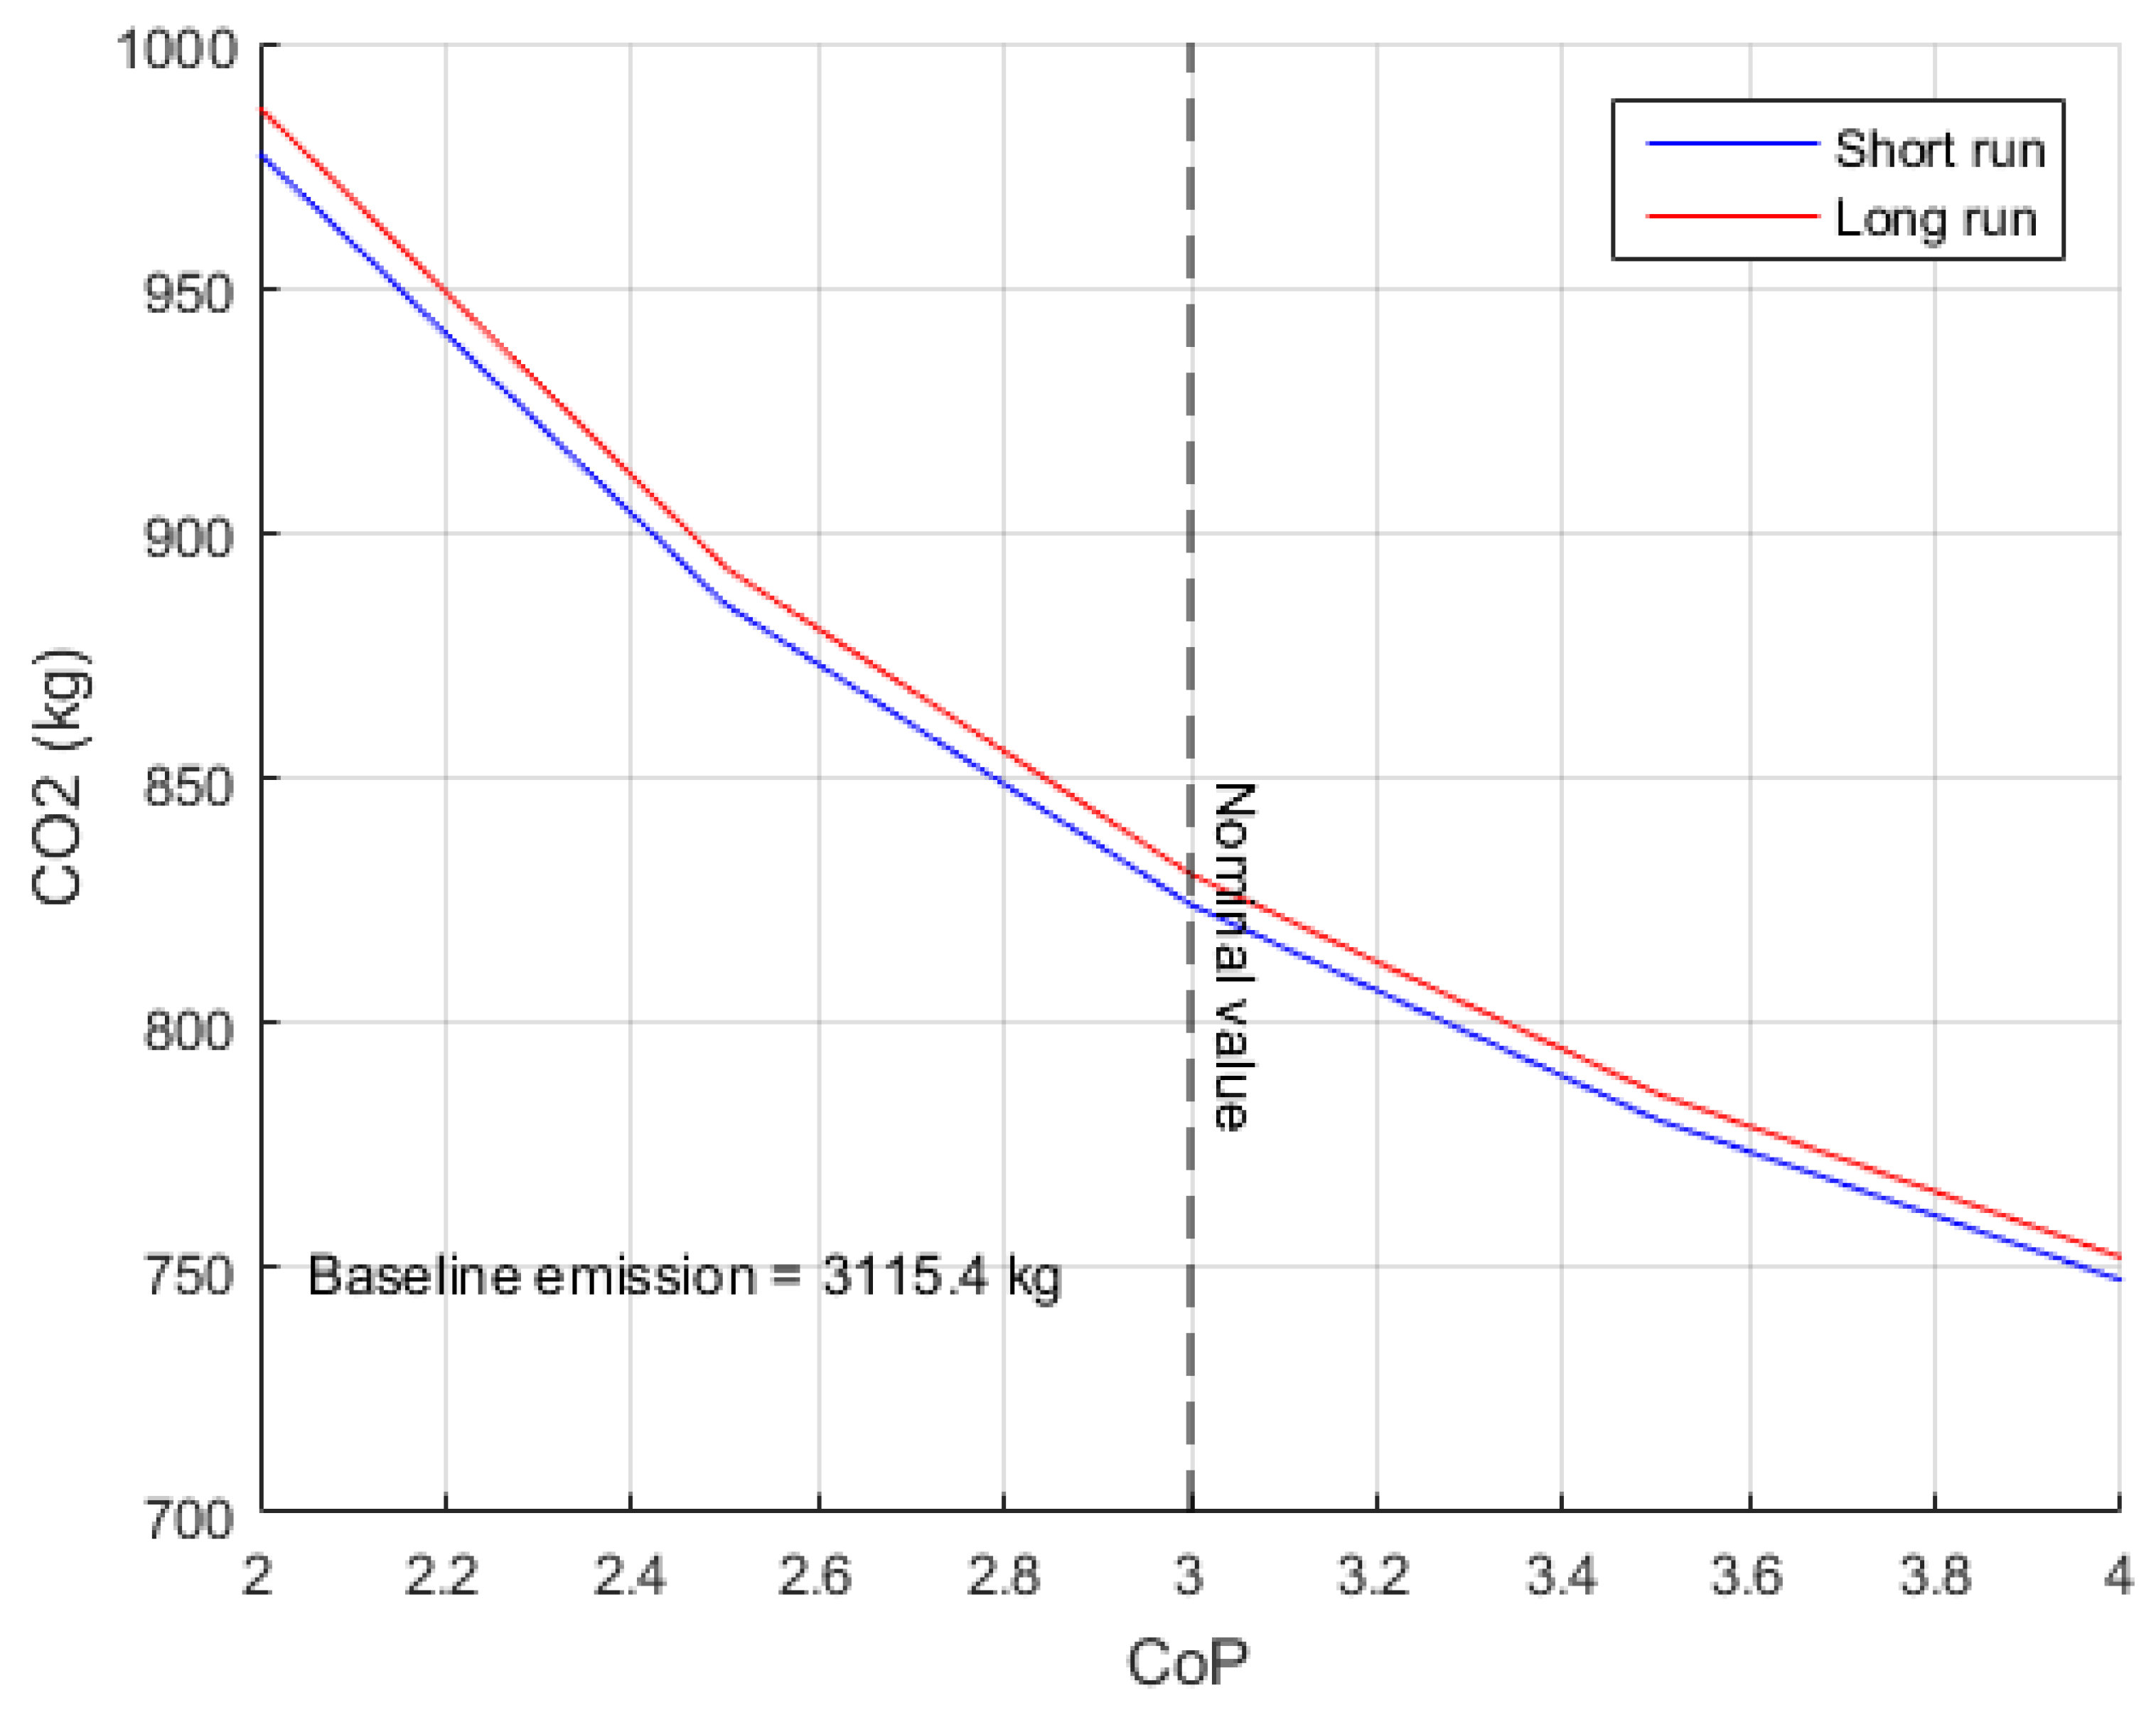
Figure 15.
Influence of fuel cell design on economic performance.

Figure 16.
Influence of fuel cell design on environmental performance.
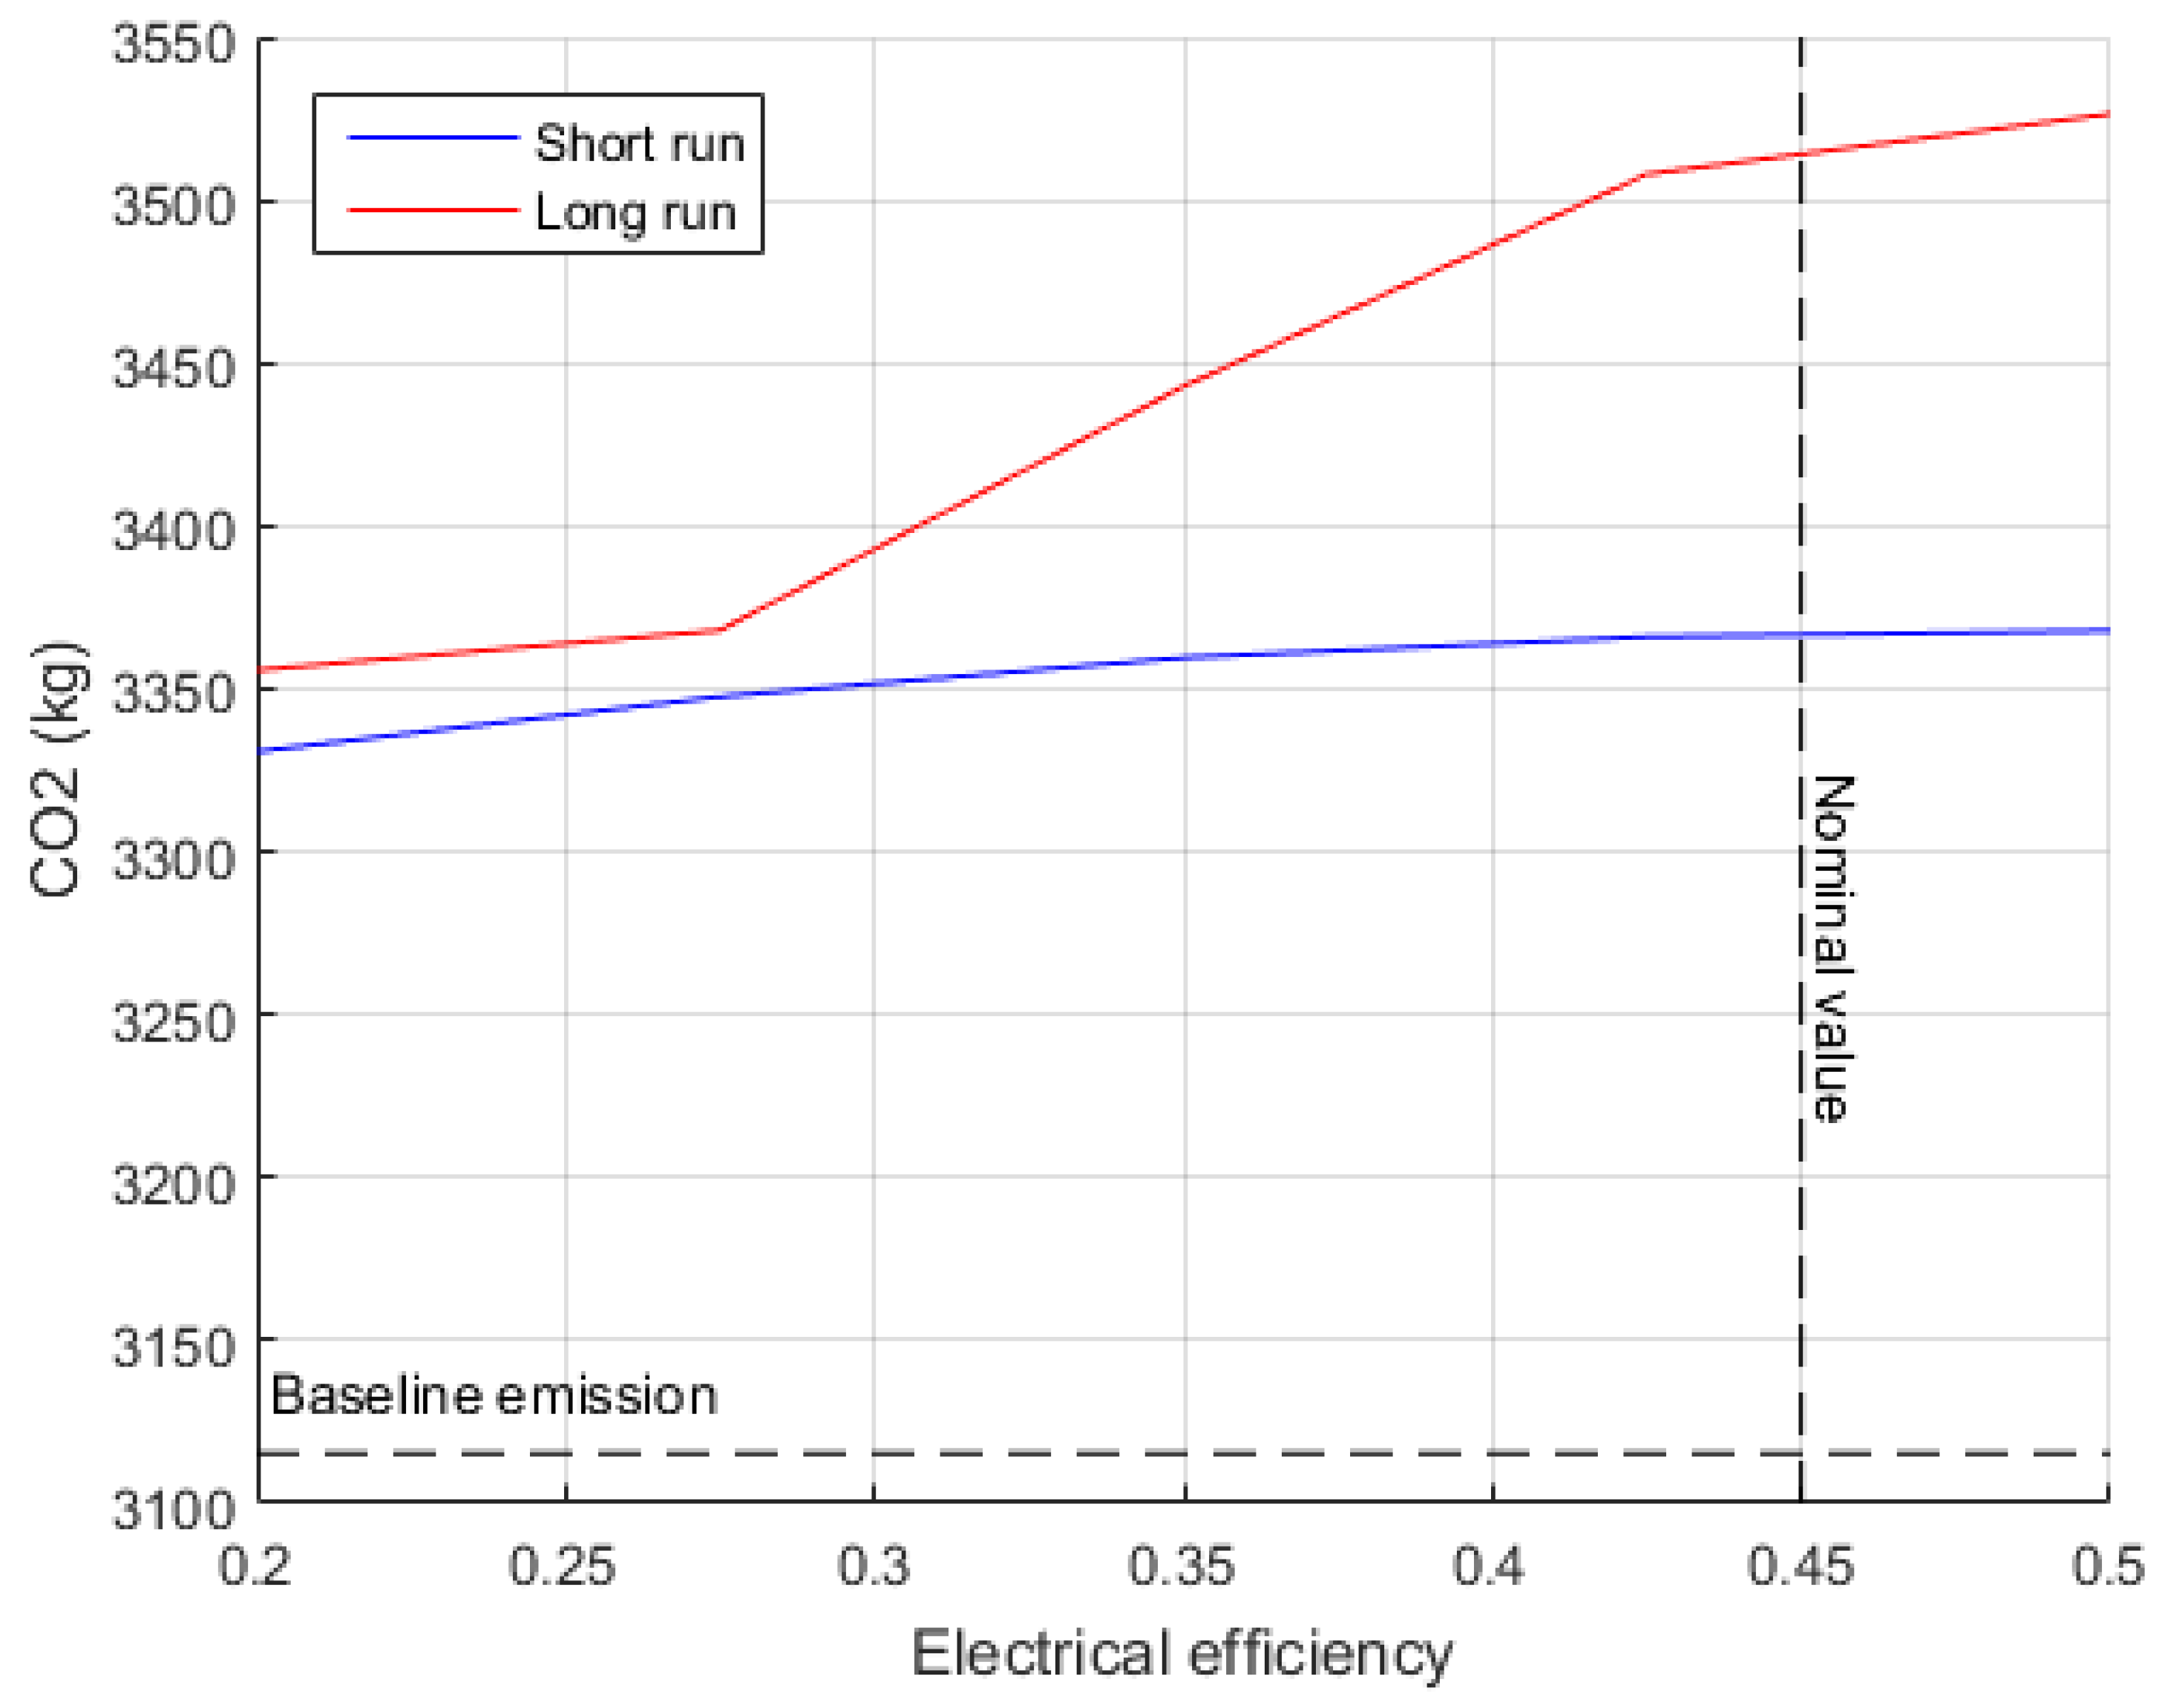
Figure 17.
Influence of Stirling engine design on economic performance.

Figure 18.
Influence of Stirling engine design on environmental performance.


Table 1.
Comparisons of heating technologies in the existing literature.
| Reference | Region | Scenario | System Description | Aim |
|---|---|---|---|---|
| Good et al. (2016) [15] | UK | Current | Individual | Economic viability and business case evaluation |
| Pineau et al. (2013) [16] | Italy | Current | Individual | Comparison of heating technologies |
| France | ||||
| The Netherlands | ||||
| Germany | ||||
| Cocroft and Kelly (2006) [17] | UK | Future | Individual | Calculation of CO2 savings; Design suggestions for CHP |
| Dorer and Weber (2009) [18] | Generic Europe | Future | Individual | Performance evaluation of Micro CHP in buildings |
| Henning and Palzer (2014) [44] | Germany | Future | Aggregated | Energy balance and planning of electricity and heat sectors with high renewable penetration |
| Lund and Mathiesen (2015) [45] | Denmark | Future | Aggregated | Analysis of large CHPs in 100% renewable energy systems |
Table 2.
Energy mix summary in the year 2015 and 2035.
| Fuel Type | 2015 (GW) | 2035 (GW) |
|---|---|---|
| Nuclear | 10.8 | 14.1 |
| Coal | 20.1 | 0.0 |
| CCS Coal | 0.0 | 4.5 |
| Gas | 32.0 | 24.8 |
| CCS Gas | 0.0 | 1.7 |
| Oil | 1.7 | 1.7 |
| Wind | 6.6 | 49.6 |
| Solar | 6.3 | 25.6 |
| Interconnectors | 3.5 | 17.7 |
Table 3.
Heating technology options.
| Case | Heat | Electricity |
|---|---|---|
| Reference | Boiler | Grid import |
| Electric heater | Boiler, Electric heater | Grid import |
| Thermal Energy Storage | ||
| Air source heat pump | Heat pump | Grid import |
| Thermal Energy Storage | ||
| Micro-CHP | Boiler, Micro-CHP prime mover | Grid import, Micro-CHP |
| Thermal Energy Storage |
Table 4.
Annual demand values.
| House | Electricity (kWh) | Heat (kWh) |
|---|---|---|
| Small | 2601.3 | 8056.1 |
| Medium | 6871.8 | 12,142.8 |
| Large | 5938.0 | 16,669.7 |
Table 5.
Electricity cost composition for the heat pump in the short run electricity price regime.
| Parameter | Medium | Large |
|---|---|---|
| Cost of supplying in-house demand (£) | 943.5 | 803.8 |
| Cost of supplying heating demand (£) | 563.6 | 765.1 |
Table 6.
Electricity cost composition for the heat pump in the long run electricity price regime.
| Parameter | Medium | Large |
|---|---|---|
| Cost of supplying in-house demand (£) | 1404.5 | 1160.1 |
| Cost of supplying heating demand (£) | 824.7 | 1083.2 |
© 2017 by the authors. Licensee MDPI, Basel, Switzerland. This article is an open access article distributed under the terms and conditions of the Creative Commons Attribution (CC BY) license (http://creativecommons.org/licenses/by/4.0/).
Share and Cite
MDPI and ACS Style
Vijay, A.; Hawkes, A. The Techno-Economics of Small-Scale Residential Heating in Low Carbon Futures. Energies 2017, 10, 1915. https://doi.org/10.3390/en10111915
AMA Style
Vijay A, Hawkes A. The Techno-Economics of Small-Scale Residential Heating in Low Carbon Futures. Energies. 2017; 10(11):1915. https://doi.org/10.3390/en10111915
Chicago/Turabian StyleVijay, Avinash, and Adam Hawkes. 2017. "The Techno-Economics of Small-Scale Residential Heating in Low Carbon Futures" Energies 10, no. 11: 1915. https://doi.org/10.3390/en10111915
Note that from the first issue of 2016, this journal uses article numbers instead of page numbers. See further details here.