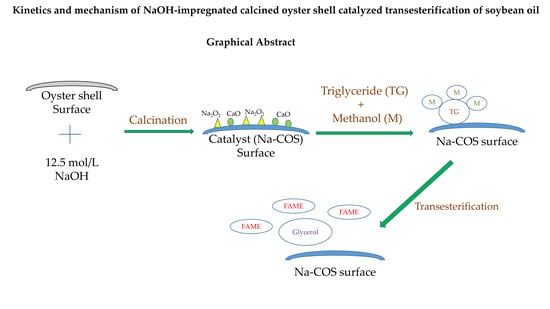
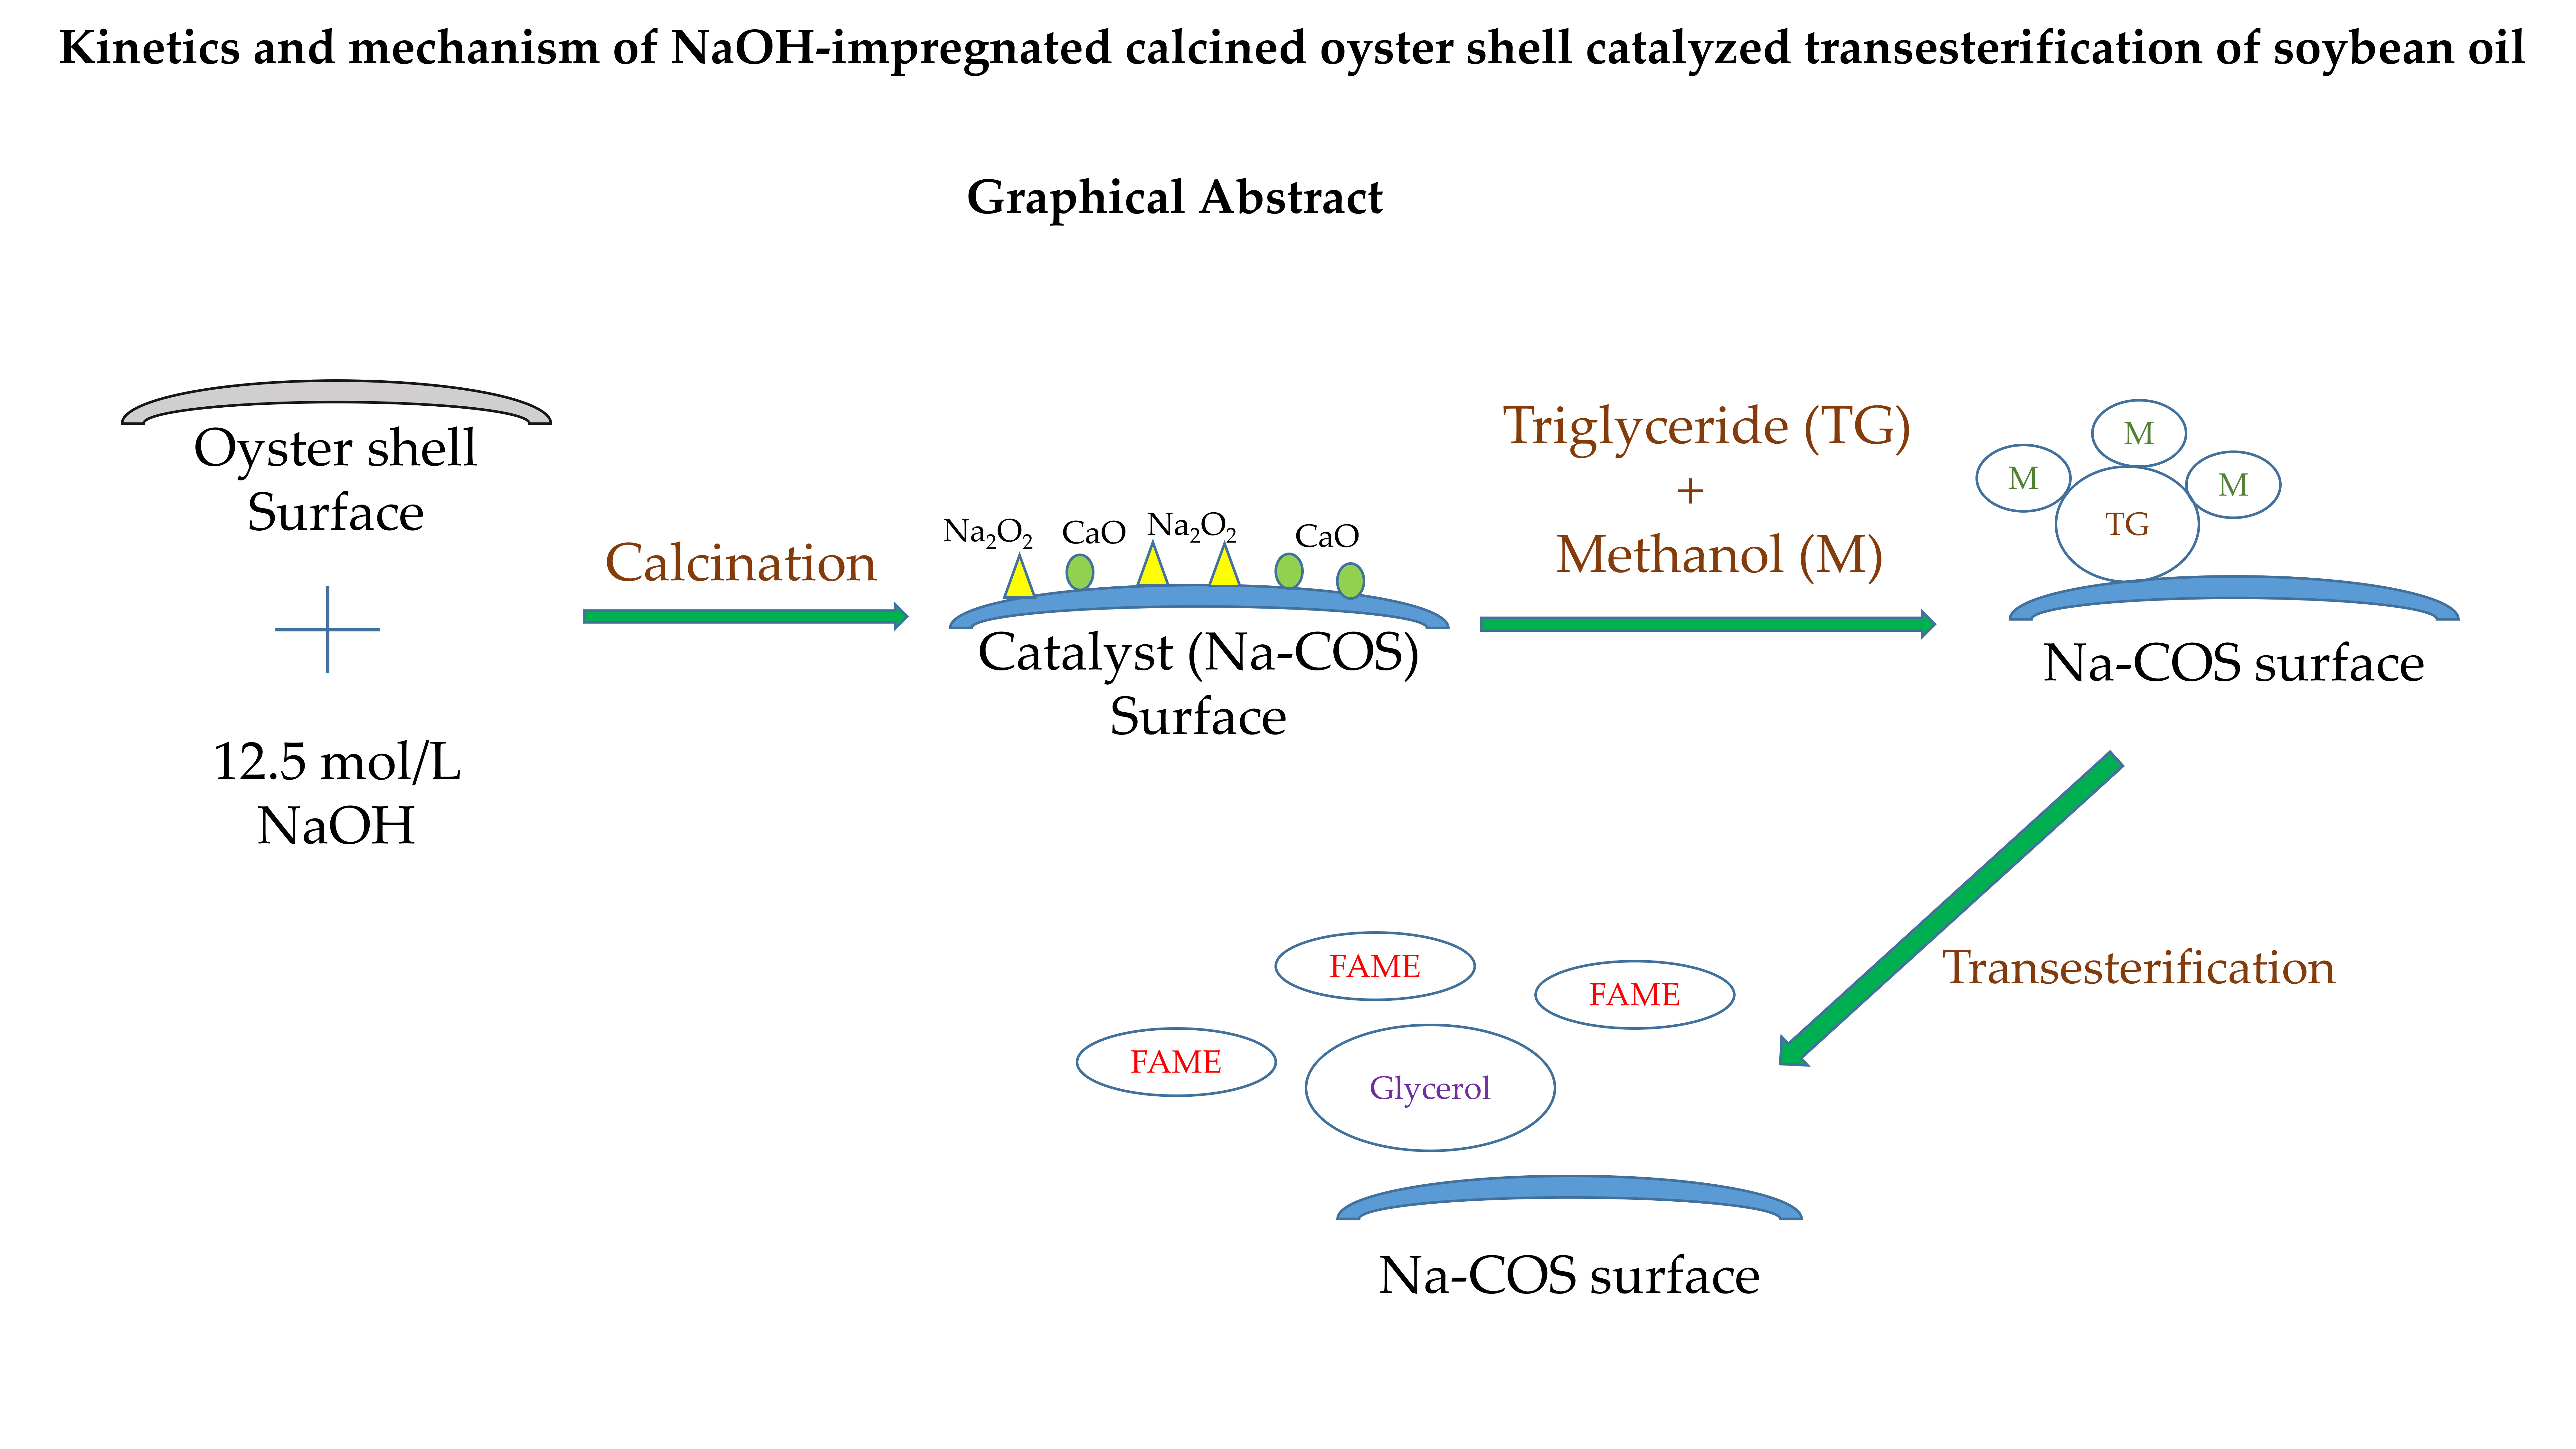
Kinetics and Mechanism of NaOH-Impregnated Calcined Oyster Shell-Catalyzed Transesterification of Soybean Oil


1
Department of Biological and Agricultural Engineering, North Carolina State University, Raleigh, NC 27695-2765, USA
2
Department of Chemical & Biomolecular Engineering, North Carolina State University, Raleigh, NC 27695-2765, USA
3
Department of Statistics, North Carolina State University, Raleigh, NC 27695-8203, USA
*
Author to whom correspondence should be addressed.
Energies 2017, 10(11), 1920; https://doi.org/10.3390/en10111920
Submission received: 25 September 2017
/
Revised: 10 November 2017
/
Accepted: 15 November 2017
/
Published: 21 November 2017
(This article belongs to the Section L: Energy Sources)
Abstract
:The objective of this research is to develop a kinetic model to describe the transesterification of soybean oil with methanol using NaOH-impregnated calcined oyster shell (Na-COS). Batch experiments were performed via a two-factor randomized complete block design using a molar ratio of methanol to oil (MR) of 6, 12, and 18 and catalyst loadings (CL) (mass of catalyst/mass of oil in %) of 2%, 4%, 6%, and 8% to obtain fatty acid methyl ester yields. In addition, the catalyst was studied by X-ray diffraction (XRD), X-ray photoelectron spectroscopy (XPS), and time-of-flight secondary ion spectrometry (TOF-SIMS) to elucidate the role of the catalyst in the transesterification reaction. XRD and XPS analyses suggested that the formation of sodium peroxide (Na2O2) on the surface contributed to catalytic activity. The TOF-SIMS analysis suggested that the transesterification occurred between adsorbed triglyceride and free methanol, similar to the Eley-Rideal mechanism. The transesterification of adsorbed triglyceride to adsorbed diglyceride was found to be the rate-determining step with a rate constant of 0.0059 ± 0.0002 L mol−1 min−1.
1. Introduction
Biodiesel or fatty acid methyl ester (FAME) is considered an alternative fuel for public transportation because of its favorable cetane rating, desirable lubricating properties, and low toxic emissions [1]. The most commonly employed method to produce biodiesel is transesterification, a chemical reaction that occurs between fat (usually vegetable oil) and an alcohol (usually methanol) catalyzed by an acid or a base to produce FAMEs, which are further modified as qualified biodiesel [2].
Despite promising features, biodiesel production has a few practical challenges. One of the major drawbacks is the complicated downstream processing of the product, which consists of FAMEs, unreacted methanol and NaOH, as separation of these products involves washing with large amounts of water, resulting in wastewater production [3]. In addition, NaOH is difficult to recover, and for all practical purposes is considered to be a non-reusable catalyst [4]. Thus, usage of NaOH is therefore considered to be non-environmentally friendly and non-economical. Hence, research has shifted towards the development of the heterogeneous base catalysts to replace traditional homogeneous catalysts such as NaOH [4]. The heterogeneous base catalysts are insoluble in the reaction system and easy to regenerate, thus simplifying the downstream processing of biodiesel production [5].
Many solid base catalysts have been reported as potential substitutes for NaOH. Alkaline earth metal oxides, such as MgO [6], CaO [7], and SrO [8], have proven to be active in transesterifying edible oils into FAMEs. Yacob et al. synthesized the nano MgO using the hydration-dehydration method for transesterifying palm oil and obtained the highest conversion of 51.3% [6]. Similarly, Liu et al. used commercial CaO to catalyze the transesterification of soybean oil in the presence of water. The highest yield exceeded 95% with a molar ratio of methanol to oil (MR) of 12, catalyst loadings (CL) (mass of catalyst/mass of oil in %) of 8%, a water content of 2.03%, at 65 °C in 1.5 h [7]. In addition, Liu et al. tested SrO as a superbase for transesterification of soybean oil, and the yield exceeded 95% at MR = 12, CL = 3%, at 65 °C [8]. Further, mesoporous material-supported solid base catalysts, such as KOH/Al2O3 [9] and KF/Al2O3 [10], were also tested for the transesterification reaction. Noiroj et al. used KOH/Al2O3 to catalyze the transesterification of palm oil. The 25% KOH-loaded Al2O3 was suggested as the optimal loading for a yield of 91.07% with MR = 15.3 g catalyst (300 rpm) at 60 °C in 2 h [9]. Boz et al. developed a series of KF/Al2O3 via wet impregnation methods to obtain a yield of 97.7% with MR = 15, CL = 3%, at 65 °C (8 h). The authors concluded that this high yield might attribute to the high surface to volume ratio of the nano-γ-Al2O3 that increased the basicity substantially [10].
In order to use solid base catalysts to produce biodiesel in industry, the kinetic behavior of the catalyst needs to be studied. Understanding the kinetics of the solid base-catalyzed transesterification reaction is crucial to the reactor design, for process control, and for scale-up. Based on the overall transesterification, it is intrinsic that the reaction rate depends on both the concentrations of triglyceride and methanol. However, in most heterogeneous, base-catalyzed transesterification reports, methanol is usually provided in excess to achieve high oil conversion. Hence, the concentration of methanol during the reaction is assumed to be constant throughout the reaction. As a result, most reported studies for solid base catalyzed transesterification reactions employed a pseudo-first-order model with respect to triglyceride [11,12,13,14]. Lukic et al. studied the kinetics of sunflower and used vegetable oil transesterification catalyzed by CaO/ZnO, and they proposed a pseudo-first order reaction for the overall process [11]. The pseudo-first- order rate constants were determined for different reaction temperatures which ranged from 0.043 min−1 at 60 °C to 0.120 min−1 at 96 °C. Similarly, Jairam et al. simulated the data from KI-impregnated calcined oyster shell catalyzed transesterification of soybean oil using pseudo-first-order kinetics. The pseudo-first-order rate constant was estimated as 0.4385 h−1 [12]. Zhang et al. used a pseudo-first-order kinetics to model the transesterification of palm oil with dimethyl carbonate catalyzed by KOH. The activation energy and pre-exponential factor, Ea and k0, were determined as 79.1 kJ mol−1 and 1.26 × 10⁹ min−1 [13]. Ramezani et al. also employed pseudo-first-order kinetics to describe the transesterification of castor oil with methanol. A good fit was observed, and the reaction rate constant was estimated to be 4.91 × 10⁻³ min−1 at 65 °C [14].
In addition to pseudo-first-order kinetics, other kinetics models have also been proposed. Pseudo-second-order kinetics with respect to the triglyceride were used to describe the initial period of transesterification of sunflower oil with ethanol by Marjanovic et al. The estimated activation energy, Ea, was reported to be in the range of 8.3–35.1 kJ mol−1 at the reaction temperature ranging from 25 °C to 75 °C [15]. Issariyakul et al. modeled the transesterification of palm oil with methanol catalyzed by KOH as three consecutive reactions (triglyceride to diglyceride, diglyceride to monoglyceride, and monoglyceride to glycerol), each of which followed second-order kinetics with respect to triglyceride and methanol. The reaction rate constants of each stepwise reaction (forward and backward) were estimated, and the rate-determining step was found to be the step from triglyceride to diglyceride [16]. Xiao et al. used the Eley-Rideal mechanism to model the stepwise transesterification of palm oil withtri methanol catalyzed by KF/Ca-Mg-Al hydrotalcite solid base. The reaction was assumed to occur between free triglyceride and adsorbed methanol wherein the transesterification of triglyceride to diglyceride was the rate-determining step. The activation energy, Ea, was determined to be 111.6 kJ mol−1 [17]. Further, Veljkovic et al. described a sigmoidal-type kinetic model, in which the transesterification process was assumed to be mass transfer-limited during the initial period, and reaction-limited during the completion of the reaction between sunflower oil and methanol catalyzed via CaO [18]. The authors proposed a kinetic model with a rate constant that differed between the initial and ending periods, attributing to the different mass transfer/reaction approximation premises and resulting in a sigmoidal FAME yield curve. The pseudo-first order rate constant was determined as 0.070 min−1 for the terminal period of the reaction [18]. Miladinovic et al. also employed a sigmoidal-type model to describe quicklime-catalyzed transesterification of sunflower oil via a full factorial experimental design (MR set to 6, 12, 18 and CL set to 1%, 2.5%, 5%, 10%). Although their model was found to be suitable, the underlying reaction mechanism was not elucidated [19].
Of late, there is a renewed interest using agricultural wastes as precursors for the synthesis of solid base catalysts. For example, naturally occurring shells, due to their high content of CaCO3, are considered excellent precursors for CaO that can catalyze transesterification reactions [20]. Wei et al. used calcined eggshell as the catalyst for transesterification of soybean oil, to obtain a maximum FAME yield greater than 95% with MR = 9, and CL = 3%, at 65 °C within 3 h [21]. Similarly, Rezaei et al. employed calcined mussel shell as the catalyst and reported a FAME yield of up to 94.1%, using a MR of 24, CL of 12% at 60 °C in 8 h [22]. Suryaputra et al. utilized the calcined capiz (Amusium cristatum) shell to catalyze the transesterification of palm oil. The maximum yield of 93% with a MR = 8, CL = 3% at 60 °C in 6 h was observed [23]. Xie et al. employed the turtle shell as the precursor, and prepared the catalyst via a tri-step procedure including incomplete carbonization followed by KF impregnation (25%) and activation (300 °C). When tested, FAME yield reached 97.5% with MR = 9, CL = 3% at 70 °C in 3 [24]. Recently, we prepared highly active solid catalysts from oyster shells by impregnating NaOH on the surface, followed by calcination (Na-COS). When tested in batch systems, FAME conversions of up to 90% were obtained [25]. These results suggest that catalysts prepared from wastes could potentially make biodiesel production processes economically competitive. However, for scale-up and reactor design, reaction kinetics and understanding of the reaction pathway is needed. However, at this time, there is limited data on the kinetics of transesterification for catalysts derived from animal and aquatic shells. Hence, the objectives of this research are to (1) develop a kinetic model to describe the kinetics of transesterification and (2) elucidate how the reaction proceeded based on the observed experimental data.
2. Materials and Methods
2.1. Catalyst Preparation
Waste oyster (Eastern oyster, Crassostrea virginica) shells were collected from a local restaurant. The shells were washed with warm water to remove the dirt from the surface, and dried at ambient temperature overnight. The washed shells were calcined at 500 °C for 2 h in a furnace (Paragon Industries, Mesquite, TX, USA) to remove the organic compounds from the shell. Subsequently, the shells were crushed using a hammer and particles of size 1–2 mm were collected via a 1–2 mm sieve. Further, the oyster shell particles were soaked in the 50% NaOH solution (in water) (CAS 1310-73-2, Fisher Scientific, Pittsburgh, PA, USA) at 90 °C for 5 h. After NaOH impregnation, the shells were filtered and calcined at 1000 °C for 3 h under a nitrogen environment to obtain the catalyst (Na-COS). The control, calcined oyster shell (COS), was prepared by calcining the crushed oyster shell particles (without impregnation) at 1000 °C for 3 h.
2.2. Catalyst Characterization
X-ray powder diffraction (XRD) data were collected using a Rigaku SmartLab X-ray diffractometer with Cu Kα radiation (λ = 0.15418 nm) in the 2θ range of 5–80°. The diffraction data were acquired using a step size and count time of 0.05° (2θ) and 3 s/step, respectively.
X-ray photoelectron spectroscopy (XPS) studies were performed with a SPECS FlexMod system equipped with a hemispherical analyzer PHOIBIS 150 and a Mg Kalpha (1254 eV) X-ray source. High-resolution spectra were recorded at take-off-angle normal to surface. The X-ray incidence angle is ~30° from the surface and the X-ray source to the analyzer is ~60°. Energy calibration was established by referencing to adventitious Carbon (C1s line at 285.0 eV binding energy). The base pressure in the analysis chamber is in 10−10 mbar range.
The surface features of Na-COS and COS were studied using a Hitachi S-3200N scanning electron microscope (SEM) via a 20 kV electron beam.
A time of flight-secondary ion mass spectrometer (TOF-SIMS) was employed to study the catalyst surfaces. A TOF SIMS V (ION TOF, Inc., Chestnut Ridge, NY, USA) instrument equipped with a Binm+ (n = 1–5, m = 1, 2) liquid metal ion gun, Cs+ sputtering gun and electron flood gun for charge compensation was used. Both the Bi and Cs ion columns are oriented at 45° with respect to the sample surface normal. The instrument vacuum system consisted of a load lock for rapid sample loading and an analysis chamber, separated by the gate valve. The analysis chamber pressure was maintained below 5.0 × 10⁻⁹ mbar to avoid contamination of the surface to be analyzed.
For high mass resolution spectra acquired in this study, a pulsed Bi3+ primary ion beam at 25 keV impact energy with less than 1 ns pulse width was used. The total accumulated primary ion dose data acquisition was less than 1 × 10¹³ ions/cm2, an amount of ions which is within the static SIMS regime. The mass resolution on Si wafer is about ~8000 m/Δm at 29 AMU. First, the fresh catalyst (Na-COS) was analyzed directly. Subsequently, to determine the adsorption of reactants on the catalyst surface, 0.1 g Na-COS was soaked into 2 mL soybean oil and 1 mL methanol, respectively, for 10 min. The catalyst was then separated and washed five times using hexane and dried at 70 °C in the oven and subjected to TOF-SIMS analysis.
2.3. Batch Experiments
Transesterification reactions were performed in 250 mL three-neck glass reactor in duplicates. A typical reaction consisted of 24 mL of pure soybean oil (Wesson) mixed with a predetermined amount of methanol (Certified ACS, CAS 67-56-1, Fisher Scientific, Pittsburgh, PA, USA) and catalyst on a process-controlled hot plate (Isotemp, Fisher Scientific, Pittsburgh, PA, USA). A predetermined amount of HPLC grade hexane (CAS 110-54-3, Fisher Scientific, Pittsburgh, PA, USA) (based on the volumetric ratio of methanol to hexane equal to 1.83:1) was added to the reaction mixture as the co-solvent. Temperature and stirring rate were set to 62 °C and 800 rpm, respectively. While the reaction was progressing, a 0.3 mL sample was withdrawn every 10 min for the first hour and every 20 min for the second hour. The reaction was stopped after 2 h. All samples were centrifuged at 14,000× g rpm to remove the solids. The remaining liquid was placed in an oven at 70 °C for 30 min to remove methanol, and then washed with deionized (DI) water. Washed samples were centrifuged again at 14,000 rpm, and the supernatant liquid was analyzed using a gas chromatograph equipped with a mass spectrometer.
2.4. Gas Chromatograph–Mass Spectrometer (GC-MS) Analysis
The FAME concentration was determined using a gas chromatograph coupled with a mass spectrometric detector (Agilent 7890/5975C VLMSD) and equipped with an Agilent HP-Plot Q column. Ultra-high pure helium (3 L min−1) was used as a carrier gas. The instrument was set to an inlet temperature 250 °C while the oven temperature maintained at 100 °C for 2 min and was increased to 250 °C at a rate of 15 °C min−1 and maintained at 250 °C. Methyl laurate (99% purity, CAS 111-82-0, from Alfa Aesar, Tewksbury, MA, USA) was used as an internal standard for quantitative analysis of FAME concentration. The ratio of FAME peak area to internal standard peak area was calculated for each sample. FAME yields were calculated as proposed by Liu et al. and Chung et al. [7,26].
2.5. Experimental Design
A two-factor randomized complete block design was employed in which the levels of MR were maintained at 6, 12, and 18, while the levels of CL (mass of catalyst/mass of oil in %) were maintained 2%, 4%, 6%, and 8%. All 12 experiments were performed at 62 °C and 800 rpm in duplicates.
3. Results and Discussion
3.1. Catalyst Characterization
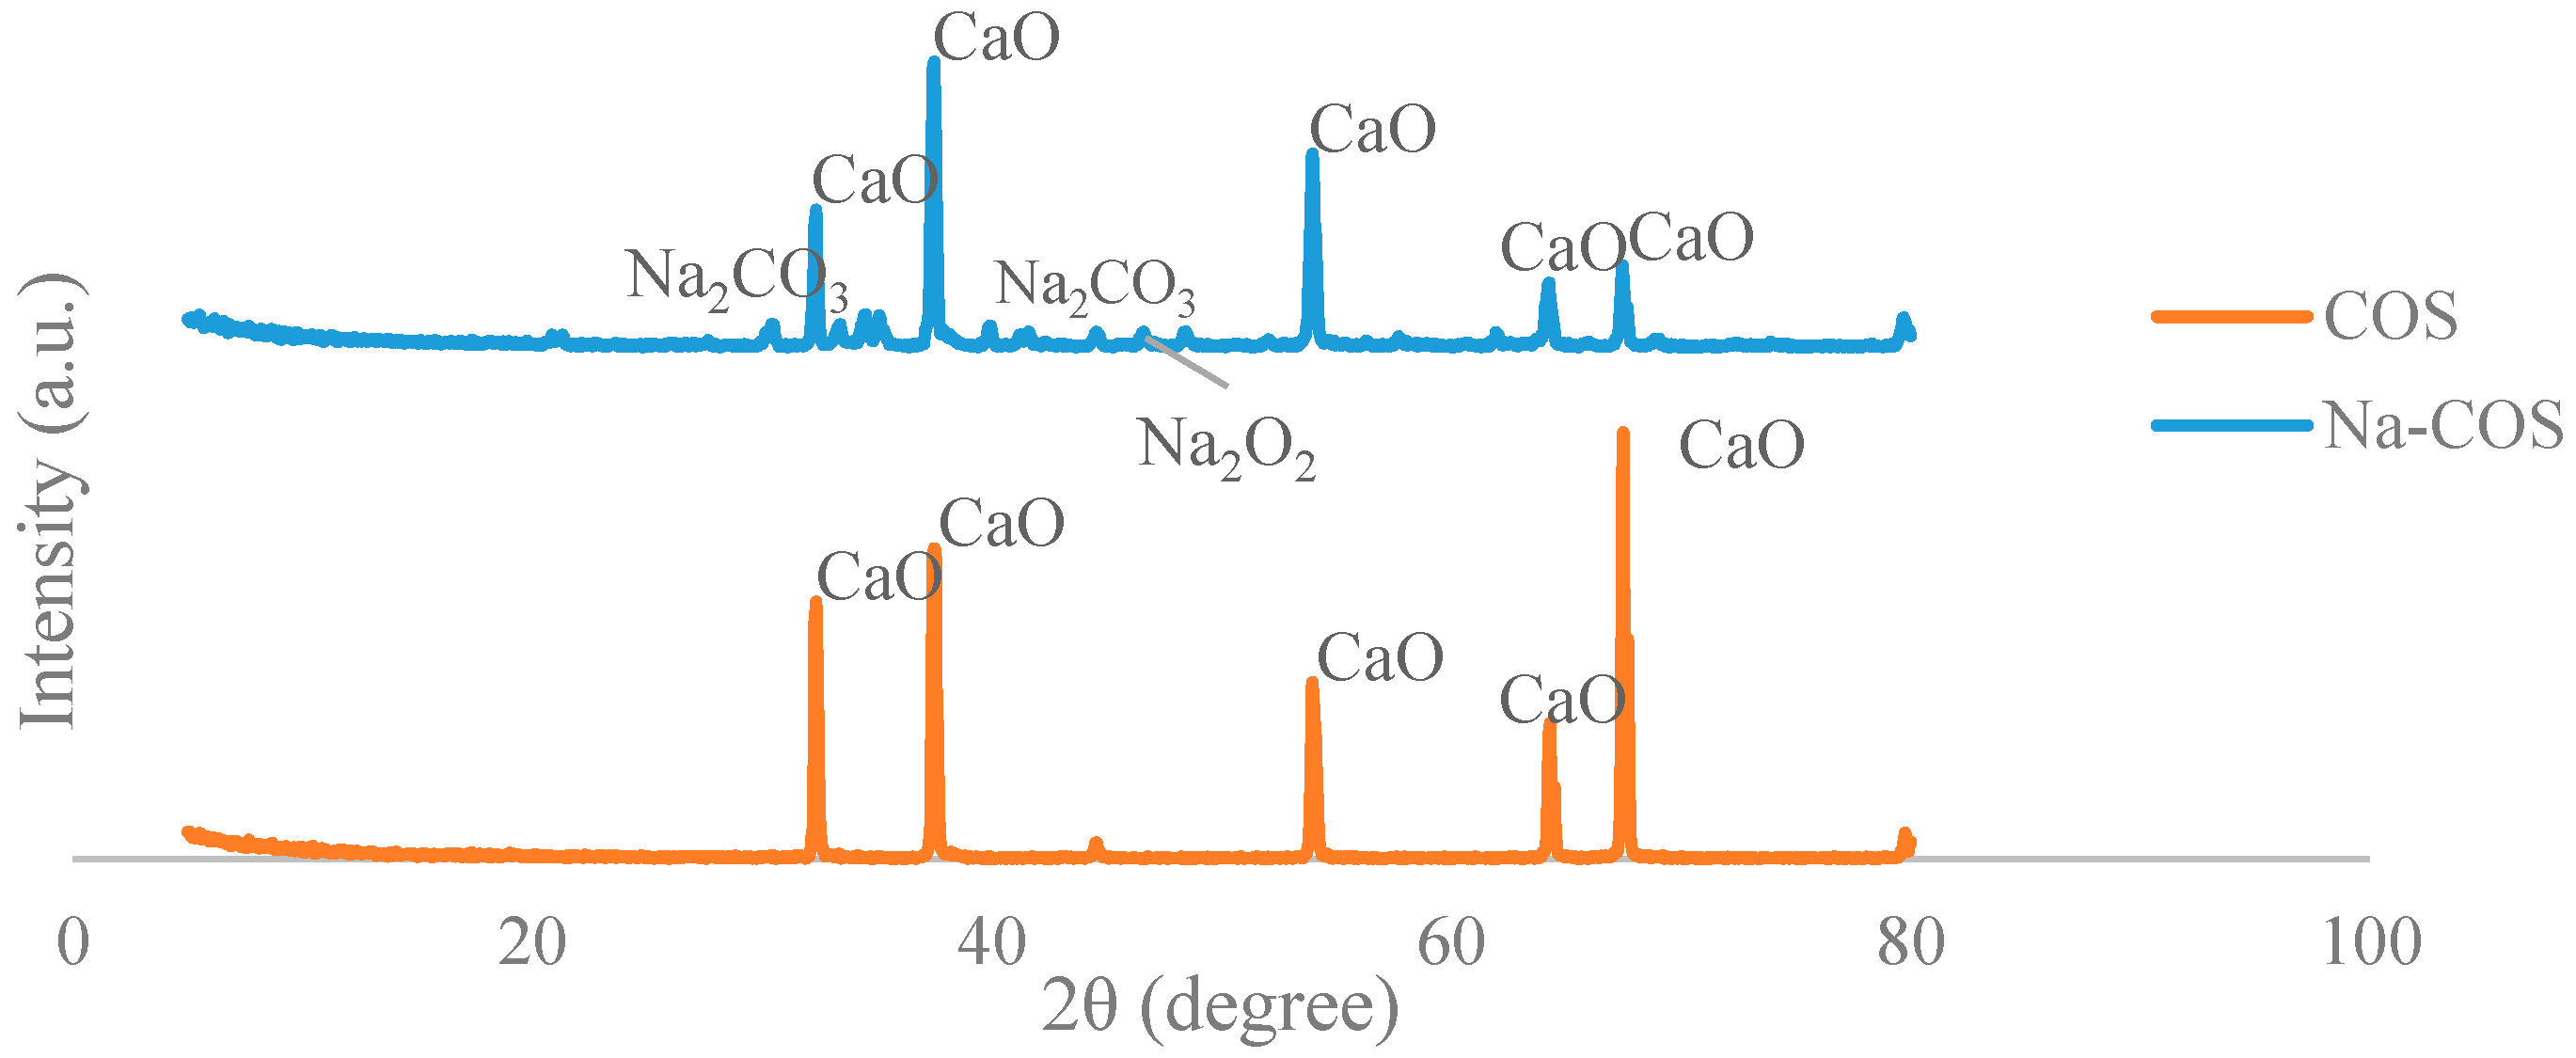
The X-ray diffraction (XRD) analyses were conducted to investigate the bulk structure and crystallinity of the catalyst. The XRD pattern of the COS (Figure 1) presented five major peaks (2θ = 32.35°, 37.5°, 53.95°, 64.3°, 67.5°), all of which were the characteristic peaks of CaO, indicating that the major component of COS is CaO. No characteristic peak of CaCO3 was presented, suggesting that CaCO3 in the oyster shell had been converted into CaO. The XRD pattern of the Na-COS (Figure 1) showed a few additional peaks than those observed with COS. After impregnation of NaOH and subsequent calcination, the resulting catalyst acquired two new phases, Na2O2 and Na2CO3, indicated by the newly generated peaks at 2θ = 46.6° and 2θ = 30.45°, 34.5°, 35.1°, 39.9°, 41.3°, 41.6°, respectively.
Similar observations were reported by Xie et al, wherein KNO3-impregnated Al2O3 was observed to acquire a newly-generated K2O phase [27]. The addition of alkaline metal on the oxide would facilitate the insertion of the alkaline metal ions into the vacant sites of the oxide, thereby enhancing the basicity during calcination.
The formation of Na2CO3 phase probably resulted from the abundant surface NaOH species, which perhaps reacted with the CaCO3 to form Na2CO3 during the calcination process. Since Na2CO3 exhibited weak basic strength, the increased catalytic activity of the Na-COS may thus be attributed to the formation of Na2O2 on the shell surface.
The XPS analysis showed the difference in surface species between Na-COS and COS (Figure 2). In COS, the Na might be the composition element of the original oyster shell [28]. The data also indicated that the proportion of Na increased while the proportion of Ca decreased in Na-COS, possibly due to adsorption of NaOH and subsequent calcination, which may have covered the Ca species. In addition, the percentage of oxygen in Na-COS decreased when compared to COS, suggesting that carbonate had been converted into oxide.
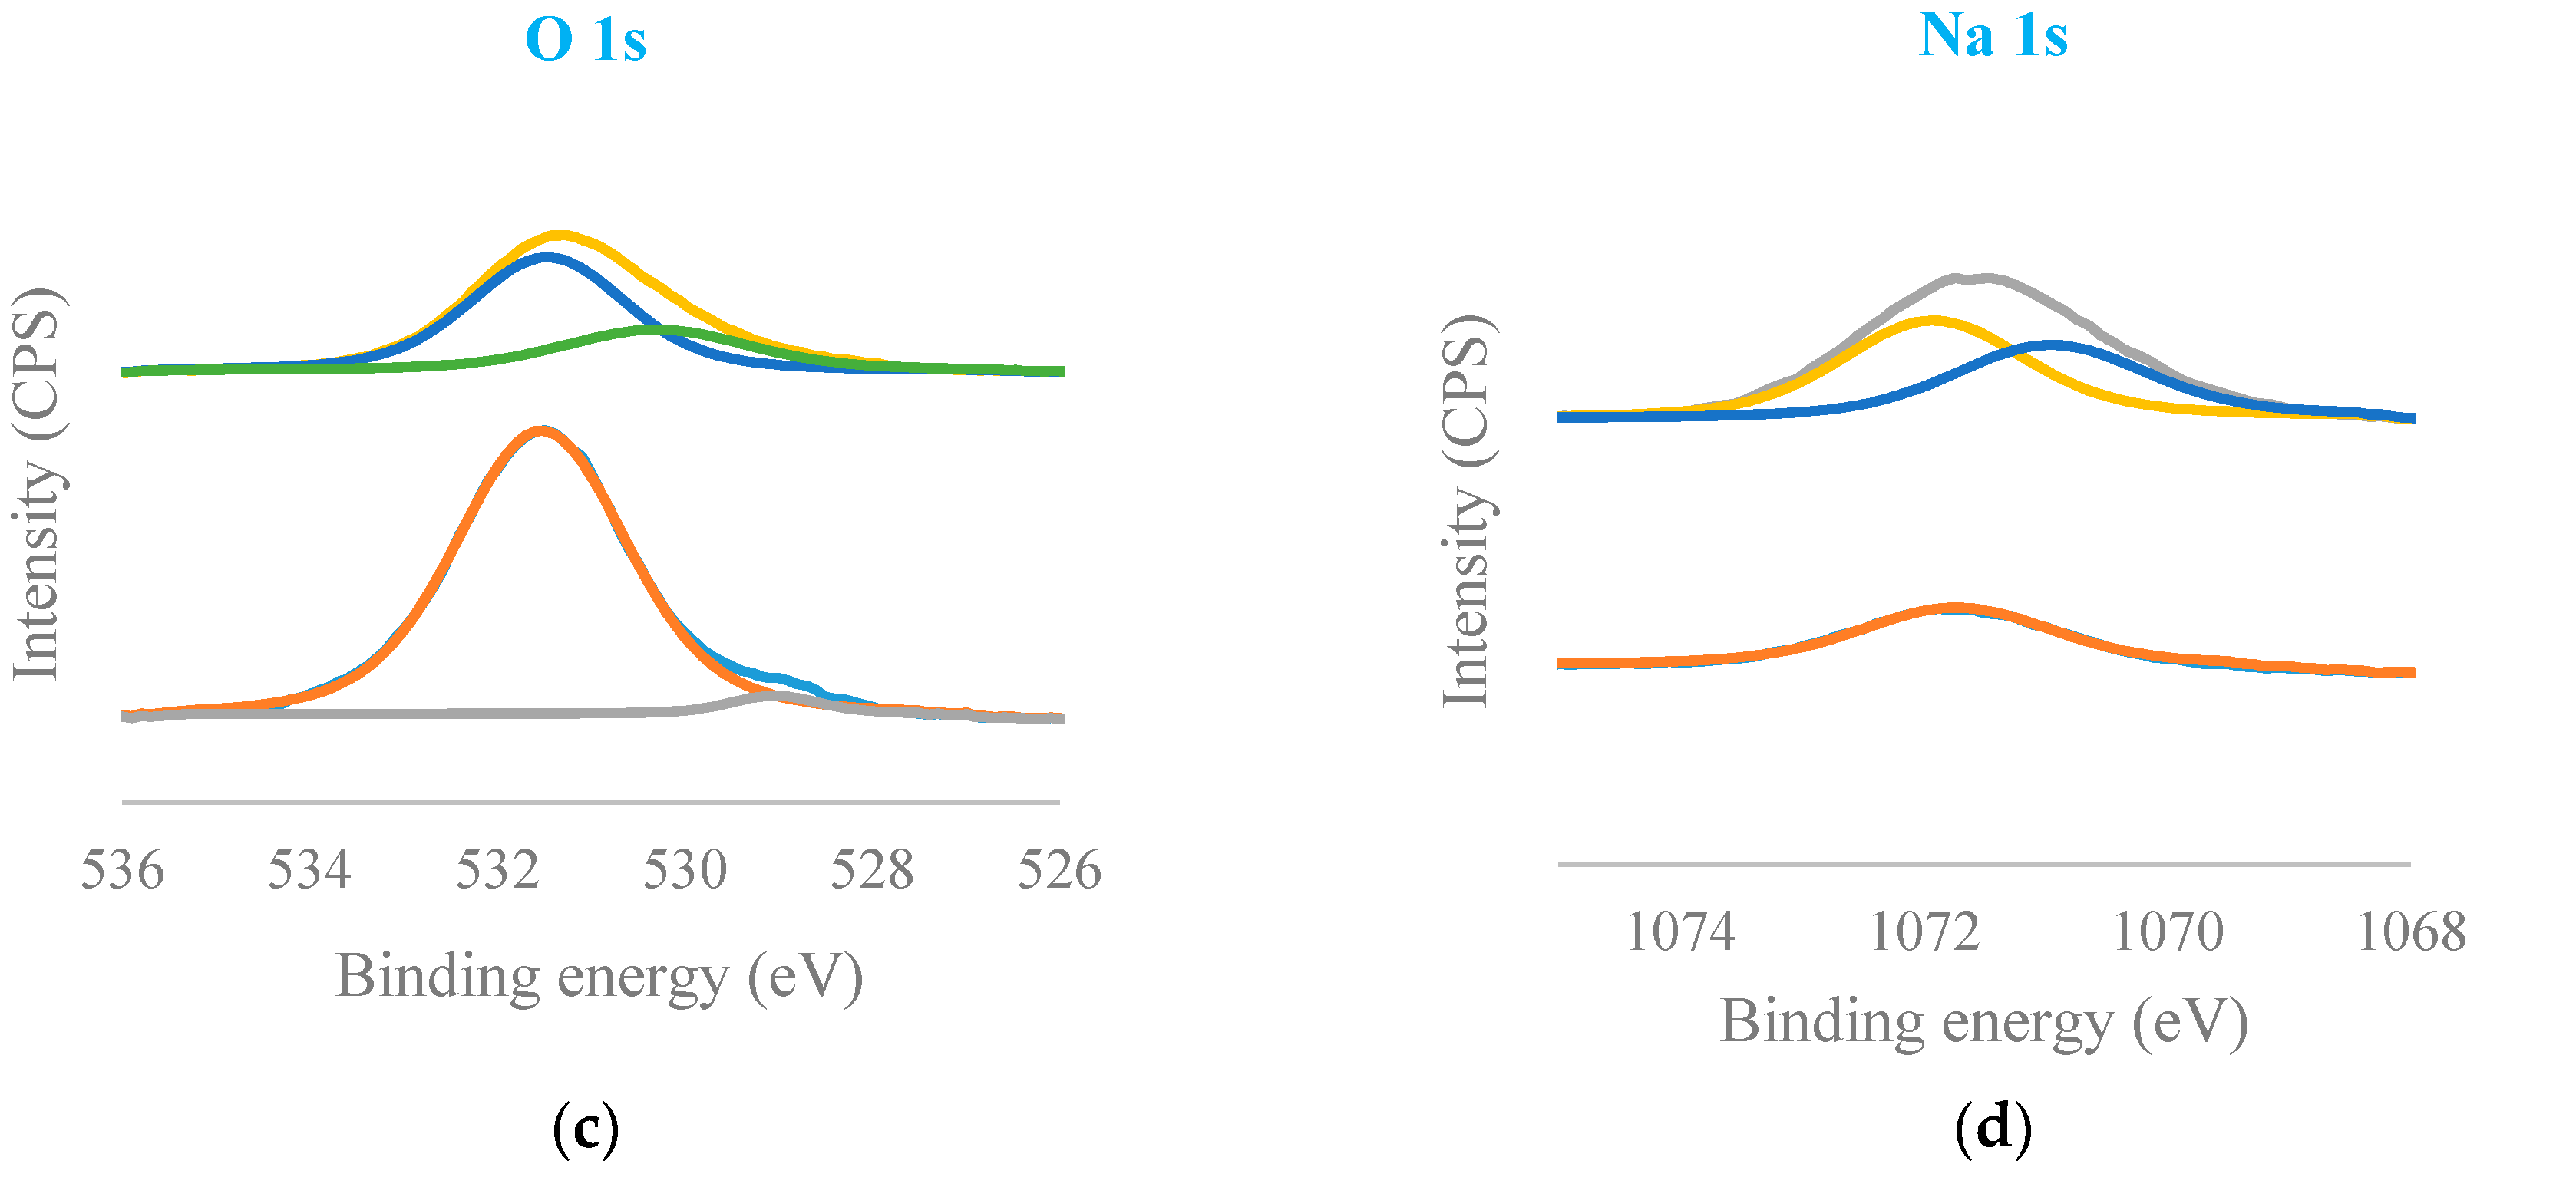
Figure 3 presented C 1s, Ca 2p, O 1s, and Na 1s regions for COS (bottom) and Na-COS (top). In the C 1s region, both COS and Na-COS exhibited two signals at 285.0 eV and 289.6 eV, due to C-H and carbonate groups, respectively [29]. The Ca 2p of COS and Na-COS exhibited a doublet with a separation of 3.5 eV, 2p1/2, and 2p3/2 components, whose binding energy (BE) values were 347.00 eV, 350.5 eV, and 346.3 eV, 349.8 eV, respectively, suggesting that the Ca was associated with CaO [30,31]. In the O 1s spectra, both COS and Na-COS displayed doublet peaks; however, the intensity distribution was different. Both COS and Na-COS showed the major O 1s peak at 531.5 eV, assigned to CaO [30]. However, the percentage of this major peak only contributed to 69.8% of the total intensity in Na-COS, compared with 96.8%, in COS. The minor O 1s peak appeared at lower BE (530.3 eV and 529.0 eV for Na-COS and COS, respectively), contributed 30.2% to the total intensity in Na-COS and only 3.2% in COS, suggesting that more surface oxygen in Na-COS had been shifted to lower BE. The Na 1s spectra also differed between COS and Na-COS, as COS only displayed a single peak at 1071.7 eV while Na-COS displayed doublet peaks at 1071.9 eV and 1071.0 eV, indicating that two different Na species existed on the Na-COS surface. For COS, the Na originated from the oyster shell that led to a substantially lower intensity compared with Na-COS. For Na-COS, the substantially higher amount of Na attributed to the impregnated NaOH, and the two Na 1s peaks at 1071.0 eV and 1071.9 eV might be assigned to Na2CO3 and Na2O2, respectively, based on the XRD results. Compared with the references, these two Na 1s peaks were both negatively shifted [32,33,34]. The negative shift in O 1s indicated that the surface oxygen atoms acquired higher effective negative charge, which led to an increase in electron donating ability. The increased electron donating ability was attributed to the newly formed basic site, suggesting that the surface oxygen was more basic [35]. As shown in Figure 4, the increased electron donating ability may have facilitated the reaction between adsorbed triglyceride and methanol to form the tetrahedral intermediate, which further produced FAME under the structure rearrangement during transesterification [7]. Because Na-COS contained more negatively shifted surface oxygen than COS did, it was more active in forming the tetrahedral intermediate and, further, increasing the FAME production rate.
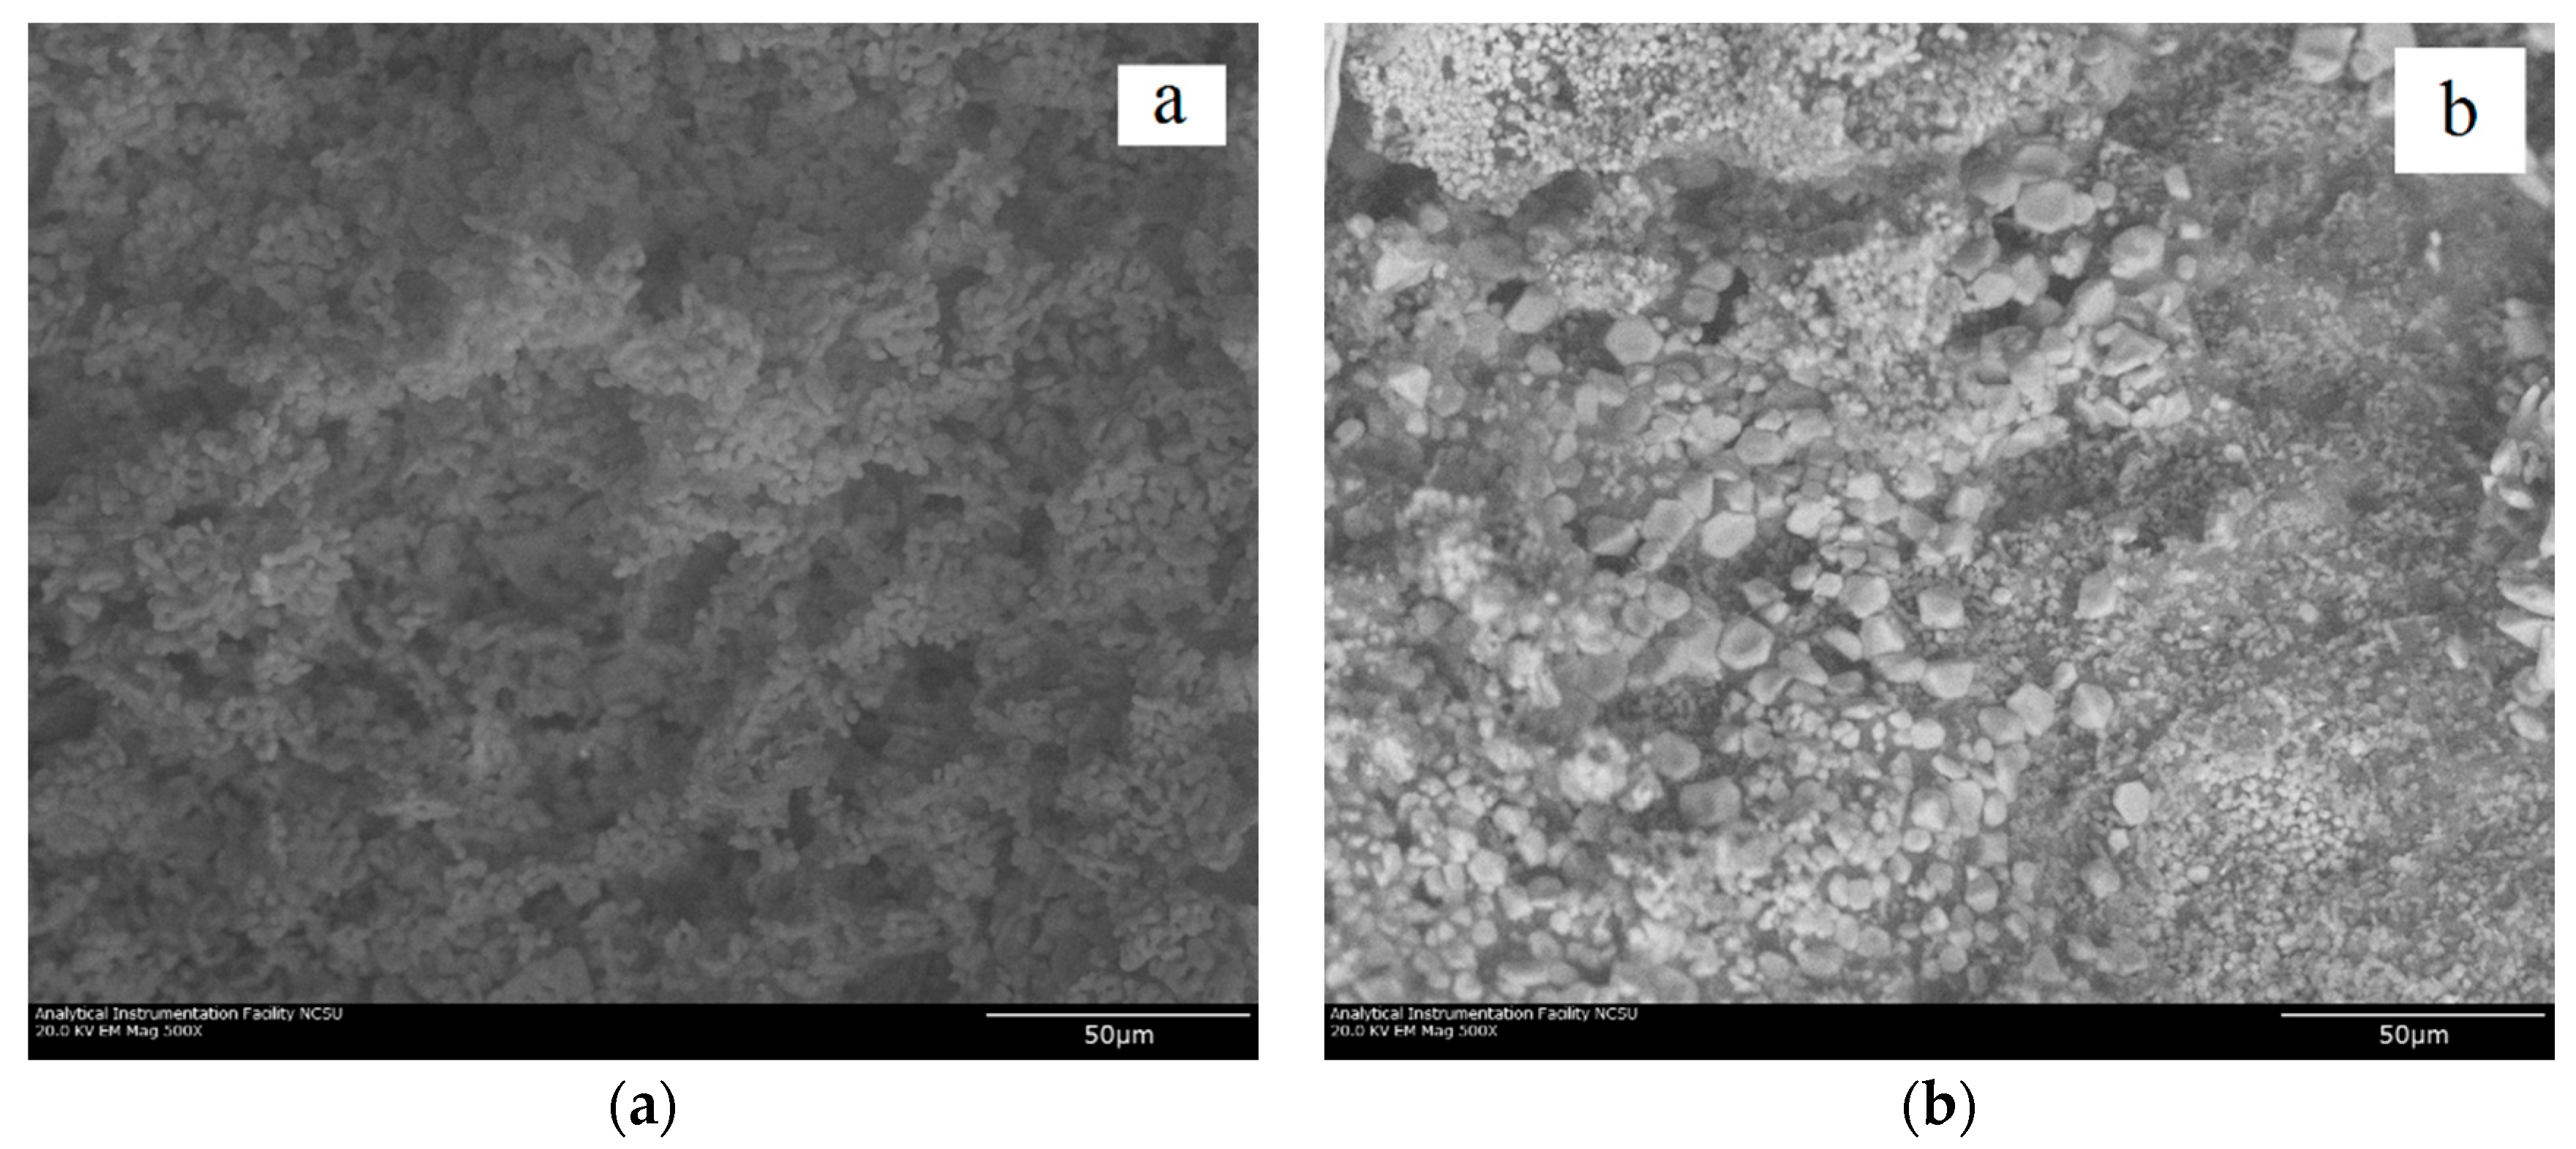
The scanning electron micrographs of morphologies of Na-COS and COS are shown in Figure 5. The surface of COS was nearly homogeneous and covered somewhat uniformly-sized CaO aggregates. However, on the surface of Na-COS, larger particles were generated due to the reaction between adsorbed NaOH and CaCO3. In addition, the morphology of Na-COS was more irregular than COS, probably because of the adsorbed NaOH prevented the complete calcination of the surface CaCO3 and led to the co-existence of both oxides and carbonates.
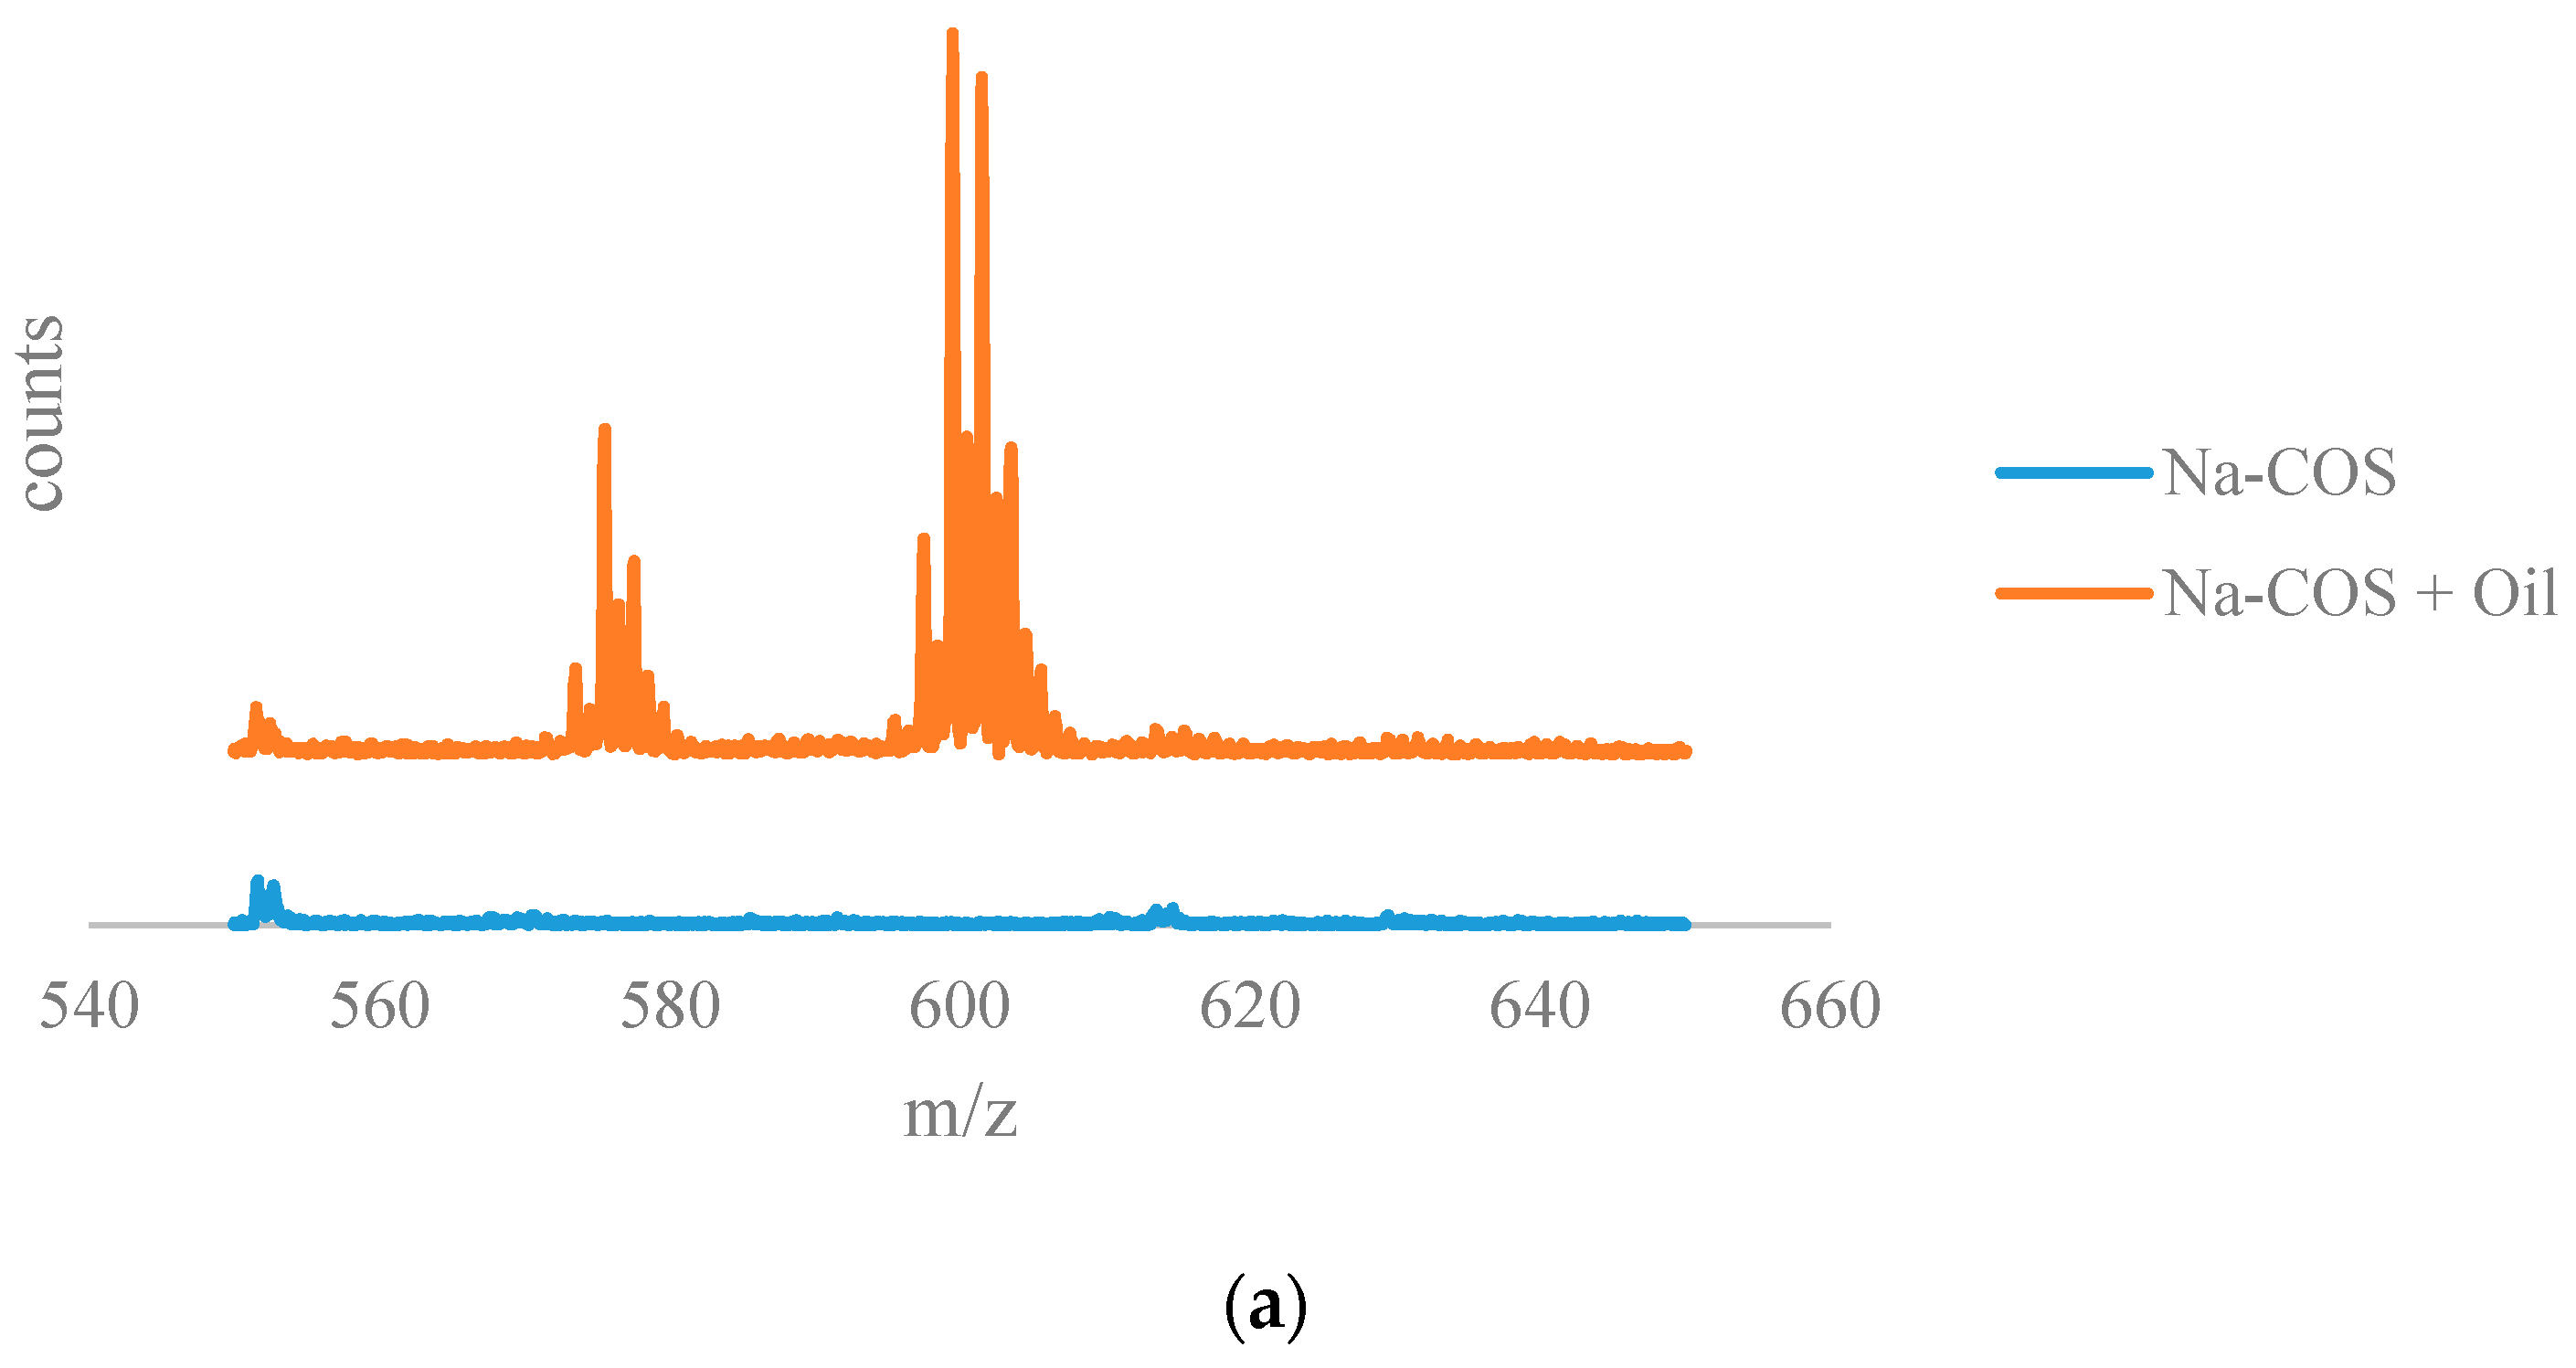
The results from the time of flight secondary ion mass spectrometry (TOF-SIMS) analysis are shown in Figure 6. The positive ion TOF-SIMS spectra (Figure 6a) of Na-COS (bottom) and soybean oil soaked Na-COS (top) showed that the soybean oil soaked Na-COS contained surface species with m/z values in the range of 590–610, while the fresh Na-COS did not. These surface species were plausibly generated from the triglyceride molecule, suggesting that the triglyceride molecule was adsorbed onto the Na-COS surface.
Figure 6b shows the negative on TOF-SIMS spectra for of Na-COS (top) and methanol-soaked Na-COS (bottom). Unlike soybean oil, methanol did not seem to adsorb on the surface of Na-COS. Based on XRD analysis, Na-COS was found to contain CaO and Na2O2 on its surface. Adsorption of methanol on Na-COS surface would have resulted in the formation of large peaks of Ca(CH3O)2 and Na(CH3O). However, in methanol-soaked Na-COS, the CH3O− peak intensity (5.8670 × 10⁻³) was even lower than the O2− peak intensity (1.0640 × 10⁻²). Considering that ionization of O2 to O2− is more difficult than the ionization of metal methoxide to negative methoxide ion, it is concluded that methanol molecule was not adsorbed on the Na-COS surface.
3.2. Batch Reactor Experiments
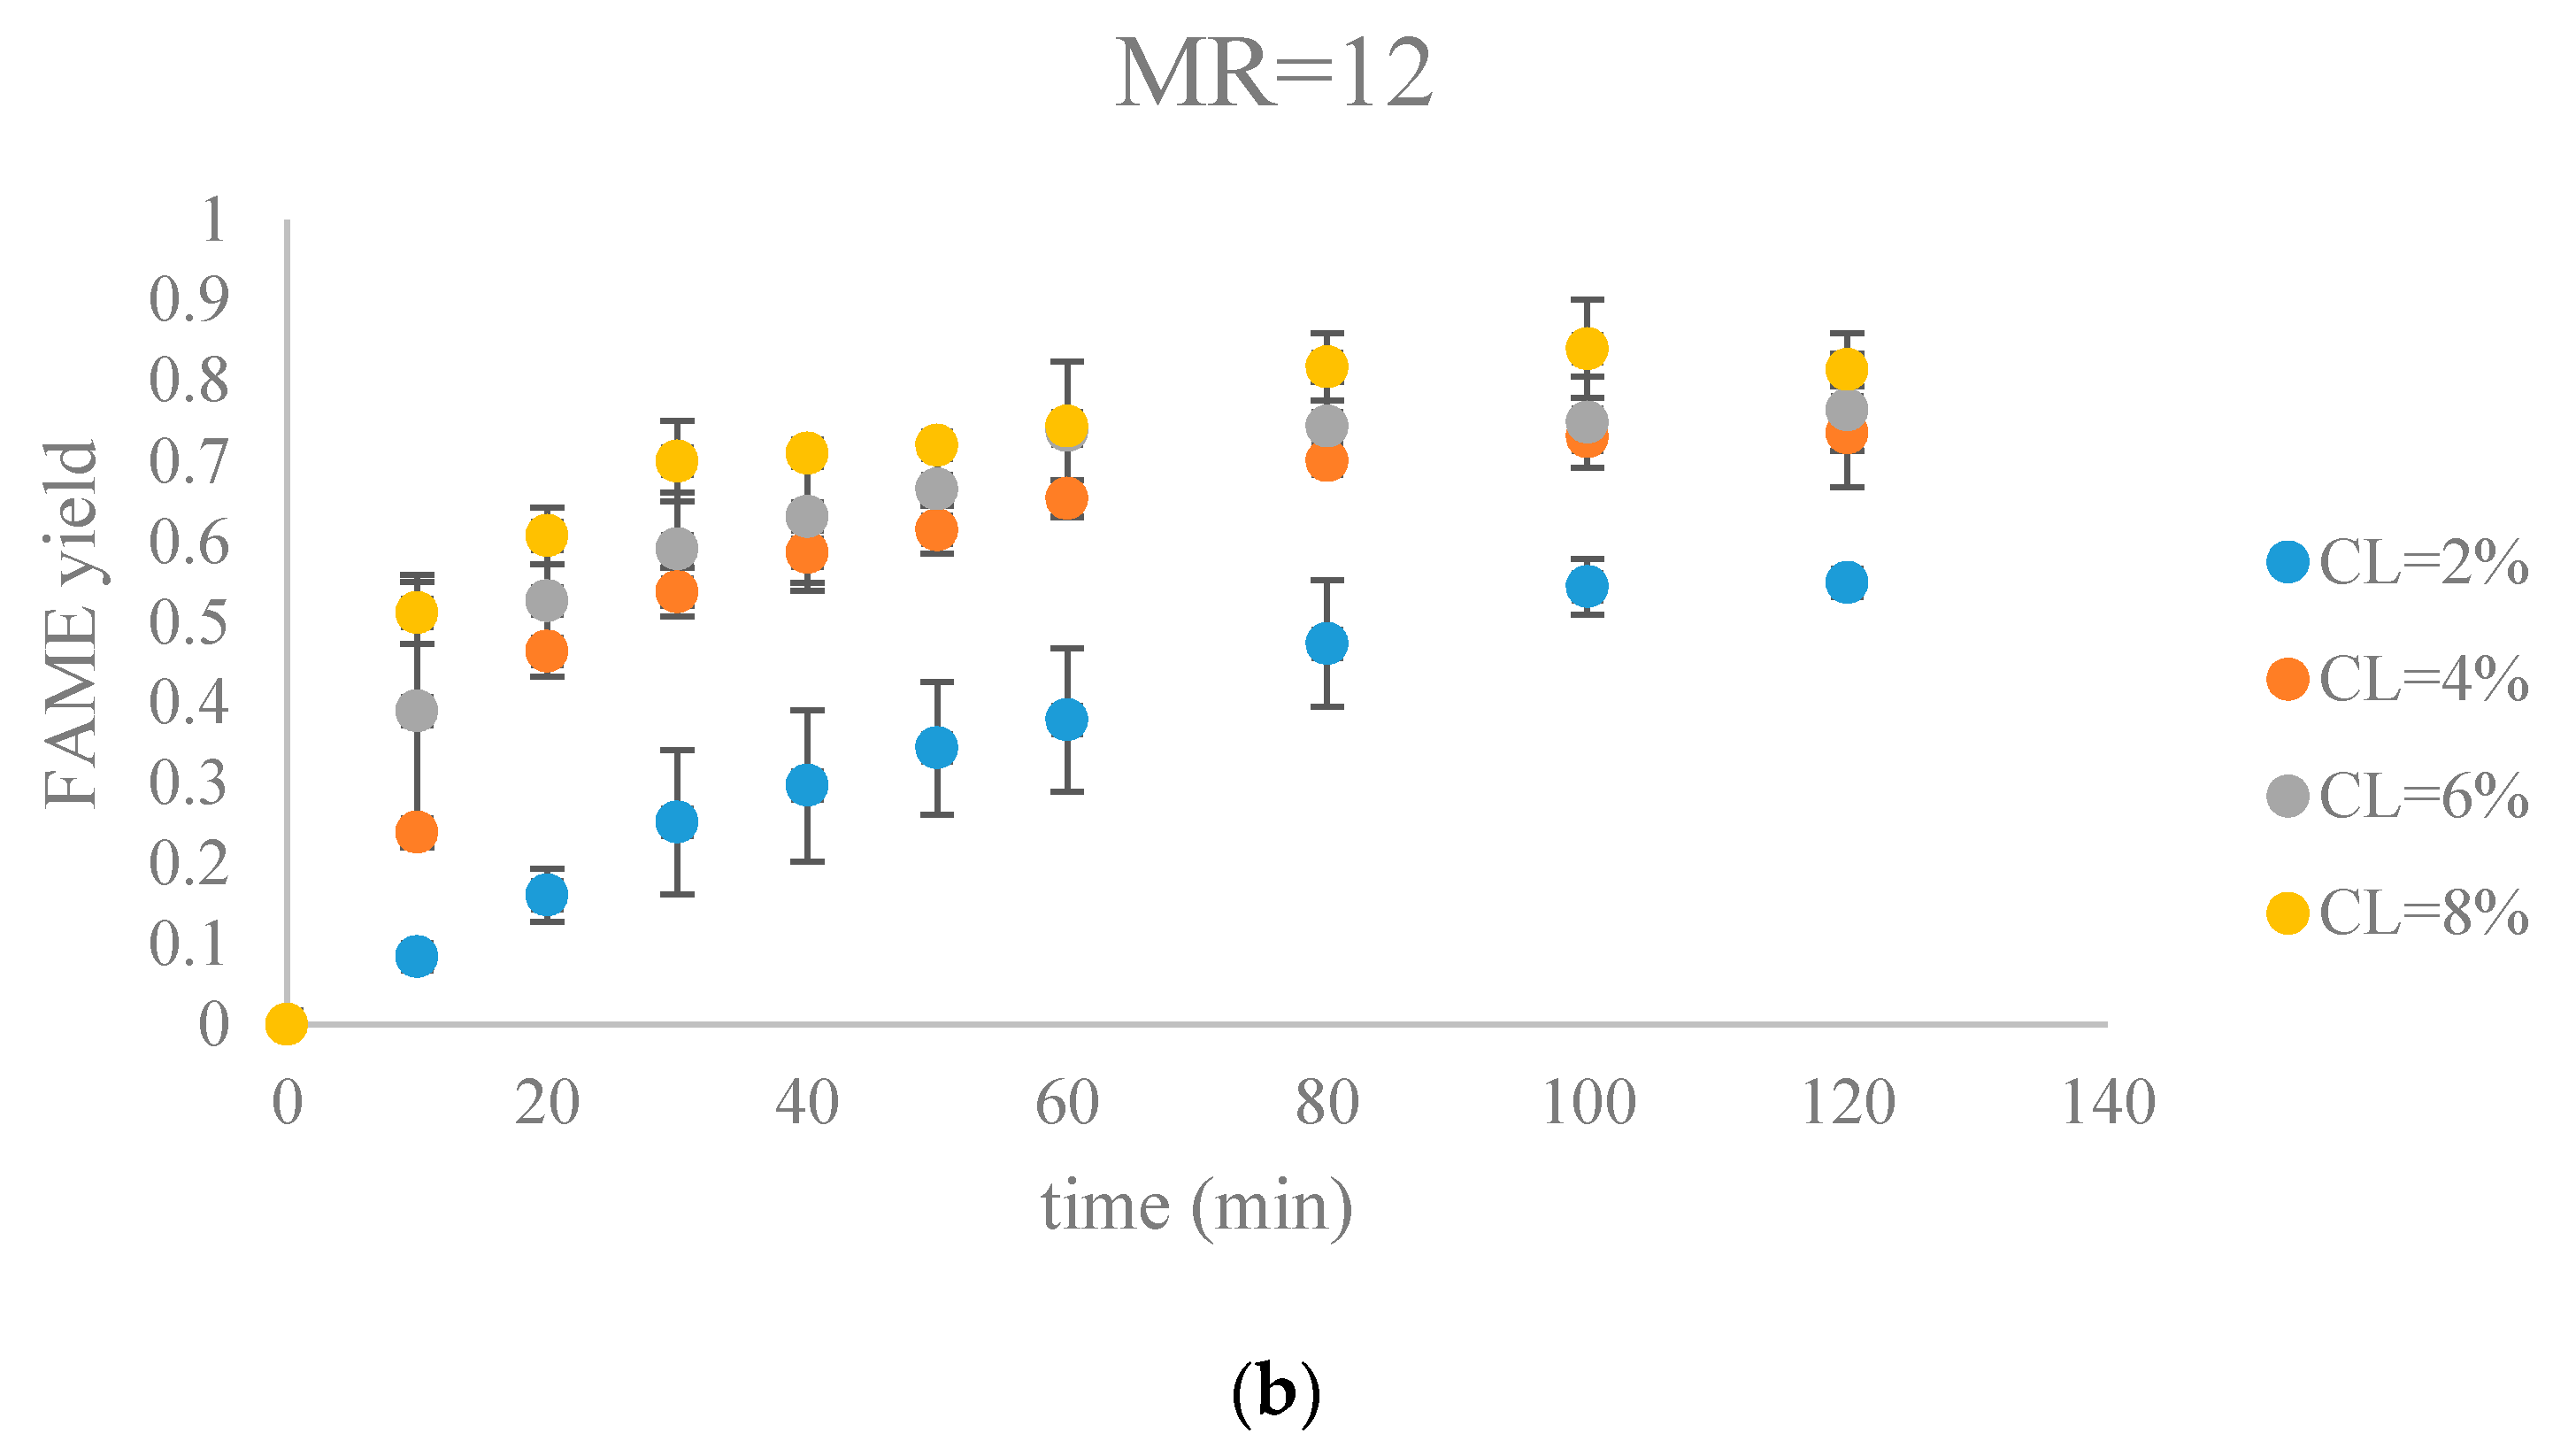
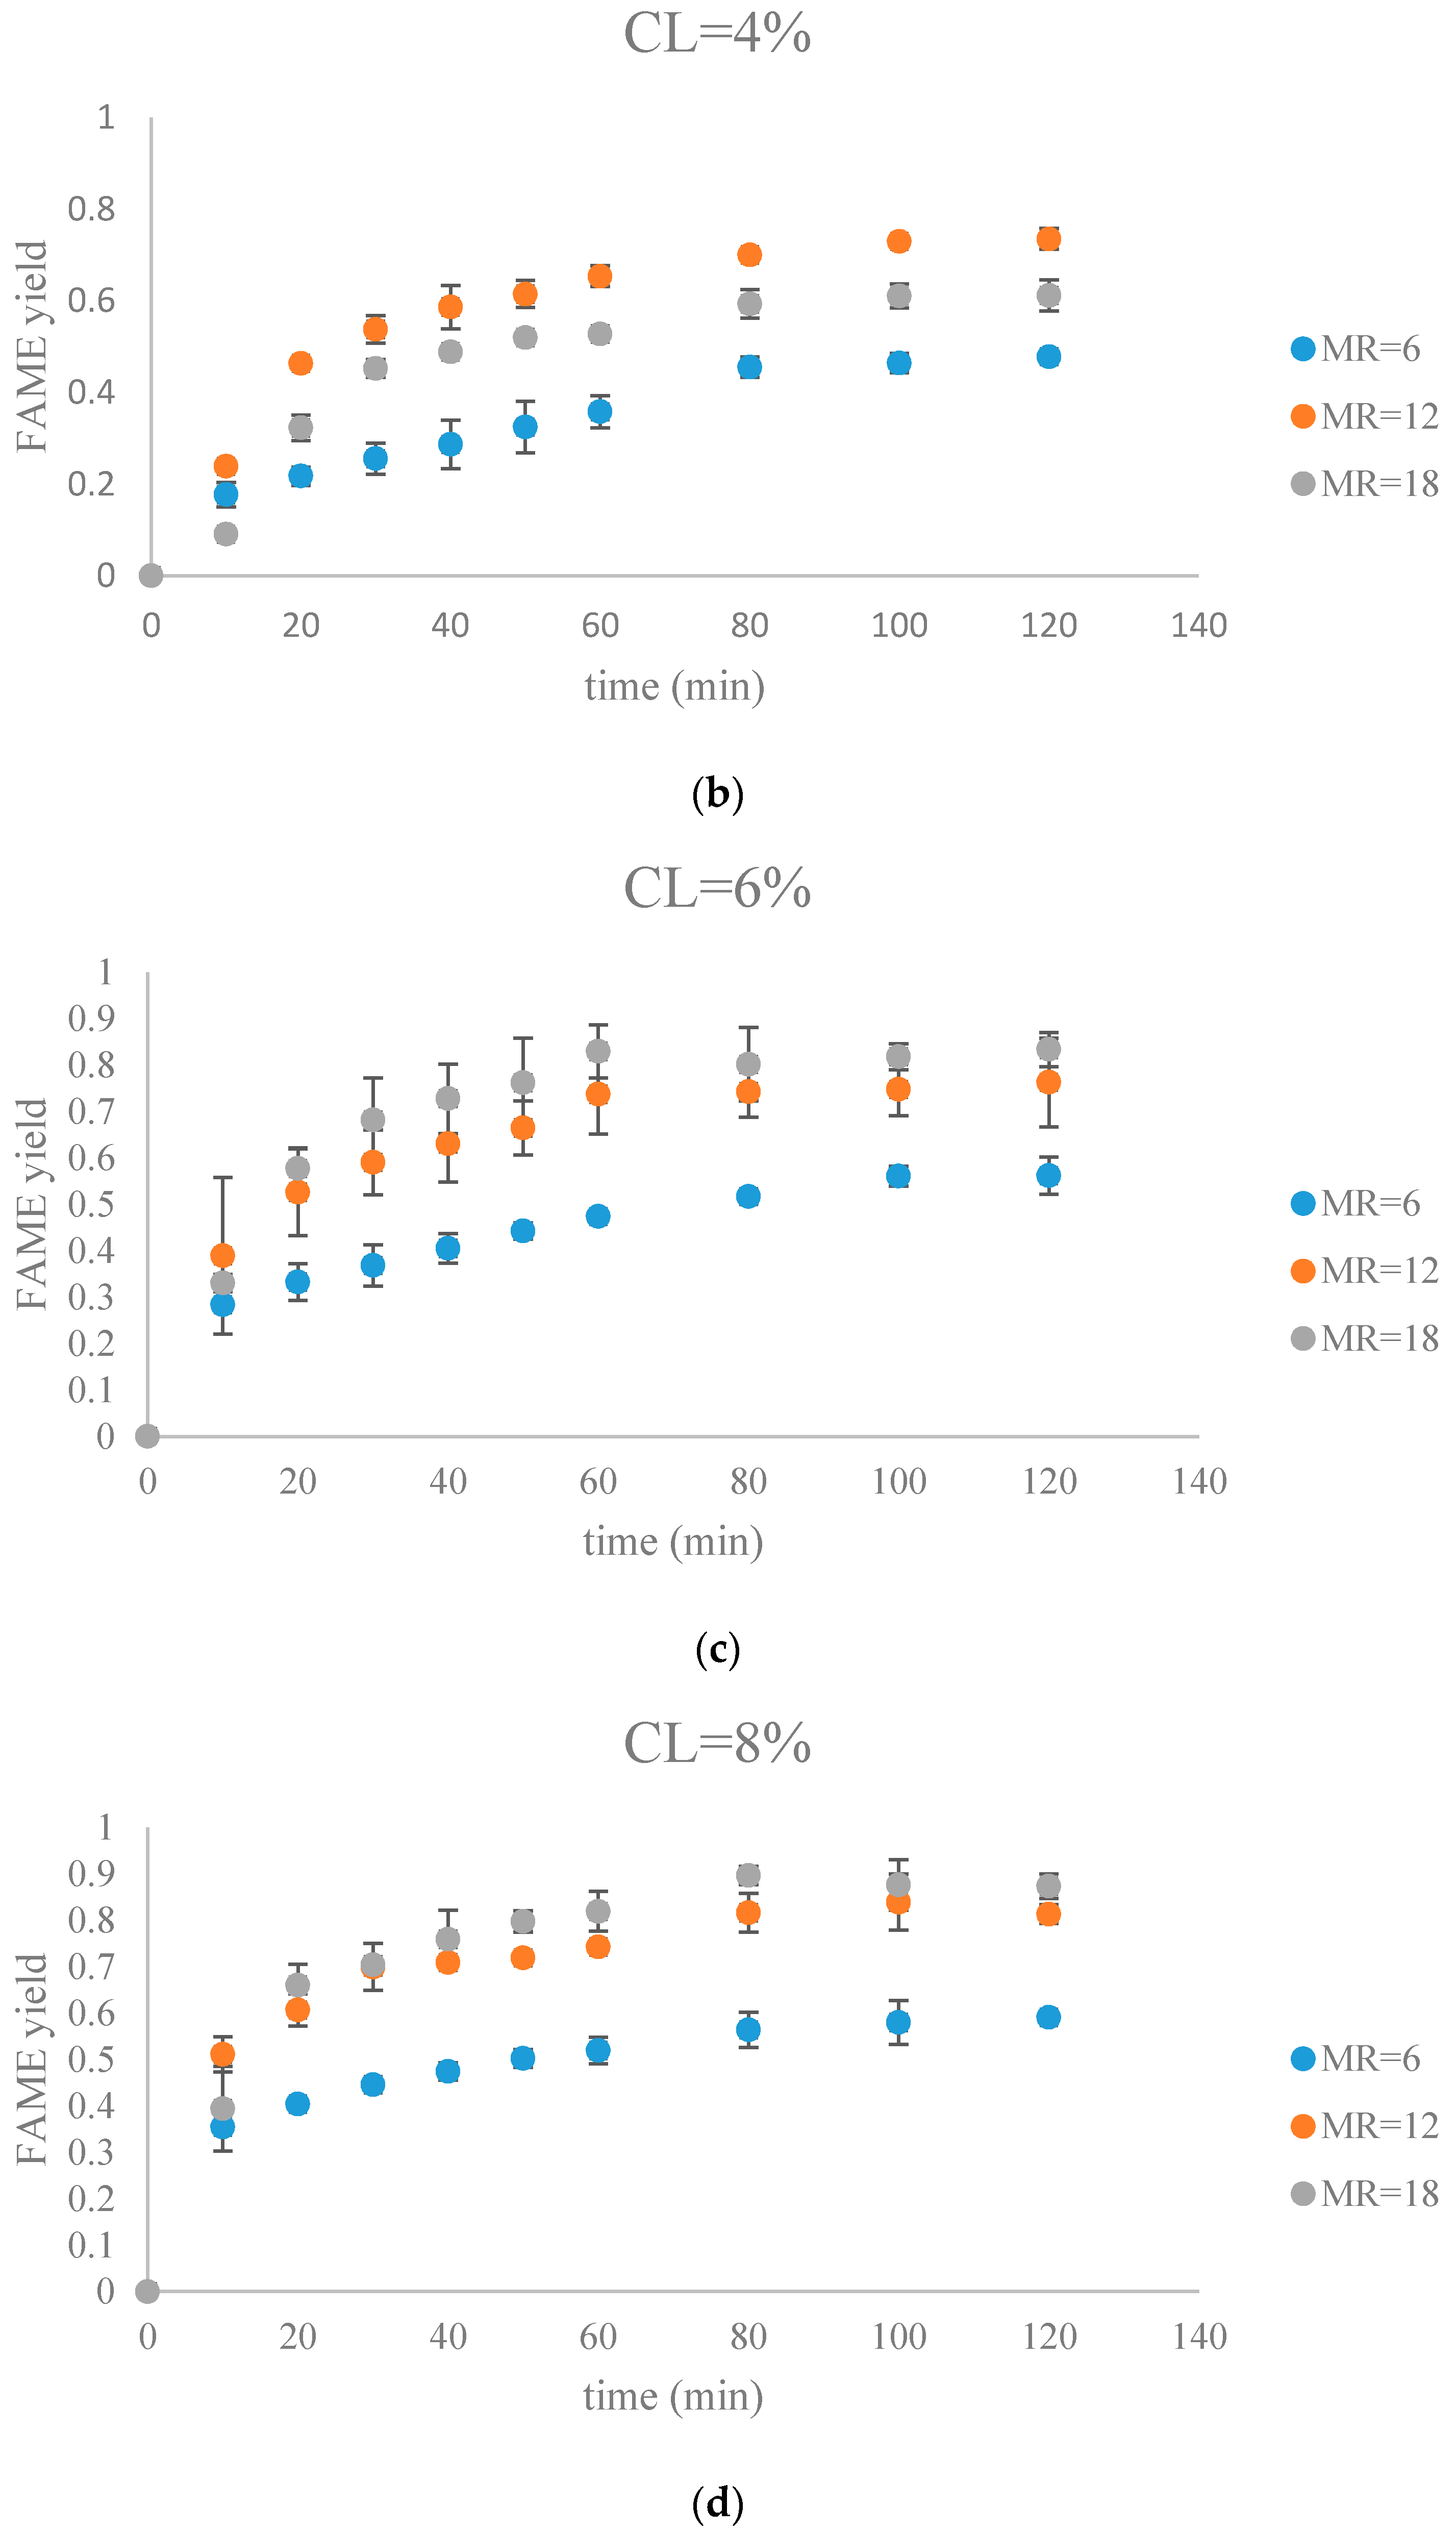
Figure 7 and Figure 8 show FAME yields obtained from transesterification reactions performed using different MRs and CLs. It appeared that the transesterification reaction started and progressed immediately from the beginning.
Our observations were different from the results reported by Veljkovic et al. and Miladinovic et al., where a slow initial reaction period existed due to the limited mass transfer rate of the triglyceride to the catalyst surface [18,19]. In our research, because hexane was used as a co-solvent to improve the mixing condition, the transesterification reaction was not limited by the mass transfer of triglyceride to the catalyst surface. Another reason might be the generation of the new phase, Na2O2, which was perhaps more active than CaO in the transesterification reaction. In our previous research, transesterification reaction catalyzed by COS showed almost no FAMEs formation in the first hour, suggesting that the surface CaO phase required some time to initiate the transesterification reaction [18,19]. In contrast, the Na-COS, containing the more catalytic active basic sites (Na2O2), catalyzed the reaction immediately once added into the reaction mixture.
From the plots, the FAMEs yields for all Na-COS catalyzed transesterifications increased rapidly for the first 20 min. However, after around 20 min the reaction started to slow down, probably because of the decreasing triglyceride concentration. During the initial reaction period, the surface of Na-COS was saturated with triglyceride; however, as the triglyceride consumed, the Na-COS surface was only partially occupied by the triglyceride after the initial period.
During the initial period (0–20 min), the rate of FAMEs yields at high CL (6%, 8%) was higher than that at the low CL (2%, 4%) at each MR level. This is probably because of availability of a greater number of active sites at higher CL. However, at high MR (12, 18), yields of FAMEs at 6% and 8% in the initial period (0–20 min) showed no significant difference. Excess methanol in the system resulted in a decreased concentration of total triglycerides thereby impacting the rate of FAMEs yield.
In our research, a maximum FAMEs yield of 89.7% was observed in the group of MR = 18, CL = 8% in 80 min. Our yield was similar to the 87% yield obtained from Xie et al. who employed KNO3/Al2O3 catalyst for transesterification of soybean oil [27]. Similar results were reported by other groups, as summarized in Table 1.
3.3. Kinetics of the Transesterification
From the proposed reaction mechanism, the reaction appeared to have occurred between adsorbed triglyceride and free methanol. The following assumptions were made to describe transesterification based on the work reported by Veljkovic et al. and Miladinovic et al. [18,19].
The initial reaction mixture was a three-phase system consisting of two immiscible liquids (triglyceride and methanol) and a solid (Na-COS). By using hexane as the co-solvent and vigorous stirring system (800 rpm), the mixture was considered as a two-phase system and perfectly mixed. The overall transesterification reaction was shown in [1]:
In this work, the FAME concentration was converted into FAME yield for data visualization and modeling. Based on the stoichiometry of the overall reaction shown above, the various concentration variables could be expressed in terms of the FAME yield, y, as below:
To develop the kinetic model, the following assumptions were made:
- The transesterification reaction occurred only on the Na-COS surface. The homogeneous transesterification reaction was negligible and thus was not considered.
- The produced FAMEs did not neutralize the basic site of the Na-COS. Therefore, the total amount of the basic site for the Na-COS did not change throughout the reaction.
- Because of continuous stirring of reactants (800 rpm), there was no mass transfer limitation between reactant and the Na-COS surface. Therefore, the production rate of FAMEs depended only on the transesterification reaction rate.
- The catalyst was assumed to be covered by triglyceride (TG*) only.
- TG was assumed to have high adsorption on the catalyst surface.
- The TG adsorption/desorption process (shown below) was fast and at equilibrium.
- The transesterification occurred in a stepwise manner as below:
- The stepwise reaction of transesterification was assumed to be irreversible in the initial period (0–20 min).
- The reaction from TG* to DG* was assumed to be the rate-determining step.
The data collected for the initial reaction period (0–20 min) was used to estimate the kinetic parameters in each model. The estimation was performed using Newton-Gauss algorithm via JMP software (Version 12.2.0, SAS Institute). The estimated kinetic parameter was presented as an estimated value ± standard error.
Based on the assumptions above, the starting rate equation was formulated as below:
From assumption 5, the catalyst is assumed to be covered by triglyceride (TG*) only, since once the diglyceride (DG*) or monoglyceride (MG*) was formed, it was immediately consumed due to its fast consumption rate. By applying the basic site balance, the TG* concentration was expressed as below:
The rate equation was re-expressed as below:
The TG was assumed to have high adsorption on the catalyst surface, suggesting that . Hence,
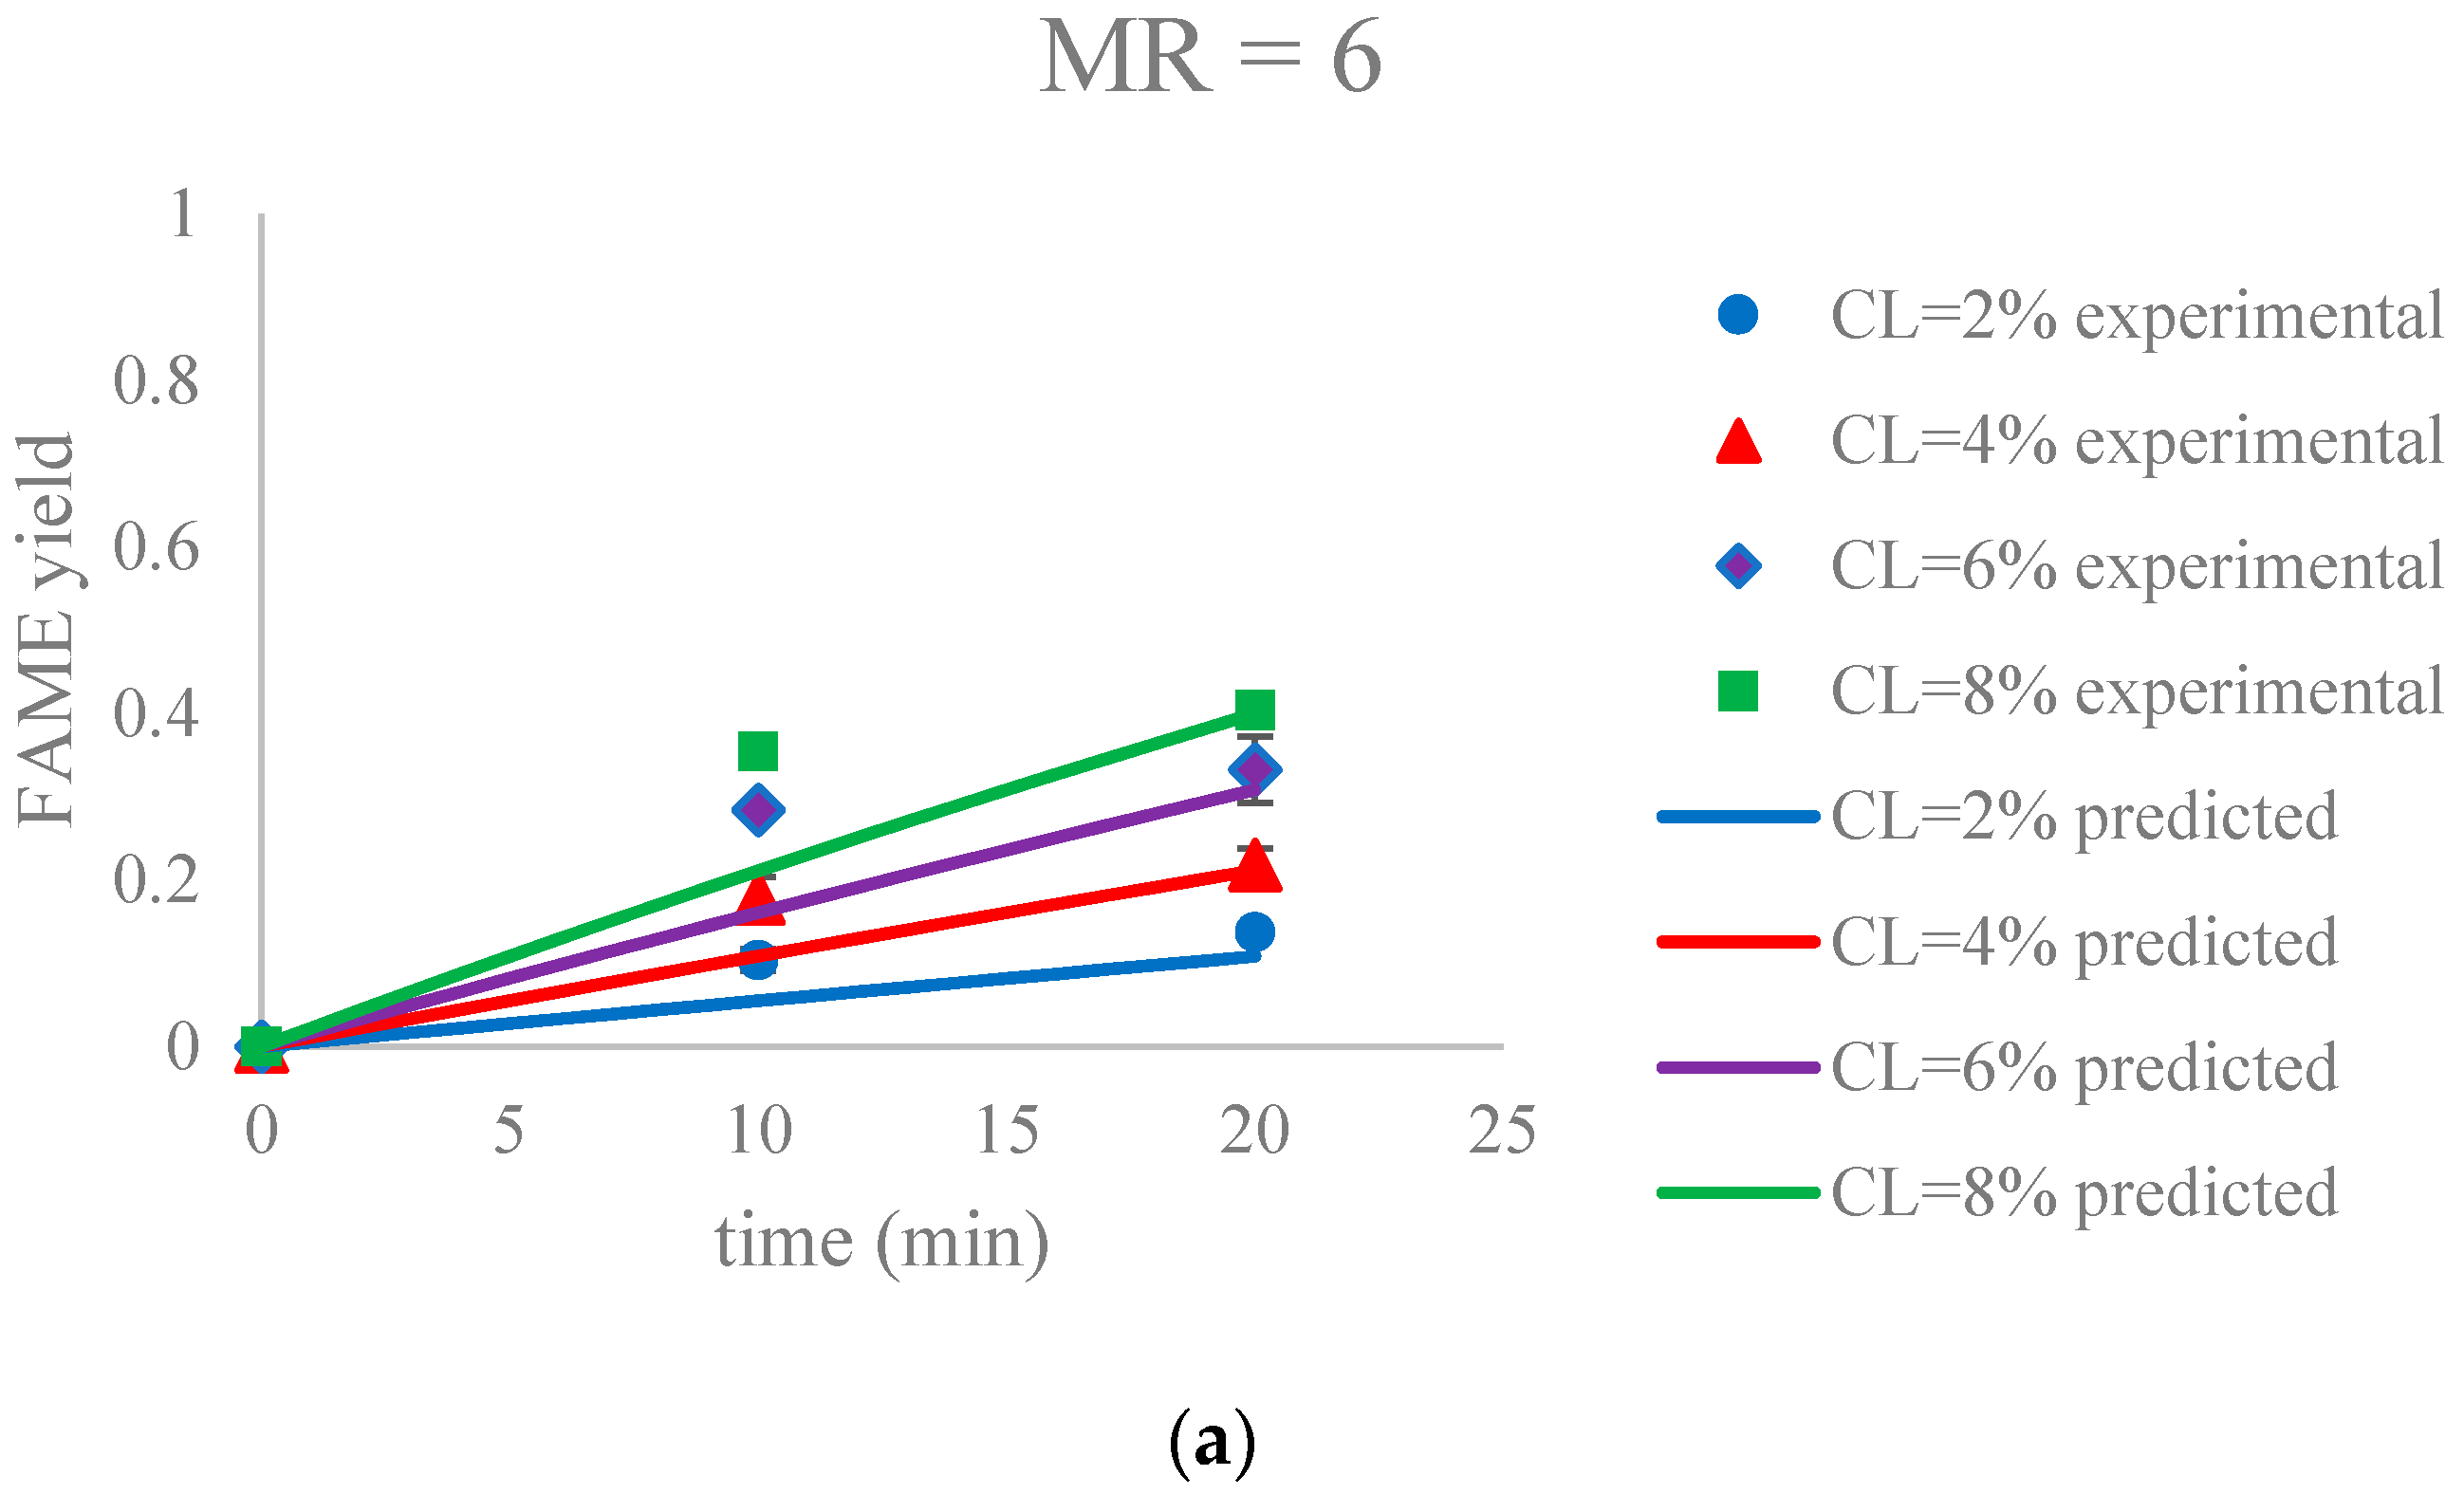
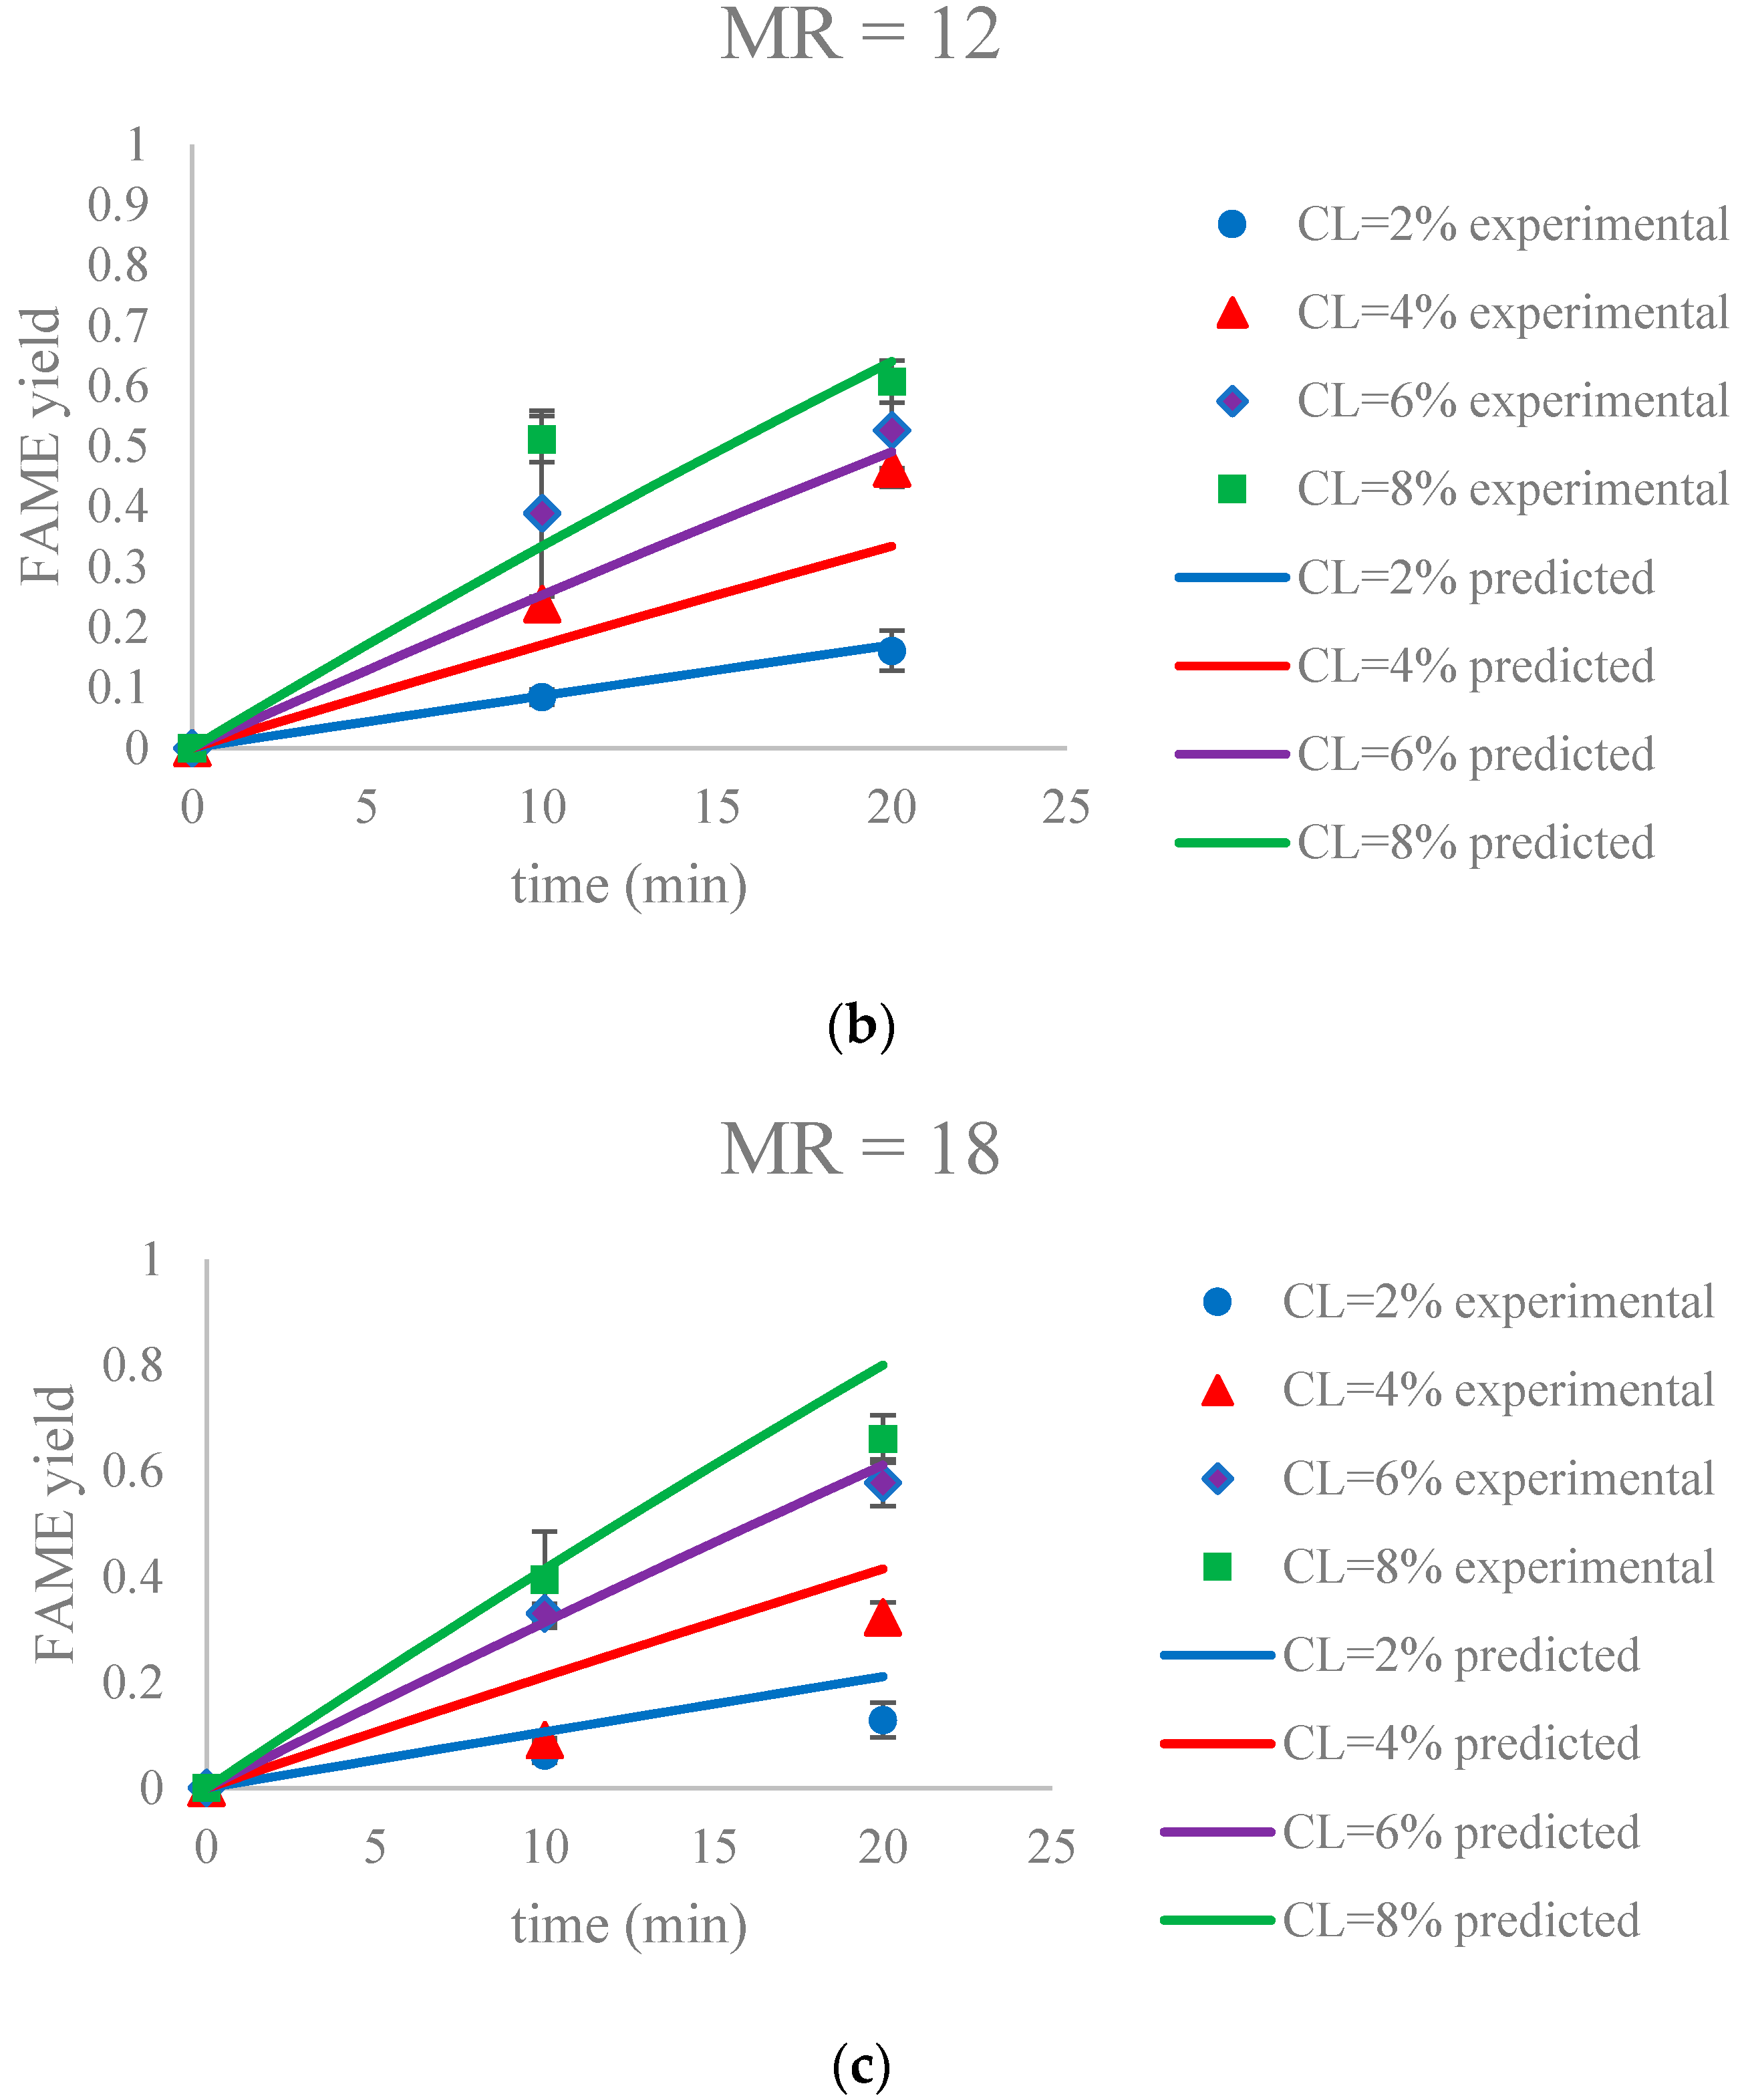
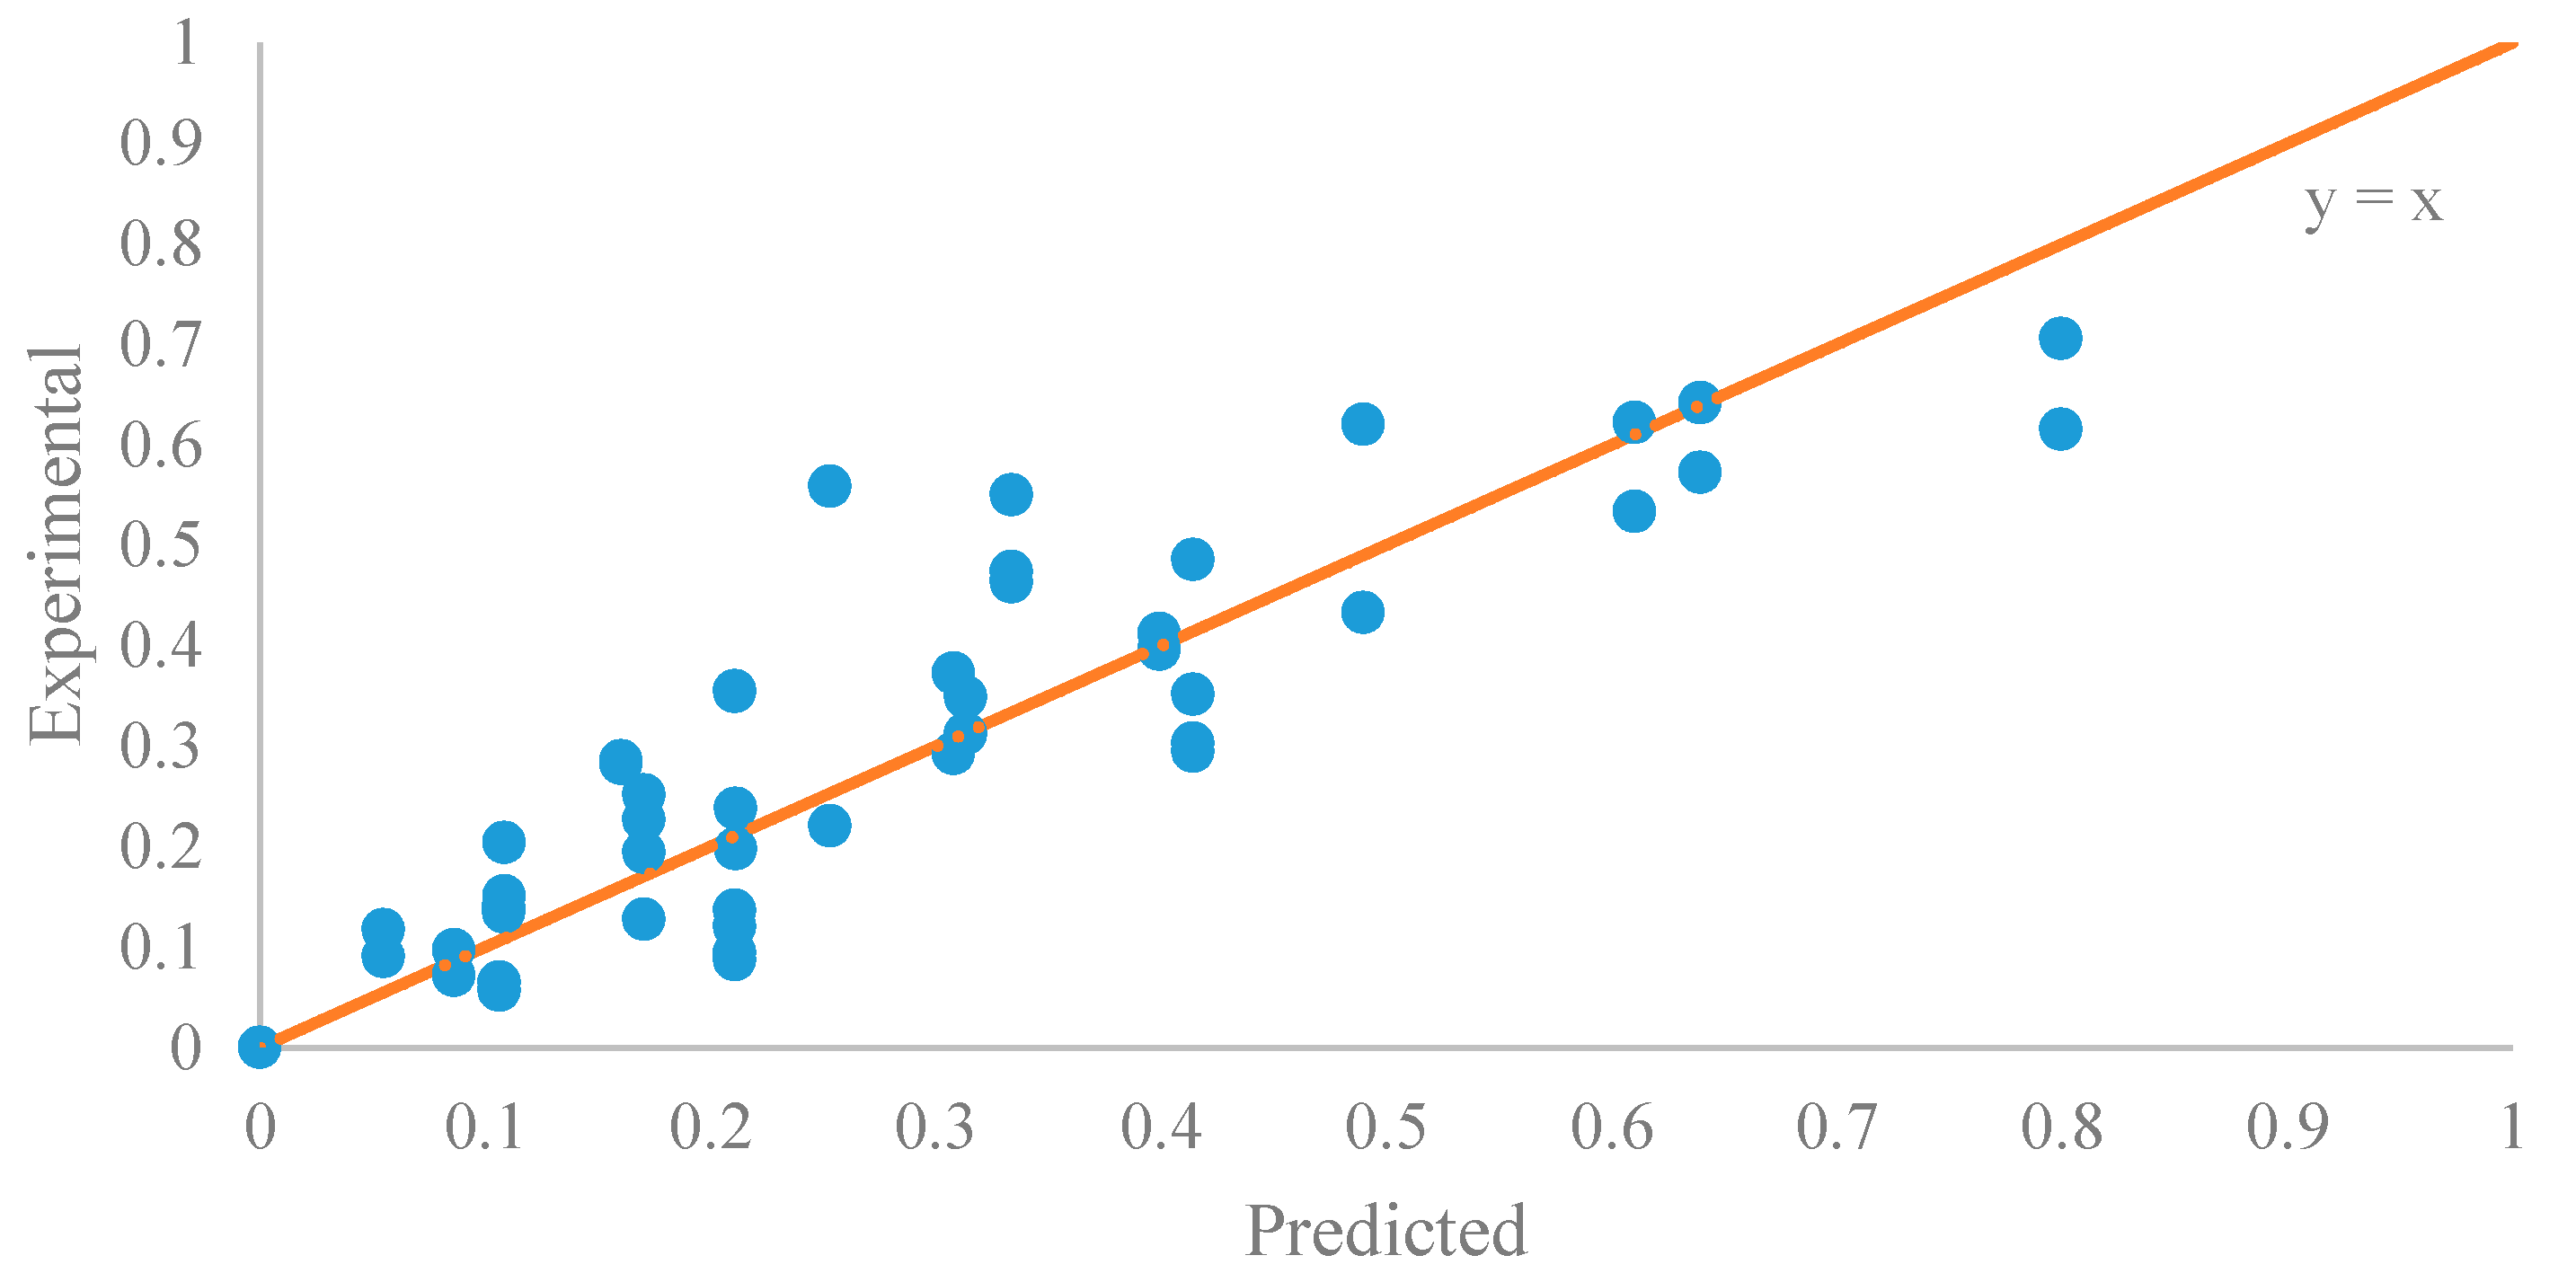
The parameter estimation was performed using the statistical software JMP Pro 12.2.0. The estimated reaction rate constant, k1 = 0.0059 ± 0.0002 L mol−1 min−1, was in the similar range as reported by Aransiola et al. [38]. Figure 9 suggested that this model was a reasonable fit (correlation of coefficient = 0.865) to the data of the initial reaction period (0–20 min). In addition, the experimental and predicted data are shown in Figure 10.
3.4. Proposed Reaction Mechanism
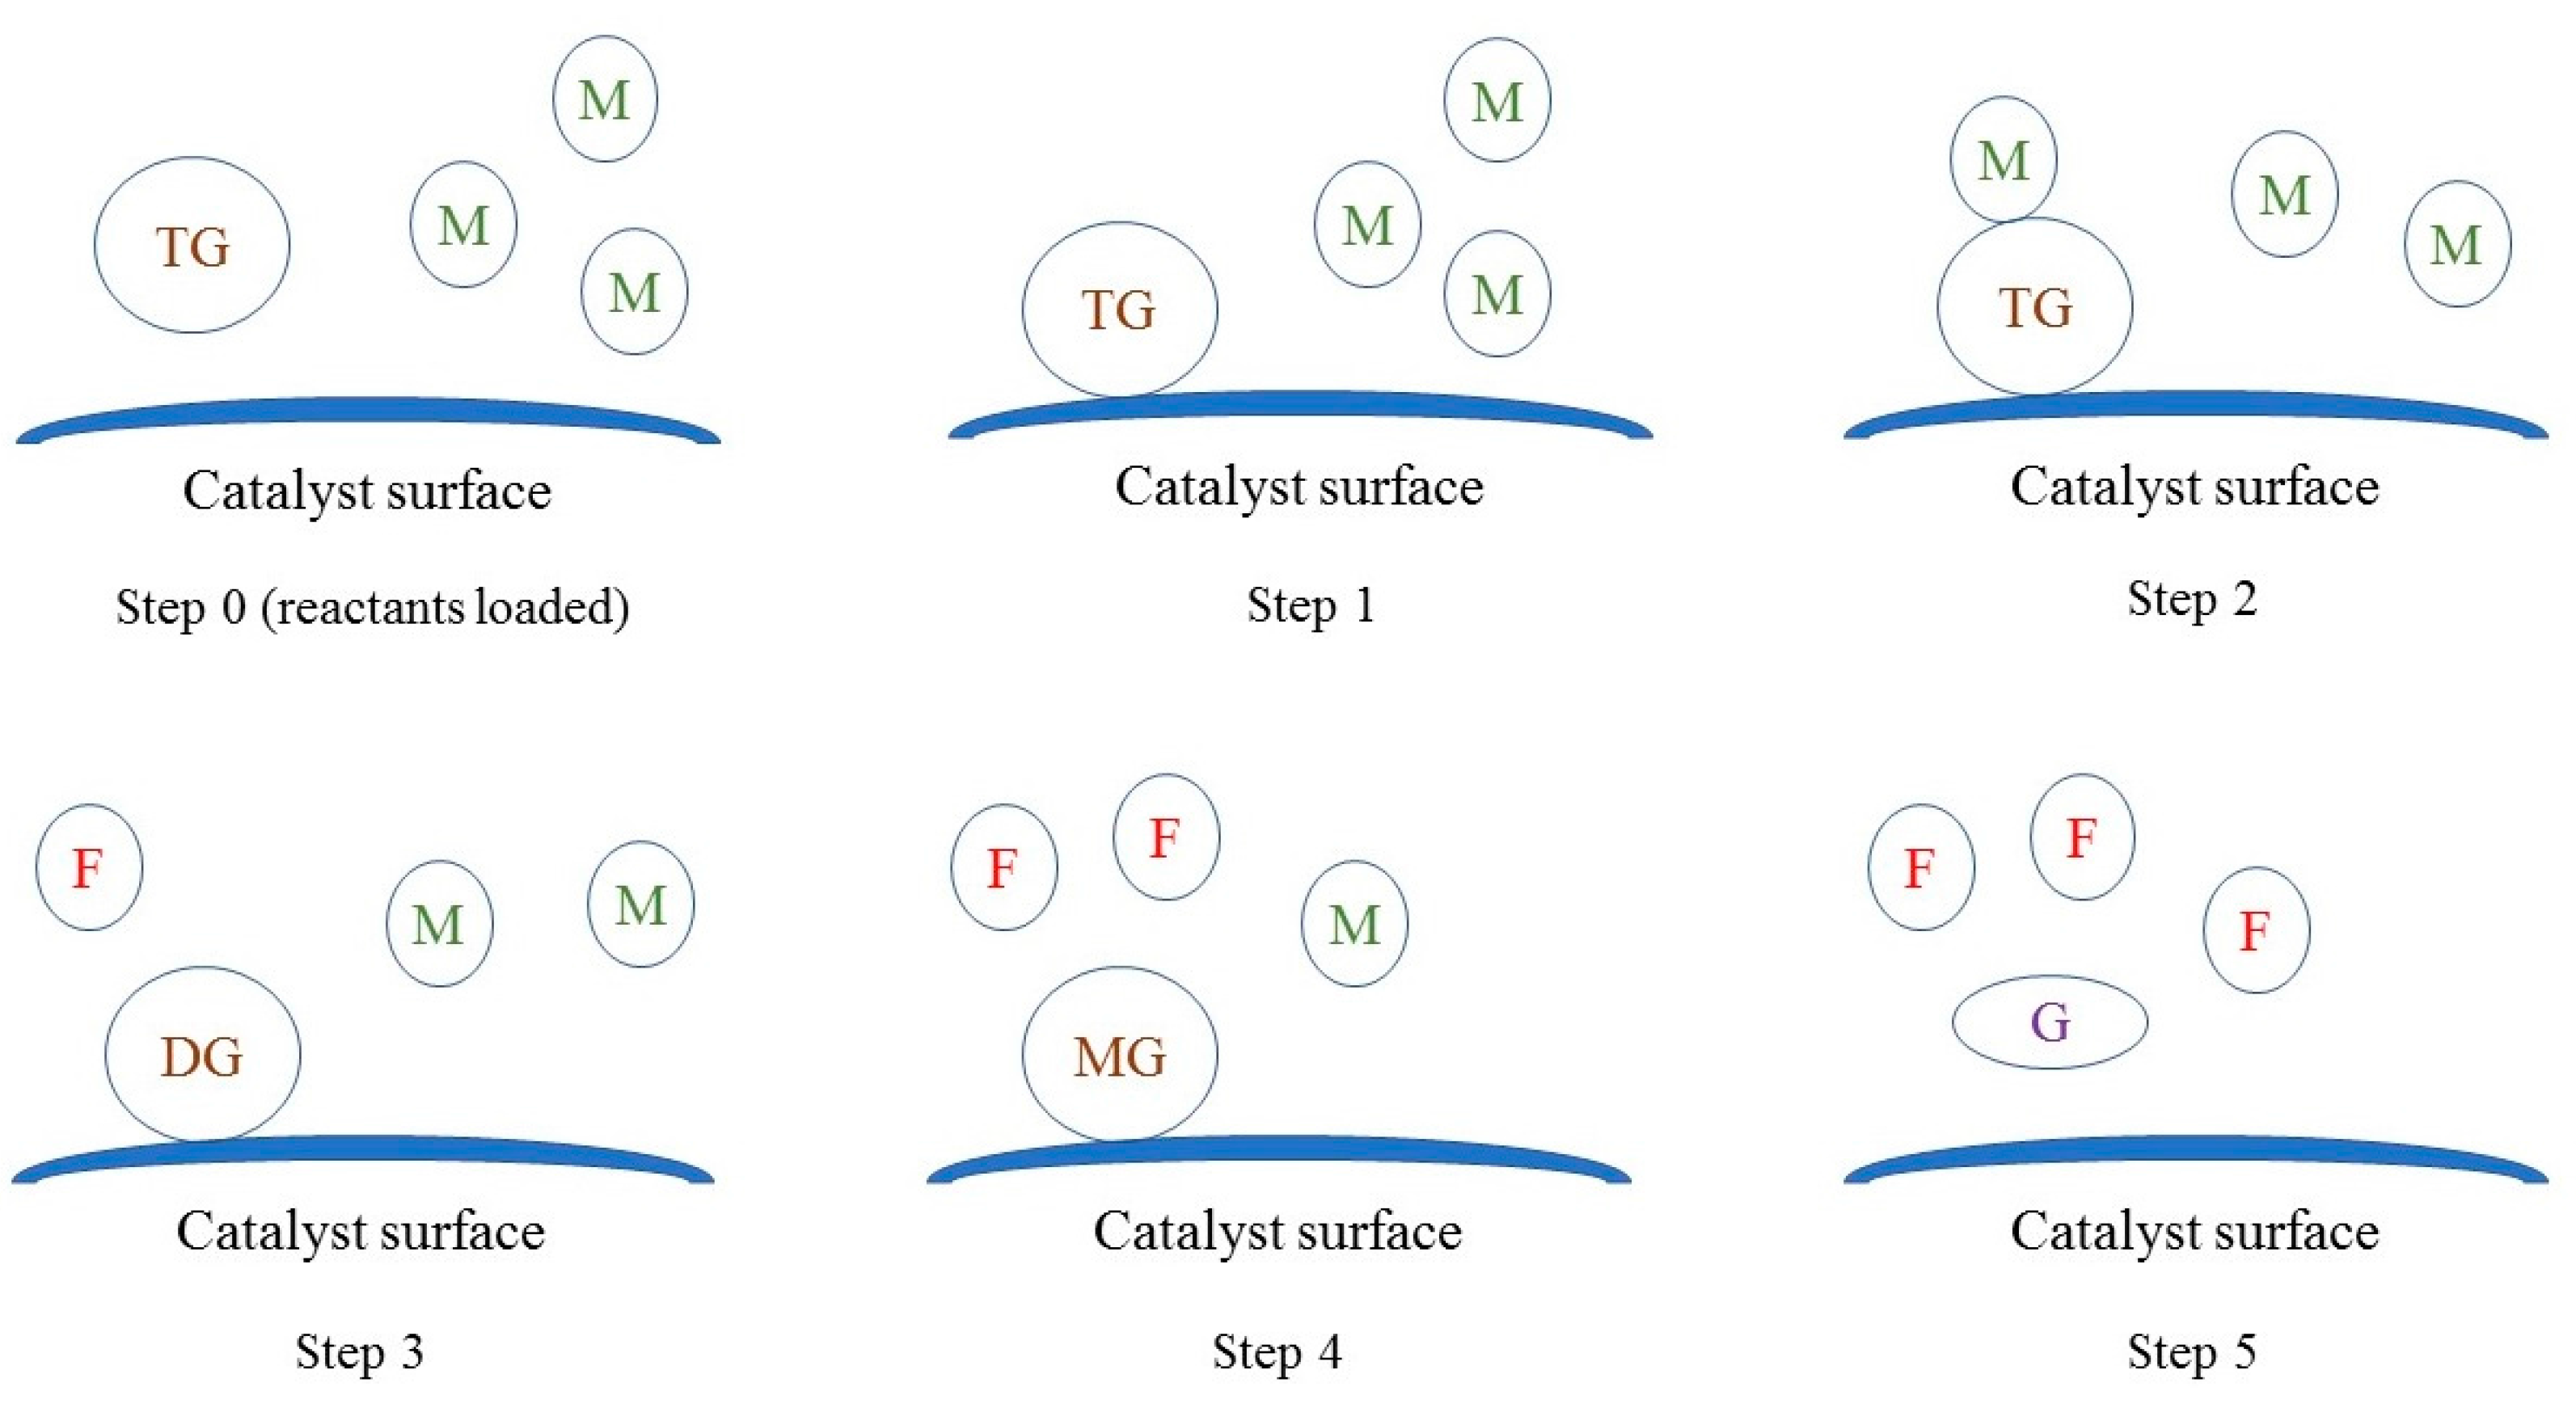
In the light of observations collected from catalyst characterization experiments, it appeared that oil molecules adsorbed on the surface of the catalyst and reacted with methanol in the bulk fluid, similar to the Eley-Rideal mechanism. As shown in Figure 11, the reaction seems to have occurred in steps. In the first step, triglyceride molecules adsorbed on the surface. Subsequently, in the second step, methanol reacted with adsorbed triglyceride molecule to form adsorbed diglyceride and FAME (RDS). In the third step, methanol reacted with adsorbed diglyceride to form adsorbed monoglyceride and FAME. In the last step, methanol reacted with adsorbed monoglycerides to form desorbed glycerol and FAME, and the vacant sites were available for next batch of reactants.
4. Conclusions
In this research, a kinetic model for transesterification of soybean oil via sodium hydroxide impregnated oyster shell as a solid catalyst was developed. The experimental data and reported literature suggested that the stepwise transesterification reaction started between adsorbed triglyceride and free methanol similar to the Eley-Rideal mechanism with the step of transesterifying adsorbed triglyceride to adsorbed diglyceride as the RDS. MR and CL affect the initial reaction rates. Characterization of the catalyst suggested that the electron donating ability was strengthened after the impregnation, probably due to the newly generated phase (Na2O2) on the surface. Using wastes as precursors for the synthesis of solid catalysts is expected to make biodiesel processes more competitive.
Acknowledgments
The authors thank Chuanzhen Zhou, Ching-Chang Chung, Chuck Mooney, Fred Stevie for the help on catalyst characterization and the Department of Biological and Agricultural Engineering for funding support. The catalyst characterization was performed in part at the Analytical Instrumentation Facility (AIF) at North Carolina State University, which is supported by the State of North Carolina and the National Science Foundation (award number ECCS-1542015). The AIF is a member of the North Carolina Research Triangle Nanotechnology Network (RTNN), a site in the National Nanotechnology Coordinated Infrastructure (NNCI).
Author Contributions
Han Jin designed and conducted the experiments, performed the data analysis, and wrote the manuscript; Praveen Kolar supervised the research and edited the manuscript; Jay J. Cheng and Steven W. Peretti contributed to the catalyst characterization and kinetic modeling of the transesterification. Jason A. Osborne contributed to the experimental design and data analysis.
Conflicts of Interest
The authors declare no conflicts of interest.
Nomenclature
| a | Molar ratio of Methanol to oil (MR) |
| ΣA | Summation of peak areas of all methyl esters |
| ΣAIS | The peak area of internal standard |
| CIS | The concentration of internal standard in the final diluted solution |
| CF | Concentration of FAMEs (mol/L) |
| CM | Concentration of methanol (mol/L) |
| Coil | The concentration of soybean oil (g/mL) in the final diluted solution |
| Ctot | Concentration of total basic site of the catalyst (mol/L) |
| CTG | Concentration of triglyceride (mol/L) |
| C°TG | Starting concentration of triglyceride in the reaction (mol/L) |
| CTG* | Concentration of adsorbed triglyceride (mol/L) |
| C* | Concentration of vacant basic site of the catalyst (mol/L) |
| kad | Triglyceride adsorption rate constant (L mol−1 min−1) |
| k-ad | Triglyceride desorption rate constant (min−1) |
| k1 | Reaction rate constant of transesterifying triglyceride to diglyceride (L mol−1 min−1) |
| k2 | Reaction rate constant of transesterifying diglyceride to monoglyceride (L mol−1 min−1) |
| k3 | Reaction rate constant of transesterifying monoglyceride to glycerol (L mol−1 min−1) |
| mF | Mass of FAMEs (g) |
| m°TG | Starting mass of triglyceride (g) |
| MF | Averaged molecular weight of FAMEs (g/mol) |
| MTG | Molecular weight of triglyceride (g/mol) |
| r | Fatty acid methyl esters (FAMEs) production rate (mol L−1 min−1) |
| t | Reaction time (min) |
| V0 | Volume of the reaction mixture (L) |
| y | Biodiesel yield |
| z | Dilution ratio |
| Greek Symbols | |
| Density of soybean oil (g/mL) | |
| Abbreviation | |
| CL | Catalyst loadings (mass of catalyst/mass of oil) (%) |
| F | Fatty acid methyl esters |
| G | Glycerol |
| M | Methanol |
| MR | Molar ratio of methanol to oil |
| TG | Triglyceride |
References
- Leung, D.Y.C.; Wu, X.; Leung, M.K.H. A review on biodiesel production using catalyzed transesterification. Appl. Energy 2010, 87, 1083–1095. [Google Scholar] [CrossRef]
- Ma, F.; Hanna, M.A. Biodiesel production: A review. Bioresour. Technol. 1999, 70, 1–15. [Google Scholar] [CrossRef]
- Vicente, G.; Martínez, M.; Aracil, J. Optimisation of integrated biodiesel production. Part I. A study of the biodiesel purity and yield. Bioresour. Technol. 2007, 98, 1724–1733. [Google Scholar] [CrossRef] [PubMed]
- Zabeti, M.; Wan Daud, W.M.A.; Aroua, M.K. Activity of solid catalysts for biodiesel production: A review. Fuel Process. Technol. 2009, 90, 770–777. [Google Scholar] [CrossRef]
- Kawashima, A.; Matsubara, K.; Honda, K. Development of heterogeneous base catalysts for biodiesel production. Bioresour. Technol. 2008, 99, 3439–3443. [Google Scholar] [CrossRef] [PubMed]
- Yacob, A.R.; Khairul, M.; Amat, A.; Samadi, N.S. Calcination Temperature of Nano MgO Effect on Base Transesterification of Palm Oil. Eng. Technol. 2009, 3, 408–412. [Google Scholar]
- Liu, X.; He, H.; Wang, Y.; Zhu, S.; Piao, X. Transesterification of soybean oil to biodiesel using CaO as a solid base catalyst. Fuel 2008, 87, 216–221. [Google Scholar] [CrossRef]
- Liu, X.; He, H.; Wang, Y.; Zhu, S. Transesterification of soybean oil to biodiesel using SrO as a solid base catalyst. Catal. Commun. 2007, 8, 1107–1111. [Google Scholar] [CrossRef]
- Noiroj, K.; Intarapong, P.; Luengnaruemitchai, A.; Jai-In, S. A comparative study of KOH/Al2O3 and KOH/NaY catalysts for biodiesel production via transesterification from palm oil. Renew. Energy 2009, 34, 1145–1150. [Google Scholar] [CrossRef]
- Boz, N.; Degirmenbasi, N.; Kalyon, D.M. Conversion of biomass to fuel: Transesterification of vegetable oil to biodiesel using KF loaded nano-γ-Al2O3 as catalyst. Appl. Catal. B Environ. 2009, 89, 590–596. [Google Scholar] [CrossRef]
- Lukic, I.; Kesic, Ž.; Maksimovic, S.; Zdujic, M.; Liu, H.; Krstic, J.; Skala, D. Kinetics of sunflower and used vegetable oil methanolysis catalyzed by CaO·ZnO. Fuel 2013, 113, 367–378. [Google Scholar] [CrossRef]
- Jairam, S.; Kolar, P.; Sharma-Shivappa Ratna, R.; Osborne, J.A.; Davis, J.P. KI-impregnated oyster shell as a solid catalyst for soybean oil transesterification. Bioresour. Technol. 2012, 104, 329–335. [Google Scholar] [CrossRef] [PubMed]
- Zhang, L.; Sheng, B.; Xin, Z.; Liu, Q.; Sun, S. Kinetics of transesterification of palm oil and dimethyl carbonate for biodiesel production at the catalysis of heterogeneous base catalyst. Bioresour. Technol. 2010, 101, 8144–8150. [Google Scholar] [CrossRef] [PubMed]
- Ramezani, K.; Rowshanzamir, S.; Eikani, M.H. Castor oil transesterification reaction: A kinetic study and optimization of parameters. Energy 2010, 35, 4142–4148. [Google Scholar] [CrossRef]
- Marjanovic, A.V.; Stamenkovic, O.S.; Todorovic, Z.B.; Lazic, M.L.; Veljkovic, V.B. Kinetics of the base-catalyzed sunflower oil ethanolysis. Fuel 2010, 89, 665–671. [Google Scholar] [CrossRef]
- Issariyakul, T.; Dalai, A.K. Comparative kinetics of transesterification for biodiesel production from palm oil and mustard oil. Can. J. Chem. Eng. 2012, 90, 342–350. [Google Scholar] [CrossRef]
- Xiao, Y.; Gao, L.; Xiao, G.; Lv, J. Kinetics of the transesterification reaction catalyzed by solid base in a fixed-bed reactor. Energy Fuels 2010, 24, 5829–5833. [Google Scholar] [CrossRef]
- Veljkovic, V.B.; Stamenkovic, O.S.; Todorovic, Z.B.; Lazic, M.L.; Skala, D.U. Kinetics of sunflower oil methanolysis catalyzed by calcium oxide. Fuel 2009, 88, 1554–1562. [Google Scholar] [CrossRef]
- Miladinovic, M.R.; Krstic, J.B.; Tasic, M.B.; Stamenkovic, O.S.; Veljkovic, V.B. A kinetic study of quicklime-catalyzed sunflower oil methanolysis. Chem. Eng. Res. Des. 2014, 92, 1740–1752. [Google Scholar] [CrossRef]
- Kouzu, M.; Hidaka, J.S. Transesterification of vegetable oil into biodiesel catalyzed by CaO: A review. Fuel 2012, 93, 1–12. [Google Scholar] [CrossRef]
- Wei, Z.; Xu, C.; Li, B. Application of waste eggshell as low-cost solid catalyst for biodiesel production. Bioresour. Technol. 2009, 100, 2883–2885. [Google Scholar] [CrossRef] [PubMed]
- Rezaei, R.; Mohadesi, M.; Moradi, G.R. Optimization of biodiesel production using waste mussel shell catalyst. Fuel 2013, 109, 534–541. [Google Scholar] [CrossRef]
- Suryaputra, W.; Winata, I.; Indraswati, N.; Ismadji, S. Waste capiz (Amusium cristatum) shell as a new heterogeneous catalyst for biodiesel production. Renew. Energy 2013, 50, 795–799. [Google Scholar] [CrossRef]
- Xie, J.; Zheng, X.; Dong, A.; Xiao, Z.; Zhang, J. Biont shell catalyst for biodiesel production. Green Chem. 2009, 11, 355–364. [Google Scholar] [CrossRef]
- Jin, H.; Kolar, P.; Peretti, S.W.; Osborne, J.A.; Cheng, J.J. NaOH-impregnated oyster shell as a solid base catalyst for transesterification of soybean oil. Int. J. Agric. Biol. Eng. 2017. accepted. [Google Scholar]
- Chung, K.H.; Kim, J.; Lee, K.Y. Biodiesel production by transesterification of duck tallow with methanol on alkali catalysts. Biomass Bioenergy 2009, 33, 155–158. [Google Scholar] [CrossRef]
- Xie, W.; Peng, H.; Chen, L. Transesterification of soybean oil catalyzed by potassium loaded on alumina as a solid-base catalyst. Appl. Catal. A Gen. 2006, 300, 67–74. [Google Scholar] [CrossRef]
- Yoon, G.L.; Kim, B.T.; Kim, B.O.; Han, S.H. Chemical-mechanical characteristics of crushed oyster-shell. Waste Manag. 2003, 23, 825–834. [Google Scholar] [CrossRef]
- Albuquerque, M.C.G.; Jiménez-Urbistondo, I.; Santamaría-González, J.; Mérida-Robles, J.M.; Moreno-Tost, R.; Rodríguez-Castellón, E.; Jiménez-López, A.; Azevedo, D.C.S.; Cavalcante, C.L.; Maireles-Torres, P. CaO supported on mesoporous silicas as basic catalysts for transesterification reactions. Appl. Catal. A Gen. 2008, 334, 35–43. [Google Scholar] [CrossRef]
- Demri, B.; Muster, D. XPS study of some calcium compounds. J. Mater. Process. Technol. 1995, 55, 311–314. [Google Scholar] [CrossRef]
- Sosulnikov, M.I.; Teterin, Y.A. X-Ray Photoelectron Study of Calcium, Strontium, Barium and their Oxides. Dokl. Akad. Nauk SSSR 1991, 317, 418–421. [Google Scholar]
- Hammond, J.S.; Holubka, J.W.; de Vries, J.E.; Dickie, R.A. The application of X-ray photo-electron spectroscopy to a study of interfacial composition in corrosion-induced paint de-adhesion. Corros. Sci. 1981, 21, 239–253. [Google Scholar] [CrossRef]
- Siriwardane, R.V.; Cook, J.M. Interactions of NO and SO2 with iron deposited on silica. J. Colloid Interface Sci. 1985, 104, 250–257. [Google Scholar] [CrossRef]
- Wu, Q.H.; Thißen, A.; Jaegermann, W. XPS and UPS study of Na deposition on thin film V2O5. Appl. Surf. Sci. 2005, 252, 1801–1805. [Google Scholar] [CrossRef]
- Babu, N.S.; Sree, R.; Prasad, P.S.S.; Lingaiah, N. Room-temperature transesterification of edible and nonedible oils using a heterogeneous strong basic Mg/La catalyst. Energy Fuels 2008, 22, 1965–1971. [Google Scholar] [CrossRef]
- Zabeti, M.; Daud, W.M.A.W.; Aroua, M.K. Biodiesel production using alumina-supported calcium oxide: An optimization study. Fuel Process. Technol. 2010, 91, 243–248. [Google Scholar] [CrossRef]
- Vyas, A.P.; Subrahmanyam, N.; Patel, P.A. Production of biodiesel through transesterification of Jatropha oil using KNO3/Al2O3 solid catalyst. Fuel 2009, 88, 625–628. [Google Scholar] [CrossRef]
- Aransiola, E.F.; Daramola, M.O.; Ojumu, T.V.; Solomon, B.O.; Layokun, S.K. Homogeneously Catalyzed Transesterification of Nigerian Jatropha curcas Oil into Biodiesel: A Kinetic Study. Mod. Res. Catal. 2013, 2, 83–89. [Google Scholar] [CrossRef]
Figure 1.
X-ray diffraction patterns of calcined oyster shell (COS) and NaOH-impregnated COS (Na-COS).
Figure 1.
X-ray diffraction patterns of calcined oyster shell (COS) and NaOH-impregnated COS (Na-COS).

Figure 2.
X-ray photoelectron spectroscopy (XPS) spectra of COS and Na-COS.
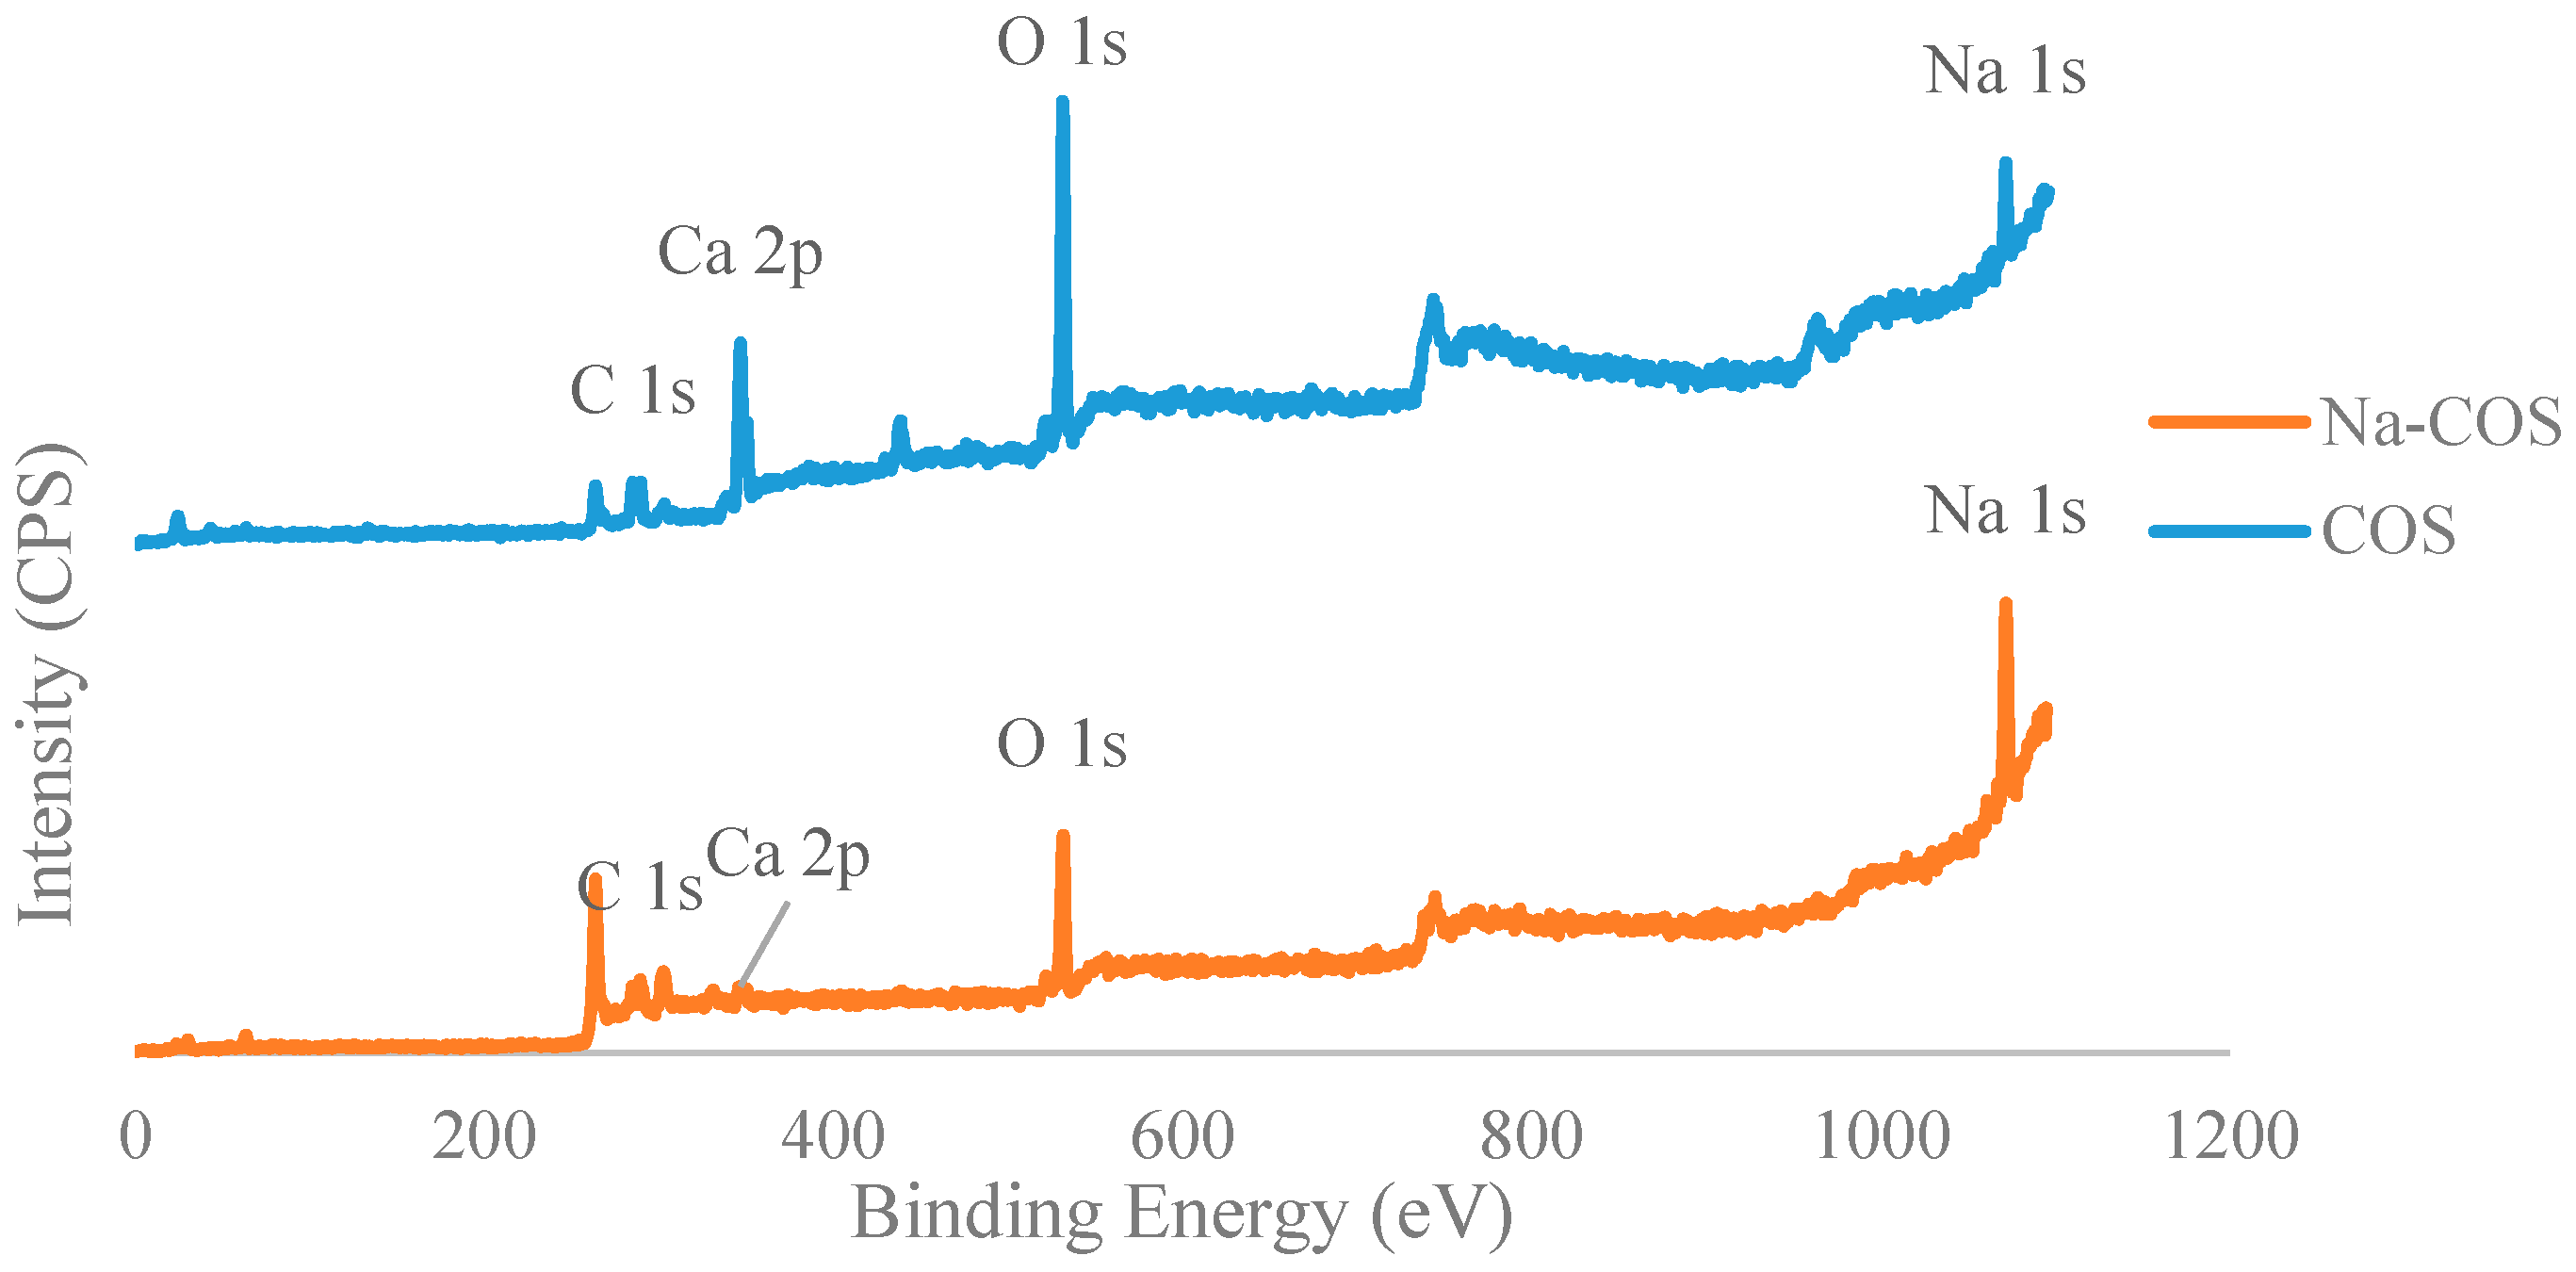
Figure 3.
Deconvoluted XPS spectra of C 1s (a); Ca 2p (b); O 1s (c); and Na 1s (d) of Na-COS (top) and COS (bottom).
Figure 3.
Deconvoluted XPS spectra of C 1s (a); Ca 2p (b); O 1s (c); and Na 1s (d) of Na-COS (top) and COS (bottom).


Figure 4.
Role of Na-COS surface basic site on the improved activity.
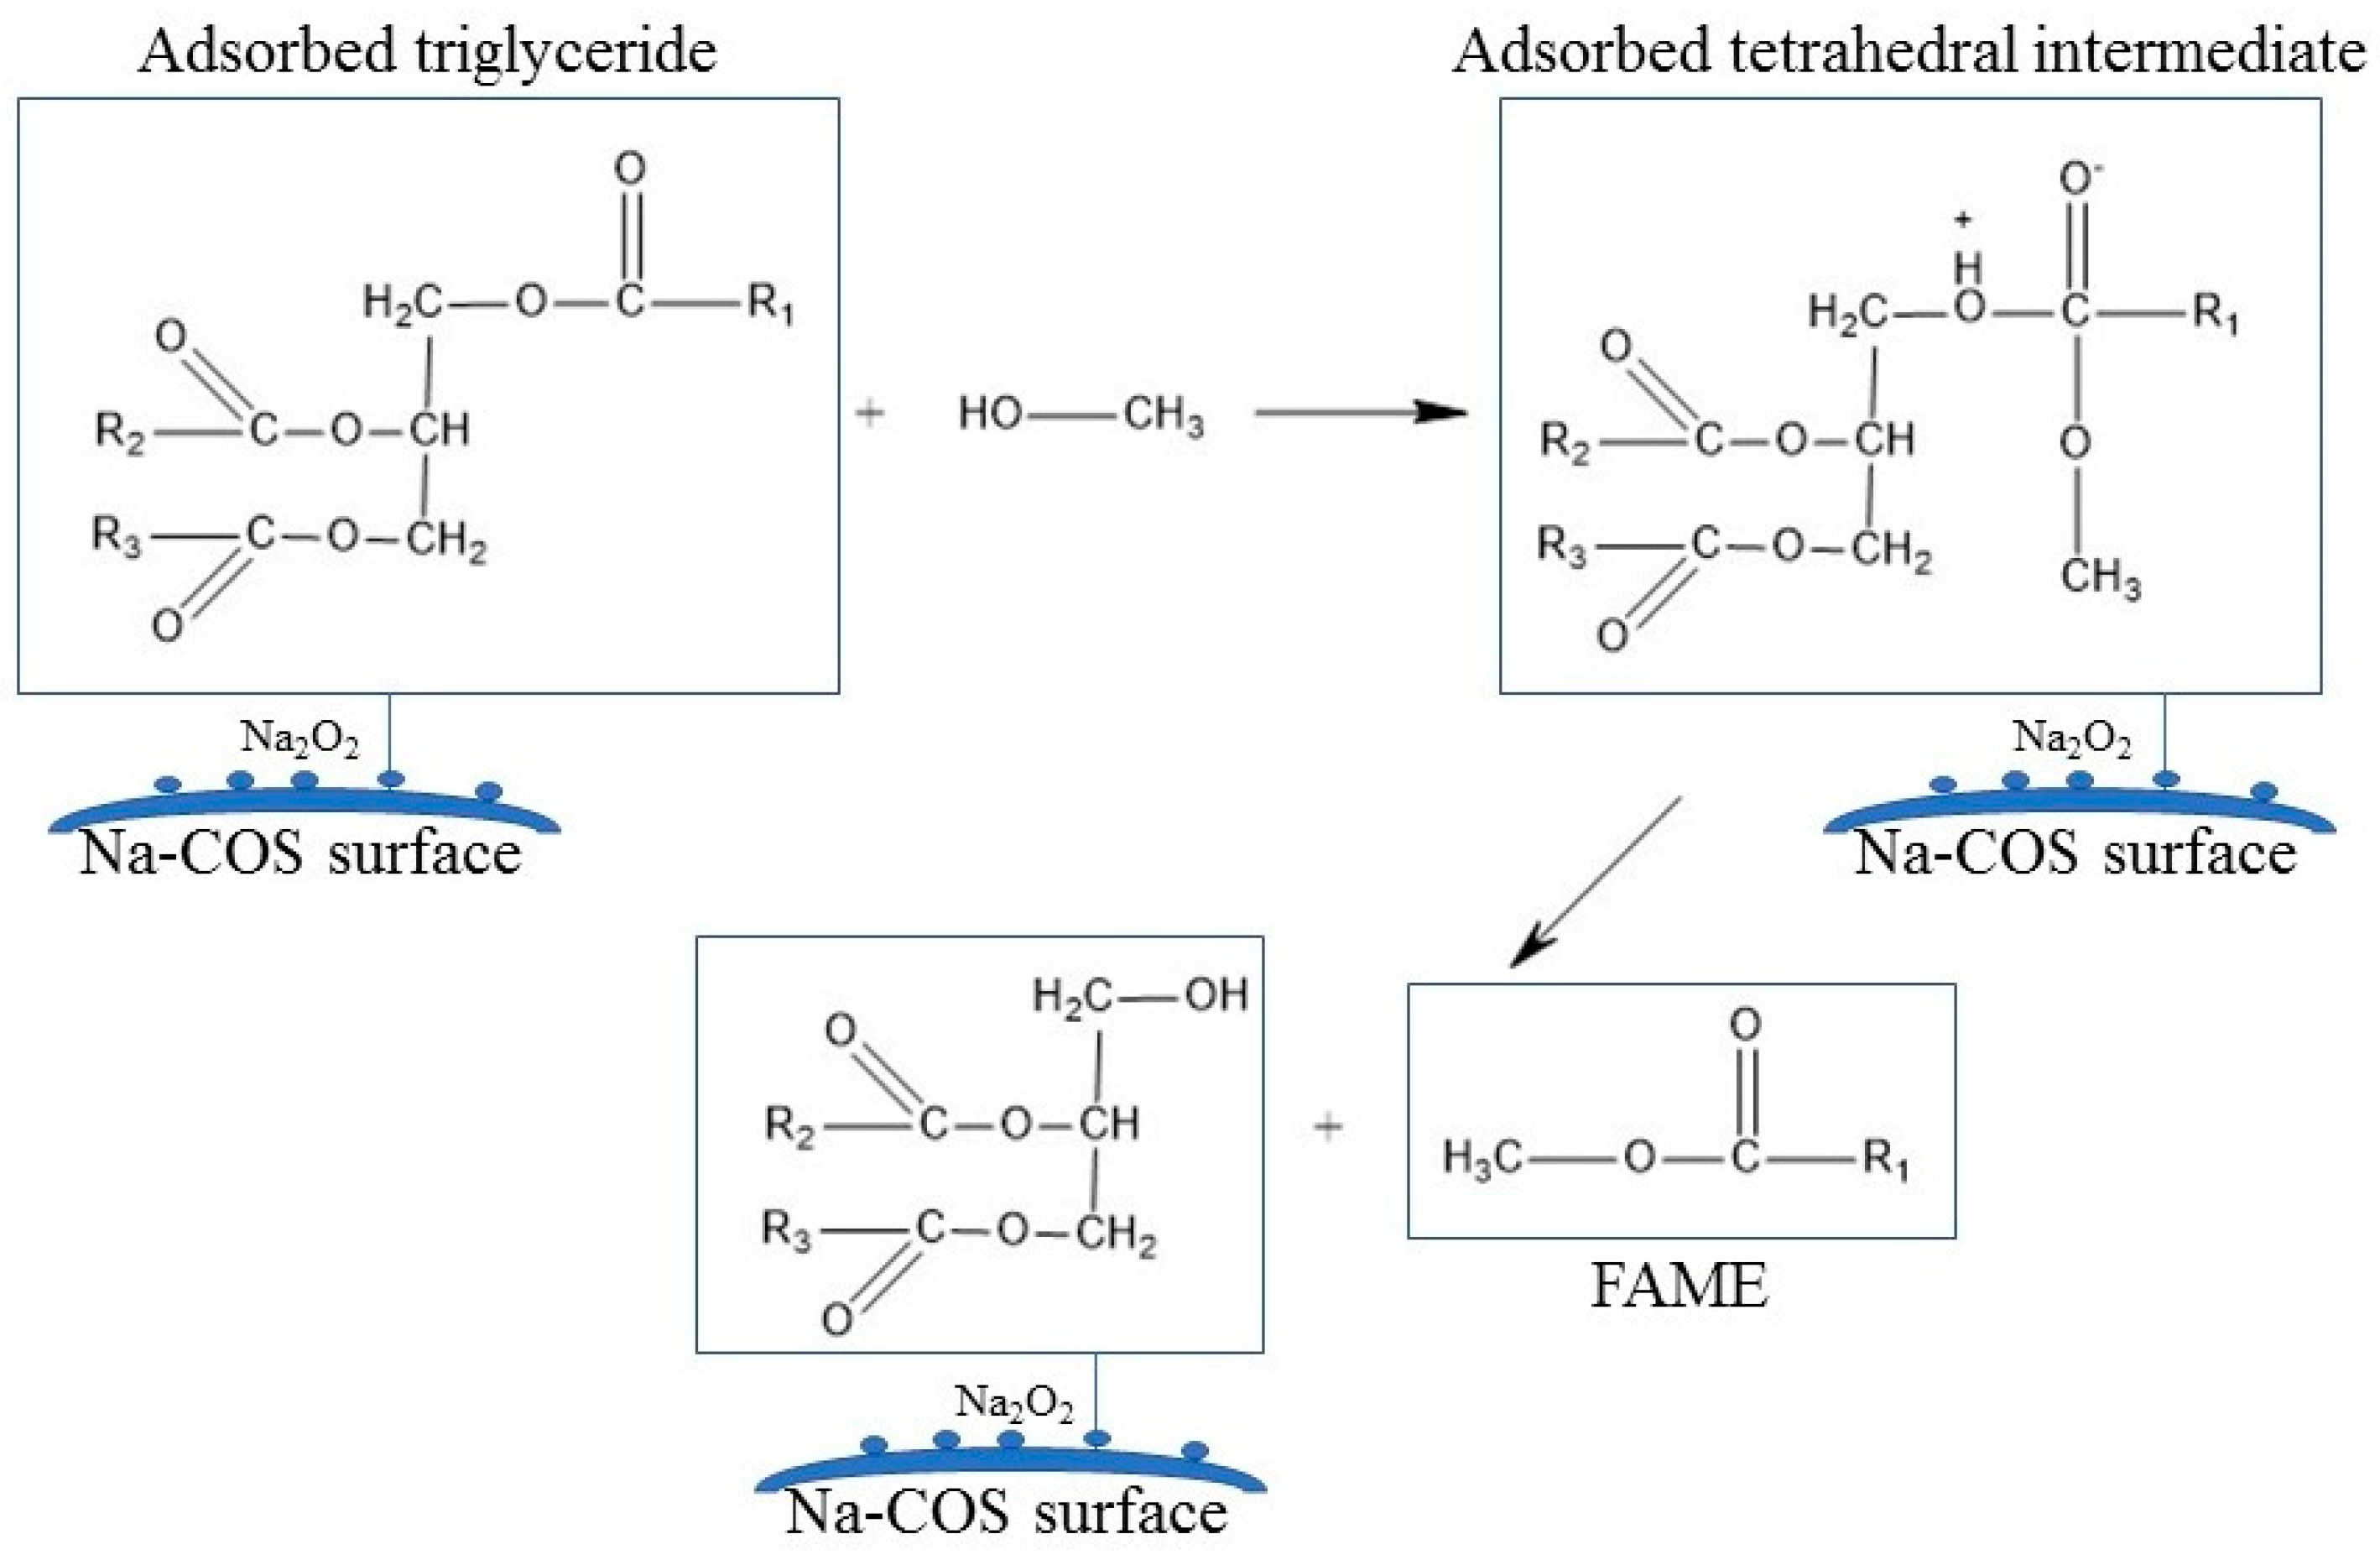
Figure 5.
SEM images of COS (a) and Na-COS (b).

Figure 6.
The results from the time of flight secondary ion mass spectrometry (TOF-SIMS) analysis: (a) TOF-SIMS spectra of the positive ions of Na-COS (bottom) and oil-soaked Na-COS (top); (b) TOF-SIMS patterns of the negative ions of Na-COS (top) and methanol-soaked Na-COS (bottom).
Figure 6.
The results from the time of flight secondary ion mass spectrometry (TOF-SIMS) analysis: (a) TOF-SIMS spectra of the positive ions of Na-COS (bottom) and oil-soaked Na-COS (top); (b) TOF-SIMS patterns of the negative ions of Na-COS (top) and methanol-soaked Na-COS (bottom).

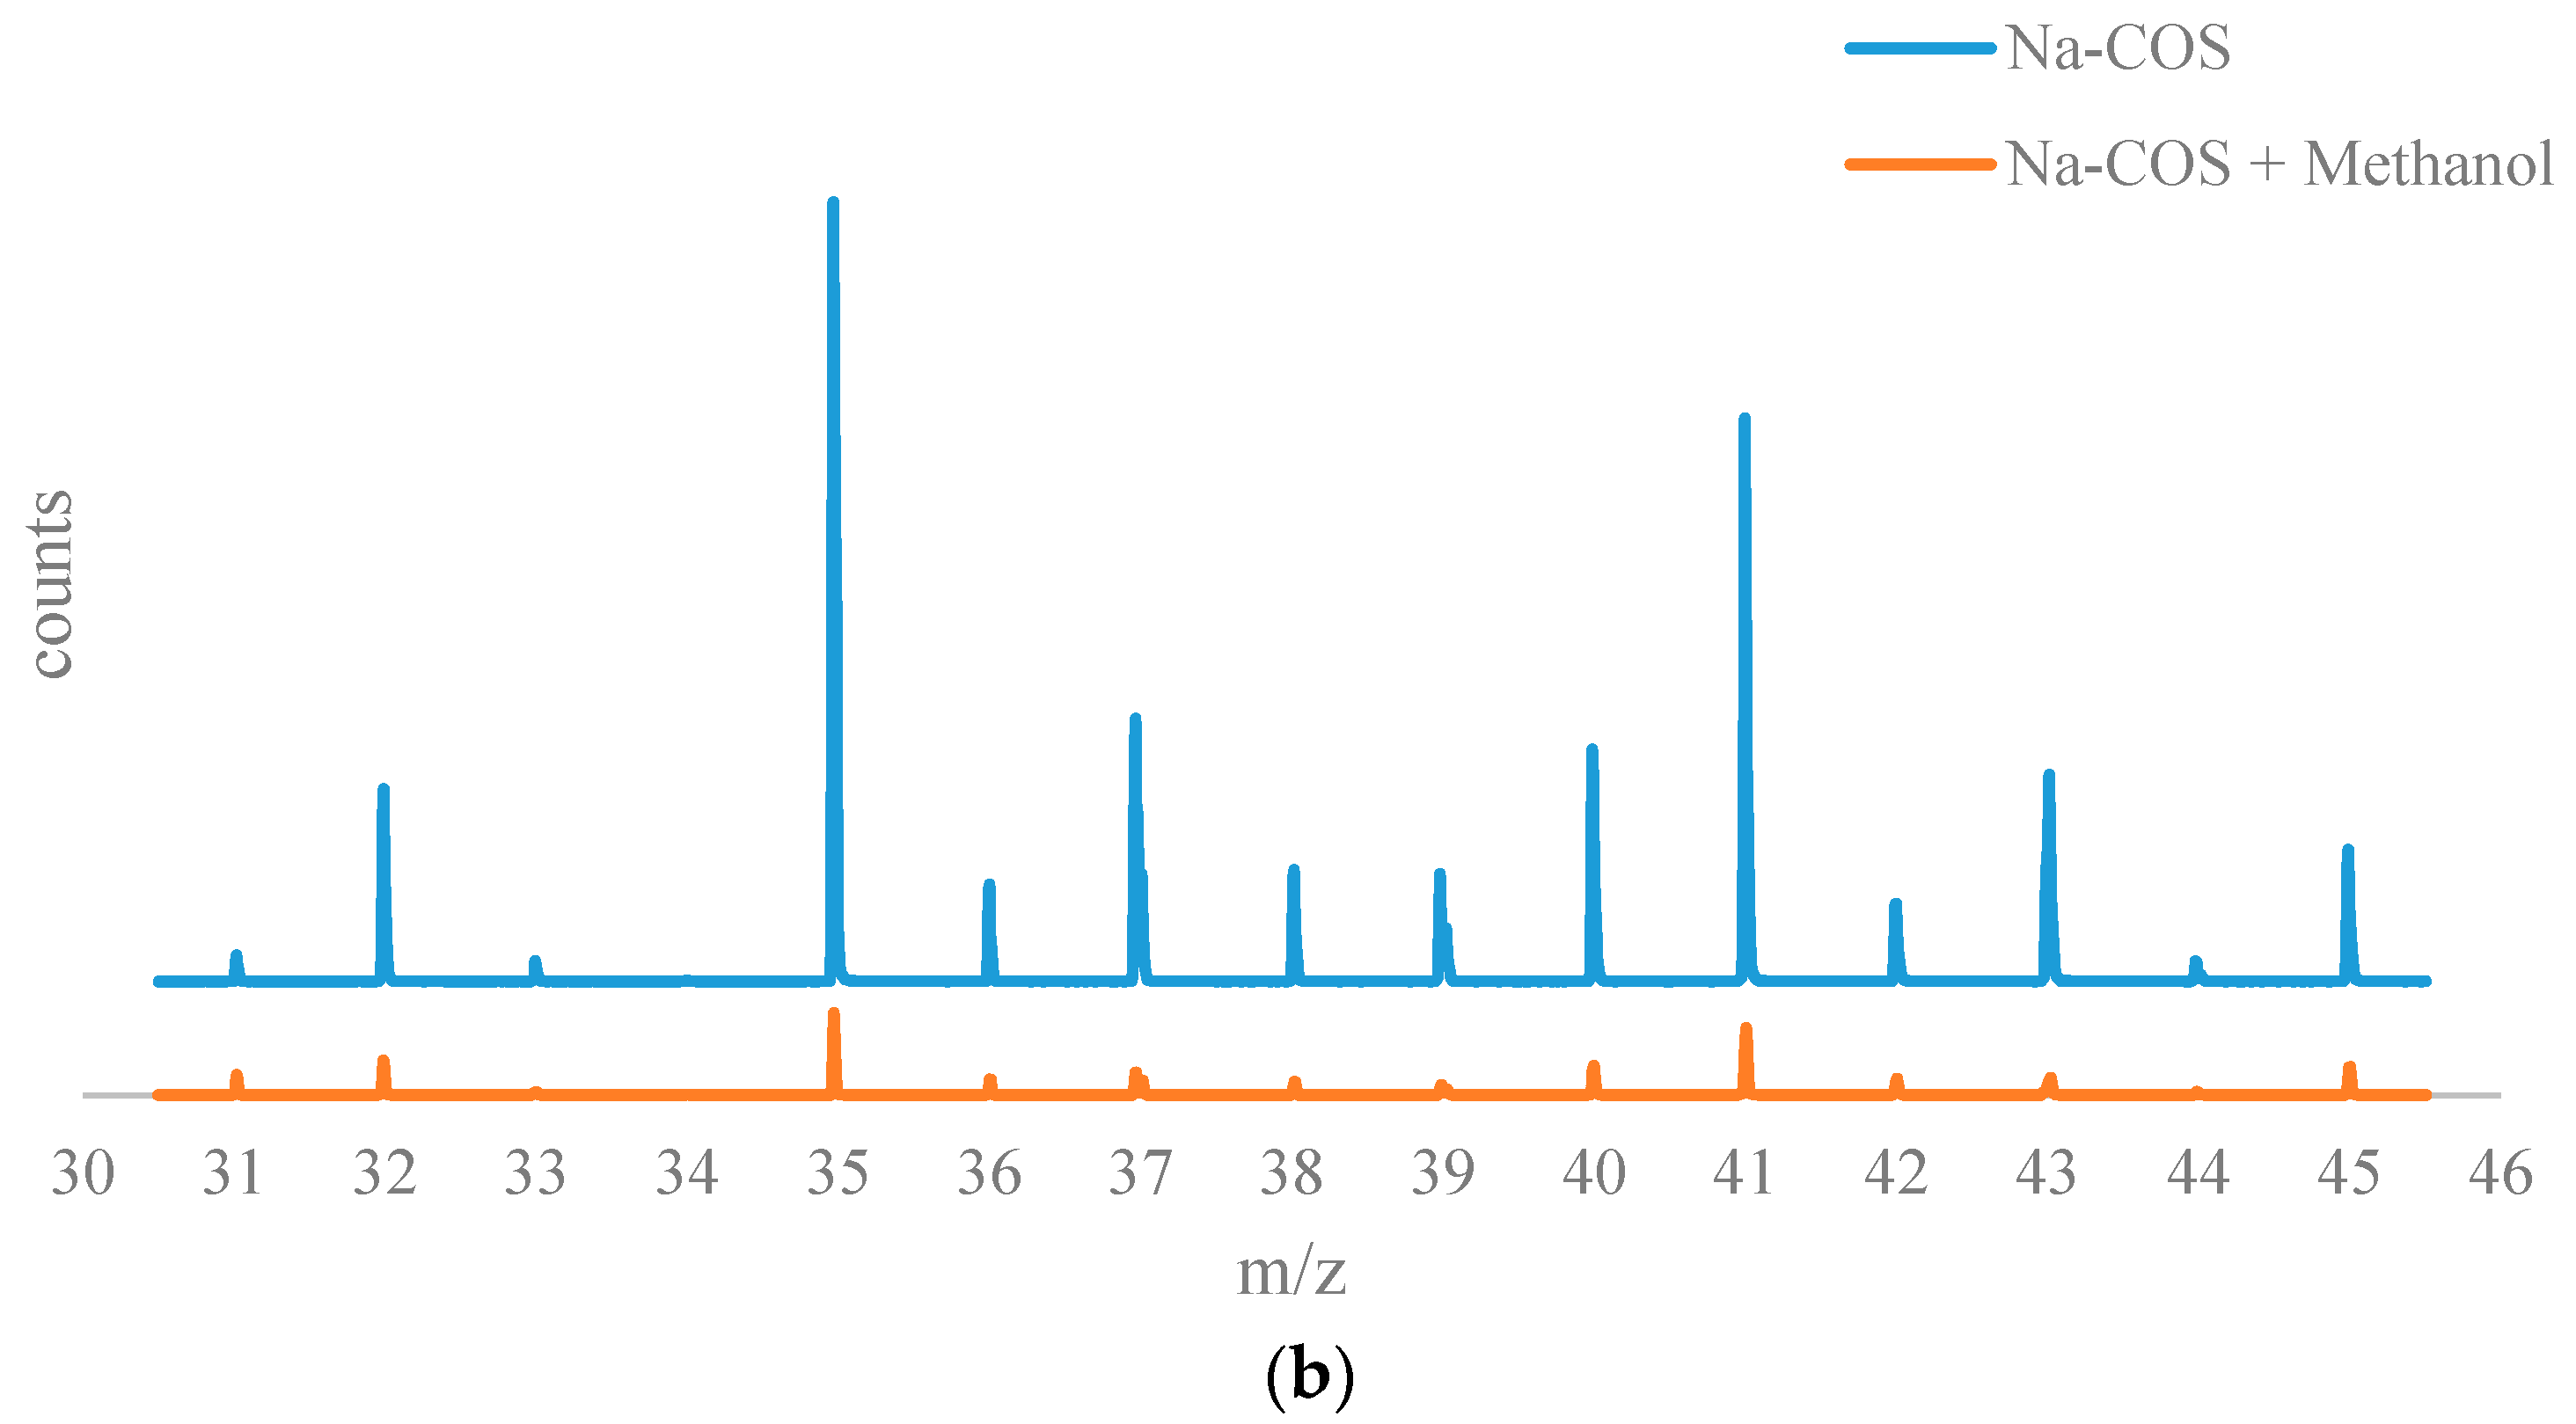
Figure 7.
The fatty acid methyl ester (FAME) yield with the progress of the soybean oil transesterification catalyzed by Na-COS grouped by molar ratio of methanol to oil (MR) (a) MR = 6; (b) MR = 12; (c) MR = 18.
Figure 7.
The fatty acid methyl ester (FAME) yield with the progress of the soybean oil transesterification catalyzed by Na-COS grouped by molar ratio of methanol to oil (MR) (a) MR = 6; (b) MR = 12; (c) MR = 18.


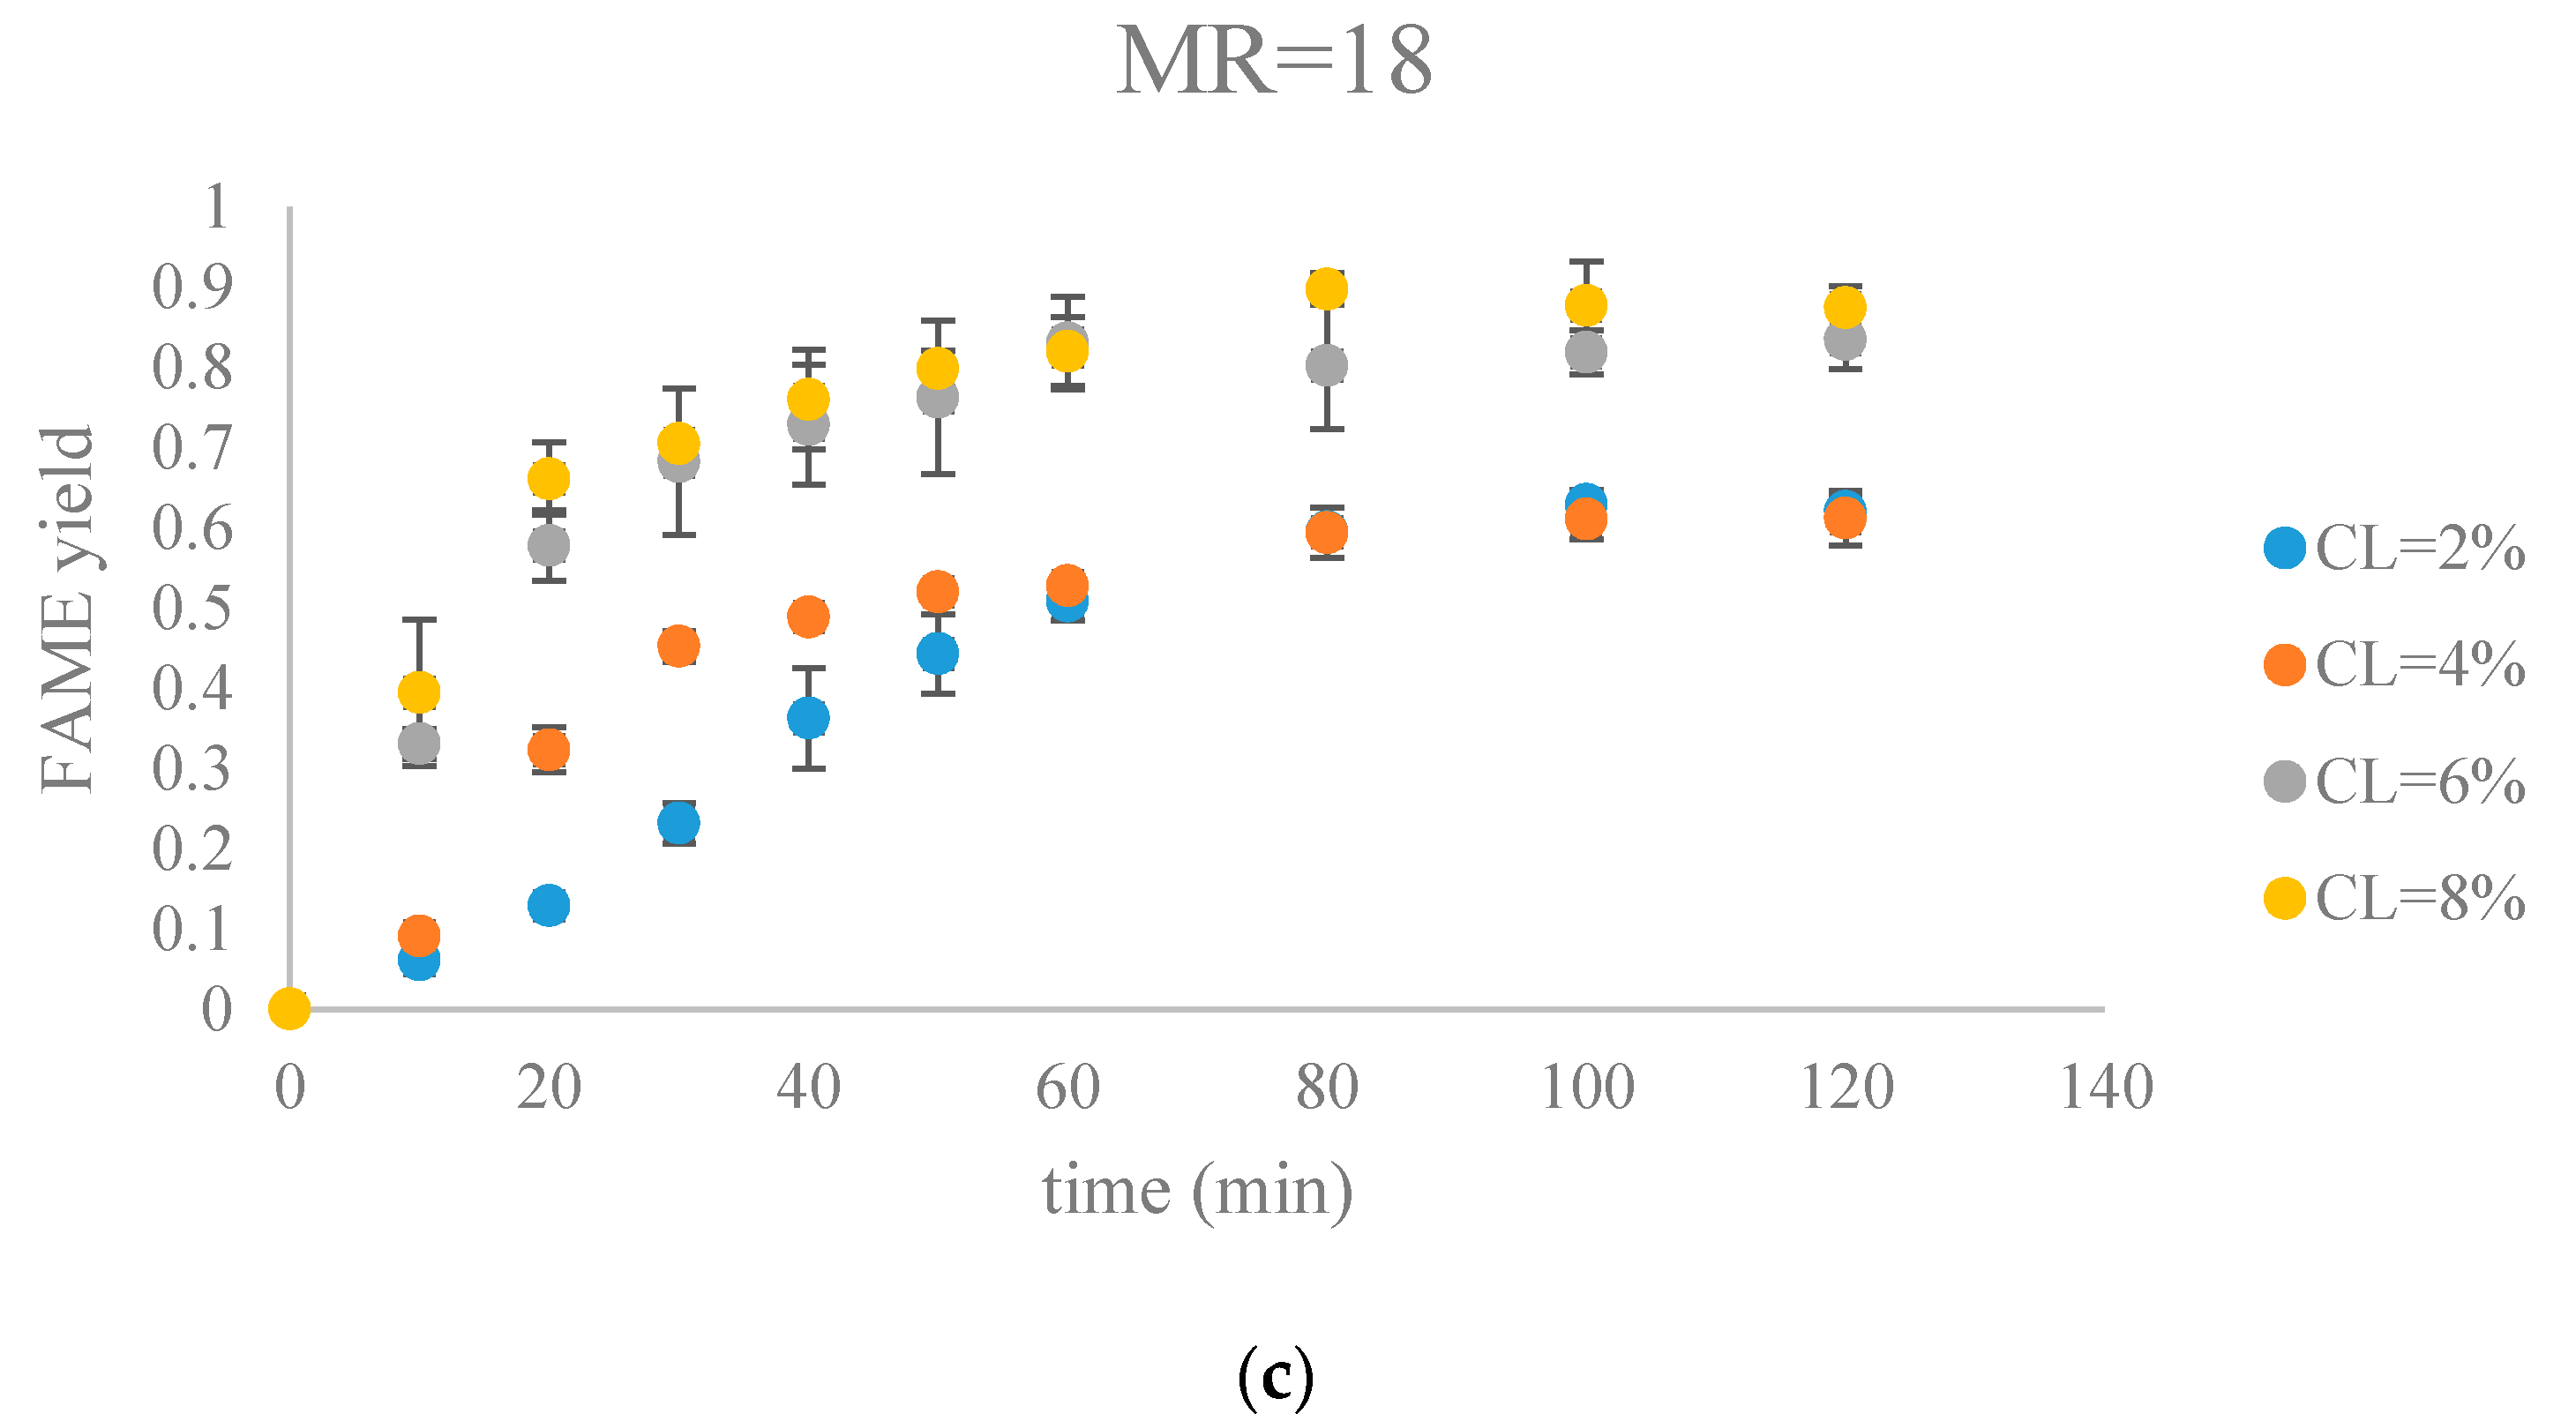
Figure 8.
The FAME yield with the progress of the soybean oil transesterification catalyzed by Na-COS grouped by CL (a) CL = 2%; (b) CL = 4%; (c) CL = 6%; (d) CL = 8%).
Figure 8.
The FAME yield with the progress of the soybean oil transesterification catalyzed by Na-COS grouped by CL (a) CL = 2%; (b) CL = 4%; (c) CL = 6%; (d) CL = 8%).
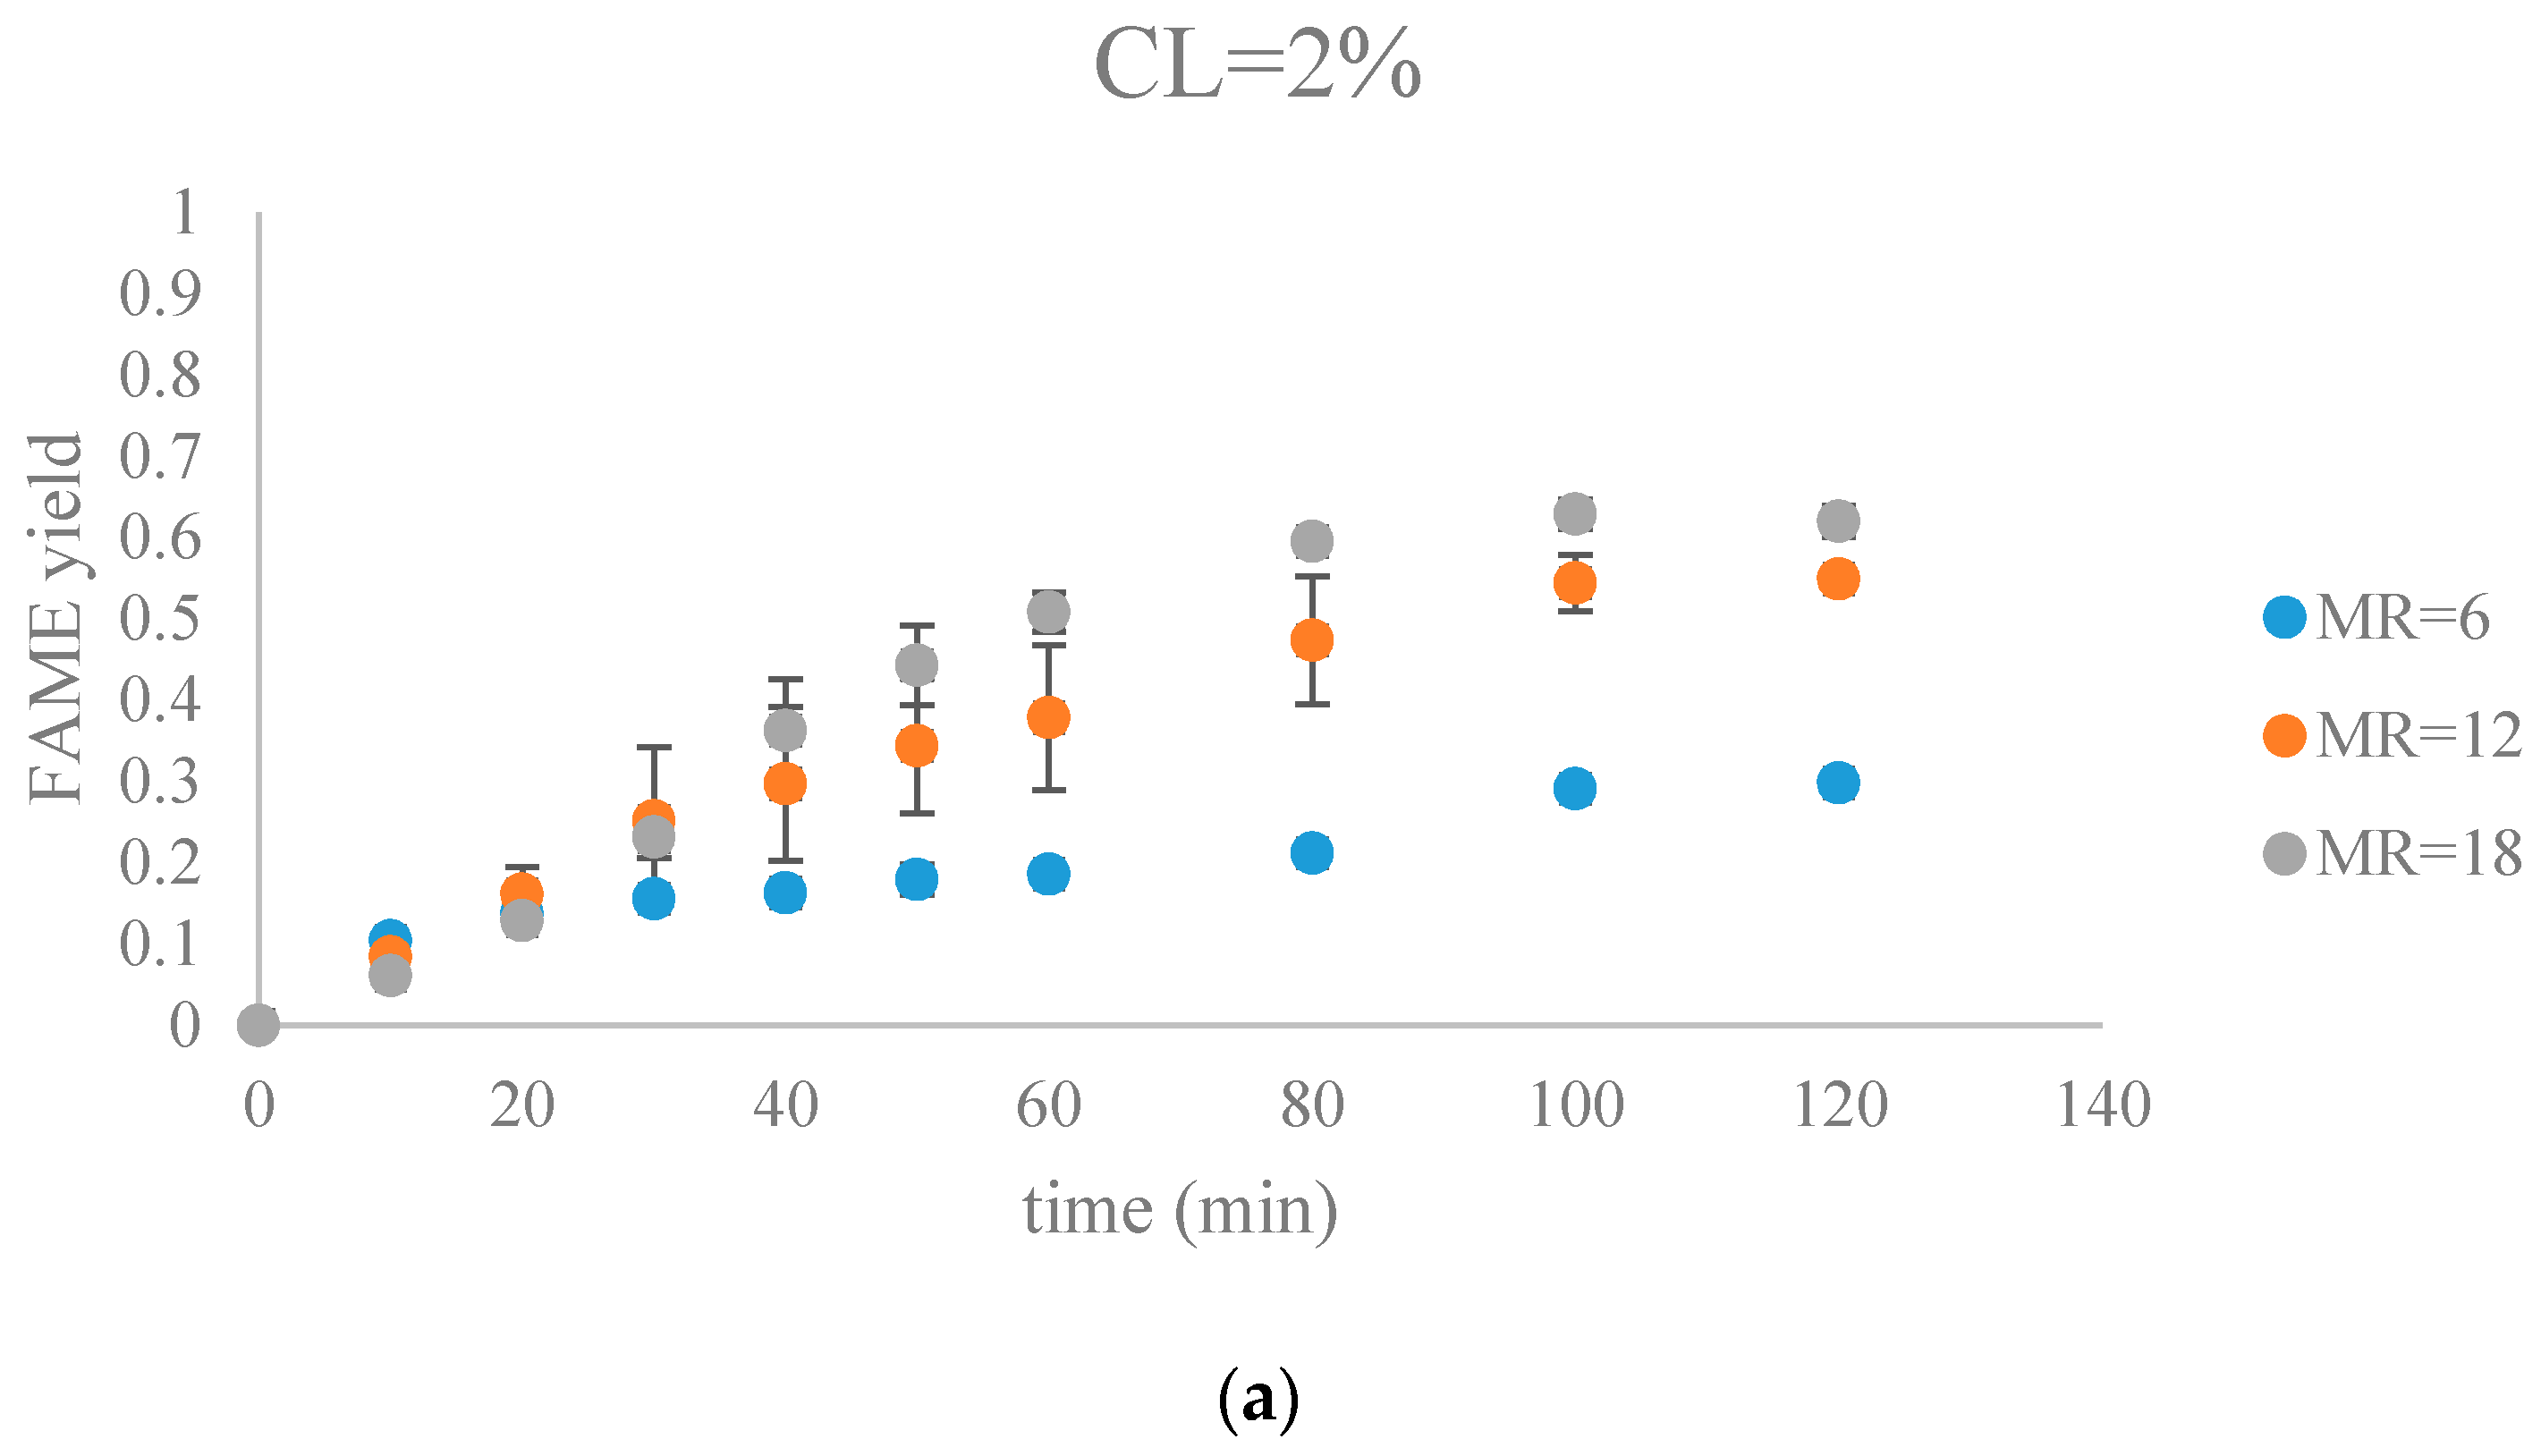

Figure 9.
The FAME yield with the progress of the soybean oil transesterification catalyzed by Na-COS in the initial period (0–20 min) grouped by MR (a) MR = 6; (b) MR = 12; (c) MR = 18. Error bars represent standard error.
Figure 9.
The FAME yield with the progress of the soybean oil transesterification catalyzed by Na-COS in the initial period (0–20 min) grouped by MR (a) MR = 6; (b) MR = 12; (c) MR = 18. Error bars represent standard error.


Figure 10.
The parity plot of the data of the initial period (0–20 min).

Figure 11.
The mechanism of Na-COS-catalyzed transesterification of soybean oil with methanol. TG, DG, MG, M, G, F represent triglyceride, diglyceride, monoglyceride, methanol, glycerol, and FAME, respectively.
Figure 11.
The mechanism of Na-COS-catalyzed transesterification of soybean oil with methanol. TG, DG, MG, M, G, F represent triglyceride, diglyceride, monoglyceride, methanol, glycerol, and FAME, respectively.


Table 1.
Comparison of various solid base catalysts for transesterification reaction.
| Catalyst | MR | CL | Reaction Temperature (°C) | Reaction Time (h) | Yield | Reference |
|---|---|---|---|---|---|---|
| CaO | 12 | 8% | 65 | 1.5 h | ≥95% | [7] |
| CaO/Al2O3 | 12.14 | 5.97% | 64.29 | 5 h | 98.64% | [36] |
| KNO3/Al2O3 | 12 | 6% | 70 | 6 h | 84% | [37] |
| KOH/Al2O3 | 15 | 3% | 60 | 2 h | 91.07% | [9] |
| Eggshell | 9 | 3% | 65 | 3 h | 95% | [21] |
| Mussel shell | 24 | 12% | 60 | 8 h | 94.1% | [22] |
| Capiz shell | 8 | 3% | 60 | 6 h | 93% | [23] |
| Turtle shell | 9 | 3% | 70 | 3 h | 97.5% | [24] |
| Na-COS | 18 | 8% | 62 | 1.33 h | 89.7% | This research |
© 2017 by the authors. Licensee MDPI, Basel, Switzerland. This article is an open access article distributed under the terms and conditions of the Creative Commons Attribution (CC BY) license (http://creativecommons.org/licenses/by/4.0/).
Share and Cite
MDPI and ACS Style
Jin, H.; Kolar, P.; Peretti, S.W.; Osborne, J.A.; Cheng, J.J. Kinetics and Mechanism of NaOH-Impregnated Calcined Oyster Shell-Catalyzed Transesterification of Soybean Oil. Energies 2017, 10, 1920. https://doi.org/10.3390/en10111920
AMA Style
Jin H, Kolar P, Peretti SW, Osborne JA, Cheng JJ. Kinetics and Mechanism of NaOH-Impregnated Calcined Oyster Shell-Catalyzed Transesterification of Soybean Oil. Energies. 2017; 10(11):1920. https://doi.org/10.3390/en10111920
Chicago/Turabian StyleJin, Han, Praveen Kolar, Steven W. Peretti, Jason A. Osborne, and Jay J. Cheng. 2017. "Kinetics and Mechanism of NaOH-Impregnated Calcined Oyster Shell-Catalyzed Transesterification of Soybean Oil" Energies 10, no. 11: 1920. https://doi.org/10.3390/en10111920
Note that from the first issue of 2016, this journal uses article numbers instead of page numbers. See further details here.