Analysis of the Potential of Low-Temperature Heat Pump Energy Sources

Department of Mechanical Engineering, Faculty of Engineering, Czech University of Life Sciences Prague, Kamýcká 129, 165 21 Prague-Suchdol, Czech Republic
*
Author to whom correspondence should be addressed.
Energies 2017, 10(11), 1922; https://doi.org/10.3390/en10111922
Submission received: 27 September 2017
/
Revised: 8 November 2017
/
Accepted: 15 November 2017
/
Published: 21 November 2017
(This article belongs to the Section L: Energy Sources)
Abstract
:The paper deals with an analysis of temperatures of ground masses in the proximities of linear and slinky-type HGHE (horizontal ground heat exchanger). It evaluates and compares the potentials of HGHEs and ambient air. The reason and aim of the verification was to gain knowledge of the temperature course of the monitored low-temperature heat pump energy sources during heating periods and periods of stagnation and to analyse the knowledge in terms of the potential to use those sources for heat pumps. The study was conducted in the years 2012–2015 during three heating periods and three periods of HGHEs stagnation. The results revealed that linear HGHE had the highest temperature potential of the observed low-temperature heat pump energy sources. The average daily temperatures of the ground mass surrounding the linear HGHE were the highest ranging from 7.08 °C to 9.20 °C during the heating periods, and having the lowest temperature variation range of 12.62–15.14 K, the relative frequency of the average daily temperatures of the ground mass being the highest at 22.64% in the temperature range containing the mode of all monitored temperatures in a recorded interval of [4.10, 6.00] °C. Ambient air had lower temperature potential than the monitored HGHEs.
1. Introduction
The effect of heat pumps, usually referred to as the heating factor, significantly influences the energy potential of the low-temperature source supplied to the evaporator. It mainly affects the consumption of energy to drive the heat pump compressor. The main low-temperature energy sources of heat pumps include air, water, ground, and rock masses. When using air, the installation of the energy system is easier and cheaper. The environmental aspect of using air is also an important issue. This system minimally affects the heat balance of the environment. The energy transferred from the air to the heat pump evaporator returns to the environment as thermal losses of the building. However, according to literature [1,2,3], the operation of the system is not efficient, reliable, nor stable during winter when the outdoor temperature is low. The exploitation of surface or groundwater is limited, in particular, by its availability, complex legislation, water flow variability and instability of the energy potential [4]. Thermal energy from ground masses in Europe is mainly exploited using horizontal ground heat exchangers (HGHEs) with different pipe configurations, most often linear or slinky-types, installed at depths of 1–2 m. Thermal energy from the rock mass is drawn by means of vertical tube exchangers in the form of single or double U-tube exchangers, installed in boreholes of 70–200 m depths. A heat transfer fluid flows through both of the heat exchanger types, abstracting heat from the source prior to being fed to the heat pump evaporator [5,6].
The primary objective of using renewable energy sources is first of all to reduce fossil fuel consumption. The question that is not entirely answered is how the above-mentioned low-temperature energy sources contribute to meeting the targets for reducing fuel and energy consumption.
By 2007, the most annually-installed heat pump types in the Czech Republic were those for which the low-temperature source for the evaporator were ground or rock masses. In 2006 alone, 4.82% of installed heat exchangers were of air to air heat pumps, 38.07% of air to water, 53.79% of ground to water and 3.32% of water to water heat pumps. However, in subsequent years, sharp falls were recorded in the installation of ground to water heat pumps. In 2014, the shares in total heat pump installation of ground to water, water to water, and air to water heat pump types were, respectively, 19.58%, 0.59%, and 79.83% [7]. Similar trends in changes in the share of low-temperature energy sources for heat pumps were also reported by Lund and Boyd [8] in the global geothermal energy use report. The main reason why investors prefer air to water heat pumps is because of their significantly lower investment costs compared to other low-temperature sources. Furthermore, their installation is easy and simple. For this reason, manufacturers have paid exceptional care to innovations and expansion of the possibilities of using air to water heat pumps [1]. Success has been particularly achieved in the use of air as a low temperature source. Contemporary heat pumps can work with air at −15 °C or lower without any problem. They can be delivered as block, compact units already filled with refrigerant, which significantly simplifies installation.
Popiel et al. [9] reported that the temperature distribution in the ground mass to a depth of 1.5–2.0 m is affected by the structure and physical properties of the mass, the cover surface of the mass and the climate of interaction (temperature, wind, solar radiation, humidity, precipitation). They also presented the differences in temperatures beneath a lawn and a parking lot. Rezaei et al. [10] also monitored the effect of different coverage of the ground mass containing HGHEs on the temperature distribution of the mass. Covering the surface with an insulating layer of recycled tires increased the heat flux transferred by HGHE by 17% in the heating season. Song et al. [11] and Blázquez et al. [12] analysed the most important parameters influencing the thermal characteristics of the ground mass, in particular the coefficient of thermal conductivity of the mass. The thermal characteristics of typical ground masses in the Czech Republic were stated by Kodešová et al. [13]. Kupiec et al. [14] dealt with the interaction of ground mass and the surrounding environment. They observed that in-ground masses without HGHE, the amount of heat transmitted to the surface of the mass from the surrounding environment in the half of the year with higher temperatures was equal to the amount of heat transferred from the ground mass to the surrounding environment in the half of the year with lower temperatures. This phenomenon causes the average temperature of the ground mass not to change in the given area. However, another situation occurs when the HGHE is installed in the ground mass. Heat drawn out by the HGHE during the heating season may not be generally compensated for by the heat supplied to the ground during the summer. The same point of thermal equilibrium, as with HGHE has been observed for the rock mass with vertical single U-tube heat exchanger and is reported in literature [15,16]. Nam et al. [16] developed a system of vertical heat exchanger integrated with a solar thermal storage tank to improve heat exchanger performance and extend its service life. However, Tarnawski [17] deduced, based on a computer simulation that HGHEs have little influence on the thermal degradation of the ground mass, when properly designed and installed. This question can be answered by an analysis of the results of long-term monitoring of temperatures of ground masses with HGHEs. Gonzalez et al. [18] attempted to improve existing knowledge of the reaction of ground masses to long-term extraction of heat energy by HGHEs through the analysis of the results of temperature measurement, physical properties of the mass, and climatic data. Hepburn et al. [19] also presented a system for monitoring the behaviour of ground masses in response to a HGHE used as a low-temperature heat pump energy source for the heating of a department store. They pointed out that the implemented HGHE can be considered as a sustainable source of energy.
The aim of the work was to gain new knowledge of the potential of low-temperature heat pump energy sources. The objectives were achieved by analysing the temperature course of the ground mass in the proximities of the two most frequently used types of HGHEs during heating and stagnation periods, as well as temperature differences between ground masses in the proximities of the HGHEs and reference ground mass. Furthermore, statistical characteristics of temperature sets of monitored HGHEs and ambient air were compared.
2. Materials and Methods
2.1. Theoretical Analysis
The effect of the ideal reversed Carnot cycle operating between the temperatures Tc and Th in which the heat is supplied and dissipated can be expressed by Equations (1) and (2):
Factor εc (cooling) is used to express the energy effect during cooling and εh (heating) when expressing the effect during heating. The temperature difference Tc − Th represents the work brought into the Carnot cycle. It follows that the smaller the temperature difference in Equations (1) and (2), the greater the effect of the ideal Carnot cycle. Considering a constant temperature Th in Equation (2), the ideal Carnot cycle makes possible the evaluation of the impact of temperature Tc, thus, essentially the temperature of the energy source from which heat is transferred to the heat pump, on the effect of the heat pump.
2.2. Materials and Methods of Measurement
Linear horizontal ground heat exchanger (HGHE) was made of polyethylene tubing PE 100RC 40 × 3.7 mm (LUNA PLAST a.s. Hořín, Czech Republic) resistant to point loads and cracking. Exchanger tubing with a total length of 330 m was installed at a depth of 1.8 m in three loops with a spacing of 1 m. The length of each loop was 54.62 m. Slinky-type HGHE was made of PE 100RC polyethylene tubing, 32 × 2.9 mm. Exchanger tubing with a total length of 200 m was installed at a depth of 1.5 m in 53 circular coiled loops with a spacing of 0.38 m. The HGHEs were not placed in a sand bed. The upper layer of the ground mass was made of backfill that ranged from 4.0 to 9.5 m. The heat transfer fluid flowing through the HGHEs was a mixture of 33% ethyl alcohol and 67% water. The temperatures of the reference ground mass tLR, tSR were measured at one point, at depths corresponding to HGHEs embedding at a distance of 10 m from the linear HGHE and 15 m from slinky-type HGHE. The subjects of evaluation and statistical analysis were the temperatures of the ground masses surrounding the linear HGHE, tL and the slinky-type HGHE, tS measured in close proximity to the HGHEs at a distance of 4 m from the beginning of HGHEs, the reference ground mass temperatures, tLR and tSR and ambient air temperature, te. Ground mass temperatures were measured using the GKF 125 and GKF 200 sensors (manufactured by GREISINGER electronics GmbH, Regenstauf, Germany) and recorded using the ALMEMO 5990 and ALMEMO 2890-9 measuring stations (manufactured by AHLBORN Mess-und Regulungstechnik GmbH, Holzkirchen, Germany). Ambient temperatures, te were measured at a height of 2 m above the ground surface and 20 m away from horizontal ground exchangers with the ALMEMO FHA646AG sensor (manufactured by AHLBORN Mess- und Regulungstechnik GmbH, Holzkirchen, Germany). All temperatures were recorded in quarter-hour intervals and an hourly average was calculated from these values.
Monitored HGHEs were connected to three heat pumps, 1 × IVT PremiumLine EQ E13 (Industriell Värme Teknik, Tnanas, Sweden) with a heat output of 13.3 kW at 0/35 °C and 2 × GreenLine HT Plus E17 with a heat output of 2 × 16.2 kW at 0/35 °C. The heat pumps were used all day long during the heating periods to heat the administration building and operational halls of the company VESKOM s.r.o. based in Dolní Měcholupy, Prague, Czech Republic. A detailed scheme of HGHEs is reported in Adamovsky et al. [20].
The measurements were carried out during three heating periods: 2012/2013 (from 17 September 2012 to 22 April 2013—218 days), 2013/2014 (from 18 September 2013 to 5 May 2014—230 days), and 2014/2015 (from 22 September 2014 to 20 May 2015—241 days). Furthermore, measurements were also obtained during three periods of stagnation of the HGHEs: 2013 (from 23 April to 17 September 2013—148 days), 2014 (from 6 May to 21 September 2014—139 days), and 2015 (from 21 May to 21 September 2015—124 days).
2.3. Statistical Evaluation
The results were evaluated using programs STATISTICA (StatSoft Inc., Tulsa, OK, USA, 2013), MS Excel 2016 and publication by Mošna [21]. The basic statistical characteristics of location, variability, and shape (Table 1 and Table 2) were used to analyze the temperature sets. A box plot (Figure 3) and absolute frequency graphs were used to visualize the distribution of the temperature set.
To test the hypothesis, Kolmagorov-Smirnov test [22] was used, applying the test criterion:
In Equation (3) w1,i, w2,i are the relative cumulative frequency of the tested temperature sets (%).
The critical value D2,α is calculated from:
In Equation (4) n1, n2 are the number of values in the monitored temperature sets; and α (-) is the level of significance (0.05).
The hypothesis is accepted when Equation (5) applies:
3. Results and Discussion
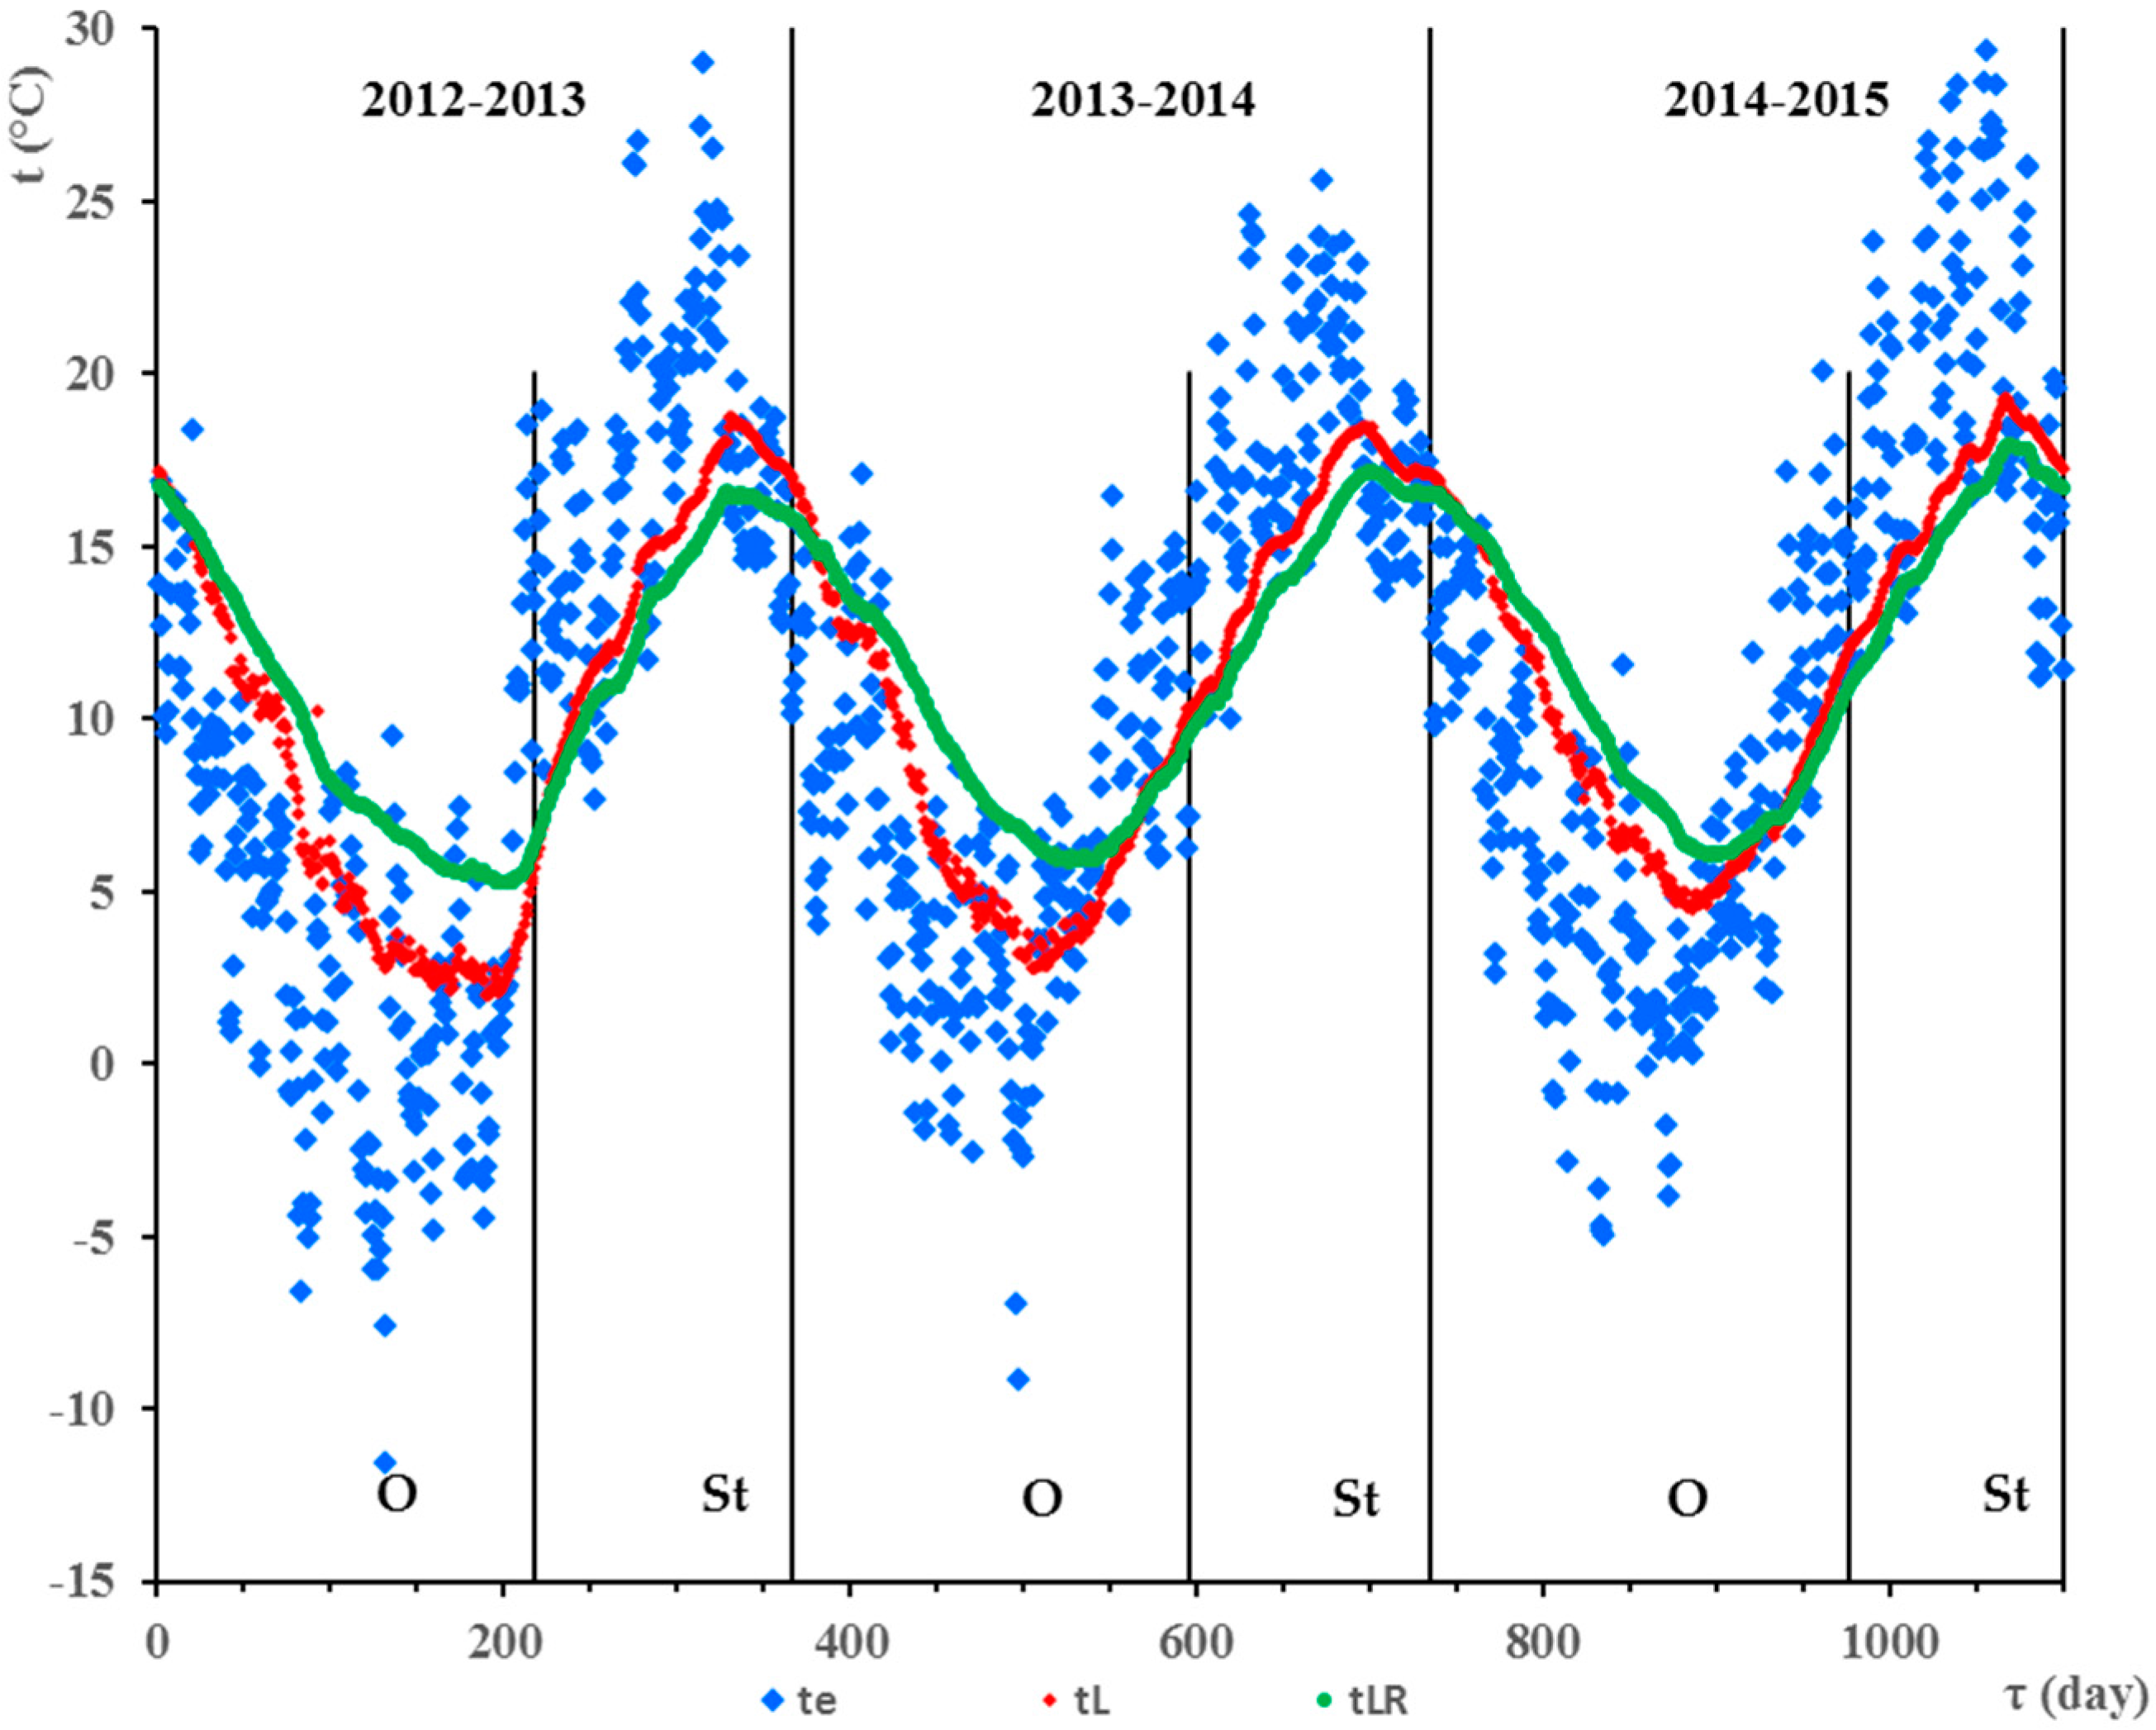
The average daily temperatures of the ground mass in the proximities of HGHEs (obtained over a duration of 1100 days), the reference ground mass temperatures and ambient temperatures in the heating periods or periods of operation, O, and periods of stagnation of the HGHEs, St, are presented in Figure 1 and Figure 2. The graphs show the dependence of the two ground mass temperatures on ambient temperatures. With adequate accuracy, the trend of ground mass temperatures during heating periods and periods of stagnation of the HGHEs can be expressed by an equation of free undamped oscillations of the mass point [23,24].
The results showed that the average daily ground mass temperatures in the proximity of the linear HGHE were higher than those in the proximity of the slinky-type HGHE by ΔtL,S,O = 1.30–1.94 K during the heating period. During six days of the heating period 2012/2013, average daily temperatures in the proximity of the slinky-type HGHE were negative, dropping as low as −0.06 °C to −0.19 °C. At the same time, significantly more thermal energy was extracted from the ground mass installed with linear HGHE compared to the ground mass with the slinky HGHE. For example, during the heating period of 2012/2013, the heat transfer per m2 of heat transfer area of the linear HGHE was 110.16 kWh/m2 and only 59.40 kWh/m2 with the slinky HGHE. Specific thermal energy extracted from the ground mass was determined by measuring the flow and temperature of the heat transfer fluid by the MTW 3 electronic device (Itron Inc., Liberty Lake, WA, USA). Lower ground mass temperatures in the proximities of slinky-type HGHE and lower specific heat flows extracted from the mass during the heating period were caused by a significantly smaller volume of the ground mass surrounding the relatively large heat exchange surface of slinky HGHE.
During the heating periods, both HGHEs showed almost identical decrease in average daily ground mass temperature. During each heating period, temperature decreased on average by ΔtO,L = 7.76 K, for the linear HGHE and by ΔtO,S = 7.98 K, for the slinky HGHE. The decrease in the average daily temperature of the mass was affected by the ambient temperature and the duration of the heating period. The average daily temperatures of the ground mass at the beginnings of the heating periods differed only at intervals of ΔtB,L = −0.13–0.21 K, for linear HGHE and ΔtB,S = −0.49–0.62 K, for the slinky HGHE. Significant reductions in the ground mass temperatures in the proximities of the HGHEs at the beginning of the heating periods would indicate a trend of decreasing potential of the low-temperature energy source.
The differences between the average daily temperatures of the reference ground mass, tLR,O, and the ground mass in the proximity of the linear HGHE, tL,O, were in the heating season ΔtLR,L,O = 0.79 ± 0.56 K. The differences between the average daily temperatures of the reference ground mass, tSR,O, and the ground mass in the proximity of the slinky HGHE, tS,O, were ΔtSR,S,O = 1.12 ± 0.50 K. The maximum ground mass temperature differences reached ΔtLR,L,O max = 4.25 K and ΔtSR,S,O max = 5.68 K.
The differences in average daily temperatures of the reference mass for linear and slinky HGHEs were mostly positive during winter period, ΔtLR,O-SR,O = 0.93 ± 0.54 K. The differences of these reference temperatures were predominantly negative during summer period, ΔtLR,St-SR,St = −0.54 ± 0.34 K. These values indicate that in the summer, the reference mass temperatures for the slinky HGHE were higher than for the linear HGHE due to the surrounding environment, the incident solar radiation and the smaller depth. In the winter, the impact of the surrounding environment with respect to the depth of embedding was not so great and the temperatures at the reference depth of the linear HGHE were higher. Additionally, a greater differences in ambient temperatures, te and the reference mass temperatures, tLR and tSR in the summer and winter periods confirmed the assumption. They were Δte,St-LR,St = 3.81 ± 3.90 K and Δte,St-SR,St = 3.27 ± 3.96 K in the summer, Δte,O-LR,O = −3.41 ± 4.93 K and Δte,O-SR,O = −2.48 ± 4.78 K in the winter.
The graphs in Figure 1 and Figure 2 indicate that the ground mass was heated to the maximum temperature during the stagnation period. Subsequently, the ground mass temperature decreased due to a decrease in the ambient temperature. The values of the maximum average daily temperatures did not differ significantly in the periods of stagnation despite the different depths of installation of the HGHEs. They ranged from 18.5 °C to 18.73 °C around the linear HGHE and 18.06−18.2 °C around the slinky-type HGHE. These temperatures correspond very well to the values reported by Popiel et al. [4]. The time in which the temperature of the ground mass increased by 1 K ranged from 8.83 to 12.07 days, during the stagnation of the linear HGHE, 8.87–11.65 days, during the stagnation of the slinky HGHE and from 9.68 to 13.73 days, in the reference ground mass.
Average daily temperatures of low-temperature energy sources during heating periods do not provide specific information on temperature distribution and this distorts the assessment of the potential of these sources. It is necessary to carry out an analysis in terms of the distribution and frequency of temperatures.
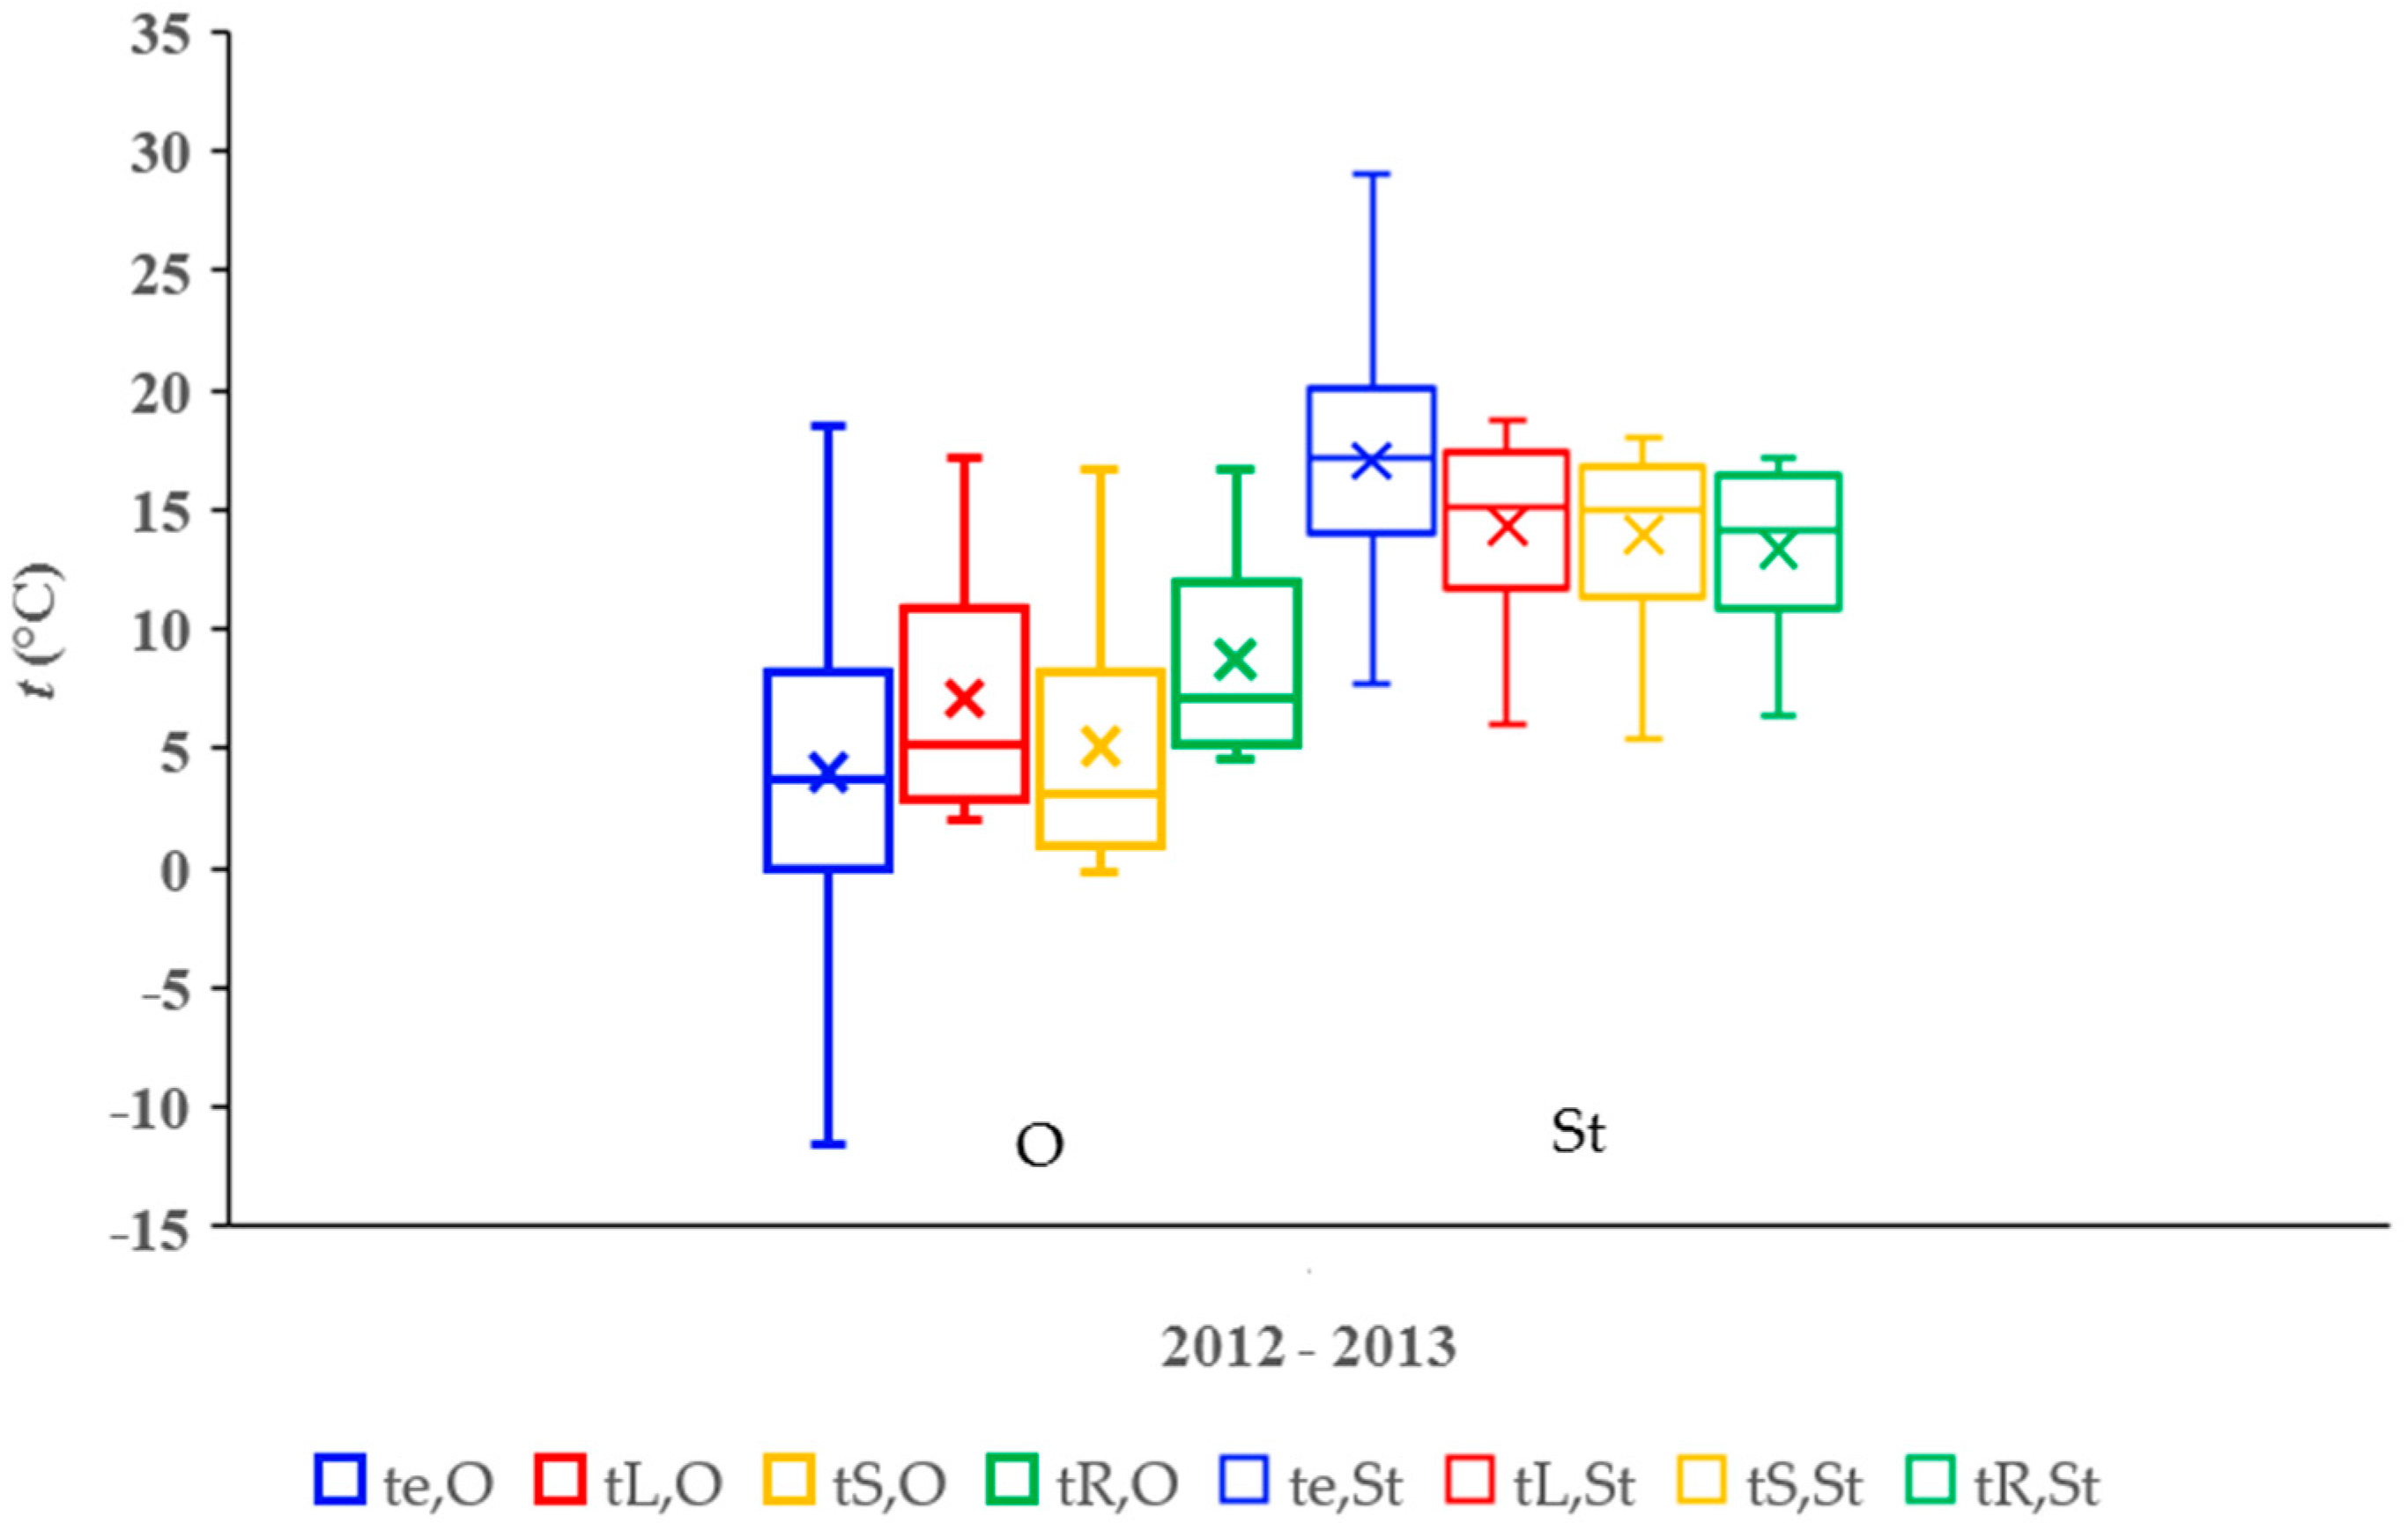
The results of the statistical analysis of the ground mass temperature data sets and ambient temperatures are presented in Table 1 and Table 2. The graph in Figure 3 gives an example of the quantile characteristics for the average daily temperatures of the ground mass and the ambient air during the heating period 2012/2013 and the period of HGHEs stagnation 2013. The statistical characteristics for the following periods are similar.
The temperatures of the reference mass tR,O and tR,St in the following graphs are the average temperatures of tLR,O and tSR,O, or tLR,St and tSR,St.
The following points ensue from the analysis of the temperature data sets for the heating periods, O:
- Considerable variability exists in the air temperature set. The variation range, R and the coefficient of variation, S% were the highest in all monitored periods. Temperature difference between the lower quartile, Q1 and the minimum, xmin was also significantly the highest and was in the lowest temperature range. The interquartile ranges Q2–Q1 were also the highest.
- Except for the air temperature set, te,O median values of temperature were, closer to the minimum temperature, xmin than to the maximum temperature, xmax. Higher concentration of the temperatures was, therefore, in the lower temperature range.
- Ground mass temperatures tL,O in the proximity of the linear HGHE had the least variability among sets of temperatures of the monitored low-temperature energy sources, being the dataset with the lowest range, R and coefficient of variation, S%. Their lower and upper quartiles, Q1 and Q2 were the highest. For this set, temperature difference between the lower quartile, Q1 and the minimum, xmin was small and was in the highest temperature range.
- The variability of the set of average daily ground mass temperatures in the area of the slinky HGHE, tS,O, was larger. The range, R, and the coefficient of variation, S%, were higher than in the set of temperatures of the ground mass which was installed with the linear HGHE. The lower and upper quartile values of temperature, Q1 and Q2, were also lower. The difference between the lower quartile temperature, Q1, and the minimum, xmin fell in the lower temperature range. The characteristics of the temperature set, tS,O, are comparable to the values of the temperature set, te,O.
- Characteristics of the temperature sets, tLR,O and tSR,O, of the reference ground masses differ only insignificantly. This is due to different depths of measurement of the mass temperatures.
- The range, R, and coefficient of variation, S%, of the temperature sets tL,O and tS,O of the ground masses installed with HGHEs were higher than those of the temperature sets tLR,O and tSR,O of the reference ground mass. The lower and upper quartiles, Q1 and Q2, of the temperatures tLR,O and tSR,O were higher than those of temperatures tL,O and tS,O of the ground masses with HGHEs. The median of the temperature sets tLR,O and tSR,O was also higher than that of the sets tL,O and tS,O.
The variability of the set of the ground mass average daily temperatures in the proximity of HGHEs was certainly affected by the different depths of installation of the linear and slinky HGHEs. However, it can be assumed that the configuration of HGHEs had a dominant impact during the heating period, taking into consideration the difference in depths of HGHEs installation of only 0.3 m. This assumption is confirmed by the results of measurements of the temperature differences of the reference masses and of the differences in ambient temperatures and reference masses, which were in average no more than 1 K, as it is apparent from the previous text.
Points deriving from the analysis of the sets of temperatures observed during stagnation periods, St:
- The variability of the air temperature set remained high. The variation range, R, and the coefficient of variation, S%, were still the highest in all monitored periods. The differences between Q1 and xmin, between the quartiles Q1 and Q2, and the values of the quartiles were also the highest.
- With the exception of the air temperature set, te,St, the median values of temperature were closer to the maximum temperature, xmax. Higher concentration of the temperature was, therefore, in the higher temperature range.
- The variabilities of the sets of temperatures of the ground masses in the proximities of the HGHEs, tL,St and tS,St were smaller than the variability of the air temperature sets, te,St. The variation range, R, and the coefficient of variation, S%, of the temperature sets tL,St and tS,St, arithmetic mean, and median, differed insignificantly during the monitored periods of stagnation.
- The range, R, of the temperature sets tL,St and tS,St of the ground masses installed with HGHEs was higher than those of the temperature sets tLR,St and tSR,St of the reference ground mass. The lower and upper quartiles, Q1 and Q2, of the temperatures, tLR,St and tSR,St, were mostly lower than those of the temperatures tL,St and tS,St of the ground masses with HGHEs. The median, , of the temperature sets tLR,St and tSR,St were also mostly lower than those of tL,St and tS,St.
The graphs in Figure 1, Figure 2 and Figure 3 show that the temperatures of the ground mass during the period of stagnation were higher in the proximities of HGHEs than in the reference mass. The difference was ΔtL,St-LR,St = 1.13 ± 0.40 K for the linear HGHE and ΔtS,St-SR,St = 0.13 ± 0.36 K for the slinky HGHE. Higher temperatures in the proximities of HGHEs can stem from a higher thermal conductivity coefficient and different structure of the backfill ground mass in the proximities of HGHEs compared to the ground at the reference mass.
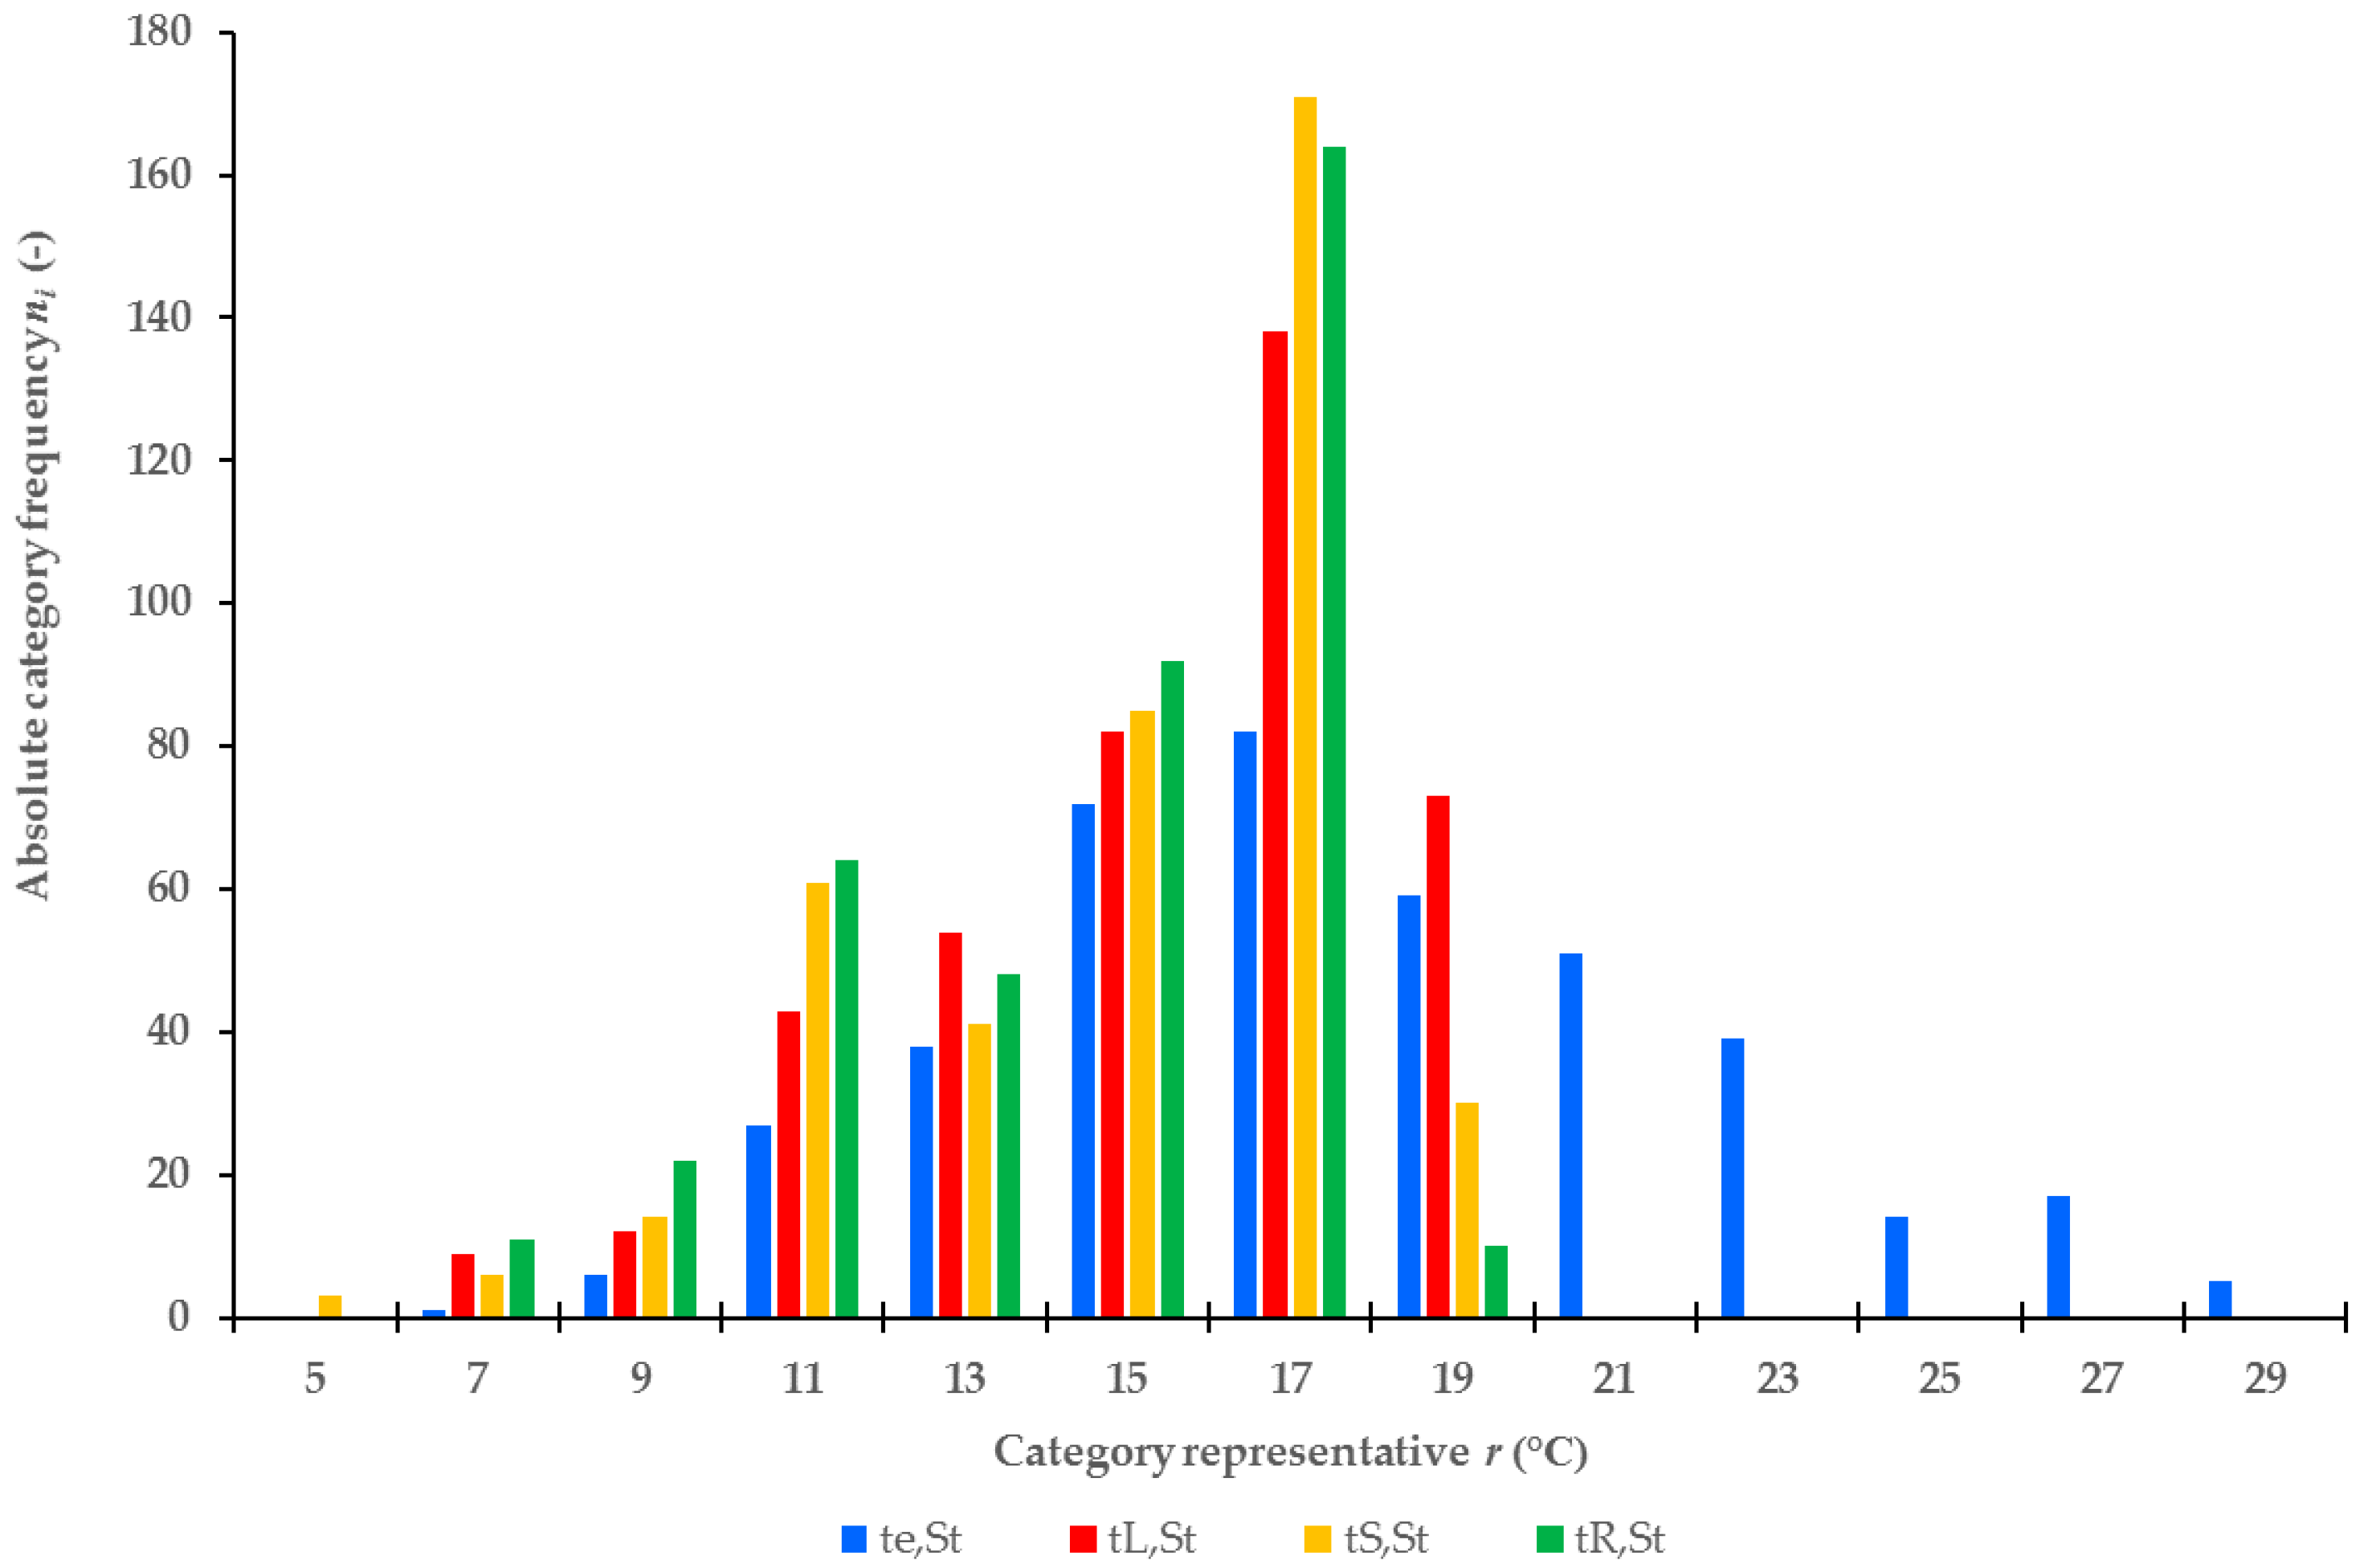
The temperature distribution of the monitored low-potential energy sources during the heating periods (689 days) and periods of stagnation of the HGHEs (411 days) are depicted in Figure 4 and Figure 5 using histograms. They allow estimation of the highest temperature frequencies and mode , at interval lengths of 2 K.
The modes of the observed average daily temperatures in the heating period, except for the temperatures of the reference ground mass tR,O, were within the interval [4.10, 6.00] °C. However, the frequency of temperatures varied. The relative frequency reached the highest value wi = 22.64% in the temperature set of the ground mass with linear HGHE. It was 18.29% in the temperature set of the mass with the slinky HGHE and 14.51% for ambient temperatures. The mode, , of the reference mass temperature tR,O was within the interval [6.10, 8.00] °C with relative frequency wi = 25.69%. Higher temperature frequencies at higher temperature intervals indicate a higher potential of a low-temperature energy source. The temperature distribution can be considered as almost symmetrical, as follows from the air temperature histogram; the coefficient of asymmetry is Ae,O = 0.02. The distribution of temperatures in ground masses with linear and slinky HGHEs was left-handed asymmetric, with values predominantly lower than the arithmetic means, AL,O = 0.54 and AS,O = 0.55. The arithmetic mean, , was higher than the median, , in all monitored temperature sets. The greatest difference of 1.03–2.05 K was observed with the slinky-type HGHE and the smallest difference of 0.32–0.38 K was observed with ambient air.
The characteristics of temperature sets during the period of stagnation of HGHEs differed from those in the heating periods. The modal value of temperature, including the reference mass temperatures, was within the range [16.10, 18.00] °C. The values of relative temperature frequency, wi were in a different order. The highest value of relative frequency, wi = 41.61%, was recorded in the set of temperatures of the ground mass installed with the slinky-type HGHE. A relative frequency of wi = 33.58% was recorded with the linear HGHE and wi = 19.95% for ambient temperatures. The distribution of air temperatures can be considered again as almost symmetrical (Ae,St = 0.32). The temperature sets of the ground masses with linear and the slinky HGHE were right-handed asymmetric, with predominance of values higher than the arithmetic mean (AL,St = −0.90 and AS,St = −0.95). Except for the ambient temperatures, te,St, the arithmetic mean, , was lower than the median of the monitored temperature sets. The greatest difference of 0.75–1.05 K was again observed with the slinky HGHE.
Points deriving from the Kolmogorov-Smirnov test for evaluating the hypothesis that the temperature frequencies of the monitored low temperature energy sources did not differ statistically significantly in each heating period:
- The values of the test criterion, D2, for air temperature frequencies, te,O, were smaller in each heating period than the critical values of criterion D2,α. Therefore, the differences in temperature frequencies were not statistically significant.
- The differences in distribution of temperature frequencies of the ground masses in the proximity of the linear HGHE, tL,O, and in the proximity of the slinky HGHE, tS,O, were statistically significant. D2 > D2,α applies for the test criteria for temperatures in each heating period.
The test results are unambiguous during the HGHEs stagnation period. The presumption of D2 < D2,α applies for the test criteria for the temperature frequencies te,St, tL,St, and tS,St. The differences in temperature frequencies were not statistically significant.
The testing of the hypothesis showed that the frequency of average daily temperatures of ground mass with HGHEs tL,O, tS,O differed in each year. The results of evaluation of temperature distribution in individual heating periods are presented in Table 3.
The results in Table 3 show that the ground mass temperature mode for the linear HGHE was in the intervals [2.10; 4.00] and [4.10; 6.00] in the individual heating periods. These intervals contained from 23.2% to 41.3% of the temperature set tL,O. The intervals in two heating periods corresponded to the interval containing the mode of all the ground mass temperatures in heating periods (see Figure 4). The mode for the slinky HGHE was at three different intervals. These intervals contained from 24.3% to 37.6% of the temperature set tS,O.
4. Conclusions
The low-temperature energy source with the highest temperature potential for a heat pump is the linear HGHE, as follows from the analysis of the course and comparison of quantile characteristics of temperature sets of the monitored low-temperature energy sources during heating and stagnation periods. The average daily temperatures of the ground mass in the proximity of the linear HGHE during the heating periods were the highest and had the lowest variability. The relative frequency of the average daily temperatures of the ground mass installed with the linear HGHE was the highest in the temperature interval containing the mode of all monitored temperatures. Temperatures of the ground mass surrounding the slinky HGHE during the heating period were lower than those of the mass in the proximity of the linear HGHE and attained negative values. Additionally, the variability of the temperature set of the ground mass with the slinky HGHE was larger. The nature of the changes in average daily temperatures of the ground mass during the heating periods was the same for both HGHEs. The maximum temperature differences of the reference ground mass and the masses in the proximity of the HGHEs did not reach 6 K in the heating period. The ambient air had a lower temperature potential than the monitored HGHEs. During the heating period, this set was characterized by the lowest temperatures, high temperature variability, and low relative frequency in the temperature range containing the mode of its monitored temperatures. These conclusions are also confirmed by results of operational verification [22,23,24,25] and modelling [14]. It is realistic to assume that, in the climatic conditions of the Czech Republic, the more favourable characteristics of the linear HGHE temperature set have positive effect on the operation of the heat pump and reduce the consumption of fossil fuels both in the heating system and for the heat pump drive. However, the essential conditions for achieving better effects are the fulfilment of the basic requirements of HGHE design (1) that take into account the area of the site, the length of the pipeline, the depth of embedding the HGHE, the thermal properties of the ground mass, the material of the pipeline, etc.
Observing the temperatures of the ground mass with HGHEs during the period of their stagnation showed that the nature of the course of increasing the temperatures of the ground mass in the proximity of HGHEs is identical despite the difference in their depths of installation (0.3 m), both in terms of the highest temperature values and the rate of heating of the ground mass. The variabilities of the set of temperatures of the ground masses surrounding the HGHEs was not significantly different and was higher than that of the reference ground mass. An important result of this study is the knowledge of the insignificant difference in temperature of the ground mass with HGHEs at the beginning of the heating periods. Both types of HGHEs can, therefore, be considered as stable, sustainable, low-temperature sources for heat pumps with long service life.
Author Contributions
Both authors contributed equally to this paper.
Conflicts of Interest
The authors declare no conflict of interest.
Nomenclature
| A | Coefficient of skewness (-) |
| D2 | Test criterion (-) |
| D2,α | Critical value of test criterion (-) |
| O | Heating period |
| Q1 | Lower quartile (°C) |
| Q2 | Upper quartile (°C) |
| S | Standard deviation (K) |
| S2 | Variance (K2) |
| S% | Coefficient of variation (%) |
| St | Period of HGHE stagnation |
| Tb | Temperature at which the heat is brought into the Carnot cycle (K) |
| Tr | Temperature at which the heat is drawn out of the Carnot cycle (K) |
| ni | Absolute category frequency (-) |
| r | Category representative (°C) |
| t | Temperature (°C) |
| wi | Relative frequency (%) |
| xmax | Maximum (°C) |
| xmin | Minimum (°C) |
| Arithmetic mean (°C) | |
| Median (°C) | |
| Mode (°C) | |
| Δ | Difference (K) |
| εc | Cooling factor |
| εh | Heating factor |
| τ | Number of days (day) |
| Subscript | |
| B | Beginning of the heating period |
| e | Ambient environment |
| L | Linear HGHE |
| O | Heating period |
| R | Reference ground mass |
| S | Slinky HGHE |
| St | Period of stagnation |
References
- Gou, X.; Fu, Y.; Shah, I.A.; Li, Y.; Xu, G.; Yang, Y.; Wang, E.; Liansheng, L.; Wu, J. Research on a Household Dual Heat Source Heat Pump Water Heater with Preheater Based on ASPEN PLUS. Energies 2016, 9, 1026. [Google Scholar] [CrossRef]
- Ni, L.; Dong, J.K.; Yao, S.; Shen, C.; Qv, D.H.; Zhang, X.D. A review of heat pump systems for heating and cooling of buildings in China in the last decade. Renew. Energy 2016, 84, 30–45. [Google Scholar] [CrossRef]
- Touchie, M.F.; Pressnail, K.D. Testing and simulation of a low-temperature air-source heat pump operating in a thermal buffer zone. Energy Build. 2014, 75, 149–159. [Google Scholar] [CrossRef]
- Kim, J.; Nam, Y. A Numerical Study on System Performance of Groundwater Heat Pumps. Energies 2016, 9, 4. [Google Scholar] [CrossRef]
- Brandl, H. Energy foundations and other thermo-active ground structures. Geotechnique 2006, 56, 81–122. [Google Scholar] [CrossRef]
- Banks, D. An Introduction to Thermogeology: Ground Source Heating and Cooling, 2nd ed.; John Wiley & Sons: Chichester, UK, 2012; p. 546. ISBN 978-0-470-67034-7. [Google Scholar]
- Bufka, A.; Rosecký, D. Renewable Energy in 2014. Results the Statistical Survey; The Ministry of Industry and Trade of the Czech Republic: Prague, Czech Republic, 2016. (In Czech) [Google Scholar]
- Lund, J.W.; Boyd, T.A. Direct Utilization of Geothermal Energy 2015 Worldwide Review. In Proceedings of the World Geothermal Congress 2015, Melbourne, Australia, 19–25 April 2015; Available online: https://pangea.stanford.edu/ERE/db/WGC/papers/WGC/2015/01000.pdf (accessed on 16 April 2017).
- Popiel, C.; Wojtkowiak, J.; Biernacka, B. Measurements of temperature distribution in ground. Exp. Therm. Fluid Sci. 2001, 25, 301–309. [Google Scholar] [CrossRef]
- Rezaei, B.A.; Kolahdouz, E.M.; Dargush, G.F.; Weber, A.S. Ground source heat pump pipe performance with Tire Derived Aggregate. Int. J. Heat Mass Transf. 2012, 55, 2844–2853. [Google Scholar] [CrossRef]
- Song, Y.; Yao, Y.; Na, W. Impacts of soil pipe thermal conductivity on performance of horizontal pipe in a ground-source heat pump. In Proceedings of the Sixth International Conference for Enhanced Building Operations, Shenzhen, China, 6–9 November 2006; Available online: http://hdl.handle.net/1969.1/5465 (accessed on 16 April 2017).
- Blázquez, C.S.; Martín, A.F.; Nieto, I.M.; Aguilera, D.G. Measuring of thermal Conductivities of soils and rock to be used in the calculation of a geothermal installation. Energies 2017, 10, 795. [Google Scholar] [CrossRef]
- Kodešová, R.; Vlasáková, M.; Fér, M.; Teplá, D.; Jakšík, O.; Neuberger, P.; Adamovský, R. Thermal properties of representative soils of the Czech Republic. Soil Water Res. 2013, 8, 141–150. [Google Scholar]
- Kupiec, K.; Larwa, B.; Gwagera, M. Heat transfer in horizontal ground heat exchangers. Appl. Therm. Eng. 2015, 75, 270–276. [Google Scholar] [CrossRef]
- Wei, W.; Wang, B.; You, T.; Shi, W.; Li, X. A potential solution for thermal imbalance of ground source heat pump systems in cold regions: Ground source absorption heat pump. Renew. Energy 2013, 59, 39–48. [Google Scholar] [CrossRef]
- Nam, Y.J.; Gao, X.Y.; Yoon, S.H.; Lee, K.H. Study on the Performance of a Ground Source Heat Pump System Assisted by Solar Thermal Storage. Energies 2015, 8, 13378–13394. [Google Scholar] [CrossRef]
- Tarnawski, V.R.; Leong, W.H.; Momose, T.; Hamada, Y. Analysis of ground source heat pumps with horizontal ground heat exchangers for northern Japan. Renew. Energy 2009, 34, 127–134. [Google Scholar] [CrossRef]
- Gonzalez, R.G.; Verhoef, A.; Vidale, P.L.; Main, B.; Gan, G.; Wu, Y. Interactions between the physical soil environment and a horizontal groundcoupled heat pump, for a domestic site in the UK. Renew. Energy 2012, 44, 141–153. [Google Scholar] [CrossRef]
- Hepburn, B.D.P.; Sedighia, M.; Thomas, H.R.; Manju, H.R. Field-scale monitoring of a horizontal ground source heat system. Geothermics 2016, 61, 86–103. [Google Scholar] [CrossRef]
- Mošna, F. Statistical Tools of Excel. In Proceedings of the 16th International Conference APLIMAT 2017, Bratislava, Slovakia, 31 January–2 February 2017; pp. 1101–1106. [Google Scholar]
- Pratt, J.W.; Gibbons, J.D. Concepts of Nonparametric Theory; Springer: New York, NY, USA, 1981; pp. 318–344. ISBN 978-1-4612-5933-6. [Google Scholar]
- Neuberger, P.; Adamovský, R.; Šeďová, M. Temperatures and Heat Flows in a Soil Enclosing a Slinky Horizontal Heat Exchanger. Energies 2014, 7, 972–987. [Google Scholar] [CrossRef]
- Pauli, P.; Neuberger, P.; Adamovský, R. Monitoring and Analysing Changes in Temperature and Energy in the Ground with Installed Horizontal Ground Heat Exchangers. Energies 2016, 9, 555. [Google Scholar] [CrossRef]
- Inalli, M.; Esen, H. Experimental thermal performance evaluation of a horizontal ground-source heat pump system. Appl. Therm. Eng. 2004, 24, 2219–2232. [Google Scholar] [CrossRef]
- Adamovský, D.; Neuberger, P.; Adamovský, R. Changes in energy and temperature in the ground mass with horizontal heat exchangers—The energy source for heat pumps. Energy Build. 2015, 92, 107–115. [Google Scholar] [CrossRef]
Figure 1.
Ground mass temperatures in the area of linear HGHE (tL), reference ground mass (tLR) and ambient air temperatures (te). O—operation of HGHE; St—stagnation of HGHE.
Figure 1.
Ground mass temperatures in the area of linear HGHE (tL), reference ground mass (tLR) and ambient air temperatures (te). O—operation of HGHE; St—stagnation of HGHE.

Figure 2.
Ground mass temperatures in the area of the slinky HGHE (tS), reference ground mass (tSR), and ambient air temperatures (te). O—operation of HGHE; St—stagnation of HGHE.
Figure 2.
Ground mass temperatures in the area of the slinky HGHE (tS), reference ground mass (tSR), and ambient air temperatures (te). O—operation of HGHE; St—stagnation of HGHE.
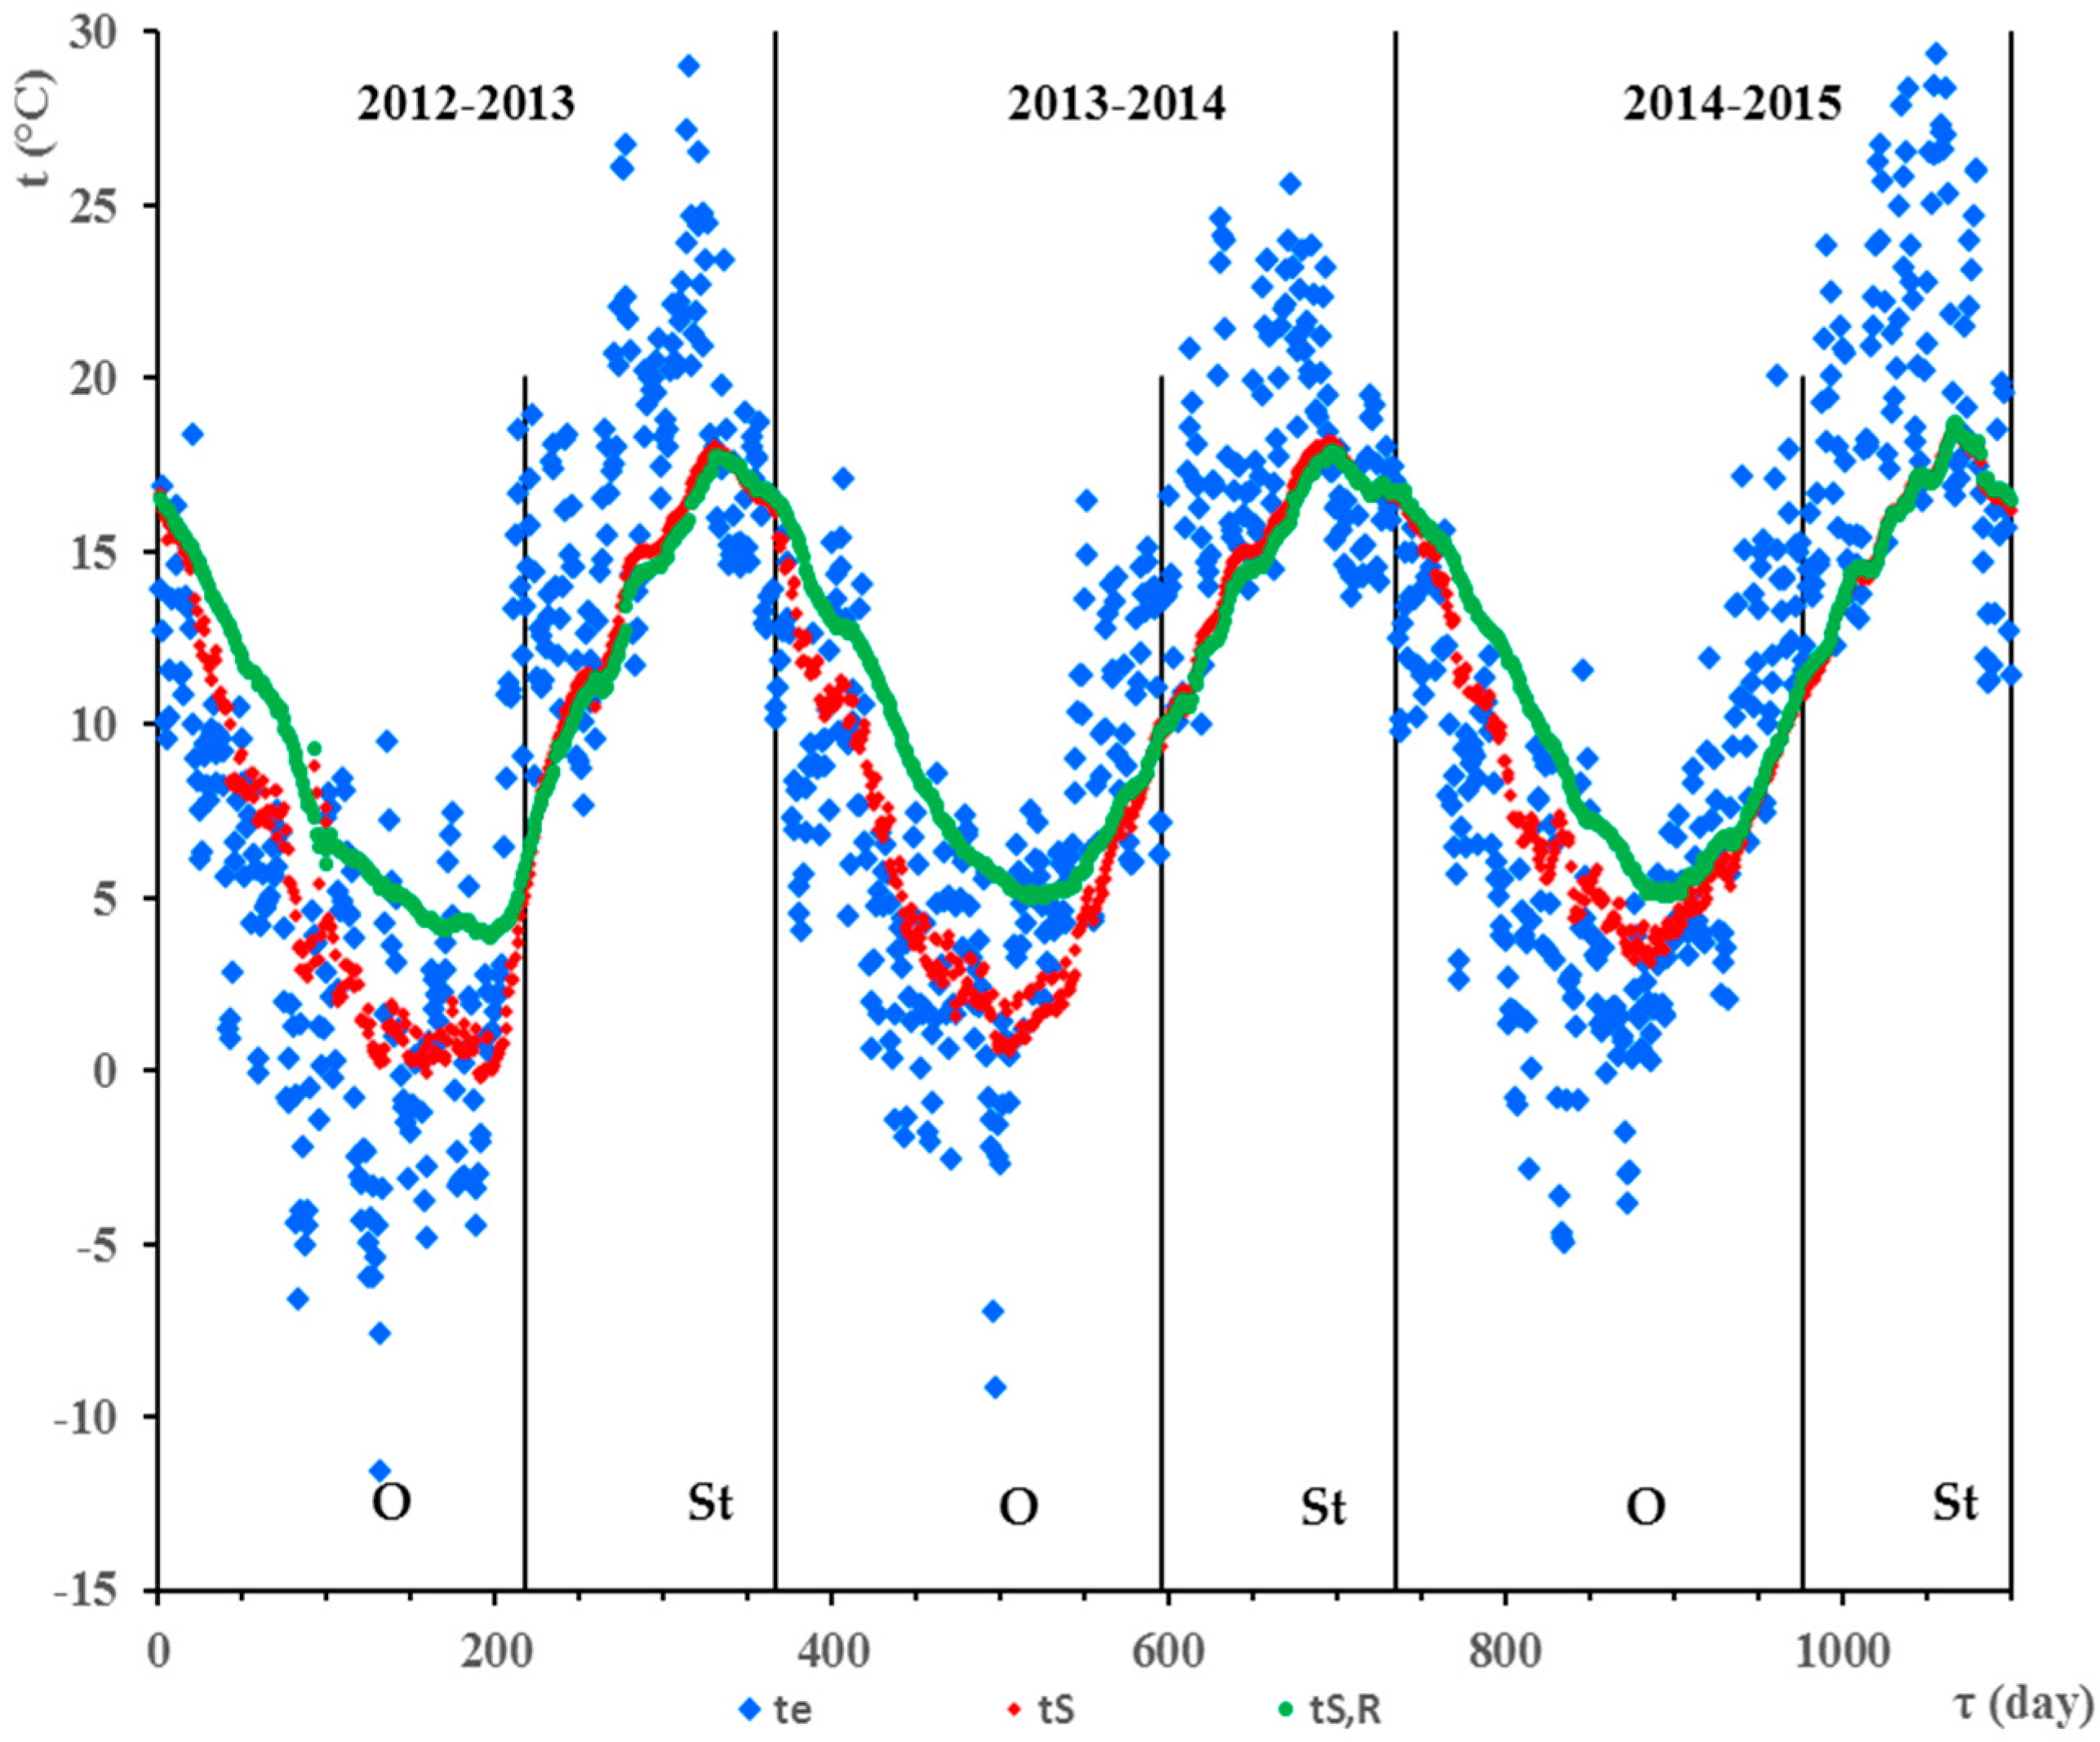
Figure 3.
Box plot of temperatures of ground mass with linear HGHE (tL,O, tL,St), slinky HGHE (tS,O, tS,St), reference ground mass (tR,O, tR,St), and ambient temperatures (te,O, te,St) during the heating season 2012/2013 (O) and the period of stagnation of the HGHEs in 2013 (St).
Figure 3.
Box plot of temperatures of ground mass with linear HGHE (tL,O, tL,St), slinky HGHE (tS,O, tS,St), reference ground mass (tR,O, tR,St), and ambient temperatures (te,O, te,St) during the heating season 2012/2013 (O) and the period of stagnation of the HGHEs in 2013 (St).

Figure 4.
Frequencies of average daily temperatures of the ground masses (tL,O, tS,O), reference ground masses (tR,O), and ambient temperatures (te,O) during the heating periods occurring between 2012 and 2015.
Figure 4.
Frequencies of average daily temperatures of the ground masses (tL,O, tS,O), reference ground masses (tR,O), and ambient temperatures (te,O) during the heating periods occurring between 2012 and 2015.
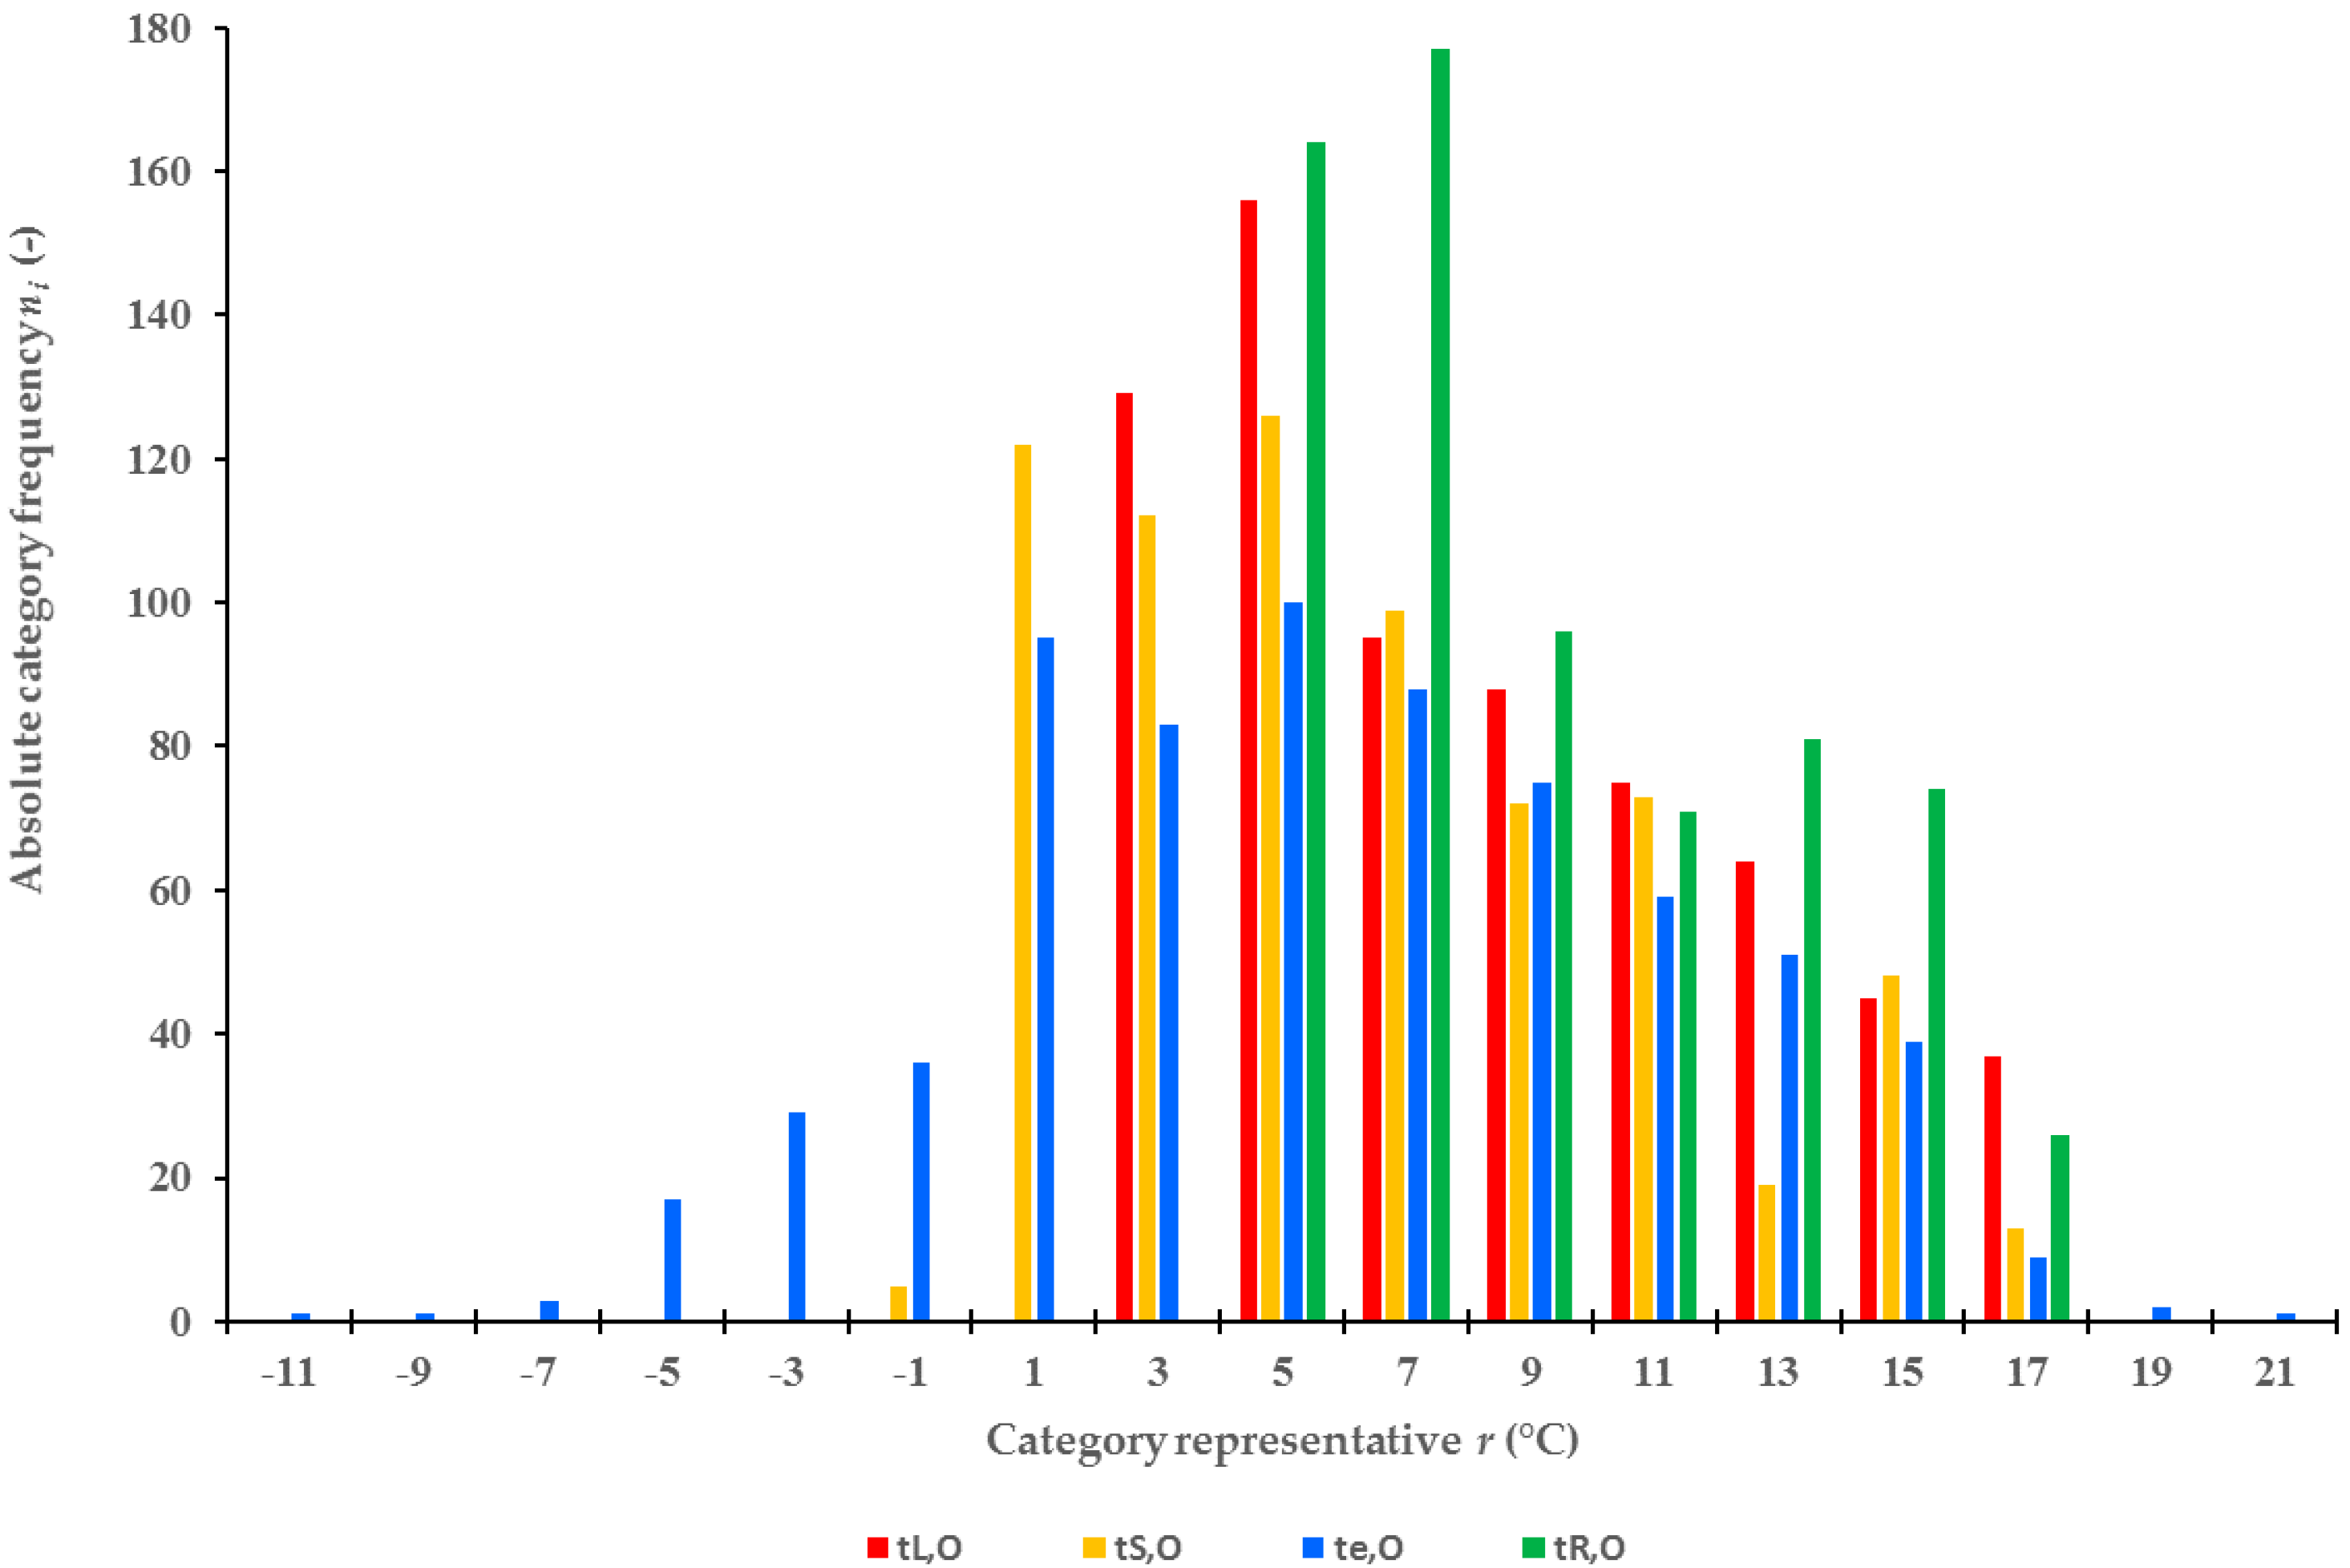
Figure 5.
Frequencies of average daily temperatures of the ground mass (tL,St, tS,St), reference ground mass (tR,St), and ambient temperatures (te,St) during periods of stagnation of the HGHE occurring between 2012 and 2015.
Figure 5.
Frequencies of average daily temperatures of the ground mass (tL,St, tS,St), reference ground mass (tR,St), and ambient temperatures (te,St) during periods of stagnation of the HGHE occurring between 2012 and 2015.

Table 1.
Quantile characteristics of sets of average daily temperatures of ground masses in the proximities of HGHEs and ambient temperatures during heating periods.
Table 1.
Quantile characteristics of sets of average daily temperatures of ground masses in the proximities of HGHEs and ambient temperatures during heating periods.
| Quantile Characteristics | 2012–2013 | 2013–2014 | 2014–2015 | ||||||||||||
|---|---|---|---|---|---|---|---|---|---|---|---|---|---|---|---|
| Linear HGHE (°C) | Slinky HGHE (°C) | Air (°C) | Linear HGHE (°C) | Slinky HGHE (°C) | Air (°C) | Linear HGHE (°C) | Slinky HGHE (°C) | Air (°C) | |||||||
| tL,O | tLR,O | tS,O | tSR,O | te,O | tL,O | tLR,O | tS,O | tSR,O | te,O | tL,O | tLR,O | tS,O | tSR,O | te,O | |
| Mean (°C) | 7.08 | 9.30 | 5.11 | 8.16 | 3.98 | 7.75 | 9.40 | 6.01 | 8.78 | 6.45 | 9.20 | 10.01 | 7.90 | 9.51 | 6.87 |
| Standard deviation S (K) | 4.76 | 3.74 | 4.94 | 4.05 | 5.70 | 3.91 | 3.12 | 4.00 | 3.37 | 4.75 | 3.68 | 3.36 | 3.72 | 3.58 | 5.14 |
| Minimum xmin (°C) | 2.00 | 5.23 | −0.19 | 3.87 | −11.54 | 2.75 | 5.84 | 0.59 | 4.96 | −9.13 | 4.45 | 6.01 | 3.13 | 5.05 | −4.96 |
| Maximum xmax (°C) | 17.14 | 16.74 | 16.71 | 16.51 | 18.50 | 16.93 | 15.78 | 16.09 | 16.46 | 17.09 | 17.06 | 16.53 | 16.58 | 16.77 | 20.06 |
| Median (°C) | 5.11 | 7.78 | 3.06 | 6.27 | 3.66 | 6.54 | 8.36 | 4.98 | 7.94 | 6.07 | 8.29 | 9.07 | 6.75 | 8.69 | 6.50 |
| Lower quartile Q1 (°C) | 2.90 | 5.85 | 0.91 | 4.54 | −0.11 | 4.33 | 6.71 | 2.48 | 5.80 | 3.25 | 6.23 | 7.11 | 4.88 | 6.53 | 2.72 |
| Upper quartile Q2 (°C) | 10.89 | 12.44 | 8.22 | 11.51 | 8.13 | 10.73 | 12.36 | 9.39 | 11.69 | 9.74 | 11.82 | 12.92 | 10.56 | 12.49 | 11.01 |
| Variance S2 (K2) | 22.66 | 13.98 | 24.42 | 16.41 | 32.50 | 15.29 | 9.74 | 16.01 | 11.37 | 22.52 | 13.54 | 11.29 | 13.82 | 12.83 | 26.47 |
| Coefficient of variation S% (%) | 67.24 | 40.22 | 96.77 | 49.67 | 143.10 | 50.43 | 33.21 | 66.57 | 38.40 | 73.56 | 40.00 | 33.55 | 47.07 | 37.69 | 74.93 |
| Range R (K) | 15.14 | 11.51 | 16.90 | 12.64 | 30.03 | 14.18 | 9.94 | 15.50 | 11.50 | 26.22 | 12.62 | 10.52 | 13.45 | 11.72 | 25.03 |
| Interquartile range Q2–Q1 (K) | 7.98 | 6.59 | 7.30 | 6.97 | 8.24 | 6.40 | 5.65 | 6.91 | 5.89 | 6.49 | 5.59 | 5.81 | 5.69 | 5.96 | 8.29 |
Table 2.
Quantile characteristics of sets of average daily temperatures of ground masses in the proximities of HGHEs and ambient temperatures during periods of HGHE stagnation.
Table 2.
Quantile characteristics of sets of average daily temperatures of ground masses in the proximities of HGHEs and ambient temperatures during periods of HGHE stagnation.
| Quantile Characteristics | 2013 | 2014 | 2015 | ||||||||||||
|---|---|---|---|---|---|---|---|---|---|---|---|---|---|---|---|
| Linear HGHE (°C) | Slinky HGHE (°C) | Air (°C) | Linear HGHE (°C) | Slinky HGHE (°C) | Air (°C) | Linear HGHE (°C) | Slinky HGHE (°C) | Air (°C) | |||||||
| tL,St | tLR,St | tS,St | tSR,St | te,St | tL,St | tLR,St | tS,St | tSR,St | te,St | tL,St | tLR,St | tS,St | tSR,St | te,St | |
| Mean (°C) | 14.31 | 13.06 | 13.97 | 13.62 | 17.05 | 15.48 | 14.39 | 15.25 | 14.88 | 17.57 | 16.35 | 15.30 | 15.60 | 15.68 | 19.32 |
| Standard deviation S (K) | 3.49 | 3.03 | 3.38 | 3.38 | 4.31 | 2.50 | 2.41 | 2.46 | 2.49 | 3.46 | 2.12 | 2.12 | 2.18 | 2.10 | 4.73 |
| Minimum xmin (°C) | 6.04 | 6.54 | 5.43 | 6.20 | 7.68 | 10.35 | 9.67 | 9.74 | 9.90 | 9.98 | 12.13 | 10.98 | 10.88 | 11.40 | 11.20 |
| Maximum xmax (°C) | 18.73 | 16.64 | 18.06 | 17.77 | 29.04 | 18.48 | 17.20 | 18.19 | 17.90 | 25.58 | 19.27 | 17.93 | 18.60 | 18.70 | 29.38 |
| Median (°C) | 15.14 | 13.77 | 15.02 | 14.46 | 17.20 | 16.24 | 14.87 | 16.05 | 15.53 | 17.04 | 17.02 | 15.91 | 16.36 | 16.37 | 18.48 |
| Lower quartile Q1 (°C) | 11.66 | 10.72 | 11.29 | 10.92 | 13.95 | 13.41 | 12.29 | 13.30 | 12.65 | 15.18 | 14.91 | 13.83 | 14.22 | 14.38 | 15.55 |
| Upper quartile Q2 (°C) | 17.44 | 16.00 | 16.76 | 16.77 | 20.13 | 17.50 | 16.55 | 17.22 | 16.97 | 20.04 | 18.05 | 17.07 | 17.19 | 17.13 | 22.77 |
| Variance S2 (K2) | 12.16 | 9.19 | 11.41 | 11.41 | 18.54 | 6.23 | 5.82 | 6.07 | 6.21 | 11.97 | 4.51 | 4.49 | 4.76 | 4.40 | 22.39 |
| Coefficient of variation S% (%) | 24.36 | 23.20 | 24.18 | 24.80 | 25.26 | 16.13 | 16.76 | 16.16 | 16.74 | 19.69 | 12.99 | 13.85 | 13.98 | 13.37 | 24.49 |
| Range R (K) | 12.69 | 10.11 | 12.63 | 11.57 | 21.36 | 8.13 | 7.53 | 8.45 | 8.00 | 15.60 | 7.14 | 6.95 | 7.72 | 7.30 | 18.18 |
| Interquartile range Q2–Q1 (K) | 5.78 | 5.27 | 5.47 | 5.85 | 6.18 | 4.09 | 4.26 | 3.92 | 4.32 | 4.86 | 3.14 | 3.24 | 2.97 | 2.75 | 7.22 |
Table 3.
Mode and temperature frequencies tL,O, tS,O of the ground mass in the proximities of HGHEs in the heating period of 2012–2015.
Table 3.
Mode and temperature frequencies tL,O, tS,O of the ground mass in the proximities of HGHEs in the heating period of 2012–2015.
| Heating Period | Mode (°C) | Relative Frequency wi (%) | |
|---|---|---|---|
| 2012–2013 | tL,O | [2.10; 4.00] | 41.3 |
| tS,O | [0.10; 2.00] | 37.6 | |
| 2013–2014 | tL,O | [4.10; 6.00] | 27.4 |
| tS,O | [2.10; 4.00] | 24.3 | |
| 2014–2015 | tL,O | [4.10; 6.00] | 23.2 |
| tS,O | [4.10; 6.00] | 32.8 | |
© 2017 by the authors. Licensee MDPI, Basel, Switzerland. This article is an open access article distributed under the terms and conditions of the Creative Commons Attribution (CC BY) license (http://creativecommons.org/licenses/by/4.0/).
Share and Cite
MDPI and ACS Style
Neuberger, P.; Adamovský, R. Analysis of the Potential of Low-Temperature Heat Pump Energy Sources. Energies 2017, 10, 1922. https://doi.org/10.3390/en10111922
AMA Style
Neuberger P, Adamovský R. Analysis of the Potential of Low-Temperature Heat Pump Energy Sources. Energies. 2017; 10(11):1922. https://doi.org/10.3390/en10111922
Chicago/Turabian StyleNeuberger, Pavel, and Radomír Adamovský. 2017. "Analysis of the Potential of Low-Temperature Heat Pump Energy Sources" Energies 10, no. 11: 1922. https://doi.org/10.3390/en10111922
Note that from the first issue of 2016, this journal uses article numbers instead of page numbers. See further details here.