1. Introduction
Over the last two decades, increasing numbers of non-synchronous wind and solar photovoltaic (PV) stations have been connected to many power systems, following a trend that is likely to continue given the international commitment to fighting climate change. These power stations are very different in nature from the conventional synchronous generation that has dominated the development of power systems over the course of the 20th century. The difficulties of integrating these technologies have led to preventive curtailment of renewable generation in several systems over the last decade [
1,
2]. One of the key factors is that non-synchronous generation is connected to the electrical grid through electronic converters. This affects the inertia of the system and the electromechanical oscillations between synchronous generators after a severe fault [
3]. As a result, transient stability is one of the reasons why transmission system operators limit the amount of non-synchronous renewable generation [
4,
5,
6].
The island of Tenerife belongs to the Spanish Canary Islands archipelago, located west of Morocco on the north-west African coast. Non-synchronous generation is expected to grow significantly on the island over the next decade due to the high potential of the island for wind [
7] and PV [
8] generation, and a strong institutional support [
9]. The integration of this new generation within the existing system poses challenges similar to those in other islands with high penetration of renewable energy sources [
10,
11]. Among these challenges is the need to ensure transient stability and maintain cost-effective operation, limiting non-dispatchable generation if necessary.
Optimal power flow (OPF) methods that include transient stability constraints, often referred to as transient stability-constrained optimal power flow (TSCOPF) methods, have emerged since the late 1990s to address this problem [
12]. Given the size and complexity of TSCOPF optimization models, the necessary trade-off between model detail and computational time has produced a number of different approaches [
13]. Numerical methods that incorporate the discretized differential equations defining the dynamics of the power system into the formulation of the OPF [
14,
15] have several advantages, such as being able to robustly handle unstable systems with different constraints [
13]. However, they produce large models with a number of variables and equality constraints that is impractical for large or medium-size systems. To reduce computational time, methods based on simplified models such as SIME [
16,
17] provide rough estimations and have limitations dealing with complex trajectories, but are generally fast and robust. Other authors reach a compromise between accuracy and computational time by decoupling optimisation algorithms and simulation tools [
18], or by using detailed models in combination with meta-heuristic searching algorithms [
19,
20,
21].
The relatively small size of the Tenerife power system makes it suitable for an optimization model that directly incorporates the discretized differential equations . This work proposes a TSCOPF model based on a simultaneous discretization approach that includes non-synchronous generation, and calculates the optimal curtailment of non-dispatchable plants based on static and dynamic constraints. The dynamic constraints ensure that the power system remains transiently stable after a series of pre-determined faults. The main contributions are the inclusion of non-synchronous generators with fault ride-through capability and voltage support in the optimization model; the treatment of non-dispatchable generation in the pre-fault stage as a variable to optimize the curtailment of renewable energy; and the application of the proposed model to explore several alternatives to reduce the generation cost on the island of Tenerife.
2. Optimization Model
The optimization model consists of a cost function that represents the generation cost, a set of equality constraints that model the power system during the pre-fault, fault and post-fault stages, and a series of inequality constraints that represent the static and dynamic limits that ensure a secure operation. If more than one contingency is considered, then there is an independent set of equations for the fault and post-fault stages of each contingency. The pre-fault stage includes also the inequality constraints common in standard OPF models [
22], such as limits on bus voltages, branch currents and production of power plants.
The cost function is a quadratic function that includes all the synchronous generation in the pre-fault stage, although other options such as combinations of linear or exponential functions could also be used. Power produced by non-synchronous generators is not included in the cost function because it is supposed to come from non-dispatchable, renewable sources.
Table 1 summarizes the constraints in the optimization model. Those constraints that are not common to other OPF and TSCOPF [
14] models are detailed in the following sections.
2.1. Power Flow Equations
The power system during the pre-fault, fault and post-fault stages is modelled by the following equations representing the power balance at bus
i and at time step
k:
where
,
,
and
are the active and reactive power produced by synchronous and non-synchronous generators, respectively;
is the complex voltage;
is the
term of the bus admittance matrix
; and
N is the number of buses. When
Equations (
1) and (2) represent the pre-fault stage and the pre-fault admittance matrix is used. When
, depending on the time step,
is the admittance matrix that represents the grid under fault or post-fault conditions. Unlike other TSCOPF models that use a reduced admittance matrix at the fault and post-fault stages [
23], here the complete bus admittance matrix is used. This makes it possible to calculate bus voltages at all time steps and therefore to represent non-linear loads and non-synchronous generation.
Loads are represented by the standard ZIP model [
24], which uses a quadratic function of the voltage to model the load as a combination of constant impedance, constant current and constant power:
Very low voltages are handed by means of low-voltage correction factor
, which has a value of 1 at normal voltages and decreases quadratically towards zero when the magnitude of the voltage is lower than 0.2 p.u.:
The introduction of a low-voltage correction factor is a standard practice in transient stability simulations [
25] to achieve numerical stability during severe faults.
2.2. Synchronous Generator Model
Synchronous generators are represented by the well known, fourth order transient generator model [
24]. The state variables of the model are the flux linkages in the d and q axis of a reference frame linked to the rotor, the rotor speed and the rotor angle.
The differential equations that define the generator model are discretized over the fault and post-fault stages using the trapezoidal rule, and incorporated to the optimization model as equality constraints.
and
in Equations (
1) and (2) are calculated as a function of the internal voltage of the synchronous generator and the voltage at the connection bus. The equations that calculate the initial values of the state variables and the entries of the model (field voltage and input torque) are incorporated as part of the pre-fault stage. A similar implementation of the synchronous generator model can be found in [
26].
2.3. Non-Sync Power Plant Model
This work includes non-synchronous generators in the optimization model to account for renewable energy connected to the grid through electronic converters. This category includes PV stations and variable speed windmills, either with doubly-fed induction generators or with synchronous generators connected to the grid via back-to-back electronic converters [
27]. Fixed-speed windmills, that represent a small and declining proportion of new wind turbines, utilize induction generators and are not included in this category.
It is a standard practice to neglect the dynamic of electronic converters in transient stability studies because they are very fast in comparison with the time scale of electromechanical oscillations. As a result, converters are modelled as current sources instead of voltage sources [
28]. This is the approach followed in the proposed model, where non-synchronous generators are defined by their production of active and reactive power.
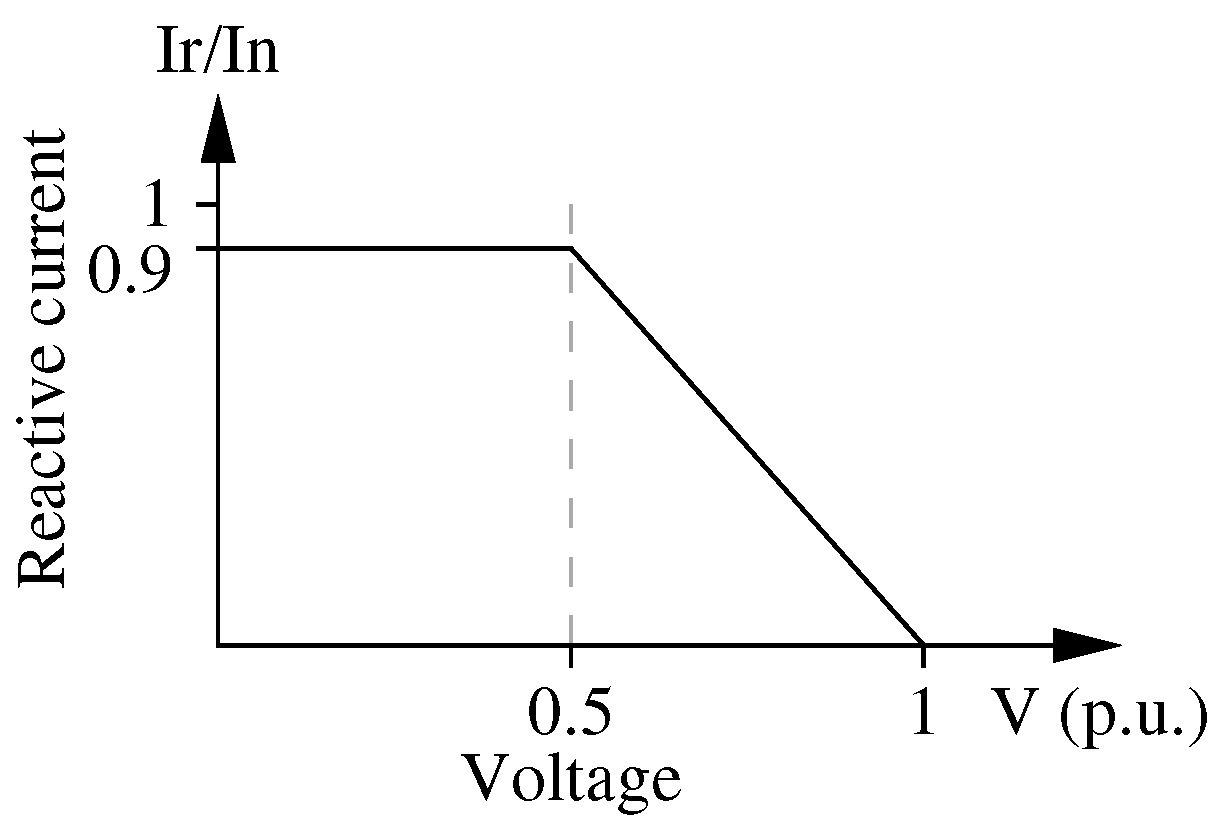
Fault ride-through requirements of non-synchronous power stations are critical to the stability of the system, and are therefore taken into account. Grid codes regarding regulation during faults refer mainly to two points: conditions under which the generating unit can be disconnected, and provision of reactive current during voltage dips [
29]. Here requirements based on the Spanish Grid Code [
30] are applied: non-synchronous plants disconnect if the voltage at the connection point falls below 20% of the nominal value, and reactive current during voltage dips increase linearly with the voltage decrease until it reaches 90% of the nominal current when voltage is 0.5 p.u., as shown in
Figure 1.
Power provided by non-synchronous plants depends primarily on the active and reactive power references
and
, and is modelled as:
Reference
depends on the available renewable energy resource, such as wind or solar radiation. Reactive power
depends on the control strategy under normal conditions, which can be reactive power control, power factor control, or voltage control. Binary factor
in Equations (
6) and (7) is equal to 1 in the pre-fault stage. During the fault and post-fault stages,
is 1 if the power plant remains connected, and 0 if it is disconnected. Factor
in Equation (7) represents the reactive current injected into the grid to support the voltage, and is calculated according to
Figure 1 as
Active power curtailment applied to each non-synchronous power plant is represented by term , which can have any value between 0 and 1.
2.4. Dynamic Constraints
Two different dynamic constraints are applied to ensure the stability of the system. Firstly, a common Center Of Inertia (COI) angle
is calculated, based on the synchronous generator rotor angles
and inertia constants
, as
and the deviation of the rotor angles with respect to the COI angle is limited in all synchronous generators:
The dynamic constraint expressed by Equation (
10) is a common practice in transient-stability constrained optimal power flows [
15].
Secondly, a constraint is imposed on the frequency after the fault because frequency stability is an important issue on the island of Tenerife as a result of the small inertia. A common COI speed is calculated, based on the synchronous generator rotor speeds
and inertia constants, as
and the deviation of the COI speed from the reference value is limited.
2.5. Implementation of the Model
The model is programmed in the algebraic modelling language GAMS and defined as a nonlinear programming model with discontinuities (DNLP). It is solved using IPOPT, an open source library for large nonlinear models based on a primal-dual interior point method [
31]. To facilitate the process of writing and modifying the model, a Python program is developed that reads all relevant data from a standard PSSE file and writes the GAMS model. This makes it possible to read the input data directly from the PSSE files routinely maintained by the Transmission System Operator.
3. Application to the IEEE 39 Bus Test System
The proposed optimization model is applied to a modified version of the IEEE 39 Bus Test System [
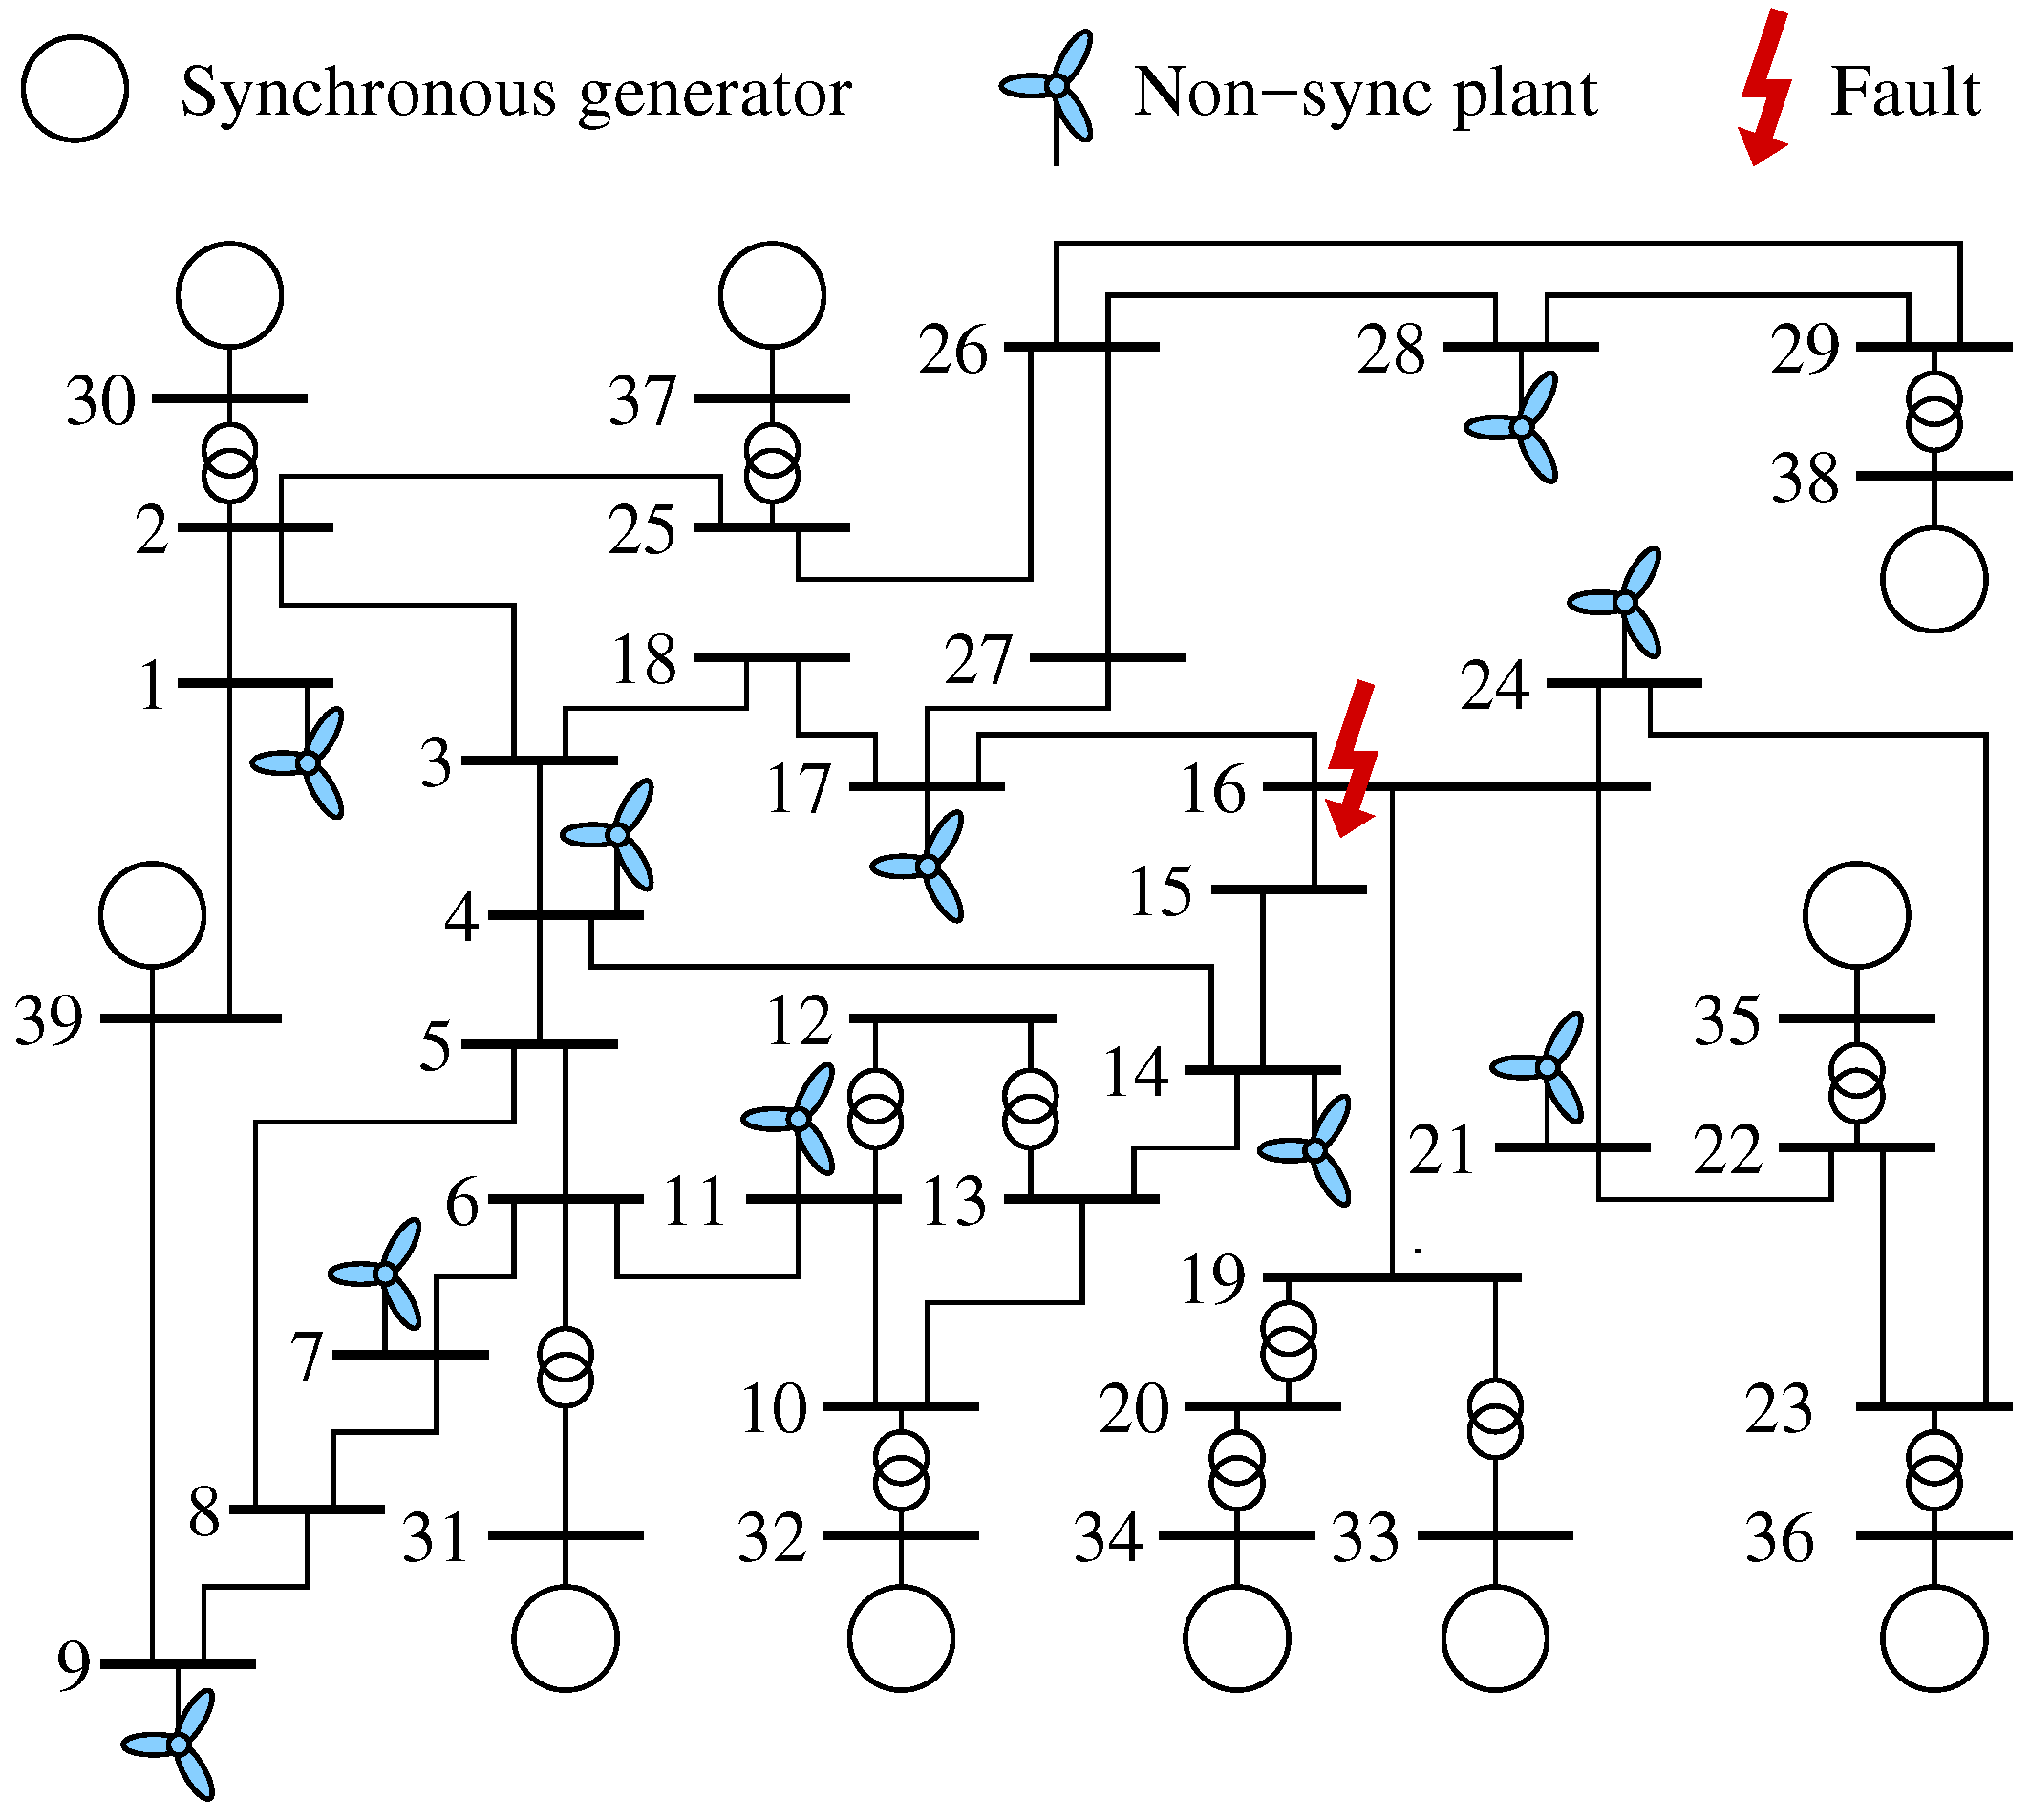
32] that includes 10 non-synchronous power plants. The aims of this case are to show an application of the model and to evaluate its performance.
Figure 2 shows all non-synchronous generators and the location of the fault, which is a direct 3-phase short circuit at bus 16 cleared after 300 ms by the disconnection of line 15–16. A GAMS model corresponding to this case is provided as a separate file in [
33].
The total load in the system is 6149.5 MW. The power plant at bus 39 represents a neighbouring system that exports 1000 MW. Generators at buses 30 and 33 are base load power plants that produce 800 MW each; the rest of the synchronous generators are totally dispatchable. Non-synchronous power plants have a nominal power of 600 MW, and the availability of the renewable source is such that they can produce a maximum of 450 MW each (75% of the nominal power). This implies that some non-synchronous generation has to be curtailed, since the load (6145.9 MW) is smaller than the base load generation (1600 MW) plus the imports (1000 MW) plus the available non-synchronous, renewable generation ( 4500 MW).
The first column in
Table 2 shows the results of the conventional OPF model obtained when the dynamic constraints are removed. The second column shows the results of the proposed model when an homogeneous curtailment is applied, which means that all non-synchronous power plants are curtailed in the same proportion. This is achieved by using a unique
variable in Equation (
6). The third column shows the solution of the model when a selective curtailment is applied, this is when the curtailment of each non-synchronous plant is calculated independently.
It can be seen that the application of the dynamic constraints increases both non-synchronous energy curtailment and generation cost. The additional cost can be seen as the price to pay to ensure that the system is stable after the fault. The increase in cost is significantly lower in the case of selective curtailment compared to homogeneous curtailment (9.0% compared to 35.8%), because different non-synchronous plants have different effects on transient stability depending on their location in the system.
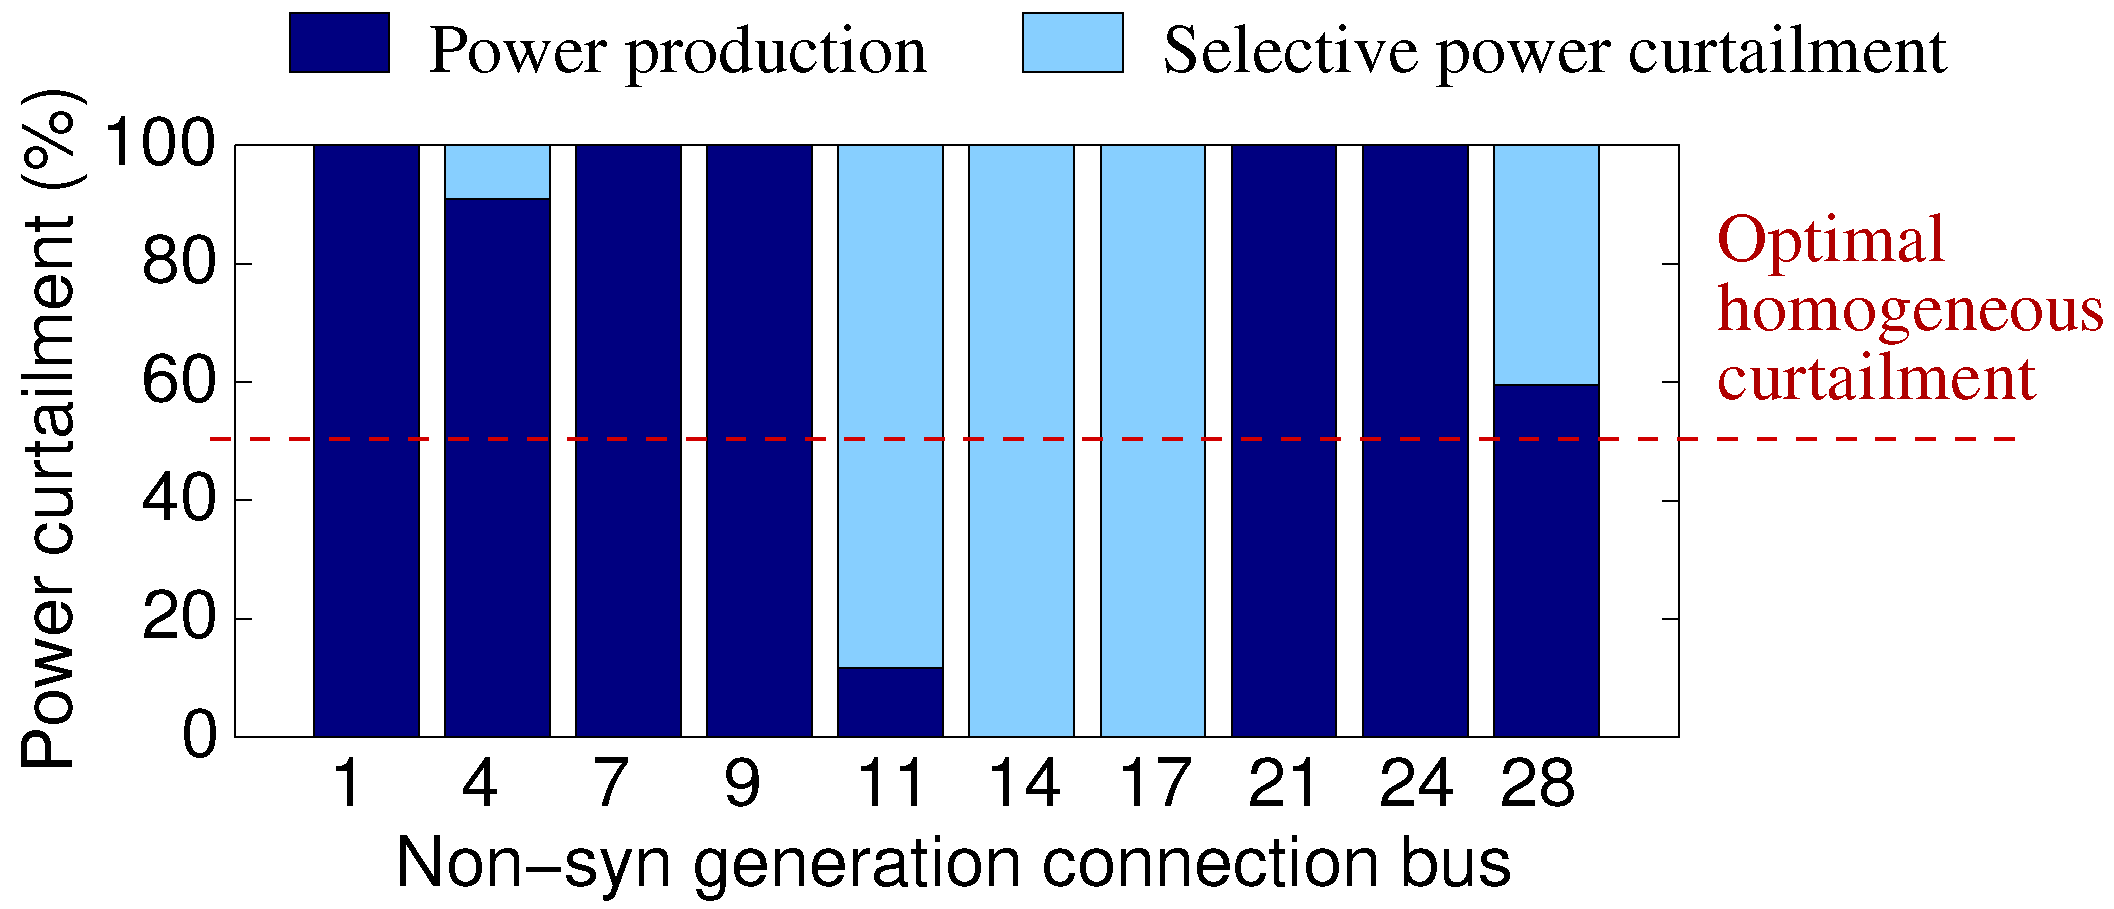
Figure 3 shows the renewable energy curtailed at each non-synchronous power station when a selective and a homogeneous curtailment is applied.
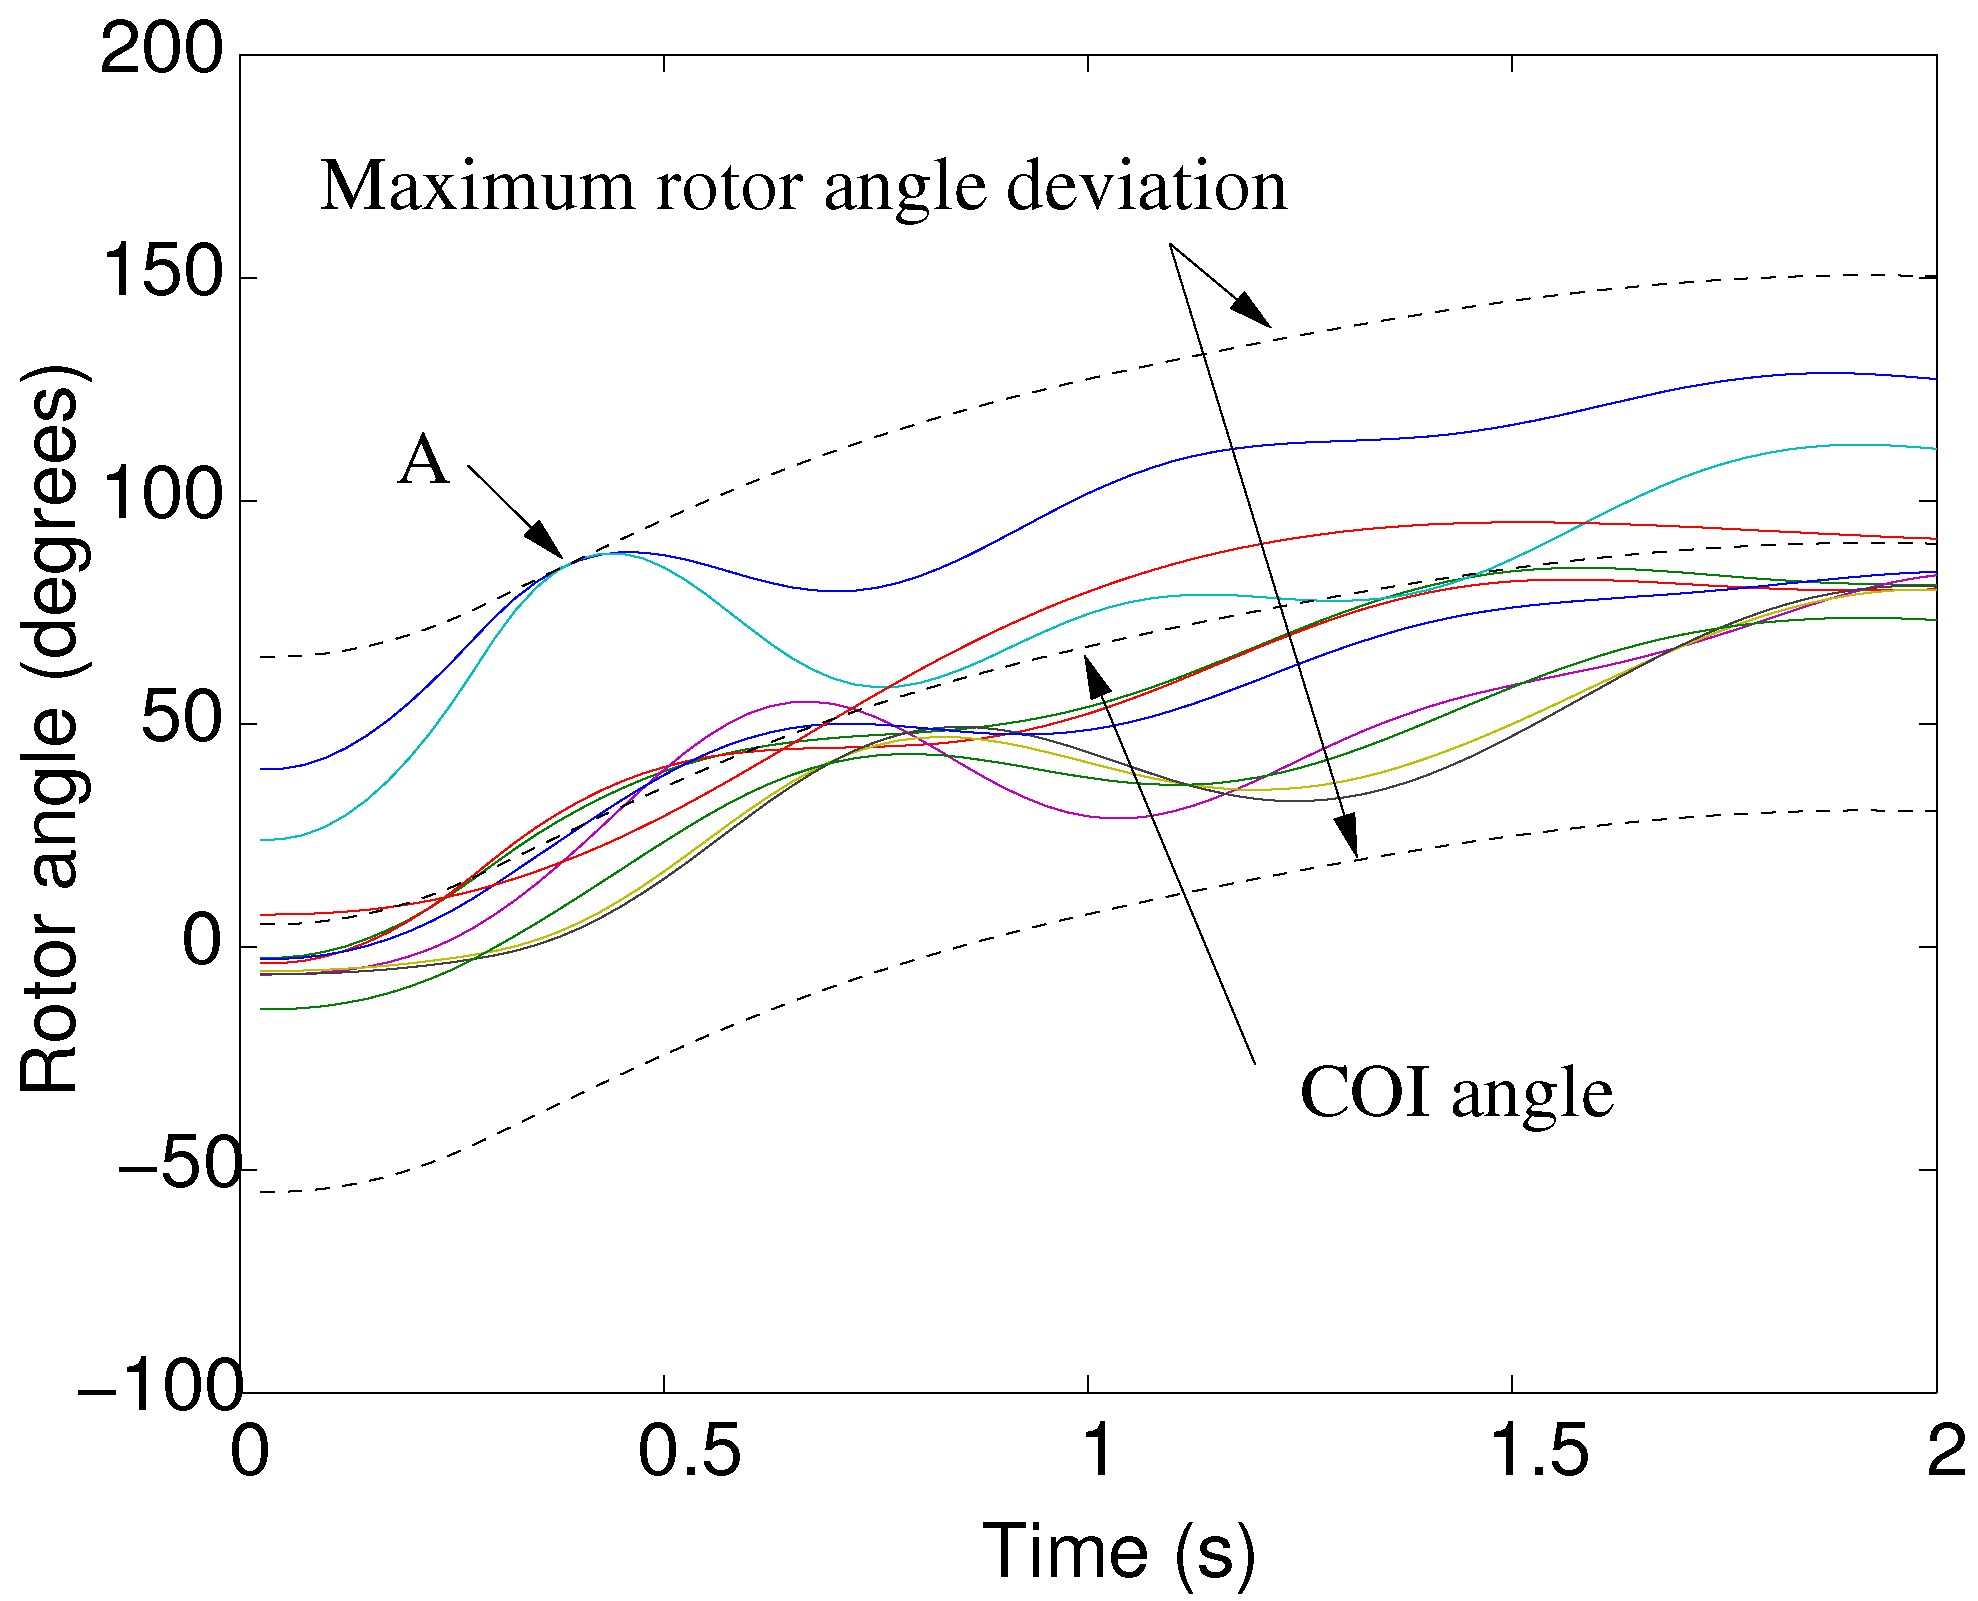
Figure 4 shows the rotor angles as provided by the solution of the optimization model in the case of the selective curtailment. It can be seen that all rotor angles remain within the limits, with the rotor angle of two synchronous generators reaching the limit at the point marked as A in
Figure 4.
Table 3 shows various parameters related to the performance of the solver. The memory and CPU time usage have been obtained on a computer with an AMD 1.35 GHz processor running a Linux operating system.
4. Application to the Tenerife Power System
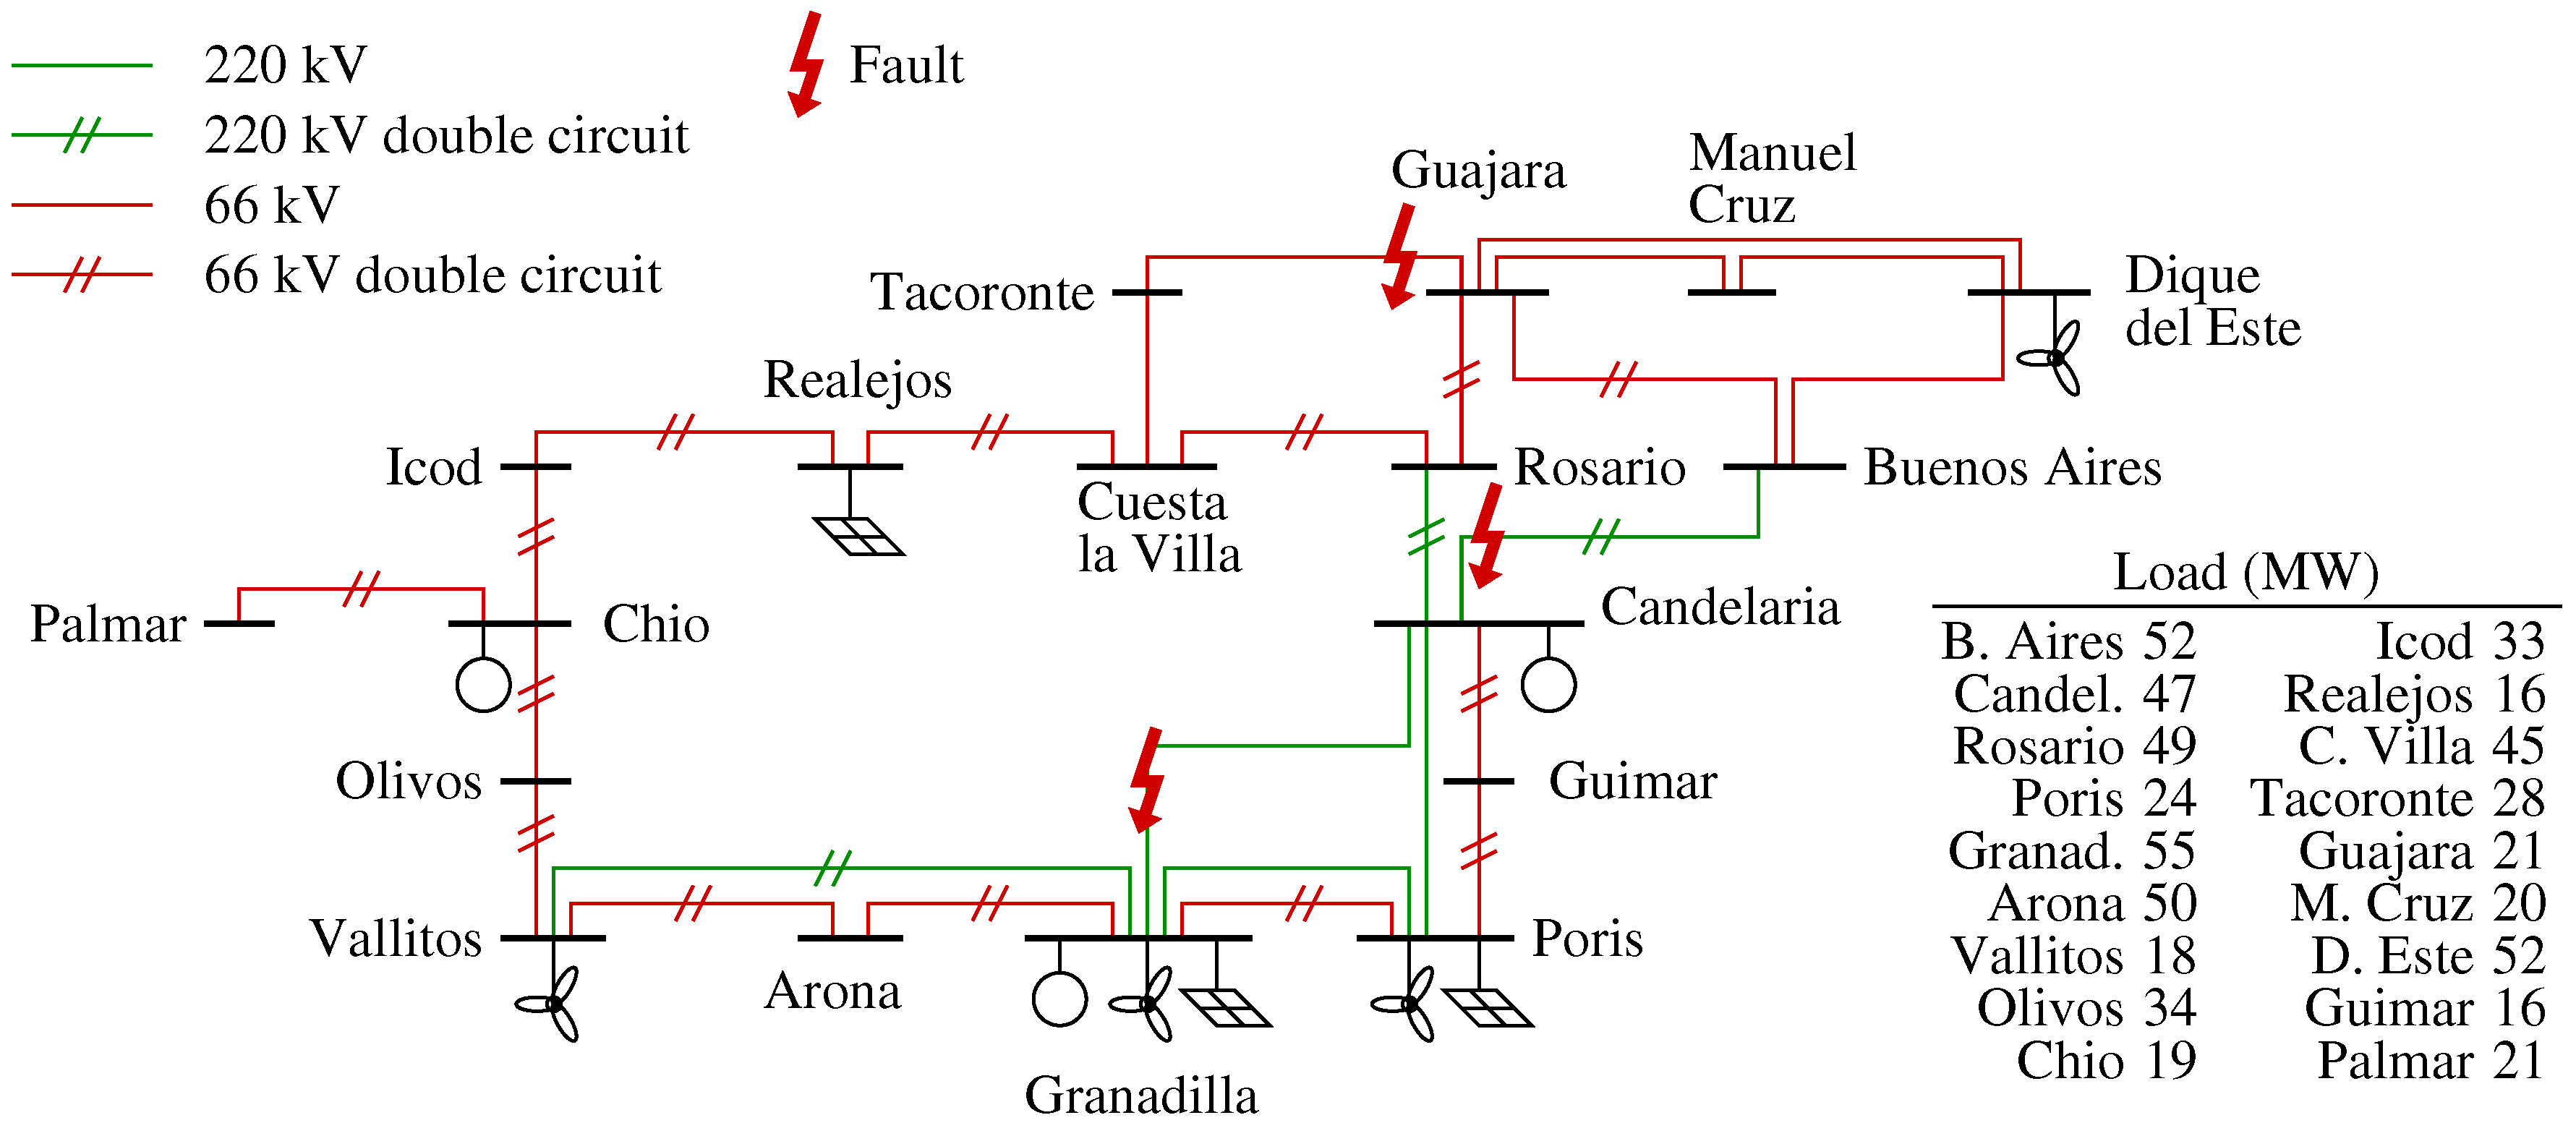
Figure 5 represents a model of the Tenerife power system including several wind and PV power stations that account for renewable generation expected to be installed in the near future. The transmission network includes a 220 kV grid that covers the most populated areas and a 66 kV ring around the island. Most lines are double circuits, so the loss of one circuit does not necessarily disconnects the substations at both ends of the line.
The peak load of the system is 580 MW and the off-peak load is 360 MW. Most generation is concentrated on the south-east coast of the island, around the substations of Granadilla and Candelaria.
Table 4 shows all power stations in the system. Coal stations Candelaria, with 180 MW, and Granadilla I, with 178 MW, provide a minimum base load generation. Combined cycle power plant Granadilla II contains several groups that can provide up to 300 MW. A smaller 50 MW, coal-fired power plant is connected on the west coast, at Chio substation.
Non-synchronous generation corresponds to a number of wind farms and PV plans. Wind generation is concentrated on the south and east of the island, while solar generation is located on the south and at Realejos substation on the north. Part of this renewable generation is already in place, such as some wind farms and PV generation at Granadilla and Poris. The rest corresponds to power plants that are expected to be installed in a few years. The total renewable energy capacity is 500 MW, slightly lower than the peak load.
Three 3-phase short circuits have been identified as major contingencies and included in the analysis. The resulting multi-contingency optimization model contains short circuits at Candelaria in one of the Candelaria—Buenos Aires lines; at Granadilla in one of the Granadilla—Candelaria lines; and at Guajara in the Guajara—Tacoronte line. Each fault is cleared by the disconnection of the affected line after 150 ms.
4.1. Base Case
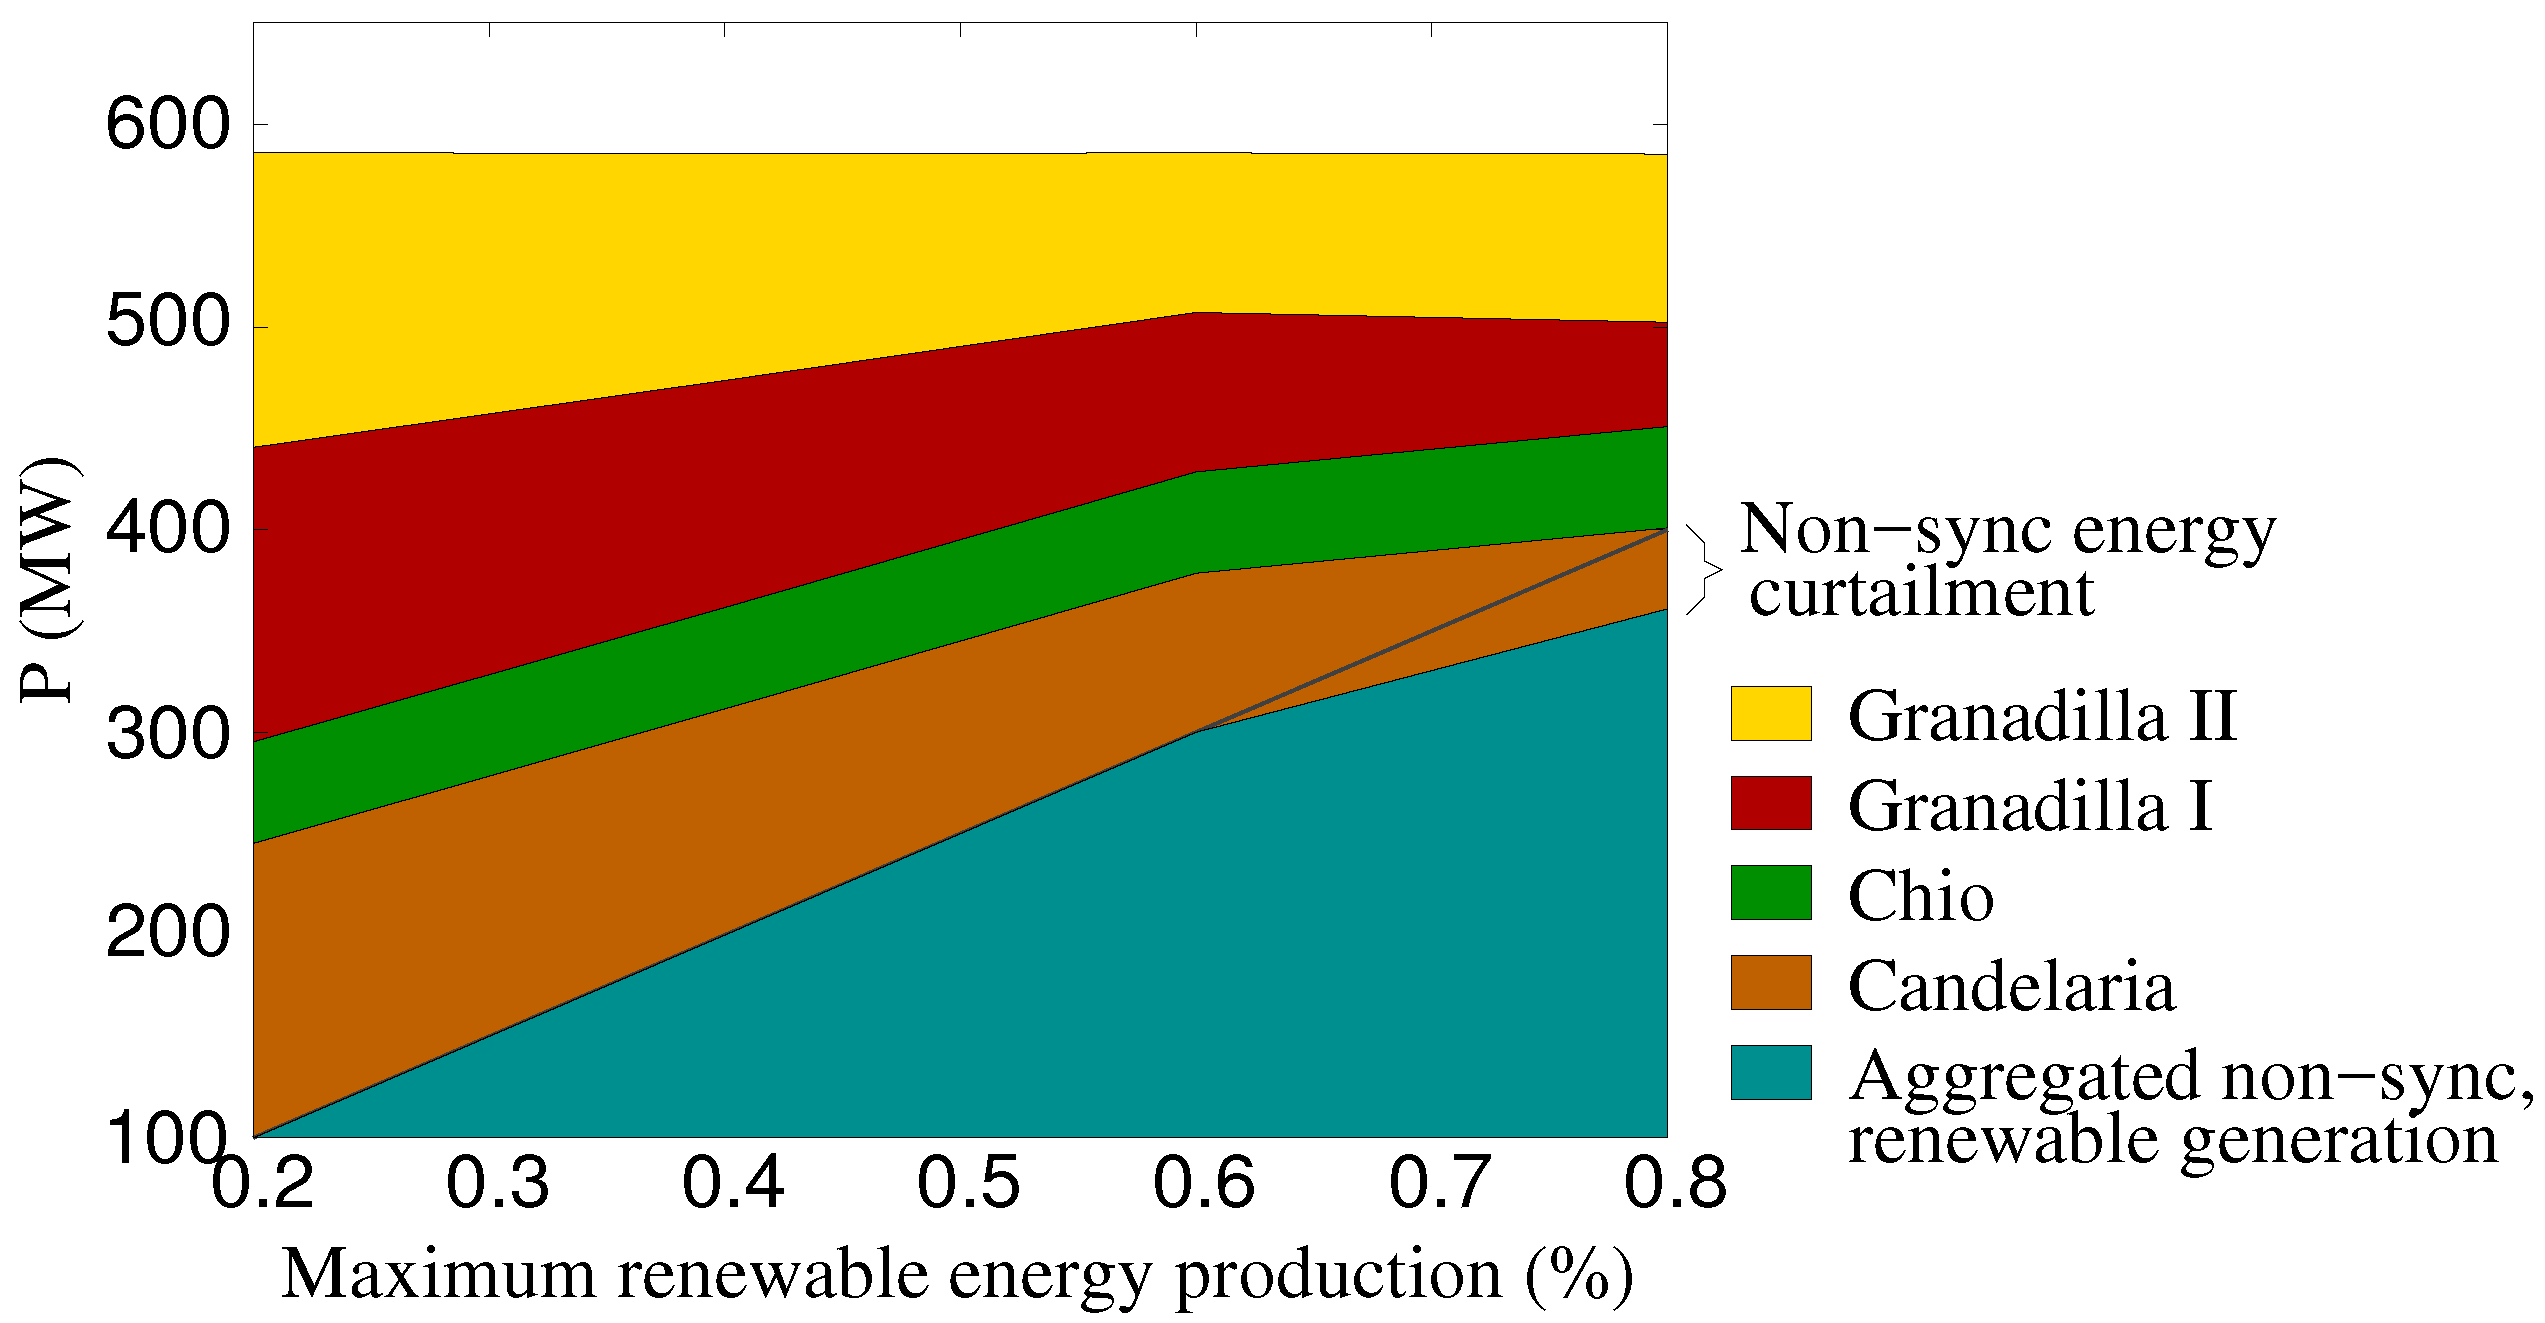
Figure 6 shows the power dispatch at peak hour provided by the solution of the optimization model against the availability of renewable energy. It can be seen that all non-synchronous generation can be dispatched up to a production of 60% of the installed capacity. From this point on, the dynamic constraints of the optimization model impose a certain curtailment on the production of renewable energy.
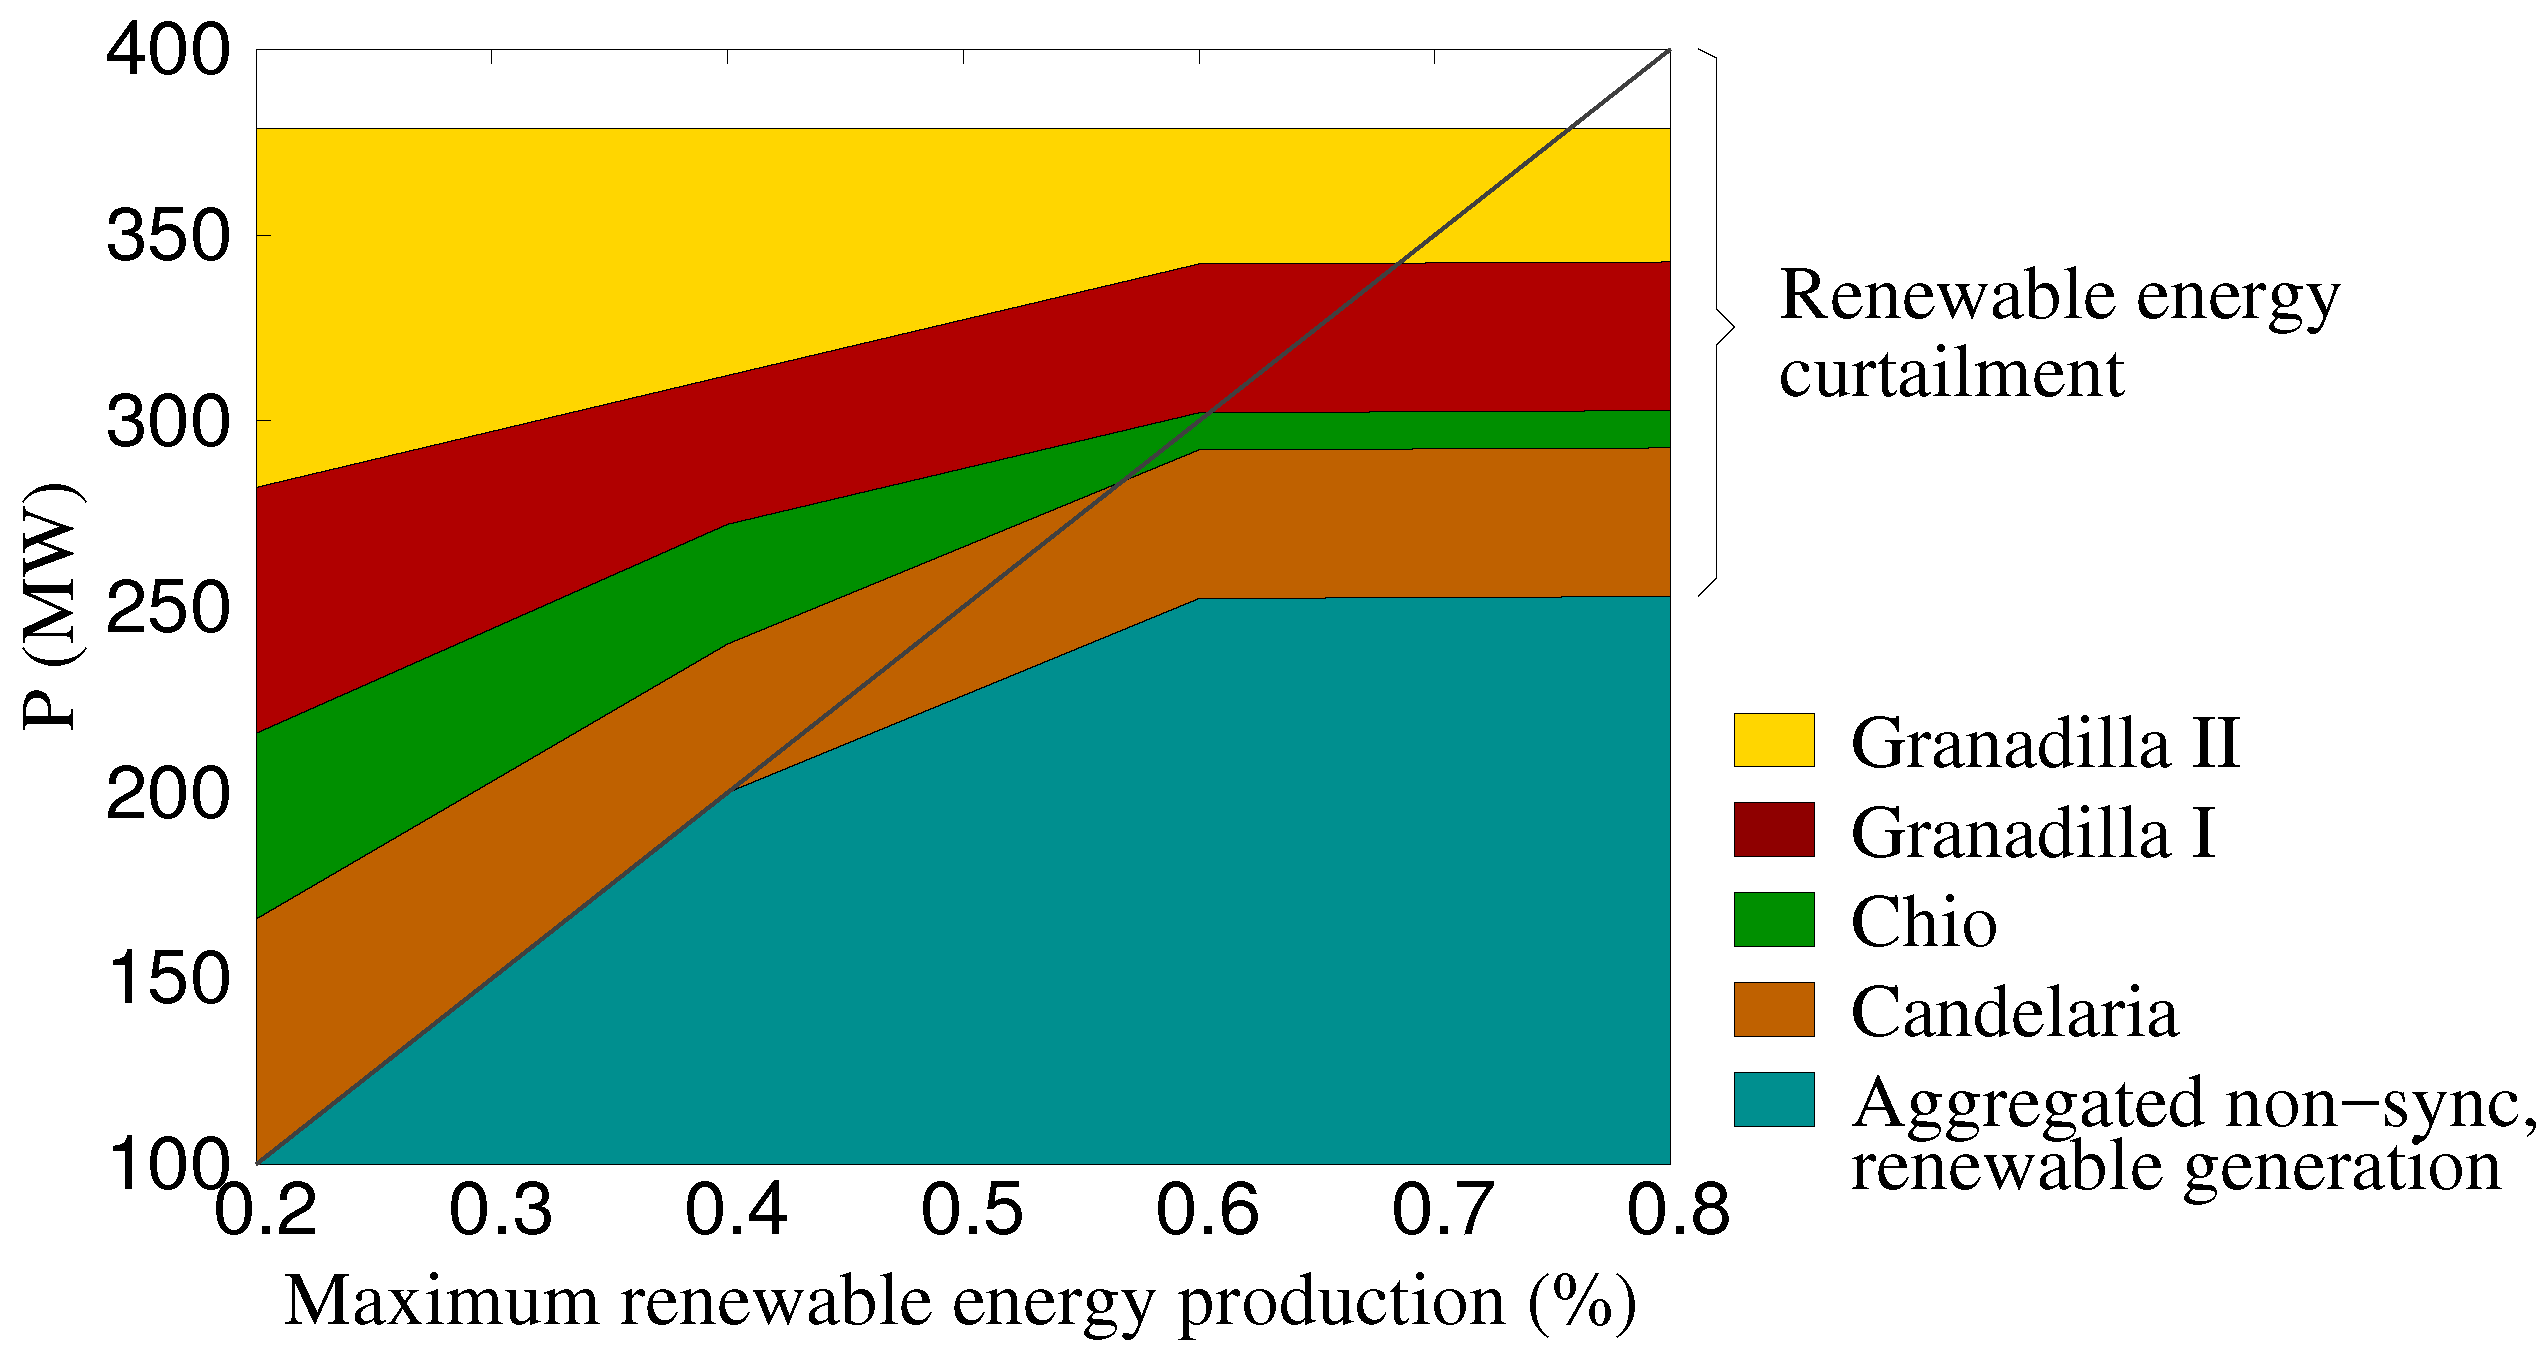
Figure 7 shows a similar graphic obtained at off-peak hour. The curtailment of non-synchronous generation is larger than in the peak load case and because the system cannot accommodate so much renewable energy production.
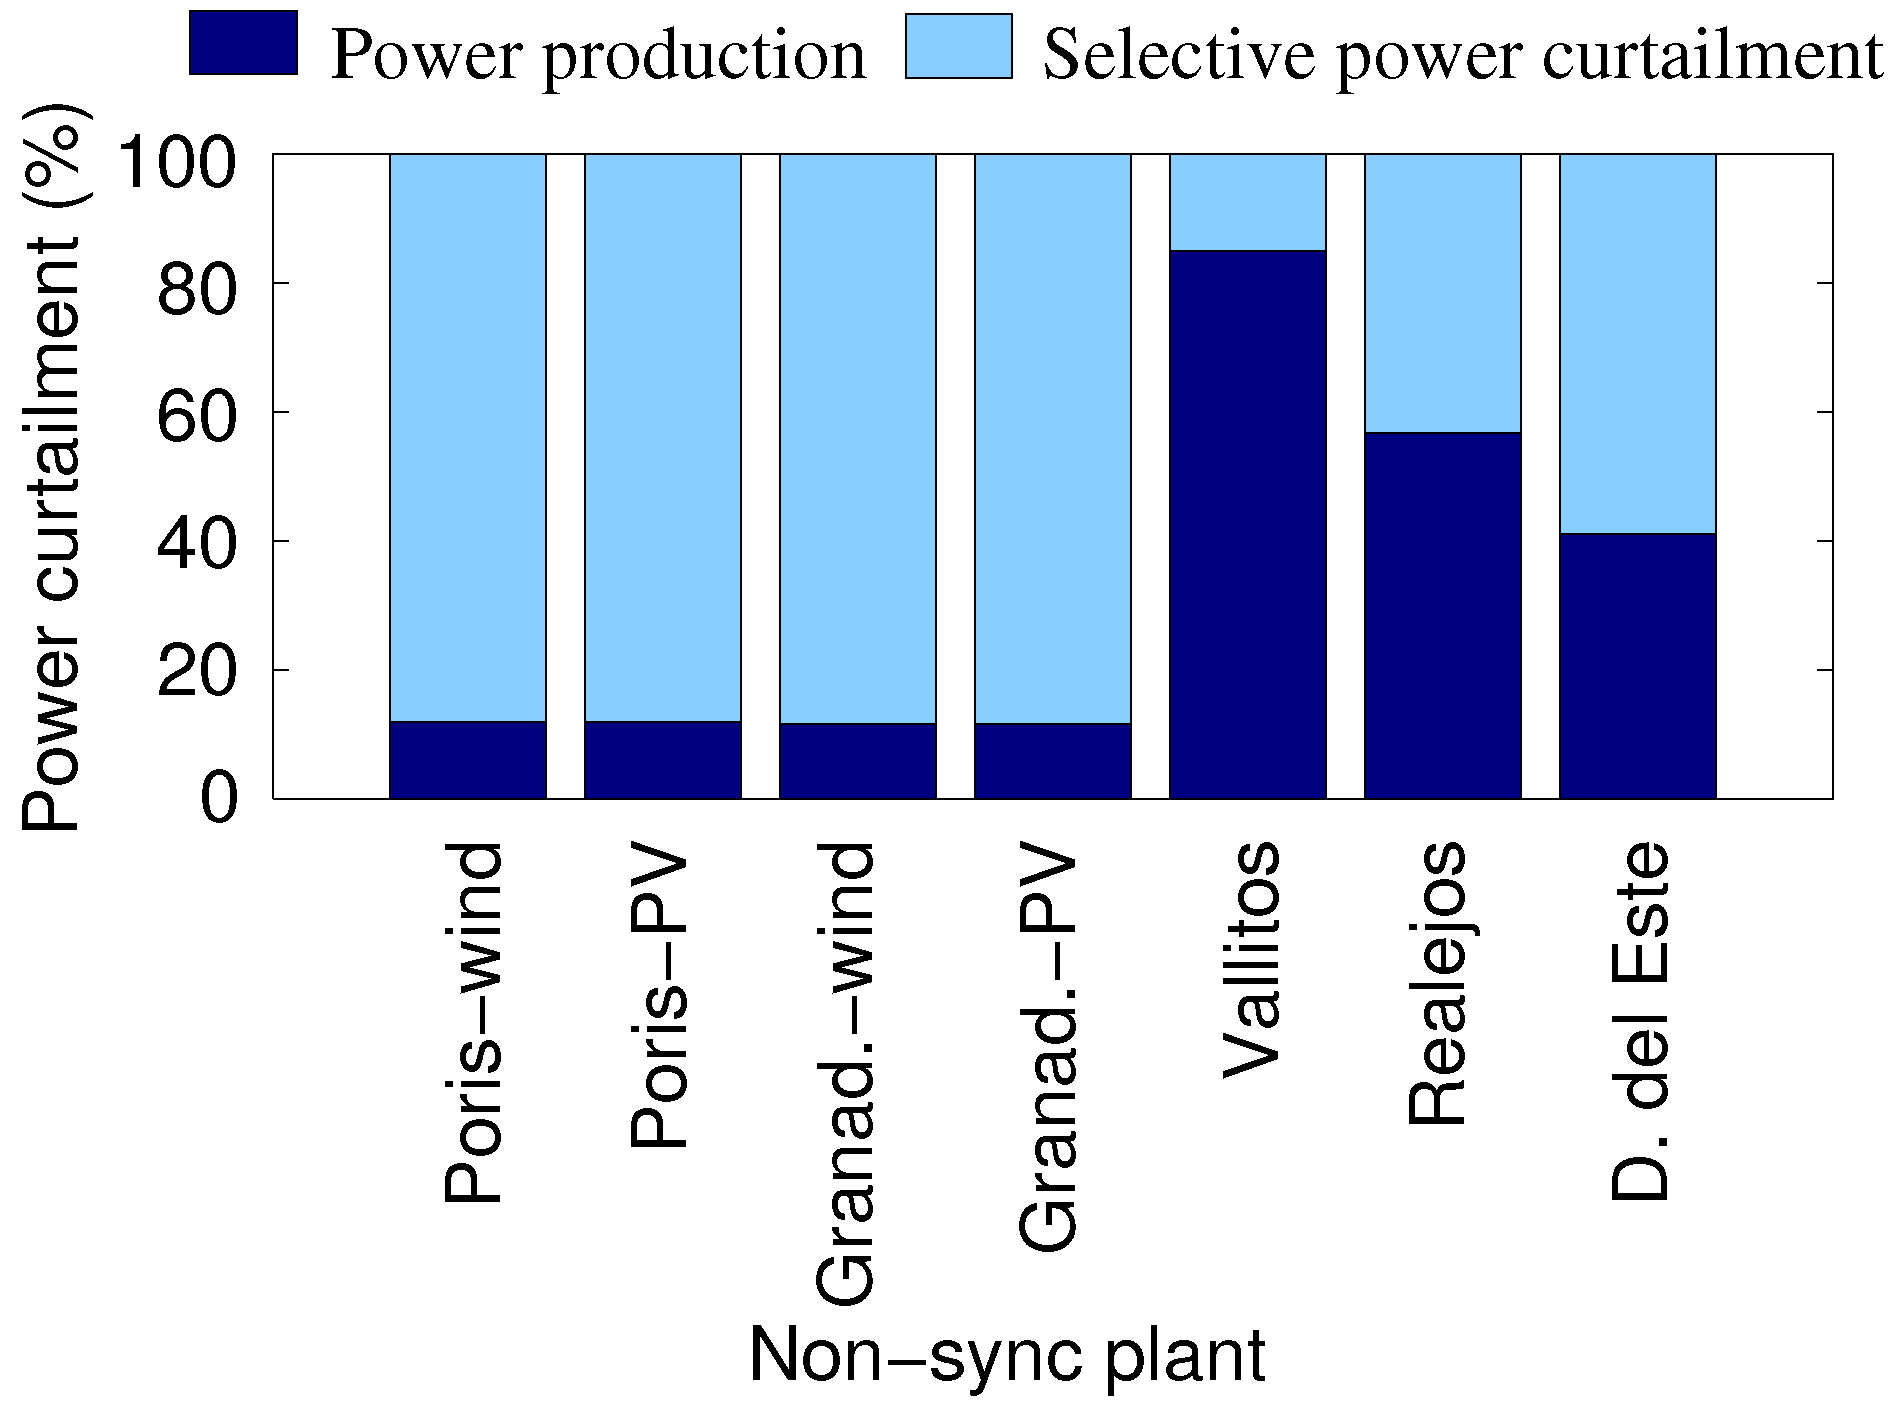
Figure 8 shows the optimal distribution of the curtailment between non-synchronous power plants when the load is lowest and the availability of renewable resources is highest.
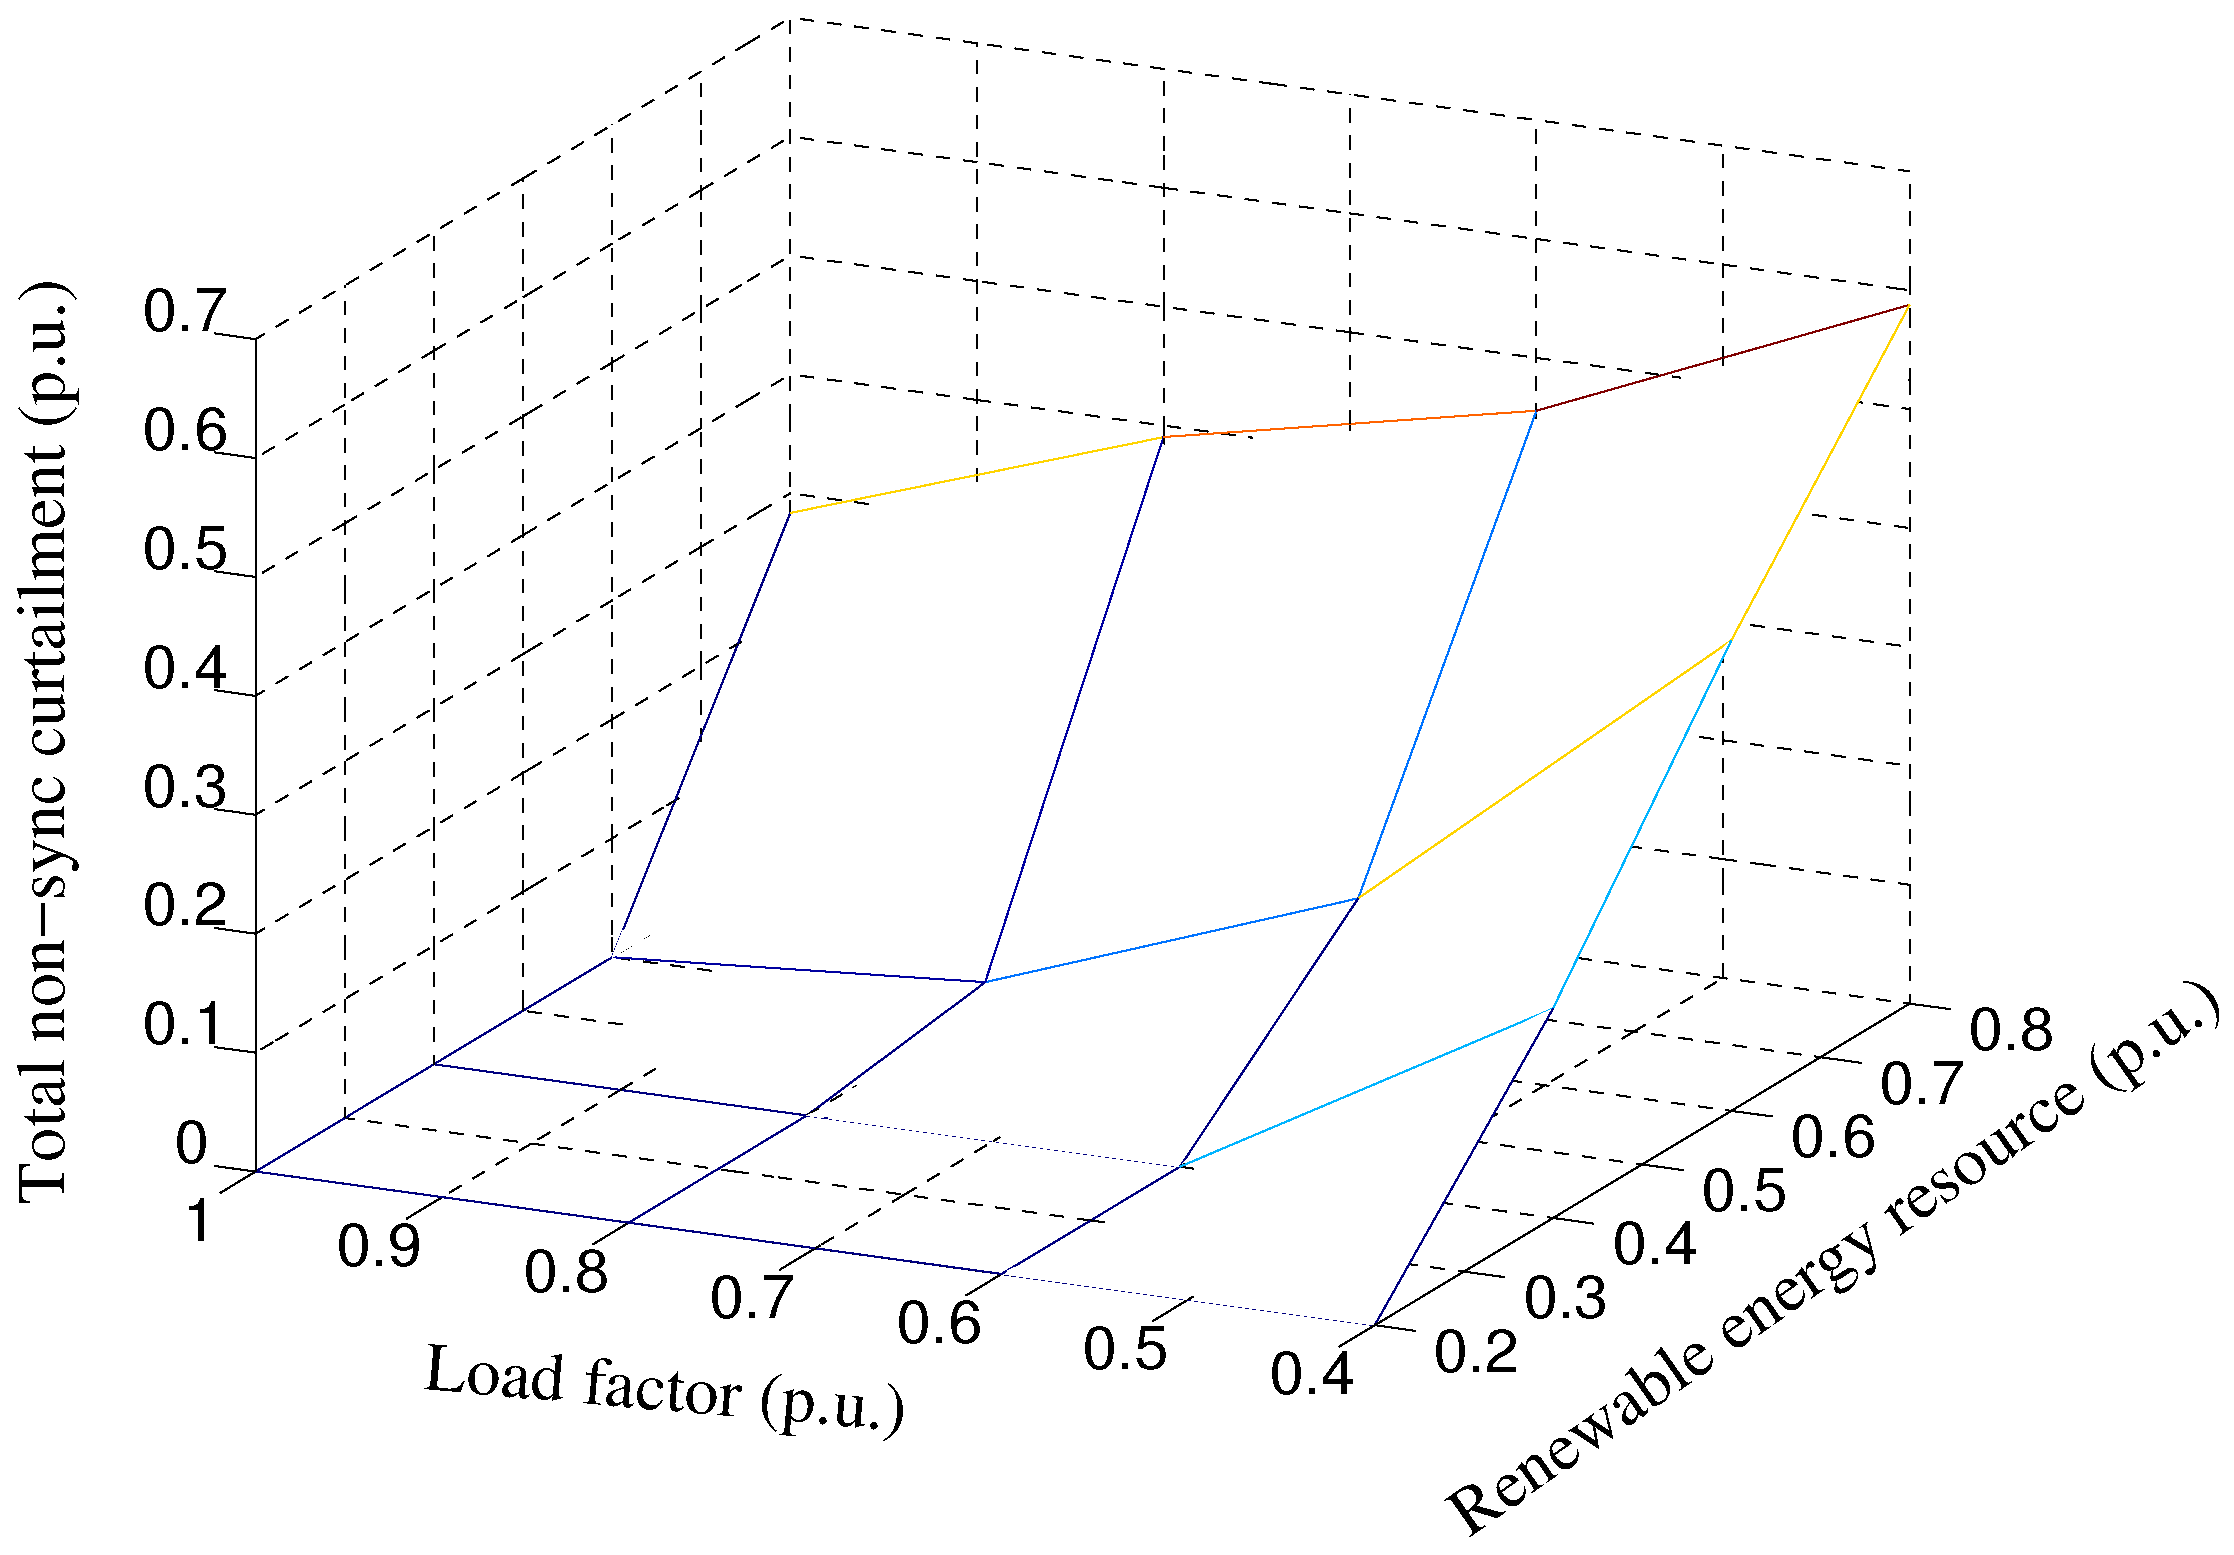
A similar study has been performed calculating the optimal solution for different load factors and availability of renewable energy. Studied load factors range from 0.4 to 1 p.u., where load factor 1 corresponds to peak load, and availability of renewable energy ranges from 0.2 to 0.8 p.u.
Figure 9 shows that the curtailment of non-synchronous generation is larger when the load is low and the availability of renewable energy is large.
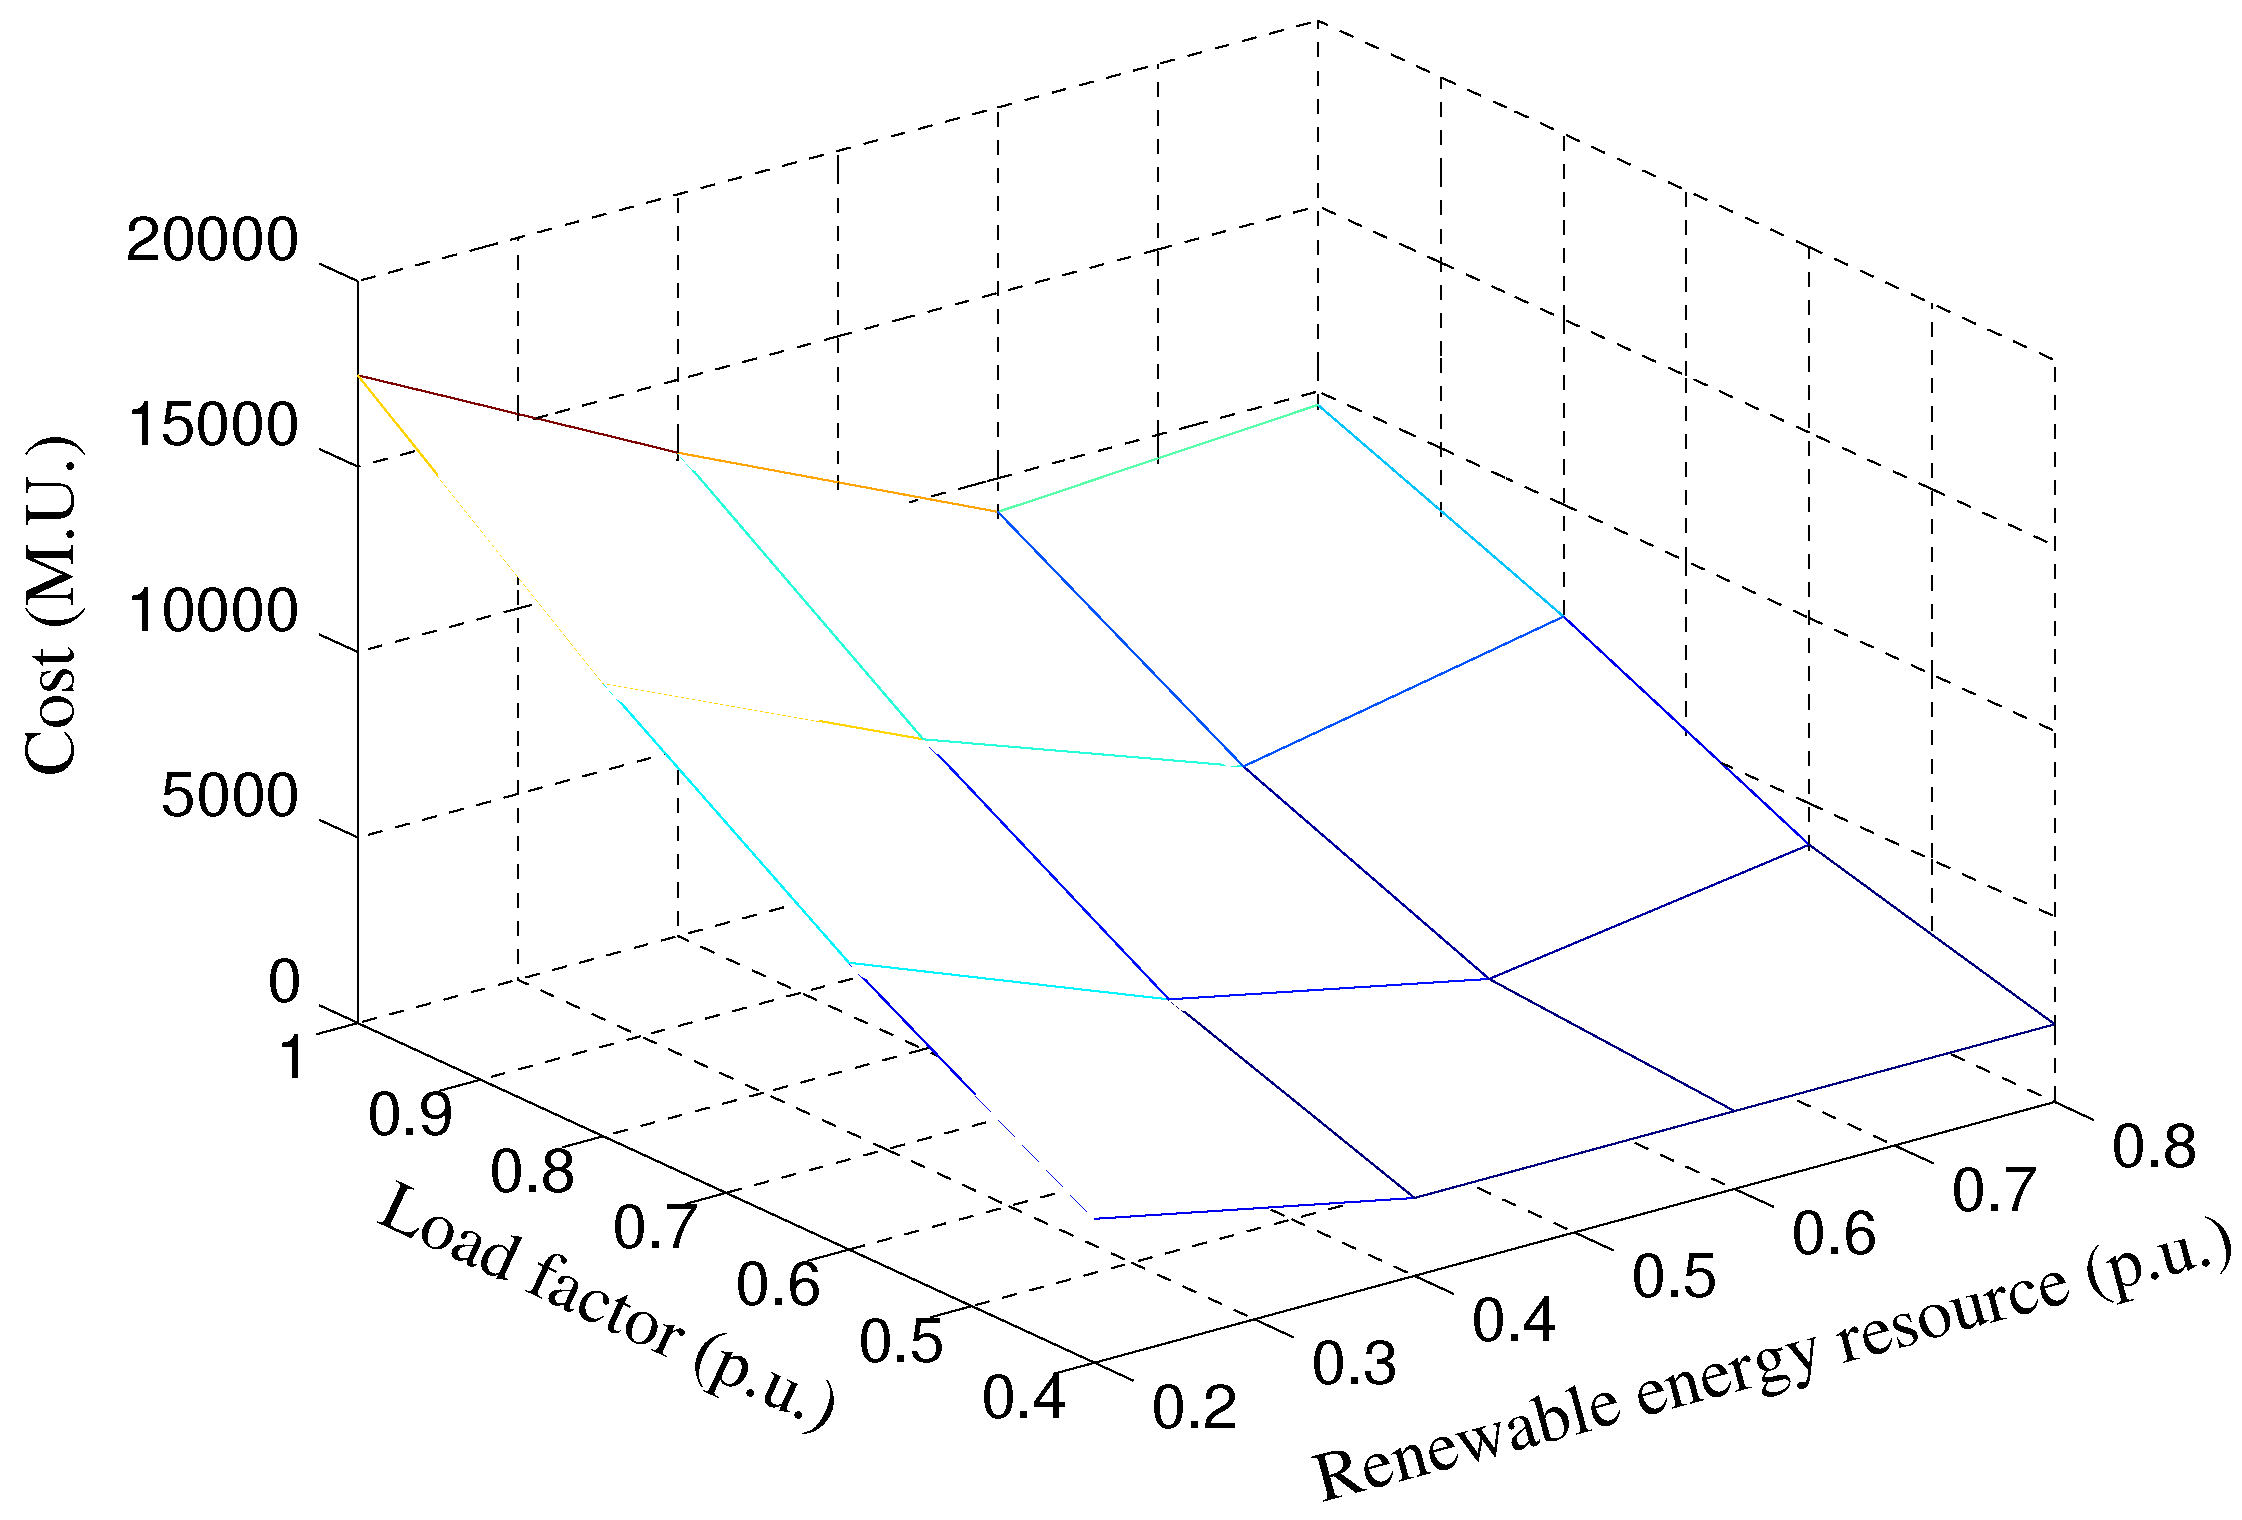
Figure 10 shows the total generation cost. It can be seen that the generation cost tends to decrease when the availability of renewable energy increases but this reduction ceases when non-synchronous generation cannot be fully dispatched, either when there is a high availability of renewable energy or when the load is small.
Figure 9 and
Figure 10 correlate in the sense that curtailment of non-synchronous generation depicted in
Figure 9 results in a halt in the decrease of generation cost in
Figure 10. To make the most of non-synchronous generation during periods of large availability of renewable sources, appropriate measures should be adopted in the system.
4.2. Actions to Reduce the Curtailment of Renewable Energy
Several actions have been evaluated to reduce the curtailment of non-synchronous generation, according to the results obtained in the previous section. The actions studied are:
Reduce the fault clearing time of protection systems from 150 ms to 120 ms.
Provide non-synchronous generators with full fault ride-through capability. This means that all non-synchronous generators remain connected after the fault, regardless of the depth of the voltage dip.
Increase the inertia of the system. There are several options to perform this action, such as emulating in the control system of non-synchronous generation, using synchronous condensers, and increasing the inertia constant in the synchronous generator. As a first approach, the inertia of synchronous generators has been increased by a 25%.
Connect a STATCOM to improve transient stability. A 50 Mvar STATCOM at Granadilla substation is modelled by including an extra term to account for the STATCOM reactive power in Equation (2).
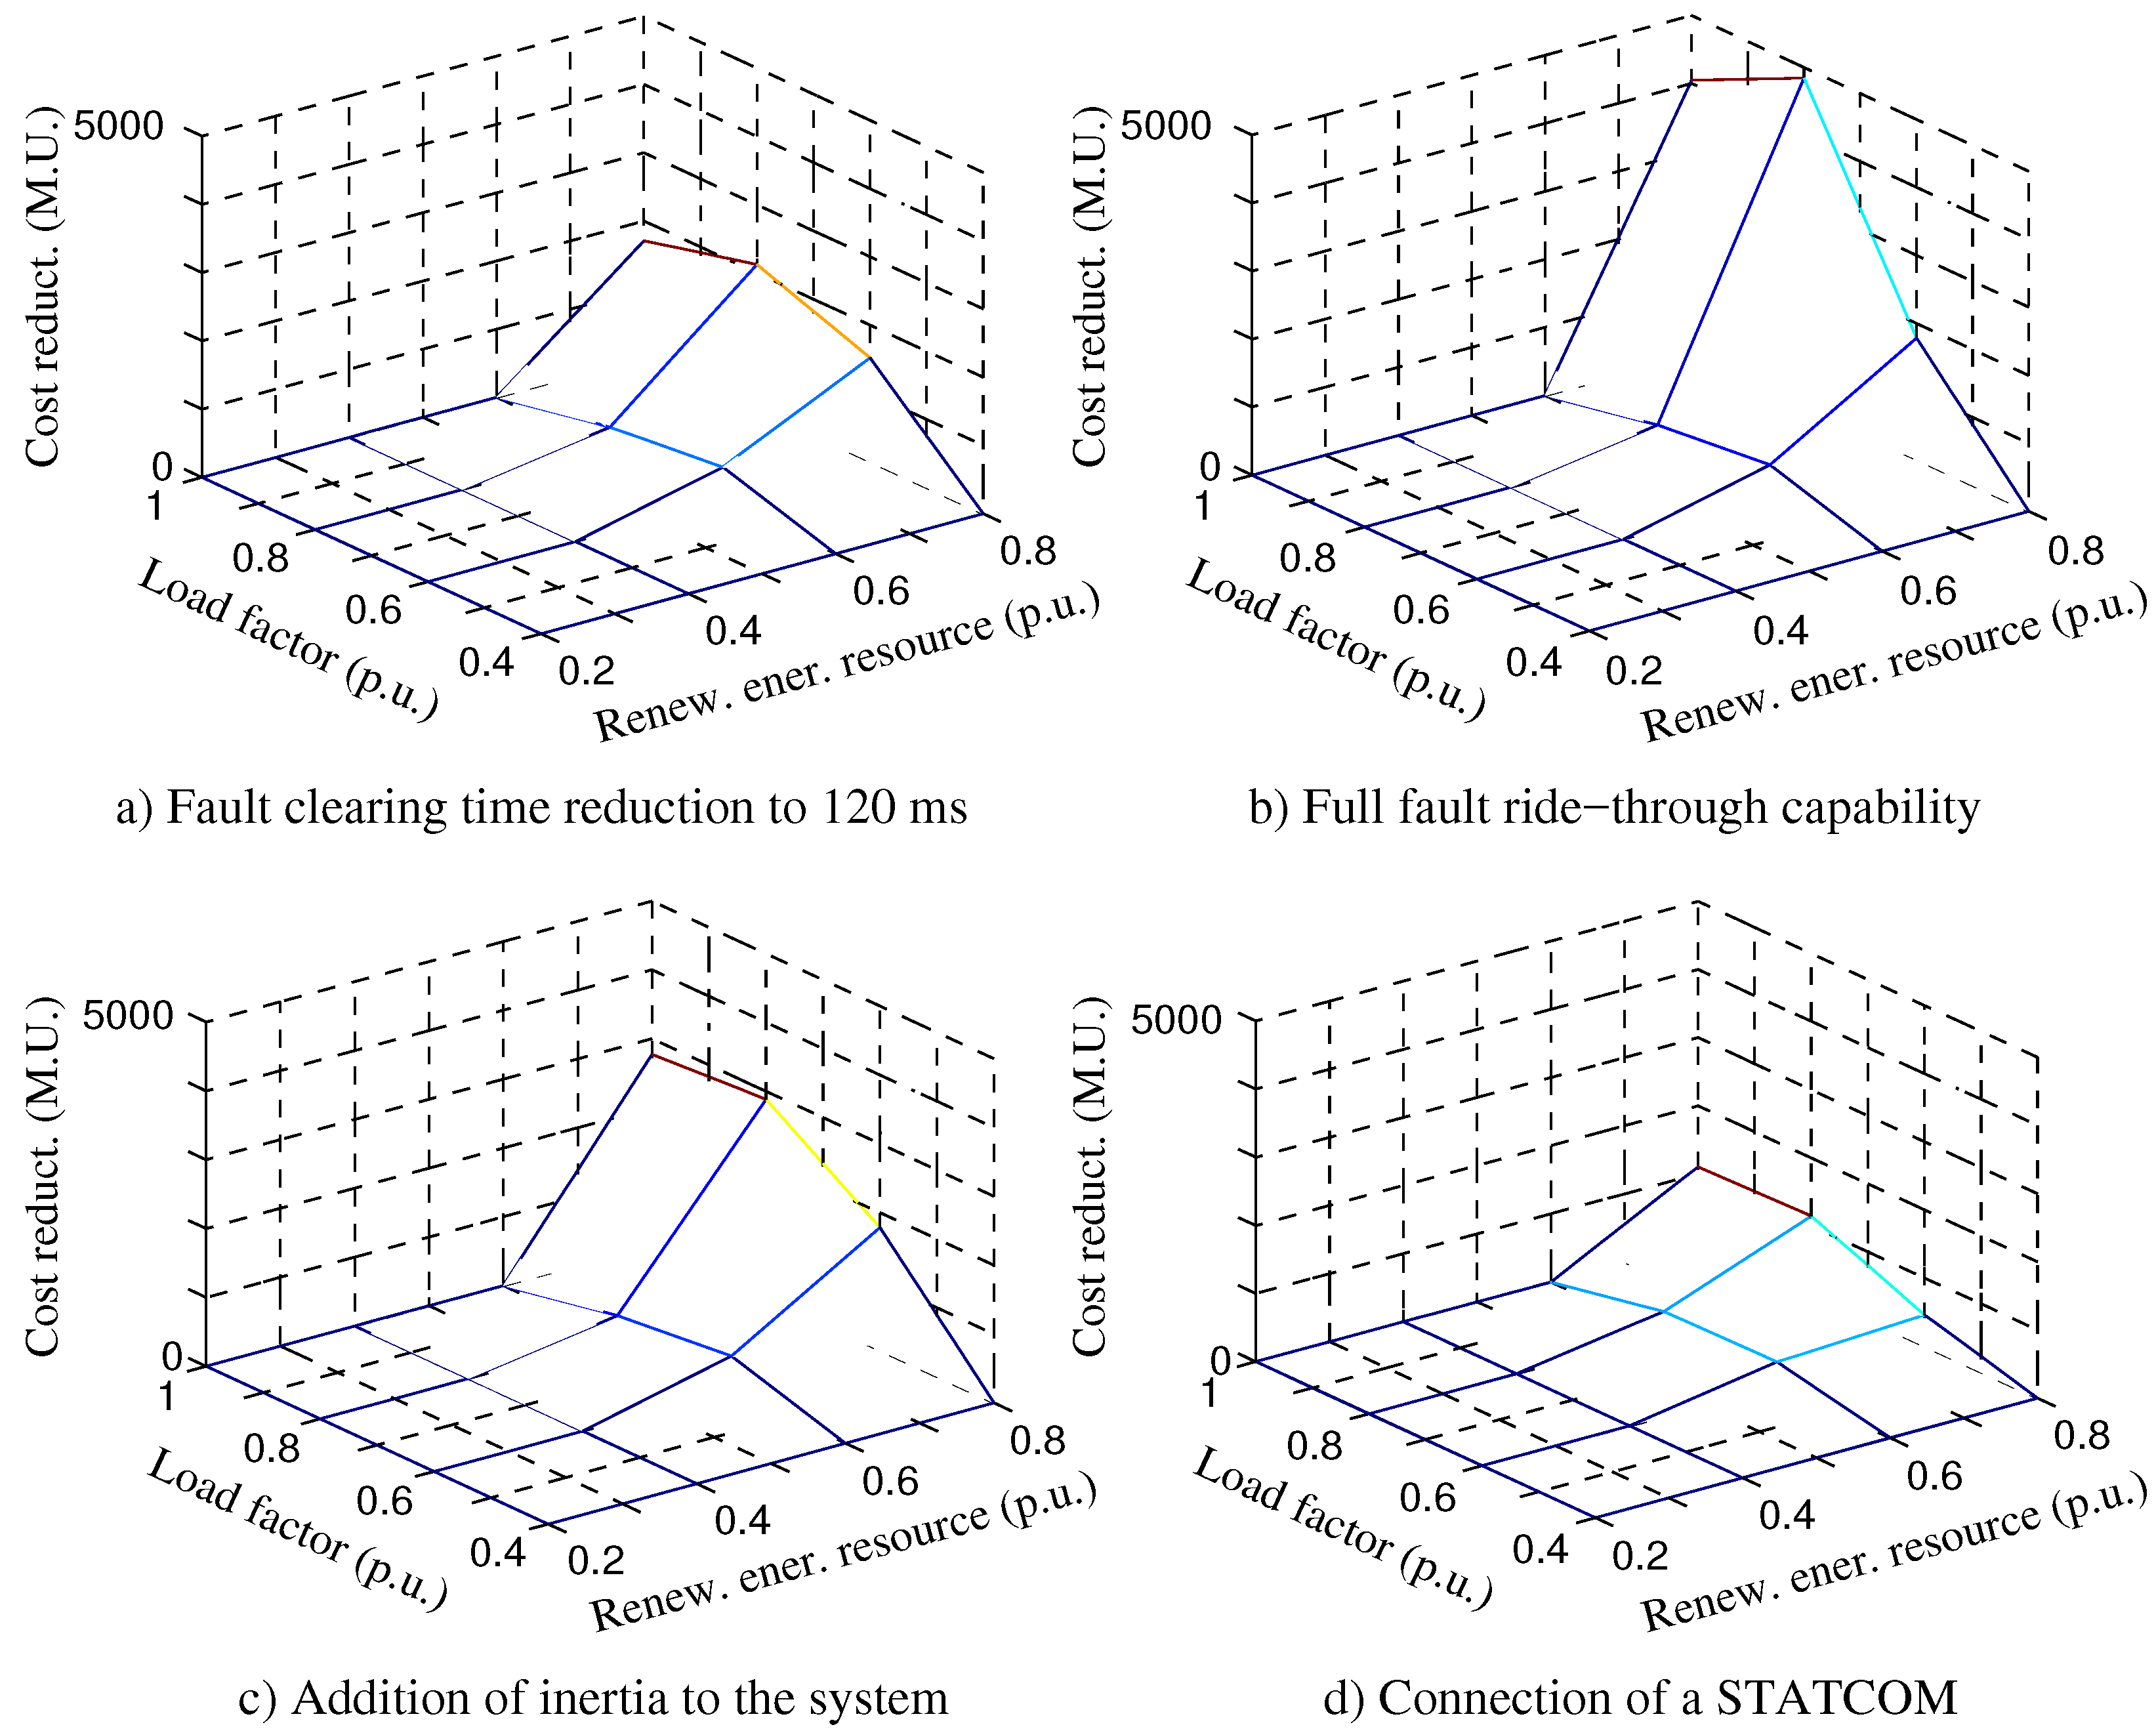
Figure 11 shows the reduction in generation cost obtained with each strategy with respect to the base case. It can be seen that this reduction occurs when the availability of renewable energy is larger, which is when non-synchronous curtailment is larger in the base case.
It can be seen in
Figure 11b that the provision of full fault ride-through capability provides the largest reduction in cost. This can be explained because the sudden disconnection of non-synchronous generation displaces the equilibrium point of the system and can therefore worsen the electromechanical oscillations of synchronous generations, and because the loss of non-synchronous generation decreases the frequency of the system.
Addition of inertia to the system in
Figure 11c also makes it possible to reduce non-synchronous curtailment and total generation cost. This is congruent with the fact that large inertia constants improves both transient and frequency stability, but it must be noted that system inertia affects other aspects of the operation of power system such as primary control that must also be taken into account.
The installation of faster automatic circuit breakers that are able to clear the fault in 120 ms reduces the cost too as shows
Figure 11a, although on a lower scale. Finally, the effect of a 50 Mvar STATCOM shown in
Figure 11d is relatively small compared to the rest of the solutions.
5. Discussion
The application of the optimization model proposed in
Section 2 to the IEEE 39 Bus test case demonstrates its performance on a standard case. It illustrates also, in
Figure 4, how non-synchronous generation can affect transient stability: the optimal solution curtails non-synchronous generation despite the fact that its cost is zero, because it is necessary to maintain the rotor angles of synchronous generators within their limits.
It is difficult to find terms of comparison for the performance of the solution, because most previous works tested on the IEEE 39 Bus system use a simpler, 2nd order classical synchronous generator model [
34,
35,
36,
37]. The proposed method applies a 4rd order, transient synchronous generator model that increases the number of variables and equations but represents the dynamics of the machine with more accuracy [
38]. Compared to the method proposed in [
26] which also uses a 4rd order synchronous generator model, the proposed method calculates the voltage at every bus and at every sample time. This makes it possible to represent non-synchronous power stations and nonlinear, ZIP load models, but comes at the prize of increasing the number of variables by 80% and the number of constraints by 64%. Nevertheless, the size of the model is suitable for application to isolated systems such as the Tenerife System studied in this paper, although its application to large power systems would be problematic unless they are previously reduced.
No problems of convergence have been observed during the application of the method, neither to the IEEE 39 Bus system nor to the Tenerife system. It is worth noting that the calculation of all voltages at every sample time makes it possible to apply the voltage correction term defined by term
in Equation (
5) during deep voltage dips. This term ensures numerical stability when representing severe faults that are not compatible with the references of active power in loads and non-synchronous generators. The results show a significant improvement if selective curtailment is applied as opposed to homogeneous curtailment, although homogeneous curtailment may be easier to implement for reasons of market organization.
The application of the proposed model to the Tenerife system makes it possible to calculate the optimal curtailment of non-synchronous generators (
Figure 9), and to quantify the increase in cost associated with it (
Figure 10). This is calculated in the paper taking the load and the availability of non-synchronous generation as independent variables. Largest curtailments and increases in cost are obtained during periods of small load and large availability of renewable energy resources, as expected. Further analysis can match these data with historical records of load and availability of renewable resources to estimate costs over long periods of time, which will probably benefit from the usual correlation between load and availability of solar energy.
Several techniques have been explored to reduce curtailment of non-synchronous generation. Results are summarized in
Figure 11, that shows how a substantial improvement can be obtained if non-synchronous power stations are provided with full ride-through capability. This can be explained as a consequence of the small inertia in the Tenerife power system. The small inertia makes it prone to large deviations of rotor speeds after a severe fault, which worsen if part of the non-synchronous generation trips off. This explains also how an increase in the inertia of the system provides a reduction in the curtailment of non-synchronous generation. Here the inertia of synchronous generators is directly increased, which must be seen as a preliminary study because there are some other options such as connecting synchronous condensers or emulating inertia in non-synchronous plants. Some benefits can be obtained from a reduction in fault clearing times, a solution that would require to invest in faster circuit breakers. The connection of a 50 Mvar STATCOM at Granadilla substation produces a slightly lower improvement. This may be due to the fact that STATCOMs are effective when damping electromechanical oscillations between synchronous generators, but have a limited effect on frequency stability. Nevertheless, a more detailed study of the effect of a STATCOM should evaluate the effect of different sizes, control systems, an connection points.
It can be concluded from the studied system that the connection of non-synchronous generation will impact on transient and frequency stability to the point of forcing the curtailment of renewable generation in certain cases. Specific measures such as improving voltage dip-ride through capability, reducing fault clearing times, providing real or synthetic inertia and using a FACTS can reduce the curtailment of non-synchronous generation and restrict it to cases with very low load and high availability of renewable energy sources.


