Article

Modeling and Experimental Study of a Small Scale Olive Pomace Gasifier for Cogeneration: Energy and Profitability Analysis

1
DIMA—Dipartimento di Ingegneria Meccanica e Aerospaziale, Sapienza Università di Roma, Via Eudossiana 18, 00184 Rome, Italy
2
CPSE—Centre for Process Systems Engineering, Imperial College London, South Kensington Campus, London SW7 2AZ, UK
3
DISAAT—Dipartimento di Scienze Agro-Ambientali e territoriali, Università di Bari, Via Amendola 165/A, 70125 Bari, Italy
4
DICMA—Dipartimento di Ingegneria Chimica Materiali e Ambiente, Sapienza Università di Roma, Via Eudossiana 18, 00184 Rome, Italy
*
Author to whom correspondence should be addressed.
Energies 2017, 10(12), 1930; https://doi.org/10.3390/en10121930
Submission received: 19 September 2017 / Revised: 15 November 2017 / Accepted: 17 November 2017 / Published: 23 November 2017
(This article belongs to the Section I: Energy Fundamentals and Conversion)

Abstract

:
A thermodynamic model of a combined heat and power (CHP) plant, fed by syngas produced by dry olive pomace gasification is here presented. An experimental study is carried out to inform the proposed model. The plant is designed to produce electric power (200 kWel) and hot-water by using a cogenerative micro gas turbine (micro GT). Before being released, exhausts are used to dry the biomass from 50% to 17% wb. The ChemCad software is used to model the gasification process, and input data to inform the model are taken from experimental tests. The micro GT and cogeneration sections are modeled assuming data from existing commercial plants. The paper analyzes the whole conversion process from wet biomass to heat and power production, reporting energy balances and costs analysis. The investment profitability is assessed in light of the Italian regulations, which include feed-in-tariffs for biomass based electricity generation.

1. Introduction

Mediterranean countries are responsible for a large part of the world olive oil production. The environmentally friend disposal of the olive pomace requires the implementation of waste-to-energy strategies through pomace gasification. A proper solution is to process the crude olive pomace (COP) aiming at obtaining dry olive pomace (DOP) as a fuel. In [1,2], an overview of the most common olive oil extraction processes is provided. A three-phases centrifugation system is generally adopted in Italy. The main products are: (i) olive oil—20% in weight of olives; (ii) COP—50% in weight of olives; (iii) a large amount of olive mill wastewater (OMW)—120% in weight of olives, which includes the water added during the process [3]. The extraction of pomace oil from COP allows obtaining the DOP as a by-product (about 10% wb), generally used for energy conversion in CHP or thermal plants. The reduced demand for pomace oil (due to excess olive oil availability from emerging markets) and consequently the increased production of COP with high moisture content (>60%) has increased the problem of olive waste disposal [4]. The option of discharging COP to the soil as fertilizer has the drawback of the high phenols, fatty acid and tannin content [2,5]. However, COP can be directly used for energy conversion, after drying [6]. The main technical issues are in this case the energy consumption for the drying process, the air emissions from combustion (unburned carbon, particulate matter), the logistics of supply and storage [7]. In Italy, the existing energy policies support the development of biomass small scale CHP plants, as described in [8].
Thermo-economic approaches can be usefully employed to compare operation strategies and profitability of small scale CHP plants fed by syngas [9]. In [10] an analysis of a more sophisticated configuration (micro GT and bottoming ORC) is proposed to investigate the best operating conditions.
Among biomass energy conversion systems, gasification is one of the most promising. A wide number of gasification technologies are available, and for small-medium applications downdraft and updraft systems are the most common. When considering syngas as a fuel, internal combustion engines and micro GT are generally employed for power and heat generation.
The ChemCad software (Chemstations, Inc, Houston, TX, USA) has been demonstrated to be an appropriate tool for computing solid fuel gasification. In [11] a ChemCad model of a biomass gasification plant coupled to a micro GT is validated through experimental data. In light of this, in this paper we adopted ChemCad to model the COP to syngas gasification process.
We assume an updraft gasifiers and its use to feed a micro GT because of its lower emissions and reduced O&M costs. In the next section, a review of gasification technologies and modelling approaches is proposed, and successively a description of the CHP plant under investigation is presented. The energy balance of the system as resulting from the simulation, informed by specific experimental tests, and the economic profitability of the investment in the Italian legislative scenario are then presented, and results are discussed in the last section.

2. Gasification Technologies and Modelling Approaches

The gasification process is the conversion of a solid carbonaceous material, such as biomass, in a gaseous energy carrier (syngas) through a partial high temperature oxidation [12,13,14,15]. The syngas is composed by CO, CO2, H2, CH4, H2O, N2, other hydrocarbons such as C2H4 and C2H6 and further substances such as ash, coal particles, tar and oils. The gasifying agent can be air, steam, oxygen or a mixture of these.
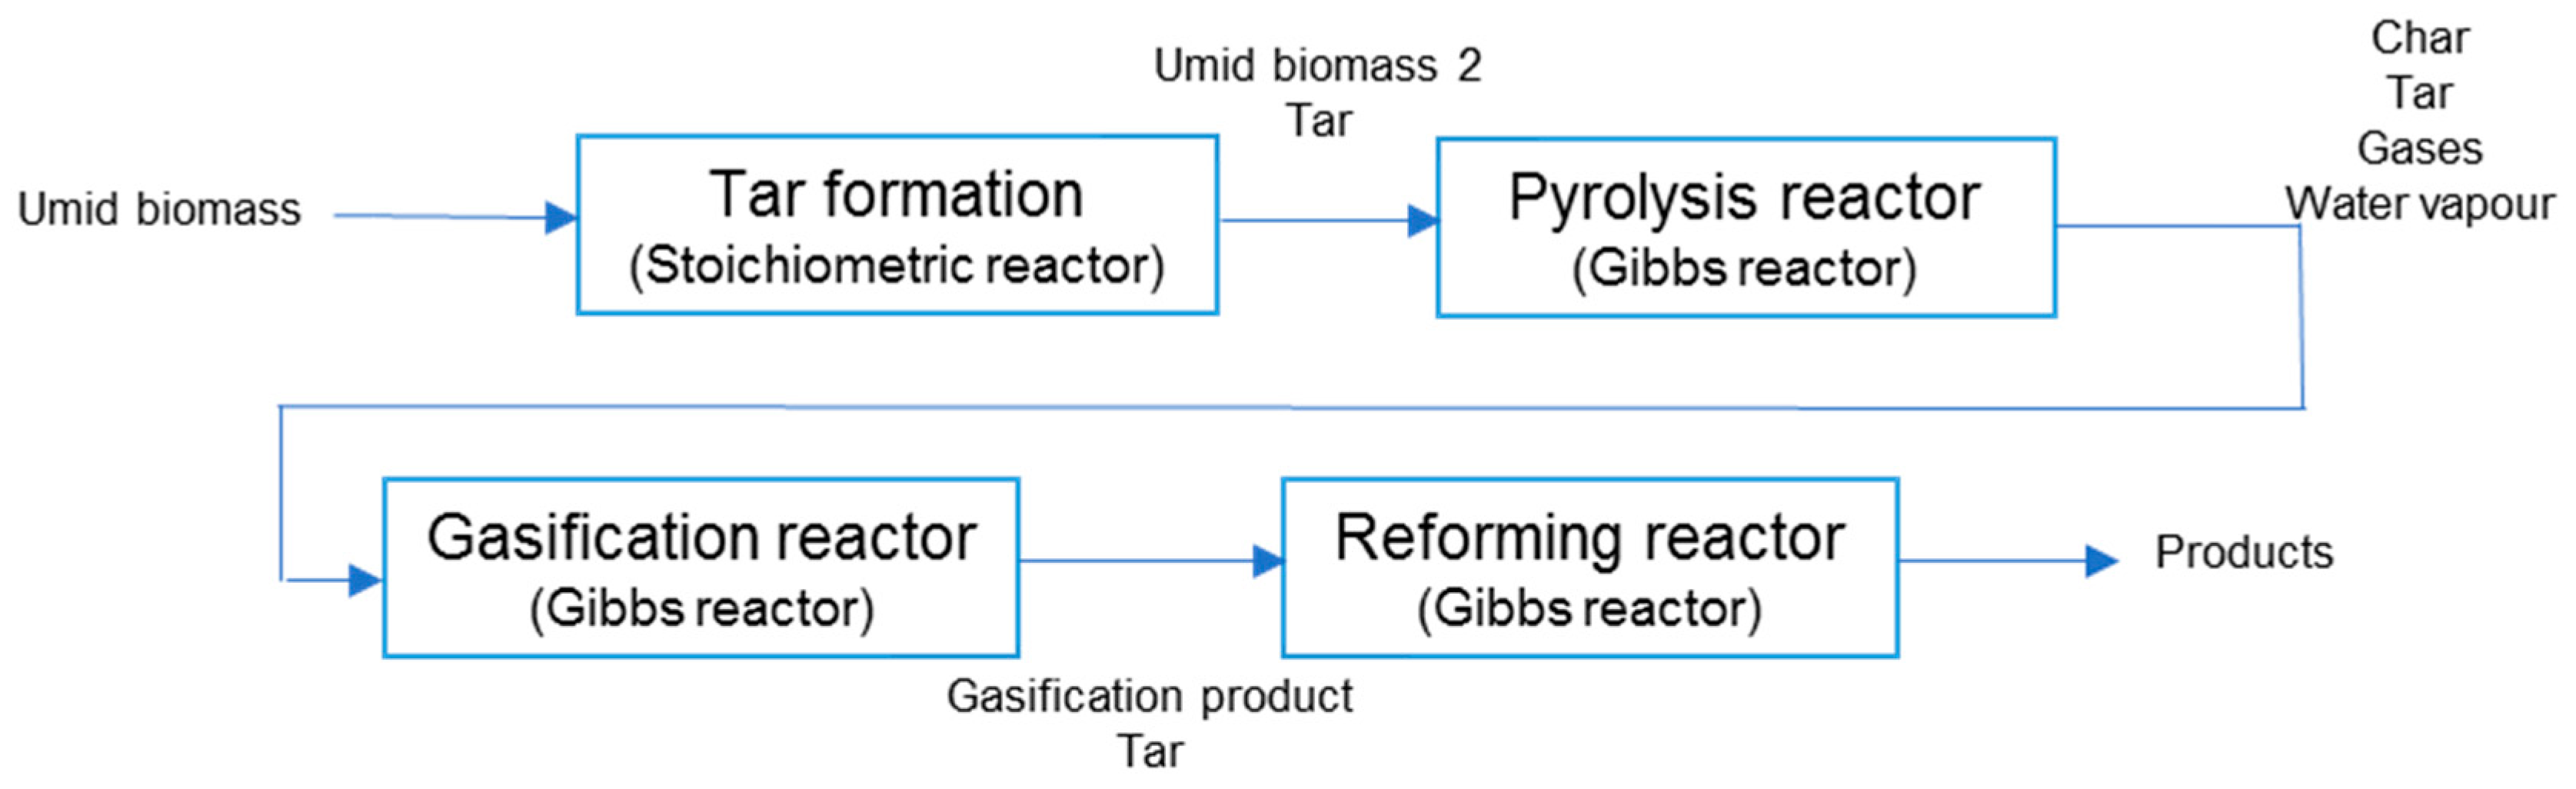
The syngas can be used as a gaseous fuel, thus easy to convey and transport, or used in other industrial processes. The gasification process takes place within a reactor and can be divided into two main stages. In the first stage of pyrolysis, as a consequence of the thermochemical decomposition of biomass at temperatures above 350 °C, the volatile components of the fuel are released [16]. These volatile vapors contain gaseous hydrocarbons, hydrogen, carbon monoxide, carbon dioxide, water vapor and tar. The solid fraction from the pyrolysis process (bio-char) is an agglomerate of complex nature consisting of carbon, ash, sulfur compounds and volatile hydrocarbons. In the second stage, the gasification of pyrolysis products is achieved, and the reaction with the gasifying agent leads to an increase of fuels concentration, and to the conversion of bio-char. This last stage is the most important; it is the slower phase, hence it affects the kinetics of the whole process and, consequently, both the sizing and the performance of the reactor.
A first classification of gasifiers proposes direct and indirect systems [17,18]. In the direct type, the burning of a part of the pyrolytic products provides heat to both pyrolysis and gasification, and the process is developed inside the reactor; in the indirect type, the combustion takes place in a separate combustion chamber and the heat is carried to the pyrolysis zone by means of a flow glowing sand or other material (heat transport is the critical point of this technology, slowing down the process [19]). Further classification criteria are based on the operating pressure, the gasifying agent, the type of the reactor construction [20,21]. Indirect gasifiers normally operate at atmospheric pressure, whereas in the direct type considerably higher pressure can be reached, with the advantage of a produced syngas that does not need to be compressed. The choice of the gasifying agent is very important, because it highly affects the characteristics of the syngas. Both the composition and calorific value vary greatly with the gasifying agent: air gasification presents a low heating value (LHV) of the syngas in the order of 4–6 MJ/N·m3, and large volumes of N2, while pure oxygen gasification allows LHV ranging between 12 and 18 MJ/N·m3 [22]. Moreover, the gasifiers can be classified in fixed bed [23,24], fluidized bed [25,26] or bed dragged gasifiers. The fixed bed gasifiers are distinguished in co-current gasifiers (downdraft) and counter current ones (updraft) [27,28]. The configuration choice is dependent on the biomass characteristics, typology and quality required for the syngas, processing plant size and cost issues. In particular, the downdraft gasifier is usually used for the production of syngas with a high content of volatile matter and low tar content. This technology is the most popular in the small scale range [29,30].
The state-of-the-art of the fluidization technology for the gasification of biomass is reviewed in [31], where the different gasifier types, fluidized bed technologies, gas cleaning systems and influence of process parameters on the syngas and biochar composition are discussed. In [32], a review of thermochemical biomass gasification for producing biofuels and chemicals is presented, with a specific focus on the effects of operating conditions on gasification reactions, on the reliable prediction of the product compositions, and on conversion efficiency optimization. The promising conversion route of bio-hydrogen production via biomass air gasification is investigated in [33,34] focusing on agricultural wastes and olive kernels via bubbling fluidized bed gasifier. Mass and energy balances on a pre-pilot scale bubbling fluidized bed reactor fed with mixtures of plastic waste, wood, and coal were also discussed in [35] in order to explore the influence of input fuel on gas composition and gas cleaning.
In the specific olive waste-to-energy sector, several experimental researches have been proposed. In particular, in [36] the atmospheric gasification of untreated olive stones at 700–820 °C is proposed. The gasification process at higher temperatures reported higher carbon conversion and gas yield, despite decreasing the LHV of the gas when increasing the air flow rates. In addition, the high potassium content and low ash fusion temperature of the olive stone ashes were found to be responsible for the bed agglomeration problems, so requiring the use of two inert materials (sand and ofite), which however affected the fluidized bed operation and reliability.
The biochar yield, biomass burning rate, syngas composition and tar content of a updraft gasifier feed by pine wood chips at different particle size, moisture content and compactness was studied in [37], reporting, among the others, an increase of biochar yield when increasing the particle size.
In [38], the behavior of different biomasses (wood, torrefied biomass, agricultural and industrial wastes) after gasification in a bubbling fluidized bed gasifier at mild temperatures (600 °C) was investigated, using an air–steam mixture at different stoichiometric ratios. The low-temperature gasification of biomass in a purpose-built atmospheric bubbling fluidized bed reactor was optimized on the basis of the experimental results; it was found that the same gasification conditions (steam quantity) do not affect every biomass in the same way, and gasification conditions must be carefully tested for each biomass. The research also investigated the possibility of reusing the carbon-rich partially oxidized biochar in agricultural applications or as a catalyst-sorbent precursor. The properties of biochar depend heavily on biomass feedstock, gasifier design and operating conditions, and in light of this, ref. [38] investigated the influence of biomass type and equivalence air ratio on the physiochemical properties of biochar from gasification. The production of biochar from hazelnut and olive pruning residues via carbonization was also investigated in [39], performing a physicochemical characterisation of the produced biochar in light of the European standards.
A simulation of the gasification process requires the assessment of the different phases of pyrolysis, partial oxidation and gasification. The modelling of the chemical reactions is very complex, and the kinetics are far from the equilibrium conditions. For these reasons, simplified models are usually assumed, such as mono-dimensional ones [40,41,42,43]. To predict the real behaviour of the plant, numerical simulation codes can be successfully adopted. In [16] a mathematical CFD model of biomass pyrolysis is presented. The model predicts the tar and light particulate matter in the syngas as well as char fraction released in a biomass packed porous bed system. In [44], the gasification of lignocellulosic biomass coupled with a SOFC/ORC plant is modelled and validated. The influence of air enrichment and of biomass moisture content is also addressed.
A good and reliable theoretical model of a gasifier is very important, to provide useful information for the design, optimal operation and energy performance assessment Many theoretical models can be found in the literature simulating the performance of gasifiers [44,45,46,47,48,49], under different operating conditions (e.g., in terms of moisture content, type of biomass, sizes of the molecules, and ash contents). In particular, some approaches use kinetic models to represent the biomass gasification process [44,45,46], which are suitable and accurate at moderately high temperatures (T < 800 °C), but very complex, while others apply equilibrium models and are particularly accurate at high temperature [47,48,49]. Equilibrium models are based either on the use of the equilibrium constants or on the minimization of the Gibbs free energy. When equilibrium constants are considered, the equilibrium models are based on the use of fundamental chemical reaction mechanisms and of the chemical composition of the biomass. In this case, their complexity depends primarily on the number of reactions that are considered. In many cases these methods, using a limited number of reactions, greatly simplify the analysis, while compromising the reliability and accuracy of the results. On the opposite, when the minimization of the Gibbs free energy is considered, the exact knowledge of the chemical reactions mechanism is not required for the syngas components prediction.
Several review papers are available in literature in the field of modeling biomass gasification. In [50], the state of art modeling works based on specific criteria such as type of gasifier and feedstock have been categorized in a comprehensive review, reporting comparative assessments of the modeling techniques and output for each category. In [51], a similar review is proposed but including artificial neural networks and Aspen Plus gasification models, while [52] focuses on mathematical and computational approaches for design of biomass gasification for hydrogen production. In [53], biomass gasification in bubbling and circulating fluidized bed gasifiers is reviewed, including both black-box models and computational fluid-dynamic ones or comprehensive fluidization models, with semi-empirical correlations.
Several free commercial codes [54] implement the Gibbs free energy minimization and propose a relatively simple and easy option to model the gasification, with accuracy that could be acceptable on the basis of the specific application. Most of the thermodynamic modeling and optimization tools are based on a modular structure, which considers the plant as a set of interconnected components; each of them can be modelled through specific equations and mass/energy flows. The research has recently moved from the simple model of gasification, based on the Gibbs free energy minimization, to more complex models, which attempt to simulate most of the physical phenomena taking place in a gasifier. For instance, in [55] different models with increasingly high level of complexity have been proposed, and the results show that a simplistic use of the default gasifier module determines an under-estimation of the methane molar percentage into the syngas. The researches proposed in [55,56,57,58] suggests the following improvements to the downdraft biomass gasification model: (i) modeling three cascade reactors, simulating respectively the pyrolysis, oxidation and reduction zones; (ii) separation of a fraction (5% by mass) of the inlet carbon content, in order to take into account the unavoidable losses occurring in the gasifier due to char formation; (iii) bypass of a fraction of the methane formed during the pyrolysis directly to the reduction outlet, in order to reflect the unavoidable losses and the impossibility to achieve a complete equilibrium composition during the gasification. In light of this state of art on gasification modelling, we here propose an original approach based on interconnection of thermochemical components and informed by experimental data at lab scale, as described in the following section.

3. Experimental Set-Up and Gasification Modeling

The biomass gasification and the cogeneration section are modeled using ChemCad. The Peng-Robinson state equation is used. The relevant ChemCad objects used are: (a) reactors (stoichiometric and Gibbs); (b) heat exchangers (coolers/heaters and condensers); (c) expander and compressors.
It is assumed that the ChemCad objects always reach equilibrium conditions. To take in account the real behaviour of all components, validation/calibration approaches are required, and for this purpose the results of specific experimental tests are used. In particular, for the pyrolysis/gasification process, experimental studies were carried out at DICMA using a laboratory scale down-draft gasifier.

3.1. Experimental Set-Up

The lab-scale plant is composed by an up-draft gasifier fed by DOP and air used as gasifying agent. A plant schematic is reported in [59]. Pomace is dried at 17% wb moisture content before feeding the reactor. The gasification tests are performed in a semi-continuous plant. The plant is divided in three zones: the pyrolysis, gasification and the reforming unit. The feeding system is composed by a hopper and a screw conveyor. The biomass, drag by a nitrogen flux, enters the pyrolysis reactor, constituted by a stainless tube of 40 mm and 700 mm length with a tilt angle of 70 °C. The tube, externally heated by means of an electrical heater at 750 °C, contains a screw that allows controlling the residence time of the biomass into the reactor. Here the volatiles, tar, light gases and char are formed. The obtained char falls in the connected vertical fixed bed gasification reactor where air is injected as gasifying agent from the bottom (800 °C at the windbox). The gasification gas and the volatiles produced in the pyrolysis flow through the reforming reactor (i.d. = 40 mm; L = 500 mm) and reach the collection system. The reforming reactor is equipped with a cable heater to minimize the heat loss from the reactor walls and to sustain the endothermic reactions, and with a steel net to support the catalyst bed. The catalyst used for the experimental tests is a CeO2 promoted bimetallic Ni–Co catalyst supported on γ-Al2O3 [60]. The plant details are provided in [61].
The pomace mass flow rate is 400 g/h, while for the air flow an Equivalent Ratio of 0.5 is used, corresponding to a flow rate of 300 L/h. All the tests are conducted using the dry olive pomace (DOP) whose main properties are reported in [14]. Proximate composition was determined using a thermogravimetric (TG) method according to the ASTM D5142/02. The ultimate analysis was carried out with an EA3000 (Eurovector, Pavia, Italy) elemental analyzer. The catalyst preparation is described in a previous article [59]. The LHV of the DOP is equal to 17.6 MJ/kg.

3.2. Plant Modelling

The whole plant is composed of five sections, as reported in the boxes of Figure 1 where the components are indicated in circles and the streams in squares. In Figure 2, the plant flow chart as resulting from ChemCad modelling is reported.

3.2.1. Biomass Drying

The green box in Figure 1 shows the biomass drying section. The COP is supplied with a 50% moisture content, and this value is too high to be sent directly to the gasifier, therefore a preliminary drying process is required (component 22 of Figure 1). The biomass is dried using an air flow having a temperature of 45 °C and heated by the exhaust gases (flow rate 31). The humidified air is sent to a water separator to be dried.

3.2.2. Pyrolysis/Gasification

Experimental data at laboratory scale gasifier are used to assess the gasification and reforming section of the model. The gasifier is modelled assuming the flow chart of Figure 2. This steady-state model considers all the depicted processes occurring in the experimental plants.
Biomass gasification takes place in different steps, and it is necessary to separately model pyrolysis, combustion and gasification phases [40,41]. The pyrolysis is separated into two reactors (tar separation and pyrolysis) to reproduce the experimental results as close as possible. The biomass is firstly sent to a stoichiometric reactor (Figure 2) where the biomass is decomposed in tar and a solid residue, whose composition is defined based on the results of olive cake experimental tests [61]. The stoichiometric coefficients of the first reaction (where tar is produced) are extrapolated from the experimental results. The amount of tar in the experimental tests is 13% by weight of the biomass. Tar is modelled as a unique molecule of CxHyOz. The coefficients x, y and z are calculated on the basis of the experimental values of tar elemental composition reported in Table 1. Consequently, the resulting tar model compound is CH1.38O0.5. The composition of the biomass, deprived of tar, sent to the second reactor is CO0.9H1.61N0.04. This biomass composition is obtained by balancing the inlet biomass and the assumed tar composition. The second reactor (Figure 2), where the pyrolysis of the biomass (deprived of tar) occurs, is modelled as a Gibbs reactor and here the tar is considered as inert in order to avoid is decomposition in the pyrolysis reactor. Since the pyrolysis cannot be considered an equilibrium process, in order to reproduce the experimental results using Gibbs reactor we limited the operating temperature to 400 °C. In this reactor the biomass is decomposed in light gases, such as CO, CO2 and CH4 and in biochar. The composition of the biochar is assumed only carbon and ashes (considered as inert).
The pyrolysis products and the tar are then mixed with 171 kg/h of air (equivalent ratio of 0.2) and sent to another Gibbs reactor (Figure 2) operating at 900 °C, where the gasification of the char takes place. In this reactor tar and pyrolysis products are treated as inert since in the experimental plant they are directly sent to the reforming reactor thus not taking part to the gasification process. In the last reactor of this section, tar and pyrolysis products are reformed obtaining the syngas used to feed the MGT. The gases are previously mixed with 85.50 kg/h of air. This amount of air, which corresponds to the 10% of the amount of stoichiometric air needed for a complete combustion of the gas, is injected to sustain the endothermic reforming reaction, burning a small part of the gaseous fuel produced during gasification. The temperature here is set at 850 °C.

3.2.3. Syngas Clean-up and Drying

The gas clean-up is carried out passing the syngas in a cyclone to remove ashes and cooling up the syngas to about 80 °C. This process is carried out in two-steps, and indicated by the red box in Figure 2.

3.2.4. Power Generation and Heat Co-Generation

The micro GT model is reported in the orange box in Figure 2. The compressed syngas (5 bars) enters in the combustor (Gibbs reactor—Component 16) together with air previously compressed (in a centrifugal compressor-CC15) and pre-heated in a heat exchanger—HE 17—by using exhausts coming from the turbine (T19). Downstream from the combustor, the exhausts are sent to a centripetal micro GT (T19). The exhausts exiting from HE-17 are sent to the heat co-generation section highlighted in blue in Figure 2.

4. Results and Discussion

4.1. Pyrolysis and Gasification

In Table 2 the flow rates of the three components exiting from the first pyrolysis reactor (where the biomass is deprived of tar) are reported. The stoichiometric reactor was set up to reproduce the mass fraction values in agreement with the experimental data [61].
In Table 3, the composition of the flow after the pyrolysis reactor is showed. As already said here the tar is considered as an inert species. The biomass is decomposed mainly in CO2, carbon and water and smaller amount of CO, hydrogen and methane.
After the gasification reactor (Table 4), the char, modelled as carbon, is converted mainly into CO and CO2 by reacting with a sub-stoichiometric amount of oxygen; a small amount of unburnt carbon, which corresponds to 3% by weight of the total carbon, is still present. The LHV of the gas exiting from the gasifier is about 4.5 MJ/kg that is in the range of typical value for air gasification. In the gasifier, following the experimental set-up described above, the tar and the pyrolysis products are considered inert and sent directly to the reforming. In the reforming reactor, the tar and the pyrolysis products are converted into light gases.
The data obtained at the outlet of the reformer were compared with the results of the experimental tests conducted in the same conditions (Table 5). The model results present some differences with experimental data due to the simulation of the reforming as a Gibbs reactor. In the experimental tests the equilibrium is not reached and so modelling via Gibbs reactor is not completely reliable. In fact, in the experimental tests the tar is not completely consumed, and an amount of 2.9% by weight is still present.

4.2. Syngas Clean-up and Drying

In Table 6, the results of the syngas clean-up and drying section (red box in Figure 2) are shown. In the first step of this section the syngas passes through a regenerator (heat exchanger—HE-12) where it reheats the clean pressurized (at 5 bars) syngas that enters in the combustor at 800 °C; in the second step (HE 9), the syngas is cooled (by producing hot water) up to 79 °C allowing the water (and residual tar) separation (separator 6). After the clean-up process the gas is then compressed (up to 5 bar) (8), reheated (using the same heat exchanger used for cooling, HE 12) and sent to the combustor.
In HE 12, the approach point temperature difference is 51 °C and it allows to increase the syngas temperature up to 799 °C. In the second heat exchanger (HE 9), more than 2100 kg/h of hot water at 90 °C is produced and available for thermal energy demand. The removed water amount is equal to 41.73 kg/h (see also mass flow difference in Table 6).
The compressor requires 30 kW for air compression to 5 bar, see Table 7. The syngas temperature outside the compressor is relatively low when compared with the exhaust temperature. Then the regeneration phase carried out in HE 12 is very convenient as the exhaust gas leaves the turbine at 683 °C, and it is possible to increase air temperature up to around 600 °C before combustion (see Table 8 below).

4.3. Power Generation and Heat Co-Generation

The technical data of the HE 17 heat exchanger are reported in Table 8. HE 17 is needed to pre-heat the air sent to the combustor by means the heat contained in the exhaust gases exiting from the turbine. Such regeneration phase is needed to increase the electric efficiency. At the end of such regeneration, the compressed air (at 5 bar, see Table 7) reaches a temperature of 604 °C.
The composition of gas leaving the combustor is reported in Table 9. The temperature is about 1006 °C. It was assumed that all fuel is burnt and no H2, CO or CH4 are present in the exhausts.
The details of the micro GT are reported in Table 10. The turbine outlet pressure is 1.1 bar. The overall power produced by the turbine (about 483 kW) is sufficient to move the air and syngas compressors and to produce a net power of 212 kW. The temperature of the flow leaving the turbine is sufficiently high to be used in the preheating of the compressed air (see also Table 8).
The thermal power production section results are reported in Table 11. The exhaust gases leaving the air regenerator HE 17 are sent to a second hot-water (90 °C) production section—HE 21—(blue box in Figure 2), and then to a final heating of cold air (up to 45 °C)—HE 22—to be used for biomass drying as shown in green box in Figure 2 and discussed above. An additional quantity of 11,500 kg/h of hot water at 90 °C is produced for feeding a thermal user. Furthermore, in the HE 22, a mass flow rate of 965 kg/h hot air at 45 °C is produced to be sent at the biomass dryer. At the end of the process, the exhausts gases are released in the atmosphere at 140 °C.
All these results refer to a technological process obtained from a scaling up of a lab model. For this reason, the configuration is not easily comparable with other results published in the open literature. However, as reported in the next section, the overall energy production and efficiency are in line with the literature performance data of micro GT fed with syngas from biomass gasification.

4.4. Energy Balances

As reported in Table 10, the net electric power of the MGT is 213 kW. The MGT thermal power output is 250 kW, while the total released thermal power due to the biomass inlet to the gasifier is 800 kW. The syngas LHV is 4.5 MJ/kg, and the thermal power entering the CHP plant is equal to 656.70 kW. This value is obtained assuming that the syngas is cooled up to 15 °C in a heat exchanger and subsequently re-heated in a similar heater up to 850 °C. This artificial assumption is done to properly evaluate the conversion process in the gasifier. If we avoid this assumption, the gasifier efficiency is strongly reduced while the CHP plant conversion is strongly increased, keeping constant the overall efficiency of the whole plant. The electric efficiency of the whole plant is equal to 26.6%, while the biomass conversion efficiency (ratio of electricity and thermal energy cogenerated vs input energy) is respectively 82.1% and 70.6% if assuming biomass at 17% and 50% wb moisture content respectively. The energy conversion efficiency is in accordance with similar researches [62,63]. In particular Damartzis et al., who modeled an integrated CHP system consisting of a biomass gasification unit coupled with an internal combustion engine (ICE) via Aspen Plus, obtained a thermal efficiency 33.5% [64], while in [65] an electric efficiency of 15% with olive pits and 23% with pine wood was reached.

5. Profitability Analysis

This section proposes a profitability assessment of the small scale biomass CHP system under different thermal energy demand intensities, and assuming the Italian subsidy mechanism for biomass CHP plants. The key techno-economic factors influencing the feasibility of such biomass to energy systems are explored for the case studies of only electricity sale (case EL) and the combined sales of heat and electricity for residential heat demand (case RES, corresponding to 1500 equivalent hours/year of thermal energy demand at 60 °C) and industrial heat demand (case IND, corresponding to 4000 equivalent hours/year of thermal energy demand at 90 °C). In all the cases, a baseload operation mode is considered (6600 equivalent operating hours/year), which is assumed on the basis of data from manufacturers and small size gasification plants in operation [8,9,66]. Different operational strategies have been investigated in previous researches [10,67], such as electric of heat driven modes. However, previous results show that, in absence of a specifically designed energy market structure that rewards the flexible operation of the on-site CHP system (load following operating mode, or operation only during high electricity price periods, or when both heat and power can be delivered to the end users), the high value of the bio-electricity feed in tariff (in comparison to the biomass purchase cost) and the high investment cost (CAPEX) of the investment make significantly more profitable a baseload operation mode, which maximizes the revenues from electricity sales, rather than other operational modes that maximize the global conversion efficiency but not the profitability.
On the basis of the assumed baseload operational mode, and in light of the energy conversion efficiency simulation results of the previous section, the wet olive pomace and dry olive cake consumption are respectively 2344 t/year and 1172 t/year and the thermal energy demand for biomass drying is 1199 MWh/year.
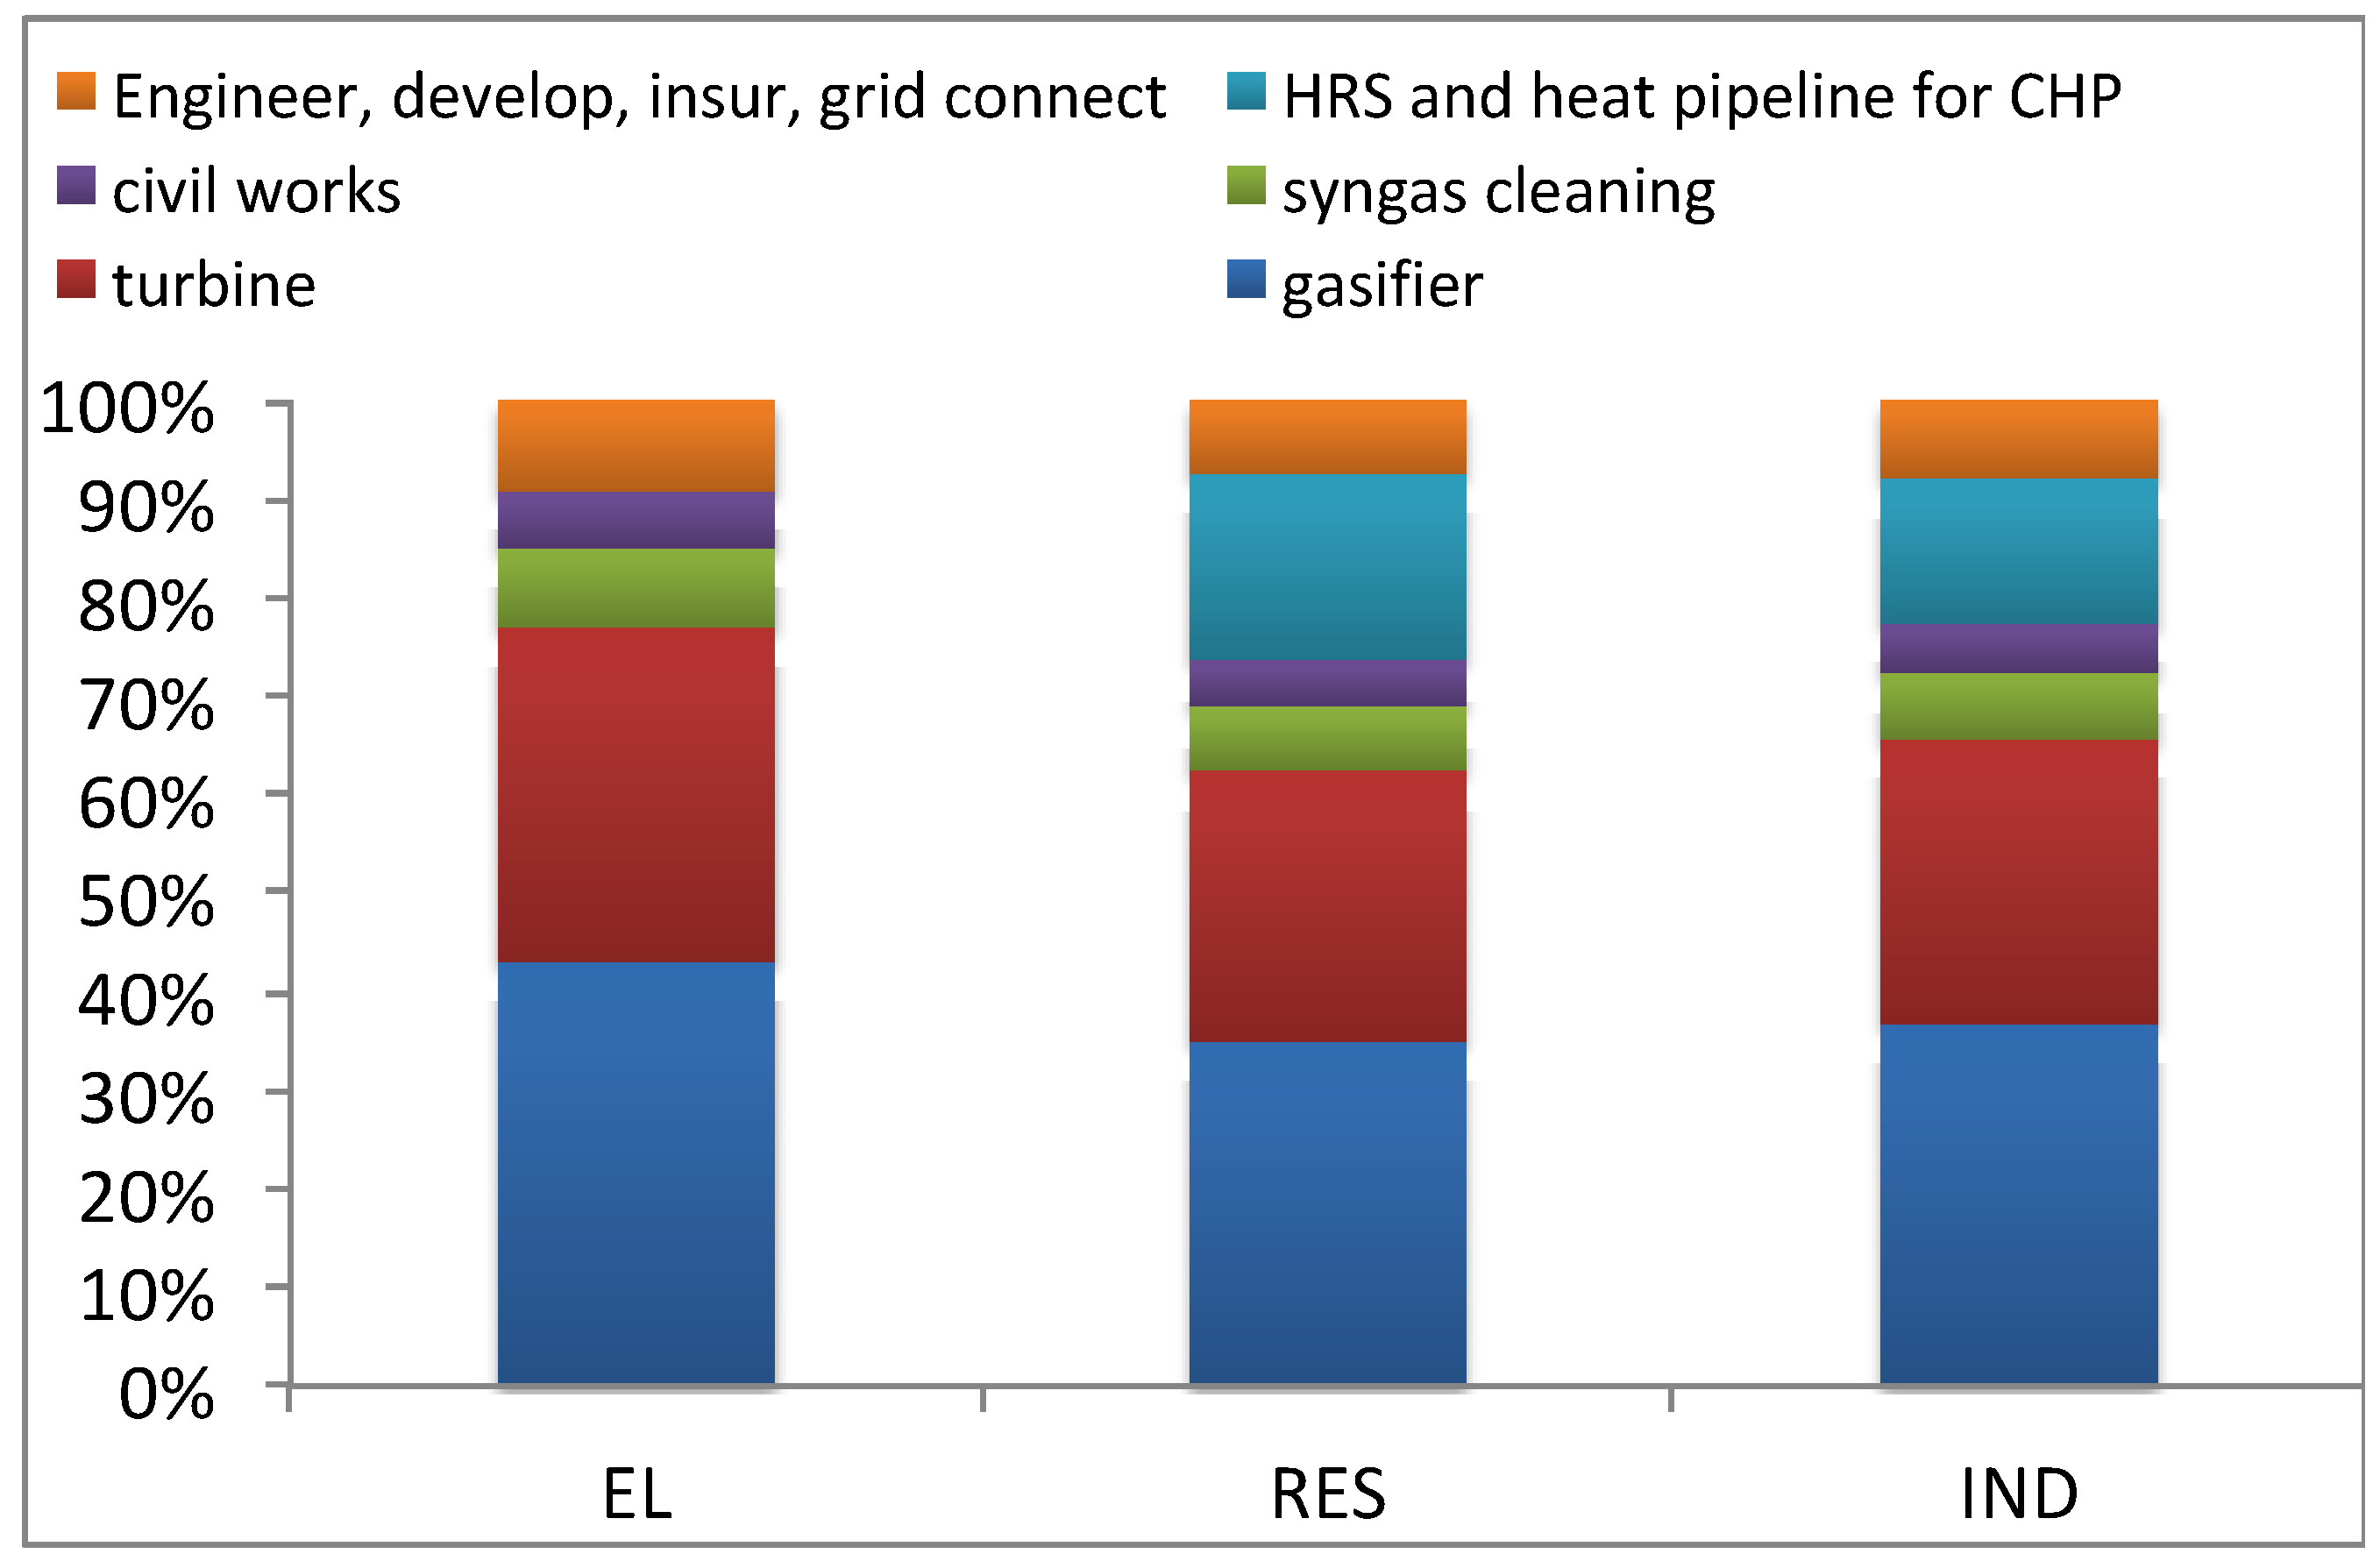
Figure 3 summarizes the CAPEX breakdown for the proposed case studies. The cost figures are author’s elaboration of data from manufacturers (for gasifiers [68,69,70,71,72,73], for MGT [74,75,76]). These data consider average values for installation, engineering, grid connection costs for small scale plants in Italy [66,67]. The operational costs are calculated assuming a biomass purchase price of 30 €/t for wet olive pomace included transport (55% moisture content and LHV of 1.97 kWh/kg), according to [1,75] and on the basis of interviews to olive oil operators in the Puglia region in Southern Italy (the Italian region with the highest production of olive oil), while unitary ash discharge costs are assumed of 70 €/t ash (ash percentage in dry olive cake of 8% [1]), and other annual O&M costs (labour, spare parts, insurances, global maintenance service) are equal to 4% of CAPEX, in line with literature data [67,77,78].
The Levelized Cost of Energy, which is calculated assuming electric autoconsumption of CHP plant of 12%, results respectively of 208, 223 and 227 €/MWh for the cases EL, IND and RES. The energy revenues are calculated in light of the Italian support mechanism for RES [79] and in particular biomass electricity feed-in tariff equal to 246 €/MWh. Moreover, thermal energy selling price is assumed on the basis of avoided natural gas cost with purchase price respectively of 80 and 35 €/Nm3 for residential and industrial demand (estimates from Italian Energy Authority data for 2017). The financial appraisal of the investment is carried out assuming 20 years of operating life and the same duration of the electricity feed in tariff, no ‘re-powering’ throughout the lifetime nor decommissioning costs, discount rate of 5%, maintenance costs, fuel supply costs, electricity and heat selling prices held constant (in real 2017 values). Moreover, corporation tax is here neglected, while capital investments and income do not benefit from any further support except the feed-in tariff. 
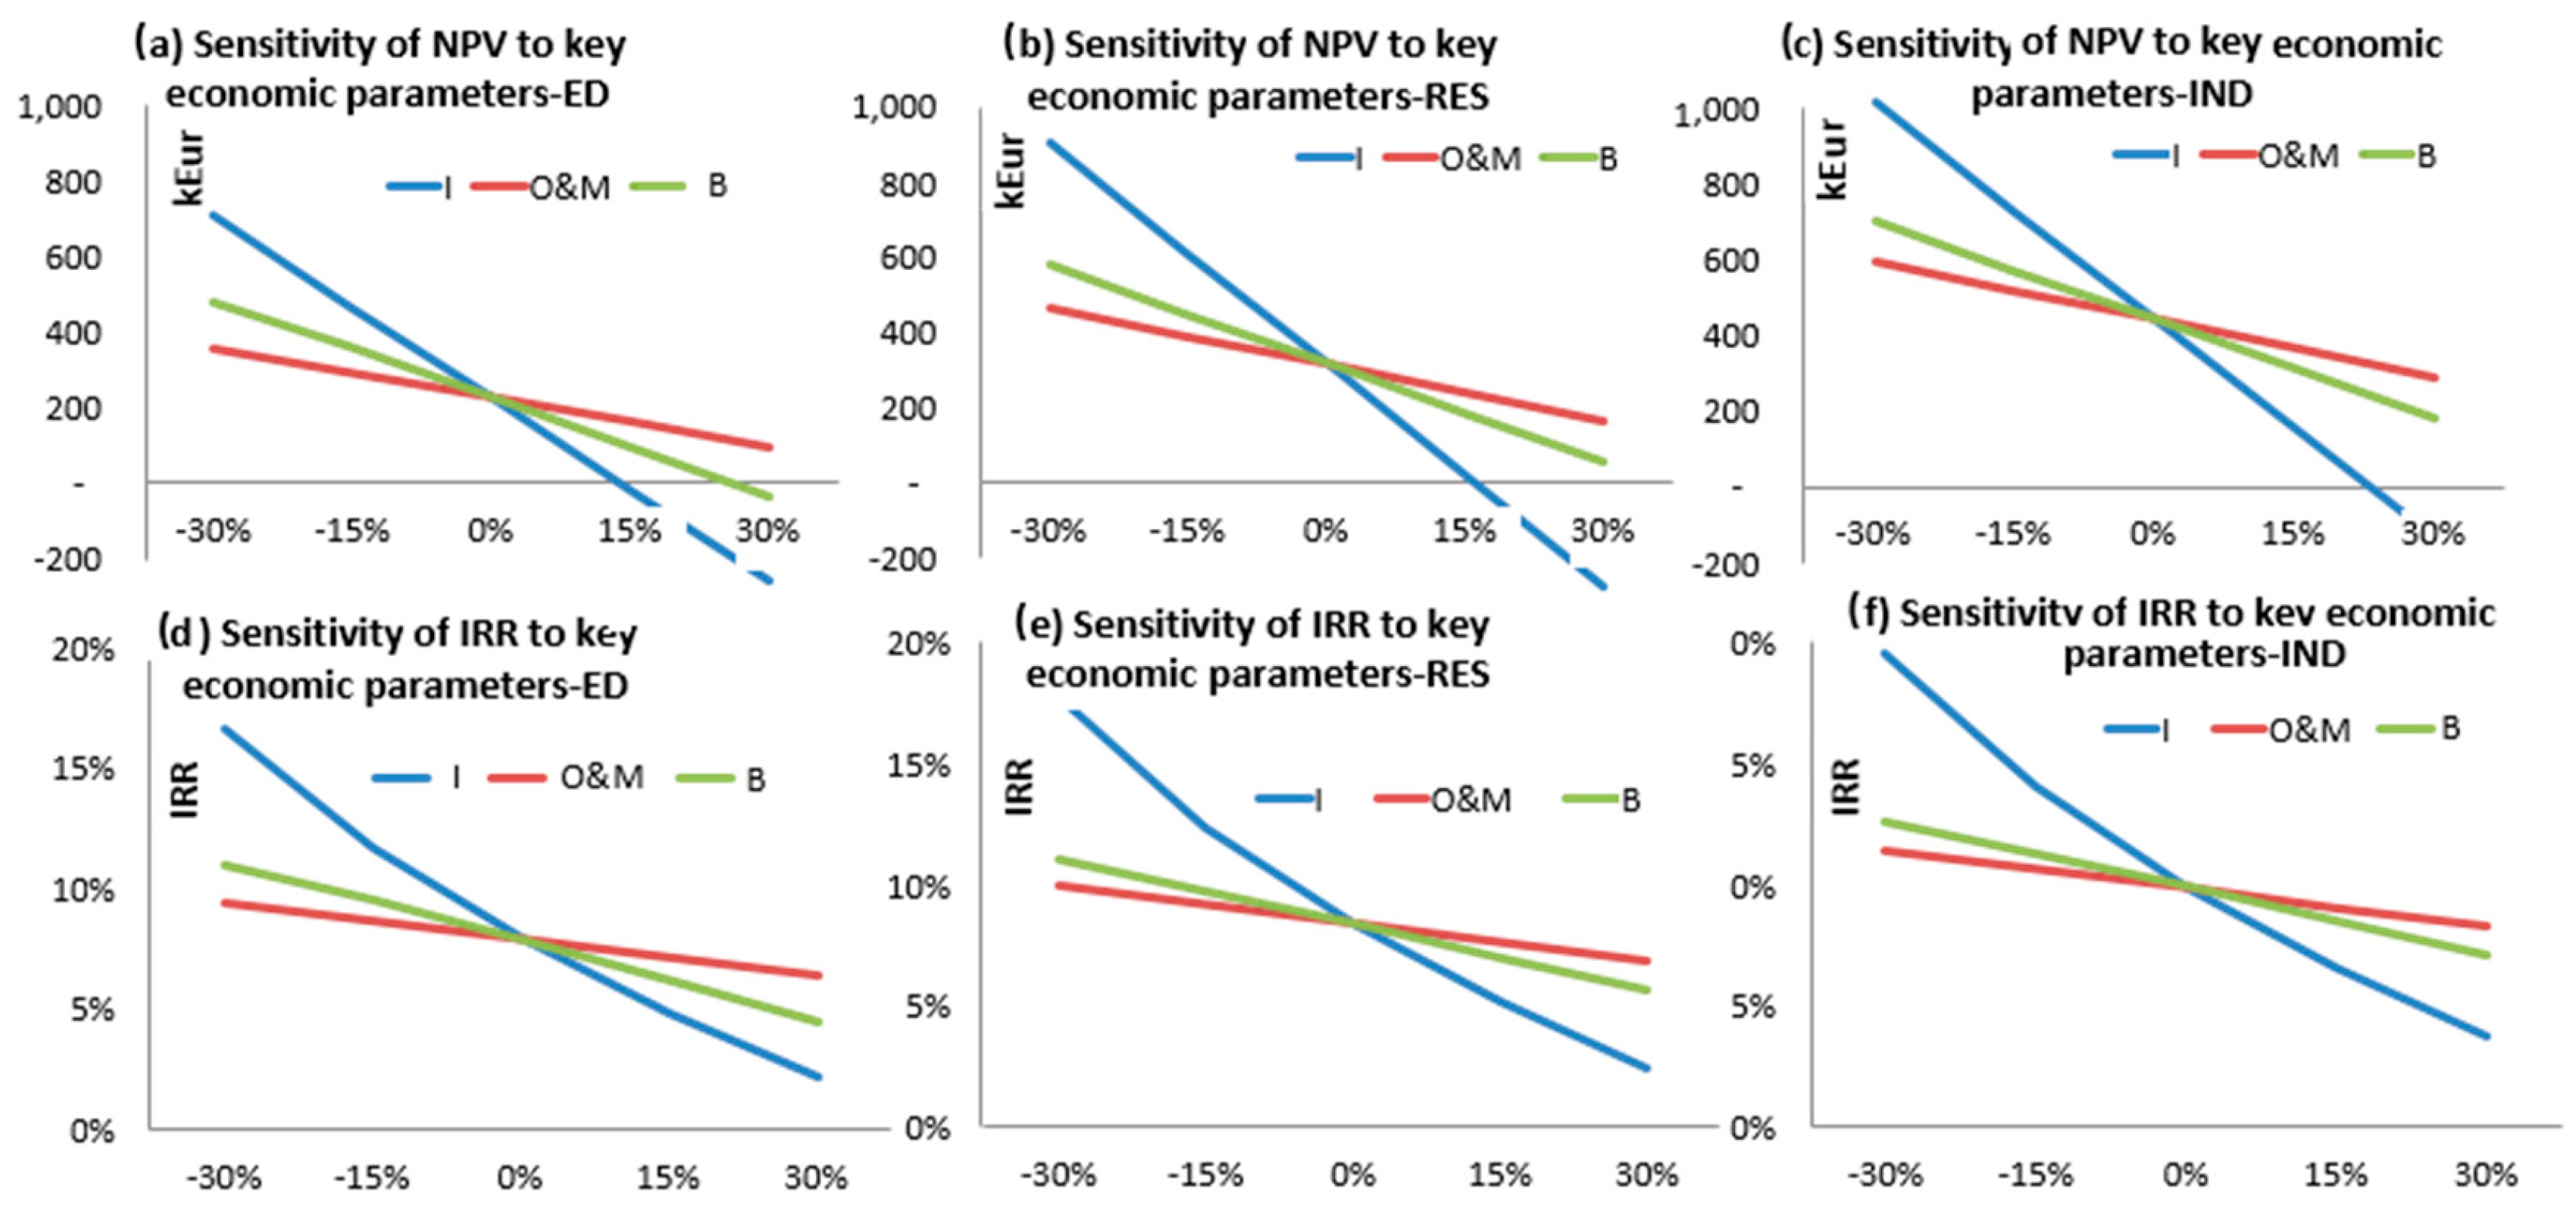
Figure 4 reports the results of the profitability analysis and the sensitivity to the three most influencing factors (the capex I, the biomass supply cost B and the operation and maintenance cost factor O&M, expressed as % of I. In the baseline scenario, Net Present Value (NPV) is positive and Internal rate of return (IRR) above 8% for all the considered energy demand and system operation typologies (ED, RES and IND).
As expected, the best results are obtained in Case IND where the highest revenues from thermal energy sales (because of the high thermal energy demand intensity) compensate the lower electric conversion efficiency and the higher investment cost in comparison to the other scenarios.

6. Conclusions

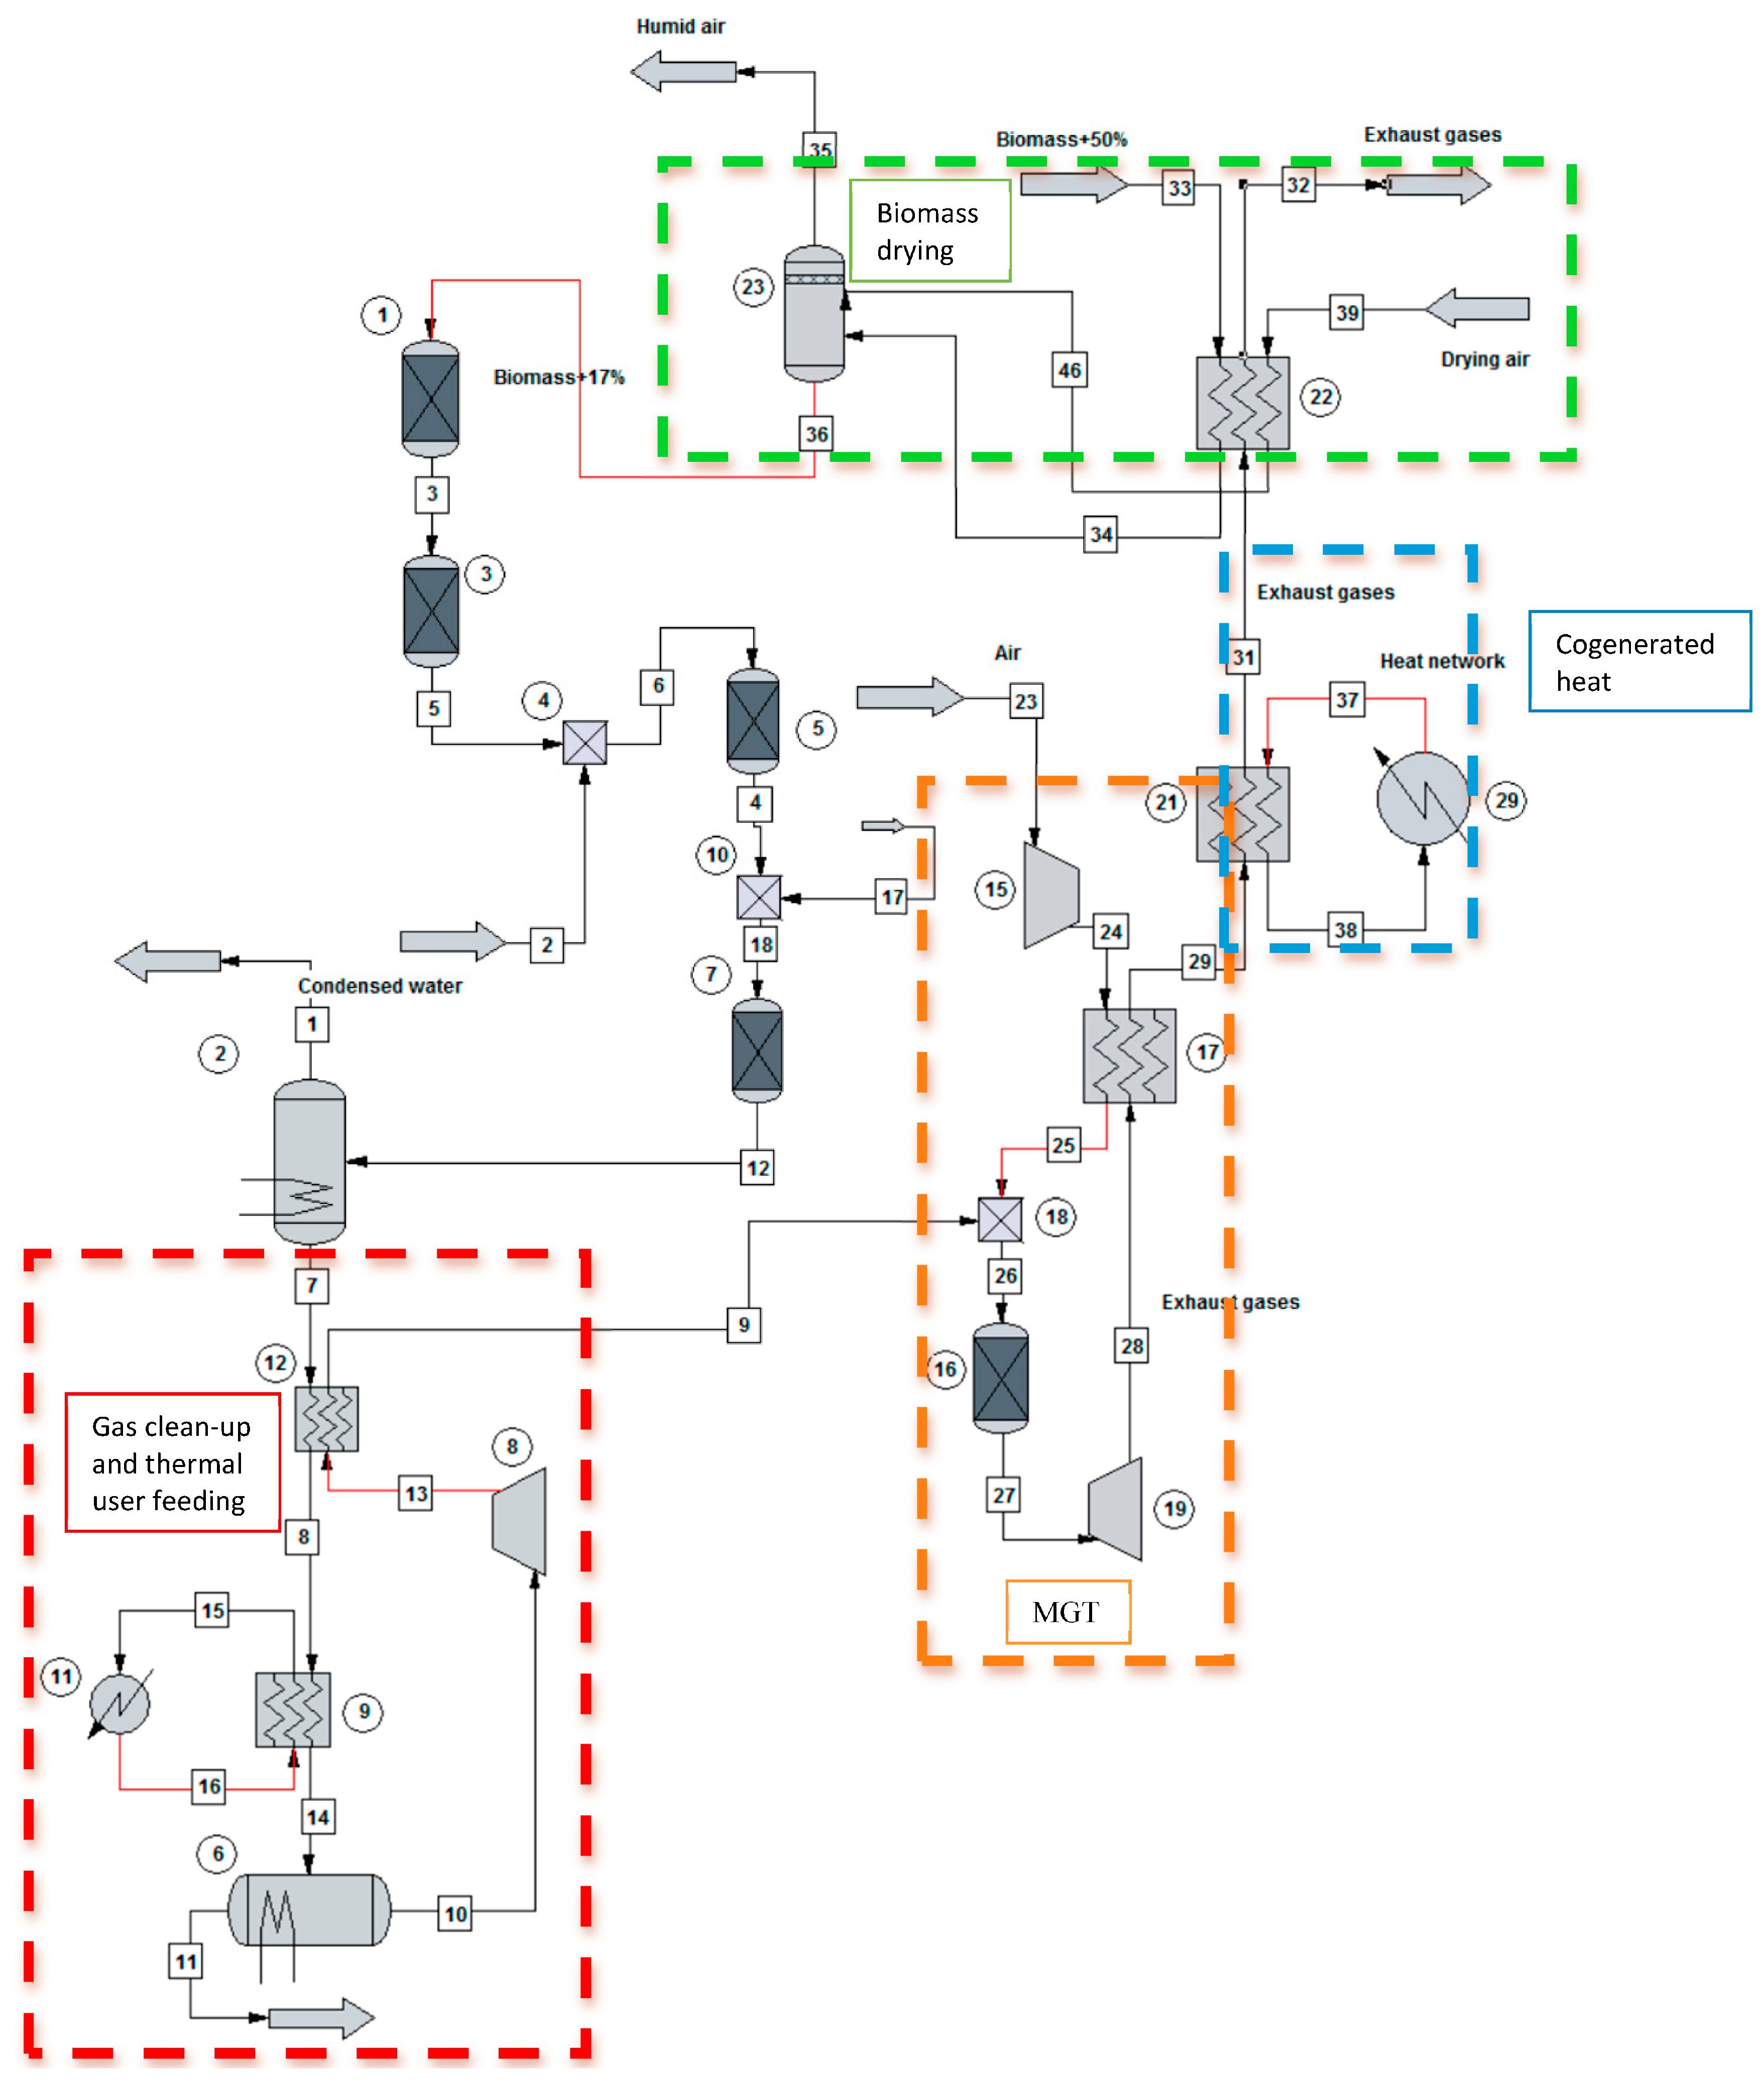
The coupling of an 800 kW updraft pomace gasifier to a MGT for CHP was modeled using ChemCad and the proposed model was validated with experimental data. The thermodynamic analysis demonstrated that, starting from a gasifier with thermal input size of 800 kW, an electric output power of 200 kW can be obtained, with a gross electric conversion efficiency of 25%, while the cogeneration section is able to provide 250 kW of thermal energy for low grade heat demand (90 °C) with 30% thermal efficiency. These results are aligned with literature data.
In order to assess the global conversion efficiency and the investment profitability, a thermo-economic analysis was also proposed, with different categories of energy end users for cogenerated heat, in order to evaluate the investment profitability and the sensitivity to the main cost items. The case studies of only electricity generation (ED), cogeneration for residential energy demand (RES) and cogeneration for industrial energy demand (IND) were analyzed, to assess the influence of thermal energy demand and cogeneration option on the investment profitability. When considering the feed-in tariff currently implemented in Italy, all the cases resulted profitable, with IRR around 8% for the baseline scenarios, and best economic indices were obtained when the CHP plant serves an industrial energy demand. However, a 15% increase of turnkey cost reduces significantly the investment profitability, with negative NPV, when only electricity is sold (case ED). In the case of cogeneration (both for industrial and residential heat demand), the investment is still profitable with an increase of investment cost up to 15% or increase of O&M or biomass supply cost up to 30%, proving that, in the scenario of industrial cogeneration with high thermal energy demand intensity, the quite low conversion efficiency of the biomass gasification plant is compensated by the high revenues from electricity sales with the feed in tariff and cogenerated heat sales to the end user.

Author Contributions

The contribution is equally divided among authors.

Conflicts of Interest

The authors declare no conflict of interest.

References

  1. Pantaleo, A.; Pellerano, A.; Carone, M.T. Olive residues to energy chains in the Apulia region. Part I. Biomass potentials and costs. J. Agric. Eng. 2009, 1, 1–11. [Google Scholar] [CrossRef]
  2. Alfano, G.; Belli, C.; Lustrato, G.; Ranalli, G. Pile composting of two-phase centrifuged olive husk residues: Technical solutions and quality of cured compost. Bioresour. Technol. 2008, 99, 4694–4701. [Google Scholar] [CrossRef] [PubMed]
  3. Alburquerque, J.A.; Gonzalvez, J.; Garcia, D.; Cegarra, J. Agrochemical characterisation of ‘‘alperujo’’, a solid by-product of the two-phase centrifugation method for olive oil extraction. Bioresour. Technol. 2004, 91, 195–200. [Google Scholar] [CrossRef]
  4. Caputo, A.C.; Scacchia, F.; Pelagagge, P.M. Disposal of by-products in olive oil industry: Waste-to-energy solutions. Appl. Therm. Eng. 2003, 23, 197–214. [Google Scholar] [CrossRef]
  5. Quaratino, D.; D’annibale, A.; Federici, F.; Cereti, C.F.; Rossini, F.; Fenice, M. Enzyme and fungal treatments and a combination thereof reduce olive mill wastewater phytotoxicity on Zea mays L. seeds. Chemosphere 2007, 66, 1627–1633. [Google Scholar] [CrossRef] [PubMed]
  6. Celma, A.R.; Rojas, S.; Lopez-Rodriguez, F. Industrial sludge processing for power purposes. Appl. Therm. Eng. 2008, 28, 745–753. [Google Scholar] [CrossRef]
  7. Pantaleo, A.; Pellerano, A.; Carone, M.T. Potentials and feasibility assessment of small scale CHP plants fired by energy crops in Puglia region (Italy). Biosyst. Eng. 2009, 102, 345–359. [Google Scholar] [CrossRef]
  8. Pantaleo, A.; Candelise, C.; Bauen, A.; Shah, N. ESCO business models for biomass heating and CHP: Profitability of ESCO operations in Italy and key factors assessment. Renew. Sustain. Energy Rev. 2014, 30, 237–253. [Google Scholar] [CrossRef]
  9. Pantaleo, A.M.; Camporeale, S.M.; Shah, N. Thermo-economic assessment of externally fired micro-gas turbine fired by natural gas and biomass: Applications in Italy. Energy Convers. Manag. 2013, 75, 202–213. [Google Scholar] [CrossRef]
  10. Pantaleo, A.M.; Camporeale, S.; Shah, N. Natural gas–biomass dual fuelled microturbines: Comparison of operating strategies in the Italian residential sector. Appl. Therm. Eng. 2014, 71, 686–696. [Google Scholar] [CrossRef]
  11. Di Carlo, A.; Borello, D.; Bocci, E. Process simulation of a hybrid SOFC/mGT and enriched air/steam fluidized bed gasifier power plant. Int. J. Hydrogen Energy 2013, 38, 5857–5874. [Google Scholar] [CrossRef]
  12. Schuster, G.; Loffler, G.; Weigl, K.; Hofbauer, H. Biomass steam gasification—An extensive parametric modeling study. Bioresour. Technol. 2001, 77, 71–79. [Google Scholar] [CrossRef]
  13. Bridgwater, A.V. The technical and economic feasibility of biomass gasification for power generation. Fuel 1994, 74, 631–653. [Google Scholar] [CrossRef]
  14. Borello, D.; De Caprariis, B.; De Filippis, P.; Marchegiani, A.; Shah, N.; Pantaleo, A.M. Thermo-Economic Assessment of a olive cake Gasifier for Cogeneration Applications. Energy Procedia 2015, 75, 252–258. [Google Scholar] [CrossRef]
  15. Fortunato, B.; Camporeale, S.; Fornarelli, F.; Torresi, M.; Pantaleo, A. A combined power plant fed by syngas produced in a downdraft gasifier. In Proceedings of the ASME Turbo-Expo, Seoul, Korea, 13–17 June 2016. [Google Scholar]
  16. Borello, D.; Cedola, L.; Meloni, R.; Venturini, P.; De Filippis, P.; de Caprariis, B.; Frangioni, G.V. A 3D packed bed model for biomass pyrolysis: Experimental tests and model calibration. Appl. Energy 2016, 164, 956–962. [Google Scholar] [CrossRef]
  17. Wang, L.; Weller, C.; Jones, D.; Hanna, M. Contemporary issues in thermal gasification of biomass and its application to electricity and fuel production. Biomass Bioenergy 2008, 32, 573–581. [Google Scholar] [CrossRef]
  18. Kirubakaran, V.; Sivaramakrishnan, V.; Nalini, R.; Sekar, T.; Premalatha, M.; Subramanian, P. A review on gasification of biomass. Renew. Sustain. Energy Rev. 2009, 13, 179–186. [Google Scholar] [CrossRef]
  19. Stassen, H.; Knoef, H. Small-Scale Gasification Systems; University of Twente Biomass Technology Group: Enschede, The Netherlands, 1993. [Google Scholar]
  20. Di Carlo, A.; Borello, D.; Sisinni, M.; Savuto, E.; Venturini, P.; Bocci, E.; Kuramoto, K. Reforming of tar contained in a raw fuel gas from biomass gasification using nickel-mayenite catalyst. Int. J. Hydrogen Energy 2015, 40, 9088–9909. [Google Scholar] [CrossRef]
  21. Balat, M.; Balat, M.; Kırtay, E.; Balat, H. Main routes for the thermo-conversion of biomass into fuels and chemicals. Part 2: Gasification systems. Energy Convers. Manag. 2009, 50, 3158–3168. [Google Scholar] [CrossRef]
  22. Pereira, E.G.; Da Silva, J.N.; De Oliveira, J.L.; MacHado, C.S. Sustainable energy: A review of gasification technologies. Renew. Sustain. Energy Rev. 2012, 16, 4753–4762. [Google Scholar] [CrossRef]
  23. Barman, N.S.; Ghosh, S.; De, S. Gasification of biomass in a fixed bed downdraft gasifier—A realistic model including tar. Bioresour. Technol. 2012, 107, 505–511. [Google Scholar] [CrossRef] [PubMed]
  24. Basu, P. Biomass Gasification and Pyrolysis: Practical Design and Theory; Elsevier: Cambridge, MA, USA, 2010. [Google Scholar]
  25. Göransson, K.; Söderlind, U.; He, J.; Zhang, W. Review of syngas production via biomass DFBGs. Renew. Sustain. Energy Rev. 2011, 15, 482–492. [Google Scholar] [CrossRef]
  26. Alauddin, Z.A.B.Z.; Lahijani, P.; Mohammadi, M.; Mohamed, A.R. Gasification of lignocellulosic biomass in fluidized beds for renewable energy development: A review. Renew. Sustain. Energy Rev. 2010, 14, 2852–2862. [Google Scholar] [CrossRef]
  27. Handbook of Biomass Downdraft Gasifier Engine Systems SERIISP-271-3022 DE88001135 March 1988 UC Category, 245. Available online: https://www.nrel.gov/docs/legosti/old/3022.pdf (accessed on 18 September 2017).
  28. McKendry, P. Energy production from biomass (Part 3): Gasification technologies. Bioresour. Technol. 2002, 83, 55–63. [Google Scholar] [CrossRef]
  29. Kirkels, A.F.; Verbong, G.P.J. Biomass gasification: Still promising? A 30-year global overview. Renew. Sustain. Energy Rev. 2011, 15, 471–481. [Google Scholar] [CrossRef]
  30. Chowdhury, R.; Bhattacharya, P.; Chakravarty, M. Modeling and simulation of a downdraft rice husk gasifier. Int. J. Energy Res. 1994, 18, 581–594. [Google Scholar] [CrossRef]
  31. Dupont, C.; Boissonnet, G.; Seiler, J.M.; Gauthier, P.; Schweich, D. Study about the kinetic processes of biomass steam gasification. Fuel 2007, 86, 32–40. [Google Scholar] [CrossRef]
  32. Kumar, A.; Jones, D.D.; Hanna, M.A. Thermochemical biomass gasification: A review of the current status of the technology. Energies 2009, 2, 556–581. [Google Scholar] [CrossRef]
  33. Wan Ab Karim Ghani, W.A.; Moghadam, R.A.; Mohd Salleh, M.A.; Alias, A.B. Air gasification of agricultural waste in a fluidized bed gasifier: Hydrogen production performance. Energies 2009, 2, 258–268. [Google Scholar] [CrossRef]
  34. Skoulou, V.; Koufodimos, G.; Samaras, Z.; Zabaniotou, A. Low temperature gasification of olive kernels in a 5-kW fluidized bed reactor for H2—Rich producer gas. Int. J. Hydrogen Energy 2008, 33, 6515–6524. [Google Scholar] [CrossRef]
  35. Zaccariello, L.; Mastellone, M.L. Fluidized-bed gasification of plastic waste, wood, and their blends with coal. Energies 2015, 8, 8052–8068. [Google Scholar] [CrossRef]
  36. Qian, K.; Kumar, A.; Patil, K.; Bellmer, D.; Wang, D.; Yuan, W.; Huhnke, R.L. Effects of biomass feedstocks and gasification conditions on the physiochemical properties of char. Energies 2013, 6, 3972–3986. [Google Scholar] [CrossRef]
  37. Gómez-Barea, A.; Arjona, R.; Ollero, P. Pilot-plant gasification of olive stone: A technical assessment. Energy Fuels 2005, 19, 598–605. [Google Scholar] [CrossRef]
  38. James, R.A.M.; Yuan, W.; Boyette, M.D. The Effect of Biomass Physical Properties on Top-Lit Updraft Gasification of Woodchips. Energies 2016, 9, 283. [Google Scholar] [CrossRef]
  39. Zambon, I.; Colosimo, F.; Monarca, D.; Cecchini, M.; Gallucci, F.; Proto, A.; Lord, R.; Colantoni, A. An innovative agro-forestry supply chain for residual biomass: Physicochemical characterisation of biochar from olive and hazelnut pellets. Energies 2016, 9, 526. [Google Scholar] [CrossRef] [Green Version]
  40. González-Vázquez, M.P.; García, R.; Pevida, C.; Rubiera, F. Optimization of a Bubbling Fluidized Bed Plant for Low-Temperature Gasification of Biomass. Energies 2017, 10, 306. [Google Scholar] [CrossRef]
  41. Di Blasi, C. Dynamic behaviour of stratified downdraft gasifiers. Chem. Eng. Sci. 2000, 55, 2931–2944. [Google Scholar] [CrossRef]
  42. Di Blasi, C.; Branca, C. Modeling a stratified downdraft wood gasifier with primary and secondary air entry. Fuel 2013, 104, 847–860. [Google Scholar] [CrossRef]
  43. Kaushal, P.; Proell, T.; Hofbauer, H. Application of a detailed mathematical model to the gasifier unit of the dual fluidized bed gasification plant. Biomass Bioenergy 2011, 35, 2491–2498. [Google Scholar] [CrossRef]
  44. Borello, D.; Di Carlo, A.; Marchegiani, A.; Tortora, E.; Rispoli, F. Experimental and Numerical Analysis of Steam-Oxygen Fluidized Gasifier Feeding a Combined SOFC/ORC Power Plant. In Proceedings of the ASME Turbo Expo 2013: Turbine Technical Conference and Exposition, San Antonio, TX, USA, 3–7 June 2013. [Google Scholar]
  45. Elmegaard, B.; Korving, A. Analysis of an integrated biomass gasification/combined cycle plant. In Proceedings of the ECOS Conference on Efficiency, Cost, Optimization, Simulation and Enviromental Aspects of Energy systems, Nancy, France, 8–10 June 1998; Volume 2, pp. 591–598. [Google Scholar]
  46. Roll, H.; Hedden, K. Entrained flow gasification of coarsely ground Chinese reed. Chem. Eng. Process. 1994, 33, 353–361. [Google Scholar] [CrossRef]
  47. Sharma, A.K. Equilibrium and kinetic modeling of char reduction reactions in a downdraft biomass gasifier: A comparison. Sol. Energy 2008, 82, 918–928. [Google Scholar] [CrossRef]
  48. Melgar, A.; Pérez, J.F.; Laget, H.; Horillo, A. Thermochemical equilibrium modelling of a gasifying process. Energy Convers. Manag. 2007, 48, 59–67. [Google Scholar] [CrossRef]
  49. Baruah, D.; Baruah, D.C. Modeling of biomass gasification: A review. Renew. Sustain. Energy Rev. 2014, 39, 806–815. [Google Scholar] [CrossRef]
  50. Puig-Arnavat, M.; Bruno, J.C.; Coronas, A. Review and analysis of biomass gasification models. Renew. Sustain. Energy Rev. 2010, 14, 2841–2851. [Google Scholar] [CrossRef]
  51. Ahmed, T.Y.; Ahmad, M.M.; Yusup, S.; Inayat, A.; Khan, Z. Mathematical and computational approaches for design of biomass gasification for hydrogen production: A review. Renew. Sustain. Energy Rev. 2012, 16, 2304–2315. [Google Scholar] [CrossRef]
  52. Gómez-Barea, A.; Leckner, B. Modeling of biomass gasification in fluidized bed. Prog. Energy Combust. Sci. 2010, 36, 444–509. [Google Scholar] [CrossRef]
  53. Altafini, C.R.; Wander, P.R.; Barreto, R.M. Prediction of the working parameters of a wood waste gasifier through an equilibrium model. Energy Convers. Manag. 2003, 44, 2763–2777. [Google Scholar] [CrossRef]
  54. Cycle-Tempo Software. Release 5 (TUDelft). Available online: http://www.asimptote.nl/software/cycle-tempo/ (accessed on 18 September 2017).
  55. Vera, D.; de Mena, B.; Jurado, F.; Schories, G. Study of a downdraft gasifier and gas engine fueled with olive oil industry wastes. Appl. Therm. Eng. 2013, 51, 119–129. [Google Scholar] [CrossRef]
  56. Vera, D.; Jurado, F.; Carpio, J. Study of a downdraft gasifier and externally fired gas turbine for olive oil industry wastes. Fuel Process. Technol. 2011, 92, 1970–1979. [Google Scholar] [CrossRef]
  57. Depoorter, V.; Olivella-Rosell, P.; Sudrià-Andreu, A.; Giral-Guardia, J.; Sumper, A. Simulation of a Small-Scale Electricity Generation System from Biomass Gasification. Available online: http://www.icrepq.com/icrepq’14/556.14-Depoorter.pdf (accessed on 18 September 2017).
  58. Zainal, Z.A.; Ali, R.; Lean, C.H.; Seetharamu, K.N. Prediction of performance of a downdraft gasifier using equilibrium modeling for different biomass materials. Energy Convers. Manag. 2001, 42, 1499–1515. [Google Scholar] [CrossRef]
  59. De Caprariis, B.; Bassano, C.; Deiana, P.; Palma, V.; Petrullo, A.; Scarsella, M.; De Filippis, P. Carbon dioxide reforming of tar during biomass gasification. Chem. Eng. Trans. 2014, 37, 97–102. [Google Scholar]
  60. De Caprariis, B.; Petrullo, A.; Scarsella, M.; De Filippis, P. Olive oil residue gasification and syngas integrated clean up system. Fuel 2015, 158, 705–710. [Google Scholar] [CrossRef]
  61. De Caprariis, B.; Bracciale, M.P.; De Filippis, P.; Hernandez, A.D.; Petrullo, A.; Scarsella, M. Steam reforming of tar model compounds over ni supported on CeO2 and mayenite. Can. J. Chem. Eng. 2017, 95, 1745–1751. [Google Scholar] [CrossRef]
  62. Begum, S.; Rasul, M.G.; Akbar, D.; Ramzan, N. Performance Analysis of an Integrated Fixed Bed Gasifier Model for Different Biomass Feedstocks. Energies 2013, 6, 6508–6524. [Google Scholar] [CrossRef]
  63. Vera, D.; Jurado, F.; Margaritis, N.K.; Grammelis, P. Experimental and economic study of a gasification plant fuelled with olive industry wastes. Energy Sustain. Dev. 2014, 23, 247–257. [Google Scholar] [CrossRef]
  64. Damartzis, T.; Michailos, S.; Zabaniotou, A. Energetic assessment of a combined heat and power integrated biomass gasification–internal combustion engine system by using Aspen Plus®. Fuel Process. Technol. 2012, 95, 37–44. [Google Scholar] [CrossRef]
  65. Lee, U.; Balu, E.; Chung, J. An experimental evaluation of an integrated biomass gasification and power generation system for distributed power applications. Appl. Energy 2013, 101, 699–708. [Google Scholar] [CrossRef]
  66. Pantaleo, A.; Pellerano, A.; Carone, M.T. Olive residues to energy chains in the Apulia region. Part II. Financial appraisal of energy conversion routes. J. Agric. Eng. 2009, 1, 12–19. [Google Scholar]
  67. Camporeale, S.M.; Pantaleo, A.M.; Ciliberti, P.D.; Fortunato, B. Cycle configuration analysis and techno-economic sensitivity of biomass externally fired gas turbine with bottoming ORC. Energy Convers. Manag. 2015, 105, 1239–1250. [Google Scholar] [CrossRef]
  68. Bio&Watt. Italy. Available online: www.bioewatt.com (accessed on 1 December 2016).
  69. Energy Life. Italy. Available online: www.energylifeindustry.it (accessed on 1 November 2017).
  70. Xylowatt SA. Belgium. Available online: http://www.xylowatt.com (accessed on 1 November 2017).
  71. Burkhardt Group. Germany. Available online: burkhardt-energy.com/ (accessed on 1 November 2017).
  72. AGT-Advanced Gasification Technologies. Italy. Available online: http://www.agtgasification.com (accessed on 1 November 2017).
  73. Ankur Scientific Energy Technologies. India. Available online: www.ankurscientific.com (accessed on 1 November 2017).
  74. Turbec-Ansaldo. Italy. Available online: http://www.turbec.com/ (accessed on 1 November 2017).
  75. Capstone. USA. Available online: www.capstoneturbine.com/ (accessed on 1 November 2017).
  76. Ingersoll-rand. Ireland. Available online: www.company.ingersollrand.com (accessed on 1 November 2017).
  77. International Renewable Energy Agency. Renewable Energy Technologies: Cost Analysis Series; IRENA: Abu Dhabi, UAE, 2012; Volume 1, 274p. [Google Scholar]
  78. Marano, J.J.; Ciferno, J.P. Benchmarking Biomass Gasification Technologies for Fuels, Chemicals and Hydrogen Production. Available online: http://citeseerx.ist.psu.edu/viewdoc/download?doi=10.1.1.140.8405&rep=rep1&type=pdf (accessed on 18 September 2017).
  79. Legislative Decree of 23-6-2016 on Support Mechanism for RES in Italy. Available online: http://www.gazzettaufficiale.it/eli/id/2016/06/29/16A04832/sg (accessed on 10 January 2017).
Figure 1. ChemCad layout. Legend of components (circles): 1. Tar Separation; 2. Cyclone; 3. Pyrolyzer; 4. Air-biomass mixer; 5. Gasification reactor; 6. Low temperature cleanup and water removal; 7. Tar reformer; 8. Syngas compressor; 9. Heat exchanger/thermal user feeding n.1; 10. Air Gas mixer; 11. Thermal user n.1; 12. Heat exchanger/rigenerator; 15. Air compressor; 16. Combustor; 17. Heat exchanger and MGT regenerator; 18. Compressed air and syngas mixer; 19. Turbine and power generation; 21. Heat exchanger/thermal user feeding n.2; 22. Heat exchanger/de-humidification air dryer; 23. Wet separator; 29. Thermal user n.2. (only the numbers of the Figure which are correspondent to specific components are reported in the legend).
Energies 10 01930 g001
Figure 2. Flow chart of the ChemCad model of the gasifier.
Energies 10 01930 g002
Figure 3. CAPEX breakdown for the three case studies Total investment cost is respectively 864–1064 and 1114 k€ for EL, IND and RES (specific investment cost 4.32–5.32 and 5.07 €/kW).
Energies 10 01930 g003
Figure 4. Results of the economic analysis and sensitivity of investment to to investment cost (I), operation and manteinance factor (O&M) and biomass supply cost (B). From top left to bottom right: sensitivity of NPV for the only electricity case (a); sensitivity of NPV for the residential heat demand case (b); sensitivity of NPV for the industrial heat demand case (c); sensitivity of IRR for the only electricity case (d); sensitivity of IRR for the residential heat demand case (e); sensitivity of IRR for the industrial heat demand (f).
Energies 10 01930 g004
Table 1. Tar elemental composition as from the experimental test.
Element% Weight
C56.13
H6.45
N<0.01
O37.42
Table 2. Dried biomass entering the gasifier.
ParameterBiomassWaterTar
Mass flow (kg/h)137.8627.8225.77
Mass Fraction0.720.150.13
Table 3. Biomass composition out from the tar separation reactor.
ParameterWaterTarN2H2COCO2CH4C
Mass flow (kg/h)70.7725.772.451.640.4142.555.7341.73
Mass fraction0.370.130.010.010.000.220.030.22
Table 4. Char gasification.
ParameterWaterTarN2H2COCO2CH4C
Mass flow (kg/h)39.2725.77135.824.9173.2376.095.731.23
Mass fraction0.110.070.380.010.200.210.020.00
Table 5. Comparison between experimental data and model results at the reformer exit. The data are reported in mol % N2 free and dry basis.
ResultsH2COCO2CH4
Experimental [61]26.249.322.42.1
Model30.641.723.53.9
Table 6. Syngas parameters.
HE 12SyngasCompressed Syngas
Mass Flow (kg/h)446.32404.59
T inlet (°C)850242
T outlet (°C)380799
HE 9SyngasHot Water
Mass Flow (kg/h)446.322168.18
T inlet (°C)38070
T outlet (°C)7990
Table 7. Compressors’ performance.
ParametersCompressor 8Compressor 15
Mass flow (kg/h)404.594090.91
Power (kW)29.45240.96
P outlet (bar)55
T outlet (°C)242222
Efficiency0.750.77
Table 8. Compressed air preheating process.
HE 17Compressed AirExhaust Gases
Mass Flow (kg/h)4090.914495.50
T inlet (°C)222683
T outlet (°C)604350
Total Power (kW)284.51
Table 9. Combustor exit flue gas composition.
ParametersWaterN2H2COCO2CH4O2
Mass flow (kg/h)70.843340.250.000.00259.990.00824.42
Mass fraction0.020.74000.0600.18
Table 10. Turbine performance as from the modeling results.
ParametersTurbine
Mass flow (kg/h)4495.5
Power (kW)483.13
P outlet (bar)1.1
T outlet (°C) 683
Efficiency %0.83
Net plant power (kW)212.73
Table 11. Thermal energy production as from the modeling results.
HE 21Exhaust GasesHot Water
Mass Flow (kg/h)4495.5011454.55
T inlet (°C)35070
T outlet (°C)14790
HE 22Exhaust GasesDrying Air
Mass Flow (kg/h)4495.50965.13
T inlet (°C)14715
T outlet (°C)14045

