Energy Poverty in China: A Dynamic Analysis Based on a Hybrid Panel Data Decision Model


1
College of Resources and Safety Engineering, China University of Mining and Technology (Beijing), Beijing 100083, China
2
Beijing Key Laboratory for Precise Mining of Intergrown Energy and Resources, China University of Mining and Technology (Beijing), Beijing 100083, China
3
Center for Energy and Environmental Policy Research, Beijing Institute of Technology, Beijing 100081, China
4
School of Management and Economics, Beijing Institute of Technology, Beijing 100081, China
5
Donlinks School of Economics and Management, University of Science and Technology Beijing, Beijing 100083, China
*
Authors to whom correspondence should be addressed.
Energies 2017, 10(12), 1942; https://doi.org/10.3390/en10121942
Submission received: 6 October 2017
/
Revised: 14 November 2017
/
Accepted: 20 November 2017
/
Published: 23 November 2017
Abstract
:Renewable energy can help to tackle energy poverty issues of the availability of modern energy services and the sustainability of energy supply. Based on the concept of the Energy Development Index, published by International Energy Agency, this paper builds the clean energy development index and applies the Grey incidence decision method to analyze regional energy poverty issues in China. A model using panel data investigates the influencing factors that are governing energy poverty alleviation and the relationship between energy poverty and social development. The improved index system not only considers the access to modern energy services, but also addresses the cleanliness of energy supply and the transition to clean energy consumption for cooking. The results indicate that due to insufficient clean energy development, China’s Northeast and West regions have experienced increasing energy poverty problems, while energy poverty in the Southwest region has improved considerably because of its renewable energy development. Urbanization, affordability, and renewable energy development can increase access to modern energy services, contributing to energy poverty alleviation. However, the role of rural household consumption levels in energy poverty alleviation should be considered in rural energy policy.
1. Introduction
Energy poverty is a status of poor access to modern energy services. These services are usually explained as household access to electricity and clean cooking facilities [1]. The insufficient access to modern energy services is a serious hindrance to economic and social development, and should be overcome if United Nations Millennium Development Goals are to be achieved. The follow-up action of Millennium Development Goals is the recent UN Sustainable Development Goals. The seventh sustainable development goal suggests the target on universal access to affordable, reliable, and modern energy services as the core of energy poverty alleviation [2]. In order to promote the countries to achieve access to modern energy services, International Energy Agency (IEA) also presented an Energy Development Index (EDI), which was designed as a composite measure of a country’s progress in the transition to modern energy services [1]. Its first edition (EDI-2004) contained three dimensions: per capita commercial energy consumption; share of commercial energy in total final energy use; and, share of population with access to electricity [3]. In 2012, IEA improved EDI by adding another two indicators (energy use for public services and for productive use) and calculated the new EDI-2012 for 80 countries, to aid policy makers in tracking progress towards modern energy access [1]. As an efficient and well-known tool to measure energy development, EDI can reflect country’s achievements in transitioning to modern fuels and clean energy services.
Based on IEA World Energy Outlook 2012, China has achieved universal access to electricity and the main energy poverty problem was the high proportion of traditional biomass use in cooking and heating. This indicates that China has experienced an improvement in energy poverty reduction. However, the imbalance in regional energy development, the severe energy poverty situation in rural areas and the quality, and the cleanliness of energy services still baffle the authorities in dealing with the energy development in China [4]. With the prominence of environmental issues and the improvement in living standards, the hope for clean and sustainable energy services, not the dominant position of coal use for electricity, nowadays becomes more urgent. Rural energy development is central to energy poverty alleviation in China. State Council of China officially released its second energy policy-related white paper since 1991 in October 2012, which demonstrated the increased significance of renewables in the context of rural development. In 2017, State Council of China released its No.1 central document to underline rural renewable energy development and enlarge clean energy supply [5]. National Energy Administration announced the by-laws on the photovoltaic development plan for rural poverty alleviation [6]. This reality requires the adjustments and improvements of research framework for regional energy poverty assessment in China.
The previous studies tracked the energy poverty problems from the measurement of energy poverty. The energy poverty situation of Nepal was investigated by measuring the availability of energy end-use devices and the minimum energy requirement, and the role of renewable energy technology innovation was highlighted in energy poverty alleviation [7]. After reviewing the adequacy and applicability of existing methods to measure energy poverty, basic household needs for energy services were suggested to measure energy poverty in Africa [8]. Some scholars think that a distinction between the rural households which faced energy poverty and those who are income poor should be considered in energy poverty measurement [9]. Other researchers recommended that sustainable development-centered investment was an important measurement of energy poverty [10]. Andadari et al. (2014) discussed the impact of a large LPG program for energy poverty alleviation in Indonesia and explained the role of energy infrastructure in coping with extreme energy poverty [11]. It can be seen from these measurements of energy poverty that the framework of regional energy poverty assessment should coincide with the stage or context of energy development and the cleanliness and sustainability of energy supply should be considered.
However, the issue of energy poverty is relatively novel in China because energy researches in past decade are primarily focused on how to support economic growth. Recent energy poverty researches are increasing along with the huge requirement for modern energy services. With the investigation on the features of energy poverty in China, Li et al. (2011) concludes that the severe respiratory disease caused by traditional use of biomass and puts forward clean energy development in rural China [12]. Wei et al. (2014) systematically analyzed the energy poverty issues in China from the aspects of the origins of energy poverty, energy poverty measurement, the features of energy poverty in China, and the health effects of energy poverty [4]. Li et al. (2014) clarified the differences and relationships between energy poverty and fuel poverty, and describes the application scope of each concept [13]. Also, solid fuel (including coal and biomass) use for cooking in rural China is considered as an energy poverty problem by evaluating its current situation and long-term trend while infrastructure construction on clean energy supply is suggested as a proper measure to solve this issue [14]. Comprehensive index system, including energy service availability, energy consumption cleanliness, energy management completeness, and household energy affordability and energy efficiency, has been suggested for measurement of energy poverty in the context of China [15]. Renewable and clean energy development not only helps to meet energy supply and safeguard energy security, but also offers an unprecedented chance to promote the transition to modern energy services in rural areas. Renewables resource base is quite sufficient to meet the present global energy demand several times [16,17], while it also has a huge potential to supply modern energy services in rural areas [18,19]. Therefore, to build a more sustainable and environment-friendly framework to assess regional energy development in China it is crucial to track energy progress in China, which could lead to poverty alleviation and economic development in a clean manner.
Based on the framework of EDI and data availability, this paper attempts to establish a clean energy development index, which considers the reality of China’s energy system and combines renewables and rural energy development within general indicators of EDI. Regional clean energy development assessment will be analyzed by the Grey incidence decision method to put forward suggestions for promoting the crucial role of renewables in achieving the target of modern energy access. Furthermore, panel data model is employed to study the influencing factors that are governing the energy poverty alleviation. The method employed in this research is novel in integrated innovation of GID and Panel data model, which is targeted on the evaluation of energy poverty situation and finding the pathways for energy poverty alleviation in the context of China. Thus, the results may be helpful to identify challenges and opportunities for mitigating energy poverty and shed some light on China’s future energy development. This paper attempts to address three issues:
- (1)
- How does the framework of energy poverty assessment evolve with assessment at regional level?
- (2)
- What are regional differences of energy poverty in China, and what are the trends for energy poverty situation in different areas?
- (3)
- What are the influencing factors for energy poverty alleviation? Or what is the solution for energy poverty alleviation in China?
The rest of this paper is organized as follows. The theoretical framework, methods, and data resources supporting the regional energy poverty analysis are explained in Section 2, while the results and discussion are presented in Section 3. Finally, Section 4 outlines the concluding remarks and policy implications. This last part also highlights the contributions that the present study seeks to make, as well as suggestions for future research.
2. Methodologies
2.1. Conceptual Framework for Regional Clean Energy Development Analysis
The latest EDI of IEA measured 80 countries’ energy development at the household and community level [1]. Five indicators are chosen as follows: (1) share of population with electricity access; (2) per-capita residential electricity consumption; (3) share of modern fuels in the residential sector; (4) per-capita public sector electricity consumption; and, (5) share of industry, agriculture, services, transport, and other non-specified energy use in total final energy consumption. The Geometric Mean Method is used to combine the first two indicators to measure the development of power system in the residential sector. In view of the IEA’s EDI framework, this paper establishes the framework to analyze China’s regional energy poverty from the perspective of clean energy development, as shown in Figure 1.
First, IEA described five characteristics to measure energy development: availability, affordability, adequacy, convenience, and reliability. This paper discusses the issue of clean energy development based on these five attributes. Provided that there are some differences between fuel poverty and energy poverty, as explained by [13], some measurements of fuel poverty could be referred, such as affordability [20,21].
Second, according to the World Energy Outlook 2012 from IEA, the status of energy poverty in China can be described as follows: the percentage of electricity access in China is close to 100% and 29% (387 million) of the population adopt traditional biomass for cooking and heating, which becomes the main problem of energy poverty. What is more, energy poverty usually roots in rural areas and the quality and cleanliness of energy services are not considered. Thus, more appropriate indicator for rural energy development and renewable energy development is required to indicate the actual status of China’s current energy poverty problem.
Finally, the improvement of China’s statistics in recent years has made more detailed indicators available. The indicators of renewable energy and the quality of energy supply can be merged into the research framework of energy poverty, contributing to a more adequate framework to address energy poverty.
As shown in Figure 1, the improved framework not only includes the common indicators that are used in the EDI, such as the electricity consumption per capita and the proportion of modern energy that is used in the residential sector, but also introduces the renewable energy development indicators. Therefore, it is called as “clean energy development index”. When combined with the actual situation of China’s energy development, the clean energy development index inherits and develops the characteristics of EDI and makes the following improvements: (1) The percentage of electricity access is removed because of the rate being close to 100%; (2) The indicators of per capita electricity consumption and the proportion of energy consumption in the production sector in the original EDI remain unchanged; (3) The proportion of modern energy in the residential sector is replaced by the share of heating and electricity energy in final energy consumption; (4) Because the electricity access rate is close to 100%, the quality of electricity services is indicated by the power grid construction and investment in power market, specified by the electricity investment per unit area and the length of power transmission lines per unit area; and, (5) The clean energy development index is extended from two aspects: renewable energy investment and renewable energy utilization.
2.2. Grey Incidence Decision Analysis for Regional Energy Poverty Assessment
The Grey system theory, as first developed by Deng (1990) [22], is an increasingly accepted technique to handle the problems with poor information [23,24]. This paper develops the Grey incidence decision model by introducing the core of TOPSIS (the Technique for Order Preference by Similarity to Ideal Solution) method [25,26]. The improved Grey incidence decision technique for regional energy poverty assessment in China is carried out as follows:
The primary model for Grey incidence decisions can be found in Liu and Lin (2011) [27]. This paper will introduce the key concept of this method: the absolute degree of Grey incidence and the selection of imagined optimum effect vector.
The absolute degree of Grey incidence can be depicted as follows.
- (1)
- Supposing that data series for each province are collected, is the initial data series of province , and (Equation (1)) are the initial annihilation image of , between which is the initial annihilation operator (Equation (2)). Thus, the concept could be obtained for step 2.
- (2)
- Provided that the data series of two provinces are displayed as , , they have the initial annihilation image of and , namely and , respectively.
If , , the ratio can be named as the absolute degree of grey incidence between and .
The selection of imagined optimum effect vector is to find the ideal solution with all the best indicators. For example, when the indicator is an index satisfying that the greater the value the better, the maximum value will be chosen.
The original Grey incidence decision method makes decisions according to the absolute degree of grey incidence that is between the target object and the imagined optimum effect vector object. As for the core of TOPSIS, its basic principle assumes that the chosen good example should simultaneously have the shortest distance with the positive-ideal solution and the farthest distance with the negative-ideal solution [23]. Based on the core of TOPSIS, this paper defines the positive ideal object (same as the imagined optimum effect vector object) and the negative ideal object (the object with all the worst indicators). Regional energy poverty situation is evaluated according to the absolute degrees of grey incidence between the target object and the positive ideal object, as well as the negative ideal one. That is to say that the chosen alternative region should simultaneously have a higher absolute degree with the positive-ideal solution and a lower absolute degree with the negative-ideal solution, shown as the in Equation (3). and is the absolute degree of region with the positive solution and the negative solution, respectively. The absolute degree of grey incidence is calculated by the Grey Theory Modeling Software (GTMS) 3.0.
2.3. Panel Data Model for Influence Factors of Energy Poverty
The panel data model is applied to research the influencing factors that are dominating the energy poverty alleviation in China. This paper just applies the static panel data model and uses the pooled ordinary least square (POLS) estimator and ordinary least square estimator with fixed effects (FE) for comparison, which is widely used by energy policy research [28,29]. Random effects (RE) estimator assumes that individual effects have no relationship with the selected variables and the Hausman test is applied to justify how to choose the estimators. Hausman test is specialized in testing the correlated random effects including cross-section random, period random, and the joint one.
The possible impact variables of energy poverty are chosen in accordance with economic theory and data availability. As is standard in energy development models, income is measured using two variables: the increase rate of per capita real GDP and the growth rate of household consumption expenditures in rural areas [1,3]. The processes of urbanization and industrialization are included because of their profound effect on the convenience and accessibility of modern energy access [8,30]. The affordability of modern energy services is measured by the percentage of electricity expenditure in income [14,31]. As the aim of this paper is the clean energy development, the percentage of hydropower, wind power, and solar energy utilization in power generation is used as the cleanliness of energy services [14,32]. Some literatures offer optional measurements for these variables [33,34,35].
For each region, a linear relationship between the energy poverty score (calculated by Grey incidence decision model) and the various explanatory variables of income, affordability, urbanization, industrialization, rural household expenditures, and renewable energy utilization is initially postulated in Equation (4) and calculated by the EViews 7. Three tests (F test, Hausman test, and Durbin-Watson test) are referred for the selection of the appropriate estimators.
where subscripts i, t, and superscript represent the province, time, and the six factors that are considered in the model, respectively. All of the variables are expressed in proportions, unless otherwise stated. The design of the Equation (4), especially applying the ratios to represent the six variables, can handle the shortage of not considering the interaction effect between multiple factors and can deal with the problem of endogeneity.
2.4. Data Resources
Table 1 explains the definition, unit, and data resource of each index that is used in this model. After the standard normalization, the values of six indicators are obtained and the Grey incidence decision method is applied to generate the clean energy development index score. Among them, data of the power transmission line [36], the proportion of renewable energy generation, and annual utilization hours of renewable energy equipment come from the China Electric Power Yearbook [37]. The energy data is from the China Energy Statistical Yearbook [38]. The data of renewable energy is extracted from the China Statistical Yearbook on Environment [39], and the data of population and area in each region come from China Statistical Yearbook [40]. The GDP is measured by billion yuan in 2005 constant price. In addition, since some data of Hong Kong, Macao, Taiwan, Tibet, and Shanghai are missing, the other 29 provinces are chosen as the research area. The study period in this paper begins in 2005 and ends in 2011.
3. Results Analysis and Discussion
3.1. Regional Differences of Energy Poverty in China
Table 2 contains the regional energy poverty scores in China. From Table 2, the increase of the minimum energy poverty value indicates that there is an improvement in the region facing serious energy poverty. The results from [15] also point out the gradual energy poverty alleviation at national level. Furthermore, the region with the lowest energy poverty score has been changed from Inner Mongolia to Xinjiang, Qinghai. This is different from the results of Wang et al. (2015). Their explanations rely on the bad performance of energy consumption cleanliness. When checking on their measurement of energy consumption cleanliness, the indicator of percentage of non-hydropower generation could be replaced by percentage of non-hydropower electricity consumption. After obtaining the regional energy poverty scores between 2005 and 2011, this paper averages the scores for each region to figure out which area experienced serious energy poverty problems.
As shown in Figure 2, energy poverty problems root in the Northeast and Northwest part of China. With rapid energy development in the Central and East China, they are relatively easy to obtain modern energy services. Due to the role of investment in energy access, energy poverty, an issue of energy development, is closely associated with social and economic development. Figure 2 also demonstrates the relationship between energy poverty and economic development. In addition, the Southwest part of China is evaluated as a region with clean energy development, which coincides with the renewable energy development in these regions. The good performance in Beijing, Tianjin, Sichuan, and Guangxi is supported by the results from Wang and his colleagues [15]. The reason may be that the structure of residential energy consumption in the four regions is sustainable, when compared with other Chinese provinces.
3.2. Trends of Energy Poverty Situation in China
While each region experienced different energy poverty problems, the trends of regional energy poverty situation are totally distinct. The red ellipse in Figure 3 reveals that the Northeast and Northwest part of China faced serious energy poverty problems, which are consistent with the results from Figure 2. The energy poverty situation in the Northeast China has previously been identified as problematic in researches of [14,15]. Solid fuels take large part of rural households’ primary cooking fuel use in the Northeast China [14].
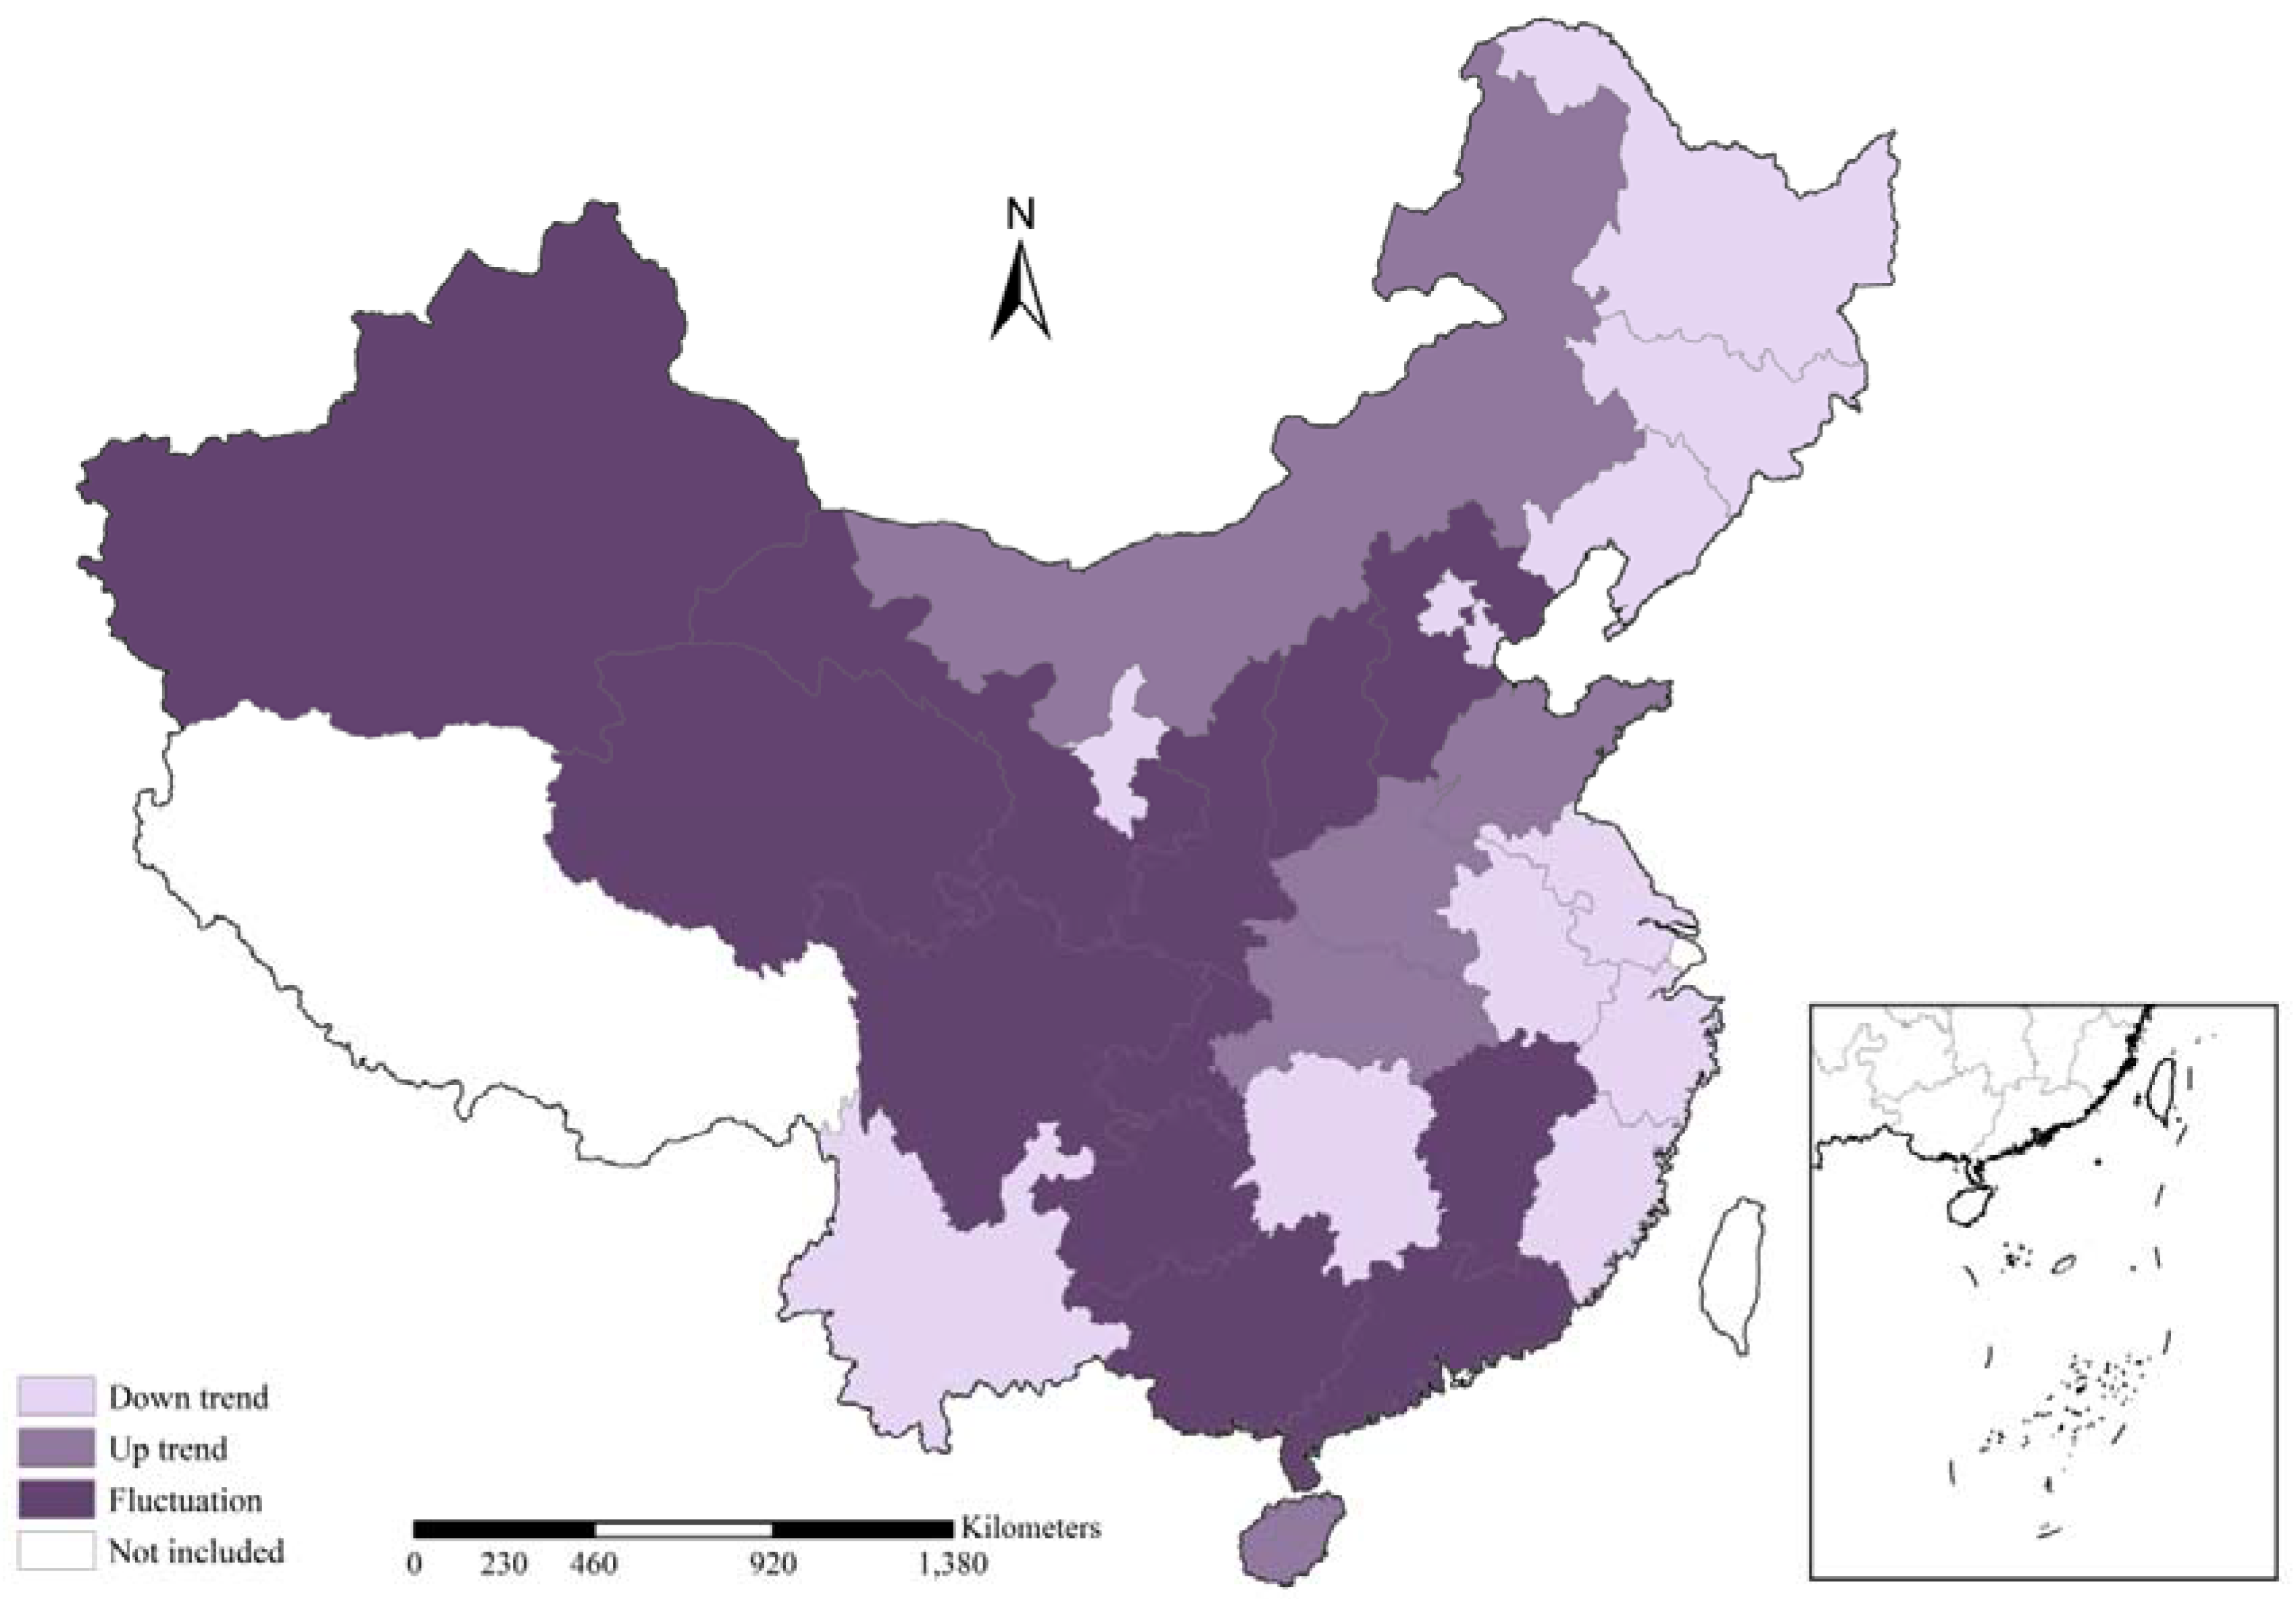
When the serious energy poverty problems root in Northwest and Northeast part of China, the development trends in these regions are different. As shown in Figure 4, Inner Mongolia experienced rapid energy development, while an obvious down trend of energy poverty scores happened in the Northeast of China (Heilongjiang, Jilin, and Liaoning). This down trend is consistent with the bad performance results of household affordability in Northeast China by [15]. On the whole, the Northwest part of China (Xinjiang, Qinghai, and Gansu) experienced a fluctuating but descending drift. Furthermore, Yunnan province (Southwest) has an obvious down trend, while other provinces in the Southwest region also present a slight slump in energy poverty scores, such as Sichuan, Guizhou, and Guangxi.
3.3. Influencing Factors for Energy Poverty Alleviation
Actually, energy poverty is an issue of energy development. This paper chooses six factors that are relevant for energy poverty, which are closely related to energy development. Each parameter has its own specific meaning in the composition of energy poverty score. Urbanization and industrialization represent the social development process, which are directly related to the deployment of modern energy services. The income and rural household consumption expenditure are the indexes of the ability for access to energy services. The affordability stands for the burden on the shoulder of residents in each region. Renewable energy utilization reflects the cleanliness of energy services. Table 3 denotes the definition and calculation of these indicators. All of the variables are presented as a percentage, such as urbanization rate, industrialization rate, and the increase rate of income, etc. This data processing can help with the explanation of the regression coefficient. Hausman test is employed in choosing the estimators. The results from Hausman test show that Chi-square statistics for cross-section random, period random, and the joint one are 3.297 *, 6.941 ** and 8.169 **, respectively, which reach 10% statistical significance (** p < 0.05, * p < 0.10). The results indicate that there are an obvious time period fixed effects and the slight significance in cross-section fixed effects. Thus, POLS and FE estimators are sourced in the analysis.
The results from the panel data regression model are presented in Table 4. It can be seen that The F-values of the regression analysis are 18.692 and 9.310 for POLS and FE, respectively, which passed the test, while Durbin-Watson statistic are 1.472 and 1.687 for sample test in POLS and FE estimators. Because the energy poverty is a complex combination of ten sub-indexes, the model does not fit the data well, with a relatively lower R2 coefficient. This fact is a general phenomenon for the use of secondary data analysis, which is usual in similar research [28]. Robustness test for model description has been displayed in Table 4. Because this research is to verify the role of renewables in energy poverty alleviation, the emphasis of Model 1 and Model 2 is on the robustness of the variable of and its relationship with final energy poverty score.
Results show that urbanization, the ability to pay the electricity bill (affordability), and renewable energy utilization have a positive and significant impact on energy poverty. These results also support the assertion that along with the urbanization process, the people living in urban areas will have easy access to modern energy services. The results for the role of urbanization coincided with these outcomes from [20]. The percentage of electricity bills in income is negatively related with energy poverty scores, suggesting the positive effect of the affordability in energy poverty. That is to say, the higher the affordability, the lower the possibility of energy poverty problems.
The industrialization has a negative effect on energy poverty mitigation, while rural household consumption expenditure has a negative and significant relationship with energy poverty alleviation. Generally speaking, the industrialization process will inevitably consume more energy resources in the second industry, resulting in the energy development at a community level. However, this process may also cause the scarcity of energy supply in the residential sector. This dual effect will determine the impact of industrialization on energy poverty alleviation. Regression results point out the negative influence of industrialization on energy poverty in China. Furthermore, because the energy poverty issues root in the rural areas of China, rural household consumption expenditure should be positively correlated with energy poverty mitigation. With a further investigation, this unsupportive fact resulted from the lower share of expenditure for energy poverty alleviation in the structure of rural household consumption. The share of expense for household facilities and articles in per capita consumption expenditure of rural households remains unchanged from 2005 to 2011 [40].
4. Conclusions and Policy Implications
Based on the EDI of IEA, the clean energy development index improved the EDI indicators and extended some indicators characterizing renewable energy development and the quality of energy services, making it more sustainable, healthy, and low-carbon for regional energy poverty assessment. Meantime, this paper aims to assess the status of regional energy development to analyze the effects of social development (income, urbanization, and industrialization, etc.) and renewable energy development in addressing regional energy poverty alleviation. These results can provide policy recommendations for inter-regional sustainable development of China’s energy system and contribute to solving the problem of energy poverty.
4.1. Conclusions
Based on the analysis conducted in this study, the following conclusions can be drawn.
- (1)
- Economic development benefits energy infrastructure construction and promotes energy development. To some extent, economic factors determine the investment for energy development, making progress in the construction of power grids and providing financial support for the popularity of energy services. Tianjin city is a typical case. Its renewable energy endowment is limited, but economic supports for energy development contribute to its high clean energy development index because of its regulations on energy conservation in buildings and the high popularity of modern energy services [41]. Furthermore, these results for regional energy poverty assessment in Figure 2 verify the significant role of economic development in energy poverty alleviation. The Central and Southeast part of China have a higher average score than other parts of China. Panel data analysis also points out the positive role of affordability in energy poverty alleviation.
- (2)
- Renewable energy endowments conditionally boost the role of renewable energy in addressing energy poverty. Since the endowment of renewable energy creates the preconditions for regional clean energy production, it reflects the potential for clean energy production in regional energy development. Even though resource endowments determine its available space and the resource foundation, the use of renewable energy also needs the support of economic investment and policy orientation. The Southwest China is a typical case, whose hydropower ranks among the highest in China. Renewable energy utilization can provide electricity services for regional clean energy access in these regions. While there is a huge wind energy base in the “Three North” region (northeast, north, and northwest), wind energy does not take its role in the popularity of modern energy services and energy poverty mitigation. As for the hydropower generation in Southwest China, its negative environmental and social consequences should be simultaneously considered in its deployment.
- (3)
- The framework for regional energy poverty assessment is adequate for clean energy development. Renewable energy development is of great significance in solving the problem of energy poverty, which should be considered in energy poverty studies. On the one hand, the large-scale use of renewables can effectively solve the problem of insufficient energy supply and provide cleaner energy. On the other hand, small-scale distributed renewable energy systems can help to meet electricity needs in rural and remote areas, which suffer the shortfall of power grid construction and inefficient power supply. Thus, the development of renewable energy is closely related to energy poverty mitigation. Due to data availability at the global level, the research framework of EDI of IEA is universal and suitable for comparative studies worldwide. While China’s electricity access rate is close to 100%, the quality of electricity service needs to be further considered. It has become another key point in energy poverty issues, apart from traditional biomass use. Therefore, the framework in this study reflects the characteristics of “adaptation to local condition” in energy poverty assessment by improving the EDI of IEA, which is more sustainable to the evaluation of energy development in China.
4.2. Policy Implications
According to the results of the Grey incidence decision model and the analysis of the panel regression coefficients, some important implications for energy poverty alleviation in China are presented below.
- (1)
- Energy development in rural areas should be facilitated in national energy policy. Even though urbanization has a positive effect on energy poverty alleviation, enhancing the urbanization rate in a short term will be very difficult. In addition, the urbanization process emerges numerous urban problems, such as heavy traffic, air pollution, and the large proportion of migrant workers in urban areas. Thus, one available choice is to promote the energy infrastructure in rural areas and to advocate the use of clean cooking facilities with higher energy efficiency. The building of Smart Grid will be another wise choice for the access to modern energy services in rural areas, which helps to reduce the inefficiency of electricity supply by traditional power networks.
- (2)
- The energy development plan should pay attention to the energy poverty issues in the Northeast and Northwest part of China duo to their poor situation regarding clean energy development. Southwest part of China experienced a down trend in energy poverty scores. The role of wind power in Northwest and Inner Mongolia should be boosted to address the clean energy development in these regions. The clean production of traditional biomass and the improvement of household living standard could be wise alternatives for energy development in Southwest China. Energy poverty alleviation is a balanced mix of economic development and policy support.
This research applies the Grey incidence decision method to undertake multi criteria decision making analysis on the framework presented in Figure 1. The role of clean energy development and rural energy development is considered in energy poverty assessment. However, other methods and estimators could be adopted, such as Data Envelopment Analysis (DEA) [42], index decomposition analysis [43], and system-GMM estimator. Because of data availability, the program for universal access to clean cooking facilities is not considered in present study. This research, mainly considering the access to modern energy services and clean energy, is efficient and practicable at current situation. When considering the limitation of data availability, first-hand data survey should be enacted for provincial case studies. Other characteristics (adequacy, convenience, and affordability) of energy development, the role of technology innovation [44], the smart design of renewable energy systems [45], and the vulnerability of energy systems [46] should be analyzed in future studies.
Acknowledgments
This research gratefully acknowledges the financial support of National Natural Science Foundation of China (No. 71704178), China Postdoctoral Science Foundation (No. 2015T80041), Major Consulting Project of Chinese Academy of Engineering (Nos. 2016-ZD-07, 2017-ZD-03), National Statistical Science Research Project by National Bureau of Statistics of China (No. 2017LY10) and the Fundamental Research Funds for the Central Universities (Grant Nos. 2017QZ02 and 2017QZ03). The supports of Tad Murty from University of Ottawa and Zhi-Fu Mi from University College London for the language editing and suggestions are also graciously acknowledged. We also greatly appreciate the valuable comments from the anonymous reviewers.
Author Contributions
Bing Wang and Hua-Nan Li conceived and designed the research framework; Bing Wang, Xiao-Chen Yuan and Zhen-Ming Sun performed and revised the modeling; Bing Wang, Hua-Nan Li and Zhen-Ming Sun analyzed the data and revised the results; and all authors contributed to the writing up of the paper.
Conflicts of Interest
The authors declare no conflict of interest.
References
- International Energy Agency (IEA). World Energy Outlook 2012; IEA: Paris, France, 2012. [Google Scholar]
- United Nations (UN). Transforming Our World: The 2030 Agenda for Sustainable Development; UN Secretary General: New York, NY, USA, 2015. [Google Scholar]
- International Energy Agency (IEA). World Energy Outlook 2004; IEA: Paris, France, 2004. [Google Scholar]
- Wei, Y.M.; Liao, H.; Wang, K.; Liang, Q.M. China Energy Report (2014): Energy Poverty Research; Science Press: Beijing, China, 2014. (In Chinese) [Google Scholar]
- State Council of China. No. 1 Central Document on Deepening Supply-Side Structural Reform in Agriculture to Cultivate New Development Engines. Available online: http://www.gov.cn/zhengce/2017–02/05/content_5165626.htm (accessed on 16 September 2017).
- National Energy Administration. Announcement on the Photovoltaic Development Plan for Poverty Alleviation Program. Available online: http://zfxxgk.nea.gov.cn/auto87/201708/t20170808_2839.htm (accessed on 16 September 2017).
- Parajuli, R. Access to energy in Mid/Far west region-Nepal from the perspective of energy poverty. Renew. Energy 2011, 36, 2299–2304. [Google Scholar] [CrossRef]
- Nussbaumer, P.; Bazilian, M.; Modi, V. Measuring energy poverty: Focusing on what matters. Renew. Sustain. Energy Rev. 2012, 16, 231–243. [Google Scholar] [CrossRef]
- Barnes, D.F.; Khandker, S.R.; Samad, H.A. Energy poverty in rural Bangladesh. Energy Policy 2011, 39, 894–904. [Google Scholar] [CrossRef]
- Spagnoletti, B.; O’Callaghan, T. Let there be light: A multi-actor approach to alleviating energy poverty in Asia. Energy Policy 2013, 63, 738–746. [Google Scholar] [CrossRef]
- Andadari, R.K.; Mulder, P.; Rietveld, P. Energy poverty reduction by fuel switching. Impact evaluation of the LPG conversion program in Indonesia. Energy Policy 2014, 66, 436–449. [Google Scholar] [CrossRef]
- Li, K.; Liu, C.F.; Wei, Y.M. Energy poverty in China. Energy China 2011, 33, 31–35. [Google Scholar]
- Li, K.; Bob, L.; Liang, X.J.; Wei, Y.M. Energy poor or fuel poor: What are the differences? Energy Policy 2014, 68, 476–481. [Google Scholar] [CrossRef]
- Tang, X.; Liao, H. Energy poverty and solid fuels use in rural China: Analysis based on national population census. Energy Sustain. Dev. 2014, 23, 122–129. [Google Scholar] [CrossRef]
- Wang, K.; Wang, Y.X.; Li, K.; Wei, Y.M. Energy poverty in China: An index based comprehensive evaluation. Renew. Sustain. Energy Rev. 2015, 47, 308–323. [Google Scholar] [CrossRef]
- REN21. Renewables 2017 Global Status Report; REN21 Secretariat: Paris, France, 2017. [Google Scholar]
- GEA. Global Energy Assessment—Toward a Sustainable Future; Cambridge University Press: Cambridge, UK; New York, NY, USA; The International Institute for Applied Systems Analysis: Laxenburg, Austria, 2012. [Google Scholar]
- Reeves, A. Exploring Local and Community Capacity to Reduce Fuel Poverty: The Case of Home Energy Advice Visits in the UK. Energies 2016, 9, 276. [Google Scholar] [CrossRef] [Green Version]
- Borhanazad, H.; Mekhilef, S.; Saidur, R. Potential application of renewable energy for rural electrification in Malaysia. Renew. Energy 2013, 59, 210–219. [Google Scholar] [CrossRef]
- Thomson, H.; Snell, C. Quantifying the prevalence of fuel poverty across the European Union. Energy Policy 2013, 52, 563–572. [Google Scholar] [CrossRef]
- Thomson, H.; Bouzarovski, S.; Snell, C. Rethinking the measurement of energy poverty in Europe: A critical analysis of indicators and data. Indoor Built Environ. 2017, 26, 879–901. [Google Scholar] [CrossRef] [PubMed]
- Deng, J.L. A Course on Grey Systems Theory; HUST Press: Wuhan, China, 1990. [Google Scholar]
- Wang, B.; Liang, X.J.; Zhang, H.; Wang, L.; Wei, Y.M. Vulnerability of hydropower generation to climate change in China: Results based on Grey forecasting model. Energy Policy 2014, 65, 701–707. [Google Scholar] [CrossRef]
- Feng, Z.H.; Zou, L.L.; Wei, Y.M. The impact of household consumption on energy use and CO2 emissions in China. Energy 2011, 36, 656–670. [Google Scholar] [CrossRef]
- Wang, B.; Nistor, I.; Murty, T.; Wei, Y.M. Efficiency assessment of hydroelectric power plants in Canada: A multi criteria decision making approach. Energy Econ. 2014, 46, 112–121. [Google Scholar] [CrossRef]
- Mi, Z.F.; Wei, Y.M.; He, C.Q.; Li, H.N.; Yuan, X.C.; Liao, H. Regional efforts to mitigate climate change in China: A multi-criteria assessment approach. Mitig. Adapt. Strateg. Glob. Chang. 2015, 22, 1–22. [Google Scholar] [CrossRef]
- Liu, S.F.; Lin, Y. Grey Systems: Theory and Applications; Springer: Berlin, Germany, 2011. [Google Scholar]
- Marques, A.C.; Fuinhas, J.A.; Manso, J.R.P. Motivation driving renewable energy in European countries: A panel data approach. Energy Policy 2010, 38, 6877–6885. [Google Scholar] [CrossRef]
- Marques, A.C.; Fuinhas, J.A. Drivers promoting renewable energy: A dynamic panel approach. Renew. Sustain. Energy Rev. 2011, 15, 1601–1608. [Google Scholar] [CrossRef]
- Practical Action. Poor People’s Energy Outlook 2016; Practical Action: Warwickshire, UK, 2016. [Google Scholar]
- Hills, J. Fuel Poverty: The Problem and Its Measurement; CASE Reports, CASE Report 69; Department for Energy and Climate Change: London, UK. Available online: http://sticerd.lse.ac.uk/dps/case/cr/CASEreport69.pdf (accessed on 18 September 2017).
- Johansson, T.B.; Kelly, H.; Amulya, K.; Reddy, N.; Williams, R.H. Renewable Energy: Sources for Fuels and Electricity; Island Press: Washington, DC, USA, 1993. [Google Scholar]
- Moore, R. Definitions of fuel poverty: Implications for policy. Energy Policy 2012, 49, 19–26. [Google Scholar] [CrossRef]
- Middlemiss, L. A critical analysis of the new politics of fuel poverty in England. Crit. Soc. Policy 2017, 37, 425–443. [Google Scholar] [CrossRef]
- Bouzarovski, S.; Petrova, S. A global perspective on domestic energy deprivation: Overcoming the energy poverty-fuel poverty binary. Energy Res. Soc. Sci. 2015, 10, 31–40. [Google Scholar] [CrossRef]
- Snape, J. Spatial and Temporal Characteristics of PV Adoption in the UK and Their Implications for the Smart Grid. Energies 2016, 9, 210. [Google Scholar] [CrossRef] [Green Version]
- Editor Committee of China Power Yearbook. China Electric Power Yearbook 2006–2012; China Electric Power Press: Beijing, China, 2006–2012. (In Chinese) [Google Scholar]
- China National Bureau of Statistics. China Energy Statistical Yearbook 2006–2012; China Statistics Press: Beijing, China, 2006–2012; (In Chinese).
- China National Bureau of Statistics; Ministry of Environmental Protection. China Statistical Yearbook on Environment 2006–2012; China Statistics Press: Beijing, China, 2006–2012; (In Chinese).
- China National Bureau of Statistics. China Statistical Yearbook 2006–2012; China Statistics Press: Beijing, China, 2006–2012; (In Chinese).
- Tianjin Municipal People’s Government. Tianjin Building Energy Efficiency Regulations. 2007. Available online: http://www.tj.gov.cn/zwgk/wjgz/szfl/200710/t20071006_27392.htm (accessed on 8 May 2014).
- Menegaki, A. Growth and renewable energy in Europe: Benchmarking with data envelopment analysis. Renew. Energy 2013, 60, 363–369. [Google Scholar] [CrossRef]
- Mi, Z.; Meng, J.; Guan, D.; Shan, Y.; Liu, Z.; Wang, Y.T.; Feng, K.S.; Wei, Y.M. Pattern changes in determinants of Chinese emissions. Environ. Res. Lett. 2017, 12, 7. [Google Scholar] [CrossRef]
- Wang, B.; Pan, S.Y.; Ke, R.Y.; Wang, K.; Wei, Y.M. An overview of climate change vulnerability: a bibliometric analysis based on Web of Science database. Nat. Hazards 2014, 74, 1649–1666. [Google Scholar] [CrossRef]
- Maheshwari, Z.; Ramakumar, R. Smart Integrated Renewable Energy Systems (SIRES): A Novel Approach for Sustainable Development. Energies 2017, 10, 1145. [Google Scholar] [CrossRef]
- Wang, B.; Ke, R.Y.; Yuan, X.C.; Wei, Y.M. China’s regional assessment of renewable energy vulnerability to climate change. Renew. Sustain. Energy Rev. 2014, 40, 185–195. [Google Scholar] [CrossRef]
Figure 1.
Framework for clean energy development index.
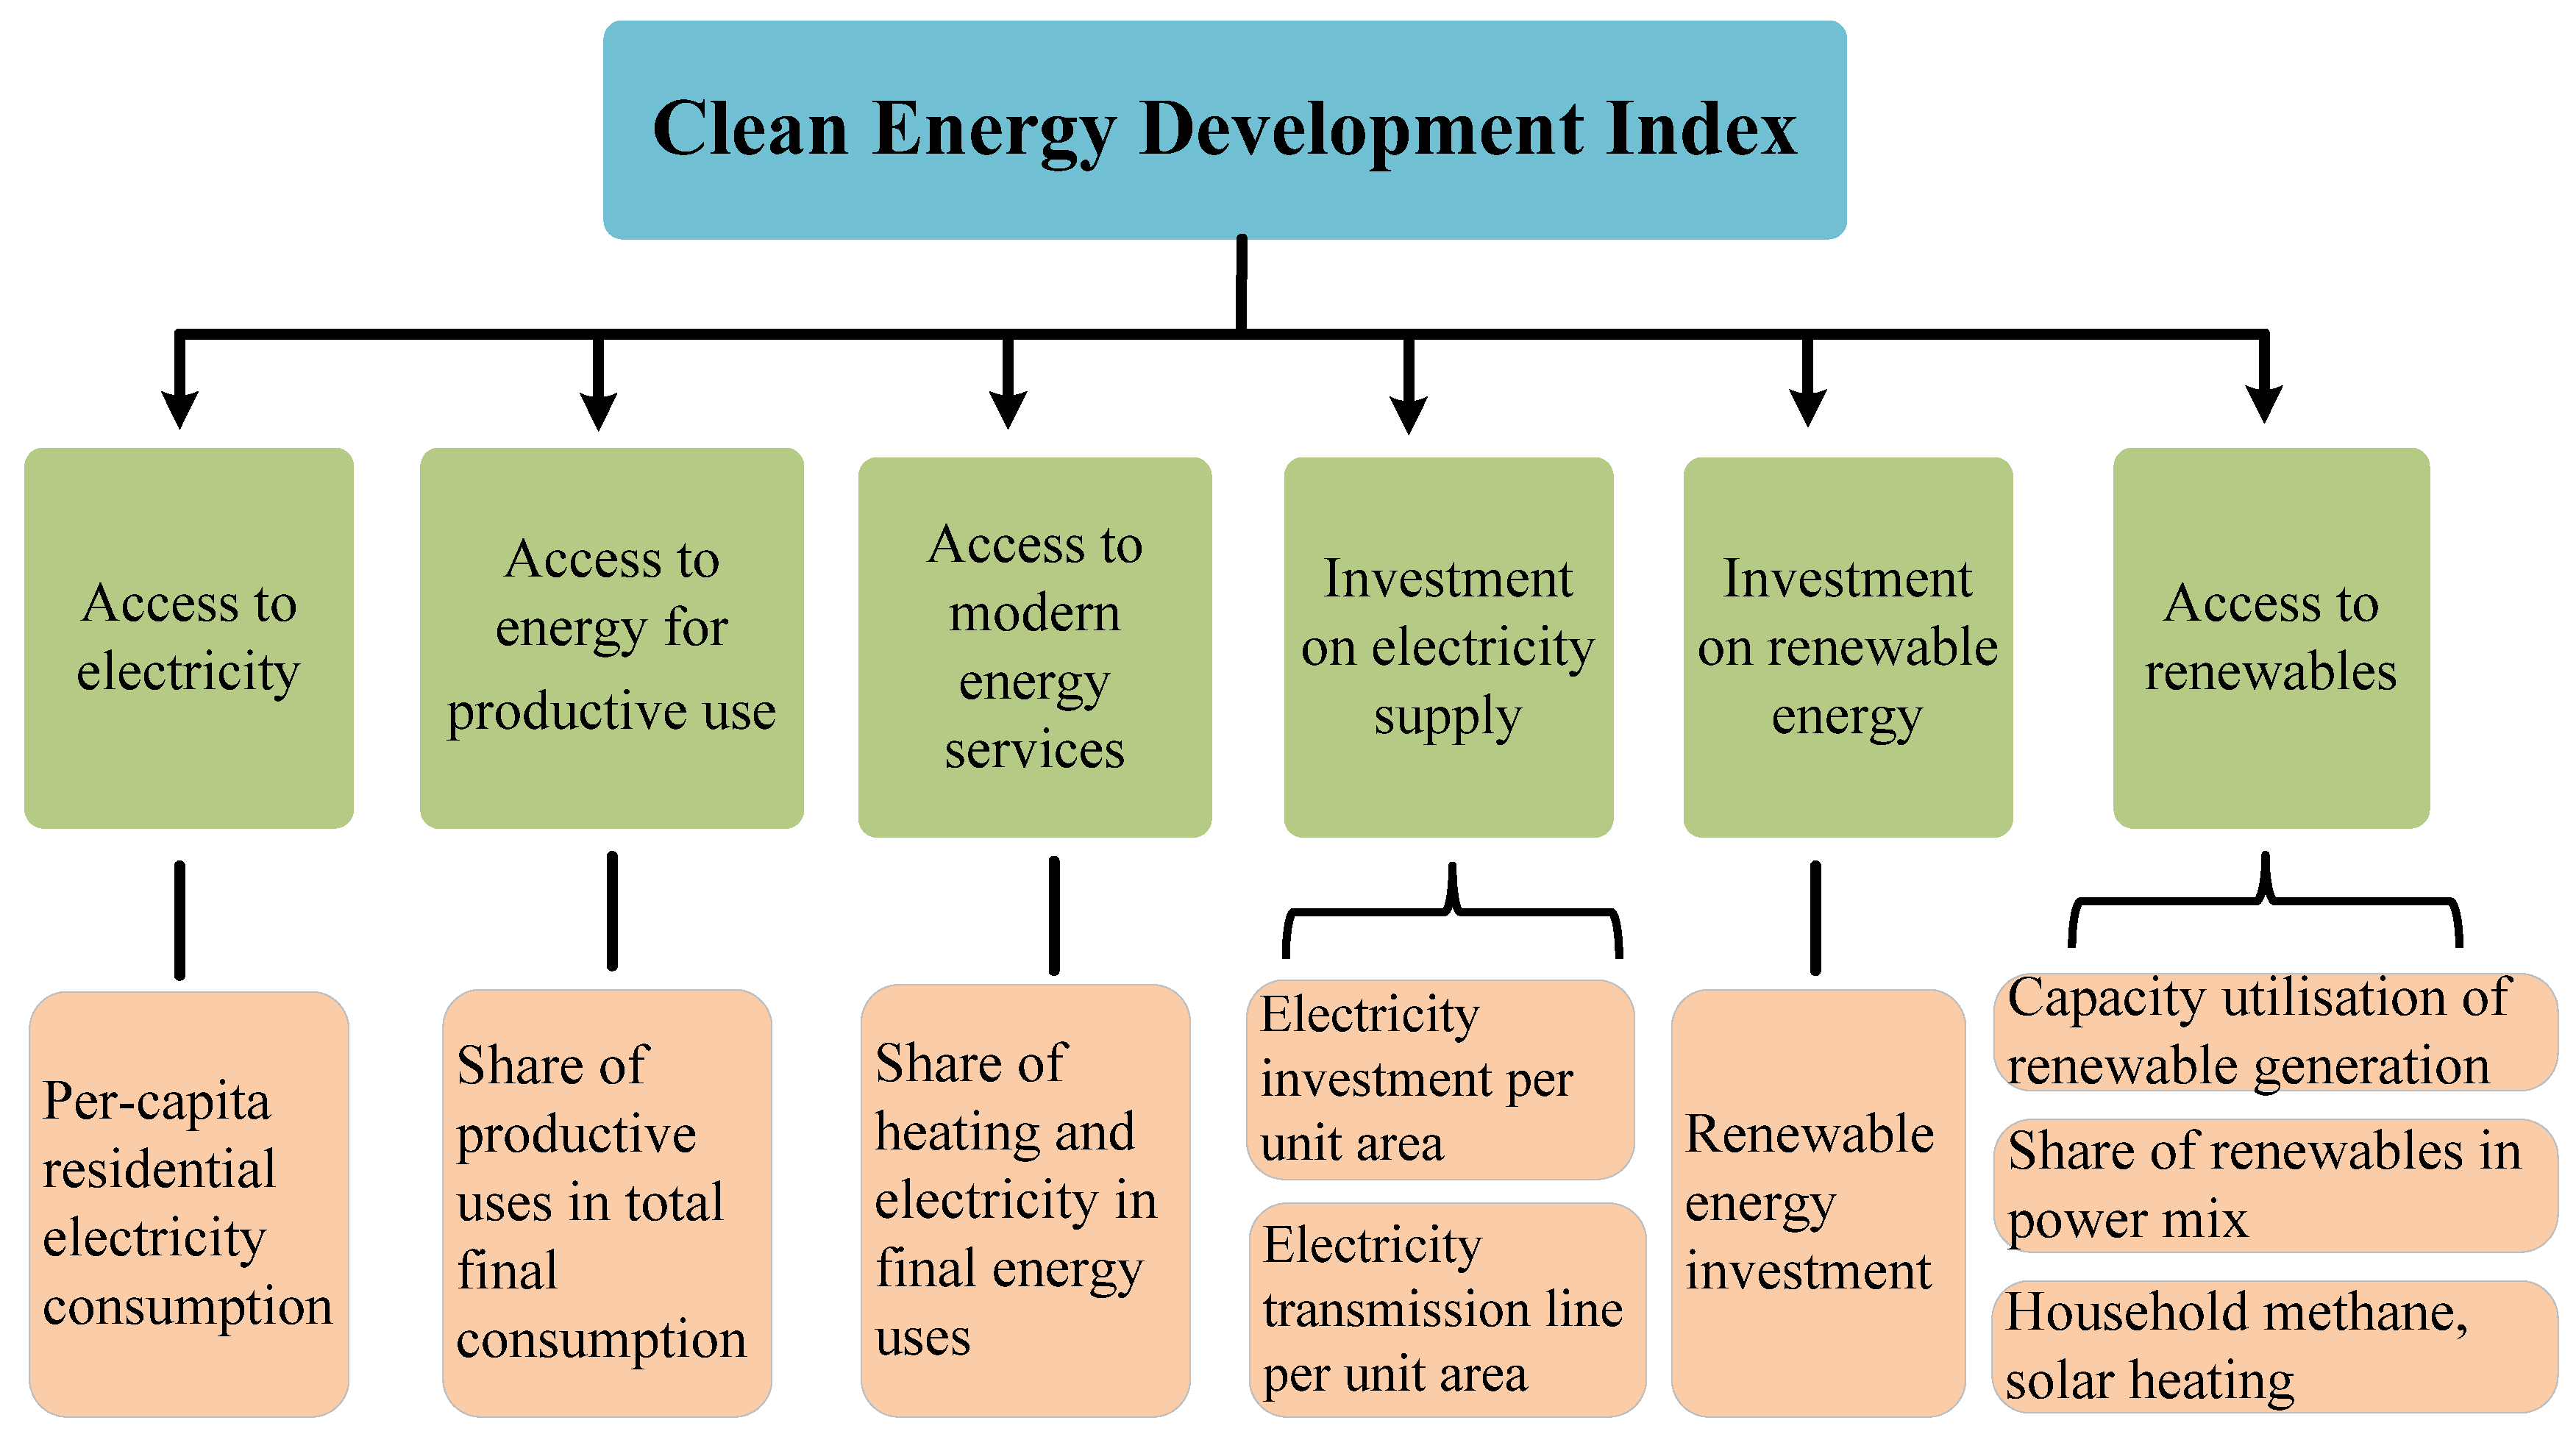
Figure 2.
Regional energy poverty average scores in China. Note: It is a schematic map and does not imply definitive boundaries.
Figure 2.
Regional energy poverty average scores in China. Note: It is a schematic map and does not imply definitive boundaries.
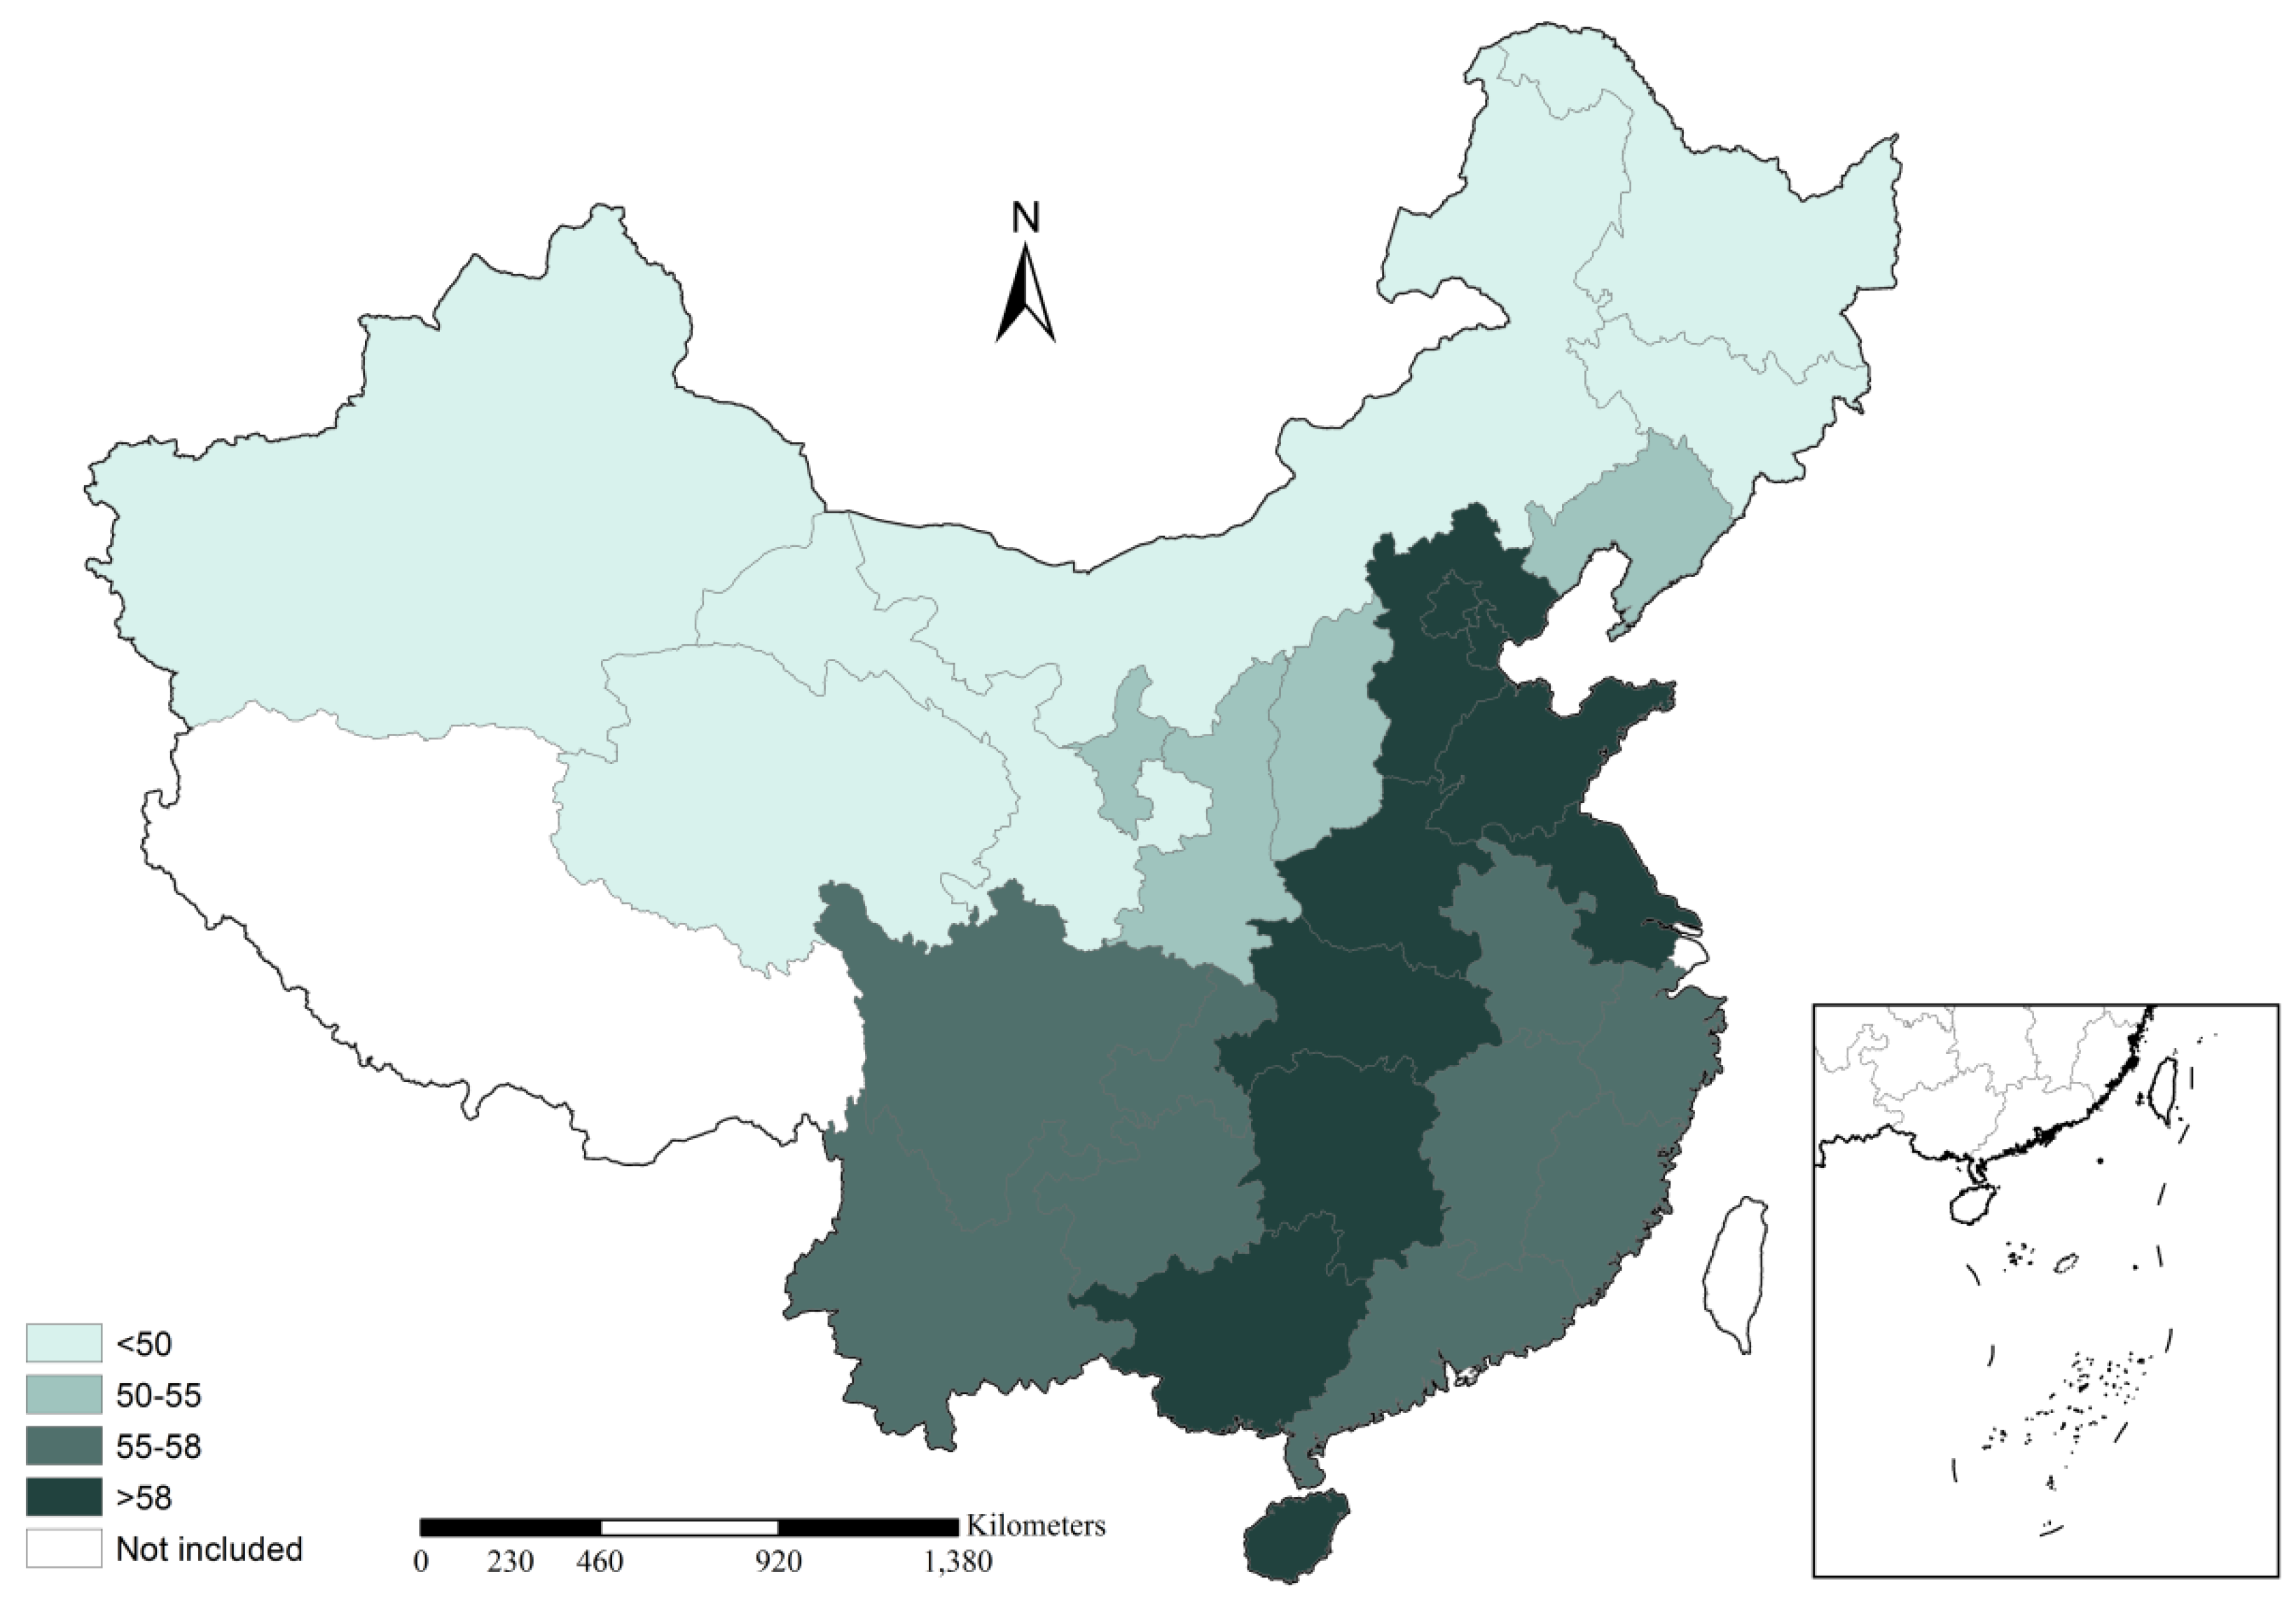
Figure 3.
Trends of regional energy poverty scores from 2005 to 2011.
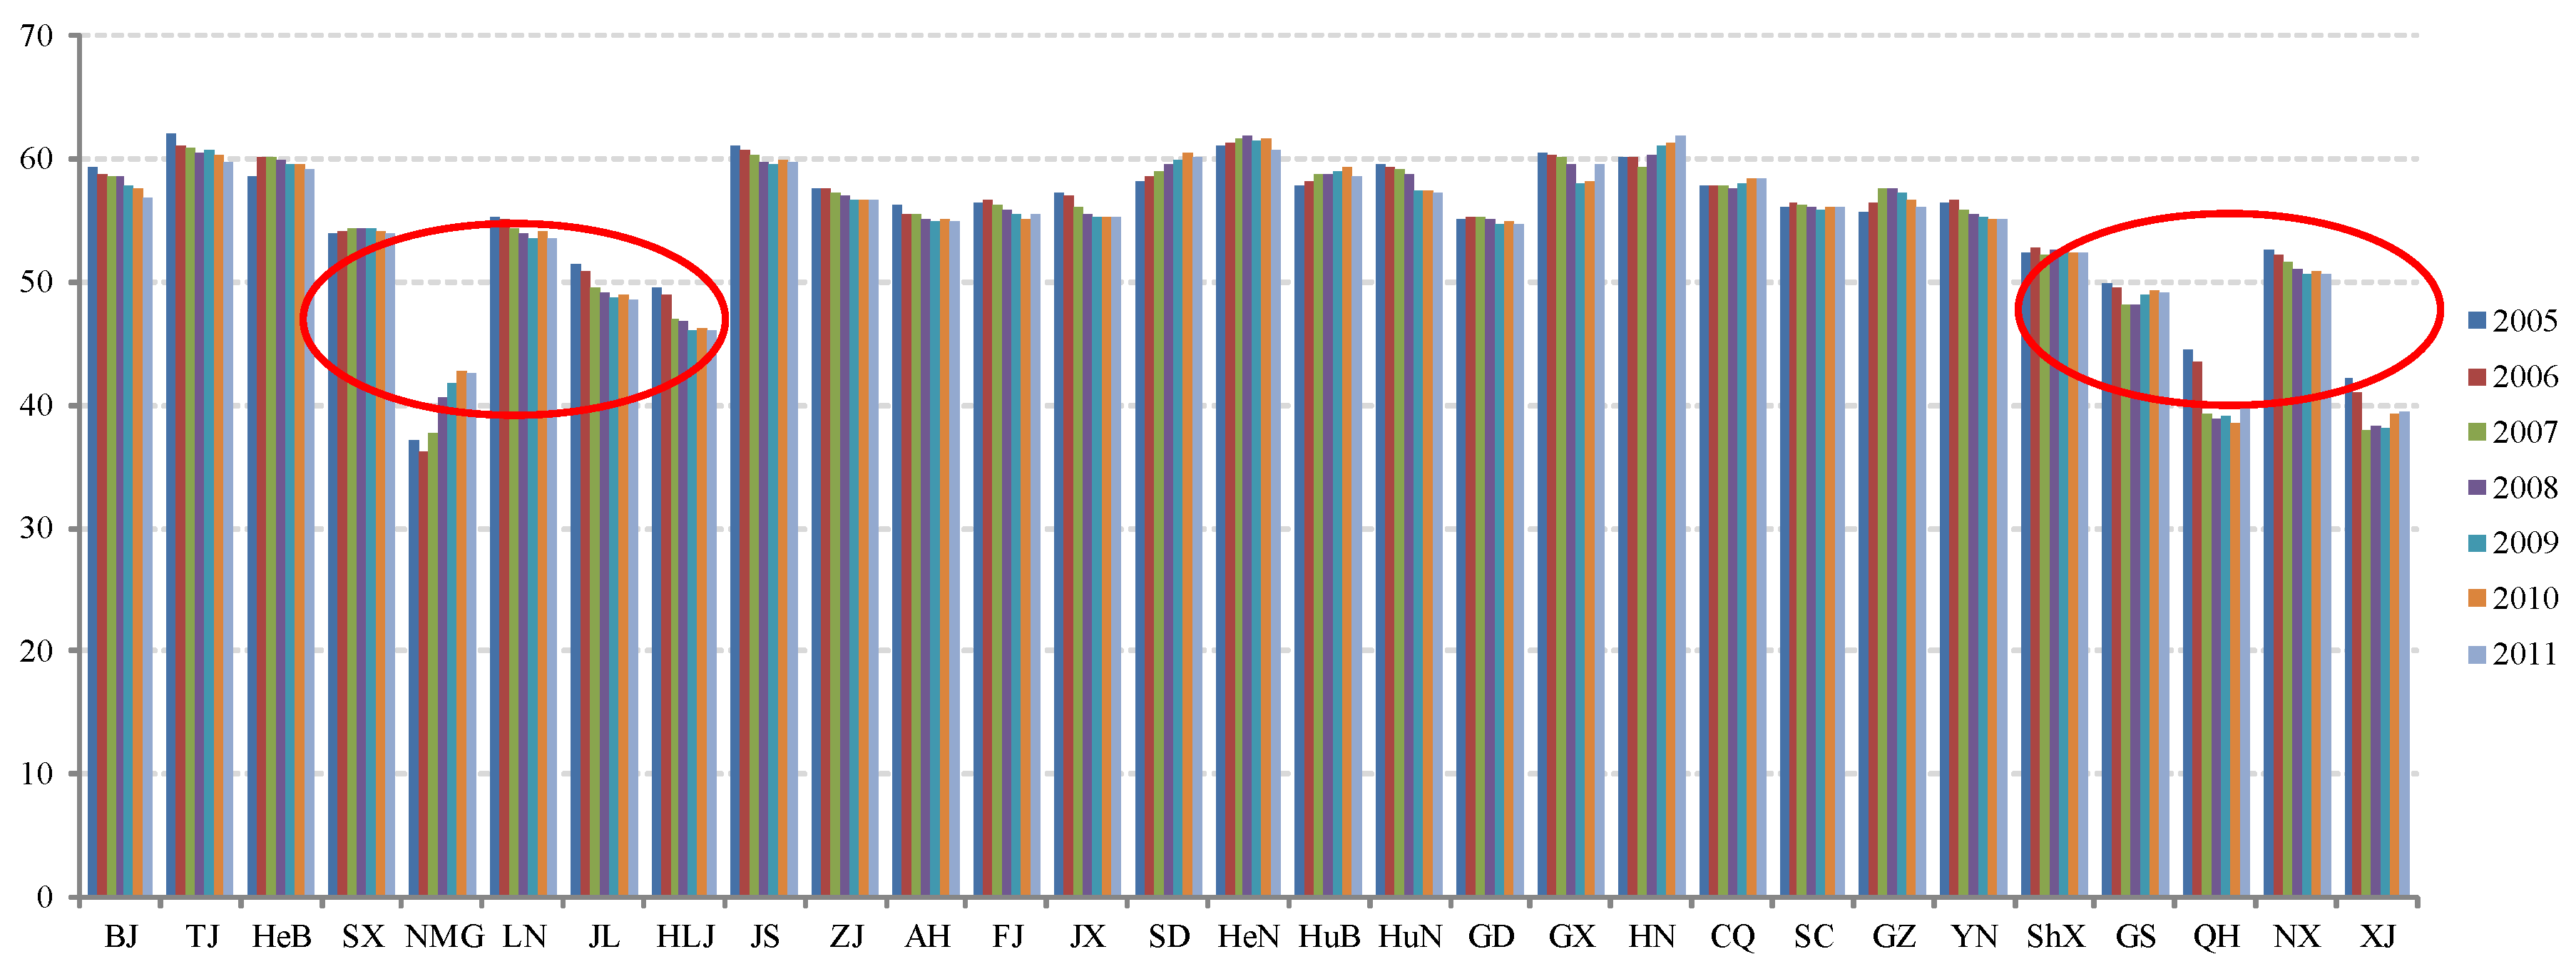
Figure 4.
Changes of regional energy poverty situation in China. Note: It is a schematic map and does not imply definitive boundaries.
Figure 4.
Changes of regional energy poverty situation in China. Note: It is a schematic map and does not imply definitive boundaries.


Table 1.
Definition and data resources of indictors.
| Indicator | Definition | Unit | Data Resource |
|---|---|---|---|
| Access to electricity | per capita electricity consumption | kWh per capita | China Electric Power Yearbook (2006–2012) [37]; China Statistical Yearbook (2006–2012) [40] |
| Energy consumption for productive use | Proportion of energy consumption for productive use in the final energy consumption * | % | China Energy Statistical Yearbook (2006–2012) [38] |
| Access to modern energy services | Proportion of heating and electricity consumption in the final heating and electricity consumption | % | China Energy Statistical Yearbook (2006–2012) [38] |
| Investment on electricity supply | Length of power transmission lines (35kV above) per unit area | kM per m2 | China Electric Power Yearbook (2006–2012) [37]; China Statistical Yearbook (2006–2012) [40] |
| Electricity investment per unit area | Million | China Energy Statistical Yearbook (2006–2012) [38] | |
| Investment on renewable energy | Investment of renewable energy | Million | China Energy Statistical Yearbook (2006–2012) [38] |
| Access to renewable energy | Proportion of renewable energy generation in power mix | % | China Electric Power Yearbook (2006–2012) [37] |
| Annual utilization hours of renewable energy equipment | Hour | China Electric Power Yearbook (2006–2012) [37] | |
| Development level of household methane | m3 | China Statistical Yearbook on Environment (2006–2012) [39] | |
| Utilization level of solar energy ** | m2 | China Statistical Yearbook on Environment (2006–2012) [39] |
* The commercial and production sector includes agriculture, forestry, animal husbandry, fishery industry, fishery and water conservancy, industry, construction industry, transportation industry, storage and postal services. ** Solar energy technologies included solar water heaters, household solar houses, solar buildings, etc.
Table 2.
Regional energy poverty scores from 2005 to 2011 in China.
| Abbreviation | 2005 | 2006 | 2007 | 2008 | 2009 | 2010 | 2011 | |
|---|---|---|---|---|---|---|---|---|
| Beijing | BJ | 59.304 | 58.713 | 58.592 | 58.525 | 57.744 | 57.514 | 56.878 |
| Tianjin | TJ | 61.967 | 61.009 | 60.851 | 60.546 | 60.585 | 60.281 | 59.780 |
| Hebei | HeB | 58.501 | 60.133 | 60.026 | 59.834 | 59.507 | 59.431 | 59.139 |
| Shanxi | SX | 53.872 | 54.166 | 54.357 | 54.387 | 54.226 | 54.087 | 53.937 |
| Inner Mongolia | NMG | 37.173 | 36.172 | 37.748 | 40.679 | 41.683 | 42.752 | 42.458 |
| Liaoning | LN | 55.185 | 55.063 | 54.259 | 53.870 | 53.627 | 54.075 | 53.551 |
| Jilin | JL | 51.395 | 50.884 | 49.493 | 49.041 | 48.637 | 48.814 | 48.453 |
| Heilongjiang | HLJ | 49.502 | 48.848 | 46.968 | 46.783 | 45.934 | 46.185 | 46.101 |
| Jiangsu | JS | 61.057 | 60.626 | 60.201 | 59.794 | 59.572 | 59.855 | 59.806 |
| Zhejiang | ZJ | 57.511 | 57.578 | 57.296 | 57.067 | 56.613 | 56.679 | 56.637 |
| Anhui | AH | 56.258 | 55.515 | 55.436 | 55.058 | 54.860 | 55.111 | 54.886 |
| Fujian | FJ | 56.517 | 56.618 | 56.286 | 55.944 | 55.379 | 55.139 | 55.491 |
| Jiangxi | JX | 57.203 | 57.036 | 55.997 | 55.413 | 55.336 | 55.344 | 55.354 |
| Shandong | SD | 58.109 | 58.505 | 58.954 | 59.563 | 59.975 | 60.512 | 60.150 |
| Henan | HeN | 60.982 | 61.200 | 61.597 | 61.813 | 61.420 | 61.659 | 60.672 |
| Hubei | HuB | 57.712 | 58.235 | 58.806 | 58.790 | 58.897 | 59.292 | 58.502 |
| Hunan | HuN | 59.541 | 59.376 | 59.134 | 58.716 | 57.452 | 57.471 | 57.218 |
| Guangdong | GD | 55.080 | 55.247 | 55.243 | 55.094 | 54.680 | 54.920 | 54.751 |
| Guangxi | GX | 60.445 | 60.320 | 60.005 | 59.505 | 58.019 | 58.098 | 59.524 |
| Hainan | HN | 60.050 | 60.035 | 59.399 | 60.226 | 60.993 | 61.248 | 61.793 |
| Chongqing | CQ | 57.787 | 57.877 | 57.768 | 57.555 | 57.889 | 58.438 | 58.281 |
| Sichuan | SC | 56.140 | 56.527 | 56.297 | 56.001 | 55.779 | 56.028 | 55.969 |
| Guizhou | GZ | 55.742 | 56.471 | 57.530 | 57.591 | 57.169 | 56.672 | 56.100 |
| Yunnan | YN | 56.396 | 56.542 | 55.889 | 55.437 | 55.281 | 55.170 | 55.125 |
| Shaanxi | ShX | 52.410 | 52.740 | 52.159 | 52.508 | 52.564 | 52.411 | 52.309 |
| Gansu | GS | 49.958 | 49.466 | 48.111 | 48.056 | 48.848 | 49.313 | 49.030 |
| Qinghai | QH | 44.474 | 43.552 | 39.273 | 38.899 | 39.001 | 38.577 | 39.607 |
| Ningxia | NX | 52.490 | 52.284 | 51.539 | 51.004 | 50.626 | 50.890 | 50.674 |
| Xinjiang | XJ | 42.072 | 41.073 | 37.865 | 38.268 | 38.196 | 39.338 | 39.503 |
| Max | - | 61.967 | 61.200 | 61.597 | 61.813 | 61.420 | 61.659 | 61.793 |
| Min | - | 37.173 | 36.172 | 37.748 | 38.268 | 38.196 | 38.577 | 39.503 |
| Mean | - | 54.994 | 54.890 | 54.382 | 54.344 | 54.155 | 54.321 | 54.196 |
Table 3.
Variables for panel data regression analysis of energy poverty.
| Definition | Calculation | |
|---|---|---|
| Energy poverty scores | Energy poverty assessment scores | |
| Urbanization | Percentage of population in urban areas | |
| Affordability | Percentage of electricity expenditure in income | |
| Income | Increase rate of Per capita GDP | |
| Industrialization | Percentage of the Secondary Industry in GDP | |
| Rural Household Consumption Expenditure | Increase rate of Rural Household Consumption Expenditure | |
| Renewable energy utilization | Percentage of hydropower, wind power, solar energy utilization in power generation |
Table 4.
Panel data regression coefficients for the determinants of energy poverty.
| Model 1 | Model 2 | |||
|---|---|---|---|---|
| POLS | FE | POLS | FE | |
| Constant | 26.915 *** | 29.101 *** | 37.735 ** | −12.481 |
| 0.159 *** | 0.150 *** | 0.888 ** | 0.904 ** | |
| −0.371 ** | −0.361 ** | −0.156 *** | −0.368 * | |
| 0.054 | −0.020 | 0.139 | −0.015 | |
| −0.099 | −0.099 | −0.375 | −0.804 ** | |
| −0.122 * | −0.154 * | −0.609* | −0.428 ** | |
| 0.231 *** | 0.231 *** | |||
| Observations | 203 | 203 | 203 | 203 |
| F-statistic | 18.692 *** | 9.310 *** | 12.426 *** | 16.157 *** |
| Adj. R square | 0.344 | 0.331 | 0.289 | 0.253 |
Note: *** p < 0.001, ** p < 0.05, * p < 0.10.
© 2017 by the authors. Licensee MDPI, Basel, Switzerland. This article is an open access article distributed under the terms and conditions of the Creative Commons Attribution (CC BY) license (http://creativecommons.org/licenses/by/4.0/).
Share and Cite
MDPI and ACS Style
Wang, B.; Li, H.-N.; Yuan, X.-C.; Sun, Z.-M. Energy Poverty in China: A Dynamic Analysis Based on a Hybrid Panel Data Decision Model. Energies 2017, 10, 1942. https://doi.org/10.3390/en10121942
AMA Style
Wang B, Li H-N, Yuan X-C, Sun Z-M. Energy Poverty in China: A Dynamic Analysis Based on a Hybrid Panel Data Decision Model. Energies. 2017; 10(12):1942. https://doi.org/10.3390/en10121942
Chicago/Turabian StyleWang, Bing, Hua-Nan Li, Xiao-Chen Yuan, and Zhen-Ming Sun. 2017. "Energy Poverty in China: A Dynamic Analysis Based on a Hybrid Panel Data Decision Model" Energies 10, no. 12: 1942. https://doi.org/10.3390/en10121942
Note that from the first issue of 2016, this journal uses article numbers instead of page numbers. See further details here.