Force Measurements on a VAWT Blade in Parked Conditions


Division of Electricity, Department of Engineering Sciences, Uppsala University, Box 534, 751 21 Uppsala, Sweden
*
Author to whom correspondence should be addressed.
Energies 2017, 10(12), 1954; https://doi.org/10.3390/en10121954
Submission received: 24 October 2017
/
Revised: 17 November 2017
/
Accepted: 20 November 2017
/
Published: 24 November 2017
(This article belongs to the Collection Wind Turbines)
Abstract
:The forces on a turbine at extreme wind conditions when the turbine is parked is one of the most important design cases for the survivability of a turbine. In this work, the forces on a blade and its support arms have been measured on a 12 kW straight-bladed vertical axis wind turbine at an open site. Two cases are tested: one during electrical braking of the turbine, which allows it to rotate slowly, and one with the turbine mechanically fixed with the leading edge of the blade facing the main wind direction. The force variations with respect to wind direction are investigated, and it is seen that significant variations in forces depend on the wind direction. The measurements show that for the fixed case, when subjected to the same wind speed, the forces are lower when the blade faces the wind direction. The results also show that due to the lower forces at this particular wind direction, the average forces for the fixed blade are notably lower. Hence, it is possible to reduce the forces on a turbine blade, simply by taking the dominating wind direction into account when the turbine is parked. The measurements also show that a positive torque is generated from the blade for most wind directions, which causes the turbine to rotate in the electrically-braked case. These rotations will cause increased fatigue loads on the turbine blade.
1. Introduction
One of the key aspects of the design of a wind turbine is survivability at high wind speeds. Typical turbines will operate at a limited rotational speed once the rated wind speed has been reached, and at some point when the forces become too large, the turbine will be stopped (cut-out), which significantly reduces the forces. A second design condition is the extreme wind speed. According to the International Electrotechnical Commission (IEC) 61400-1 standard, the extreme 50-year gusts are defined as 70 m/s, m/s and m/s for Classes I to III.
This study focus on the vertical axis wind turbine (VAWT). It is a technology that has received an increased interest recently, especially for offshore applications due to its low center of gravity [1,2,3]. The technology has the potential to scale to large sizes as shown by Ottermo and Bernhoff [4]. A comparison between a horizontal axis wind turbine (HAWT) and a VAWT by Eriksson et al. concluded that the VAWT can be built with less moving parts and that the straight-bladed Darrieus design has manufacturing benefits compared to the curved Darrieus turbine [5]. This work focus on the straight-bladed Darrieus design, the H-rotor.
For HAWTs, operating at wind speeds close to cut-out can be the highest load case, which is seen in the case by Kong et al. [6]. In that case, it is possible to reduce the loads by choosing a lower cut-out speed. For the second condition with the extreme wind speed, the HAWT can use both blade pitch and yaw to minimize the cross-sectional area. For the VAWT, the loads close to cut-out can be reduced by choosing a lower cut-out speed in the same way as for the HAWT. The options close to the extreme wind speed are more limited for the VAWT though. Turbines with up to two blades can turn the rotor in a favorable position that minimizes the cross-sectional area. For turbines with three or more blades, however, one cannot find a position that minimizes the loads on all blades at the same time. The straight-bladed VAWT will also need support arms, which add to the cross-sectional area. Hence, the forces at the extreme wind speed case are of key importance when designing a straight-bladed VAWT.
Despite the importance, very few studies have been performed on this case. Ottermo et al. used simplified analytical expressions to estimate the extreme loads [7]. Paulsen et al. have done computational fluid dynamics (CFD) studies covering both operational states and parked situations for the DeepWind concept [8].
As numerical modeling is difficult for turbine blades at these high angles of attack, there is a need for experimental studies of this topic, which is the main purpose of the current work. Here, a 12 kW straight-bladed VAWT prototype is used (Figure 1). The turbine is designed for a rated wind speed of 12 m/s, at which the blade speed is 40 m/s (this would give relative velocities of up to 47 m/s at a cut-out speed of 25 m/s). This may be compared to the extreme wind speed specified by IEC Class II of m/s. As the forces scale quadratic with the wind speed, it is clear that the extreme wind speed case will give a larger aerodynamic force than any operational condition. Further, the contribution due to support arms and tower should give a larger contribution for the extreme wind speed case than in the operational case, as the high wind speed acts on the entire support arm/tower. This should show that the extreme wind speed is a very important design case, even though the number of load cycles should be significantly less than for the operational load cases. Note that for an individual blade, the centrifugal force will give a significant force contribution in the operational case, which depending on the turbine design, still can cause this case to have the largest forces.
Beside studying the loads for a parked turbine, this work also considers how the turbine should be parked. A direct drive permanent synchronous generator that is capable of giving sufficiently large torque can be used as an electric brake to stop the turbine. The torque from the generator is however low at low rotational speeds, and hence, the turbine can rotate slowly with the electric brake engaged. It was suggested by Ottermo et al. to use electrical braking since it can dampen oscillations in the drive-train during parking [7]. Here, it is studied if this electric brake is suitable for parking the turbine in terms of aerodynamic loads or if an additional mechanic brake is required to lock the turbine to a fixed position.
2. Method
The forces are measured on a three-bladed VAWT with a diameter of m and a blade length of 5 m. Each blade is attached with two support arms according to Figure 1. More details about the turbine can be found in Table 1. The design of the support arms is presented in Figure 2.
On one of the blades, four single-axis load cells are attached between the hub and the support arms, which will measure the forces on the blade and support arms combined. From these load cells, it is possible to extract the forces in the radial direction and the torque provided by a single blade (including the contribution from the support arms). Wind velocities are measured using an acoustic anemometer located at hub height and 2.5 turbine diameters north of the turbine. The wind directions are defined as 0° from north, 90° from east, 180° from south and 270° from west; see Figure 3. The turbine has a hub height of 6 m and is located at an open site, which mainly consists of farmland in most directions. There is however a building about 30 m away from the turbine at angles around 180 to 210°, which is approximately 5 m in height, that can disturb the flow field. Detailed descriptions of the turbine and all the measurement equipment are available in [10,11]. The measurements are performed during two conditions; during electrical braking of the turbine and with the turbine mechanically fixed. Data for the first case have been collected between 13 September 2014 and 13 January 2015 and for the second case between 12 November 2015 and 29 January 2016.
2.1. Electrical Braking of Turbine
The electromechanical braking of the prototype is achieved by a Y-connected resistive load of /phase. The generator is designed with enough overload capacity to brake the turbine from any operating condition, as shown by Eriksson et al. [12]. The resistive value of the load is chosen such that it is able to brake the turbine from nominal speed without damage to the mechanical system or the generator, and it is the default brake system of the turbine prototype. The braking torque of the generator will approximately be proportional to the rotational velocity of the turbine. Hence, the torque is low when the turbine is parked, and this system allows the turbine to rotate slowly at high wind speeds (at a very low tip speed ratio).
2.2. Mechanically-Fixed Turbine
In this case, the turbine is mechanically locked in place, similar to a typical mechanical brake. The mechanically-fixed case allows for studies of the directional variations of the forces for a single blade, as the blade position is known in this case. Here, the blade is fixed with the leading edge pointing in the dominating wind direction, which should reduce the total forces on the turbine. See Figure 3 for the position of the blade and Figure 4 for wind data for the measurement period.
2.3. Data Treatment
The measurements are obtained from 1 s average values from the forces at each load cell. From the load cell measurements, estimates of the tangential forces and the radial forces of the blade and support arms are possible. The obtained forces require calibration that changes somewhat over time; see [10]. To obtain the calibration, a lookup table is used. The lookup table is built based on time and forces measured at wind speeds below m/s. All measurements are calibrated using linear interpolation between the lookup table entries. The total aerodynamic force on a single blade is determined as:
where and are the estimated radial and tangential forces from the measurements. Note that the measurement system measures the torque, and the tangential force is estimated as the force at the blade that will give the measured torque. This underestimates the tangential forces generated on the support arms; however, since the radial force is dominating, the problem is limited. To reduce the effects of turbulence in the wind, considering that the wind measurement equipment is located 2.5 turbine diameters away from the turbine, 10 s mean values are used for both the forces and the wind speed.
The total force during parking is expected to correspond to:
where is the force coefficient, which can be approximated as independent of wind speed, is the air density, A is the blade area ( m2) and V is the wind speed. The use of the blade area for the normalization is motivated because it is the main contribution to the force, and it is also easy to calculate. A curve fit of the force measurements as a function of the quadratic wind speed provides the estimate of that can be used to estimate the forces at higher wind velocities.
The statistical deviation estimation of can be done as a standard deviation, where the curve fit is used as the expected value (instead of the average). The formula for the deviation is then:
where is the total measured force and is the estimated force from the curve fit, both at sample i. Since Equation (3) can result in unreasonably large values at low wind speeds, a wind speed threshold is introduced at 2 m/s. If the average wind speed of the analyzed data is less than 2 m/s for a particular bin, the average wind speed is used as the threshold for this bin. This is mainly introduced to handle the low amount of data above 2 m/s available for wind directions around 90°.
Since the force coefficient is expected to change with different wind directions in the case of a mechanically-fixed turbine, the estimation of the coefficient is performed for different wind direction regions. A total of 18 or 72 (different for different figures) bins is used for the wind direction, and the wind speed is divided into bins of m/s. The average of the total force is estimated for each bin.
Additionally, to establish a correlation between and the wind direction at higher resolution, the wind direction is divided into 5° bins. As a comparison, the forces have also been calculated as a function of wind direction using blade element data, with lift and drag coefficients from [13]. For the support arms, the lift and drag coefficients for the NACA0025 have been used. To account for the blunt trailing edge, the model for blunt trailing edges in XFoil [14] has been used. Here, the difference in drag for a NACA0025 with a sharp trailing edge and the drag with the blunt trailing edge has been added to the drag coefficients in [13]. The calculations have been performed with the streamtube code described in [15] with the wake modeling and all correction models turned off. Note that with wake modeling deactivated, this will be the same as manually integrating the lift and drag forces, obtained from the static coefficients at asymptotic wind speed, over the blades and the support arms. The force calculations are designed to match the conditions for the measurements. This means that the radial force and the torque are calculated, and the tangential force is then estimated from the calculated torque the same way as for the measurements. The force coefficient components in radial direction and tangential direction are calculated from and using Equation (2) in the same way as the total force coefficient is calculated from .
3. Results
The directional dependence of the force on a single blade and its support arms is investigated in Figure 5. Here, data have been separated into 20°, sections and the mean force for each wind speed is given. The curve fits of the total force are added according to Equation (2). The curve fits are also plotted as a function of wind direction in Figure 6, here in 5° sections. As a comparison, the estimated force coefficients from blade element data are plotted in Figure 7. Since the turbine can move during electrical braking, one would expect that the forces are relatively independent of wind direction. The results from the electrical braking can thereby be seen as a validation of directional independence of the measurements. In general, by inspecting Figure 5 and Figure 6, one can see some trends that the electrical braking case shows small minima at the same positions as the mechanically-fixed turbine. While some of them could be coincidences, the most significant one is the region 210° to 250°, which also shows lower forces. Note that this is a common wind direction and should not be dismissed due to insufficient data. Hence, it appears that at least for this direction, there is an offset in the relation between the wind speed at the measurement position and at the turbine blade. A possible explanation can be disturbances from the building to the south, although its position does not directly cover the turbine for angles above 210°.
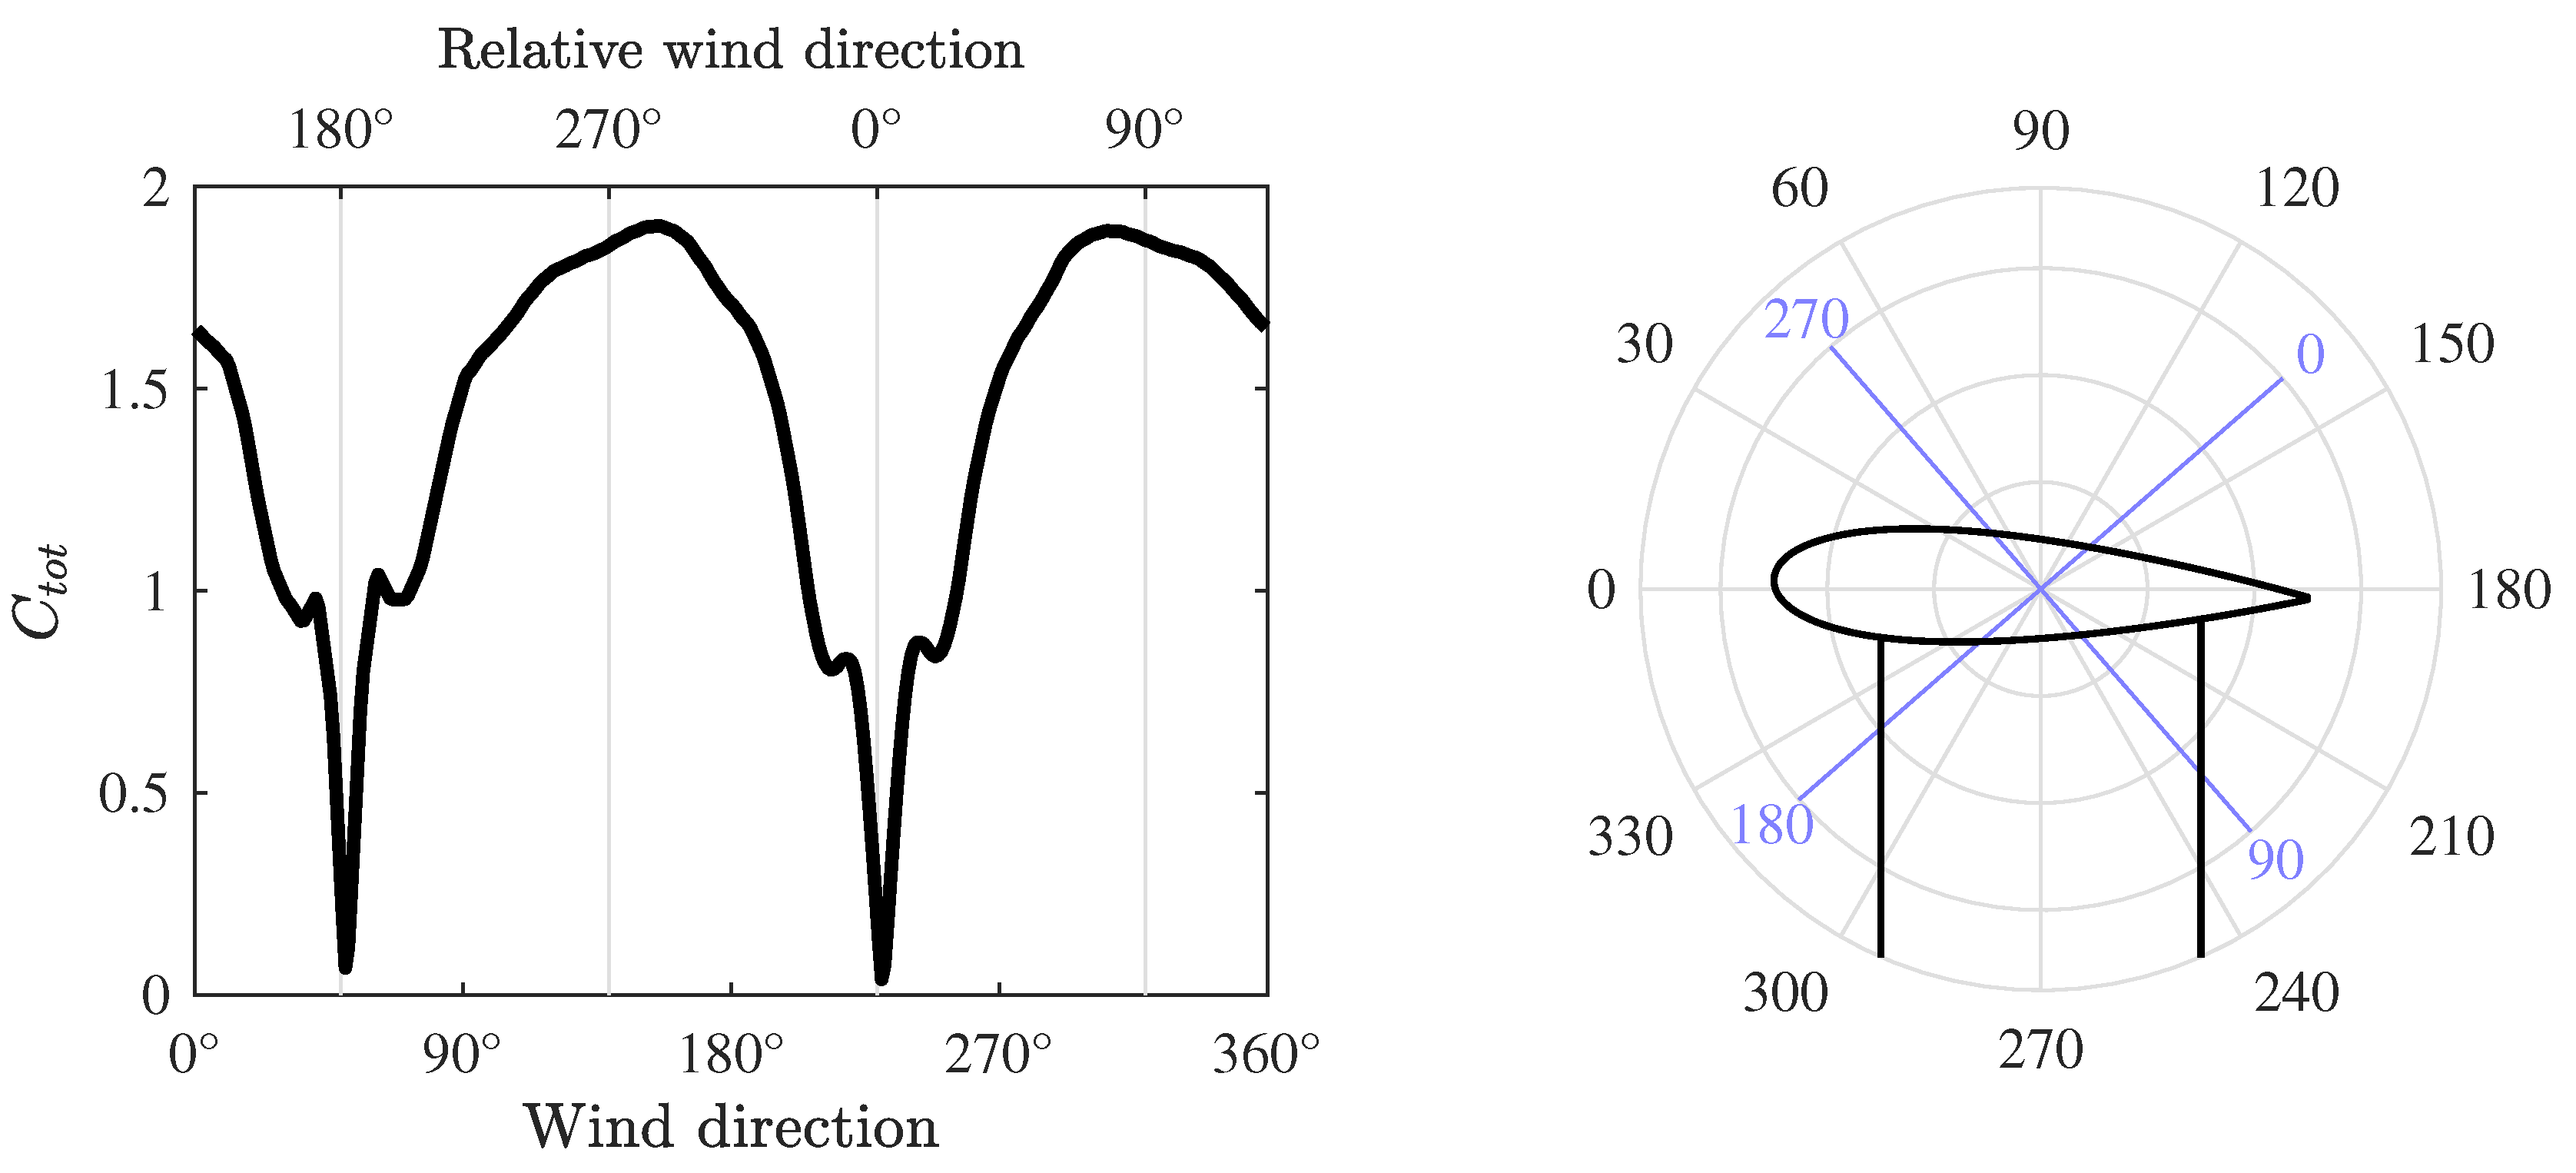
In Figure 6, Figure 7, Figure 8 and Figure 9, there are two coordinate systems plotted. On the bottom x-axis is the wind direction, and the values here correspond to the definitions used in the previous figures. On the top x-axis, the coordinate system has been rotated according to Figure 7, which is the local coordinate system centered on the blade. This coordinate system simplifies the analyses of the results, as most interesting phenomena occur at 90° multiples in this coordinate system. Note that the 2° pitch angle of the blade causes the angle of attack to be zero at 2° in this coordinate system. Hence, zero angle of attack occurs at a wind direction of 231°. All values here on are given with the wind directions in the original frame of reference, unless specified otherwise.
For the mechanically-fixed case, there is limited measurement data available in the region from 310° to 170°, and hence, the focus should be on the 170° to 310° region. Clearly, there are significant variations due to the wind direction, as seen in Figure 5 and Figure 6. The decrease in force when the leading edge of the turbine is facing the wind (231°) is prominent, even if it does not reach as low values as predicted by the calculated theoretical estimates in Figure 7. However, as the theoretical minimum regions are very narrow, they seem unlikely to show in measurement data from an open site experiment. Note that the forces may be too low here, as a smaller decrease in forces is observed in this region during electrical braking, as well. Hence, there can be a local flow phenomenon that causes the forces to be too low here. A similar decrease in forces is seen when the trailing edge is facing the wind at 51°. Here, the lowest measured force is measured at about 58°, and the large region with low forces is located at higher angles. This may indicate some static offset in the wind direction measurements from this angle. One can expect a larger area of low forces here, as the blade is much less efficient at this orientation and hence stalls much earlier, but one should be cautious with these results due to the lack of measurement points (especially measurement points at higher wind speeds are missing as seen in Figure 4 and Figure 5). Hence, the values around 90° are likely measurement errors.
One difference between the theoretical estimates and the measurements is at wind directions around 310°, where the blade is close to the center upwind position. At this position, the blade and the support arms will be aligned with the wind, which gives a lower projected area, while the theoretical estimates (which do not account for wakes) suggest that this position has the highest force coefficient. Note that there is a slight offset in angles here, as the center upwind position is at 319°, which is a position where the forces already are increasing toward the peak value. This may be a measurement error though, as some local flow phenomenon could cause small offsets in wind direction between the measurement position and the blade. A similar trend with lower forces is seen for the center downwind position at 139°. In this case, the angle of the minimum forces coincides better with the actual position for when the blade and support arms are located in a line, which is the expected position for the lower forces (the actual lowest position is at 147° though).
To further show the directional part of the forces, the radial part of the forces is plotted in Figure 8 and the tangential part in Figure 9. Here, only results from the case with the turbine is mechanically fixed are included, and the experiments are compared with the static blade element data calculations. For the radial forces, the same trends can be seen as for the total force, which is quite expected considering that the radial part is the dominating force. Especially on the downwind side (wind directions from 49° to 229°), the forces from the static coefficients are overestimated. This may be related to the interaction of the flow with the other turbine parts, which is ignored in the theoretical estimates. The torque measurements converted into the corresponding tangential forces at the blade are plotted in Figure 9. Here, the peak values are lower in the measurements than in the calculations, while the region with negative forces is smaller for the measurements. The mean value in the measurements (0.061) is 4% higher than for the calculations. The result is important as it causes the turbine to rotate. As the contribution from one blade gives a positive torque in most positions, the contribution from all three blades will give a positive torque in all cases, which can be seen from the rotation in the electrically-braked case. Note, however, that these values cannot directly be used to determine when the turbine will be self-starting, as the torque can decrease when the turbine rotates slowly.
To analyze how the choice of blade position affects the total forces, all data are combined in Figure 10 (Left). Here, the average forces for the fixed turbine are significantly lower than during electrical braking. This is caused by the lower forces obtained for the case where the blade is facing the wind. As can be seen in Figure 4, this wind direction is much more common than the average. Hence, when the blade position is chosen with respect to the main wind direction, the total average force becomes lower.
As an additional result, the rotational speed of the turbine during electrical braking is presented in Figure 10 (Right). The turbine starts to move at a wind speed of about 7 m/s (which corresponds to an average torque of 20 Nm). Asymptotically, the rotational speed appears to vary linearly with the wind speed. As the generator torque is expected to increase linearly with the rotational speed, while the turbine torque is expected to have a quadratic increase with respect to wind speed, one can assume that at these low rotational speeds, the power coefficient of the turbine decreases with rotational speed. Considering this, it is uncertain for how high wind speeds the linear trend will continue.
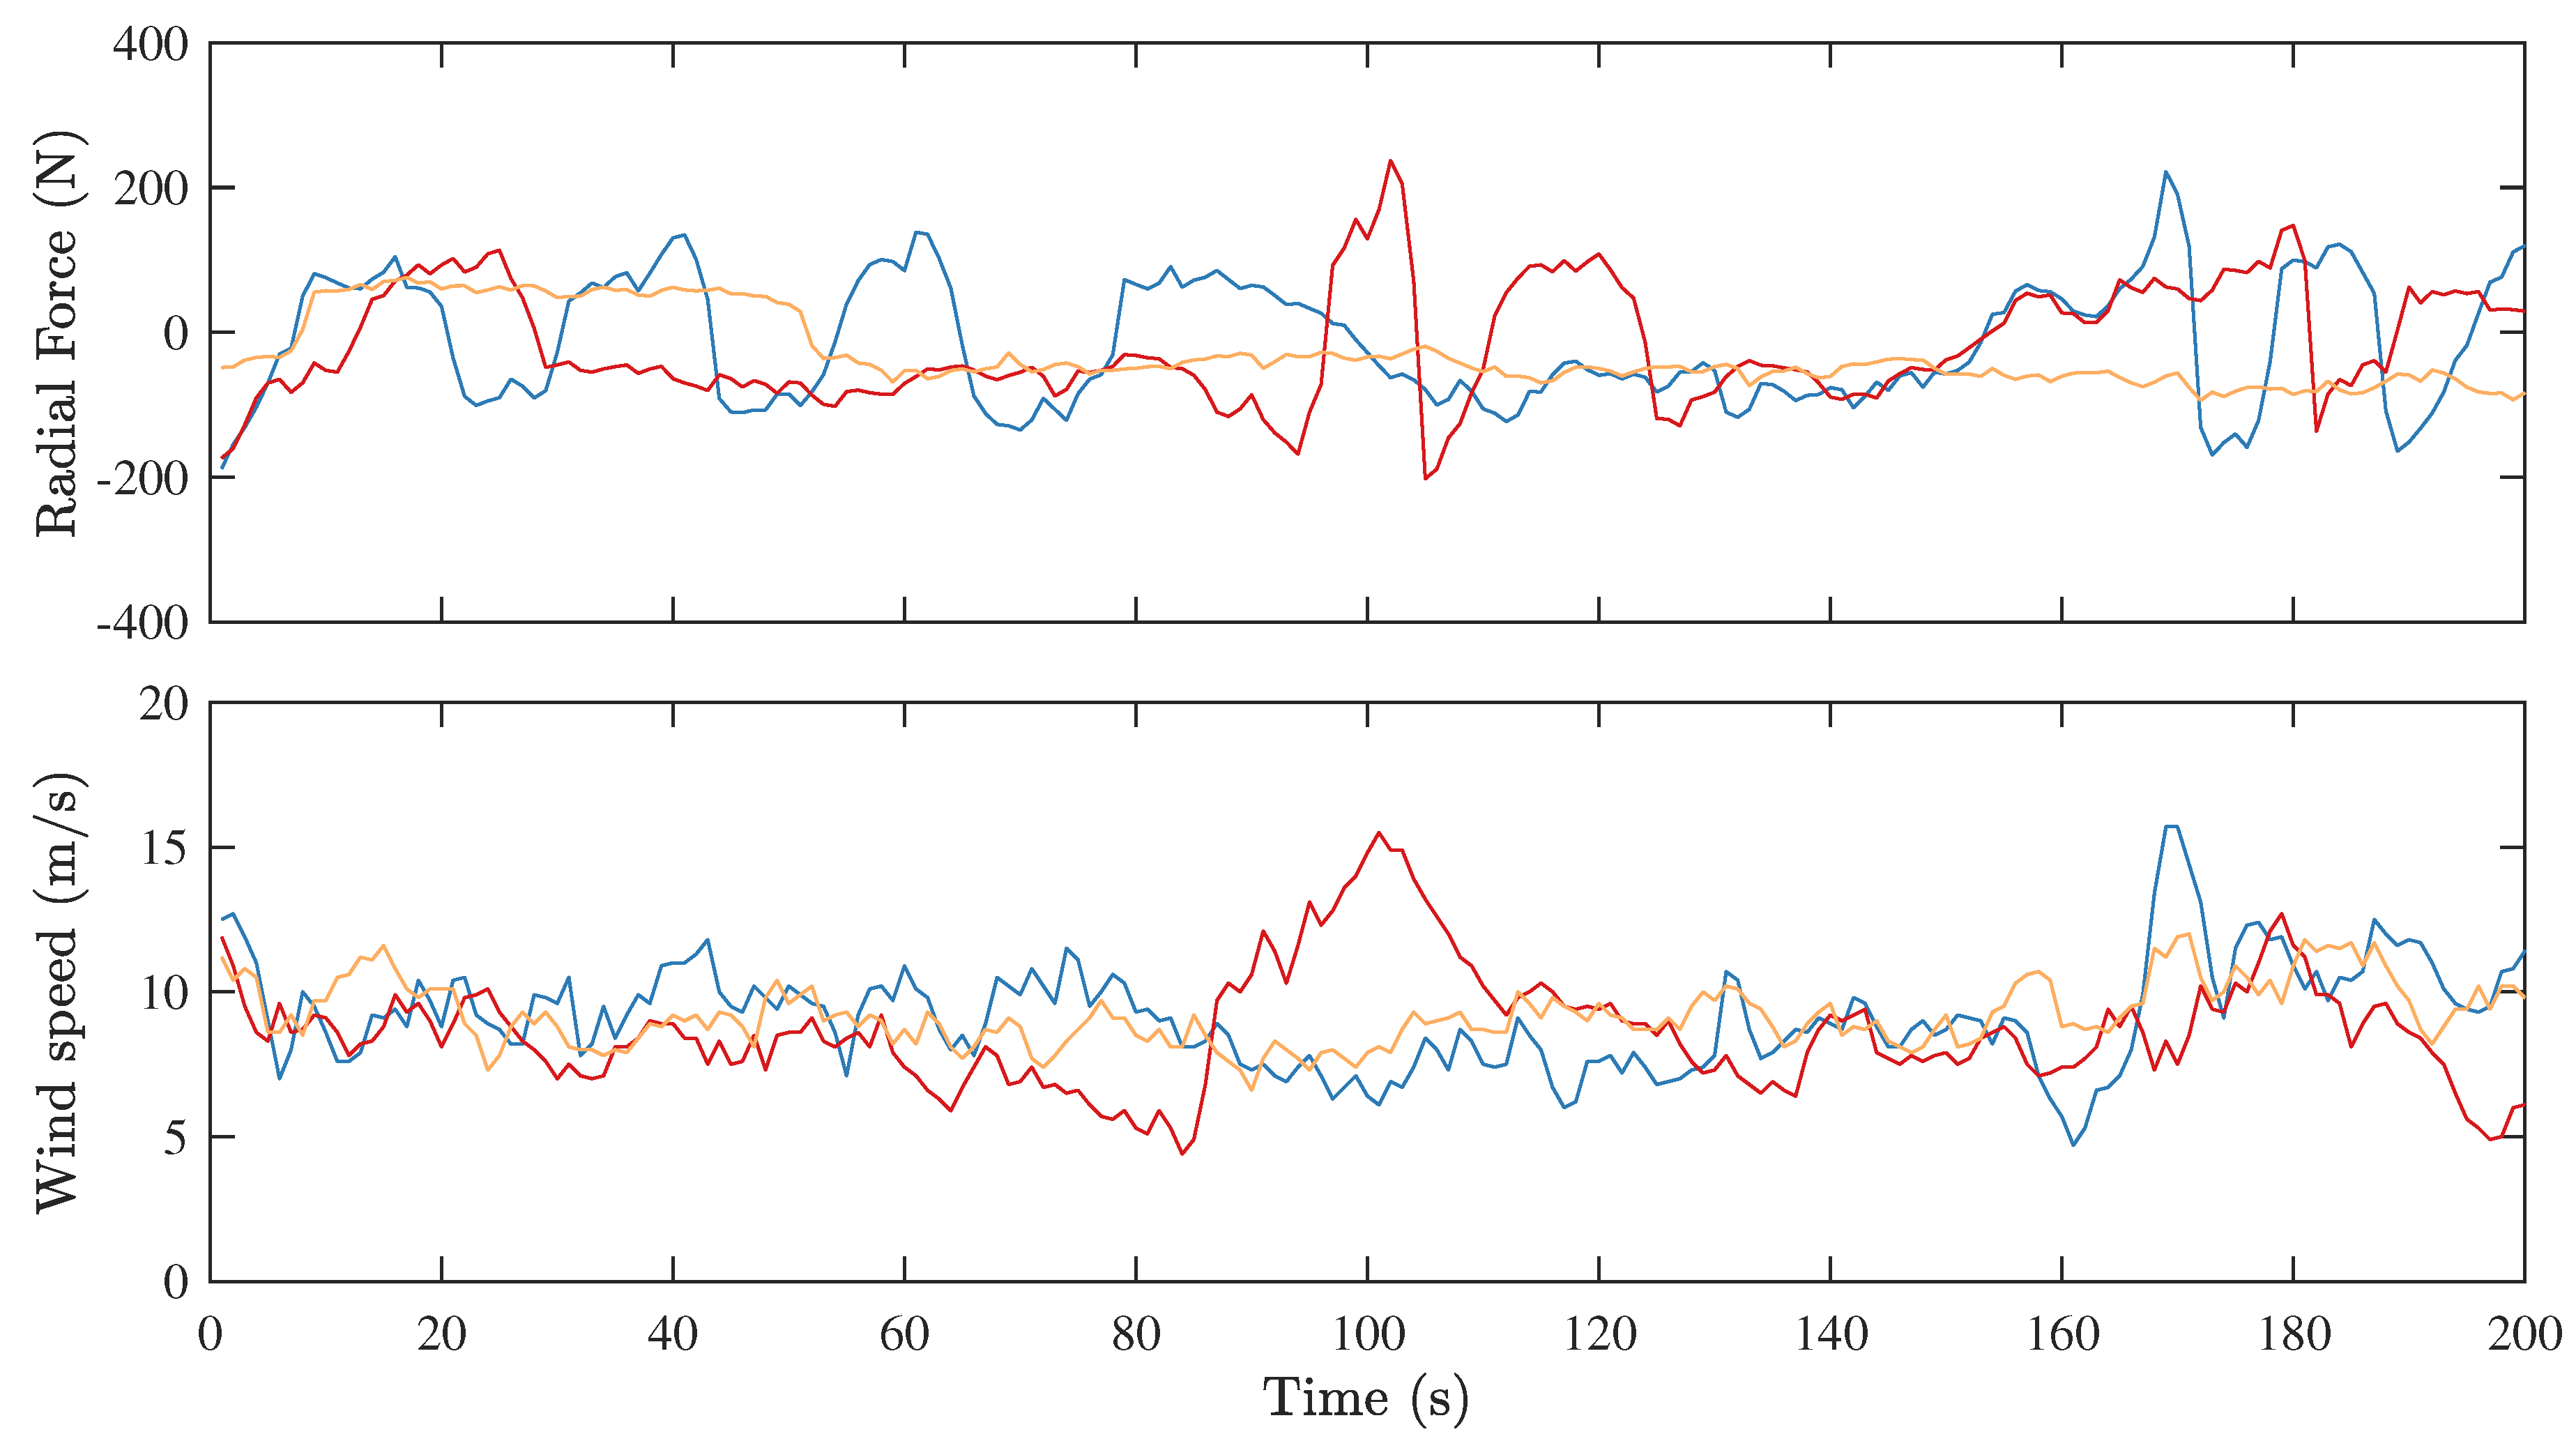
As a final comparison between the mechanically-fixed and the electrically-braked case, time series from the measurements have been plotted for the mechanically-fixed case in Figure 11 and for the electrically-braked case in Figure 12. For the mechanically-braked case, three cases have been chosen to illustrate how the time series look for different wind directions. Here, the force in the radial direction is shown (instead of the total force), as it is desired to show the sign changes of the forces. The main part of the force is in the radial direction, as this direction has the largest surface area. The largest variations for the mechanically-fixed case are when the wind comes from the leading edge (angles of attack close to zero). This can be expected as small changes in the angle of attack give large changes in lift forces here, while if the wind approaches the blade at an angle of attack close to 90°, the forces are more steady although at a higher value. For the electrically-braked case, one cannot choose different wind directions, and the different lines only represent different examples. Here, once the turbine starts to rotate, one can see significant variations in the forces of the blade. These variations are caused by the change in angle between the blade and the wind due to the rotation, and each revolution will give a full load cycle. This should be compared to the much more steady values of the mechanically-fixed case. Hence, allowing the turbine to rotate slowly will give increased fatigue loads on the turbine during extreme wind conditions.
4. Discussion
The presented force measurements are of similar magnitude as the theoretical calculations, but the accuracy of the calculations is somewhat limited. The aim of the calculations is to have a simple theoretical method that is easy to apply. Still, the estimates provide data that seem representative for maximum loads, but less accurate with respect to wind direction. Hence, for determining average loads, a more advanced simulation model or model tests are recommended. One obvious reason for the errors in the calculated loads is that the simplified calculations ignore the interaction between the different blades and the blades with the support arms, which likely is the reason for the lower measured forces when the blades and support arms are aligned with the flow. One other possible reason for the errors in the measurements is that the blade element data in [13] are inaccurate. One can note that several of these values actually are estimated instead of measured, especially the values at higher angles of attack.
One thing to consider for model experiments is the how accurately the measurements scale with size. The most important dimensionless number should be the Reynolds number (wind speed × length/kinematic viscosity), where the length should be a suitable turbine dimension. As the Reynolds number increases with both wind speed and length, its value will be significantly larger for a full-sized turbine at extreme wind conditions, than for the experiments here. The Reynolds number is of particular interest close to the stall angle; however, as noted in [13], lift and drag coefficients are relatively independent of the Reynolds number for large angles of attack. For a parked vertical axis turbine, these large angles should be the most common case; hence, one can expect larger lift forces for a small set of angles close to when the leading edge is facing the wind, but for most cases, the results should be valid in terms of scaling effects. The scaling effects can to some extent be seen in Figure 5 by comparing the curve fit to the measurements. Angles from 270° to 310° show some trends that the force coefficient may increase with increased Reynolds number, but due to the turbulent wind conditions at the site, this can also be an effect of measurement uncertainties.
One difficulty in the comparisons is that the wind distributions are different between the two test cases. For a specific direction, this effect is reduced by grouping the measurement points by the wind speed. However, for the total force values in Figure 10 (Left), this is not as accurate due to the directional dependence of forces. For the fixed blade case, the wind angles giving the lowest forces are more common than for the electrical braking case; hence, the difference in forces may have been smaller, if the fixed blade case would have been tested with the same wind field as during the electrical braking case.
One issue is that the wind velocity can be different between the measurement position and at the turbine blade due to turbulences and static offsets. As there is a quadratic relation between the force and the wind speed, errors in the wind measurement quickly grow. Considering that most of the curves in Figure 5 are relatively close to quadratic, the errors in the mean values due to turbulence are likely limited. The impact on the standard deviation will be large though. This should be taken into account when using the standard deviations presented in Figure 6, if the highest possible load that can occur is to be estimated. As a reference, the raw measurement data are given in Appendix A, showing that the actual peak values are relatively close to the highest values of the calculated curves. Even though the average measured forces are lower than the theoretical predictions, the peak values are relatively close to the theoretical predictions. Hence, using the theoretical predictions can be considered suitable for the turbine design when peak forces are to be considered.
The force coefficient is normalized with respect to the blade area, while the support arms also give a contribution to the force. This should be taken into account if the inclination angle or size of the support arms is different, compared to the experimental turbine. Especially the radial force should be affected due to the change in surface area in this direction. Hence, with the current normalization, one can expect an increasing radial force coefficient with increased inclination angle of the support arms.
Electromechanical braking of a permanent magnet generator is a feasible solution to add a brake to a wind turbine system. The brake could be implemented as a simple resistive load. However, the results here indicate that it may be hard to find a single fixed resistance value that brakes the turbine safely, while keeping the rotational speed at high winds sufficiently low (cf. Figure 10 (Right)). A solution is to add dual resistive brake loads; one for braking and one for parking. The parking resistance may simply be a short-circuit of the generator.
Although the results here indicate that a mechanically-fixed turbine is beneficial for the blade itself in terms of fatigue loads, there can be other benefits to having an electrically-braked turbine. As previously mentioned, using an electrically-braked turbine can reduce torsional vibrations in the shaft, as the generator can dampen these oscillations [7]. Hence, one should look at the entire system before deciding which parking strategy to use. The results here will therefore not definitely say which strategy to use, but should work as important input in any future design of a VAWT.
5. Conclusions
This paper presents measurements on the blade forces on a straight-bladed turbine while it is parked. These results can be used to estimate the loads at extreme wind conditions, which is useful for the structural design of a VAWT.
There is a significant directional dependence on the forces. A fixed blade with the leading edge facing the dominating wind direction will experience lower forces than average. This can be useful for two-bladed turbines. If the turbine is parked with the blade facing the dominating wind direction, the forces will be lower than if it is parked in a random position. Even better should be to adapt the position according to the actual wind direction.
A simple calculation of the forces from blade element data will for most directions give a higher estimated force than the average measured force values. However, peak values are still observed of similar magnitude as the estimated forces, showing that the estimated forces can be a good design criterion.
It is possible to both park the turbine using electric braking and using a mechanical brake. Due to the net positive torque at stand still, electric braking can be insufficient to keep the turbine from rotating slowly. The rotation can increase the fatigue loads on the blades since the forces change significantly with direction.
Acknowledgments
The J. Gust Richert foundation is acknowledged for contributions of equipment for the experiments. This work was conducted within the STandUp for Energy strategic research framework, and it is a part of STandUp for Wind.
Author Contributions
Anders Goude was the main author responsible for the paper. Morgan Rossander collected the measurements. Both authors have taken part in data analysis and interpretation.
Conflicts of Interest
The authors declare no conflict of interest.
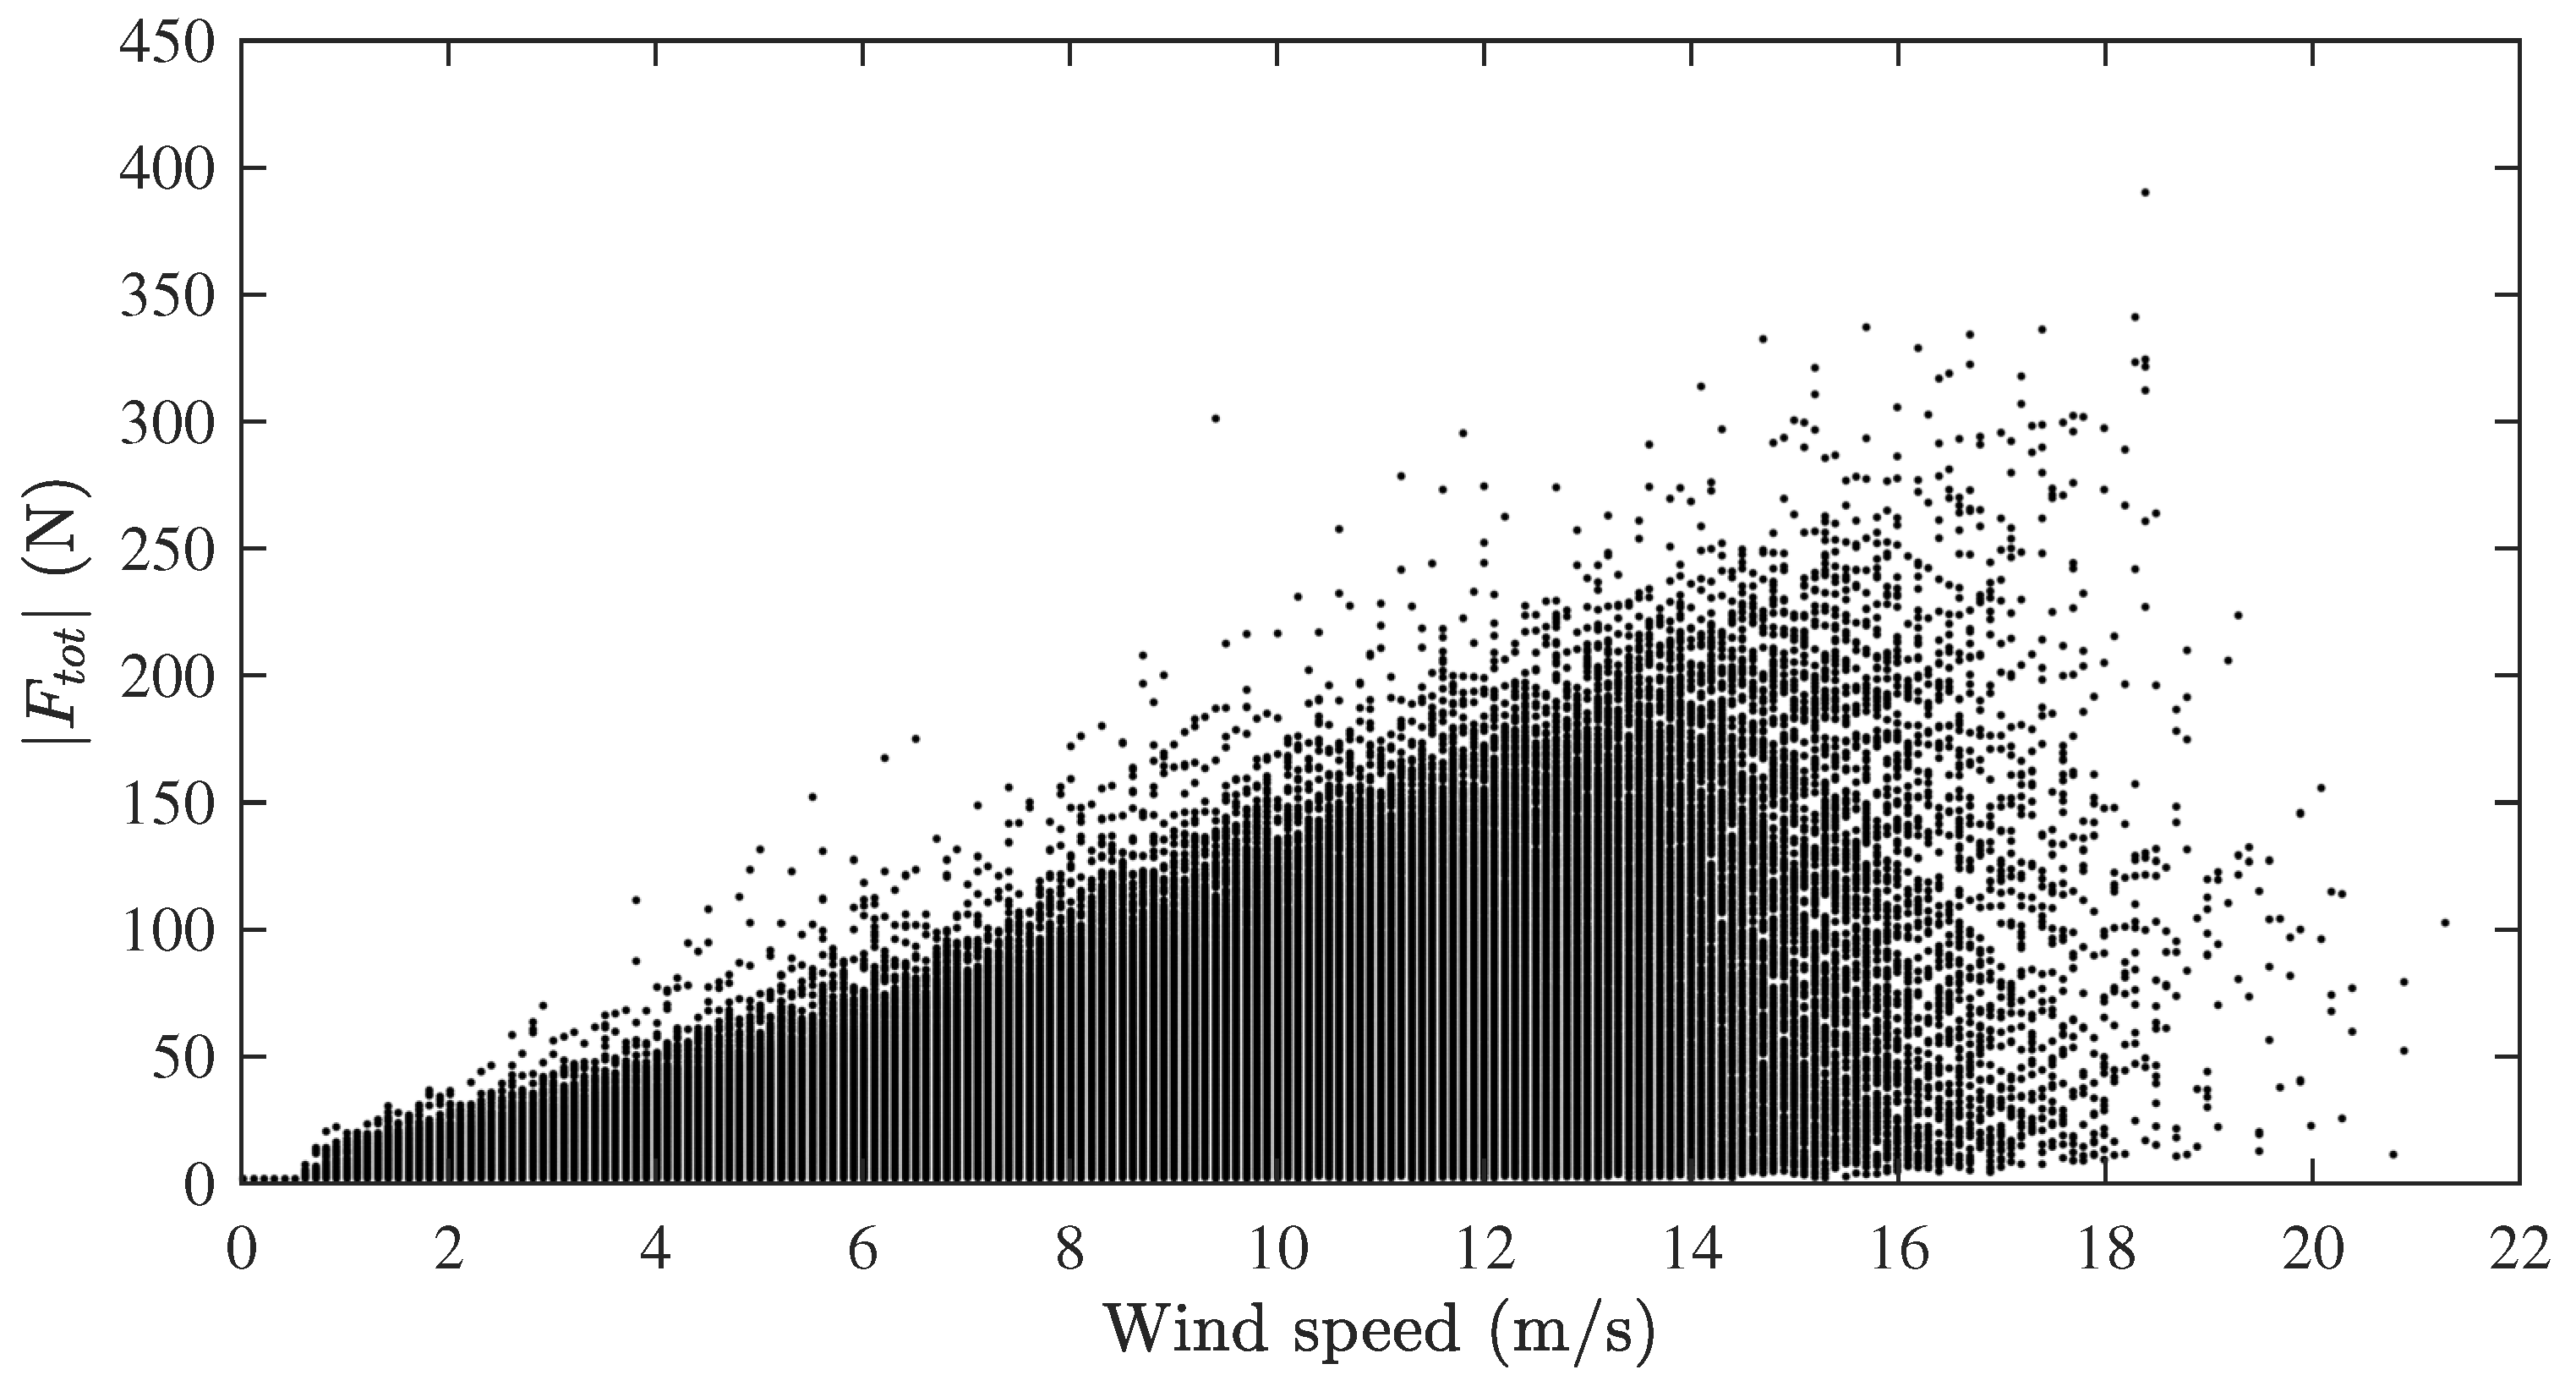
Appendix A. Raw 1 Hz Data
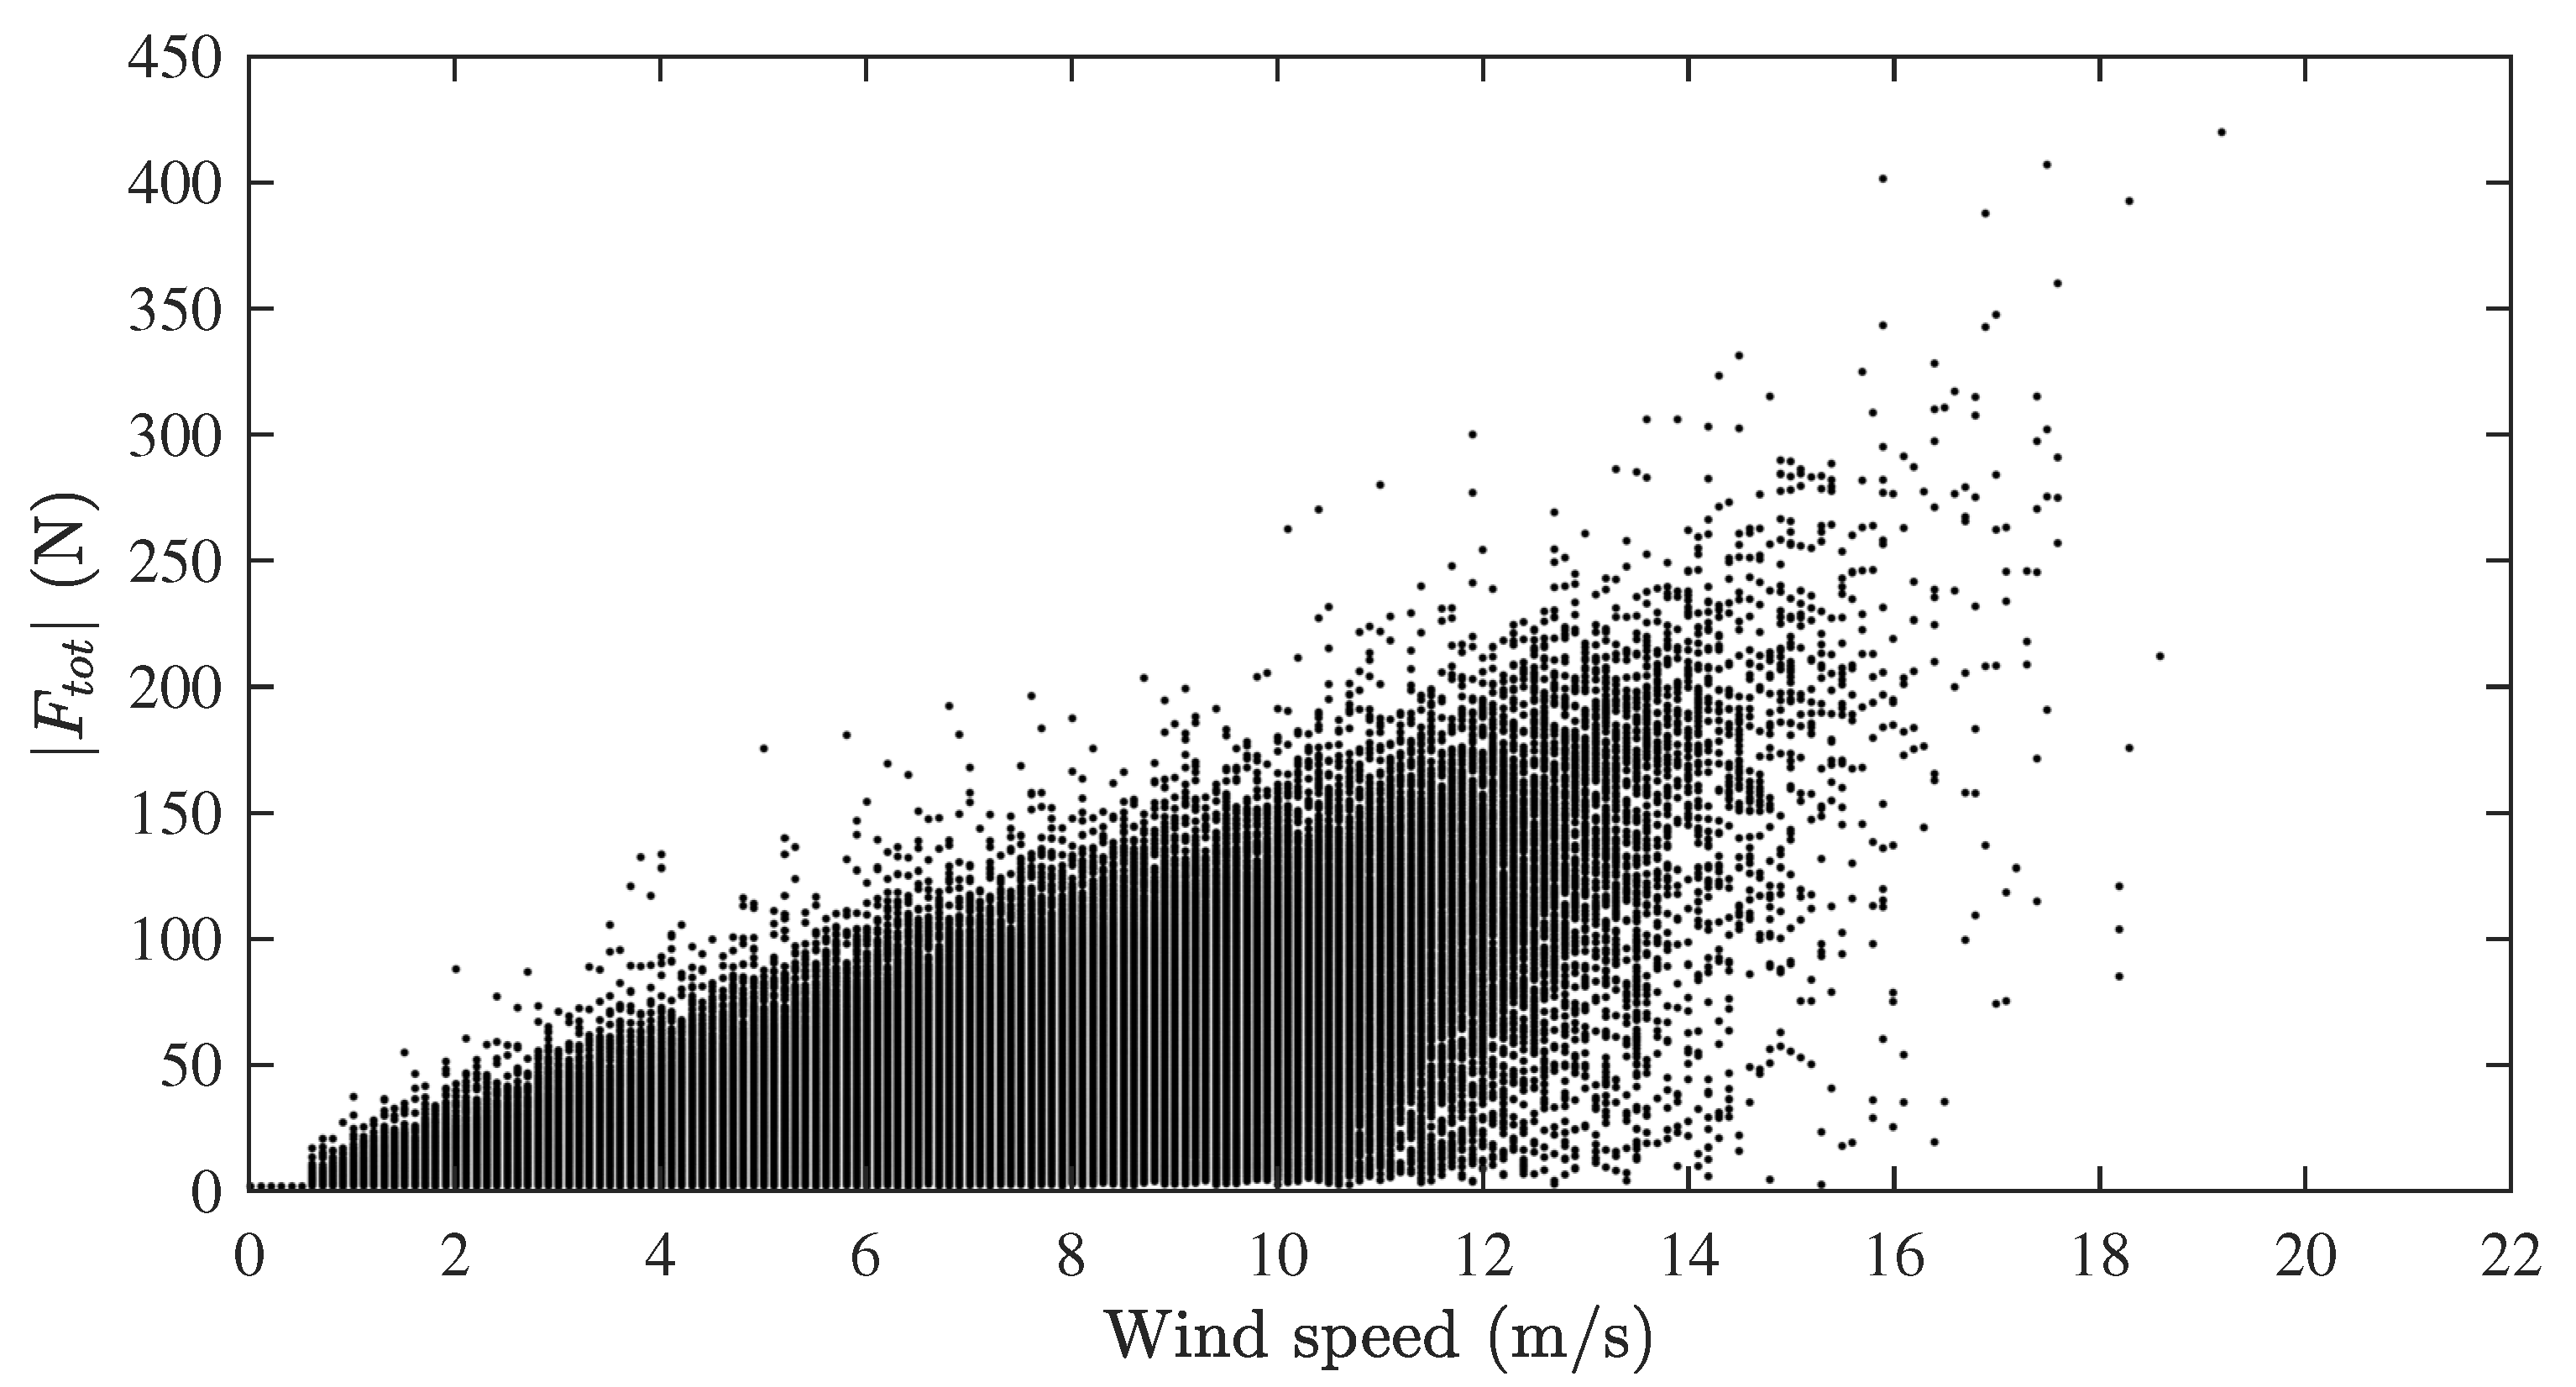
The standard deviation is relatively large for many cases in the results presented. One reason for these variations is errors in the measured wind speed. It is therefore of importance to also look at the actual measured values for the forces. Hence, all measurement points have been plotted in Figure A1 for the electric-braking case and in Figure A2 for the mechanically-fixed case. Each dot represent one measurement point. These figures contain unfiltered 1 s values for the total force . Note that the resolution of the anemometer is m/s.
Figure A1.
All measurement points for the electrical-braking case.

Figure A2.
All measurement points for the mechanically-fixed case.
References
- Bhutta, M.M.A.; Hayat, N.; Farooq, A.U.; Ali, Z.; Jamil, S.R.; Hussain, Z. Vertical axis wind turbine—A review of various configurations and design techniques. Renew. Sustain. Energy Rev. 2012, 16, 1926–1939. [Google Scholar] [CrossRef]
- Tjiu, W.; Marnoto, T.; Mat, S.; Ruslan, M.H.; Sopian, K. Darrieus vertical axis wind turbine for power generation I: Assessment of Darrieus VAWT configurations. Renew. Energy 2015, 75, 50–67. [Google Scholar] [CrossRef]
- Tjiu, W.; Marnoto, T.; Mat, S.; Ruslan, M.H.; Sopian, K. Darrieus vertical axis wind turbine for power generation II: Challenges in HAWT and the opportunity of multi-megawatt Darrieus VAWT development. Renew. Energy 2015, 75, 560–571. [Google Scholar] [CrossRef]
- Ottermo, F.; Bernhoff, H. An upper size of vertical axis wind turbines. Wind Energy 2014, 17, 1623–1629. [Google Scholar] [CrossRef]
- Eriksson, S.; Bernhoff, H.; Leijon, M. Evaluation of different turbine concepts for wind power. Renew. Sustain. Energy Rev. 2008, 12, 1419–1434. [Google Scholar] [CrossRef]
- Kong, C.; Bang, J.; Sugiyama, Y. Structural investigation of composite wind turbine blade considering various load cases and fatigue life. Energy 2004, 30, 2101–2114. [Google Scholar] [CrossRef]
- Ottermo, F.; Eriksson, S.; Bernhoff, H. Parking Strategies for Vertical Axis Wind Turbines. ISRN Renew. Energy 2012, 2012. [Google Scholar] [CrossRef]
- Paulsen, U.S.; Madsen, H.A.; Hattel, J.H.; Baran, I.; Nielsen, P.H. Design Optimization of a 5 MW Floating Offshore Vertical-axis Wind Turbine. Energy Procedia 2013, 35, 22–32. [Google Scholar] [CrossRef] [Green Version]
- Kjellin, J.; Bülow, F.; Eriksson, S.; Deglaire, P. Power coefficient measurement on a 12 kW straight bladed vertical axis wind turbine. Renew. Energy 2011, 36, 3050–3053. [Google Scholar] [CrossRef]
- Rossander, M.; Dyachuk, E.; Apelfröjd, S.; Trolin, K.; Goude, A.; Bernhoff, H.; Eriksson, S. Evaluation of a Blade Force Measurement System for a Vertical Axis Wind Turbine Using Load Cells. Energies 2015, 8, 5973–5996. [Google Scholar] [CrossRef]
- Dyachuk, E.; Rossander, M.; Goude, A.; Bernhoff, H. Measurements of the Aerodynamic Normal Forces on a 12-kW Straight-Bladed Vertical Axis Wind Turbine. Energies 2015, 8, 8482–8496. [Google Scholar] [CrossRef]
- Eriksson, S.; Solum, A.; Leijon, M.; Bernhoff, H. Simulations and experiments on a 12 kW direct driven PM synchronous generator for wind power. Renew. Energy 2008, 33, 674–681. [Google Scholar] [CrossRef]
- Sheldahl, R.E.; Klimas, P.C. Aerodynamic Characteristics of Seven Symmetrical Airfoil Sections through 180-Degree Angle of Attack for Use in Aerodynamic Analysis of Vertical Axis Wind Turbines; Technical Report; Sandia National Laboratories (SNL): Albuquerque, NM, USA; Livermore, CA, USA, 1981.
- Drela, M. XFOIL: An Analysis and Design System for Low Reynolds Number Airfoils. In Low Reynolds Number Aerodynamics; Mueller, T.J., Ed.; Springer: Berlin/Heidelberg, Germany, 1989; pp. 1–12. [Google Scholar]
- Goude, A. Fluid Mechanics of Vertical Axis Turbines: Simulations and Model Development. Ph.D. Thesis, Acta Universitatis Upsaliensis, Uppsala, Sweden, 2012. [Google Scholar]
Figure 1.
The turbine prototype.
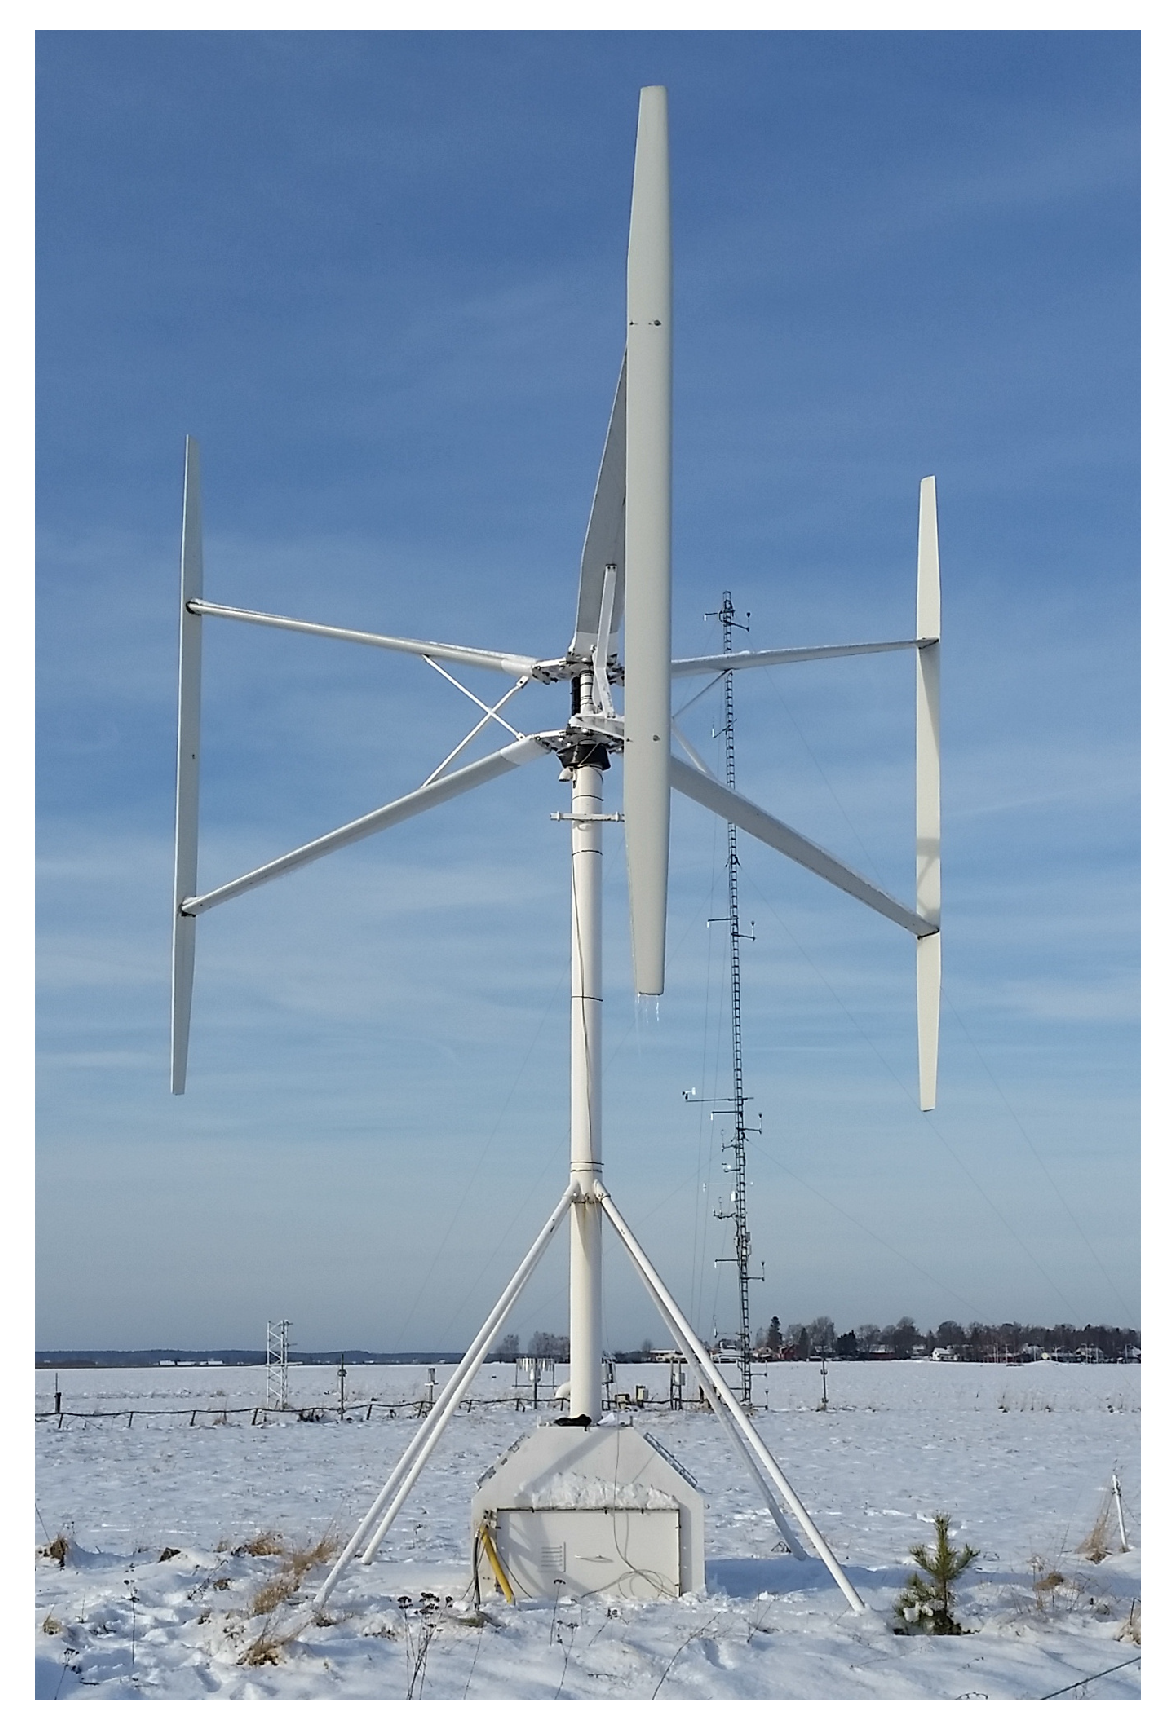
Figure 2.
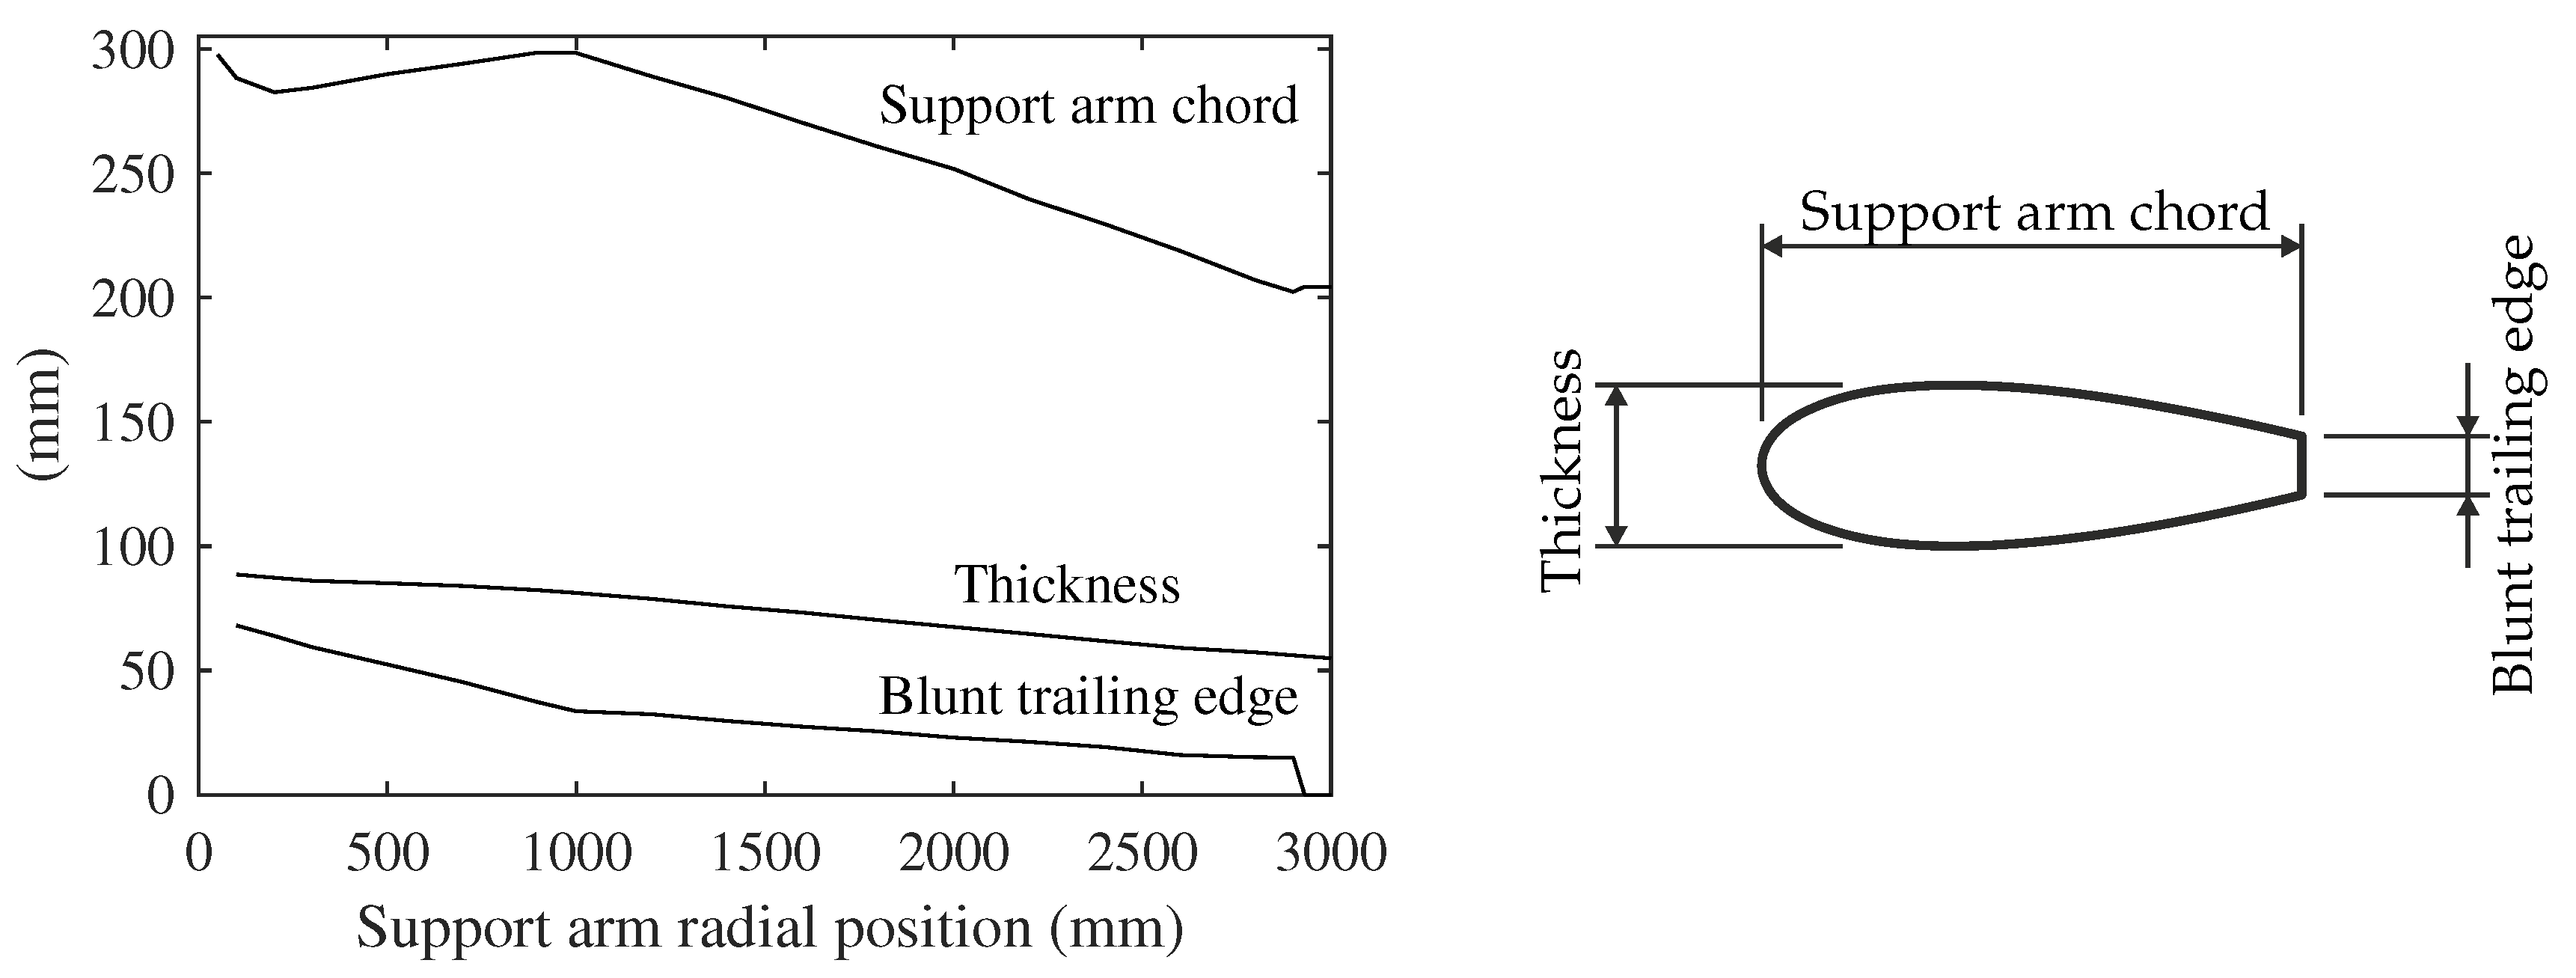
The support arm design is based on a NACA0025 profile, but where the upper and lower halves have been separated at the trailing edge, causing a blunt trailing edge. Left: How the dimensions of the support arms vary with radial position. Zero radial position represents the start of the support arm, which is attached m from the turbine axis. Right: Cross-section of the support arm with the specification of the varying values.
Figure 2.
The support arm design is based on a NACA0025 profile, but where the upper and lower halves have been separated at the trailing edge, causing a blunt trailing edge. Left: How the dimensions of the support arms vary with radial position. Zero radial position represents the start of the support arm, which is attached m from the turbine axis. Right: Cross-section of the support arm with the specification of the varying values.

Figure 3.
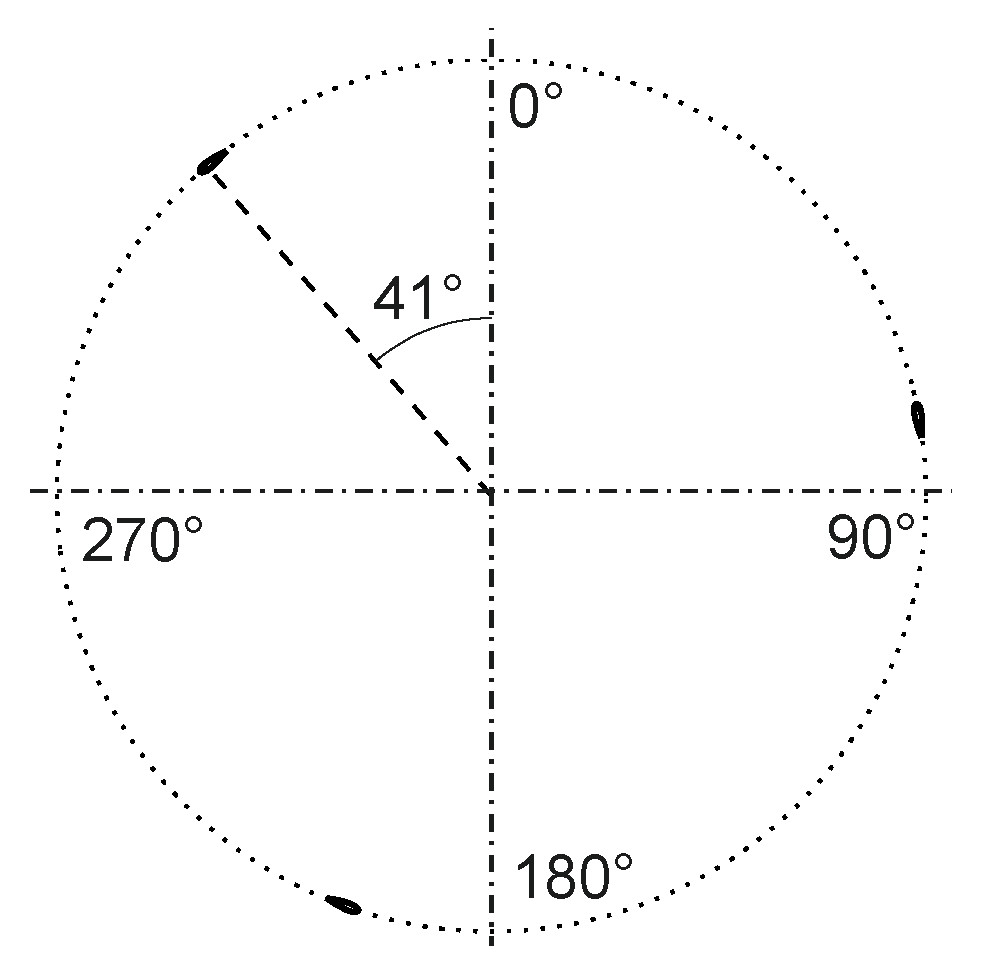
Illustrative drawing of the turbine from above. The blade with the measurement equipment is located 41° from north.
Figure 3.
Illustrative drawing of the turbine from above. The blade with the measurement equipment is located 41° from north.

Figure 4.
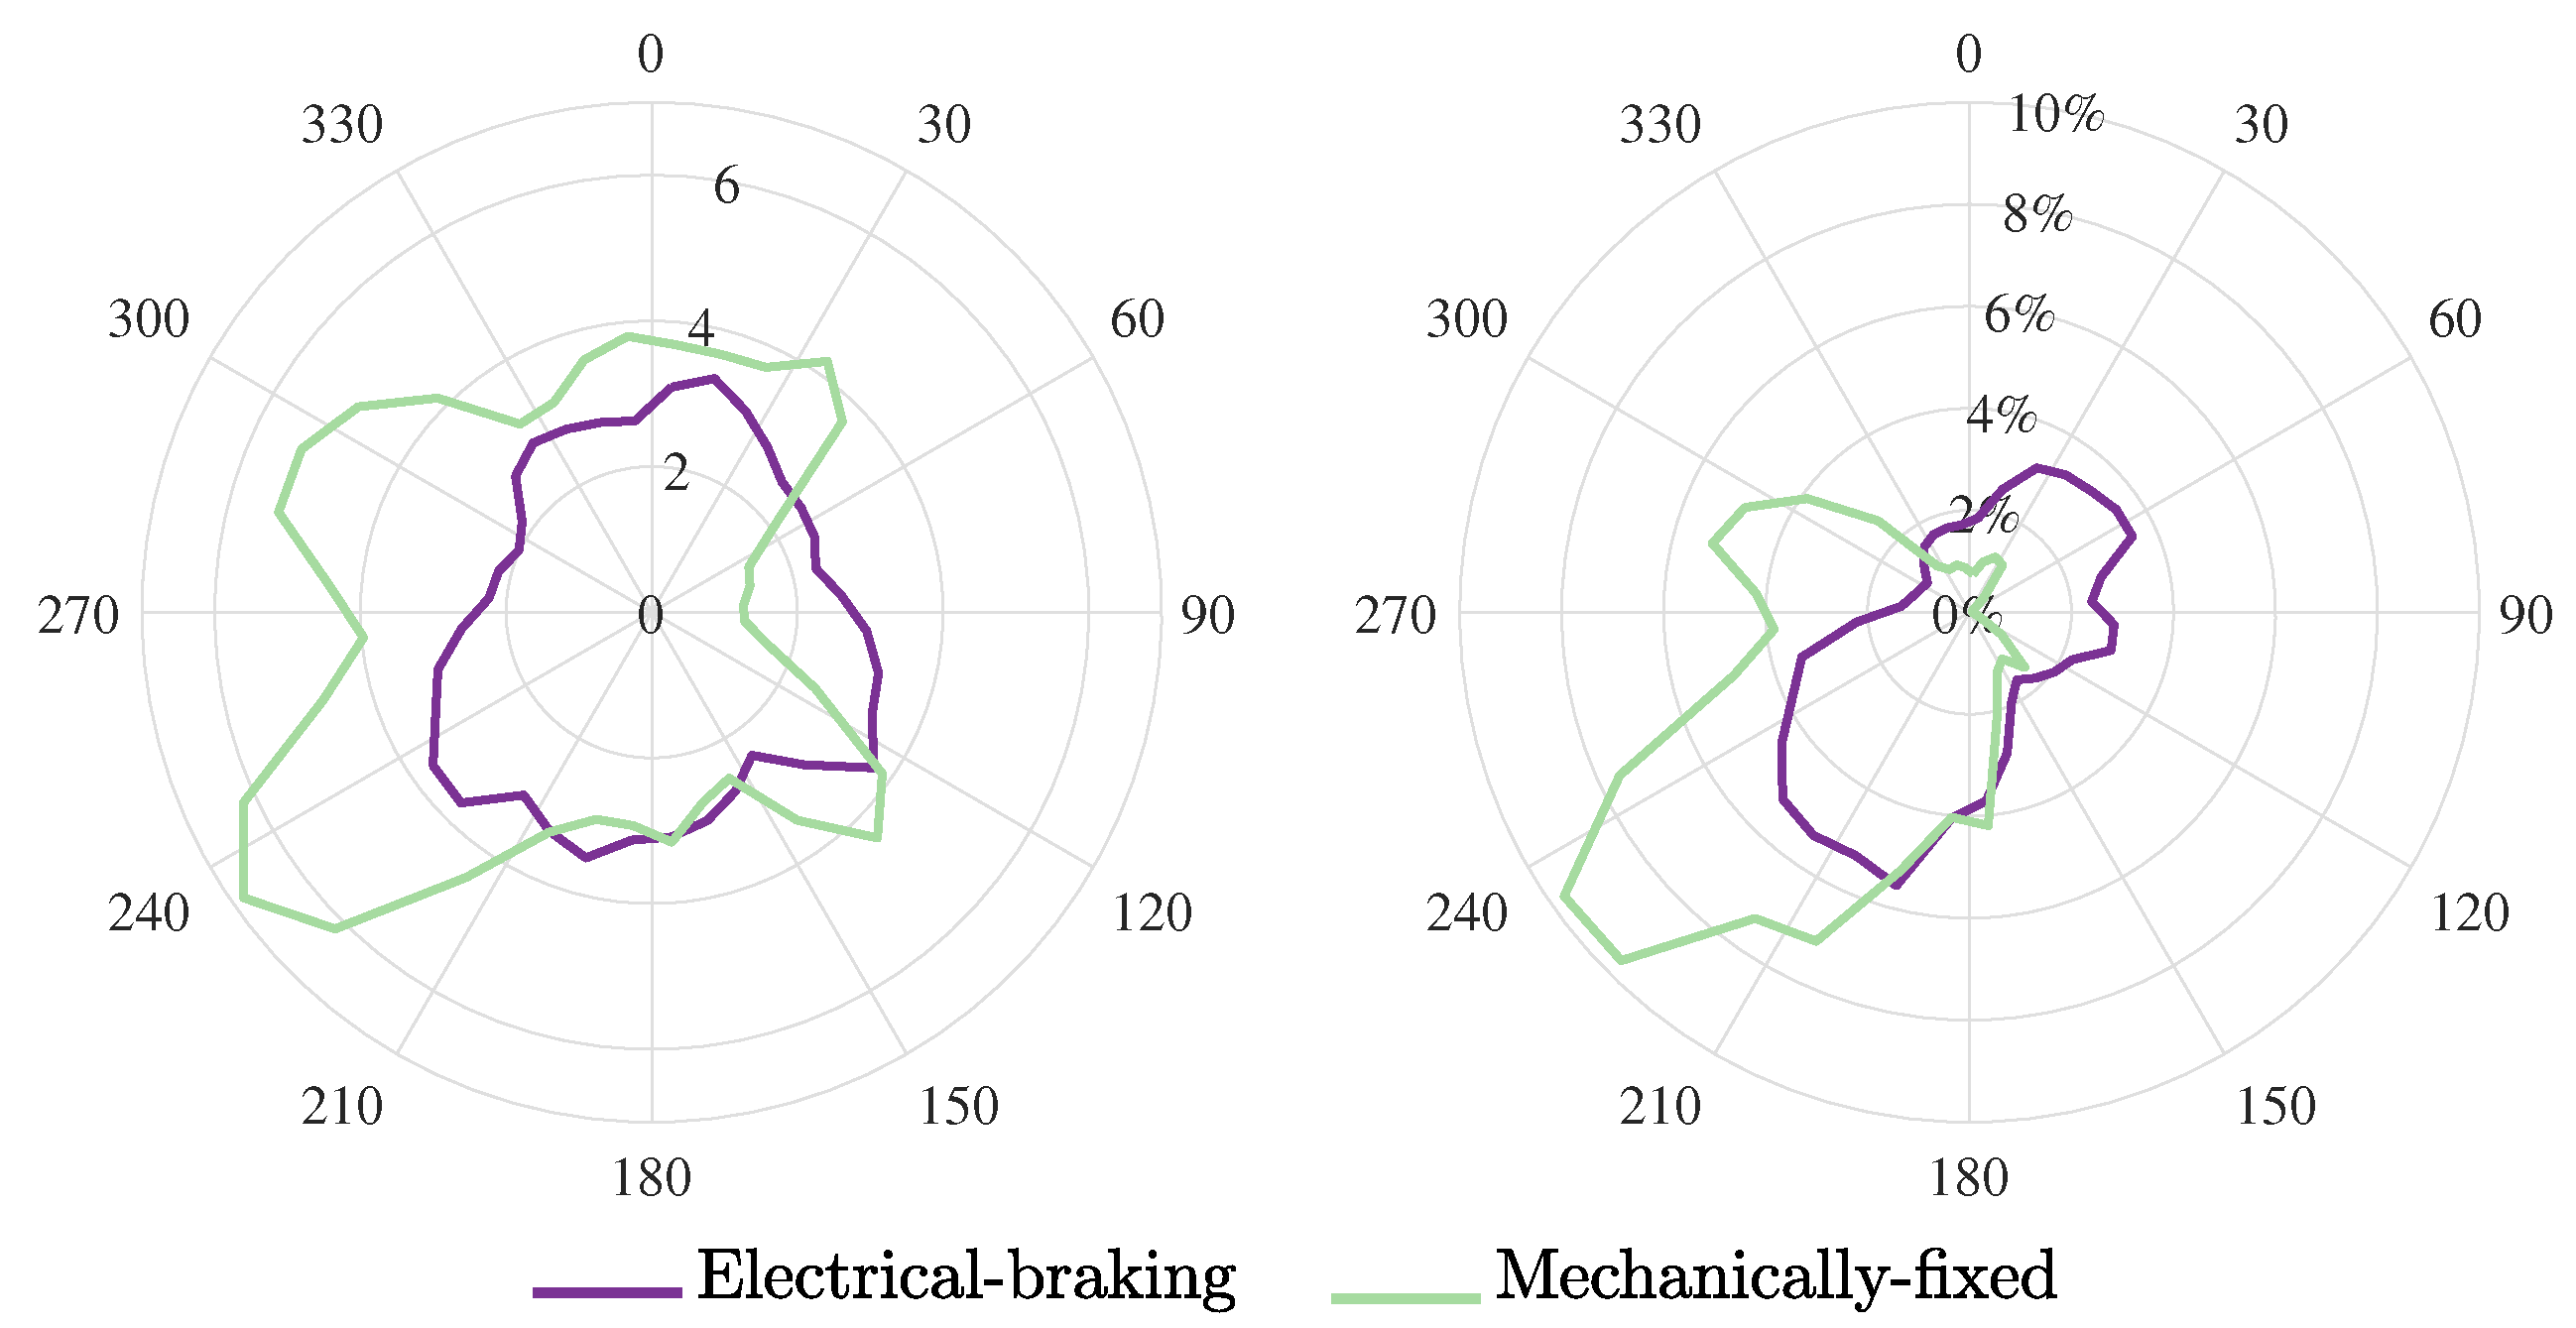
Wind rose data. Left: The average wind speed in () during the measurements. Right: The distribution of the data in the 18 different bins used, expressed in relation to the total number of samples. The total number of 1 s samples is 2.67 × 10⁶ for the electrical braking case and 1.27 × 10⁶ for the mechanically-fixed case.
Figure 4.
Wind rose data. Left: The average wind speed in () during the measurements. Right: The distribution of the data in the 18 different bins used, expressed in relation to the total number of samples. The total number of 1 s samples is 2.67 × 10⁶ for the electrical braking case and 1.27 × 10⁶ for the mechanically-fixed case.

Figure 5.
The total force on the blade sorted by wind direction. In each direction the data have been grouped by the wind speed, and the average of each wind speed is plotted. The presented curve-fits are based on all data in each direction.
Figure 5.
The total force on the blade sorted by wind direction. In each direction the data have been grouped by the wind speed, and the average of each wind speed is plotted. The presented curve-fits are based on all data in each direction.
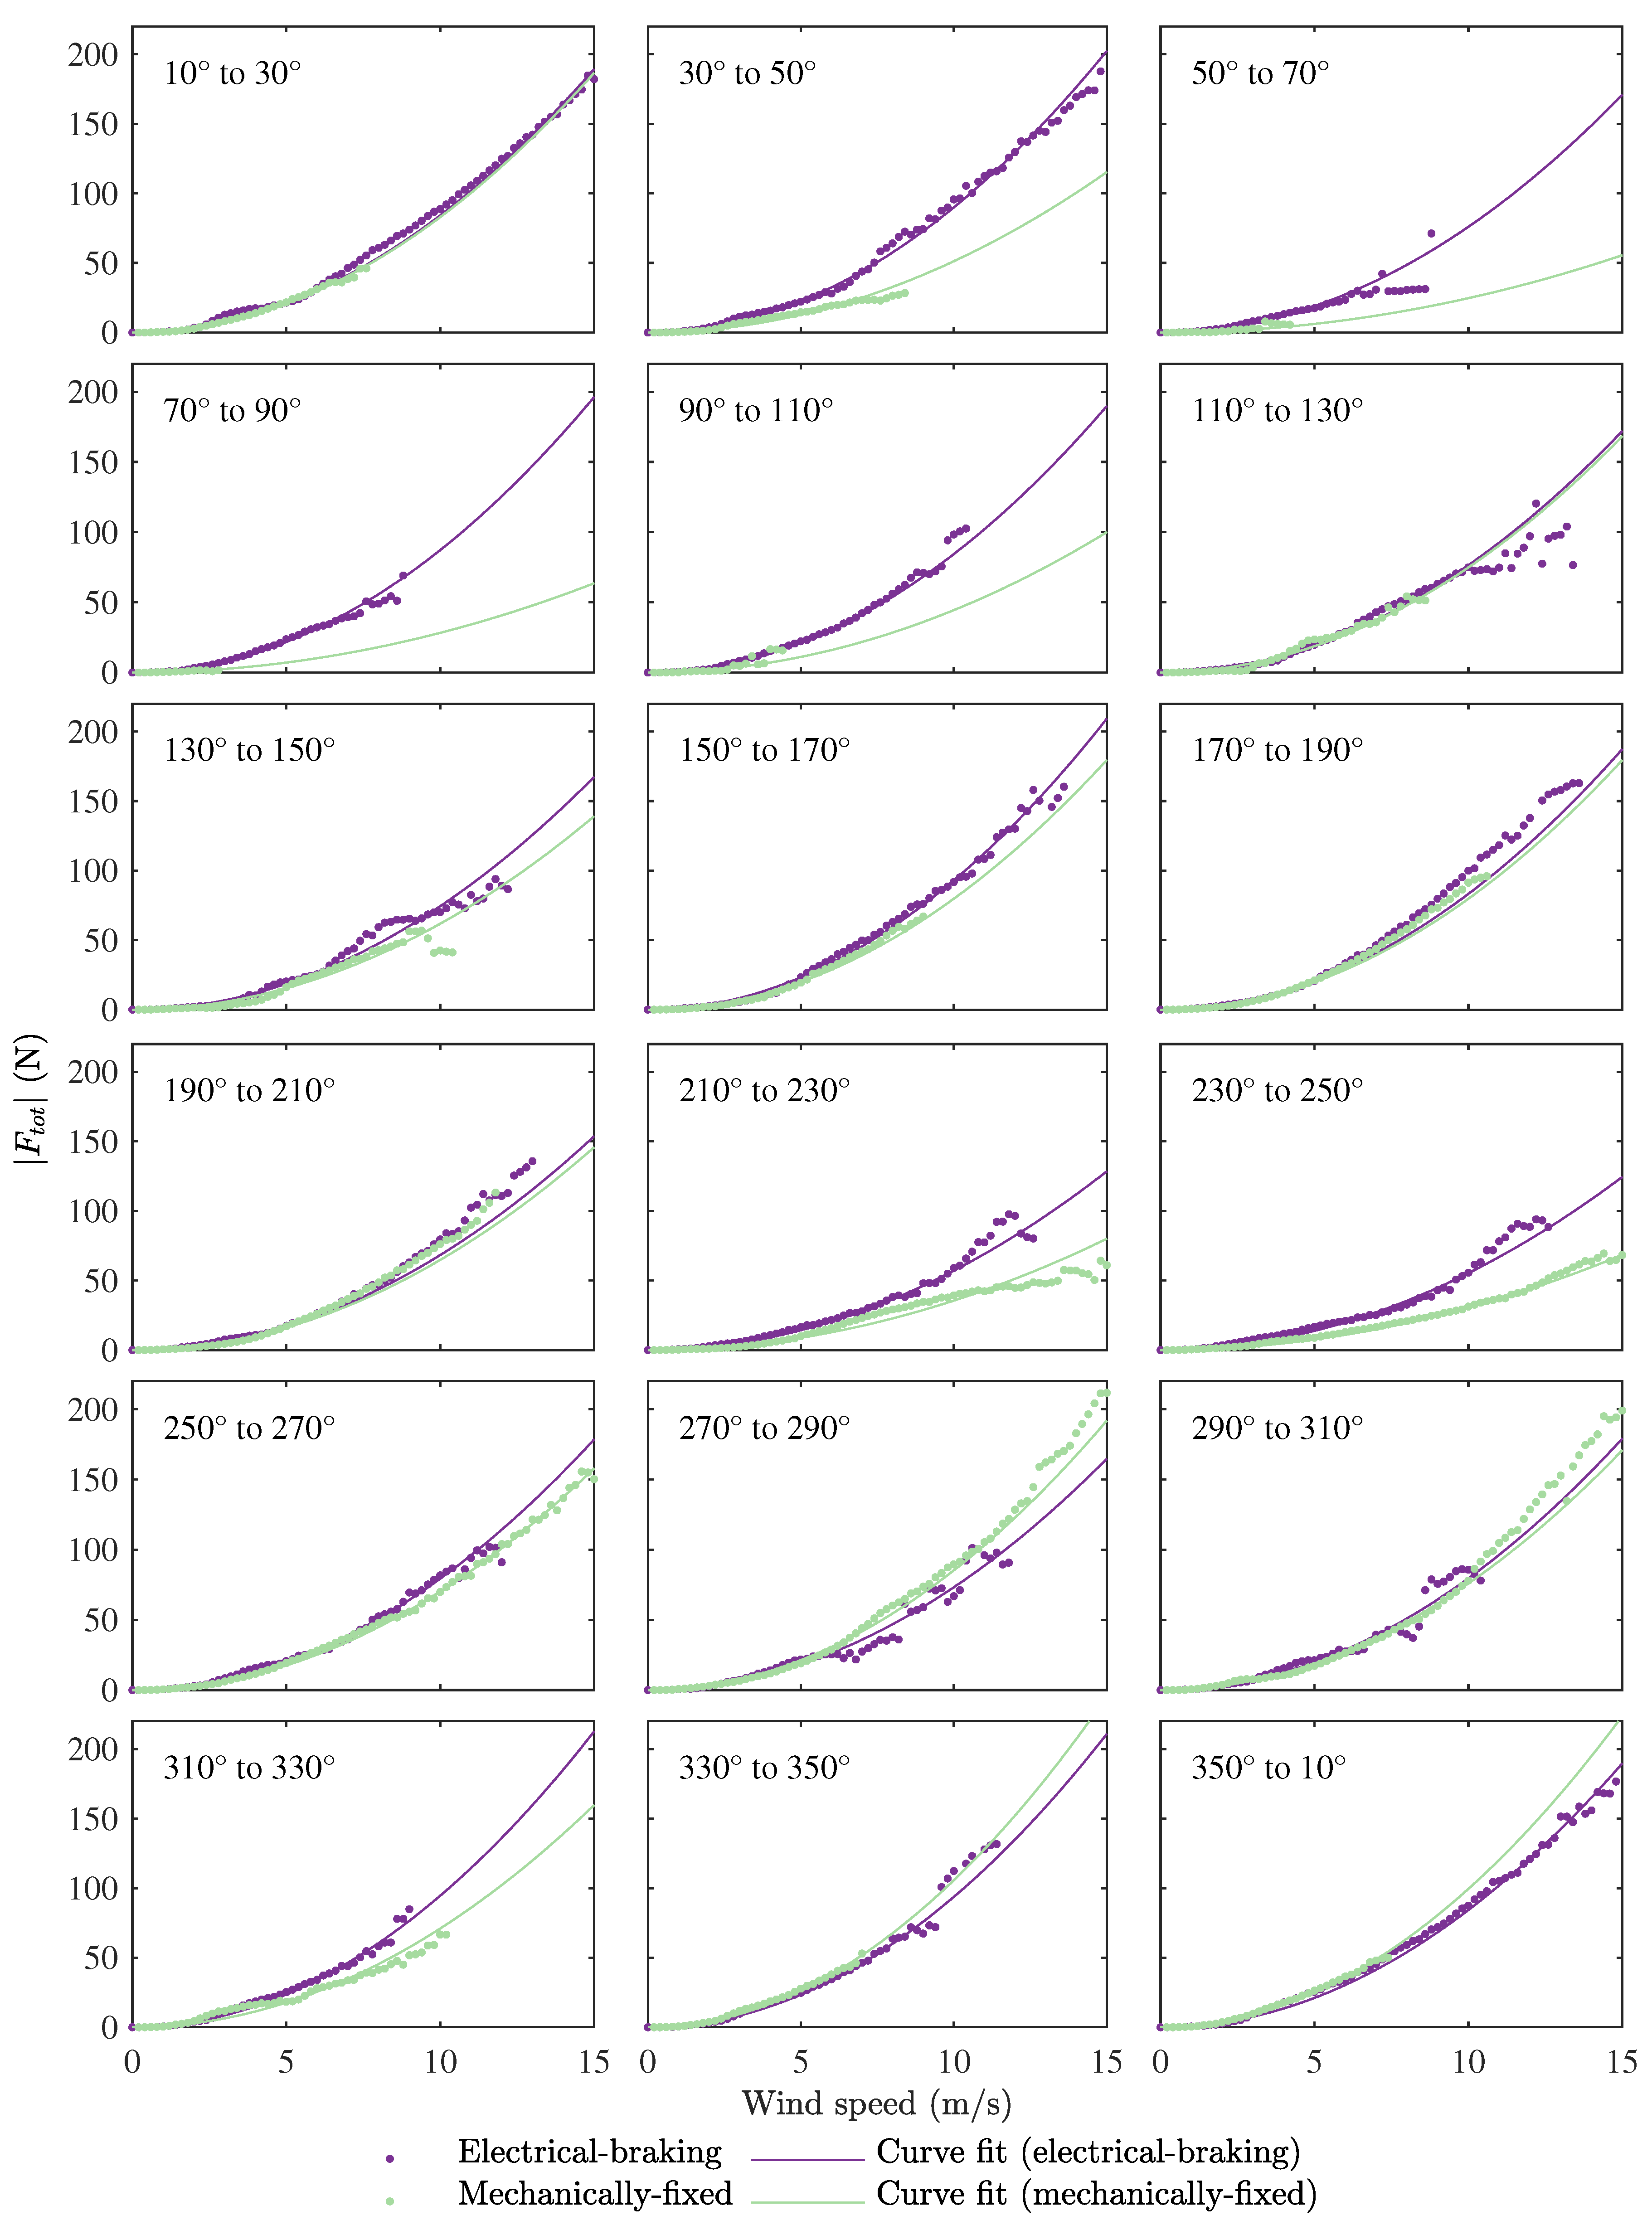
Figure 6.
Left: The coefficients of the squared curve fits as a function of wind direction. The lowest value occurs at 228° during the electrical braking situation and at 233° for the mechanically-fixed situation. Right: The deviation in the data as defined by Equation (3).
Figure 6.
Left: The coefficients of the squared curve fits as a function of wind direction. The lowest value occurs at 228° during the electrical braking situation and at 233° for the mechanically-fixed situation. Right: The deviation in the data as defined by Equation (3).
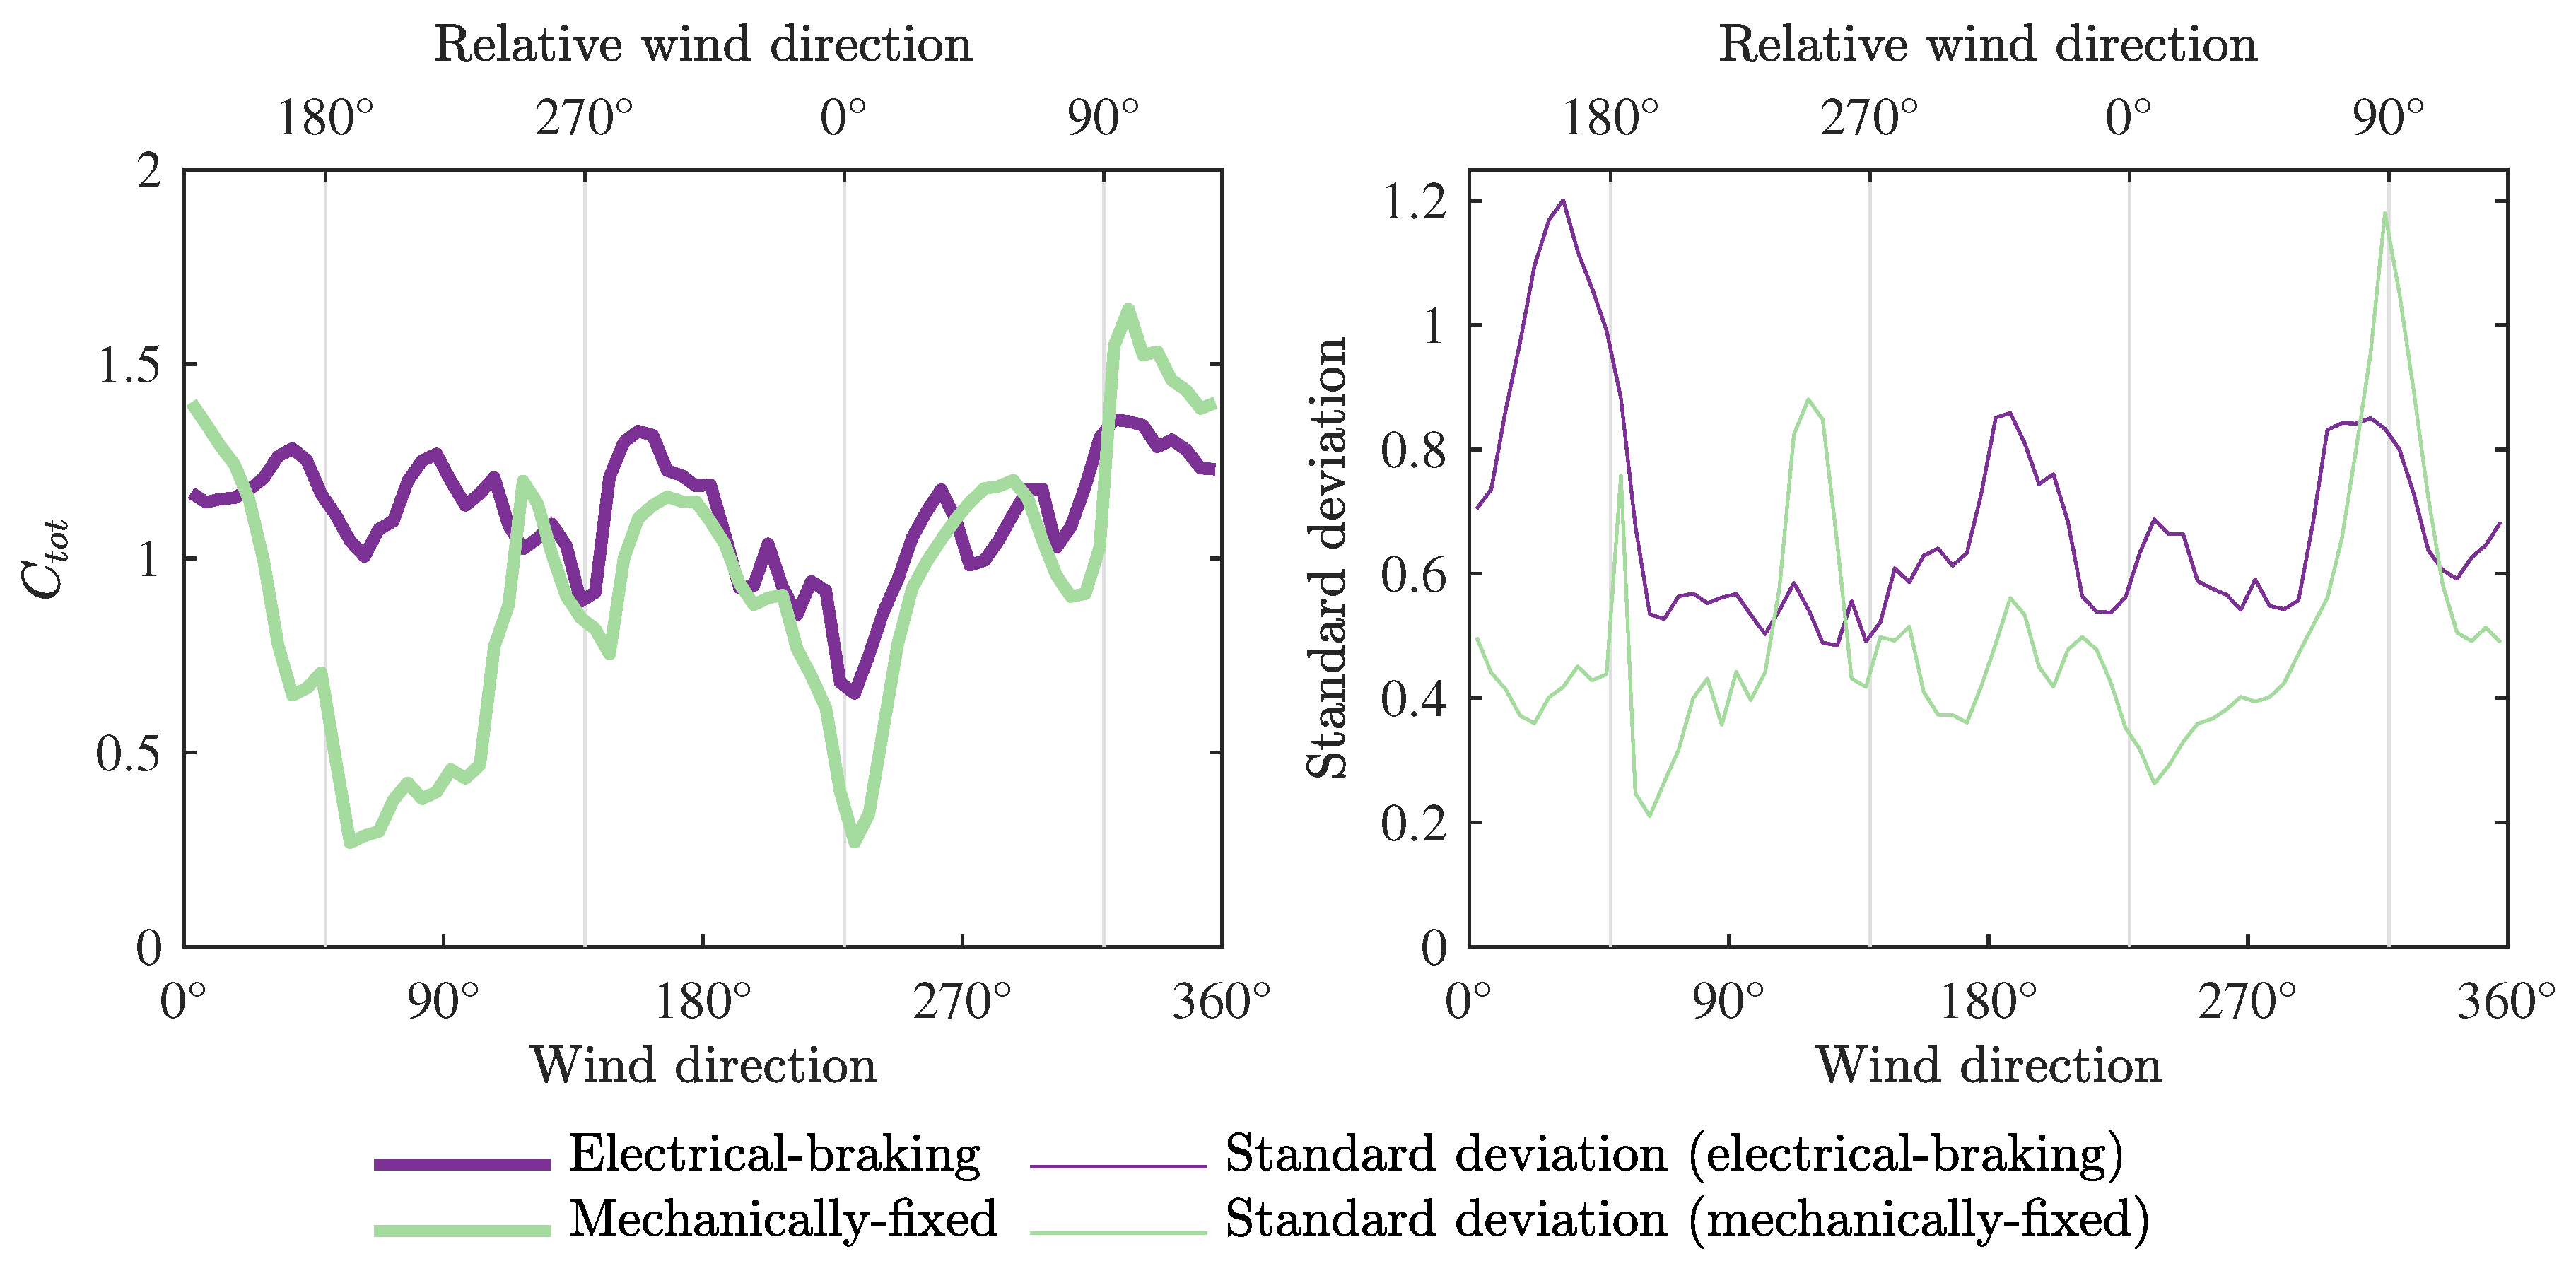
Figure 7.
Left: Calculated values for the force coefficient. Right: Illustration of the relative wind direction. The absolute wind direction is illustrated in the blue axis. Note that the blade has a 2° pitch angle.
Figure 7.
Left: Calculated values for the force coefficient. Right: Illustration of the relative wind direction. The absolute wind direction is illustrated in the blue axis. Note that the blade has a 2° pitch angle.

Figure 8.
Left: Comparison of measured and calculated forces in the radial direction. Right: Standard deviation of the measurements.
Figure 8.
Left: Comparison of measured and calculated forces in the radial direction. Right: Standard deviation of the measurements.
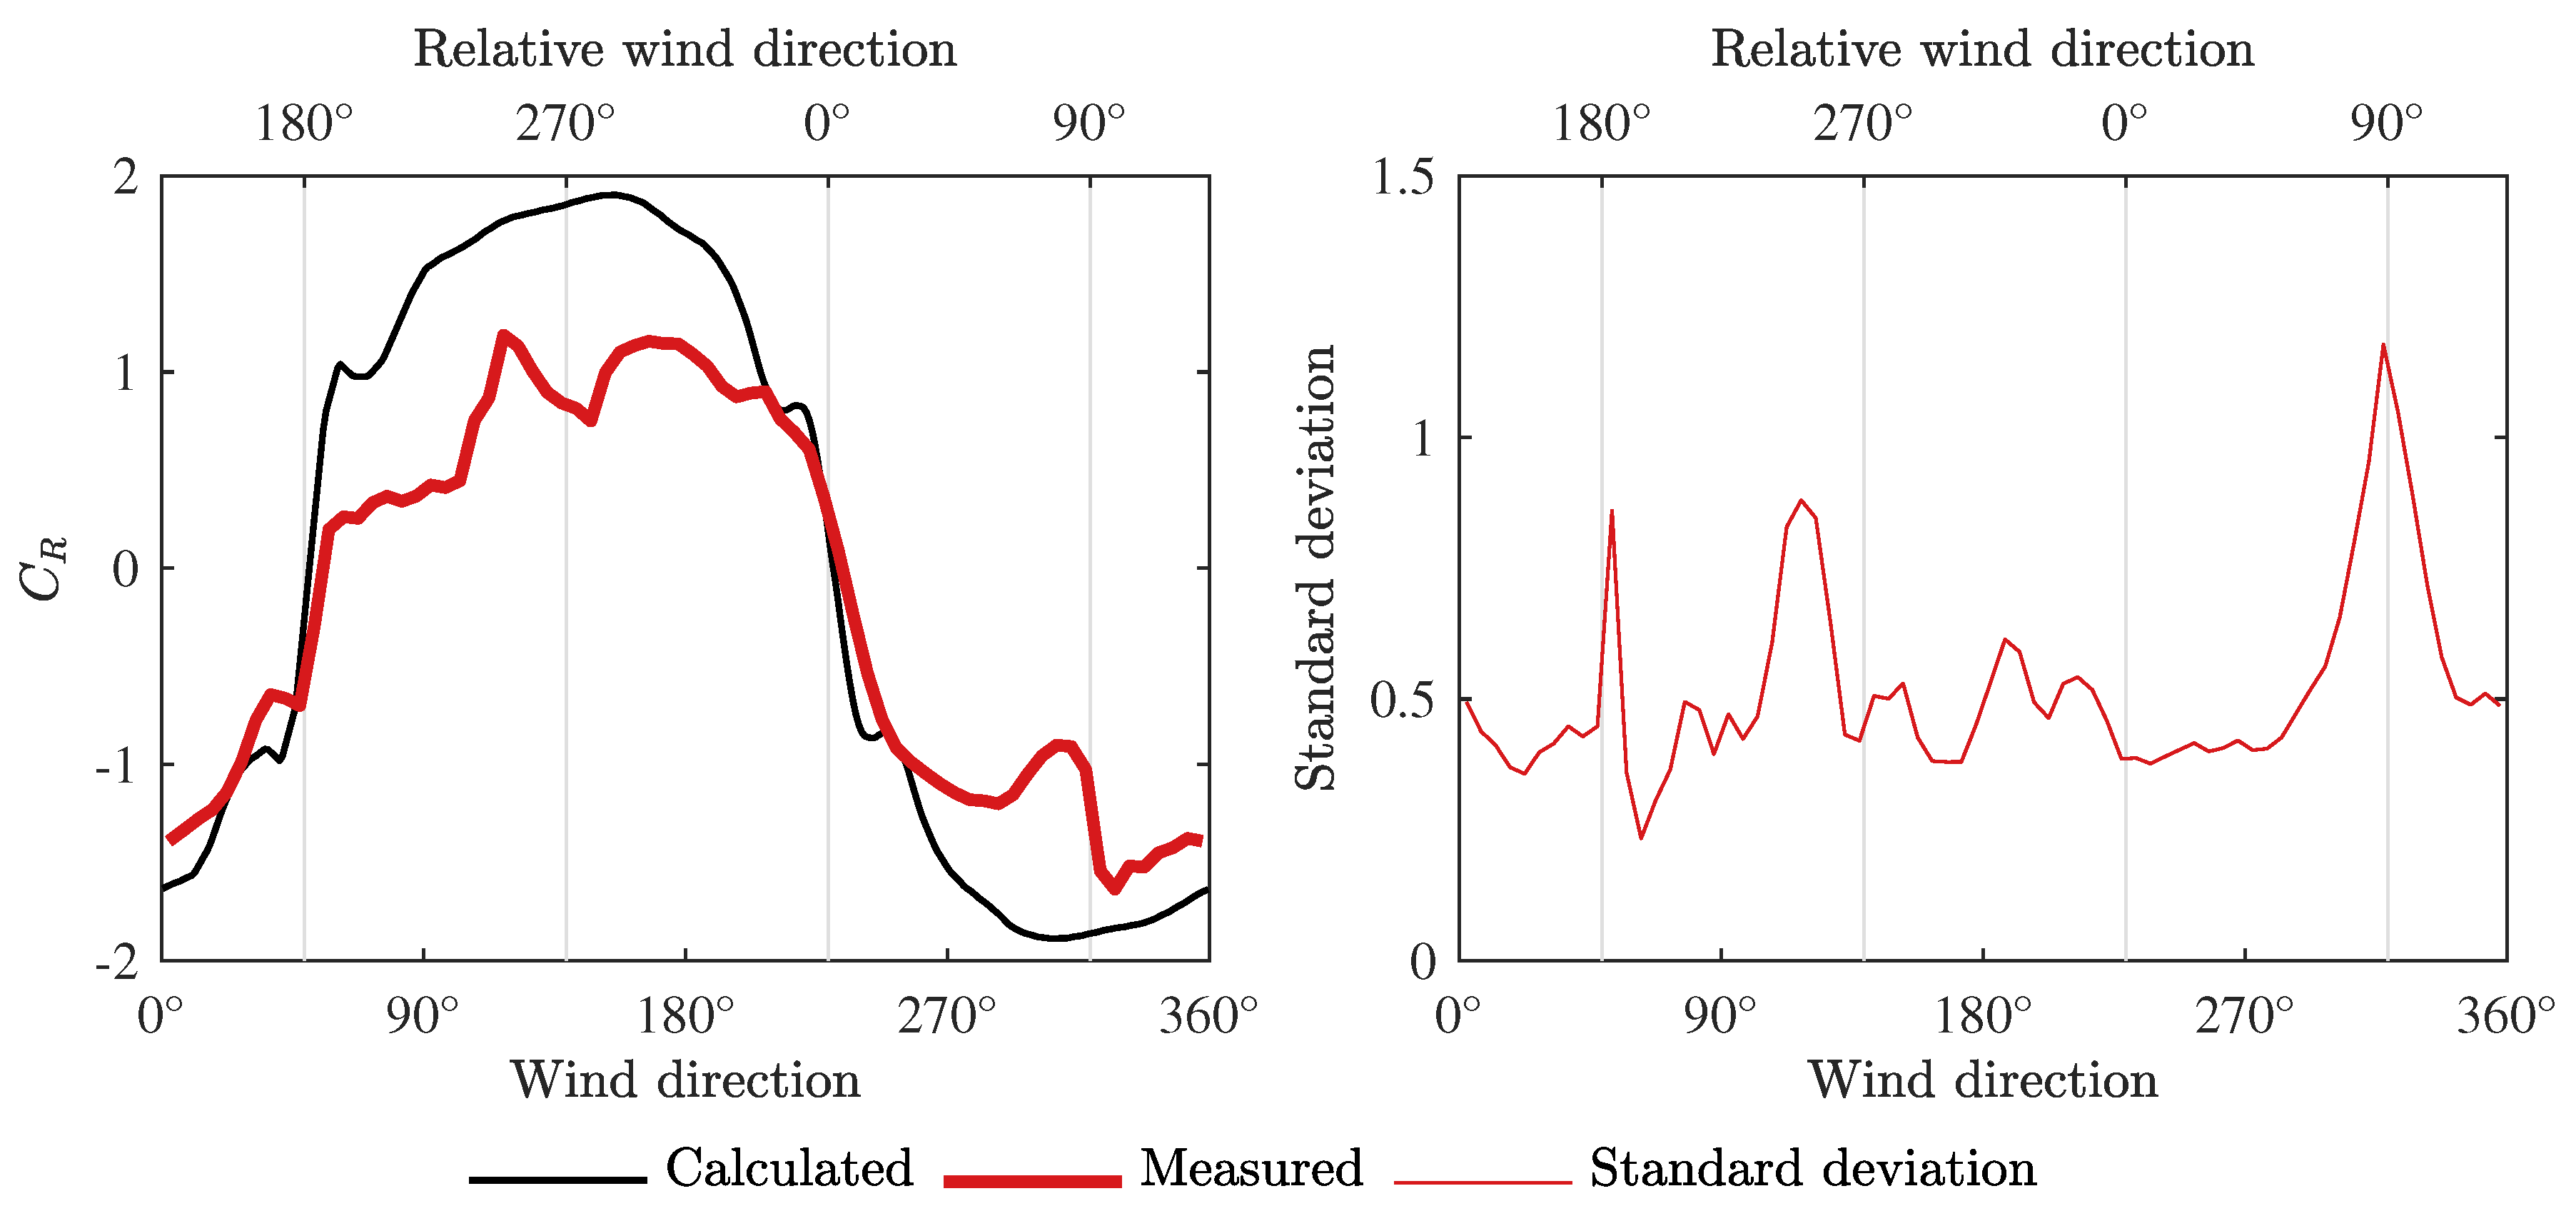
Figure 9.
Left: Comparison of measured and calculated torque in the tangential direction, here illustrated as the corresponding tangential forces coefficient at the blade. Right: Standard deviation of the measurements.
Figure 9.
Left: Comparison of measured and calculated torque in the tangential direction, here illustrated as the corresponding tangential forces coefficient at the blade. Right: Standard deviation of the measurements.
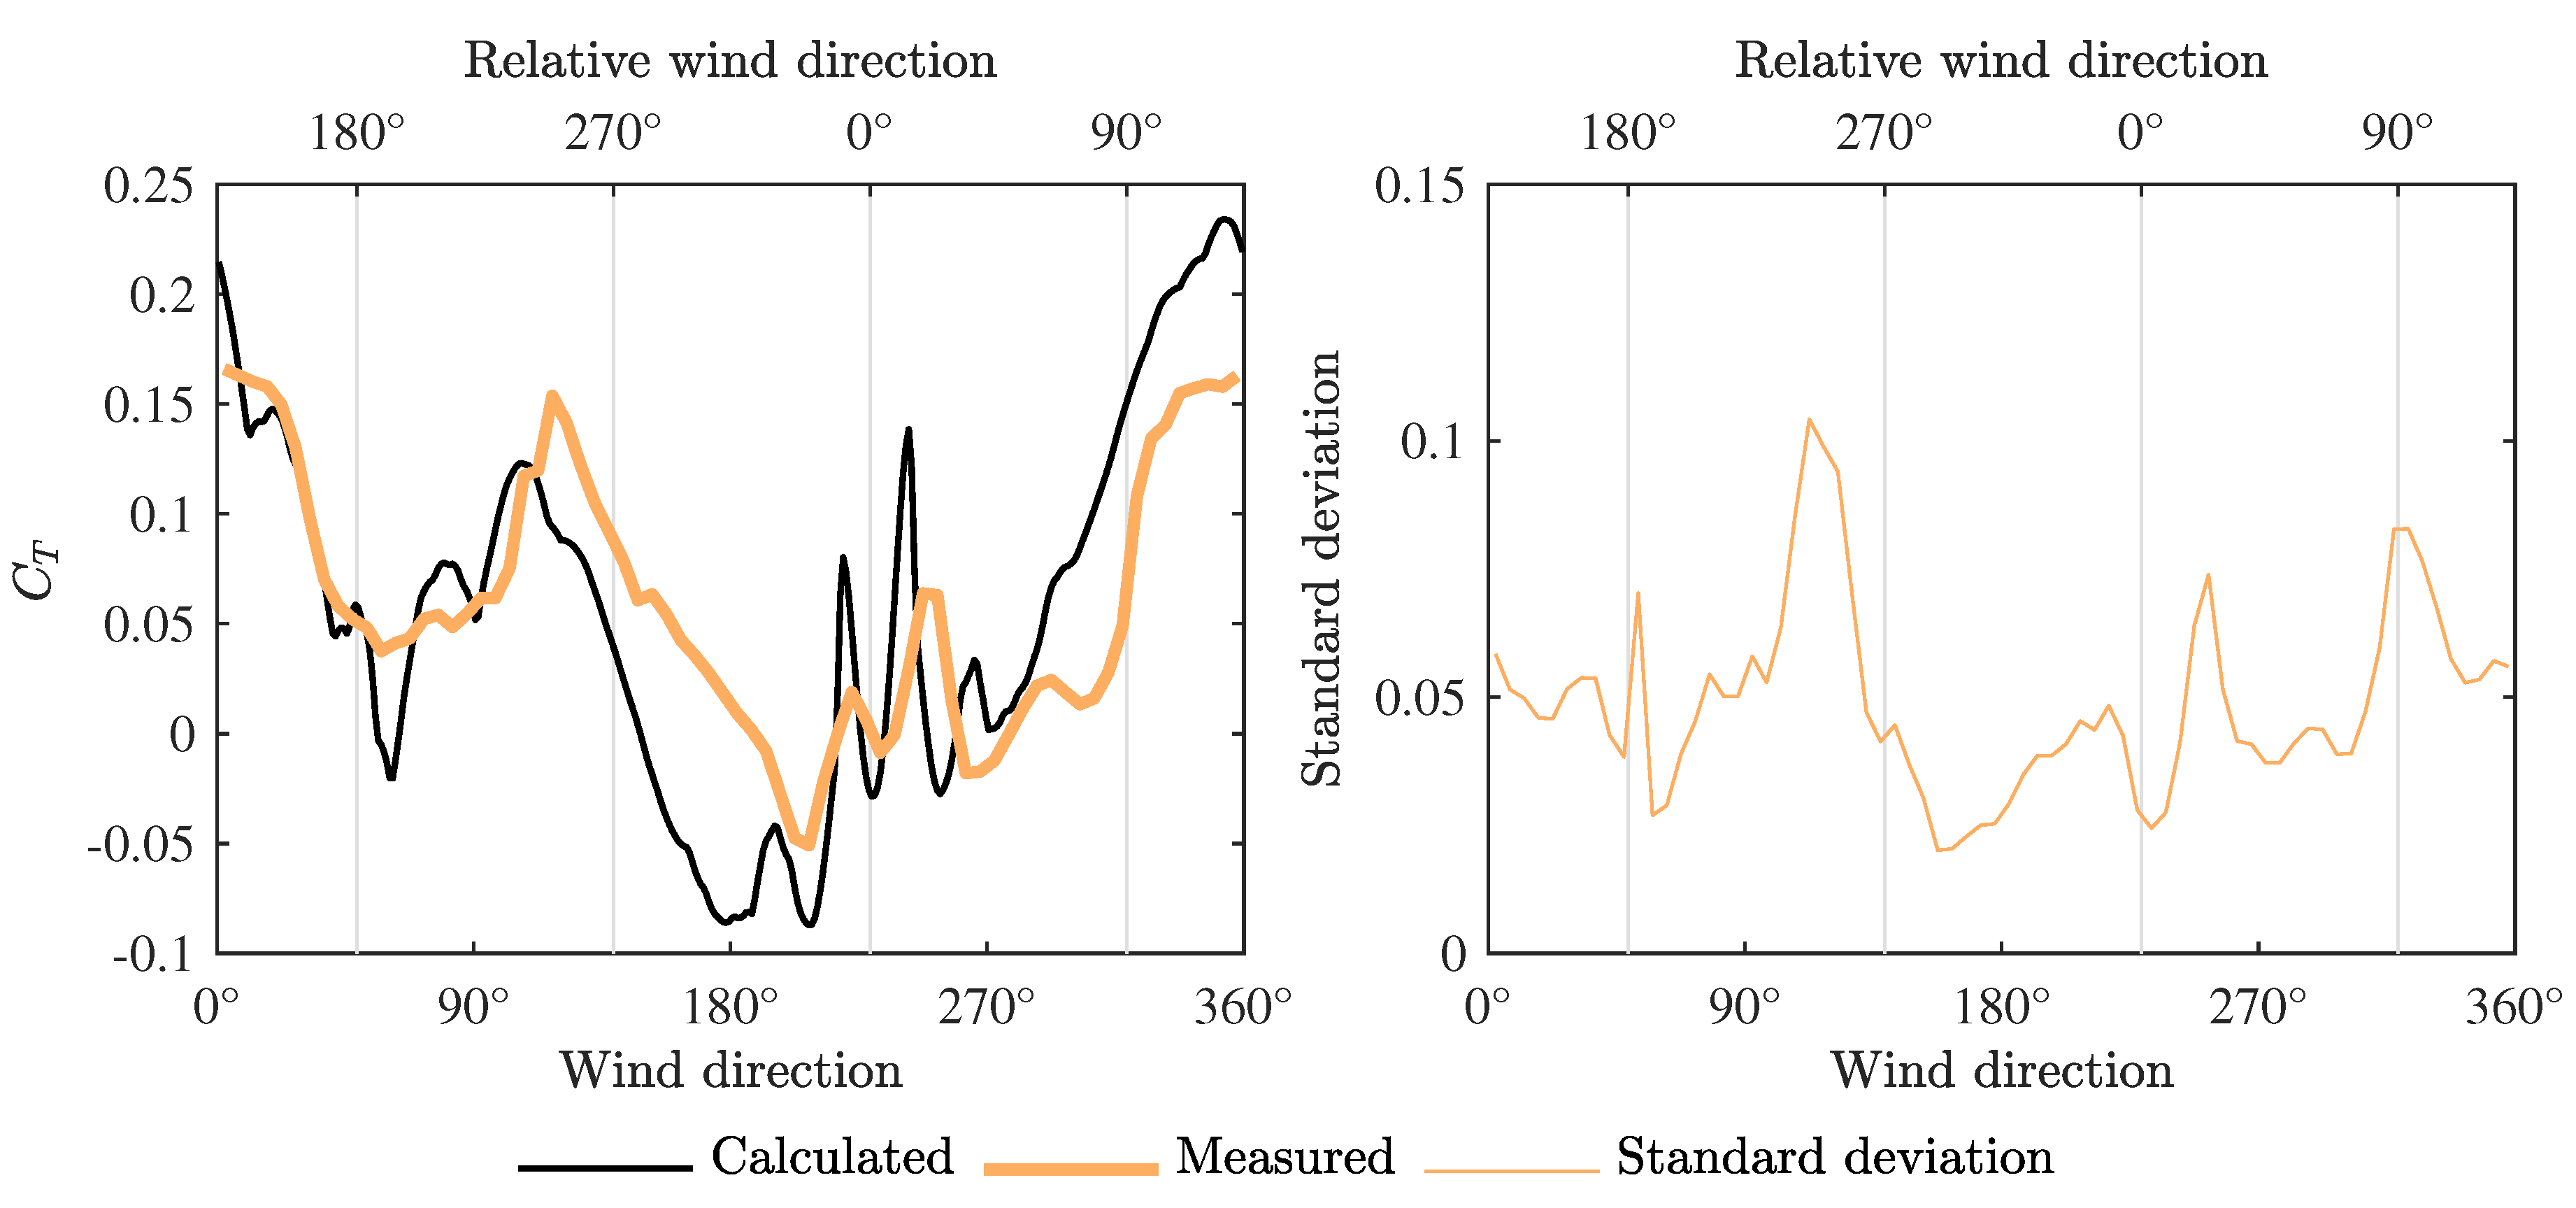
Figure 10.
Left: Bucket sorted total force with respect to wind speed. Note that the dominating wind direction during the mechanically-fixed case was from a direction resulting in a low force on the blade. Right: The rotational speed as a function of wind speed during electrical braking. Note that the rotational speed sensor lower limit is rad/s, and data below this limit are a result of the averaging.
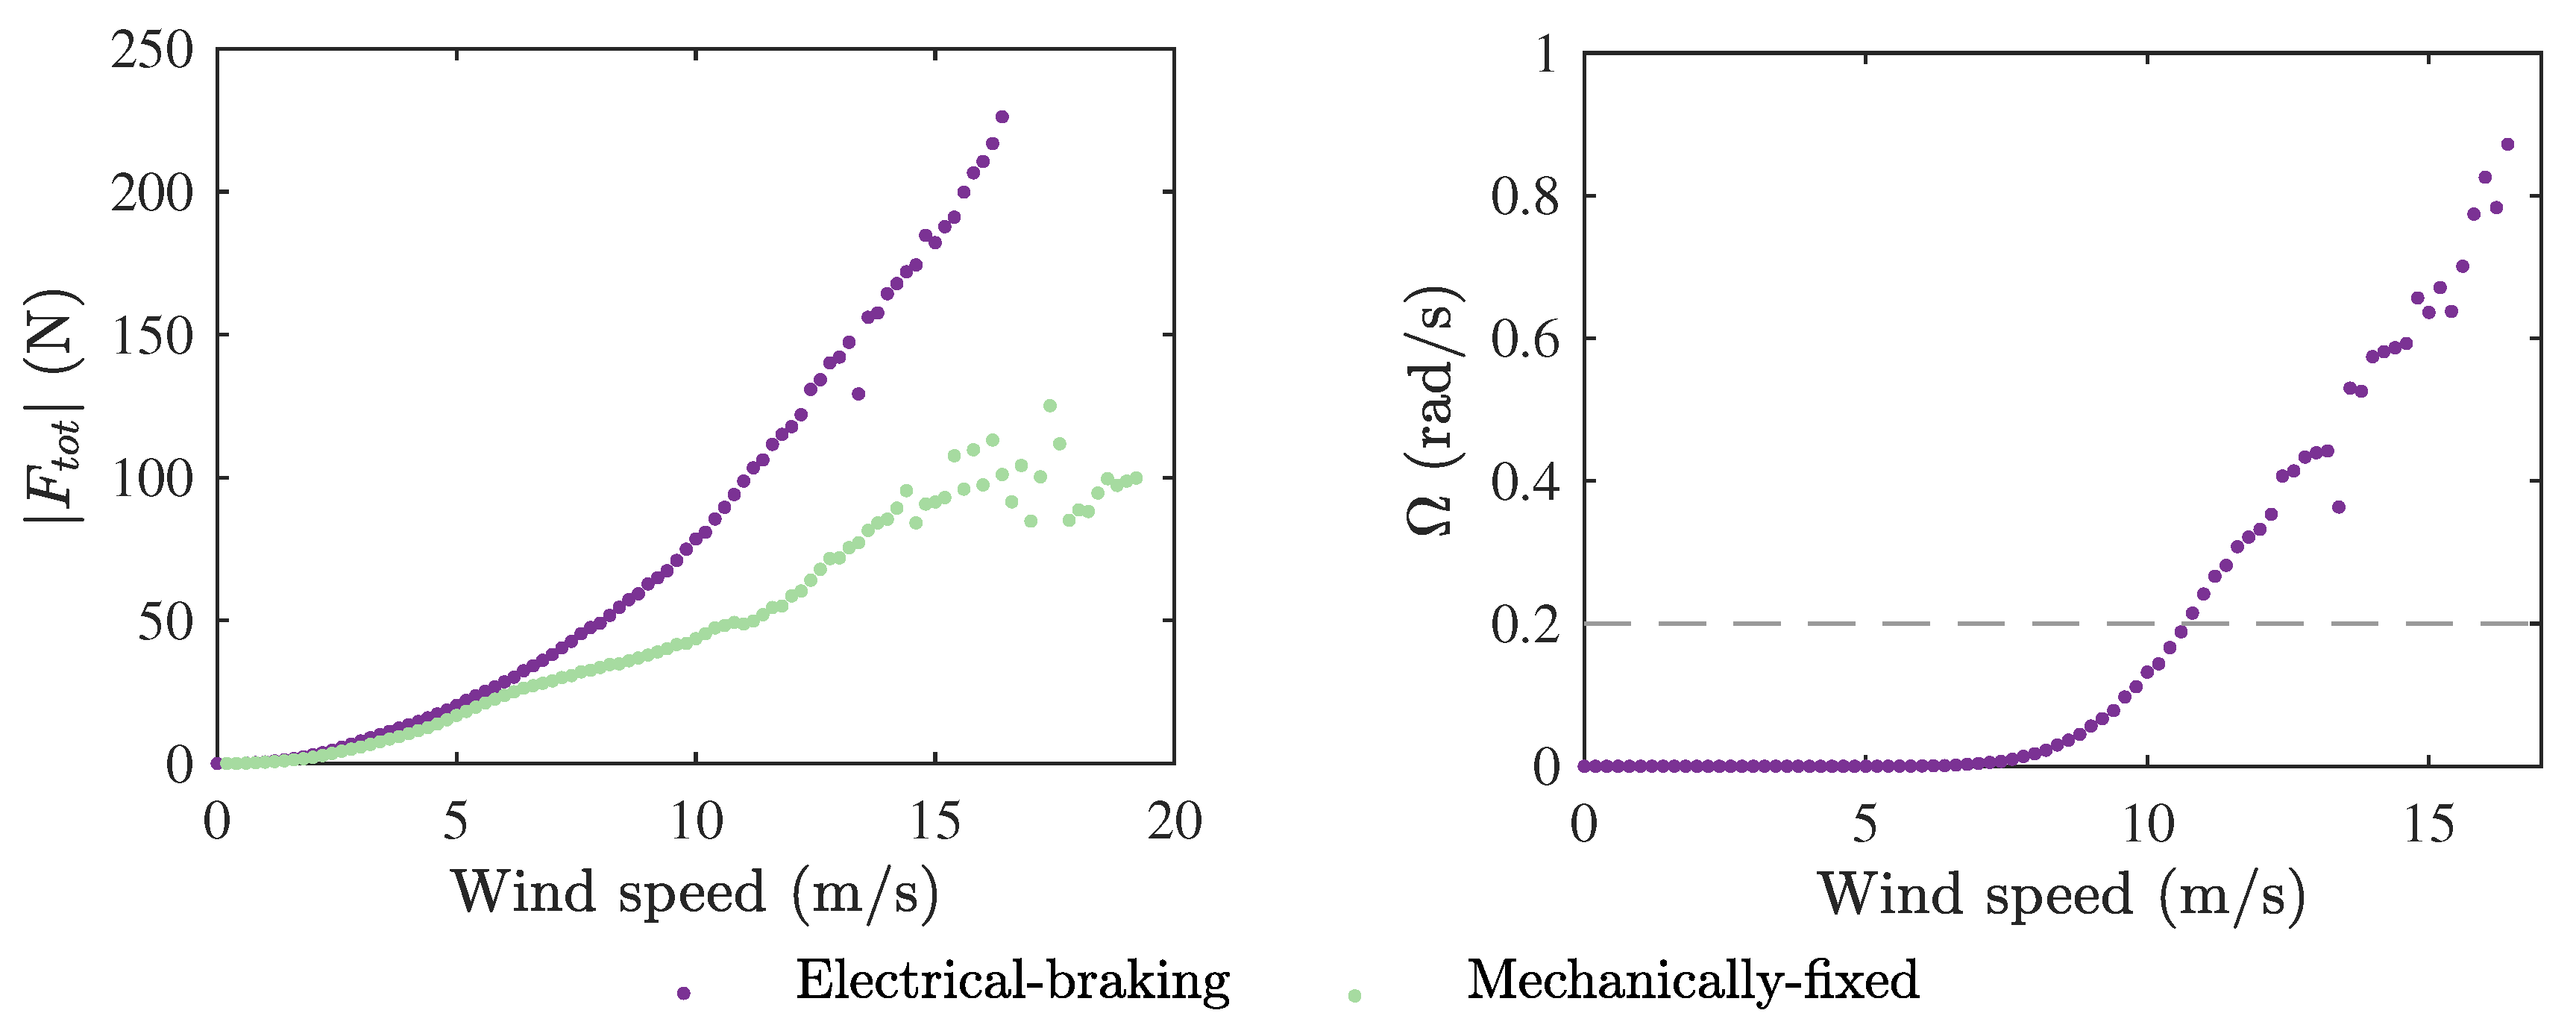
Figure 11.
Measured forces with the turbine mechanically fixed for three different wind directions, relative to the blade. Top: the radial force. Bottom: the corresponding wind speed.
Figure 11.
Measured forces with the turbine mechanically fixed for three different wind directions, relative to the blade. Top: the radial force. Bottom: the corresponding wind speed.
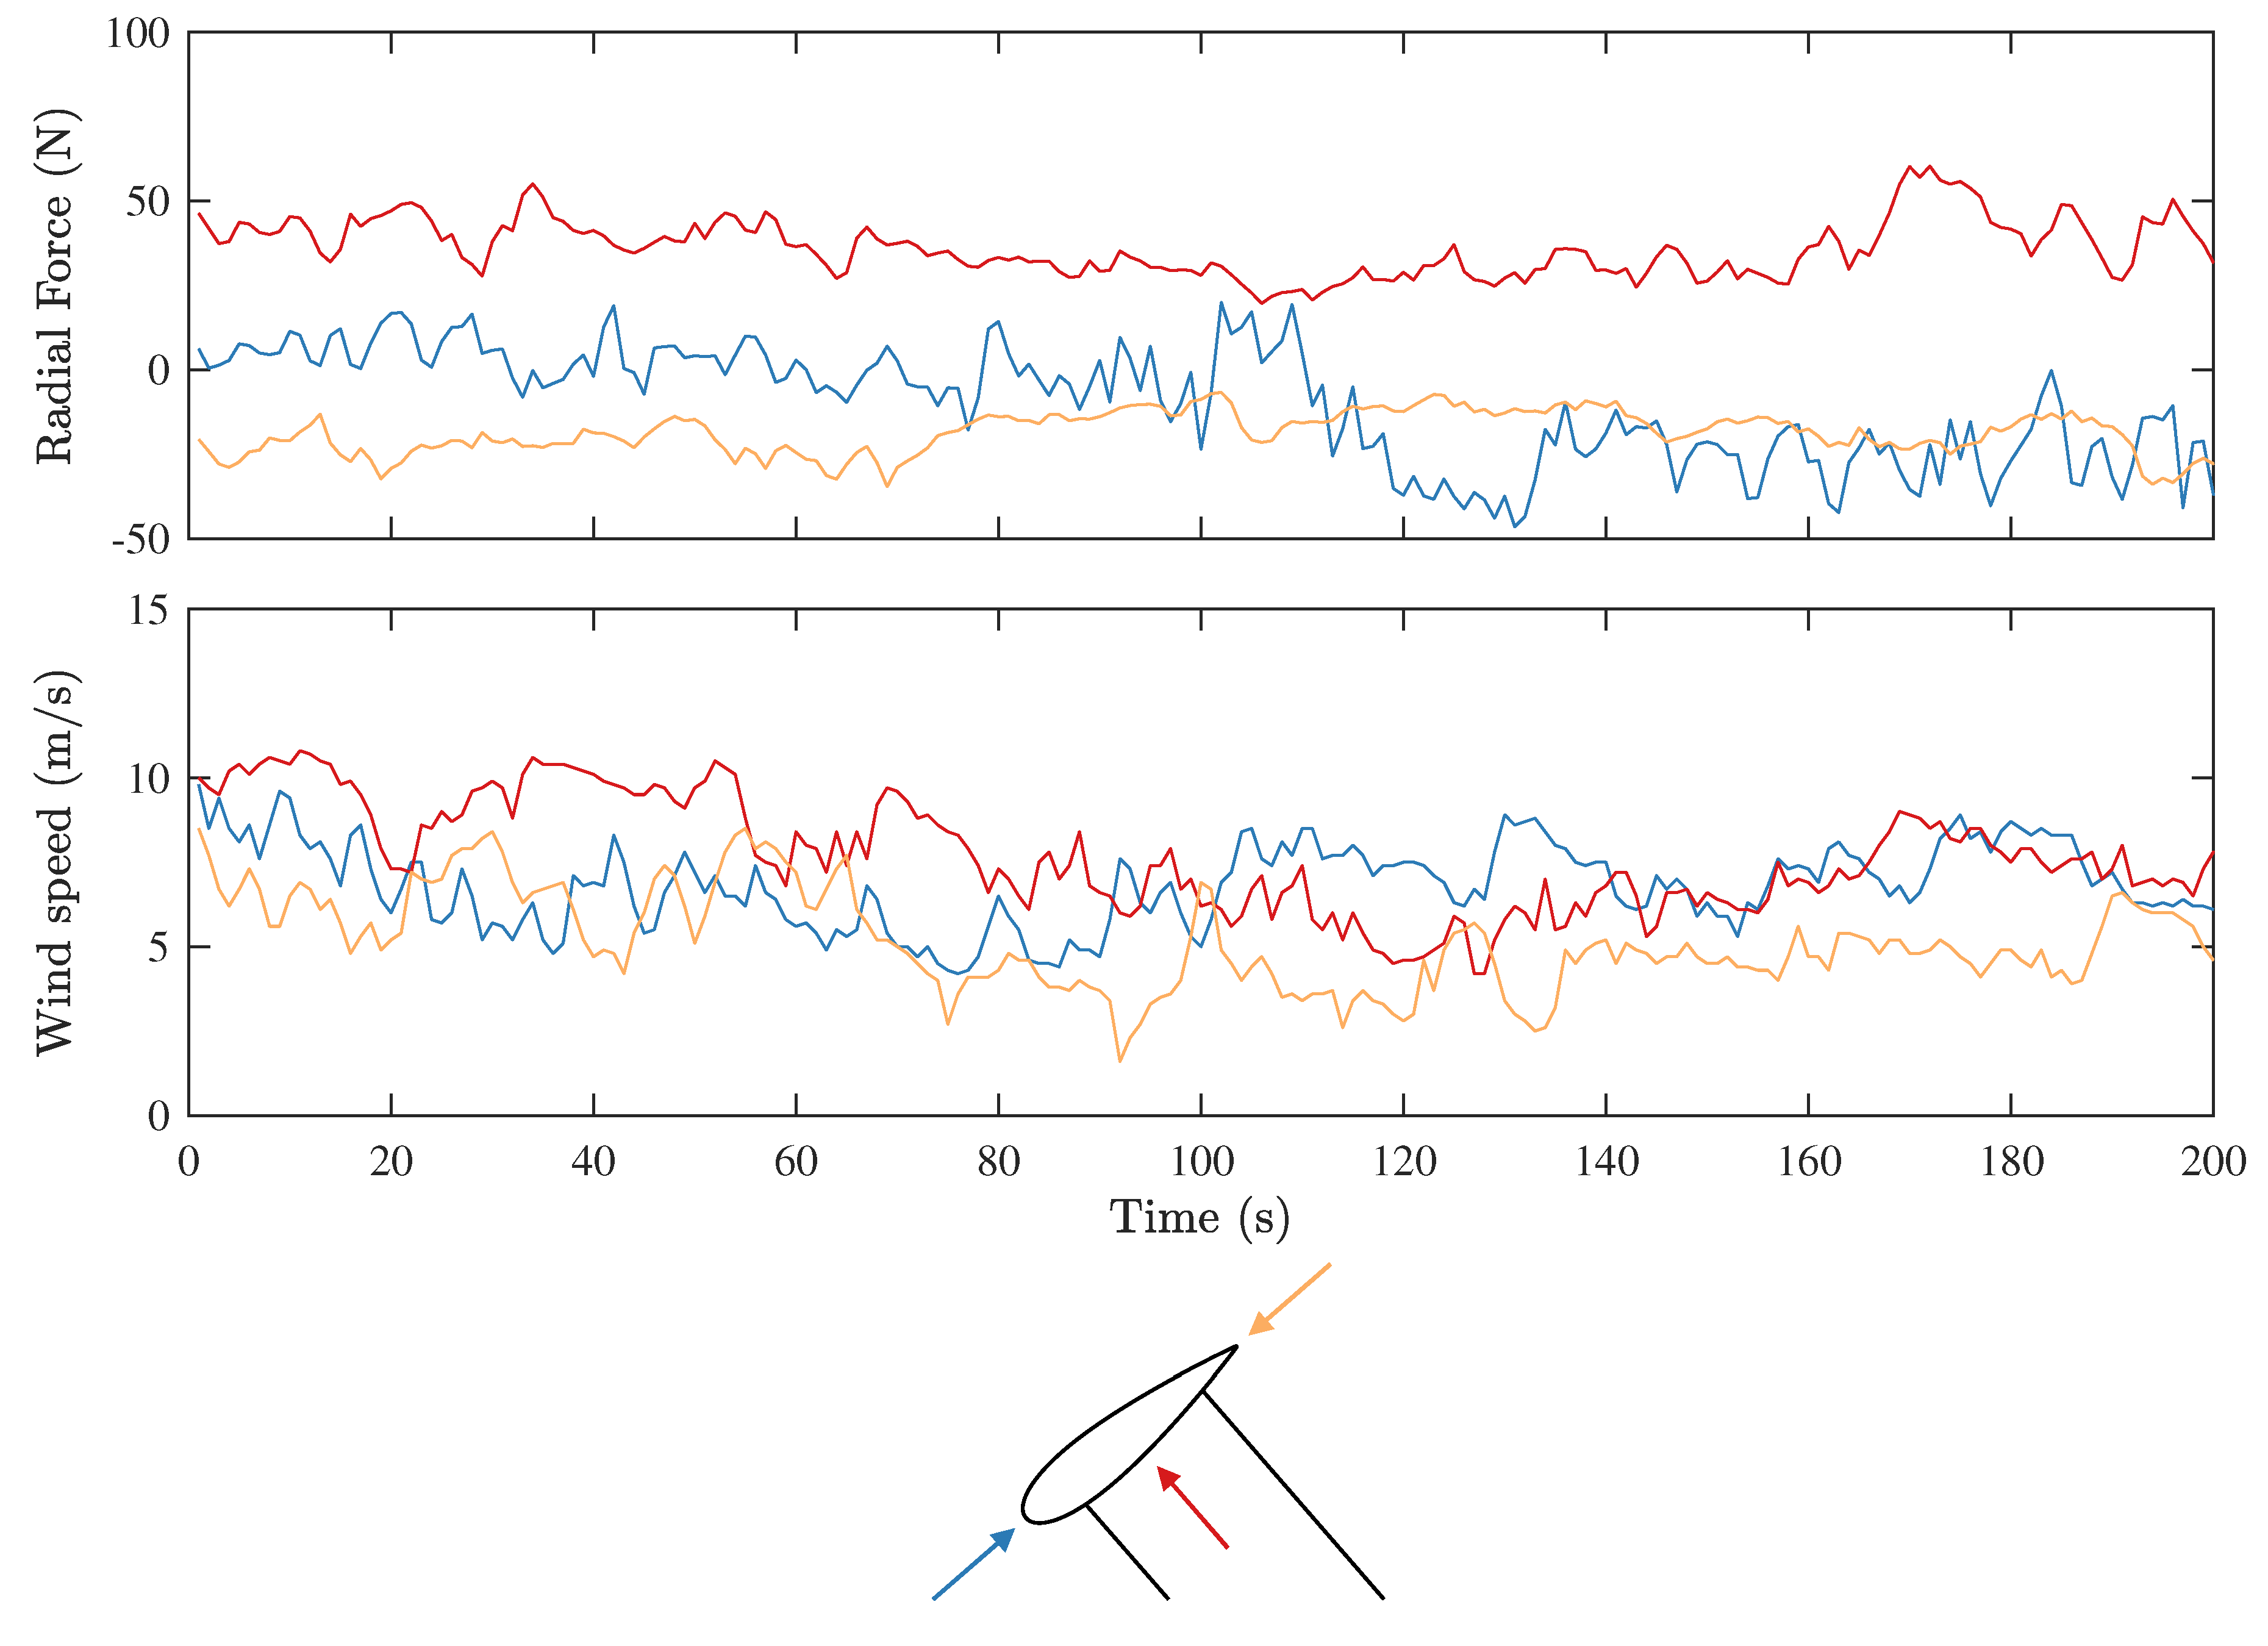
Figure 12.
Measured forces with the turbine during electrical braking for similar absolute wind directions as in Figure 11. Note that the turbine is rotating slowly, so the angle of the wind relative to the blade is changing. Top: the radial force. Bottom: the corresponding wind speed.
Figure 12.
Measured forces with the turbine during electrical braking for similar absolute wind directions as in Figure 11. Note that the turbine is rotating slowly, so the angle of the wind relative to the blade is changing. Top: the radial force. Bottom: the corresponding wind speed.


Table 1.
Turbine parameters.
| Number of blades | 3 |
| Rotational speed | ~40rpm–127rpm |
| Optimal power coefficient * | 0.29 |
| Optimal tip speed ratio * | 3.3 |
| Rated wind speed | 12 m/s |
| Hub height | 6 m |
| Turbine radius | m |
| Blade length | 5 m |
| Blade area | m2 |
| Blade profile | NACA0021 |
| Chord length | m |
| Tapering, linear | 1 m (from tip) |
| Tip cord length | m |
| Blade pitch | 2° |
| Number of support arms per blade | 2 |
| Support arm tip attachment height | m (from turbine center) |
| Support arm root attachment height (at radius m) | m (from turbine center) |
* Measured before the load cells were attached ( m turbine radius and 0° blade pitch) [9].
© 2017 by the authors. Licensee MDPI, Basel, Switzerland. This article is an open access article distributed under the terms and conditions of the Creative Commons Attribution (CC BY) license (http://creativecommons.org/licenses/by/4.0/).
Share and Cite
MDPI and ACS Style
Goude, A.; Rossander, M. Force Measurements on a VAWT Blade in Parked Conditions. Energies 2017, 10, 1954. https://doi.org/10.3390/en10121954
AMA Style
Goude A, Rossander M. Force Measurements on a VAWT Blade in Parked Conditions. Energies. 2017; 10(12):1954. https://doi.org/10.3390/en10121954
Chicago/Turabian StyleGoude, Anders, and Morgan Rossander. 2017. "Force Measurements on a VAWT Blade in Parked Conditions" Energies 10, no. 12: 1954. https://doi.org/10.3390/en10121954
Note that from the first issue of 2016, this journal uses article numbers instead of page numbers. See further details here.