Perforated Thermal Mass Shading: An Approach to Winter Solar Shading and Energy, Shading and Daylighting Performance

Department of Architecture, Wuhan University, Wuhan 430072, China
*
Author to whom correspondence should be addressed.
Energies 2017, 10(12), 1955; https://doi.org/10.3390/en10121955
Submission received: 30 September 2017
/
Revised: 10 November 2017
/
Accepted: 21 November 2017
/
Published: 24 November 2017
(This article belongs to the Special Issue Solar Energy Application in Buildings)
Abstract
:Direct solar irradiance may cause thermal discomfort, even in winter when the ambient temperature is low and especially for high-altitude locations with a high intensity of solar radiation. Thus winter solar shading might be required and, if used, must achieve a balance between the prevention of the transmittance of solar irradiance, the utilization of passive solar heat and the supply of adequate natural daylighting. These considerations render conventional solutions of solar shading inapplicable in the winter. In this paper, a novel approach to perforated thermal mass shading for winter is reported and examined. The impacts of the perforated percentage and the opening positions of this shading device on energy, shading and daylighting performance were assessed for south- and west-facing orientations. A range of perforated percentages and vertical and horizontal positions were tested using simulations by Energyplus and Daysim. Our results indicate that the proposed perforated thermal mass shading is efficient for the integrated performance of shading, daylighting and energy savings in the south-facing orientation, while it achieves acceptable performance in shading and daylighting in the west-facing orientation for a high-altitude cold climate.
1. Introduction
Direct solar radiation is normally considered to be welcome in winter because of the warming effect when the ambient temperature is low [1], and in passive solar design, direct solar heat is also encouraged into indoor space to reduce heating loads in winter, especially in cold climates. However, it is also argued that the occupant’s thermal comfort should be the taken into account in the utilization of passive solar heat in winter, otherwise occupants may draw shades to prevent the discomfort of overheating caused by solar radiation. This would cause a negative impact on the energy-saving design [2]. The discomfort due to solar radiation has been explored in previous studies, it was revealed that the warming effect of solar radiation may cause overheating and thus requires a cooling load to correct [3]. A theoretical analysis in a mild climate suggests there could be heat discomfort near a window area during the mid-day hours on a typical day in winter [4]. As thermal stimuli and solar radiation are identified as the major factors driving solar shading adjustments [5,6], solar shading might be adopted in winter by occupants in order to prevent possible overheating by solar irradiance. A typical case is Lhasa in Tibet, where it was found that solar shading in winter is widely employed in traditional buildings as a climatic responsive measure to reduce solar irradiance [7]. This unconventional solar shading is due to the high intensity of solar irradiance and the extensive sunlight hours in Lhasa, where solar radiation on the south-facing facade from November to March has been measured at 109.7 MJ/m2 and annual sunlight hours exceed 3000 h. Both measurements are much higher than in other locations at similar altitudes [8,9].
Compared with low-altitude climates, the requirement of winter solar shading is of greater necessity in high-altitude climates which are generally characterized by clear skies and a high intensity of solar irradiance. According to the altitude-effect theory, global solar irradiance increases with the increase in altitude because of smaller optical air masses, and less scattering and absorption at relatively high altitudes [10]. Moreover, direct irradiance is the major contributor to total irradiance at altitudes above 3000 m [11]. On the other hand, because of the low angle of incidence of solar irradiance in winter, as compared summer, higher levels of solar heat can occur on south-facing glazing and penetrate into indoor space in winter. Therefore, high-altitude locations are more likely to be influenced by a high intensity of direct irradiance, and overheating by solar irradiance can be even more serious in winter in these condition. Considering Lhasa as a case, in our previous study it was also theoretically demonstrated that considerable overheating may occur with a predicted mean vote (PMV) of 3 and a mean radiant temperature (MRT) over 40 °C during the mid-day hours on a typical winter day because of the impact of direct solar radiation. It was also suggested that for the entire winter season, approximately one-third of the interior area will likely be overheated by direct solar radiation, especially the south-east part of near-window areas, and that the overheating would last for over 5 h per day for most of the impacted area [12].
However, in present studies solar shading was been explored mostly in the context of hot periods or hot climates, with a focus on the prevention of solar heat and the reduction of the cooling load in summer [13,14]. Solar shading in cold climates has only been explored in terms of the balance between the heating load in winter and the cooling load in summer [15], where the major concern is to minimize solar heat gain by reducing the penetration of solar radiation to interiors. Obviously, conventional solar shading that aims to reduce solar heat gain is not helpful in terms of the utilization of passive solar heat. Additionally, few studies have been performed on the design of winter solar shading that needs to balance both the prevention and utilization of solar irradiance in winter, especially for high-altitude climates with a high intensity of solar radiation, and on the resulting impacts on energy, shading and daylighting performance.
Therefore, the objectives of this study are (1) to analyze of the principles for winter solar design; (2) to propose a prototype of a shading device; (3) to determine the major configuration parameters that are suitable for architectural design, in practice; (4) to evaluate the individual and combined effects of the shading device in terms of energy, shading and daylighting performance by changing these parameters in simulation experiments; and (5) to identify the most effective parameters and balanced solutions.
2. Method
2.1. Design Approach to Winter Solar Shading
Conventional solar shading benefits the reduction of overheating caused by solar irradiance by reducing solar heat gain and facilitating natural daylighting, while it also decreases the utilization of passive solar heat that is of importance in winter. Thus, winter solar shading must balance the following objectives: (1) the prevention of the transmittance of beam solar irradiance into indoor spaces; (2) the utilization of passive solar heat; and (3) facilitating natural daylighting. This requires an integrated design approach, which has not been widely addressed.
A number of studies on solar design have been devoted to the balance between shading, daylighting control and cooling loads. Various designs of external solar shades have been examined through a combination of daylight and thermal analysis for tropical and warm climates [16]. A perforated solar screen which has been employed in a desert climate, which resembles the high-altitude climate in its clear skies and high intensity of solar radiation, has been investigated in terms of its reduction to the cooling load [17]. This shading device proved to be effective at improving natural daylighting while controlling solar access in certain optimized configurations [18,19]. A further study on the optimized design of perforated solar facades was conducted with a focus on the integration of daylighting, the control of solar radiation and energy performance [20]. Meanwhile, other existing studies on the design of solar thermal facades have addressed the absorption and conversion of excess solar energy into thermal energy. The solar blind system has been demonstrated to be efficient at improving the uniformity of the indoor thermal environment and radiation level [21], and the partially transparent solar thermal facade has been discussed in connection with the advantages of insulation and shading in summer [22]. The performance of the double skin façade has also been investigated with respect to solar heat gain in summer and heat loss in winter [23]. However, very limited studies on solar thermal facade regards the effects on the indoor illuminance. Existing designs of solar facade and solar shading have limitations with regards to meeting the requirements of winter solar shading. Thus, a design approach that meets the integrated requirements of shading from overheating, the utilization of passive solar heat and daylighting is needed. Moreover, the performance of the design needs to be evaluated comprehensively.
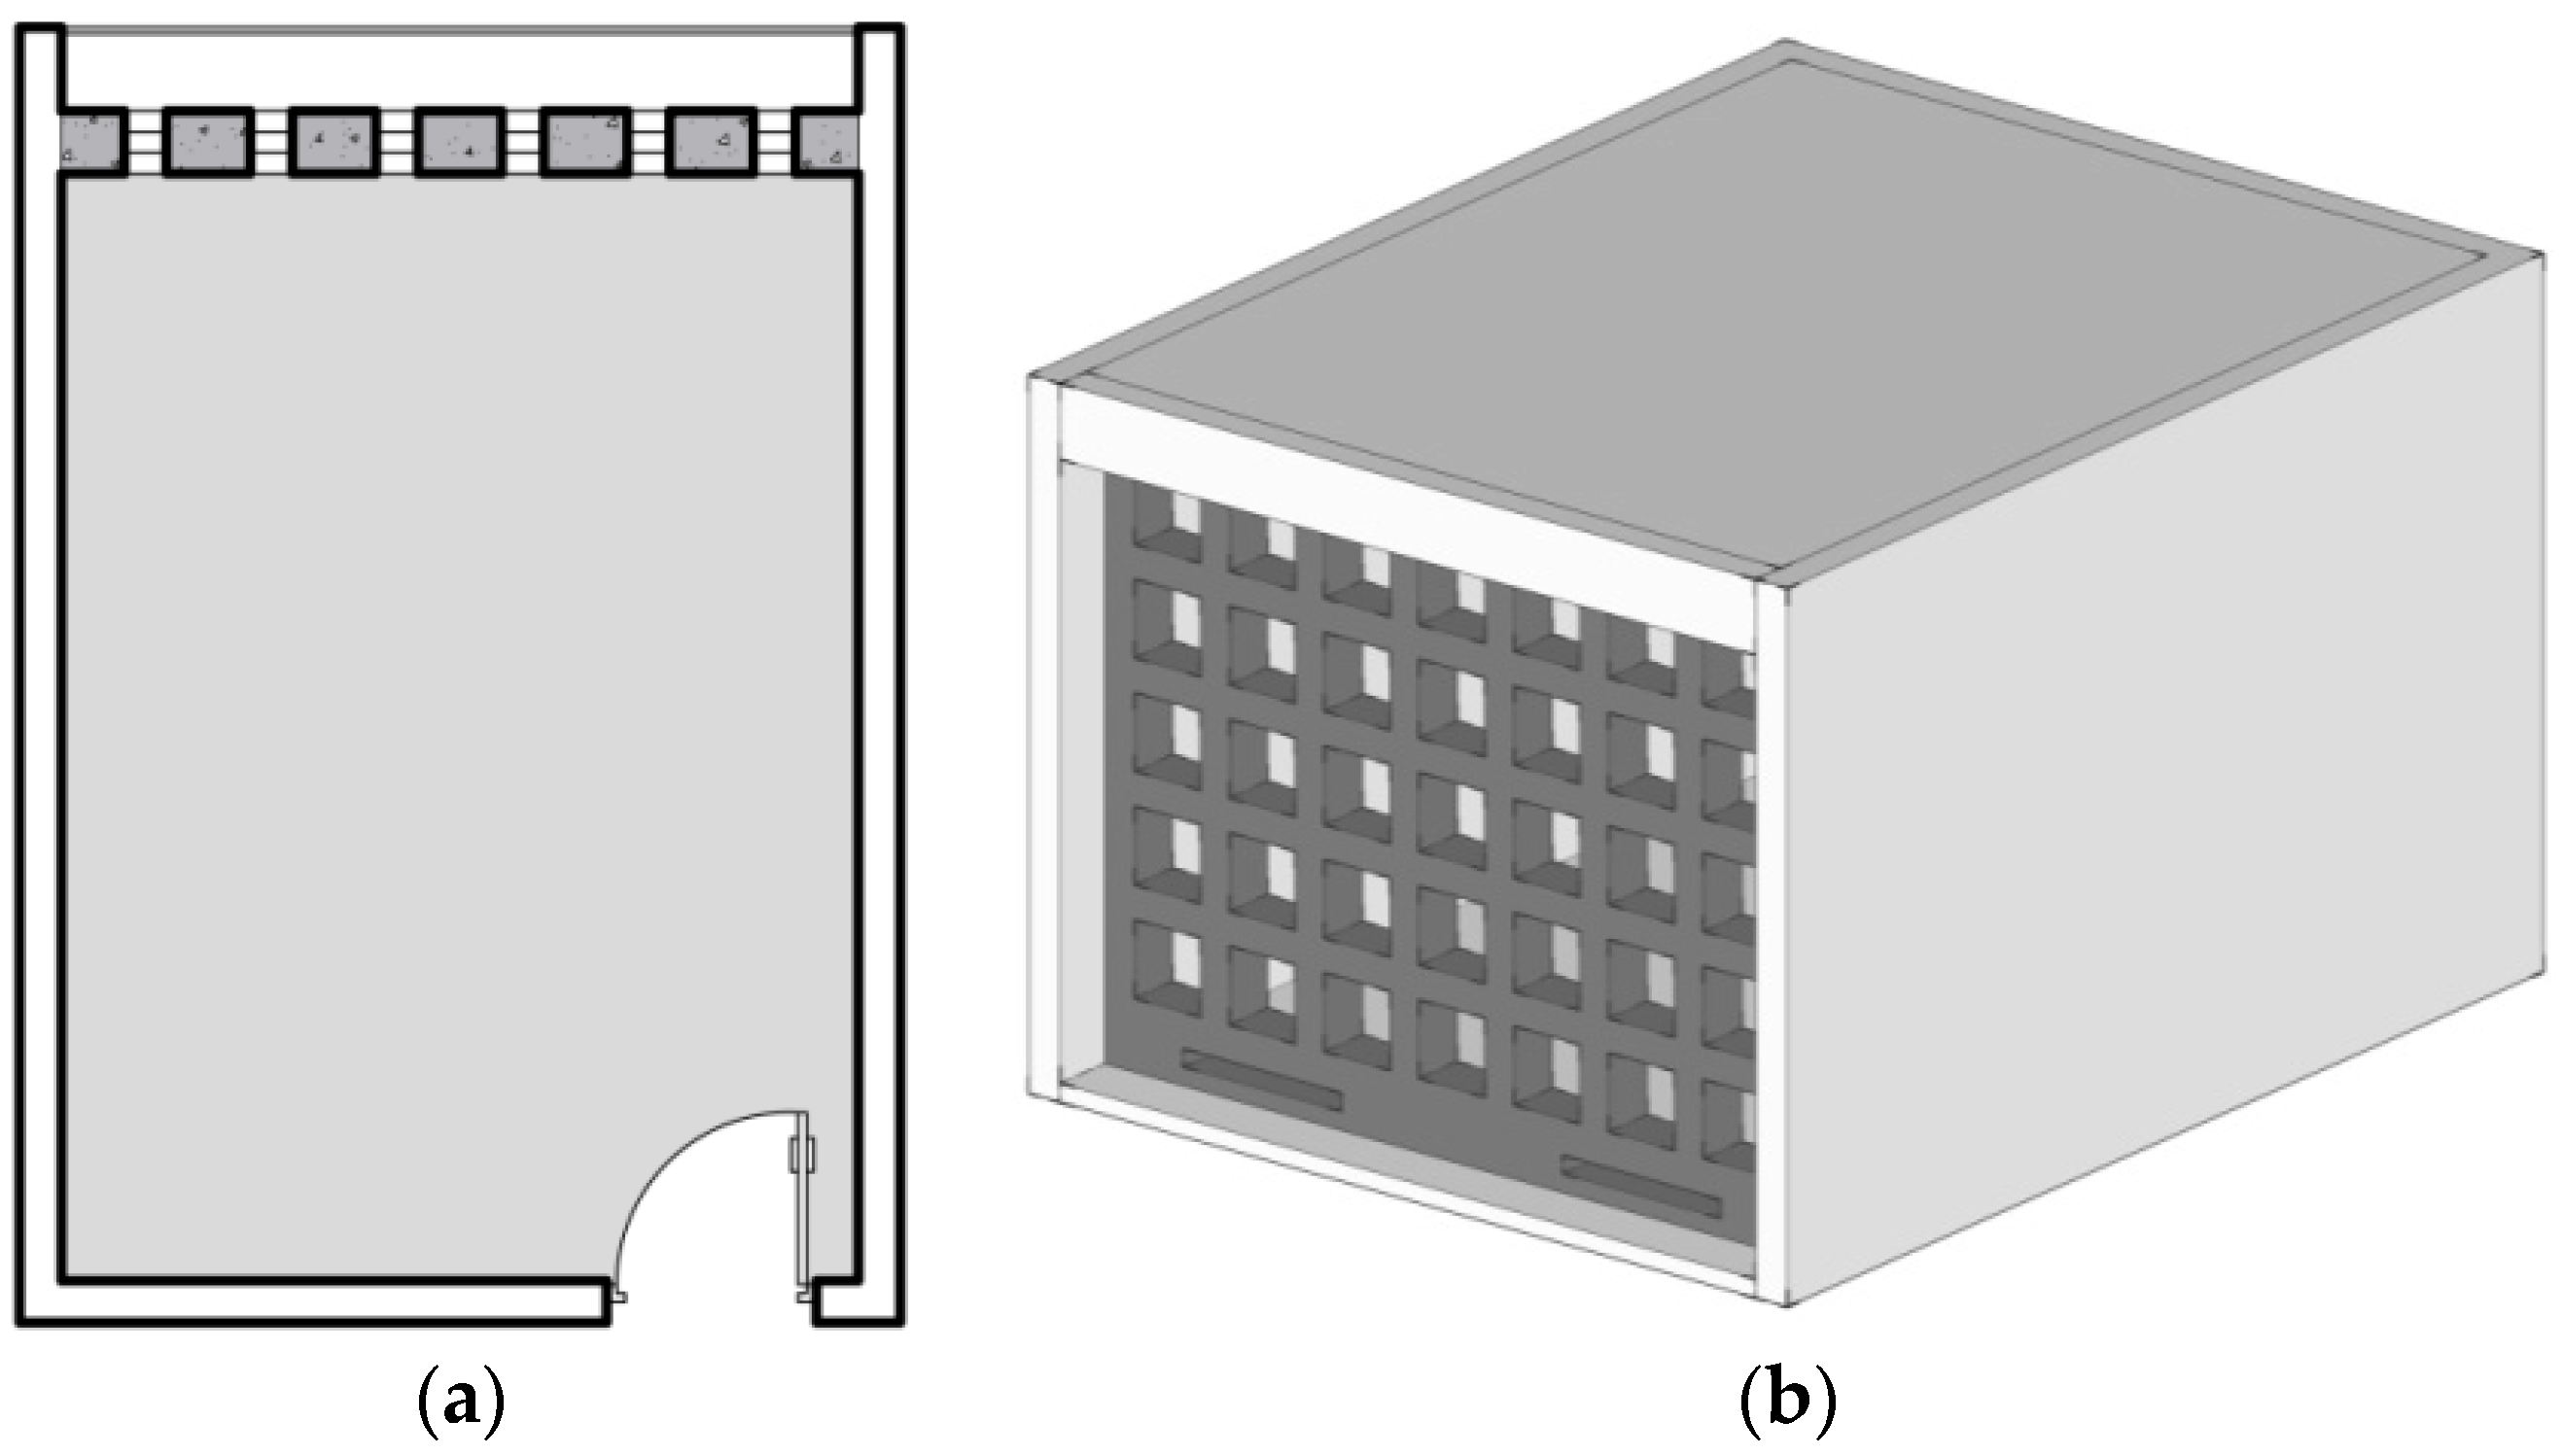
In this study, a configuration of perforated mass shading that is derived from the concept of the Trombe wall, solar thermal facade and the perforated solar screen is proposed. A classical Trombe wall is a massive wall behind the exterior glazing that collects solar radiation and converts solar energy into heat, which can then be stored and released to the indoor space via conduction through the wall, radiation and airflow convection [24]. An opaque Trombe wall can facilitate the utilization of solar heat and can completely prevent beam solar radiation. However, the approach does not facilitate natural lighting for the indoor space. Thus, a modified design based on the classic Trombe wall was developed by combining it with a perforated solar screen. Moreover, a perforated solar screen could be constructed in the form of a mass wall, and mass is suitable to the high-altitude climate with regards to both high solar irradiance and diurnal temperature swing. Therefore, perforated mass shading based on the combination of a Trombe wall and a perforated solar screen is proposed. The perforated mass shading follows the form of a classic Trombe wall, with a vent and a solar screen with an orthogonal grid (Figure 1).
2.2. Experimental Approach
For the purpose of evaluating the effects of the proposed perforated mass shading on energy, shading and daylighting performance, two key configuration parameters were used to define the geometry of the perforated mass shading: the perforation percentage (PP) and the position of the openings (PO). PP defined the area of opening that transmits natural light and the area of the mass surface that received solar heat, while PO had an impact on the falling position of the incident solar radiation that penetrated into the indoor space. In this study, the thickness of the mass was defined as a constant value of 300 mm. There were two forms of change introduced to PP. In the first, PP ranged from 70% to 10%, with a step of 10%, and was achieved by the change in area of each opening (while the number and position of the openings remain unchanged). In the second form, the change of PP was achieved removing openings, from the bottom to the top, with the corresponding PPs of 70%, 46%, 34%, 23% and 12%. PO was also examined for openings in horizontal and vertical layouts with position changes in vertical and horizontal directions at adduced constant PPs of 14% and 10%, respectively.
A rectangular area (3.5 m × 3 m) in the central of the partition was set as the perforated area, where the distance between the top and bottom edge of this perforated area is denoted as “l”, and distance between the left and the right edge is denoted as “d”, while the distance between the bottom edge of the opening and the bottom edge of the perforated area is denoted as “y” and the distance between the right edge of the opening and the right edge of the perforated area is denoted as “x”. The index λv is defined as the ratio of y and l, and indicates the relative vertical position of the openings, while λh is the ratio of x and d for the relative horizontal position. To evaluate the effects of these parameters, four groups of experiment were performed (Table 1).
The investigation was divided into two stages. In the first stage, the energy consumption of different alternatives in winter was evaluated and compared with a reference model. The reference model represented the conditions in which an internal curtain was used as the shading adjustment. The curtain was dynamically controlled and was active when the solar intensity exceeded a setpoint of 120 W/m2. In addition, the window-to-wall ratio (WWR) of the south-facing facade was defined as 50%. Energy performance was evaluated by comparing energy consumption and heating gain with the reference model, taking into account heating load, lighting load, transmitted solar energy and the heating contribution from the mass wall.
In the second stage, daylighting and shading performance were evaluated. Two metrics that are widely adopted in shading studies [17,19,25] were employed: daylight autonomy (DA) and useful daylight illuminance (UDI). Daylight autonomy (DA) was employed to evaluate daylighting performance. DA is defined as “the percentage of occupied hours per year, when the minimum illuminance level can be maintained by daylight alone” [26]. The recommended minimum illuminance value used in the tested room space was 300 lx. A criterion adopted in previous studies [16] was employed to evaluate daylighting performance: the area that meets the threshold of required luminance for half of the occupied time. This area is defined as the “day lit area”. Daylighting performance was acceptable when the day lit area reached 70% of the total area. We propose a new metric termed Cui in order to evaluate the annual uniformity of illuminance. This metric is defined as the ratio of the minimum and average values of the annual light exposure, which is the yearly cumulative amount of visible light incident on the points of interest. The data of annual light exposure for daylighting was provided in the simulation software, which will be explained in the Simulation Setup section.
Shading performance was evaluated with the metric useful daylight illuminance (UDI). UDI was used to determine when daylight levels would be useful for the occupant, with lower and upper thresholds of 100 lx and 2000 lx. The upper threshold means an oversupply of daylight, which may result in visual or thermal discomfort [27] and thus suggests the necessity of shading. For this reason, UDI was adopted to evaluate shading performance. The criterion for evaluation in this study is the percentage of indoor space that experiences UDI > 2000 lx for over 30% of the occupied period. This area is defined as the “over-day lit area”.
The described alternatives were tested for south- and west-facing orientations, which are the principle orientations for solar radiation and thus the orientations which require solar shading. Because of the symmetry of solar position, the performance for the east-facing orientation resembles that of the west-facing orientation.
2.3. Simulation
2.3.1. Simulation Setup
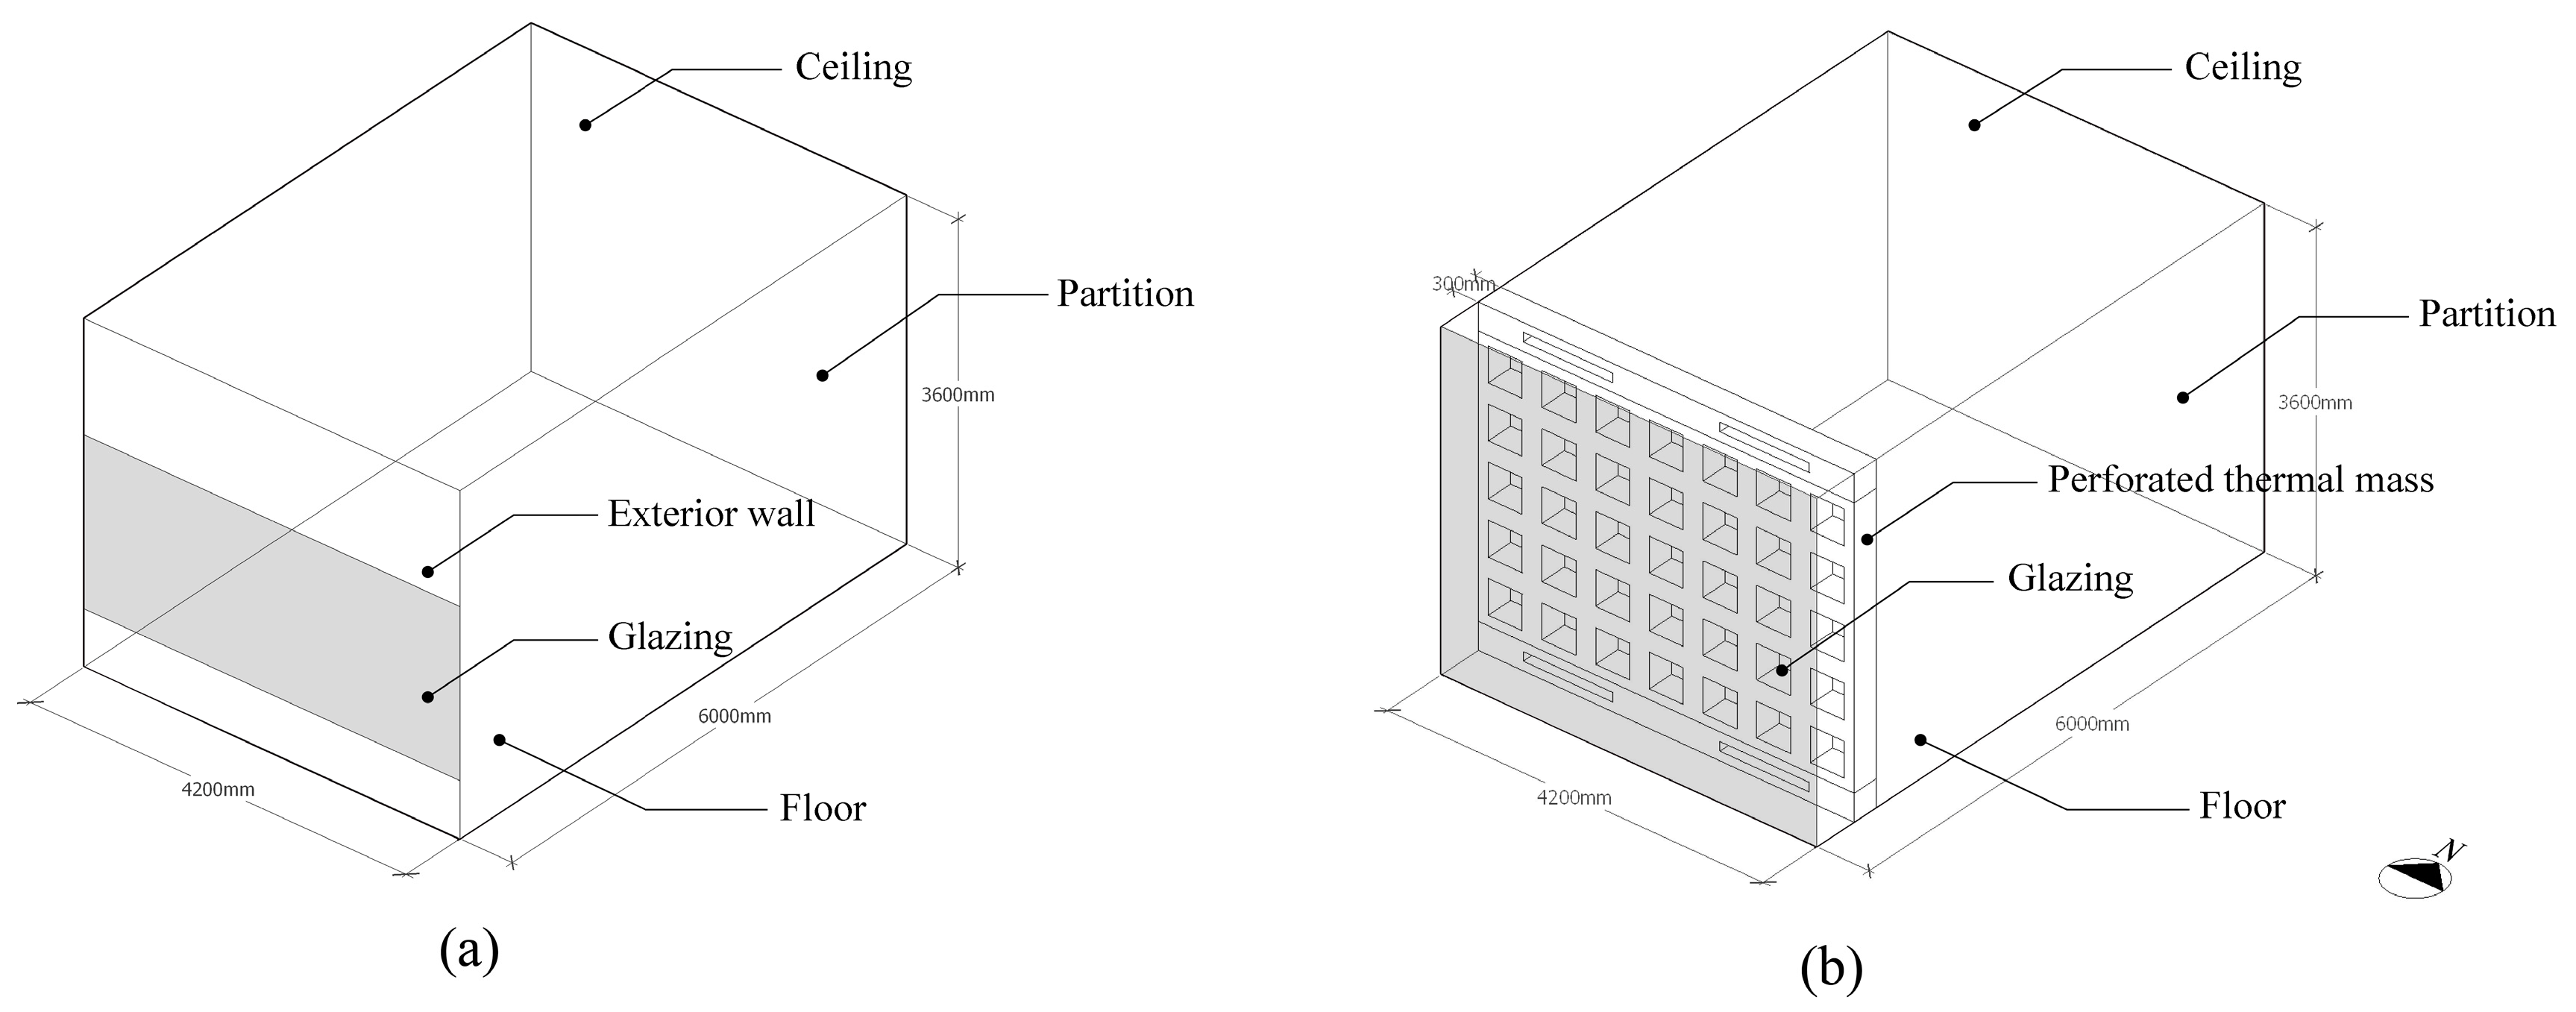
An office room (6 m × 4.2 m × 3.6 m) was assumed for the experiments (Figure 2). To focus on the performance of the mass shading, the envelope (except the south-facing part) was assumed to be adiabatic with no heat exchange with the external environment. The south-facing wall was fully glazed with a window-to-wall ratio of 100%. The parameters of the room model are listed in Table 2. The simulations for energy performance were conducted with Designbuilder as the modeling tool, with the simulation engine Energyplus, which has been widely used for energy performance studies [28]. In the simulation, the activity times were set as for an office, with occupancy from 8:00 a.m. to 7:00 p.m. on typical workdays (5 days/week), and an occupancy density of 0.111 people/m2. The heating mode was defined as electric storage heating, and the heating setpoint temperature was 22 °C, with a heating supply temperature of 35 °C. The fuel for the heating was electricity from the grid. When the zone air temperature was lower than heating setpoint temperature, the heating was on, otherwise it was off. Natural ventilation was set to be activated in this office. Both heating (HAVC) and natural ventilation were operated with occupancy. The internal heat gains from office equipment were not considered in this study. Artificial lighting was set to be dynamically active, according to the conditions of daylighting illuminance. The setpoint of target illuminance was 300 lx, with the sensor being at the center of the space.
The simulations for daylighting and shading performance were conducted with Radiance and Daysim software packages. Radiance is a validated, physically based, backward ray tracer that provides simulations of indoor illuminance for one sky condition at a time. Daysim is a Radiance-based daylighting analysis tool for the calculation of annual indoor illuminance profiles based on a weather climate file [26]. Daysim has also been validated and widely employed in daylighting studies [18,19,29].
2.3.2. Climate Data
The simulation was performed in Lhasa (29.6° N–91.1° E), Tibet, which is a typical location at a high altitude of 3600 m, with a cold climate and a high intensity of solar irradiance. The monthly average temperature is 3.7 °C, and the minimum daily temperature can be as low as −11.8 °C in January. The daily intensity during the winter period (30 October to 8 March of the next year) reaches 433.5 W/m2, 533.7 W/m2 and 299.7 W/m2 for horizontal surfaces, south- and west-facing vertical facades, respectively. The simulations were conducted using standard weather data (CSWD) from China’s special meteorological data set for thermal environment analysis. The source data was a typical annual meteorological data fully reflecting the long-term weather, selected from a data bank of nearly 30 years in duration. The data set included measured hourly data of the outdoor dry-bulb temperature, relative humidity, intensity of horizontal global solar radiation and horizontal scattered radiation etc. The hourly data of the intensity of direct normal and vertical solar radiation for east-, west-, south- and north-facing orientations were then calculated accordingly. For the locations where there were no hourly meteorological data, the interpolation function was used to generate those missing data [30].
2.4. Validation of Simulation Method
Simulations were carried out to validate the accuracy of the solution of simulation in our work. Results from the simulation were compared with the results from previous studies of solar screens [17]. The version of Designbuilder used in this study was 4.5.0.141 BETA with version 8.5 of Energyplus.
In the referenced study, the test room with a window on the south-facing facade was set up for simulation in the desert climate of the Kharga Oasis, Egypt. Our simulation set-up is in compliance with the referenced work, including the dimensions of the test room and solar screens, the thermal properties and the heating mode. Additionally, we chose 3 types of solar screens for validation with depth of ratios of 0.1, 0.75 and 1.5, respectively, at a perforation percentage of 80%.
The results of the simulations are plotted in Figure 3, where good agreement can be observed. The maximum and average error between the two models were 1.79 kWh and 0.89 kWh, respectively, in lighting load, 2.8 kWh and 1.8 kWh, respectively, in transmitted solar energy, 2.79 kWh and 1.9 kWh, respectively, in cooling load, and 3.3 kWh and 2.2 kWh, respectively, in heating load (Table 3). The maximum and average error were within acceptable ranges.
3. Results and Discussion
3.1. Benchmark of the Reference Model
The evaluation of energy performance included heating load, lighting load, transmitted solar gain and the heat contribution from the thermal mass shading (TMS), while DA and UDI were simulated to evaluate shading and daylighting performance. The reference models were first simulated in order to achieve a basic understanding of the assumed scenario. In terms of energy performance, the simulation results indicate that the reference model had a heating load of 67.7 kWh/m2, a transmitted solar gain of 48.7 kWh/m2 and a lighting load of 8.7 kWh/m2 for the south-facing orientation and 114.9 kWh/m2, 25.8 kWh/m2 and 10.7 kWh/m2, respectively, for the west-facing orientation. No heat contribution from the thermal mass was available since no thermal mass shading was set in the reference model. Considerably lower heating and lighting loads, as well as higher transmitted solar gain, were observed for the south-facing orientation compared to the west-facing orientation. In terms of shading and daylighting, 90% and 66% of areas were found to be over-day lit for the south- and west-facing orientations, respectively, and a 100% day lit area was achieved in both orientations with a Cui of 0.3 and 0.5, respectively. The described reference model performances were used as benchmarks in the subsequent investigation.
3.2. Effect of Perforation Percentage
3.2.1. Energy Performance
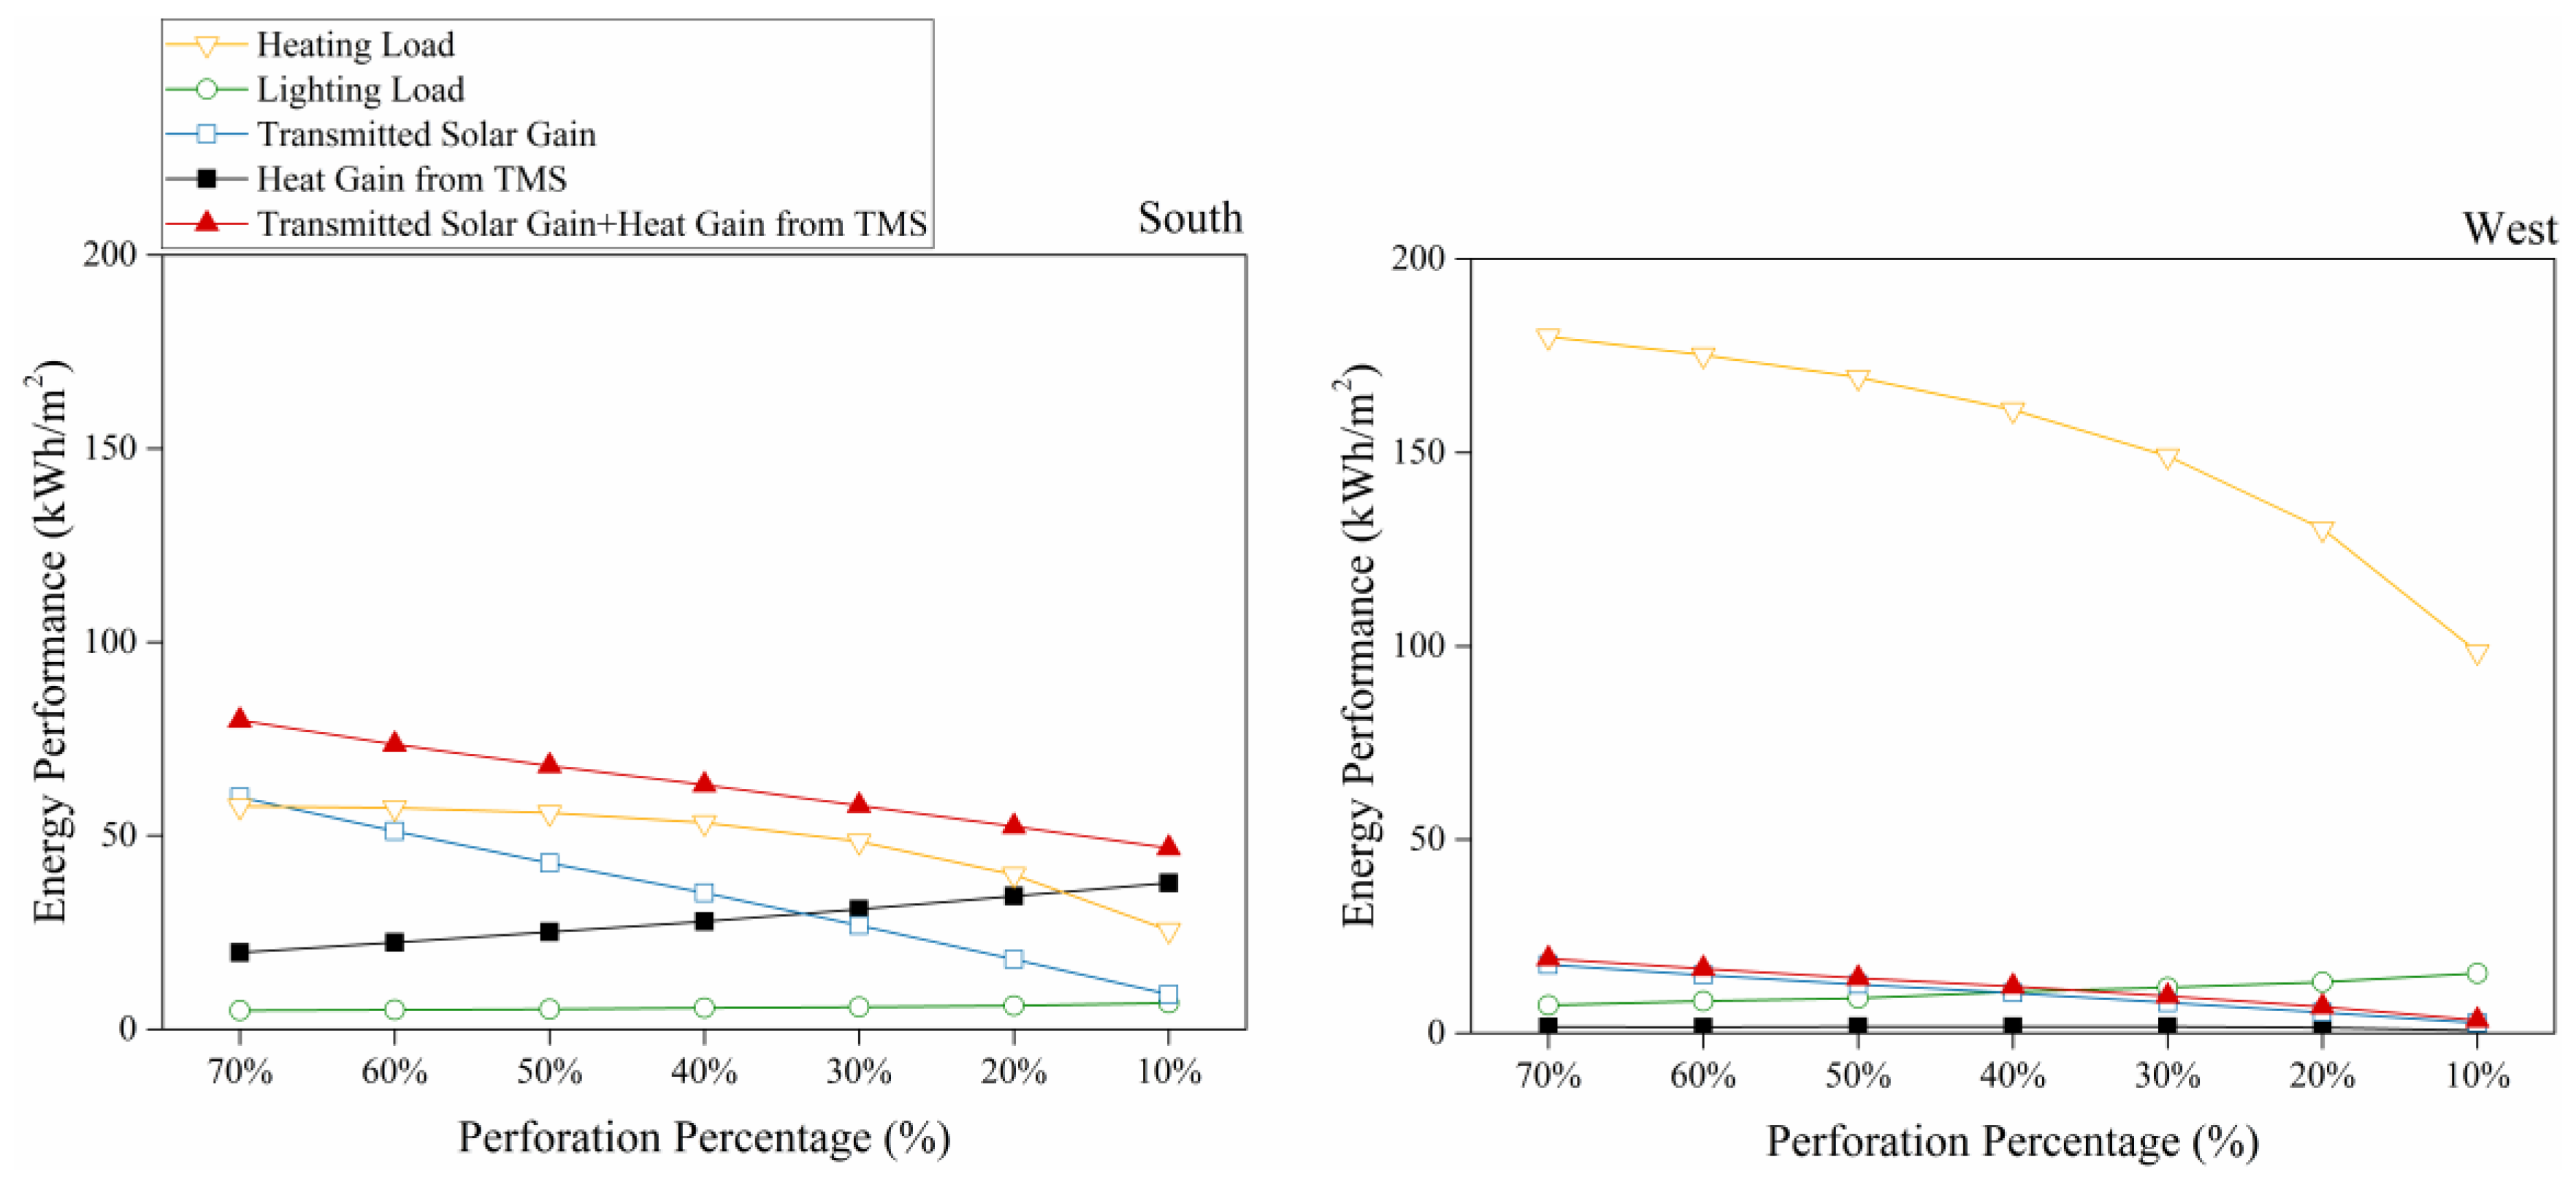
Two forms of variation in perforation percentage were studied. Figure 4 illustrates the first condition, i.e., how energy performance changed with decreasing PP and the same number of openings (Group 1). For the south-facing orientation, it was observed that the heating load decreased with the decrease in PP, while the load changed at a slightly higher rate when the PP was less than 50%. A decreasing trend in transmitted solar heat gain was noted, with a much higher and constant rate. However, heat contribution from the TMS exhibited a constant increase. Additionally, the balance point—the point at which the absorbed solar heat gain by TMS started to exceed the transmitted solar heat gain through the openings of the mass shading—was at a PP of approximately 33%. The saving of heating energy was achieved by the decreased opening area, while the heat gain from TMS offset the loss of transmitted solar heat gain to a certain degree. It was noted that even the lowest value of the total transmitted solar gain and heat gain from TMS (46.7 kWh/m2) at the lowest PP of 10% was close to the transmitted solar gain of the reference model (48.7 kWh/m2). In addition, a slight increase in the lighting load of 1.9 kWh/m2 was observed and was attributed to the reduction of transmitted solar radiation.
For the west-facing orientation, the heating load exhibited a similar trend with a decrease in PP. In addition, the TMS was constantly lower than that of the transmitted solar gain, and it started to decrease at a PP of 20%. This decrease was attributed to the greater heat loss through the fabric of the thermal mass shading as compared to the absorbed solar heat gain. This suggests that the increase in thermal mass area does not result in a higher heat contribution for the west-facing orientation where there is less solar irradiance. The highest value of the total transmitted solar gain and TMS (19.2 kWh/m2) was considerably lower compared with the performance of the reference model for the west-facing orientation. In addition, the lighting load displayed a notable increase of 8.3 kWh/m2 at a much higher rate compared with the south-facing orientation.
The energy performance behavior in the second condition, with decreased PP in the form of a reduction in the number of openings (Group 2), is plotted in Figure 5. For the south-facing orientation, the heating load exhibited a steady decline with the decrease in PP, and the heat gain from TMS increased at a slow rate. Additionally, the value of the total transmitted solar gain and heat gain from TMS remained higher than the transmitted solar gain of the reference model. A slight increase of 0.9 kWh/m2 in lighting load was also observed. For the west-facing orientation, the heating load exhibited a fast decline with the decrease in PP, whereas the contribution from TMS displayed a notably slow decrease, for which the same explanation as offered for the first condition is applicable.
In sum, highly similar behaviors in energy performance were observed for both forms in each orientation with variations in the perforation percentage. For the south-facing orientation, the heating load was found to exhibit obvious decreases along with the decrease in PP, while the decrease occurred at a remarkably higher rate when PP decreased in the form of a reduction in the number of openings. It can be found that there is an obvious reduction of transmitted solar heat gain due to the reduction of the opening area, while was partially offset by the increase in the heat contribution of the TMS due to the increase in thermal mass area. Only a slight increase in lighting load was observed with the decrease of PP. However, the transmitted solar gain and heat gain from TMS exhibited a steady decline in general. For the west-facing orientation, similar trends were observed for both conditions, but with higher heating demands and less heat gain from solar irradiance and thermal mass effects.
3.2.2. Shading and Daylighting Performance
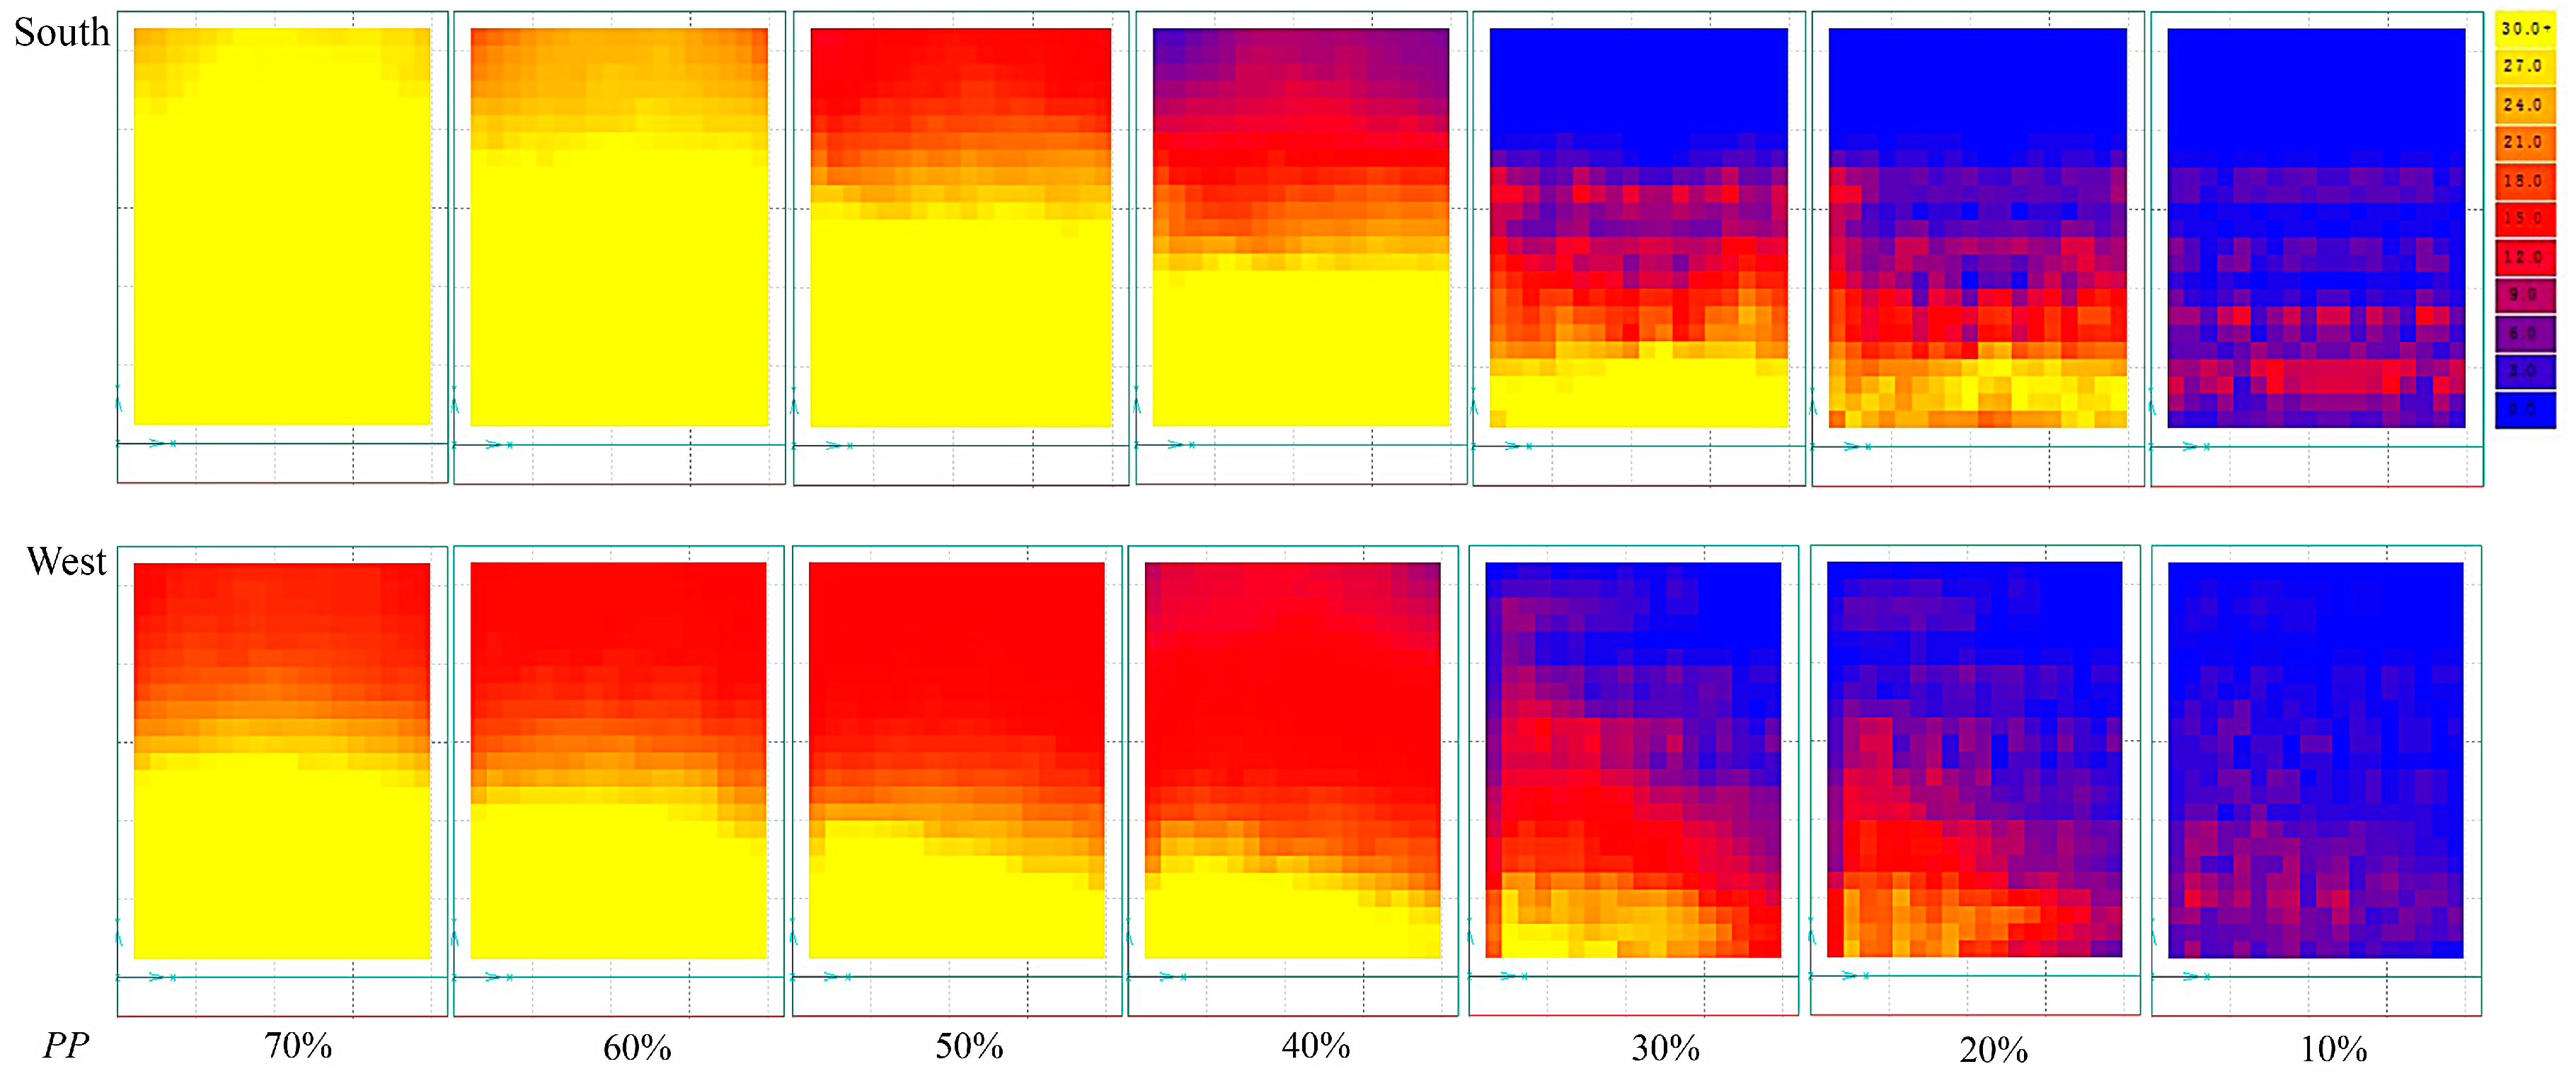
Figure 6 shows the shading and daylighting performance of the test cases, with decreasing PP and the same number of openings for both orientations (Group 1). In terms of shading, gradual decreases in over-day lit area were found for both orientations, which suggests that the increase in shading performance was due to the reduction of the opening area. Acceptable shading performance was found to be achieved at a PP below 30% for the south-facing orientation and below 50% for the west-facing orientation, while the best performance occurred at PPs of 20% and 40%, respectively. In addition, the over-day lit area was observed to occur in the area near the window (Figure 7).
For daylighting performance in the south-facing orientation, 100% of the area was day lit when the PP ranged from 70% to 20%, while only 25% of the space met the criteria at a PP of 10%. For the west-facing orientation, adequate day lit area was achieved at PPs from 70% to 40%, with a dramatic decrease in day lit area starting at a PP of 30%.In addition, the Cui exhibited a generally stable decrease for both orientations of approximately 0.3 (west) and 0.5 (south-facing) for all the cases.
The results suggest that in the south-facing orientation, acceptable daylighting could be achieved at a low PP of 20% with perforated thermal mass shading, whereas in the west-facing orientation, a higher PP of at least 40% would be required (Figure 8). Additionally, the uniformity of daylighting decreased notably with the reduction of PP, which implies that better shading performance may result in less uniformity of daylighting. Considering both shading and daylighting in the south-facing orientation, the best performance was achieved at a PP of 20%, with a day lit area of 76%, an over-day lit area of only 4%, and a Cui of 0.66. Acceptable shading performance with better daylighting was also achieved at a PP of 30%, with an over-day lit area of 14%, a day lit area of 100% and a Cui of 0.3. In the west-facing orientation, acceptable performances were achieved at two PPs of 50% and 40%.
In the second condition (Group 2), the shading and daylighting performance was similar to that of the first condition (Figure 9). For shading, a similar gradual decrease in the over-day lit area was found for both orientations, but at a higher rate as compared with the first condition. Acceptable shading performance was achieved at PPs of 23% and 34% for the south- and west-facing orientations, respectively. The over-day lit area was located at a distance from the window and closer to the center of the room space as compared with the first condition, due to the higher opening positions. In some cases no over-day lit area was found since solar irradiance mostly fell on the vertical wall instead of the horizontal workplane (Figure 10). It needs to be noted that over-day lit areas on the interior walls might cause also glare, although it has no obvious affect the occupant area.
Regarding daylighting, 100% day lit area was steadily maintained at PPs from 70% to 23%, with a notable decrease to 40% at a PP of 12% in the south-facing orientation. While for the west-facing orientation, adequate day lit area was also maintained at PPs from 70% to 23%, with a sudden decrease to 0% at a PP of 12%. The Cui fluctuated slightly between 0.3 and 0.4 for the south-facing and remained stable at approximately 0.5 for the west-facing orientation.
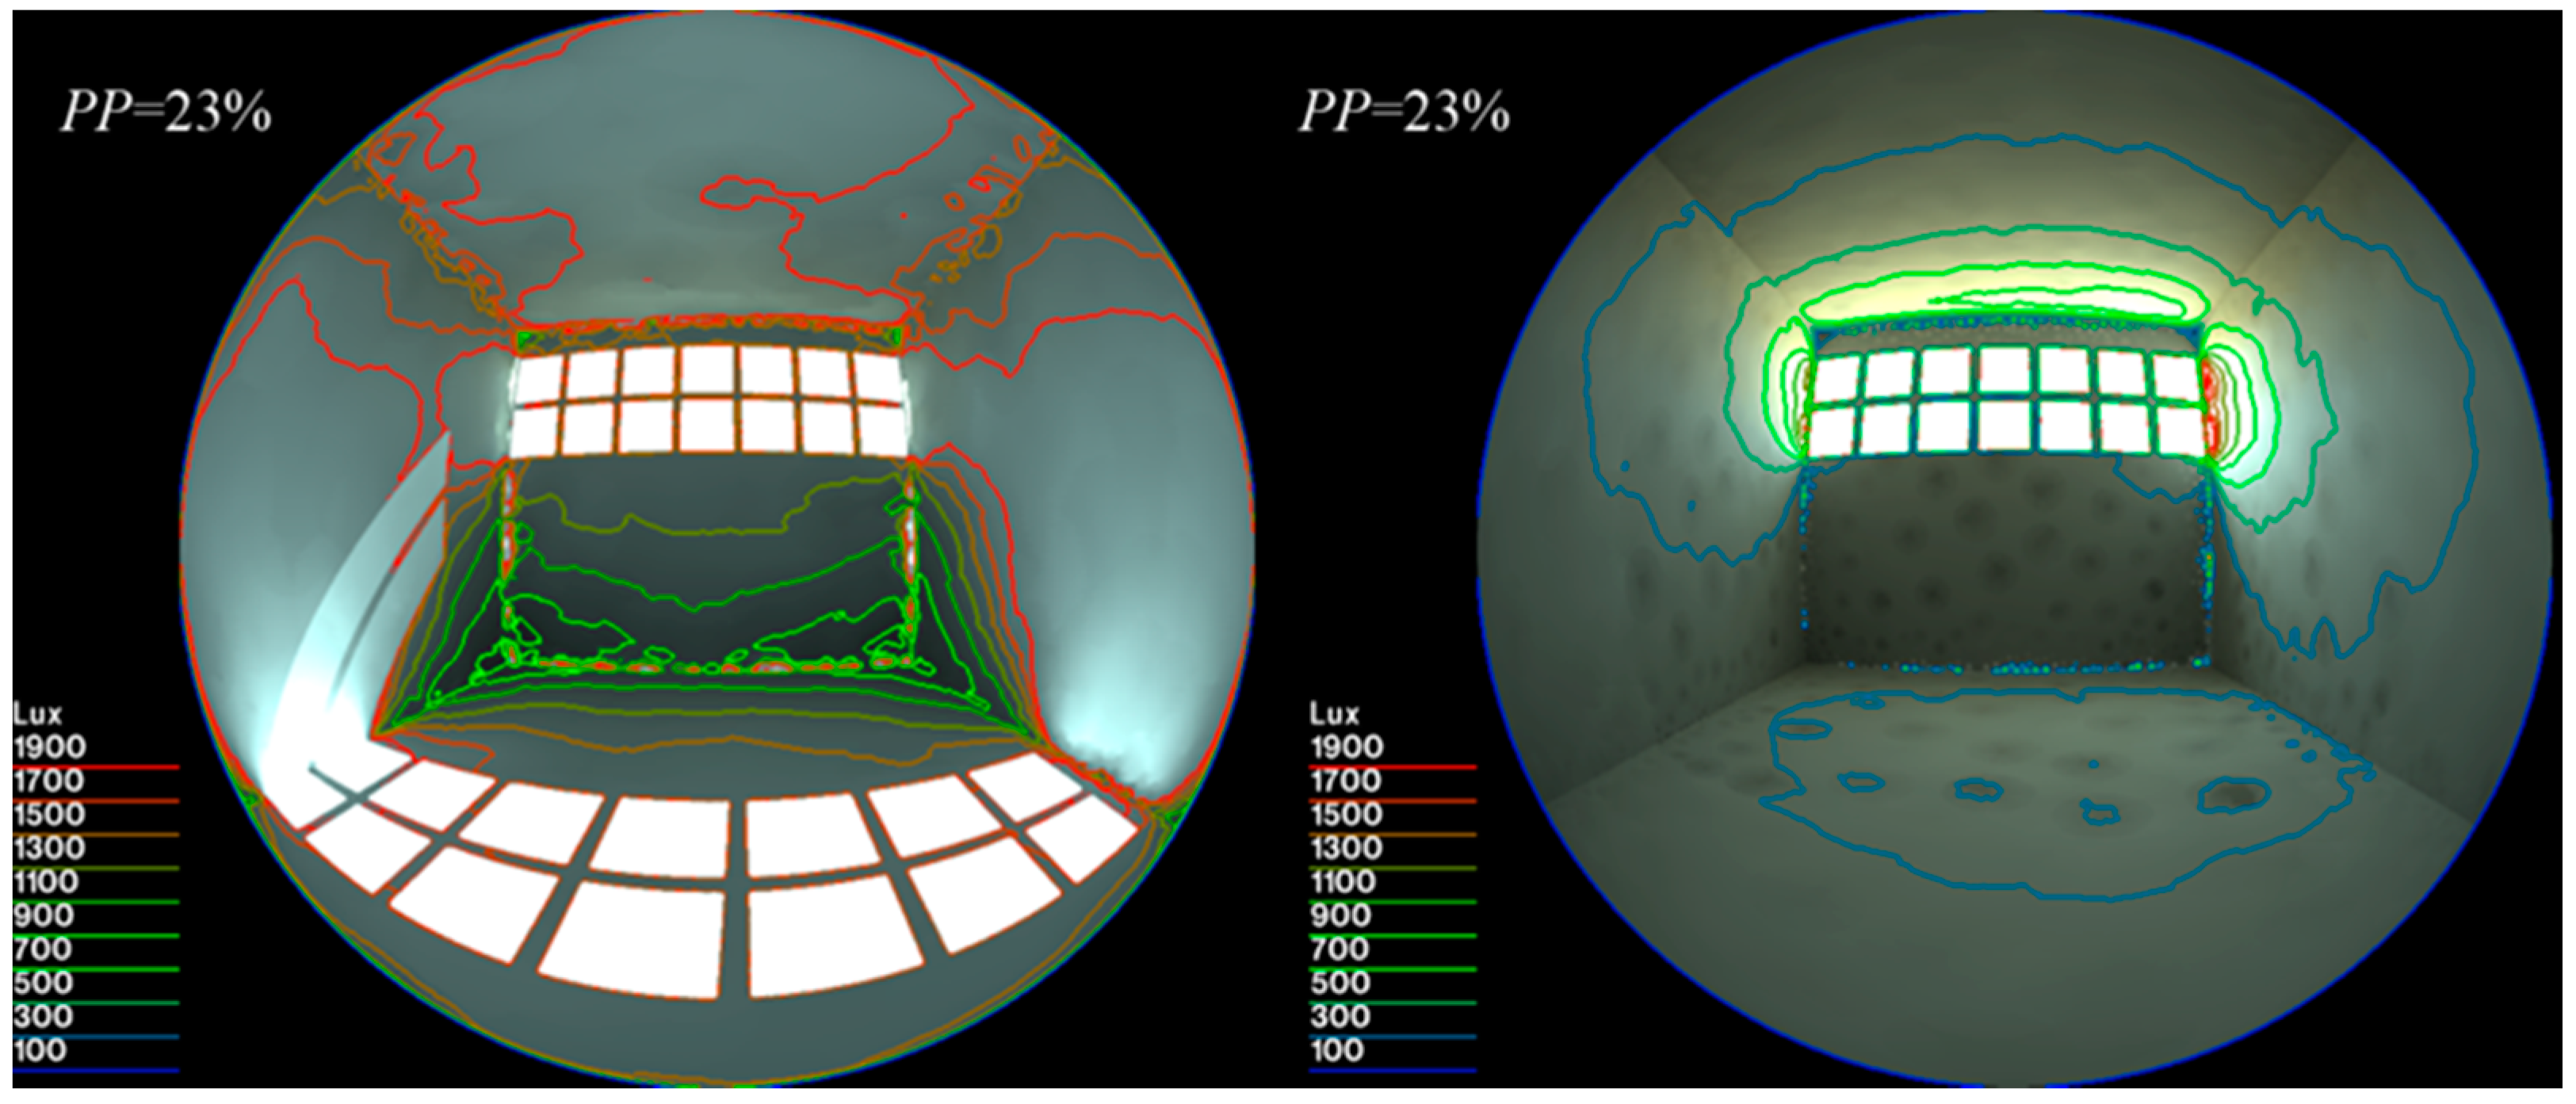
Compared with the first condition, the second condition exhibited a similar performance in the south-facing orientation, while a better daylighting performance in the west-facing orientation for adequate day lit area could be achieved at a low PP. The best combined performance was achieved at a PP of only 23%, with 3% over-day lit area, 100% day lit area and a Cui of 0.4 for the south-facing orientation. In the west-facing orientation, acceptable performance was achieved at PPs of 23% and 34% (Figure 11).
For both conditions, similar trends were observed. Acceptable daylighting performance was achieved for most test cases, and a sudden decrease in day lit area could occur at a low PP. Shading performance exhibited a gradual increase with the decrease in PP, as the over-day lit area exhibited a good linear variation. However, in the first condition, perforated thermal mass shading was found to achieve notably better shading and daylighting performance in the south-facing orientation, while for the second condition, the shading and daylighting performance was acceptable for both the south- and west-facing orientations.
3.3. Effect of the Opening Position
3.3.1. Energy Performance
The energy performance results from varying the opening positions in vertical and horizontal directions are plotted in Figure 12 and Figure 13 (Group 3 and 4). Nearly identical and stable behaviors were observed with the changes in opening position. The results indicate that the opening position had a negligible impact on energy load and heat gain. Openings in vertical layout tended to cause more heating load than those with horizontal layouts (by approximately10 kWh/m2 and 20 kWh/m2 for the south- and west-facing orientations, respectively), despite the smaller opening area that was assumed for the vertical openings in this study.
3.3.2. Shading and Daylighting Performance
Different behaviors were found with changes in opening position. When the position was varied in the vertical direction, over-day lit areas were found to be absent when the openings were at the top and the center positions in both orientations. When the openings were at the bottom position, a low expanse of over-day lit area only occurred in the near-window area (Figure 14).
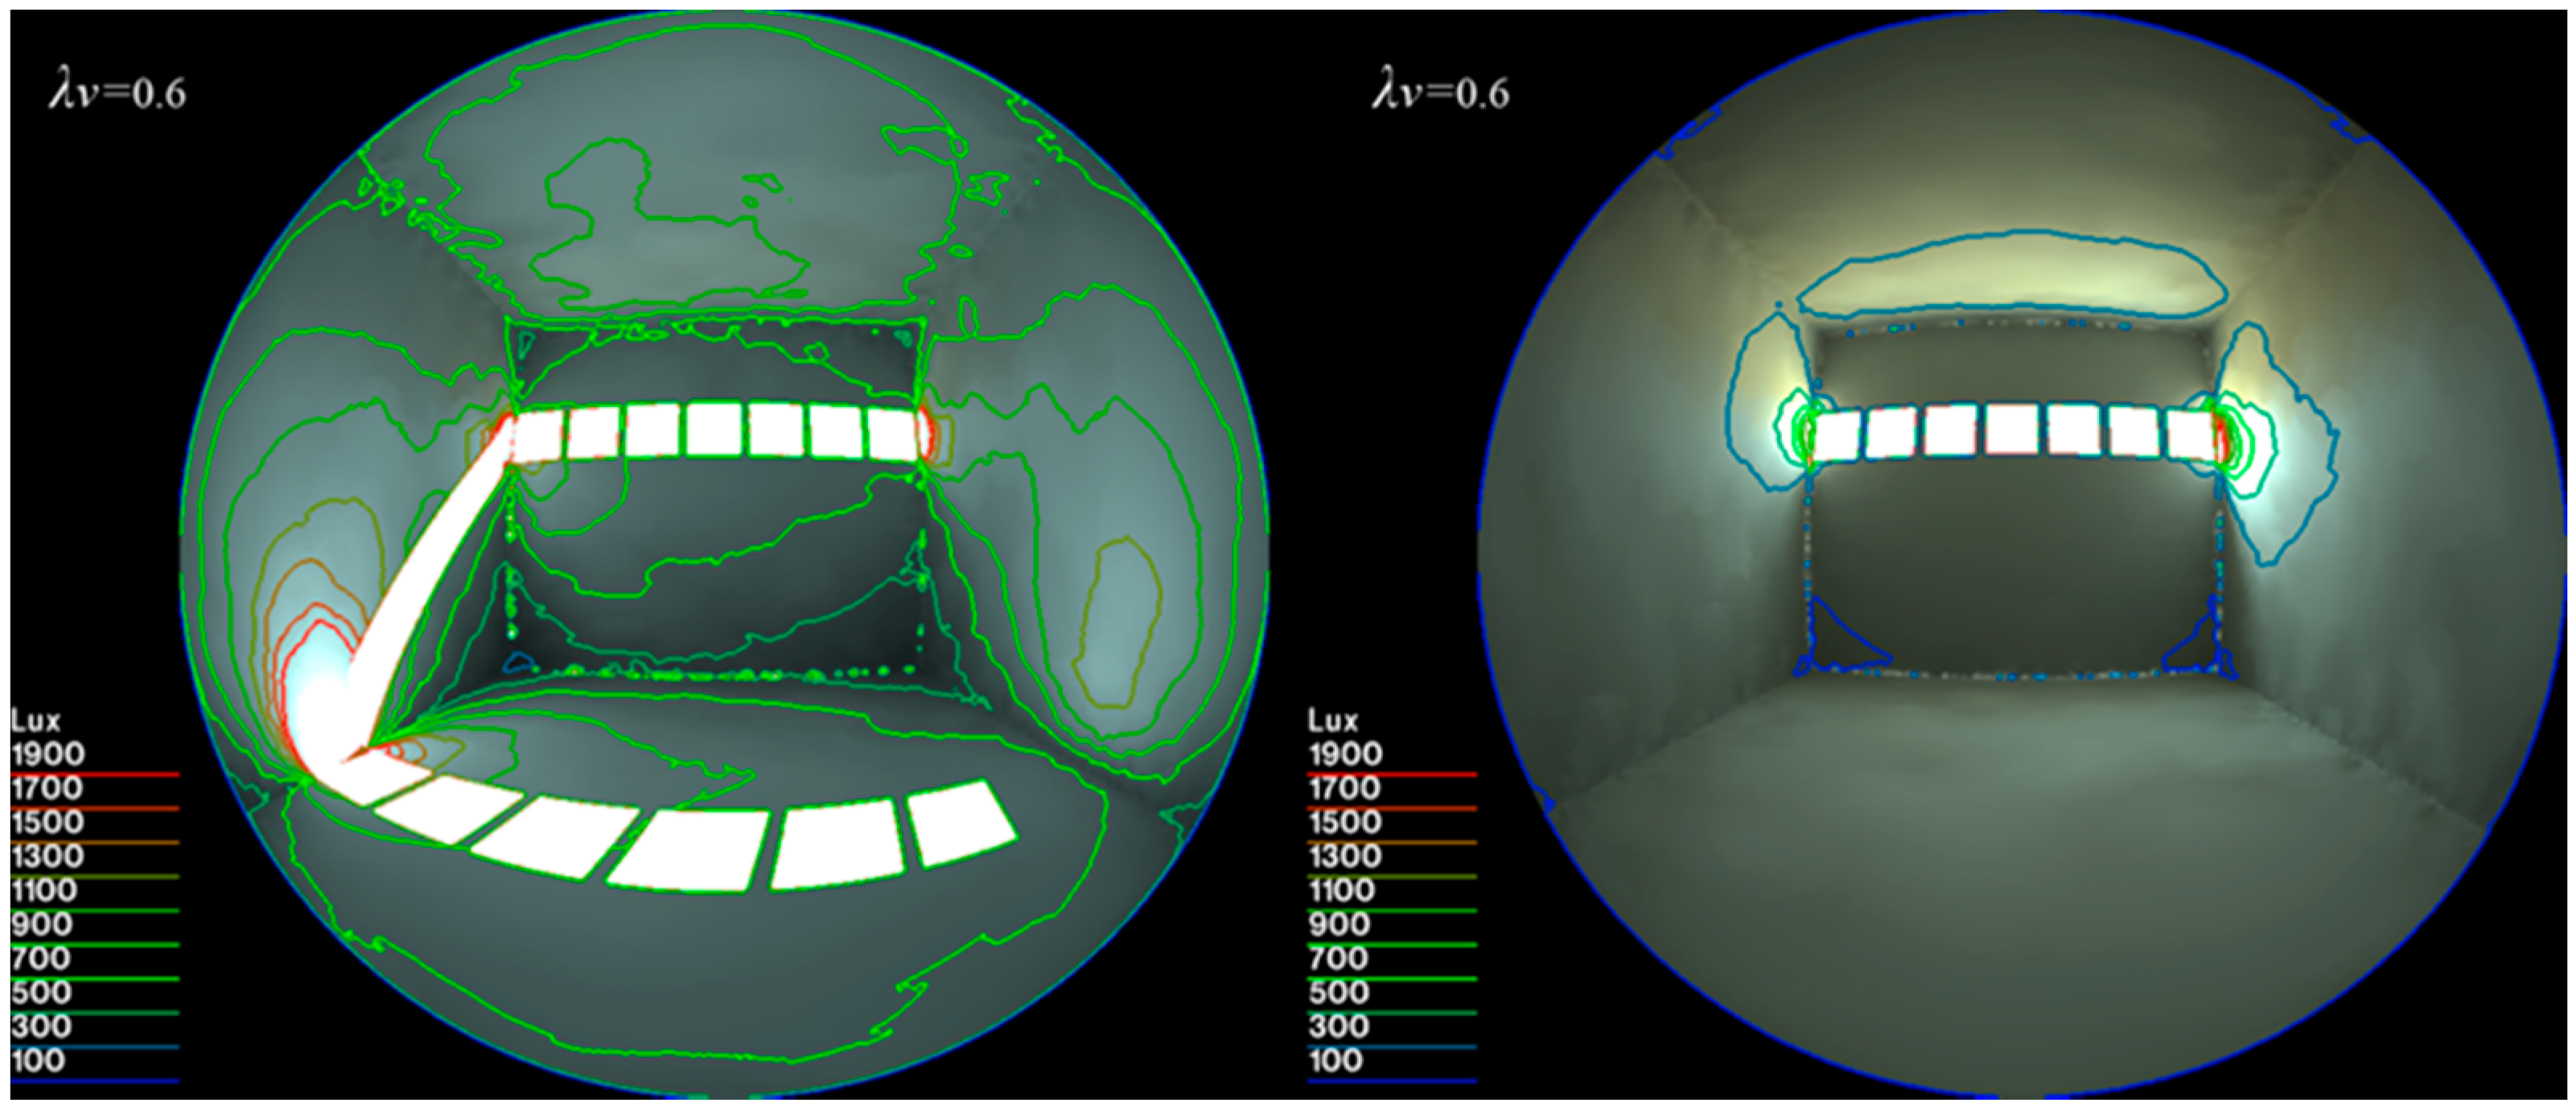
The day lit area exhibits a para-curve (Figure 15), which indicates better daylighting performance with the openings at the upper position. Notable differences in Cui were observed between 0.2 to 0.4 for south-facing and 0.3 to 0.5 for west-facing, which suggests slight differences in the distribution of daylighting with the change in the openings in the vertical direction. The best performances occurred at λv = 0.6 for both orientations (Figure 16).
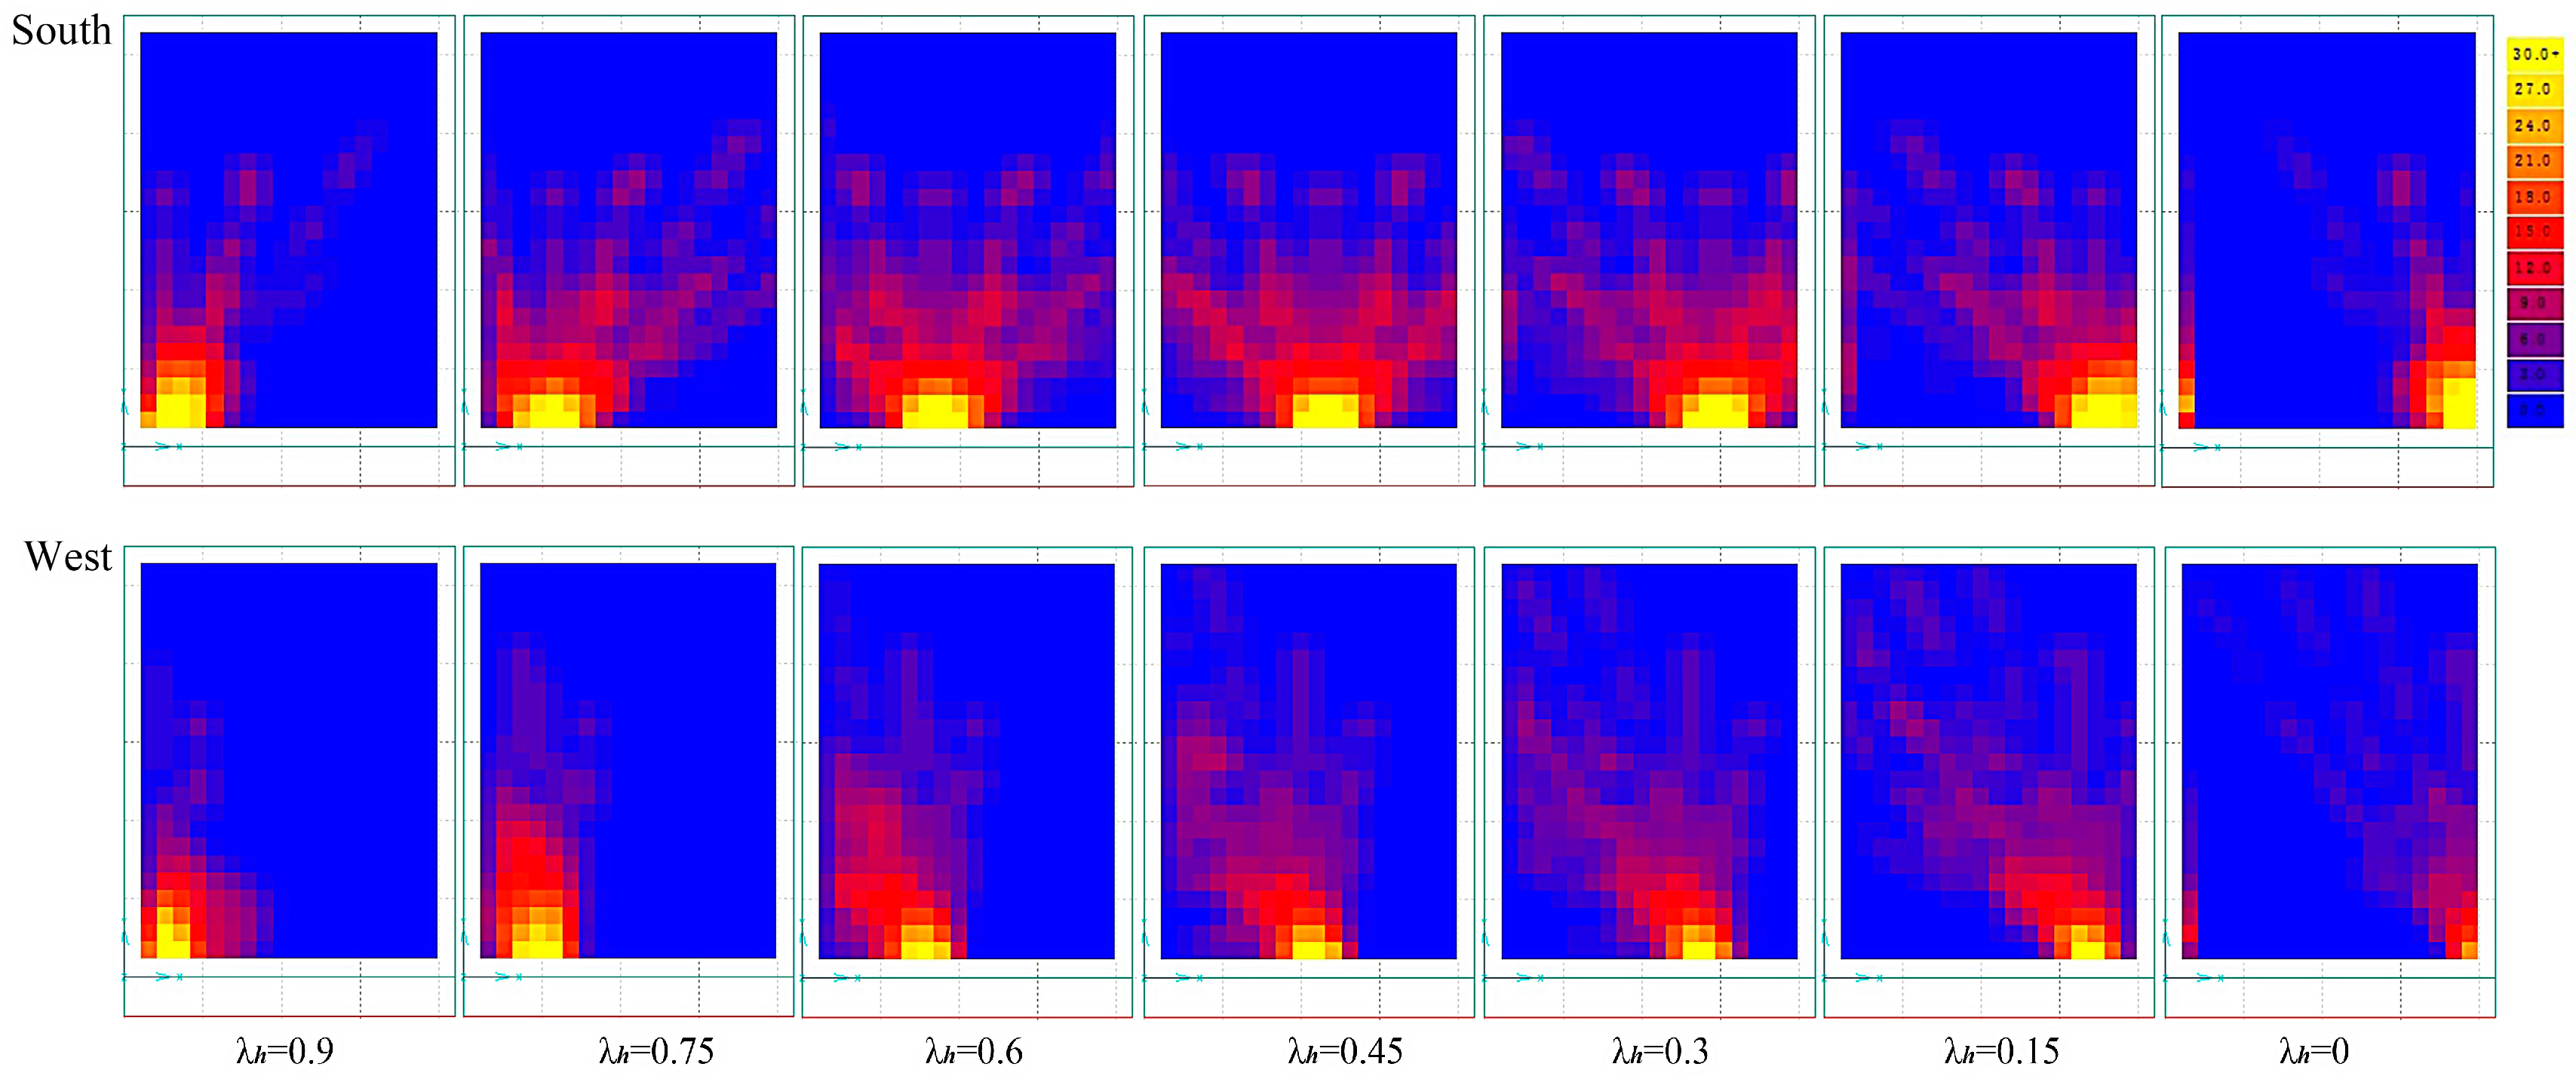
When the position was varied in the horizontal direction, limited over-day lit areas were observed for all test cases for both orientations, which suggests good shading performance in all situations (Figure 17).
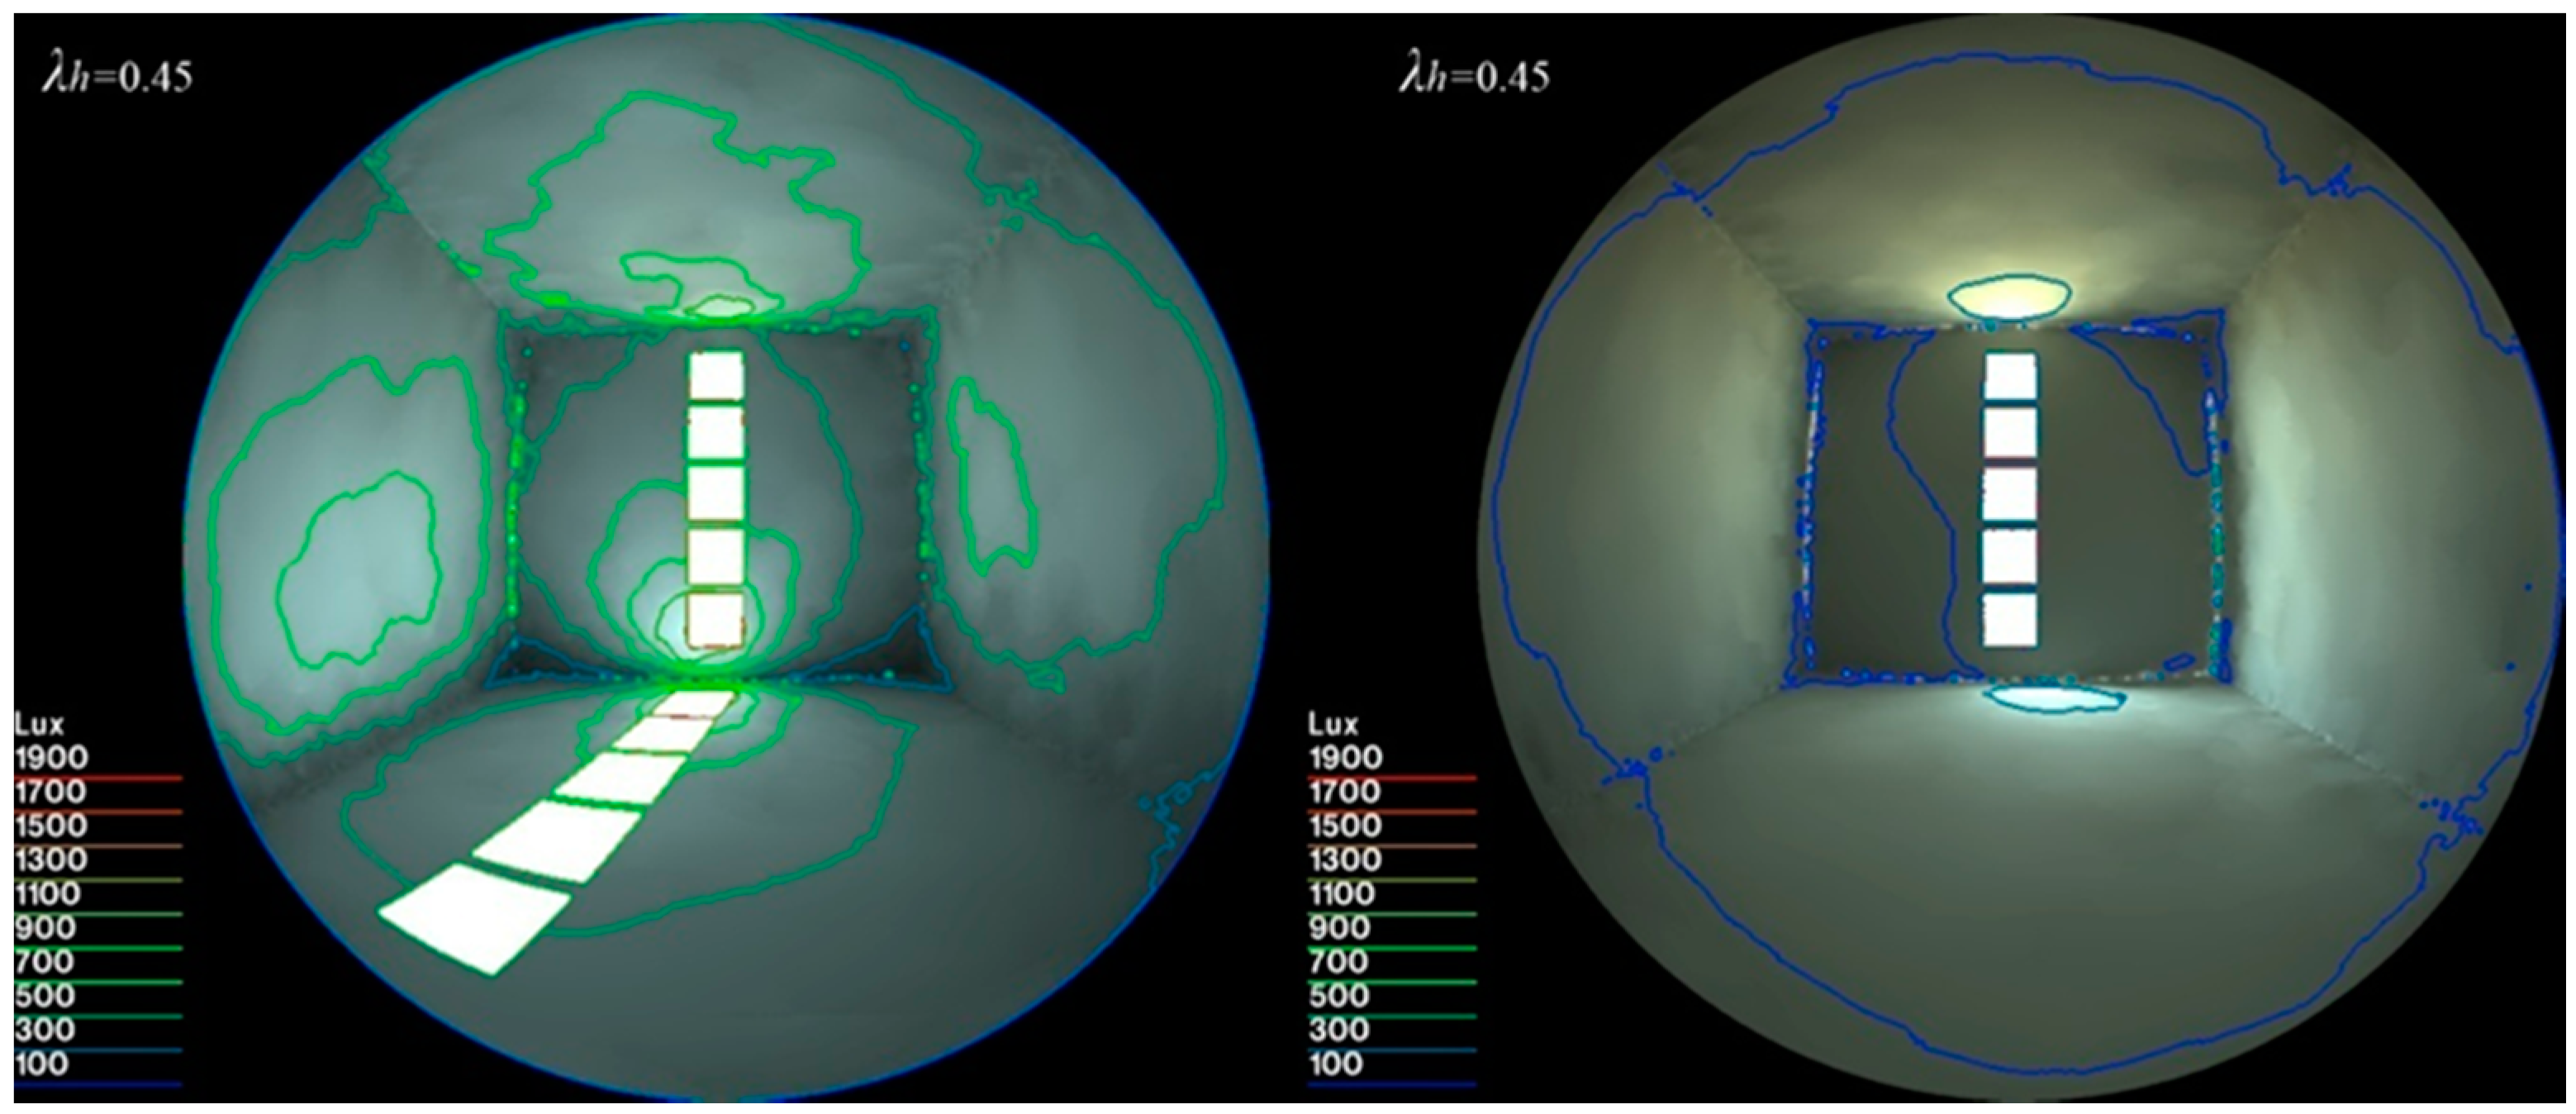
As shown in Figure 18, the day lit area also exhibits a para-curve for the south-facing orientation, which indicates better daylighting performance with the openings at the central position, while for the west-facing orientation, day lit areas remain at low levels (below 10%) for all the cases. The Cui varied between 0.2 and 0.3 for the south-facing orientation and between 0.3 and 0.4 for the west-facing orientation, which again suggests slight differences in the distribution of daylighting with the change of the openings in the horizontal direction. The best performance occurred when the openings were at the central position, with λh = 0.45 for the south-facing orientation (Figure 19).
The results indicate perfect shading performance in the two configurations of perforated mass shading, and also indicate that openings at the upper or central positions achieved the best daylighting performance. However, the area of the openings must be increased in order to achieve acceptable a day lit area.
3.4. Overall Performance
In the test cases, the performance of thermal solar shading were found to vary significantly between the different conditions. In terms of variations in PP, energy savings were achieved for all the test cases in the south-facing orientation: from 15.0% to 62.2% in Group 1 and from 15.0% to 78.7% in Group 2 (as compared with the reference model). In the west-facing orientation, energy savings were negative for most cases: only 14.9% was achieved for a PP of 10% in Group 1 and 29.1% for a PP of 12% in Group 2. The major causes may include less solar heat gain and more heat loss through the holes and vents of the mass shading in the west-facing orientation. While shading performance was found to be significantly improved for all the cases in both orientations, over-day lit areas were as low as 20% in Group 1 and 3% in Group 2 for the south-facing orientation, and 15% in Group 3 and 10% in Group 4 for the west-facing orientation, with acceptable day lit areas and similar or better annual uniformity of illuminance as compared with the reference model. Thus, regarding variations in PP, the best combined performance was achieved by the south-facing orientation at a PP of 23% in Group 2 and a PP of 20% in Group 1.
In terms of variations in PO, notably similar energy savings were achieved for all the test cases in each group and orientation. In Group 3, energy savings were 78.7% in the south-facing orientation and 28.9% in the west-facing orientation compared with the reference model. In Group 4, the energy savings were 60% and 8.9%, respectively. Significantly improved shading performance was achieved for all the cases in both directions, and negligible over-day lit areas were observed for most cases. However, for daylighting performance, the largest day lit area of 63% was observed in the south-facing orientation when the opening was at the vertically top position (Group 3), and 34% day lit area was achieved for the horizontally middle position (Group 4). The daylighting performance of the two conditions did not meet the overall criteria because of the small perforation percentage. The PO for the best combined performance was determined to occur at a λv of 0.6 and a λh of 0.45 in the south-facing orientation. The best combined performance of alternatives in the 4 groups in the south-facing orientation are illustrated in Table 4.
4. Conclusions
Perforated TMS in proper configurations proved to be an efficient device for shading, daylighting and savings in heating load in winter for a high-altitude, cold climate, primarily in the south-facing orientation. This was demonstrated by the simulation results of a case study of Lhasa, Tibet under the prescribed conditions. It is also suggested that a balance between the conflicting requirements of the prevention of solar irradiance and the utilization of passive solar heat can be achieved with an adequate supply of natural daylighting by the use of mass shading in winter.
Two key configuration parameters of PP and PO were observed to have great impact on the integrated or individual performance of this shading device. The modification of PP was found to have significant impacts on energy, shading and daylighting performance. When PP was varied with the openings in fixed positions, the best combined performance was achieved in the south-facing orientation at a PP of 20%, with results of 3% over-day lit area, 100% day lit area and 41.1% energy savings. Acceptable performance was observed at a PP of 30%. When the PP was changed by varying the number of openings (each opening having a fixed area), the best performance was at a PP of 23%, with 4% over-day lit area, 76% day lit area and 53.2% energy savings. The modifications of the PO were observed to have obvious impacts on shading and daylighting, while producing a negligible impact on energy consumption. High performance was also achieved in the south-facing orientation when the openings were in the vertically upper or horizontally middle positions. Additionally, a λv of 0.6 and a λh of 0.45 are recommended for the best combined performance.
In terms of orientation, perforated TMS was found to be more applicable in the south-facing orientation with more solar radiation. Whereas in the west-facing orientation with less radiation, it was noted that the thermal mass shading had positive effects on shading with the possibility of adequate daylighting, but negative impacts on energy savings for most cases during the tested winter period. However, this result is as compared with the condition of a large glazed area in the west-facing orientation. The perforated TMS still offers a solution for shading when an opening in the west-facing orientation is of necessity. The west-facing results also apply to the east-facing orientation.
5. Future Work
The above work has explored the performance of a basic configuration of perforated mass shading. The thickness of the mass may have contribution to the heat gain from the mass, as well as producing impacts on shading and daylighting. Thus, further study is needed in order to explore the variation in the thickness of the mass on the performance.
Acknowledgments
This research was supported by the National Natural Science Foundation of China (No. 51278525). The authors would also like to thank Jiayu Xiao for assistance in the illustration design.
Author Contributions
Lingjiang Huang conceived and designed the experiments; Shuangping Zhao performed the experiments; Lingjiang Huang and Shuangping Zhao analyzed the data; Lingjiang Huang wrote the paper.
Conflicts of Interest
The authors declare no conflict of interest.
References
- Lyons, P.R.; Arasteh, D.; Huizenga, C. Window performance for human thermal comfort. Ashrae Trans. 2000, 106, 4–20. [Google Scholar]
- American Society of Heating, Refrigerating and Air-Conditioning Engineers. 2009 ASHRAE Handbook: Fundamentals. Available online: http://shop.iccsafe.org/media/wysiwyg/material/8950P217-toc.pdf (accessed on 22 November 2017).
- Arens, E.; Hoyt, T.; Zhou, X.; Huang, L.; Zhang, H.; Schiavon, S. Modeling the comfort effects of short-wave solar radiation indoors. Build. Environ. 2015, 88, 3–9. [Google Scholar] [CrossRef]
- La Gennusa, M.; Nucara, A.; Pietrafesa, M.; Rizzo, G. A model for managing and evaluating solar radiation for indoor thermal comfort. Sol. Energy 2007, 81, 594–606. [Google Scholar] [CrossRef]
- Haldi, F.; Robinson, D. On the behaviour and adaptation of office occupants. Build. Environ. 2008, 43, 2163–2177. [Google Scholar] [CrossRef]
- Yun, G.Y.; Steemers, K. Time-dependent occupant behaviour models of window control in summer. Build. Environ. 2008, 43, 1471–1482. [Google Scholar] [CrossRef]
- Huang, L.; Hamza, N.; Lan, B.; Zahi, D. Climate-responsive design of traditional dwellings in the cold-arid regions of Tibet and a field investigation of indoor environments in winter. Energy Build. 2016, 128, 697–712. [Google Scholar] [CrossRef]
- Liu, Y.; Liu, J.; Yang, L.; Li, J. Measureing study of passive solar house for traditional dewlling building in lhasa area. Acta Energiae Sol. Sin. 2008, 29, 391–394. [Google Scholar]
- Si, P.; Feng, Y.; Lv, Y.; Rong, X.; Pan, Y.; Liu, X.; Yan, J. An optimization method applied to active solar energy systems for buildings in cold plateau areas—The case of Lhasa. Appl. Energy 2017, 194, 487–498. [Google Scholar] [CrossRef]
- Blumthaler, M.; Ambach, W.; Ellinger, R. Increase in solar UV radiation with altitude. J. Photochem. Photobiol. B Biol. 1997, 39, 130–134. [Google Scholar] [CrossRef]
- Blumthaler, M. Solar Radiation of the high Alps. In Plants in Alpine Regions; Springer: Vienna, Austria, 2012; pp. 11–20. [Google Scholar]
- Huang, L. Impacts of Solar Radiation on Winter Indoor Thermal Comfort in Lhasa in: 12th National Building Physics Conference; China Building Industry Press: Wenzhou, China, 2016; pp. 575–579. [Google Scholar]
- Aldawoud, A. Conventional fixed shading devices in comparison to an electrochromic glazing system in hot, dry climate. Energy Build. 2013, 59, 104–110. [Google Scholar] [CrossRef]
- Cho, J.; Yoo, C.; Kim, Y. Viability of exterior shading devices for high-rise residential buildings: Case study for cooling energy saving and economic feasibility analysis. Energy Build. 2014, 82, 771–785. [Google Scholar] [CrossRef]
- Grynning, S.; Time, B.; Matusiak, B. Solar shading control strategies in cold climates—Heating, cooling demand and daylight availability in office spaces. Sol. Energy 2014, 107, 182–194. [Google Scholar] [CrossRef]
- David, M.; Donn, M.; Garde, F.; Lenoir, A. Assessment of the thermal and visual efficiency of solar shades. Build. Environ. 2011, 46, 1489–1496. [Google Scholar] [CrossRef]
- Sherif, A.; El-Zafarany, A.; Arafa, R. External perforated window Solar Screens: The effect of screen depth and perforation ratio on energy performance in extreme desert environments. Energy Build. 2012, 52, 1–10. [Google Scholar] [CrossRef]
- Sherif, A.; Sabry, H.; Rakha, T. External perforated Solar Screens for daylighting in residential desert buildings: Identification of minimum perforation percentages. Sol. Energy 2012, 86, 1929–1940. [Google Scholar] [CrossRef]
- Sabry, H.; Sherif, A.; Gadelhak, M.; Aly, M. Balancing the daylighting and energy performance of solar screens in residential desert buildings: Examination of screen axial rotation and opening aspect ratio. Sol. Energy 2014, 103, 364–377. [Google Scholar] [CrossRef]
- Chi, D.A.; Moreno, D.; Navarro, J. Design optimisation of perforated solar façades in order to balance daylighting with thermal performance. Build. Environ. 2017, 125, 383–400. [Google Scholar] [CrossRef]
- Vadiee, A.; Yaghoubi, M.; Martin, V.; Bazargan-Lari, Y. Energy analysis of solar blind system concept using energy system modelling. Sol. Energy 2016, 139, 297–308. [Google Scholar] [CrossRef]
- O’Hegarty, R.; Kinnane, O.; McCormack, S.J. Review and analysis of solar thermal facades. Sol. Energy 2016, 135, 408–422. [Google Scholar] [CrossRef]
- Peng, J.; Lin, L.; Yang, H. An experimental study of the thermal performance of a novel photovoltaic double-skin facade in Hong Kong. Sol. Energy 2013, 97, 293–304. [Google Scholar] [CrossRef]
- Chan, H.Y.; Riffat, S.B.; Zhu, J. Review of passive solar heating and cooling technologies. Renew. Sustain. Energy Rev. 2010, 14, 781–789. [Google Scholar] [CrossRef]
- Lee, K.S.; Han, K.J.; Lee, J.W. The Impact of Shading Type and Azimuth Orientation on the Daylighting in a Classroom–Focusing on Effectiveness of Façade Shading, Comparing the Results of DA and UDI. Energies 2017, 10, 635. [Google Scholar] [CrossRef]
- Reinhart, C.F.; Walkenhorst, O. Validation of dynamic RADIANCE-based daylight simulations for a test office with external blinds. Energy Build. 2001, 33, 683–697. [Google Scholar] [CrossRef]
- Nabil, A.; Mardaljevic, J. Useful daylight illuminances: A replacement for daylight factors. Energy Build. 2006, 38, 905–913. [Google Scholar] [CrossRef]
- Nguyen, A.T.; Reiter, S.; Rigo, P. A review on simulation-based optimization methods applied to building performance analysis. Appl. Energy 2014, 113, 1043–1058. [Google Scholar] [CrossRef]
- Reinhart, C.F.; Herkel, S. The simulation of annual daylight illuminance distributions—A state-of-the-art comparison of six RADIANCE-based methods. Energy Build. 2000, 32, 167–187. [Google Scholar] [CrossRef]
- Meteorological Data Set for Building Thermal Environment Analysis of China; China Building Industry Press: Beijing, China, 2005.
Figure 1.
Diagrammatic rendering of perforated mass shading: (a) The plan; (b) The axonometric view.
Figure 1.
Diagrammatic rendering of perforated mass shading: (a) The plan; (b) The axonometric view.

Figure 2.
Simulation models: (a) the reference model (50% WWR); (b) an example test case.

Figure 3.
Annual energy consumption of different depth ratios: (a) Simulated data of the referenced study; and (b) simulated data of the verification model.
Figure 3.
Annual energy consumption of different depth ratios: (a) Simulated data of the referenced study; and (b) simulated data of the verification model.
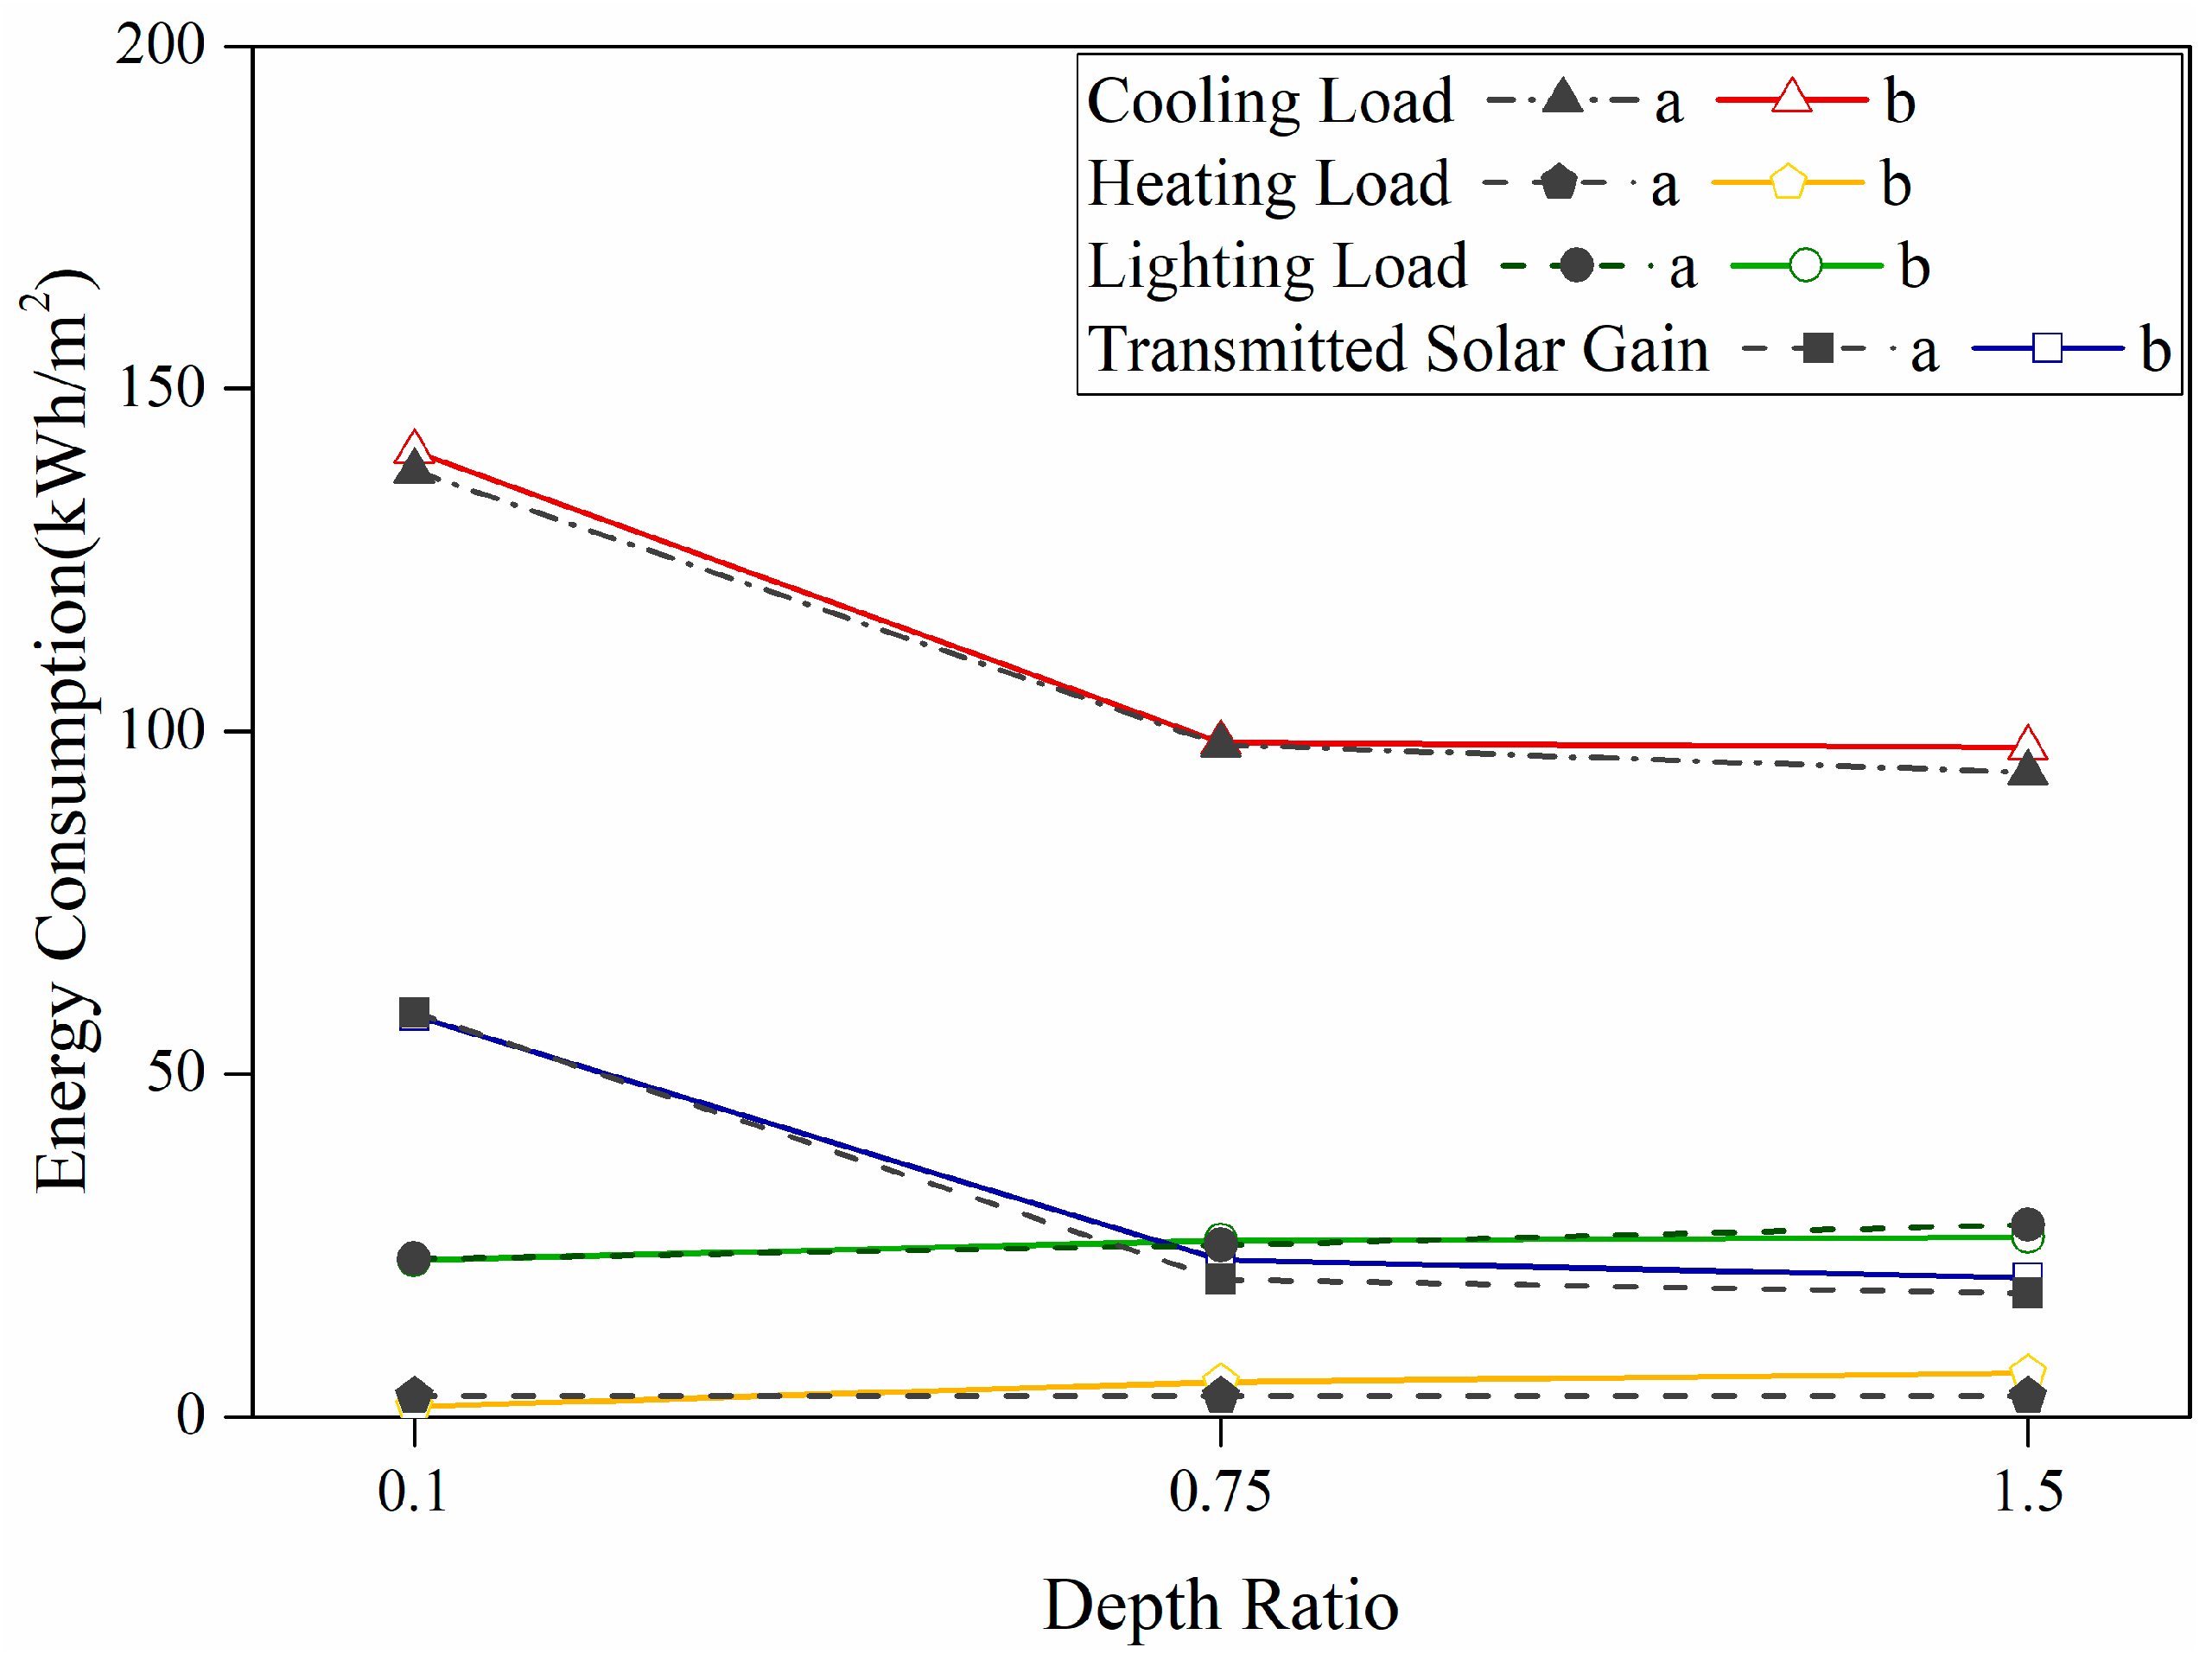
Figure 4.
Winter energy performance of different perforated percentages in Group 1.

Figure 5.
Winter energy performance of different perforated percentages in Group 2.

Figure 6.
Shading and daylighting performance for the tested cases in Group 1.
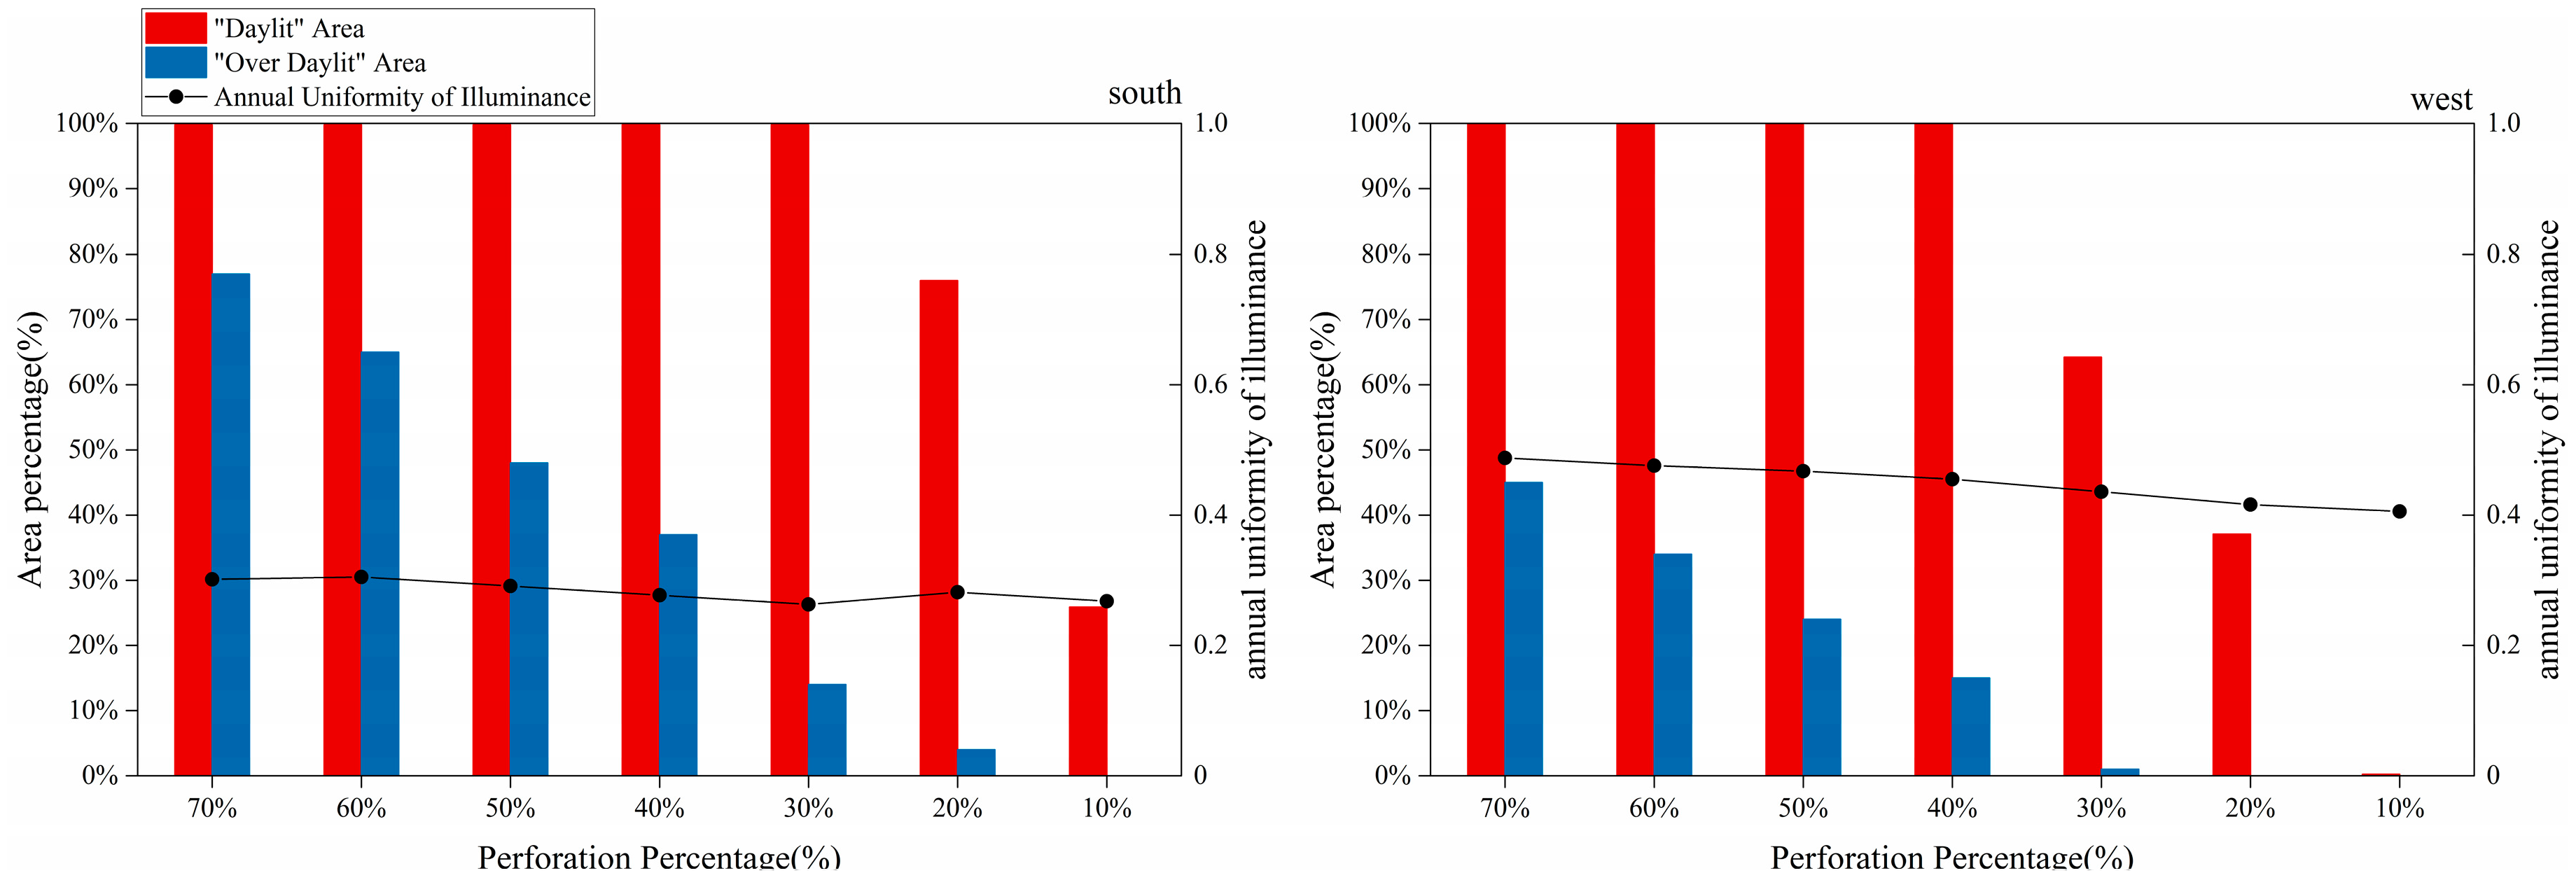
Figure 7.
Distribution of over-day lit area in Group 1.

Figure 8.
Radiance rendered views for a PP of 20% in the south-facing orientation and 50% in the west-facing orientation at 12:00 p.m. 21 December (standard meteorological year).
Figure 8.
Radiance rendered views for a PP of 20% in the south-facing orientation and 50% in the west-facing orientation at 12:00 p.m. 21 December (standard meteorological year).
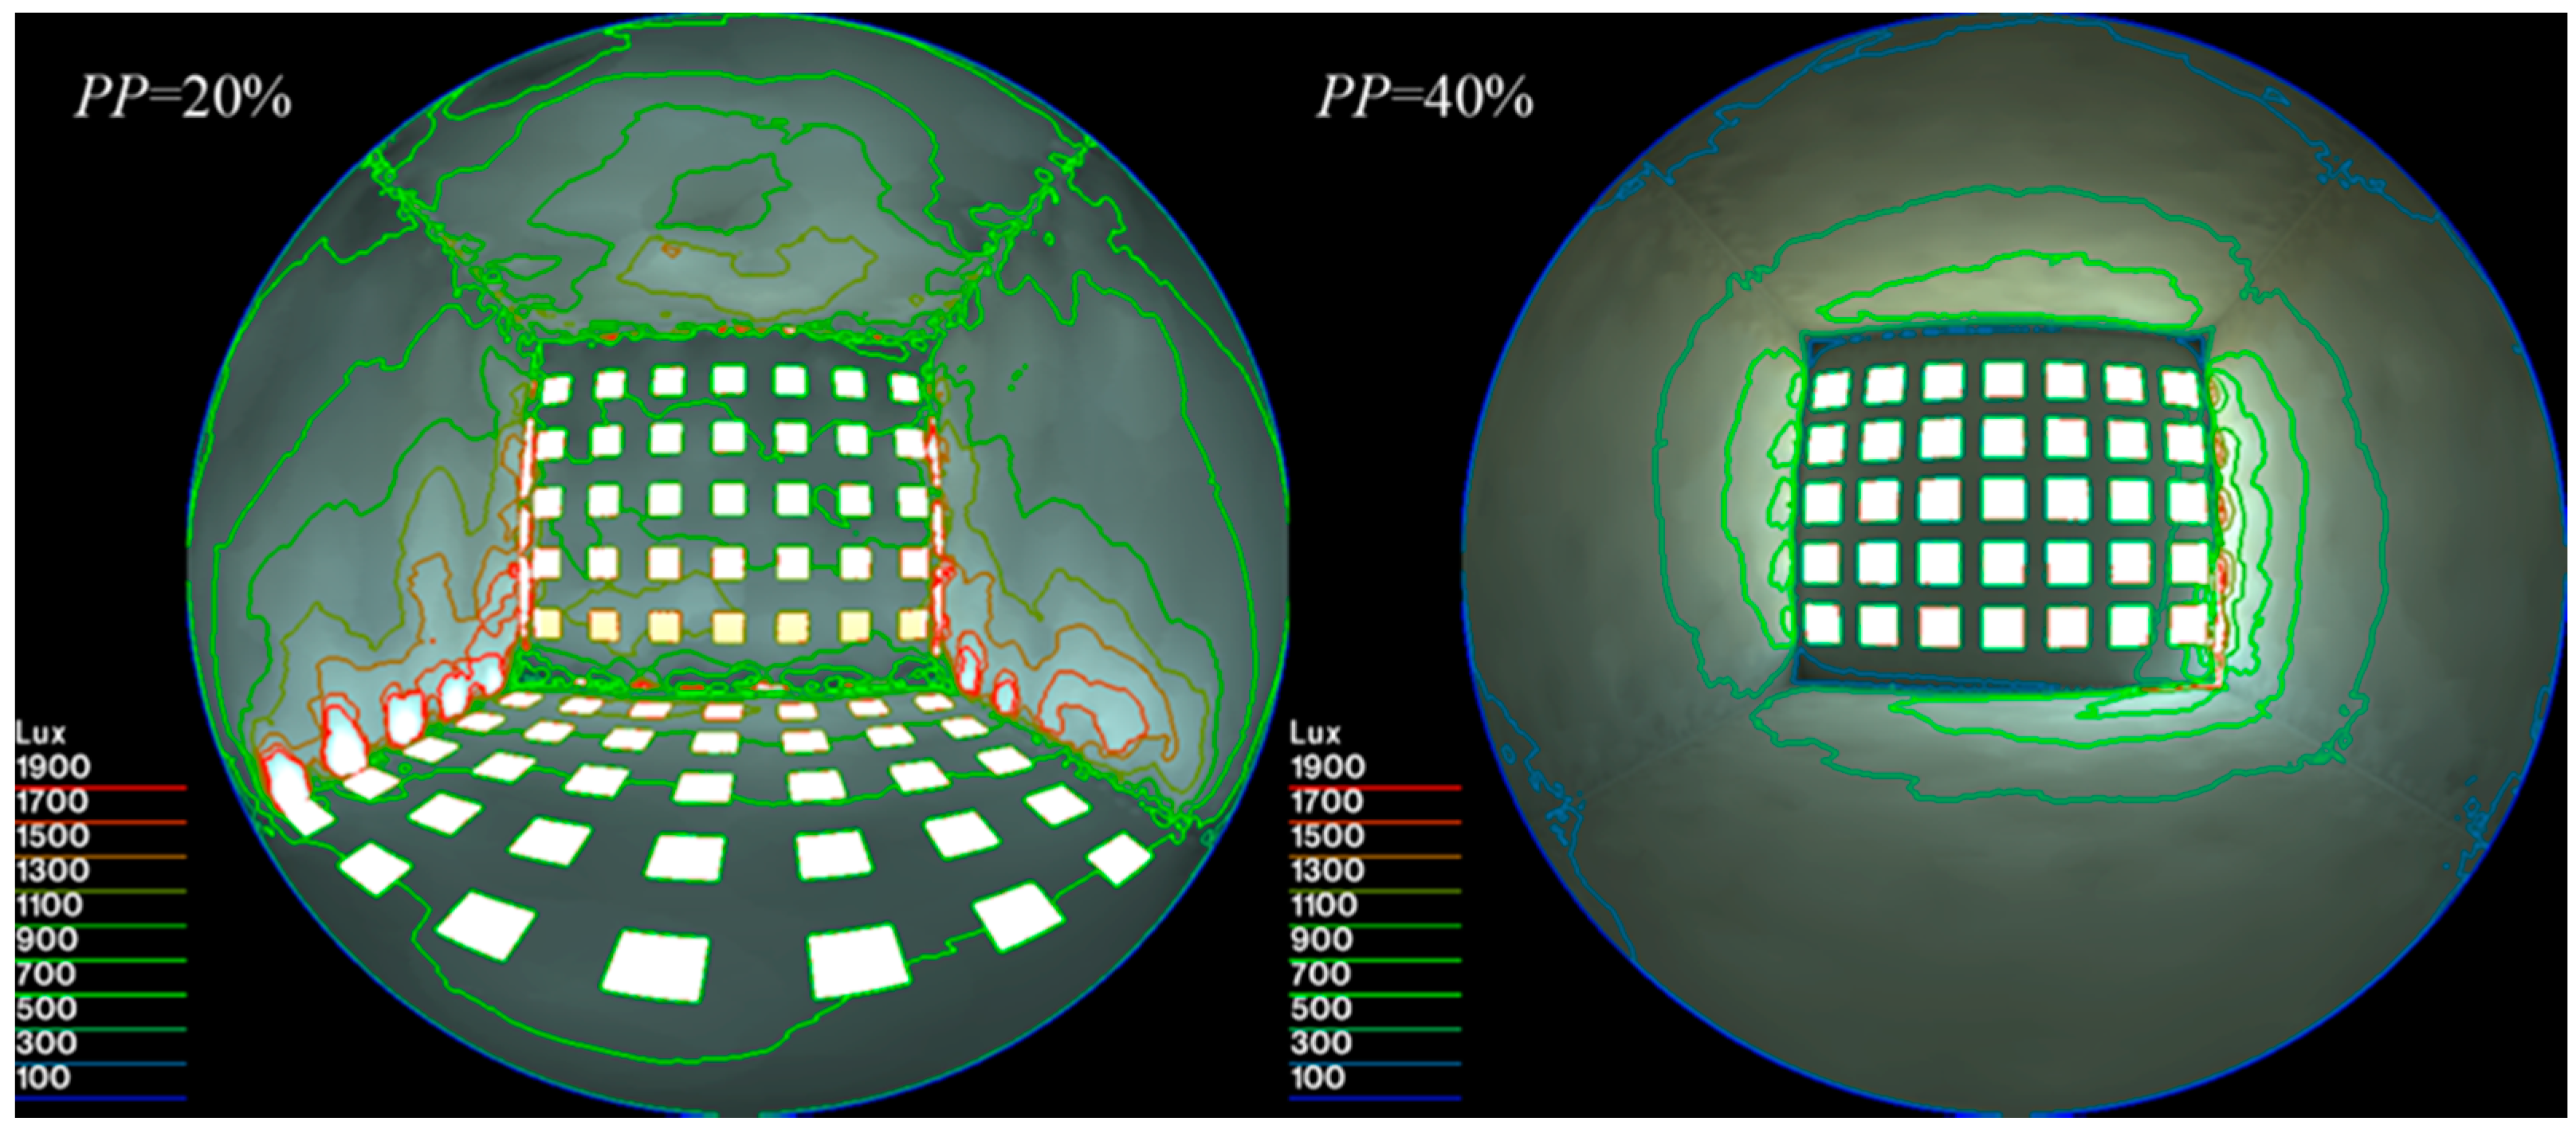
Figure 9.
Daylighting and shading performance for the tested cases in Group 2.
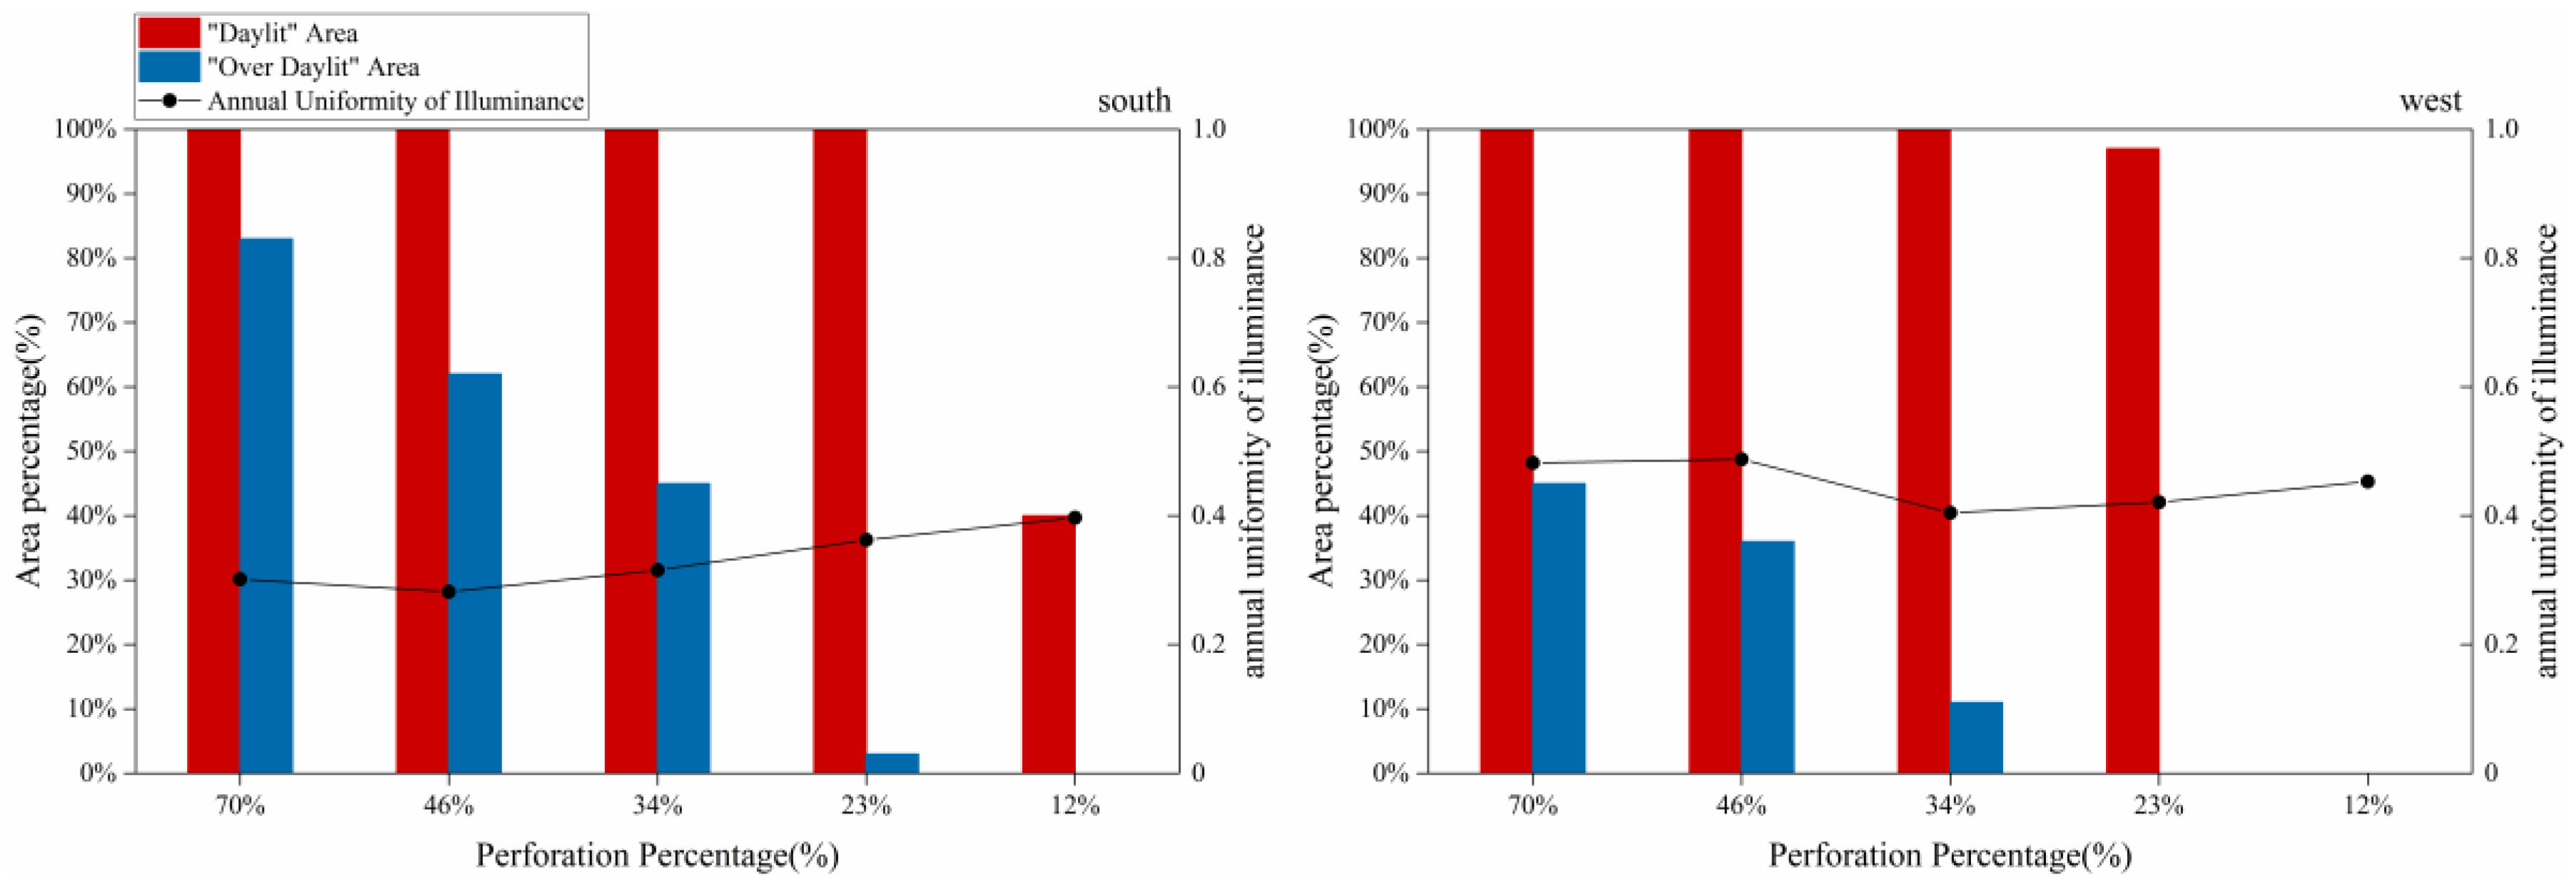
Figure 10.
Distribution of over-day lit area in Group 2.
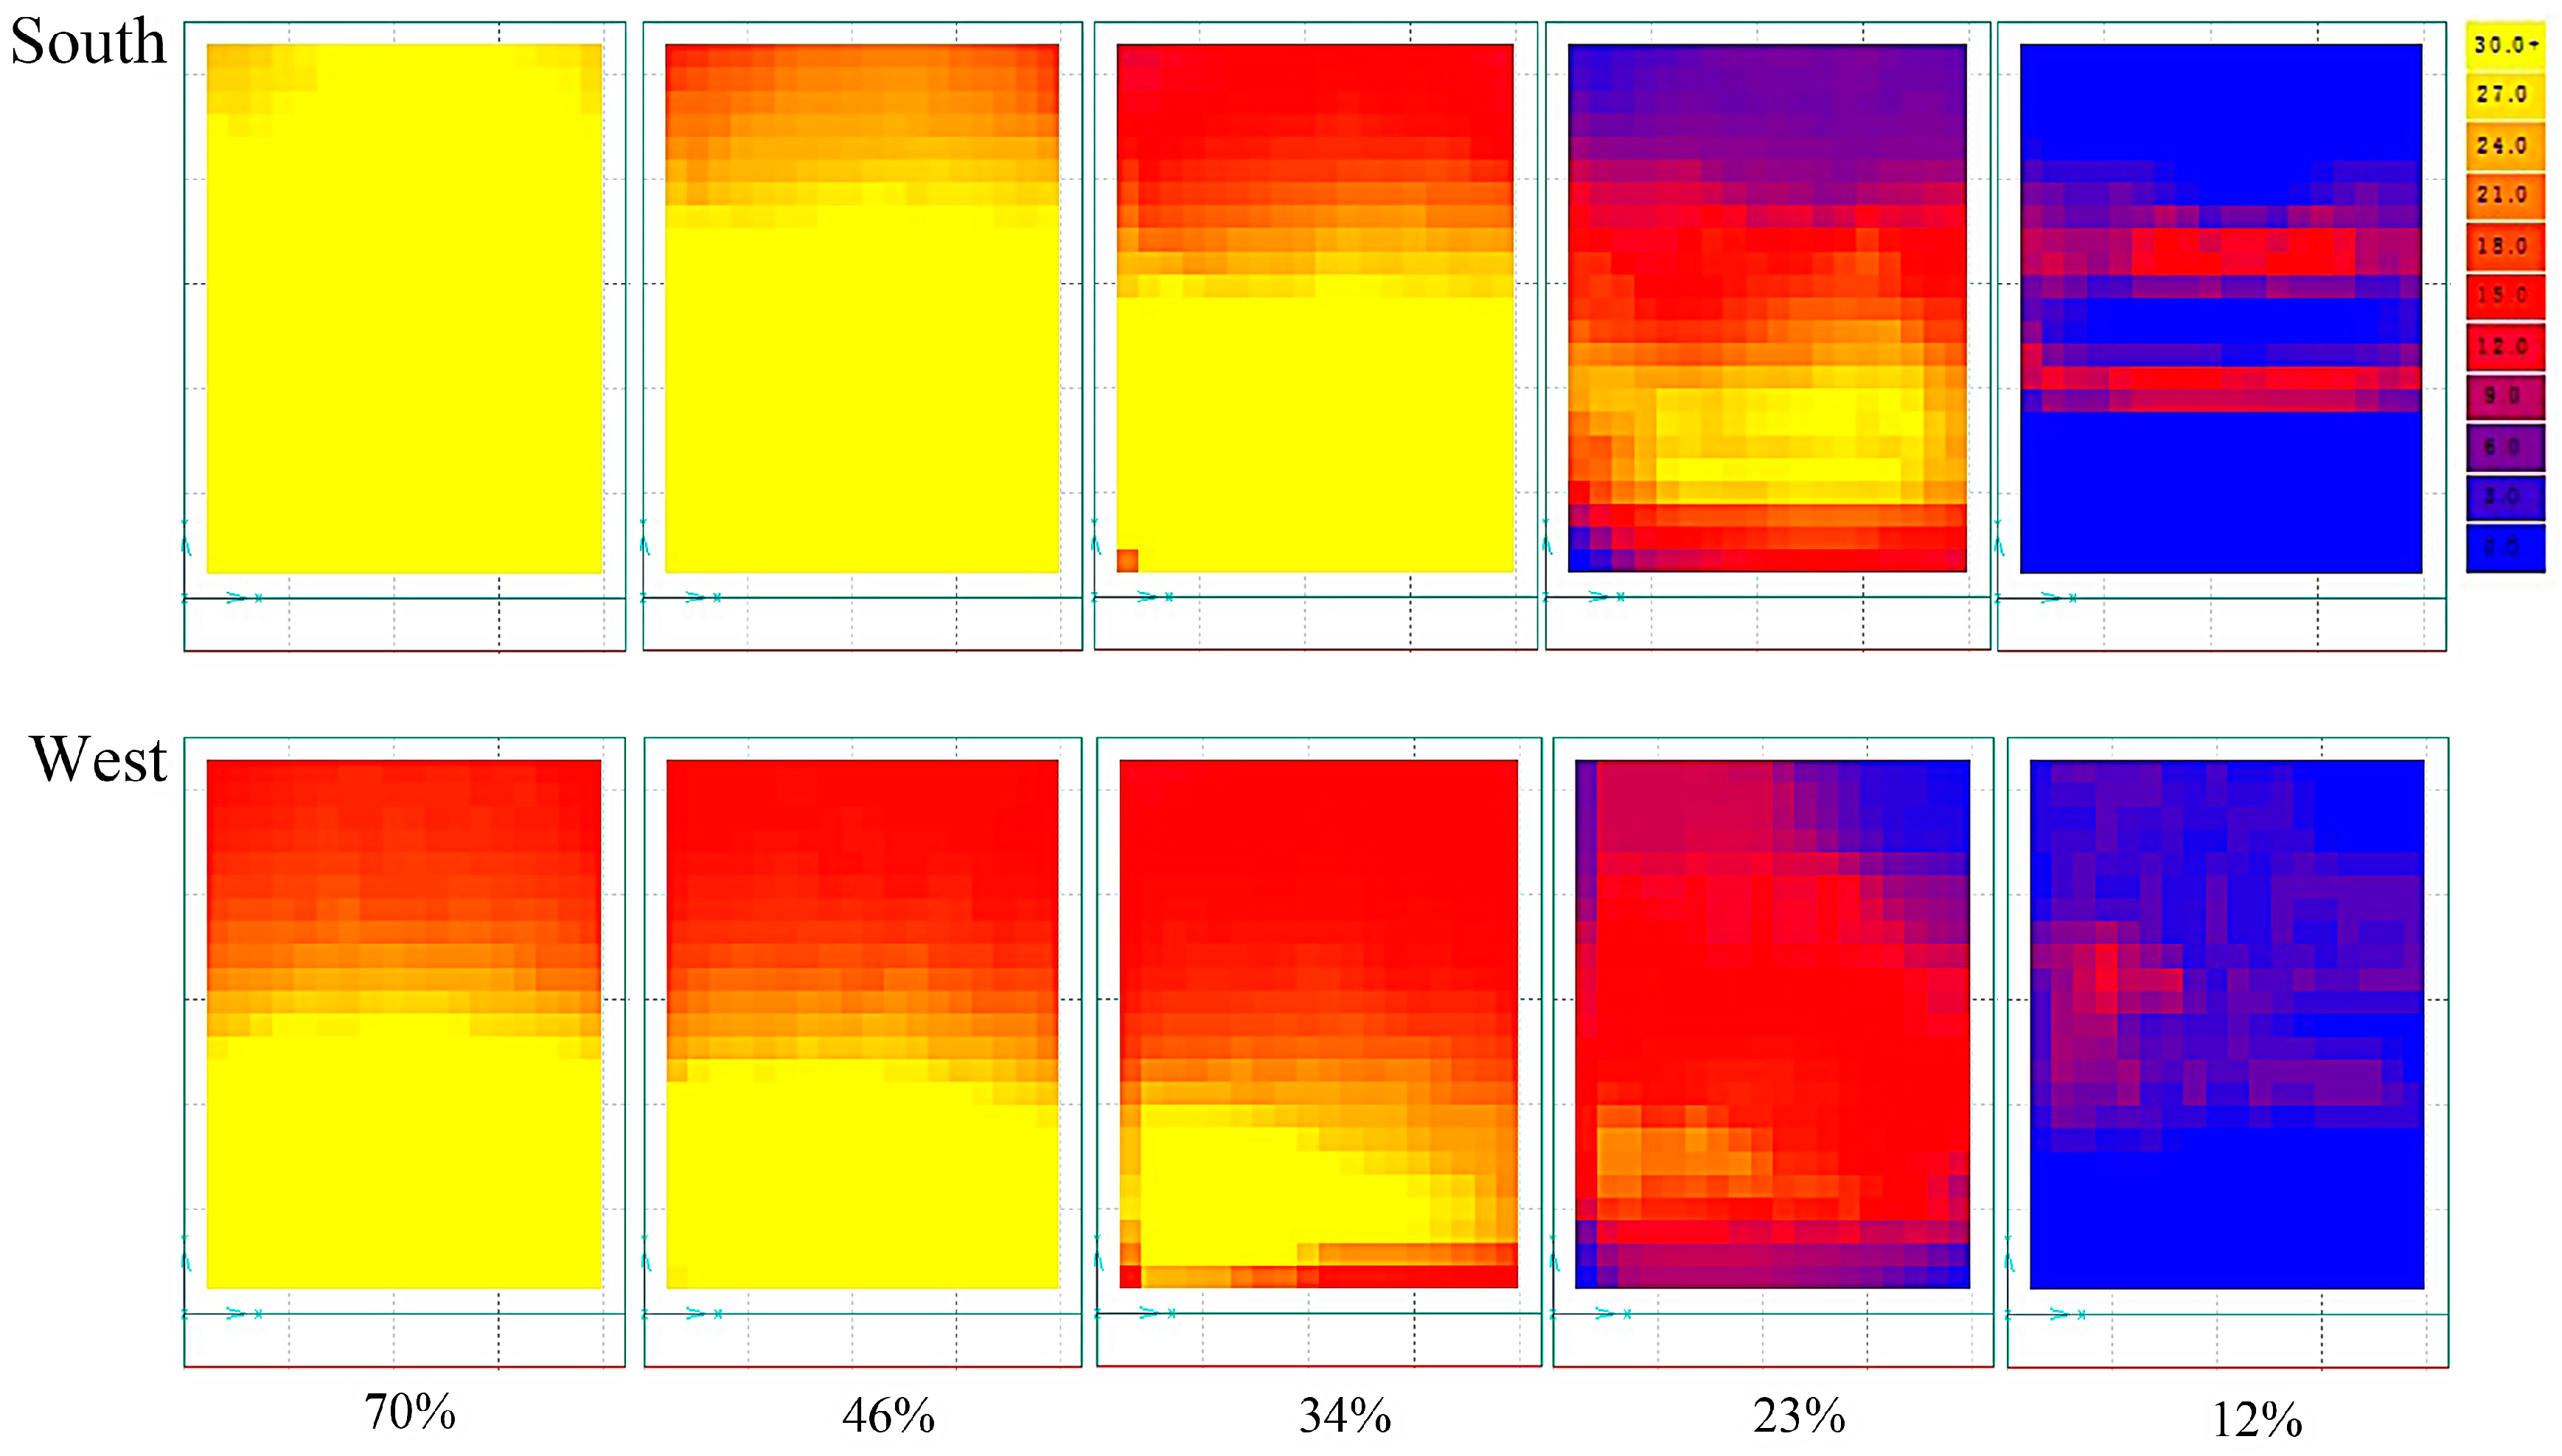
Figure 11.
Radiance rendered views for a PP of 23% in the south- and the west-facing orientations at 12:00 p.m. 21 December (standard meteorological year).
Figure 11.
Radiance rendered views for a PP of 23% in the south- and the west-facing orientations at 12:00 p.m. 21 December (standard meteorological year).

Figure 12.
Winter energy performance of different perforated percentages in Group 3.
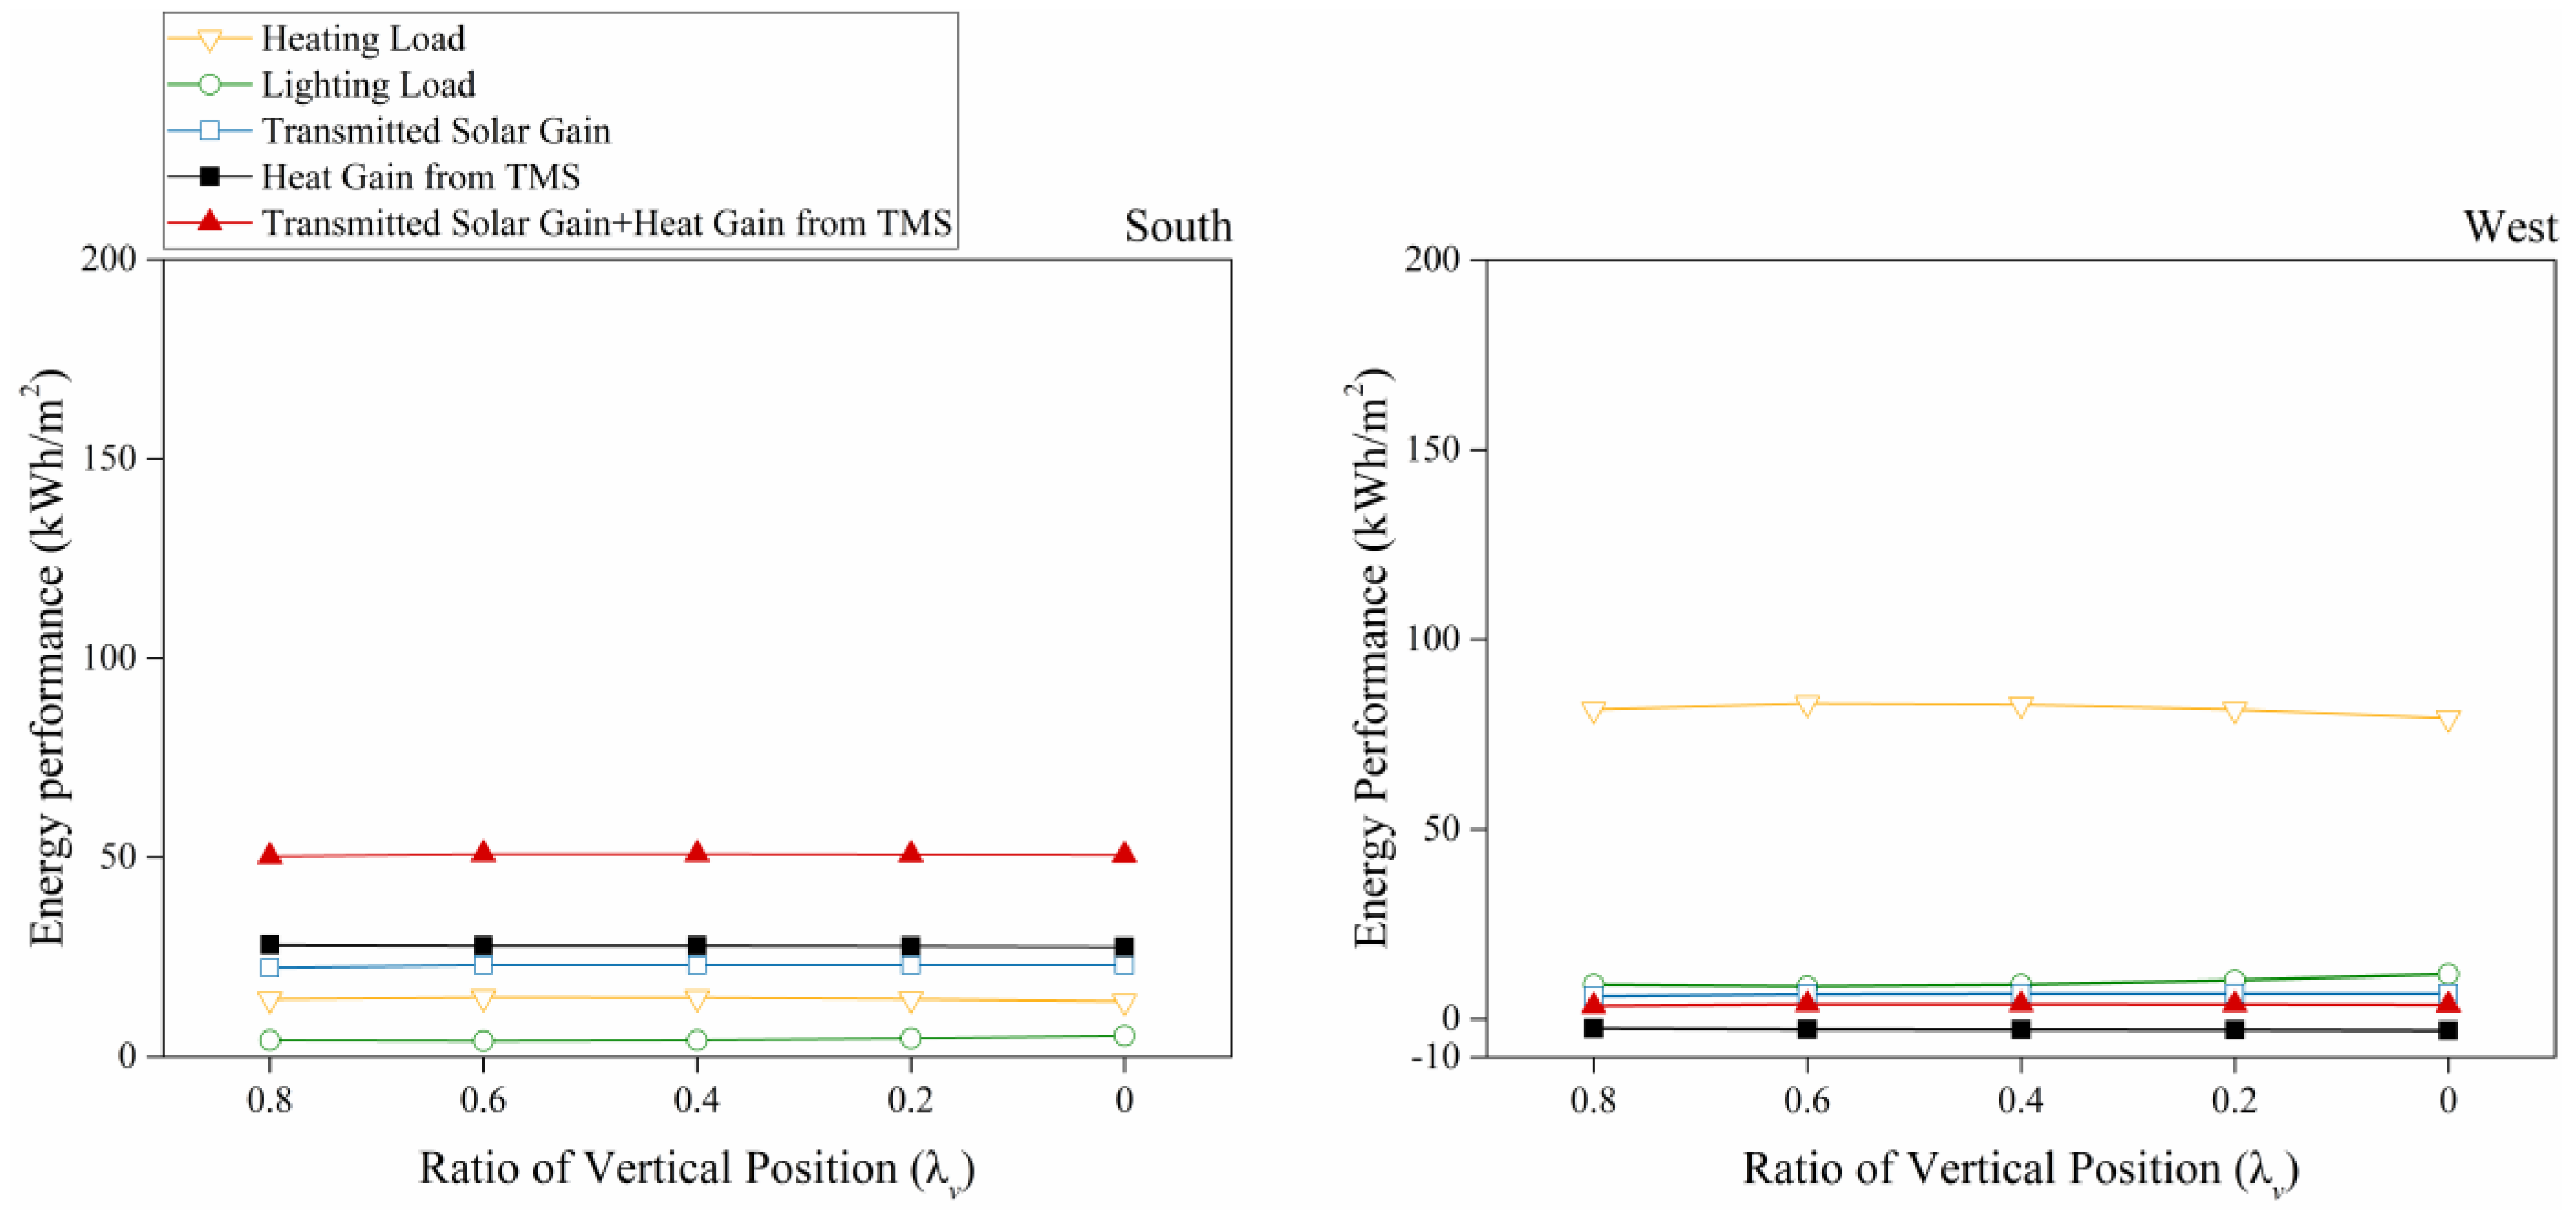
Figure 13.
Winter energy performance of different perforated percentages in Group 4.
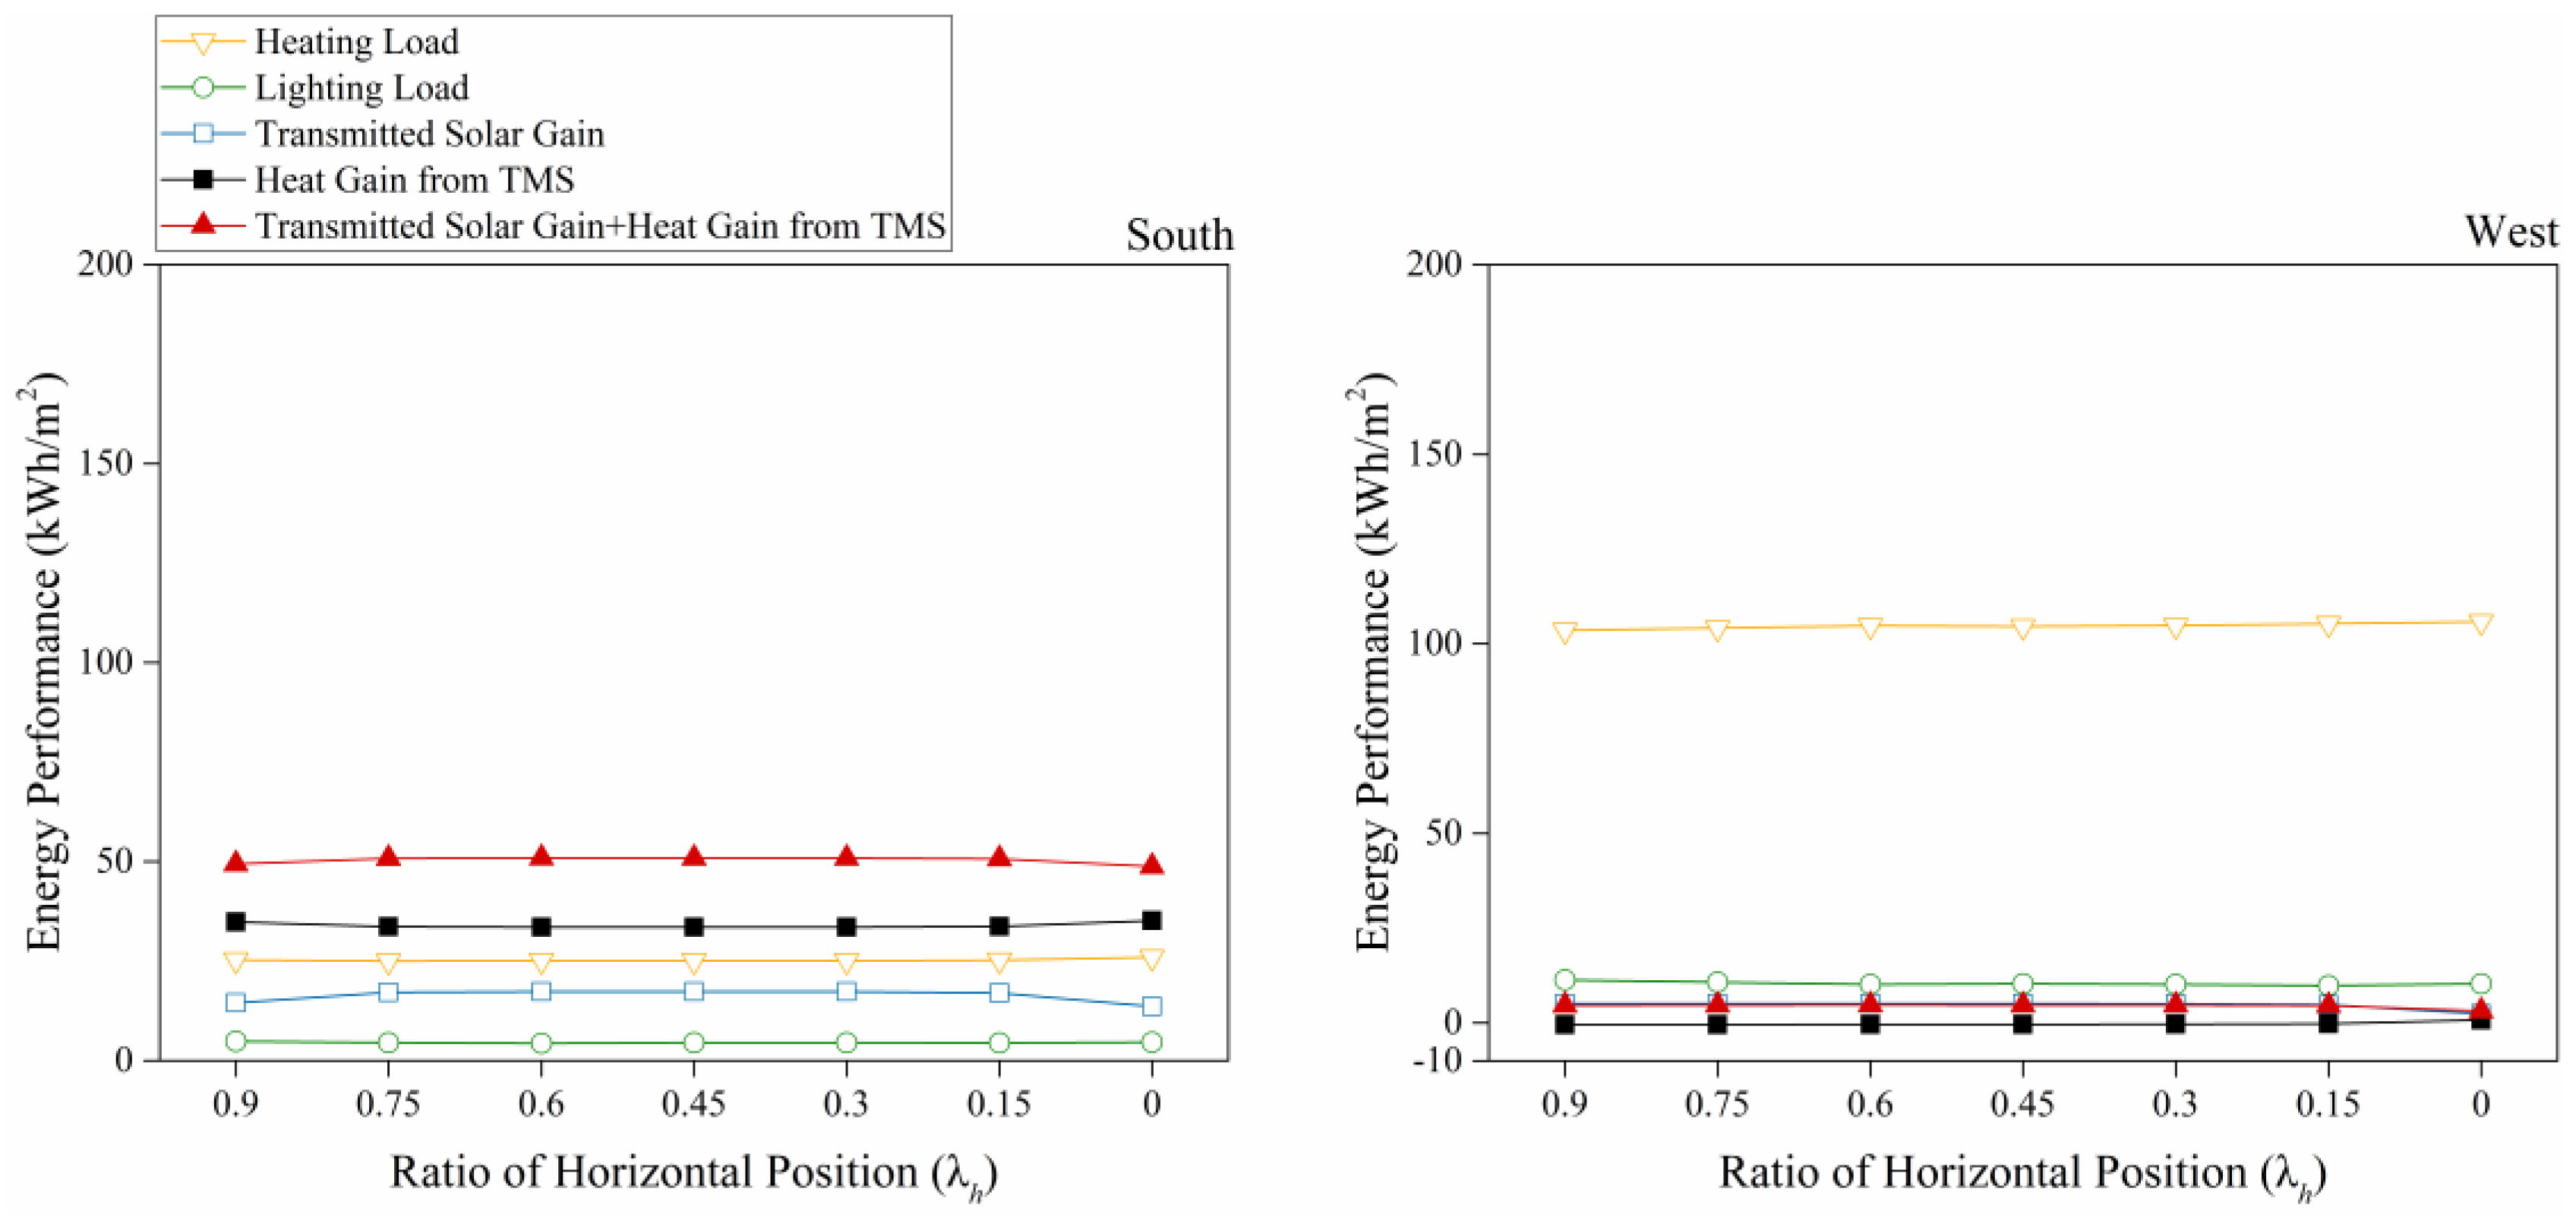
Figure 14.
Distribution of over-day lit area in Group 3.
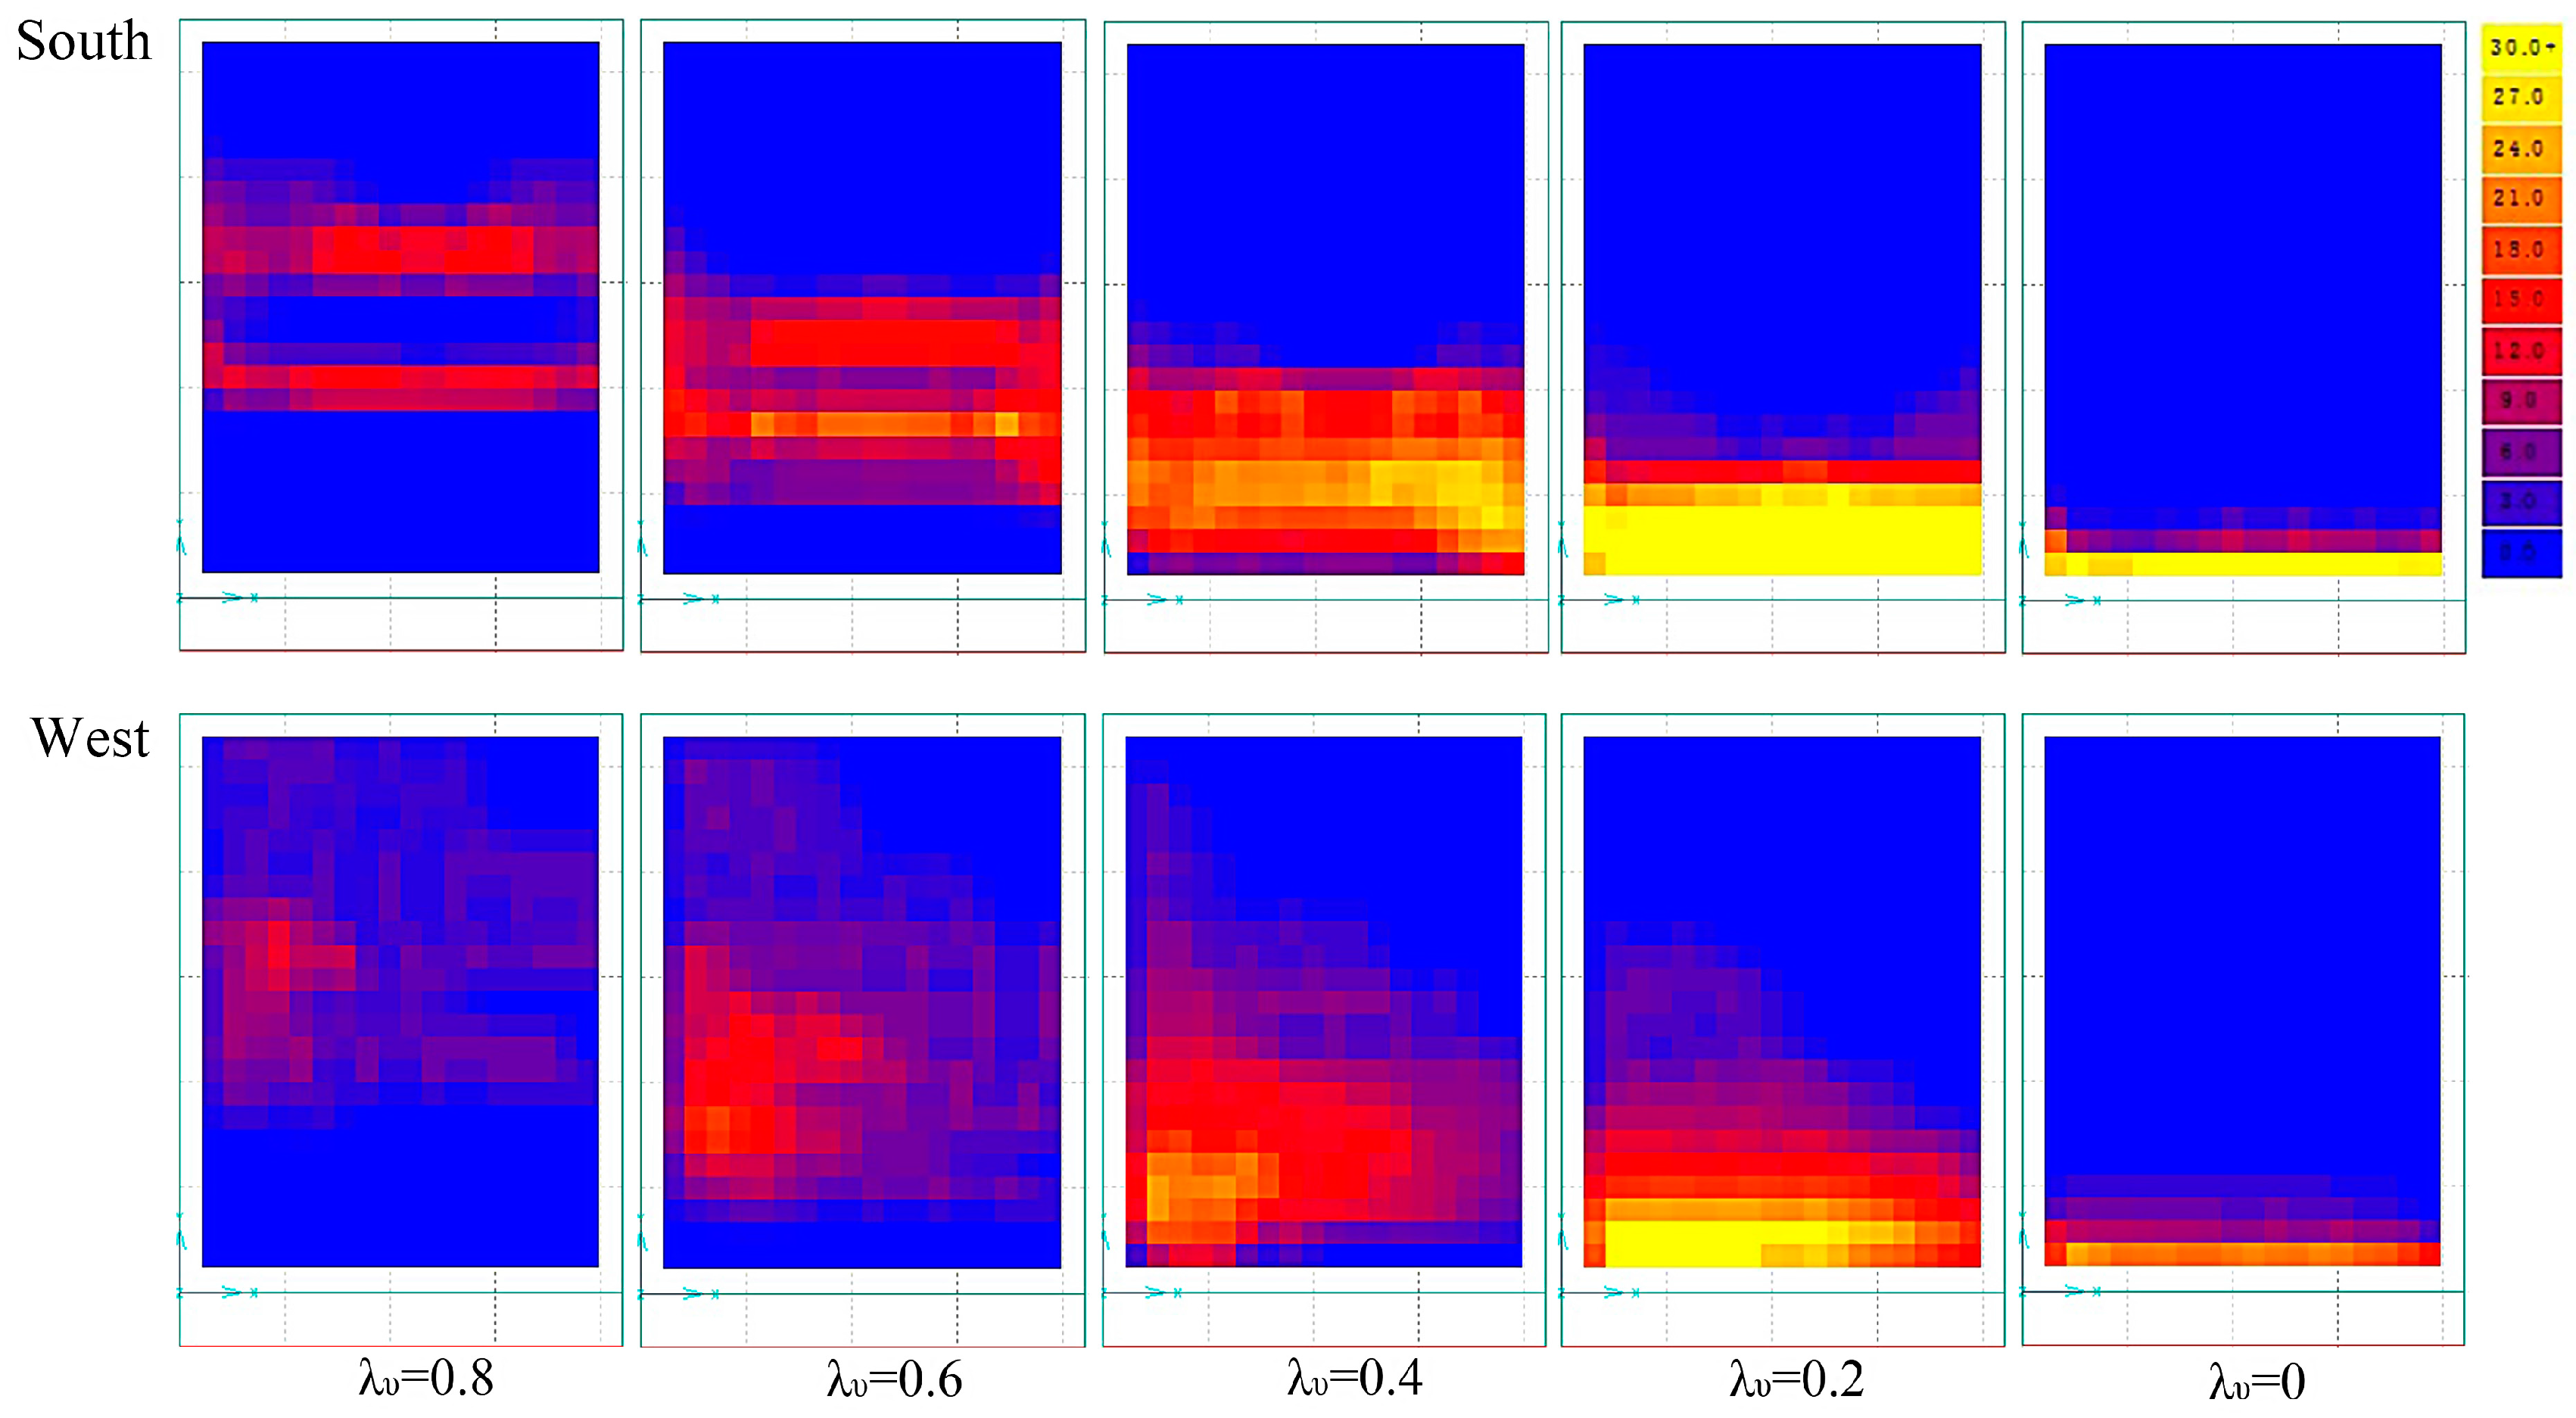
Figure 15.
Shading and daylighting performance for the tested cases in Group 3.
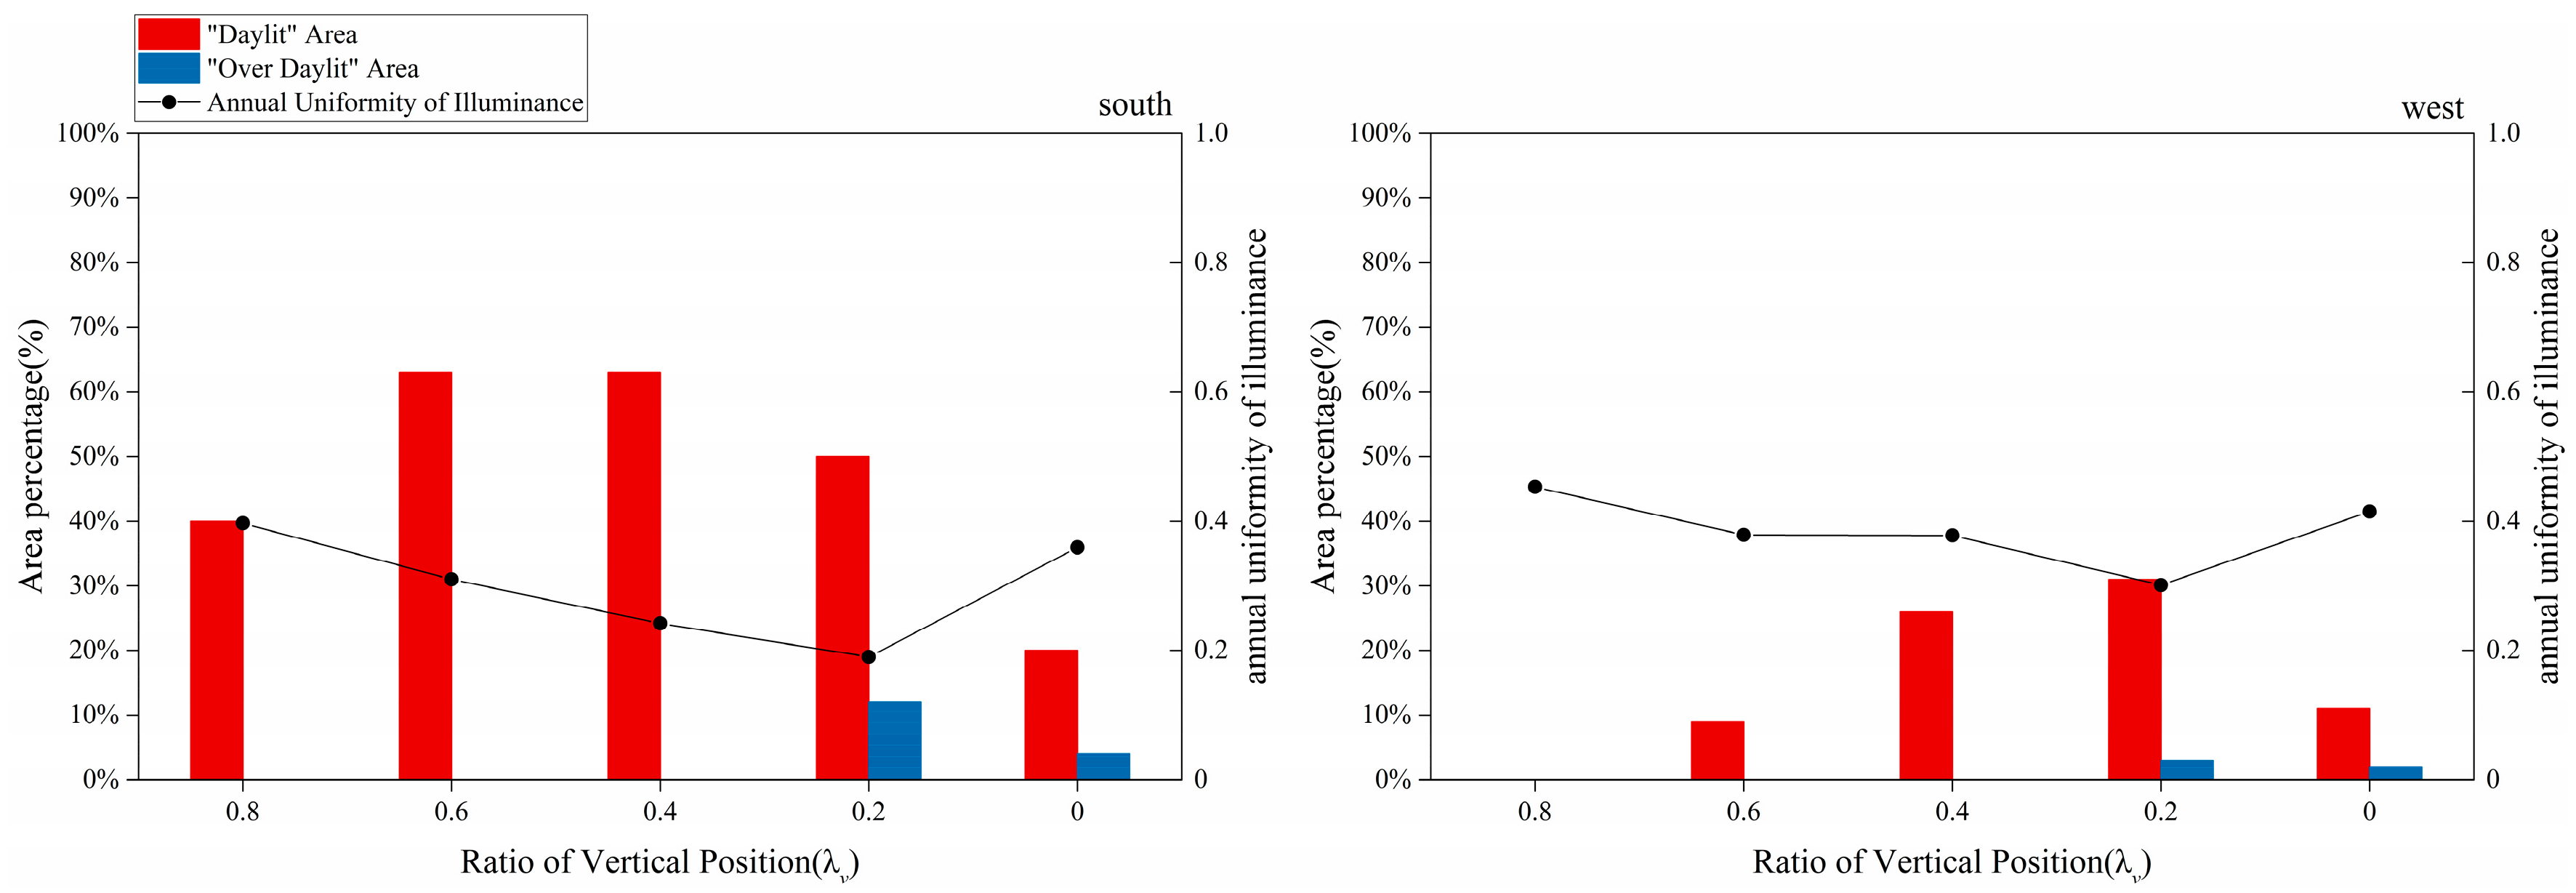
Figure 16.
Radiance rendered views for λv = 0.6 in the south- and west-facing orientations at 12:00 p.m. 21 December (standard meteorological year).
Figure 16.
Radiance rendered views for λv = 0.6 in the south- and west-facing orientations at 12:00 p.m. 21 December (standard meteorological year).

Figure 17.
Distribution of over-day lit area in Group 3.

Figure 18.
Shading and daylighting performance for the tested cases in Group 4.
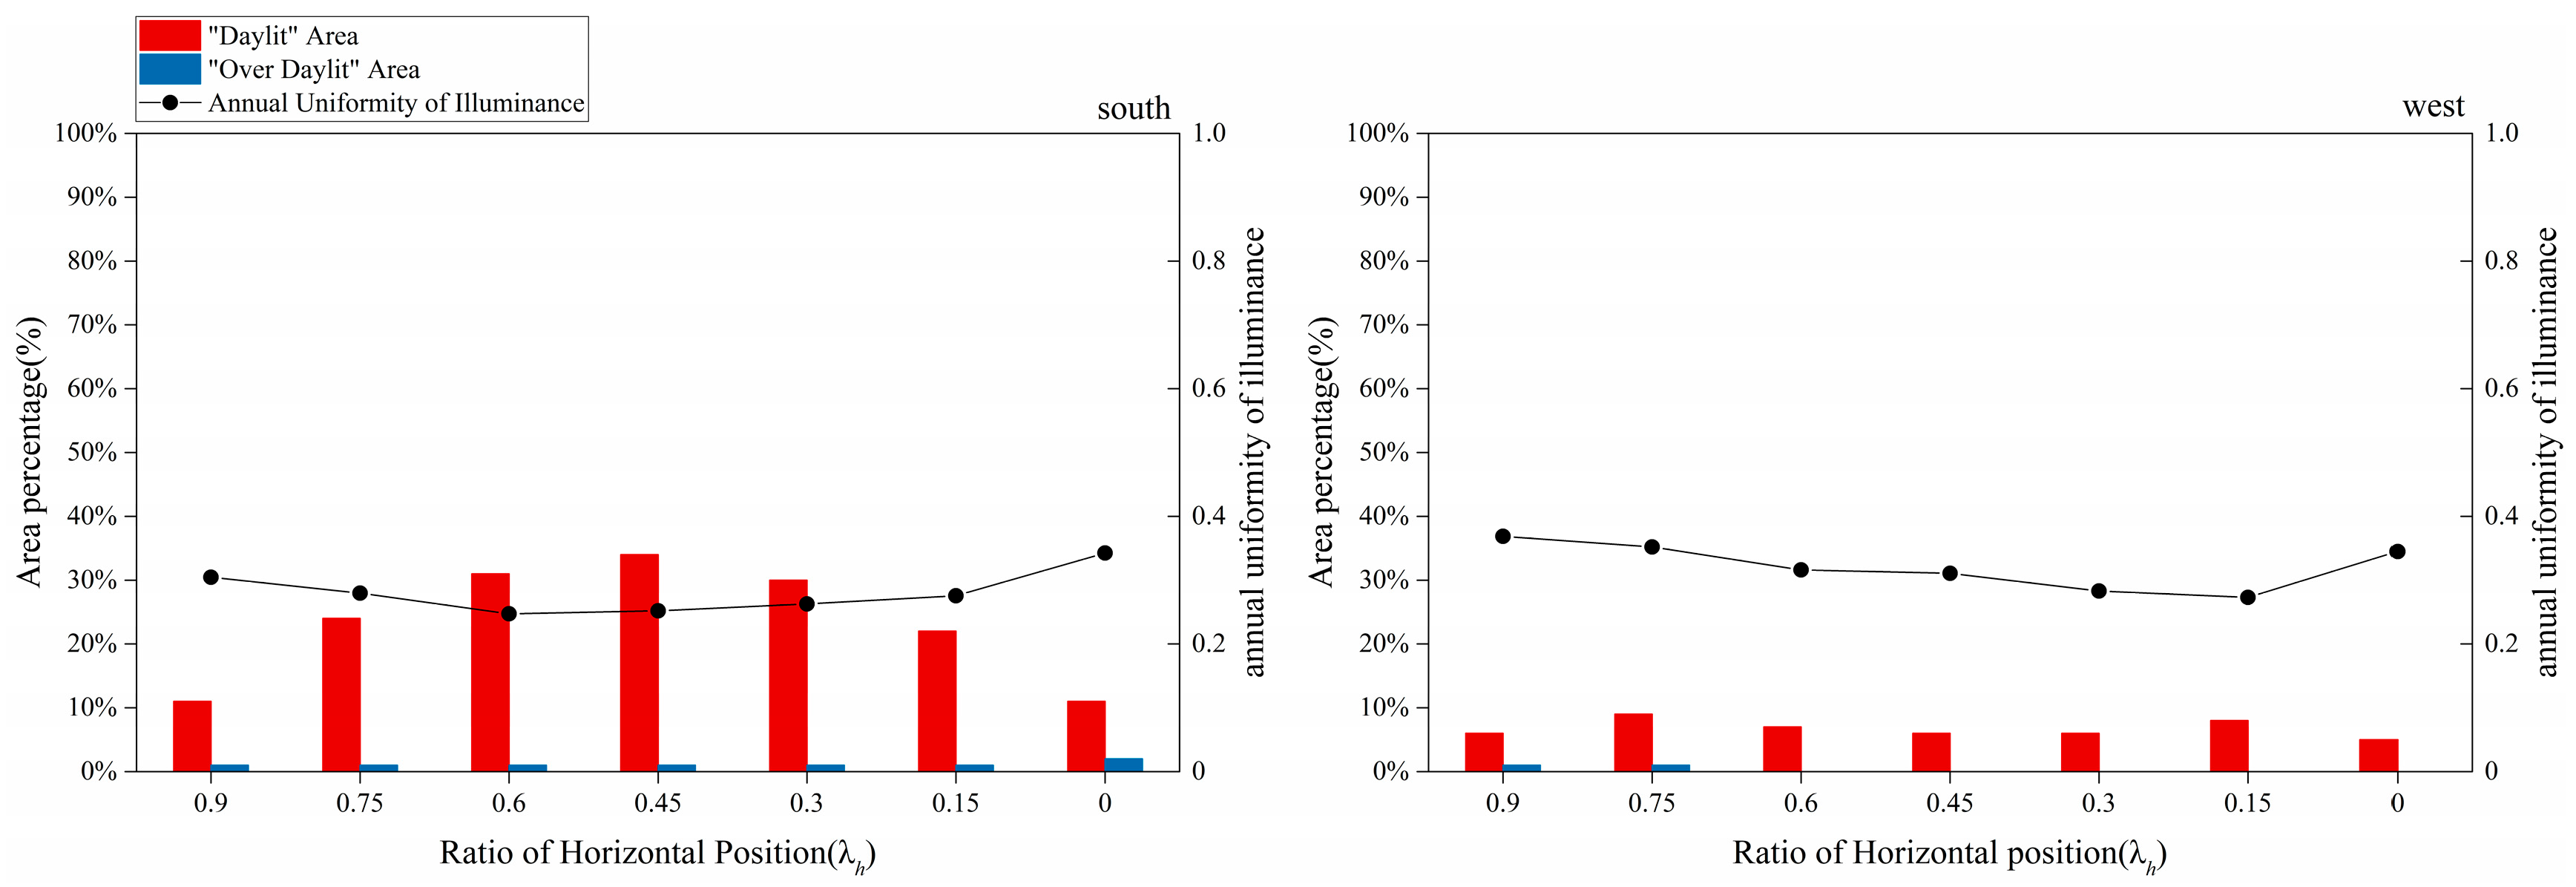
Figure 19.
Radiance rendered views for λh = 0.45 in the south- and west-facing orientations at 12:00 p.m. 21 December (standard meteorological year).
Figure 19.
Radiance rendered views for λh = 0.45 in the south- and west-facing orientations at 12:00 p.m. 21 December (standard meteorological year).


Table 1.
Variations in the configuration of perforated mass shading.
| Group 1—PP Changes with a Fixed Number of Openings |
 |
| Group 2—PP Changes with a Decreased Number of Openings |
 |
| Group 3—Changes in Vertical Position with a Constant PP of 14% |
 |
| Group 4—Changes in Horizontal Position with a Constant PP of 10% |
 |
Table 2.
Main parameter inputs of the simulation model.
| Components | Material | Properties |
|---|---|---|
| Exterior wall | Brickwork, XPS extruded polystyrene, concrete block, gypsum plastering | U-value: 0.35 W/(m2·K) |
| Reflectivity: 0.753 | ||
| Floor | Concrete slab | U-value: Set as adiabatic |
| Reflectivity: 0.592 | ||
| Ceiling | Suspended plaster insulation | U-value: Set as adiabatic |
| Reflectivity: 0.702 | ||
| Glazing | Single; clear (6 mm) | U-value: 5.78 W/(m2·K) |
| Total solar transmission: 0.819 | ||
| Direct solar transmission: 0.775 | ||
| Light transmission: 0.881 | ||
| Partition | Concrete block plaster | U-value: Set as adiabatic |
| Reflectivity: 0.753 | ||
| Perforated Thermal Mass | Black cast concrete (dense) | U-value: 2.11 W/(m2·K) |
| Reflectivity: 0.753 |
Table 3.
Typical errors of verification.
| Evaluating Indicators | Average Error (kWh/m2) | Maximum Error (kWh/m2) |
|---|---|---|
| Annual Lighting Load | 0.89 | 1.79 |
| Annual Heating Load | 2.2 | 3.3 |
| Annual Cooling Load | 1.9 | 2.79 |
| Annual Transmitted Solar Gain | 1.8 | 2.8 |
Table 4.
Alternatives with the best combined performance in the 4 Groups.
| Evaluating Indicators | Group 1 | Group 2 | Group 3 | Group 4 |
|---|---|---|---|---|
| PP 20% | PP 23% | λv 0.6 | λh 0.45 | |
| Heating Load | 41.1% | 53.2% | 78.1% | 63.0% |
| “Day Lit” Area | 76% | 100% | 63% | 34% |
| “Over-day Lit” Area | 4% | 3% | 0% | 1% |
© 2017 by the authors. Licensee MDPI, Basel, Switzerland. This article is an open access article distributed under the terms and conditions of the Creative Commons Attribution (CC BY) license (http://creativecommons.org/licenses/by/4.0/).
Share and Cite
MDPI and ACS Style
Huang, L.; Zhao, S. Perforated Thermal Mass Shading: An Approach to Winter Solar Shading and Energy, Shading and Daylighting Performance. Energies 2017, 10, 1955. https://doi.org/10.3390/en10121955
AMA Style
Huang L, Zhao S. Perforated Thermal Mass Shading: An Approach to Winter Solar Shading and Energy, Shading and Daylighting Performance. Energies. 2017; 10(12):1955. https://doi.org/10.3390/en10121955
Chicago/Turabian StyleHuang, Lingjiang, and Shuangping Zhao. 2017. "Perforated Thermal Mass Shading: An Approach to Winter Solar Shading and Energy, Shading and Daylighting Performance" Energies 10, no. 12: 1955. https://doi.org/10.3390/en10121955
Note that from the first issue of 2016, this journal uses article numbers instead of page numbers. See further details here.