A Novel Electricity Transaction Mode of Microgrids Based on Blockchain and Continuous Double Auction


1
State Key Laboratory of Power Transmission Equipment & System Security and New Technology, Chongqing University, Chongqing 400044, China
2
School of Electrical and Electronic Engineering, Nanyang Technological University, Singapore 639798, Singapore
*
Author to whom correspondence should be addressed.
Energies 2017, 10(12), 1971; https://doi.org/10.3390/en10121971
Submission received: 8 October 2017
/
Revised: 14 November 2017
/
Accepted: 17 November 2017
/
Published: 26 November 2017
Abstract
:The installed capacity of distributed generation (DG) based on renewable energy sources has increased continuously in power systems, and its market-oriented transaction is imperative. However, traditional transaction management based on centralized organizations has many disadvantages, such as high operation cost, low transparency, and potential risk of transaction data modification. Therefore, a decentralized electricity transaction mode for microgrids is proposed in this study based on blockchain and continuous double auction (CDA) mechanism. A buyer and seller initially complete the transaction matching in the CDA market. In view of the frequent price fluctuation in the CDA market, an adaptive aggressiveness strategy is used to adjust the quotation timely according to market changes. DG and consumer exchange digital certificate of power and expenditure on the blockchain system and the interests of consumers are then guaranteed by multi-signature when DG cannot generate power due to failure or other reasons. The digital certification of electricity assets is replaced by the sequence number with specific tags in the transaction script, and the size of digital certification can be adjusted according to transaction energy quantity. Finally, the feasibility of market mechanism through specific microgrid case and settlement process is also provided.
1. Introduction
Centralized coal power or natural gas power generation have been the leading power supply modes for a long time. The massive use of fossil fuels not only causes numerous environmental problems, but also accelerates the exhaustion of fossil fuel resources [1]. Renewable energy sources, such as wind power, photovoltaic power, and hydropower, provide several possible solutions to environmental energy challenges [2]. The World Energy Council predicted that the power generation capacity from renewable energy sources would account for nearly 60% by 2060 [3]. Compared with traditional centralized power generation, renewable energy generations, which can produce electricity in small scale, are located on the load side and are connected to the grid in a distributed form [4]. Considering the change of generation structure, the electricity market will have to accommodate a large number of small-scale renewable energy suppliers. However, consumers can only trade with renewable energy source suppliers indirectly through their retailers in the existing electricity market [5,6]. Microgrids, which are defined as a small power distribution systems consisting of loads, distributed generations (DGs), and energy storage devices, are considered an efficient way to utilize renewable energy sources [4]. The direct transaction between DGs and consumers in microgrids rather than involving the retailer as the intermediate agency can increase benefits to both parties, and it is conducive for the development of renewable energy sources [7]. The key question of microgrid transactions is the safe, low cost, and transparent design of the information symmetry trade mode [8]. Traditional transaction management based on centralized organization in microgrids will experience the following problems: (1) the operation and regulatory costs of the transaction center are high, and these costs will be directly transferred to DG suppliers; (2) trust issue exists between the transaction center and traders, and the transaction center experiences difficulty in ensuring fairness, transparency, and effectiveness of information; and (3) information security risks exist in the centralized trading mode, which threaten transaction security and interests of traders [8,9,10]. Therefore, new technologies should be developed for microgrid electricity transactions.
Meanwhile, the blockchain technology realizes peer-to-peer (P2P) transactions with the assistance of asymmetric encryption, digital signature, consensus mechanism, and other mechanisms [11]. Blockchain is a type of non-tampering and non-forgery decentralized shared ledger, which combines data blocks in a time sequence in a chain manner into a specific data structure and is guaranteed by cryptography. The blockchain-based transaction mode eliminates additional regulatory costs from transaction institutions, and the distributed storage of data can reduce the cost of the purchase server, as well as ensure data security [12]. Goldman Sachs mentioned in Blockchain: Putting Theory into Practice that blockchains will play an important role in the credit system of the sharing economy, real estate transactions, securities transactions, anti-money laundering monitoring, and distributed electricity trade [13]. Blockchain provides a feasible means for direct electricity transactions in microgrids. Currently, research and applications of blockchain technology in energy sources are still in the early stage; nevertheless, several preliminary results have been achieved. In [14], a machine-to-machine electricity trading market was proposed based on blockchain technology. This trading market mainly emphasizes on investigating the communication technology between producers and consumers. In [15], the distributed energy source transaction pattern based on multiple signatures and blockchain was discussed. However, this pattern only considers electricity as one general commodity and formulates neither strict market mechanism and flexible pricing schemes nor compensation system for default. LO3 Energy (New York, NY, USA) and Siemens (Munich, Germany) cooperated and developed the TransActive Grid microgrid transaction platform based on blockchain [8]. This platform provides settlement services of photovoltaic electricity transactions between consumers in Brooklyn and designs a market mechanism with double auction. However, the platform has no appropriate bidding strategic model for transaction parties and direct settlement based on blockchain.
Blockchain technology realizes the information and value transfer between DGs and users, and a complete electricity market also requires an appropriate market mechanism. Market mechanism provides an efficient allocation of the traded energy method based on the quotes of buyers and sellers, and auction is a common method for allocating resources [16]. Auctions can be classified into two types, namely, single auction, where a single seller (buyer) accepts quotations from multiple buyers or sellers, and double auction, which allows multiple buyers and sellers to bid/ask a specified commodity [17]. The relationship between demand and supply in microgrids shows the pattern of multi-buyer and multi-seller. Thus, double auction is suitable for a microgrid market. A double auction contains two types, namely, continuous double auction (CDA), which matches buyers and sellers immediately upon the detection of compatible bids, and periodic double auction, which collects bids over a specified interval of time and then clears the market at the expiration of bidding interval [16,17,18]. Given the great uncertainty of renewable energy power generation prediction, microgrid transaction cycle should be short. Reference [18] showed that CDA mechanism can quickly allow buyers and sellers to achieve market equilibrium. In addition, CDA-based allocation mechanisms eliminate the need for a centralized control and suit the decentralized nature of microgrids. CDA utilizes the dynamics of free market to balance demand and supply effectively, and only a small amount of information is delivered to participants at relatively low computational costs [19]. Therefore, CDA is suitable for microgrid transactions.
In the CDA market, buyers and sellers are faced with a complex quotation decision process [20]. Buyers (sellers) should not only consider other buyers’ (or sellers’) quotations but also the price of the sellers (buyers); thus, the trading strategy selection under the double auction market is more complicated than the single auction. In addition, CDA market has dynamic and random characteristics considering that quotations can be adjusted in real time. Appropriate trading strategies are difficult to select in such a complicated market environment. Therefore, an agent, which is a software program, should be considered to realize adaptive quotations [21]. Agents in the CDA market can be viewed as delegates of their master to achieve a good profit. At present, zero intelligence (ZI), ZI plus (ZIP), and adaptive aggressiveness (AA) are the main trading strategies adopted by agents in computing quotations [22,23,24]. ZI randomly quotes in a given uniform distribution interval without considering market transactions, which leads to relatively low earnings of traders in the market. ZIP considers market and failed prices during quotation and adjusts the quotes accordingly. Specifically, the trading party will increase the profit margin appropriately on a previous quote after each transaction. Otherwise, the trading party will lower the profit to increase the probability of the transaction. AA strategy indicates that traders adjust quote automatically through the learning mechanism according to market price and price fluctuations. Compared with ZIP strategy, the AA strategy has more adaptive capability because it considers the past market price and its volatility. Ref. [22] compared the three strategies and revealed that the AA strategy is superior in terms of multiple indexes, such as market efficiency and trading profits.
In this study, blockchain technology and CDA mechanism are combined and applied in microgrid electricity transactions. This combination can realize safe and independent P2P transactions between DGs and consumers. In this transaction pattern, buyers and sellers can submit quotes to the CDA market according to an AA strategy and adjust quotes continuously according to transaction outcomes. After market matching, the buyers and sellers accomplish the digital proof of electricity sales and settlement of transactions by using blockchain, thereby realizing direct microgrid electricity transactions. Finally, the principle of microgrid electricity transaction and settlement are analyzed in a case study.
2. Principle of Blockchain and Unspent Transaction out (UTXO) Model
2.1. Basic Principle of Blockchain
Blockchain is composed of a string of data blocks that is generated based on cryptography theory [11]. Blockchain is essentially a distributed ledger that can efficiently record transactions between two parties in a verifiable and permanent way. The structure of blockchain is shown in Figure 1. Each block consists of a header and a body. Most functions of blockchain are realized by the block header. The block header contains the hash of the previous block. This hash is calculated from the hash function of the previous block header. Blocks are connected successively by hash, which form the blockchain. The block body records all transaction information in the previous period. Each transaction (TX) generates a hash value, and then two adjacent hash values continue to implement hash algorithm to generate a unique Merkle root. The binary tree that is obtained through the above process is called Merkle tree [25]. The block body and the block header are connected by Merkle root. Any changes in the transaction information in the block will change the Merkle root value.
Blockchain, which has a special data structure and organization form, has four main characteristics, namely, decentralization, transaction non-tampering, traceability, and transparency.
- (i)
- Decentralization: The blockchain network is a P2P network. Direct transactions without any centralized third party can be made among nodes. All nodes in the blockchain network possess equal positions and can verify data in blocks.
- (ii)
- Transaction non-tampering: In the blockchain system, single or multiple node database modification does not affect the database of other nodes, unless the entire network of more than 51% of node changes can be controlled at the same time, which is practically impossible.
- (iii)
- Traceability: As mentioned above, each transaction in the blockchain is connected by a cryptographic method with two adjacent blocks; thus, any transaction is traceable.
- (iv)
- Transparency: The entire blockchain operation rules of the system is open and transparent; thus, the blockchain records information on multiple node redundancy backup and updates information with multiple node mutual authentication. A node cannot deceive other nodes.
The characteristics of blockchain decentralization are related to the distributed form of microsource and load in a microgrid. P2P transactions in the blockchain adopt to the demand of microgrid direct transaction. The non-tampering, traceability, and transparency characteristics can further guarantee the safety and reliability of microgrid transactions.
2.2. UTXO Model
Transaction is the core content of the blockchain. Traditional online transaction is realized through third parties, such as banks and Alipay [26]. However, transactions in the blockchain are based on the UTXO model [11]. Each transaction has an input and output. The input stipulates that the source of transaction objects must be the output of a transaction that is not used in previous transactions, and the output should transfer transaction objects to a new address. The UTXO model enables the nodes in the blockchain to trace the object source of any transaction and determine whether the spending party has the right to spend it.
Transaction script is the work control language that is operated in the blockchain system. According to the objects of payment, transcription script can be classified into pay-to-public-key-hash (P2PKH) script and pay-to-script-hash (P2SH) script [11,27]. P2PKH script is a common transaction script. Currently, most transactions in the bitcoin network are conducted in P2PKH script [11]. During the transaction, the sender locks his own UTXO using the output script on the address of the receiver while the receiver unlocks it using the input script. This transaction is approved by all nodes considering that the receiver proves that he is the owner of the address. The input script (scriptSig) and output script (scriptPubKey) of P2PKH are as follows:
where <sig> is the signature, and <pubKey> is the public key.
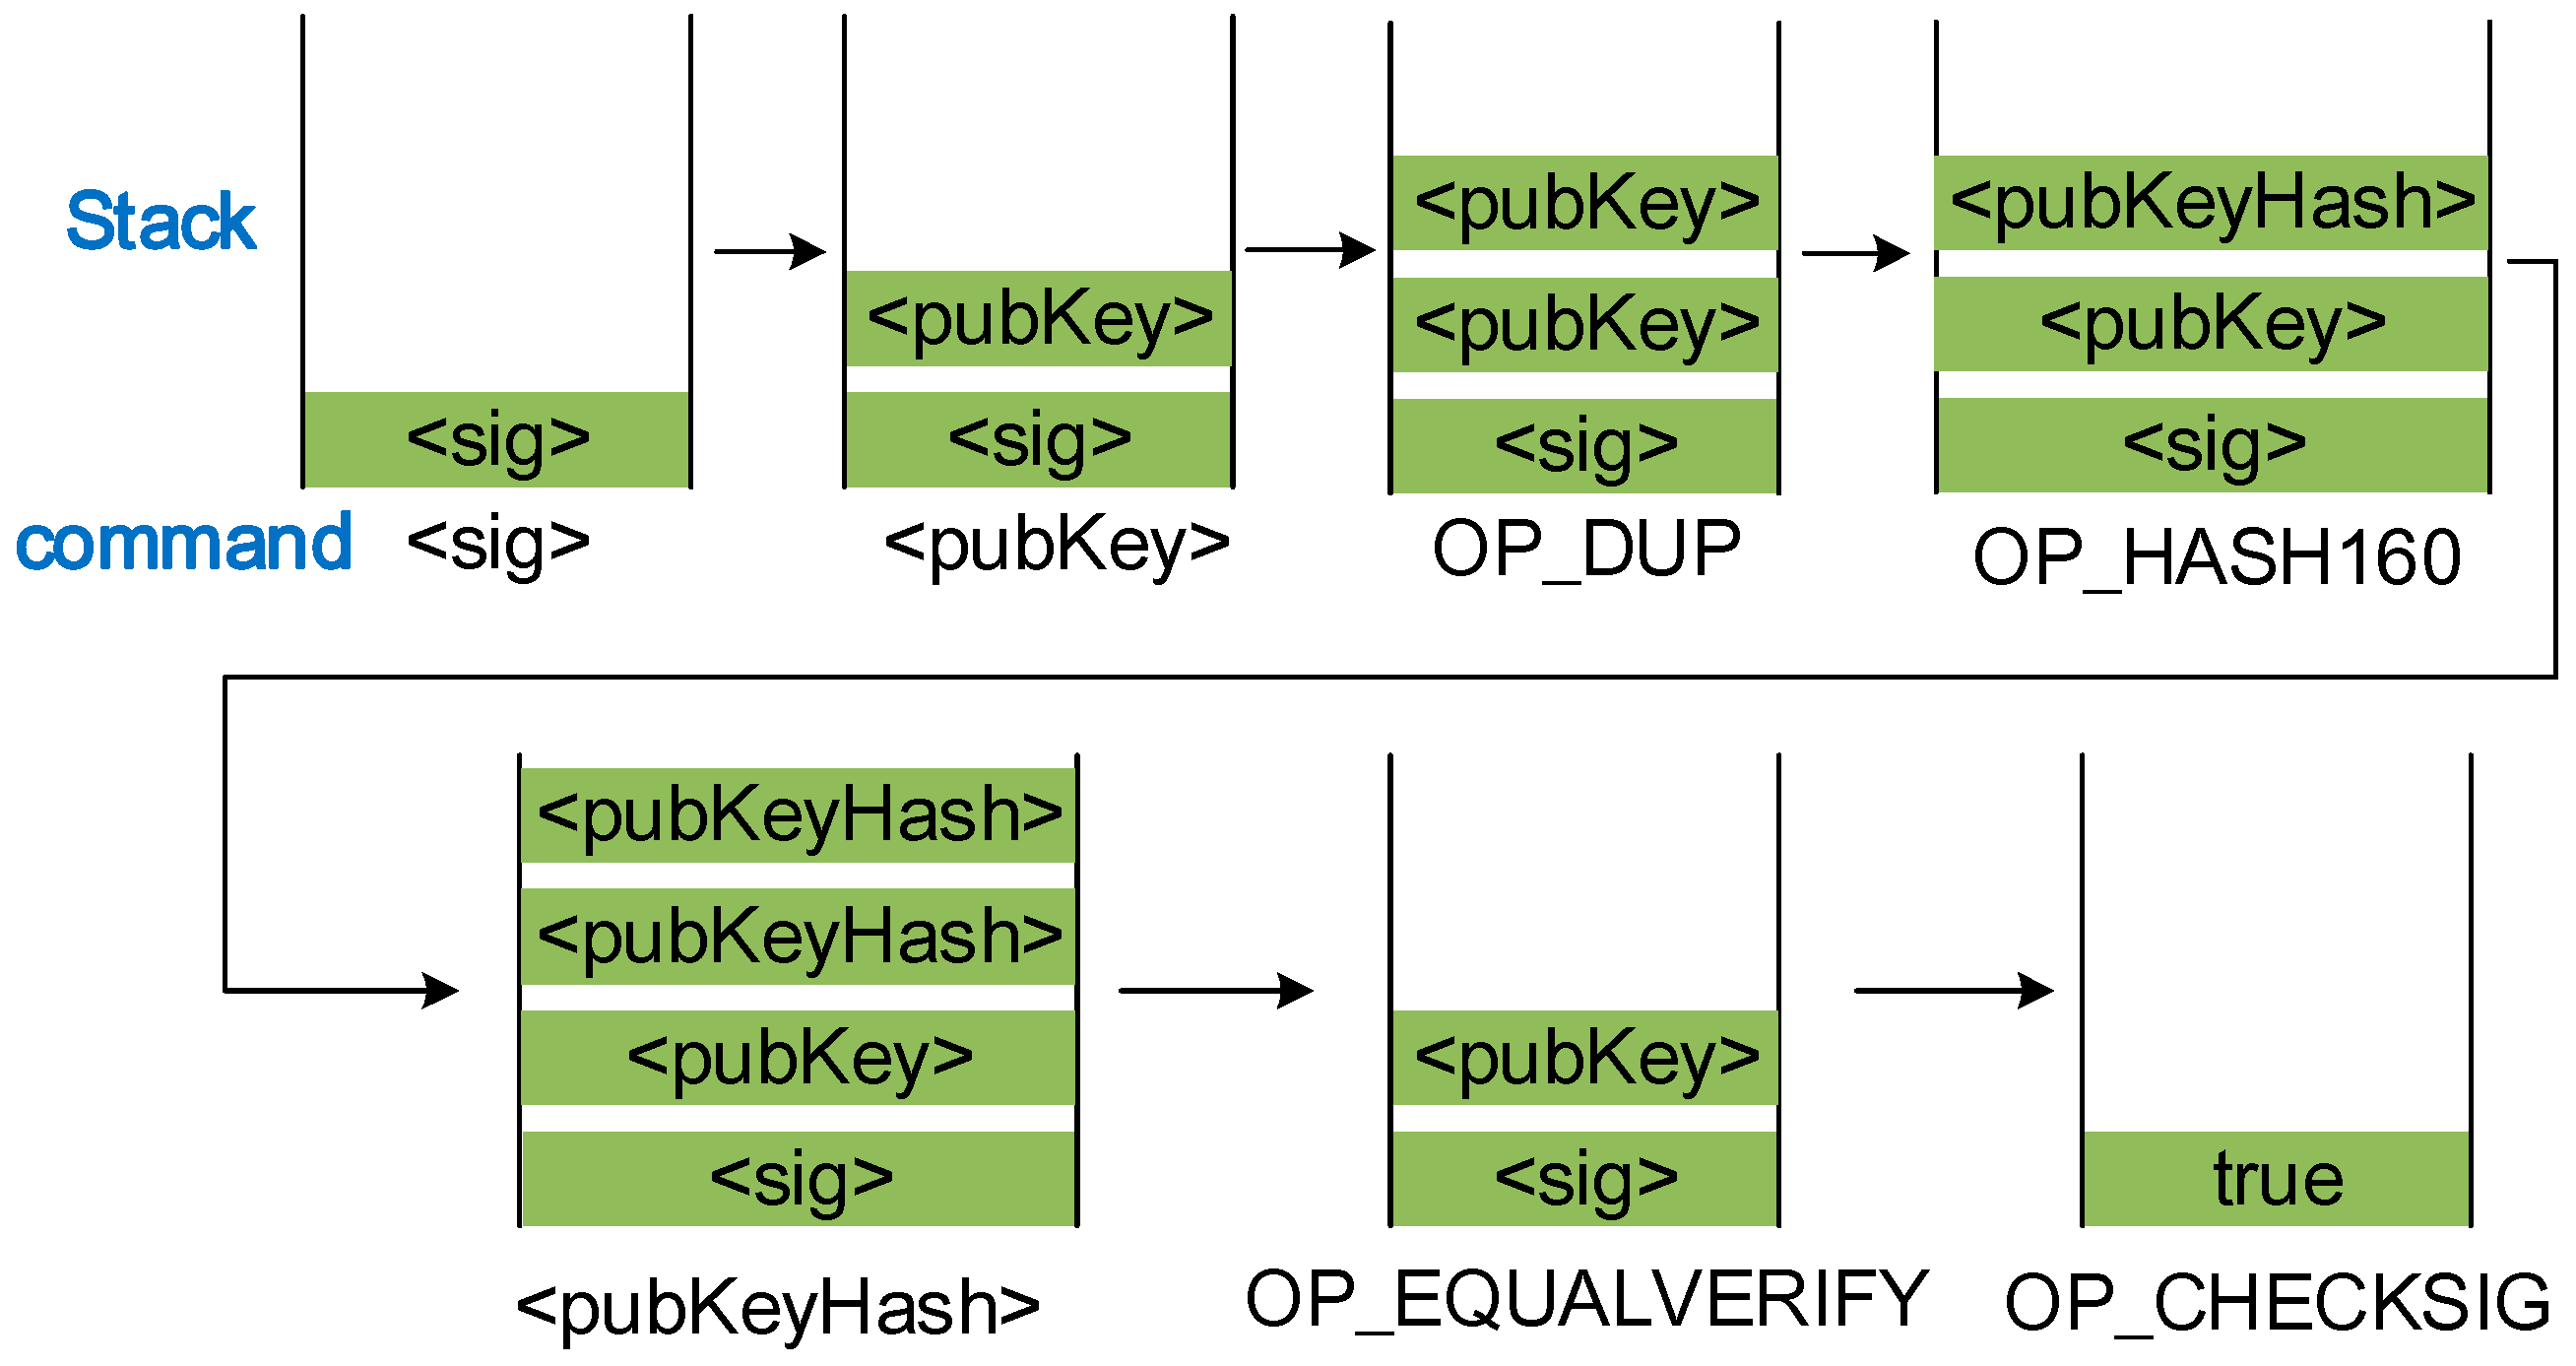
Script execution in the blockchain is based on stack language. It is calculated by data and work code commands. The data command pushes data onto the top of stack, whereas the work code command generally uses the data at the top stack as the input value to calculate one function. In this script, the input script command and <pubKeyHash> command in the output script are data commands, whereas the rest of the output script commands pertain to work code commands. The script execution process is shown in Figure 2.
- (1)
- Store data commands <sig> and <pubKey> in stack while the duplicate command OP_DUP copies the public key in the top stack and places it in the top stack.
- (2)
- The command OP_HASH160 collects the data at the top stack. Perform hash calculations twice. After this command is executed, the public key in the top stack becomes the hash of the public key. The calculation formula is:where SHA256 and RIPEND160 are 256-bit and 160-bit hash functions, respectively, which are converted from data.
- (3)
- Execute the <pubKeyHash> command and place it on the top stack.
- (4)
- Execute the command OP_EQUALVERIFY. If the public key hash in the output script of the sender is equal to that in the input script of the receiver, remove two data on the top stack and execute the next command. Otherwise, return to the failure signal and stop the execution.
- (5)
- Verify the rest of the public and private keys in the stack by using OP_CHECKSIG. This command proves that this public key is matched with the private key of the receiver, and the receiver gains the ownership of the asset.
P2SH allows the sender to deliver the transaction to one script hash [27]. In transactions with multiple signatures, the sender does not need to input multiple public keys. The structure of P2SH script is expressed as follows:
where redeemScript is a redeem script. The receiver gains the right to use the asset through redeemScript. redeemScriptHash is the hash of the redeem script, which is calculated using the similar method in Equation (2).
When multiple signatures are used, the redeemScript is:
This multi-signature script implies that at least m digital signatures exist in n public keys to close the transaction successfully. P2SH script simplifies the payment of the sender. The receiver should inform the payer with only one hash. Moreover, the output script of P2SH is extremely small, which is beneficial for nodes in the blockchain to trace the UTOX script.
3. CDA Mechanism
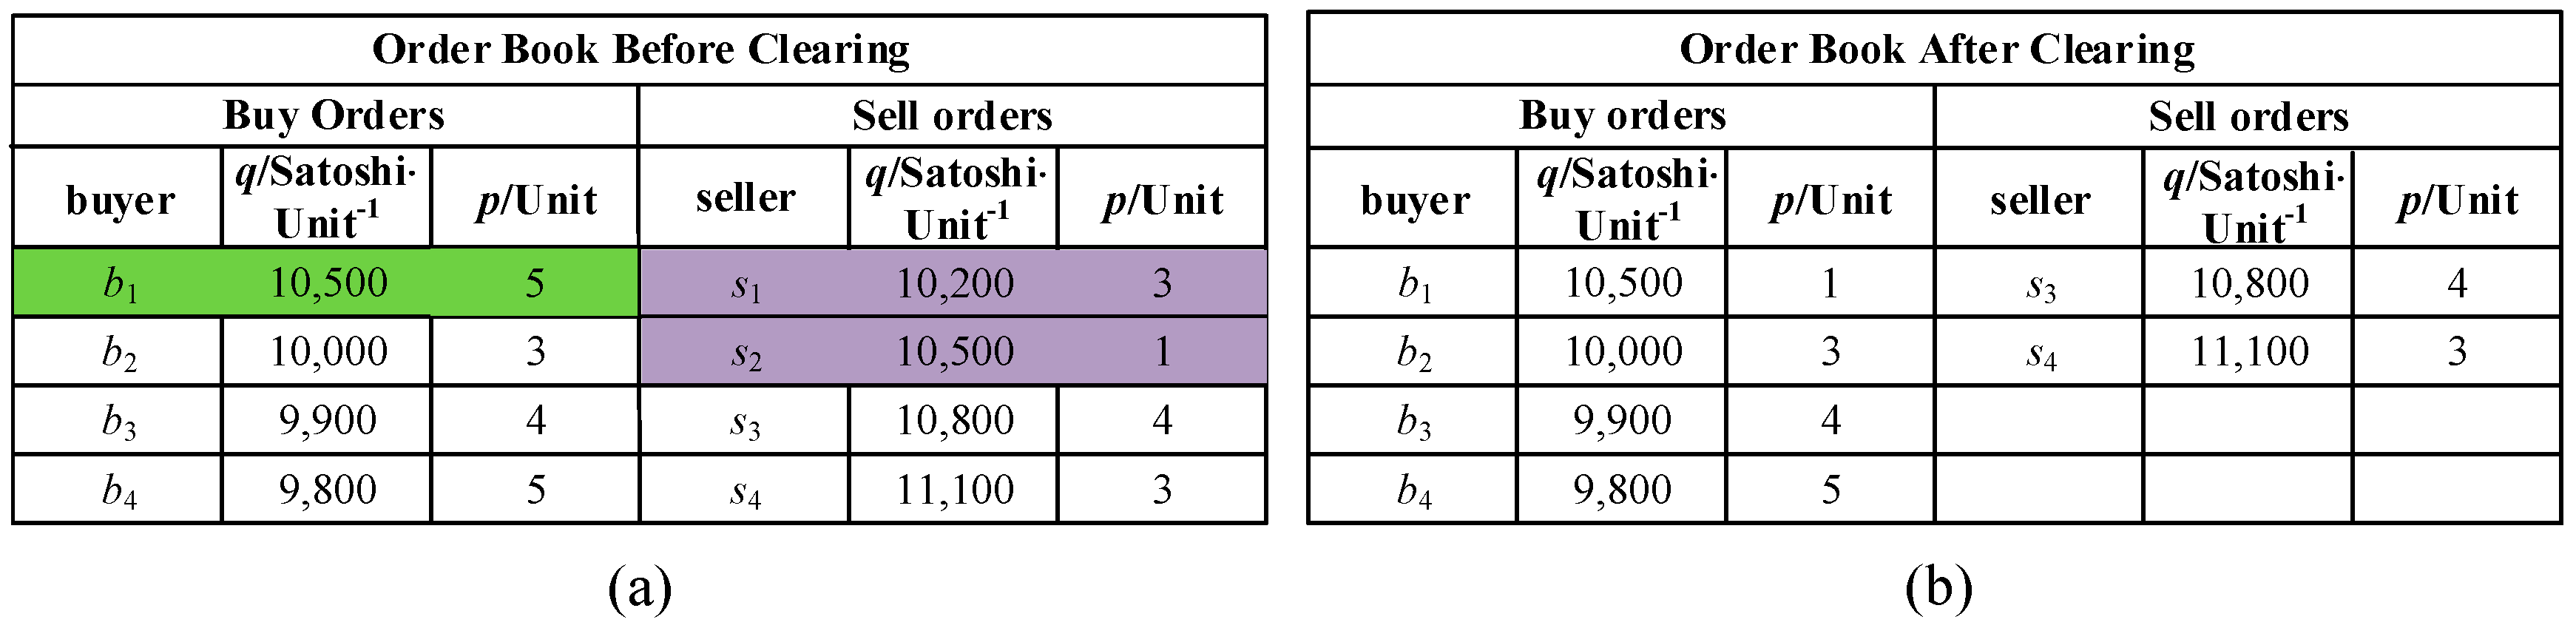
Market trade mechanism stipulates the market transaction subjects, transaction time, pricing mechanism, and the market information disclosure approach. The proposed microgrid electricity market in this study allows prosumers with DGs, independent DG operators, and common consumers to participate in market transactions through the CDA mechanism. The transaction period is hypothesized as 1 h considering the accuracy of renewable energy generation forecasting and load forecasting. In the CDA market, buyers and sellers can submit quotes at any time during the trading period and the market clears continuously [24]. The quotes of the buyers and sellers are ordered according to the principle of “price first and time first” [28]. In other words, the quotes of the buyers are in high-to-low order, whereas the quotes of the sellers are in low-to-high order. Given the same prices, quotes are ranked according to submission time. These orders are queued in an order book that is cleared continuously (Figure 3). Parameters p and q are the quotes and transaction quantity of power energy, respectively.
In the CDA market, the highest quote of a buyer is called the outstanding bid, and the lowest quote of a seller is called the outstanding ask. Transaction occurs when the outstanding bid is equal to or lesser than the outstanding ask. During the matching process, the outstanding bid is matched with the outstanding ask, and the transaction price is the average of their quotes. This matching process continues until the outstanding bid is lower than the outstanding ask. This process is called one round of transaction [24]. At least one transaction occurs in each round of transaction. For example, Figure 3a,b is the order books of the microgrid market before and after the clearing, respectively. In this matching round, the quote of buyer b1 (outstanding bid) is higher than that of seller s1. Thus, buyer b1 and seller s1 match successfully, and the transaction price and volume are 10,350 Satoshi/Unit and 3 Unit (Satoshi is the unit of bitcoin, and Unit is the transaction unit). Then, buyer b1 continues to match with seller s2 until the transaction price and volume are 10,500 Satoshi/Unit and 1 Unit, given that the quote of buyer b1 is equal to the price of s2. This round of transaction ends because the outstanding bid is less than the outstanding ask. Subsequently, the system updates the order book, as shown in Figure 3b. In the transaction process, market participants can examine the outstanding bid, outstanding ask, and transaction cost. They can adjust the quotes continuously according to market information and then match with each other again. If the buyer and the seller have not completed the matching before the trade deadline, they will purchase or sell electricity from the bulk power grid at a fixed transaction price rather than the market bid.
4. Microgrid Electricity Transaction Mode Based on Blockchain and CDA Mechanism
4.1. Overall Structure
The transaction in the microgrid market is mainly classified into three processes, namely, identity verification, market opening, and market closing.
Identity verification mainly confirms whether the consumer or DG has the right to participate in the market transaction. The first authentication is performed by a trusted third entity (e.g., government), which is then automatically completed by the software program.
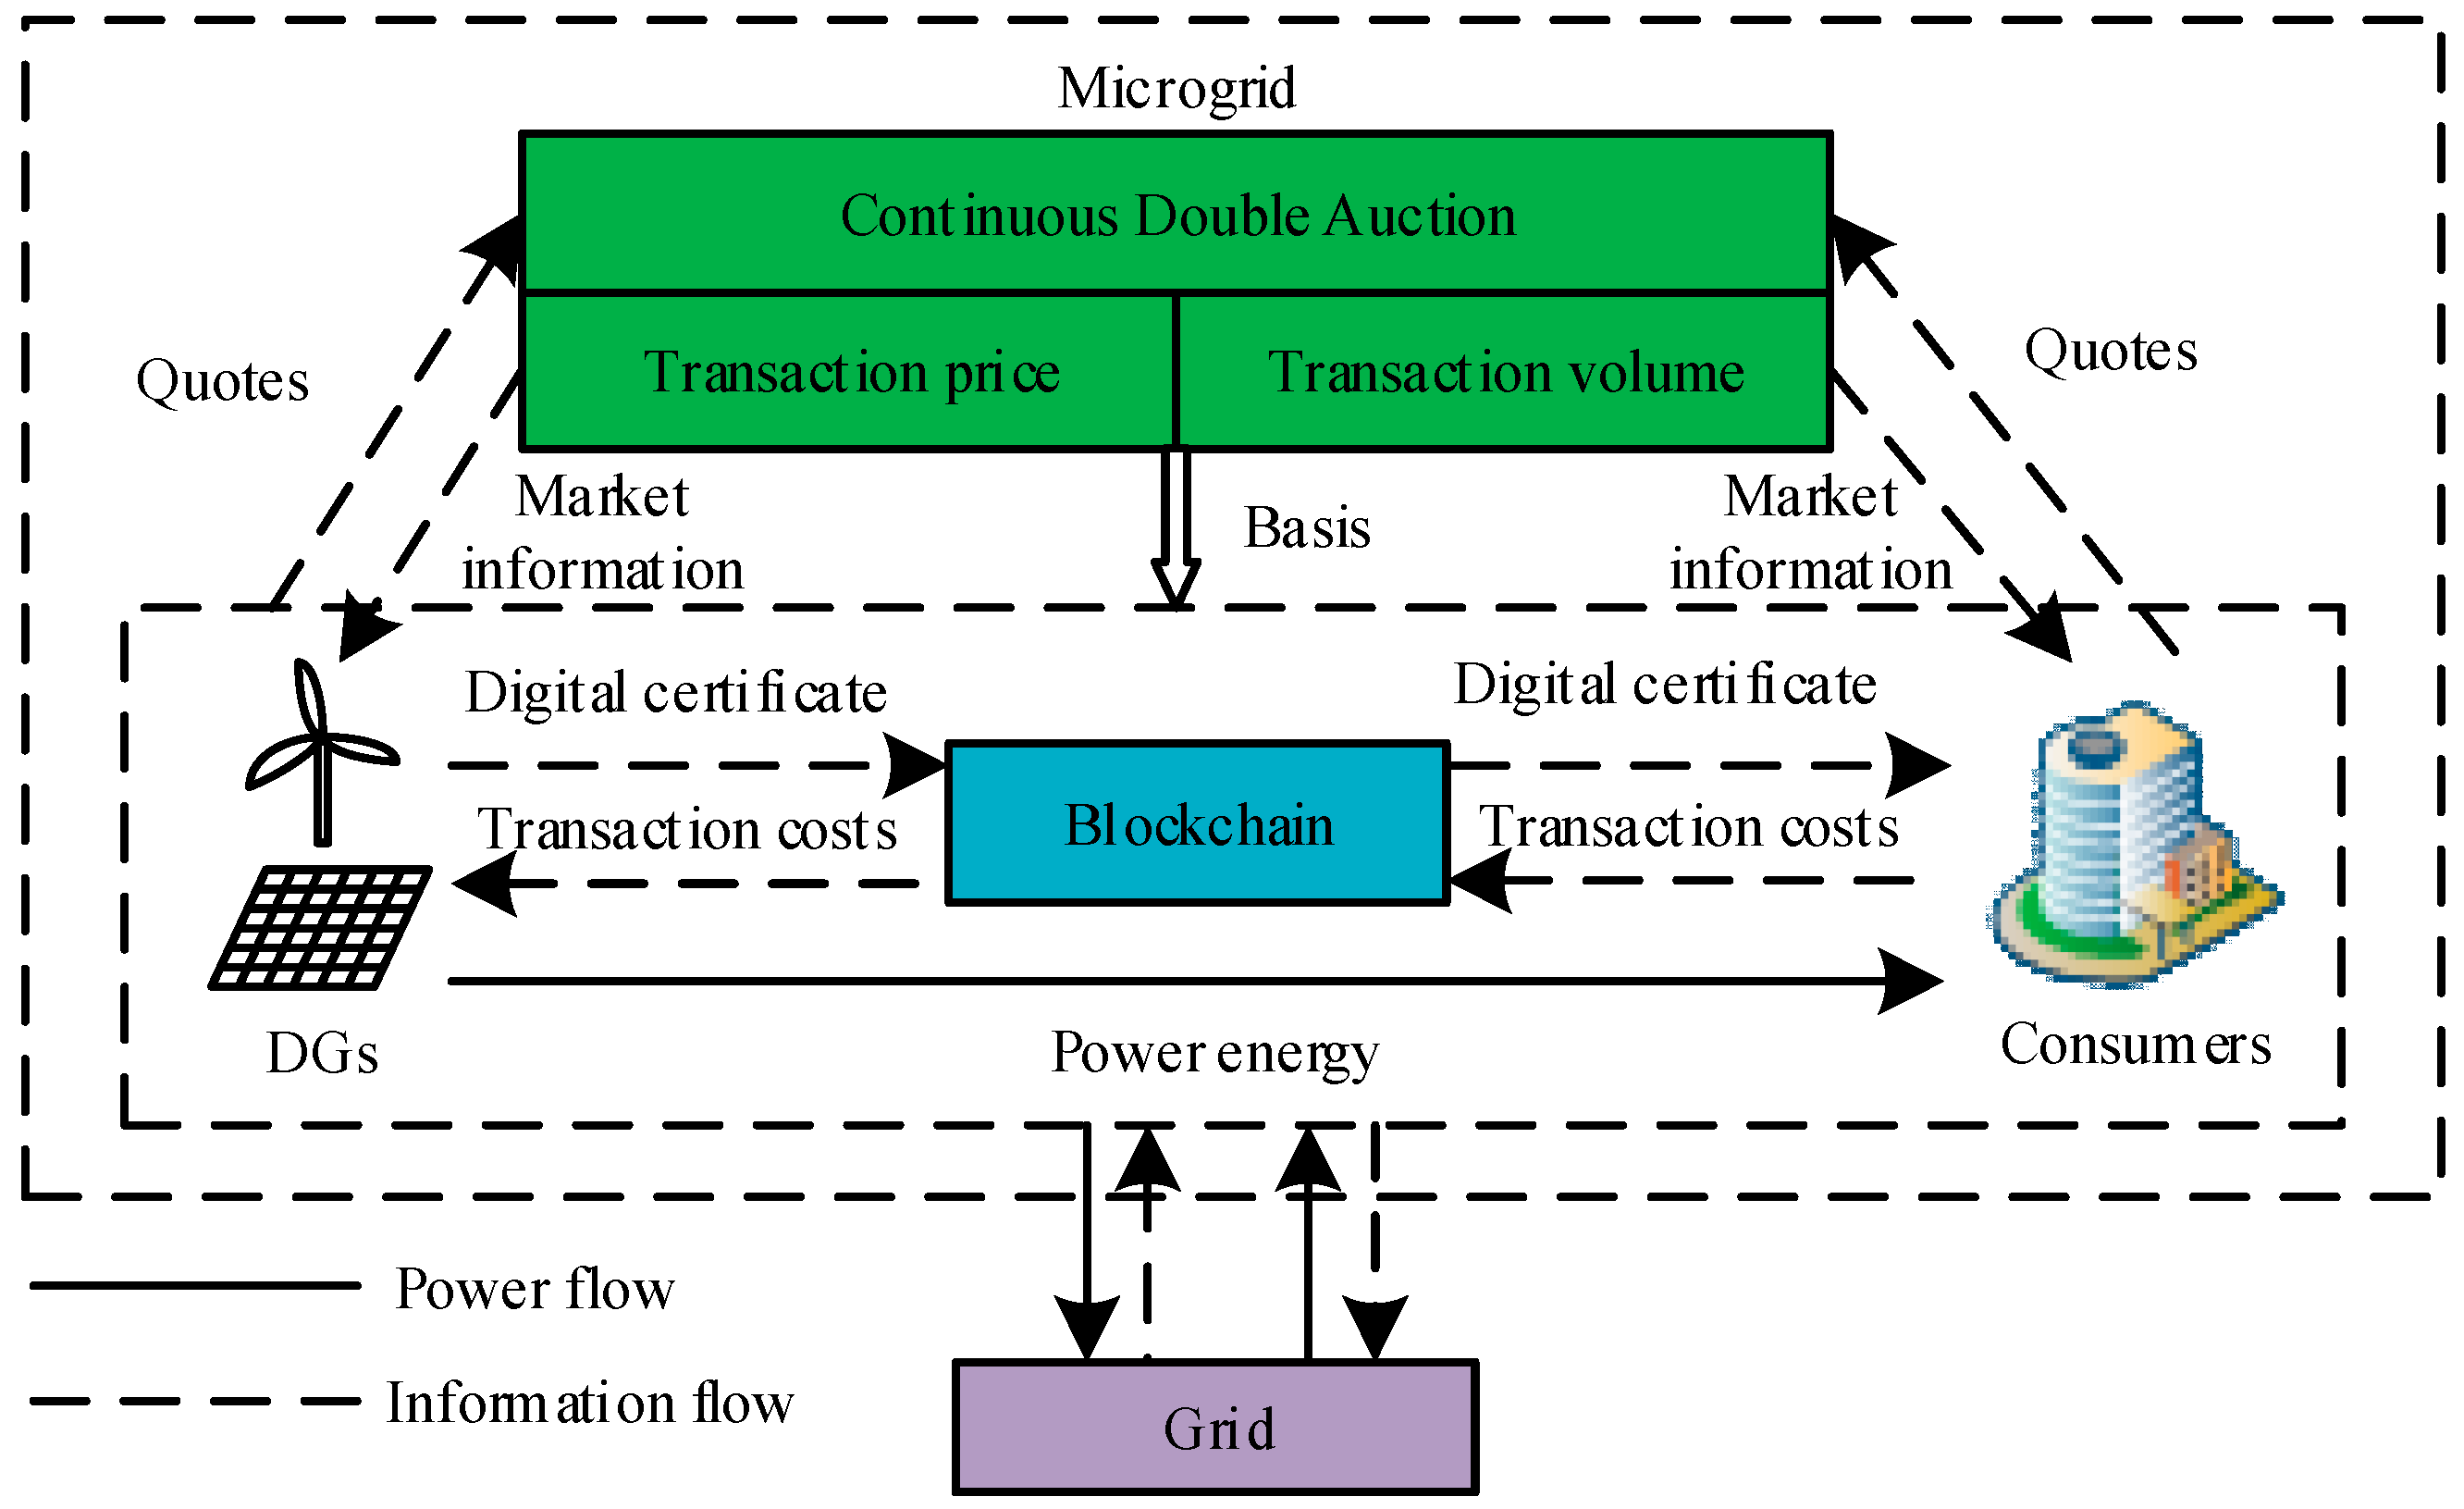
When the microgrid market opens, the seller and buyer submit the quotes, and the market automatically completes the transaction volume and price matching according to the trading rules. Then, the buyer and seller complete the settlement of transaction through the blockchain system. The overall structure of market transaction is shown in Figure 4. Many DGs and consumers exist in the microgrid electricity market. They submit quotes and available electricity resources to the CDA market in each transaction period, and the market matches automatically according to the quotes of two parties. In the matching process, the market continuously discloses transaction information to the public, including transaction price, the current outstanding ask, and the outstanding bid. Unmatched DGs and consumers adjust quotes according to a certain pricing strategy through the agent system. Two transaction parties who accomplish the matching process perform settlement based on a blockchain. Specifically, DGs transfer digital certificate of electricity transaction to the consumers based on a blockchain, and consumers provide payment to the involved DGs through the blockchain. The digital certificate indicates that the consumers obtain the right to use the corresponding electricity. Consumers pay for electricity through digital currencies, such as bitcoin based on UTXO model. The transaction succeeds after approval by all nodes through consensus mechanism in the network. Proof of work (PoW) and proof of stake (PoS) are the two common consensus mechanisms in the blockchain system [11,29]. PoW relies on machines for mathematical operations to gain the right to keep accounts, and it consumes considerable power resources. PoS is an upgraded consensus mechanism of PoW. According to the proportion and time of digital currency of each node, computational difficulty is reduced by equal proportion, which significantly reduces power consumption. Thus, the blockchain consensus mechanism in microgrid market is realized based on PoS.
The microgrid market closes when the trading time ends, and the buyers and sellers will not be able to trade. In the next trading period, the transaction process is the same as above.
4.2. AA Strategy in Microgrid Electricity Market
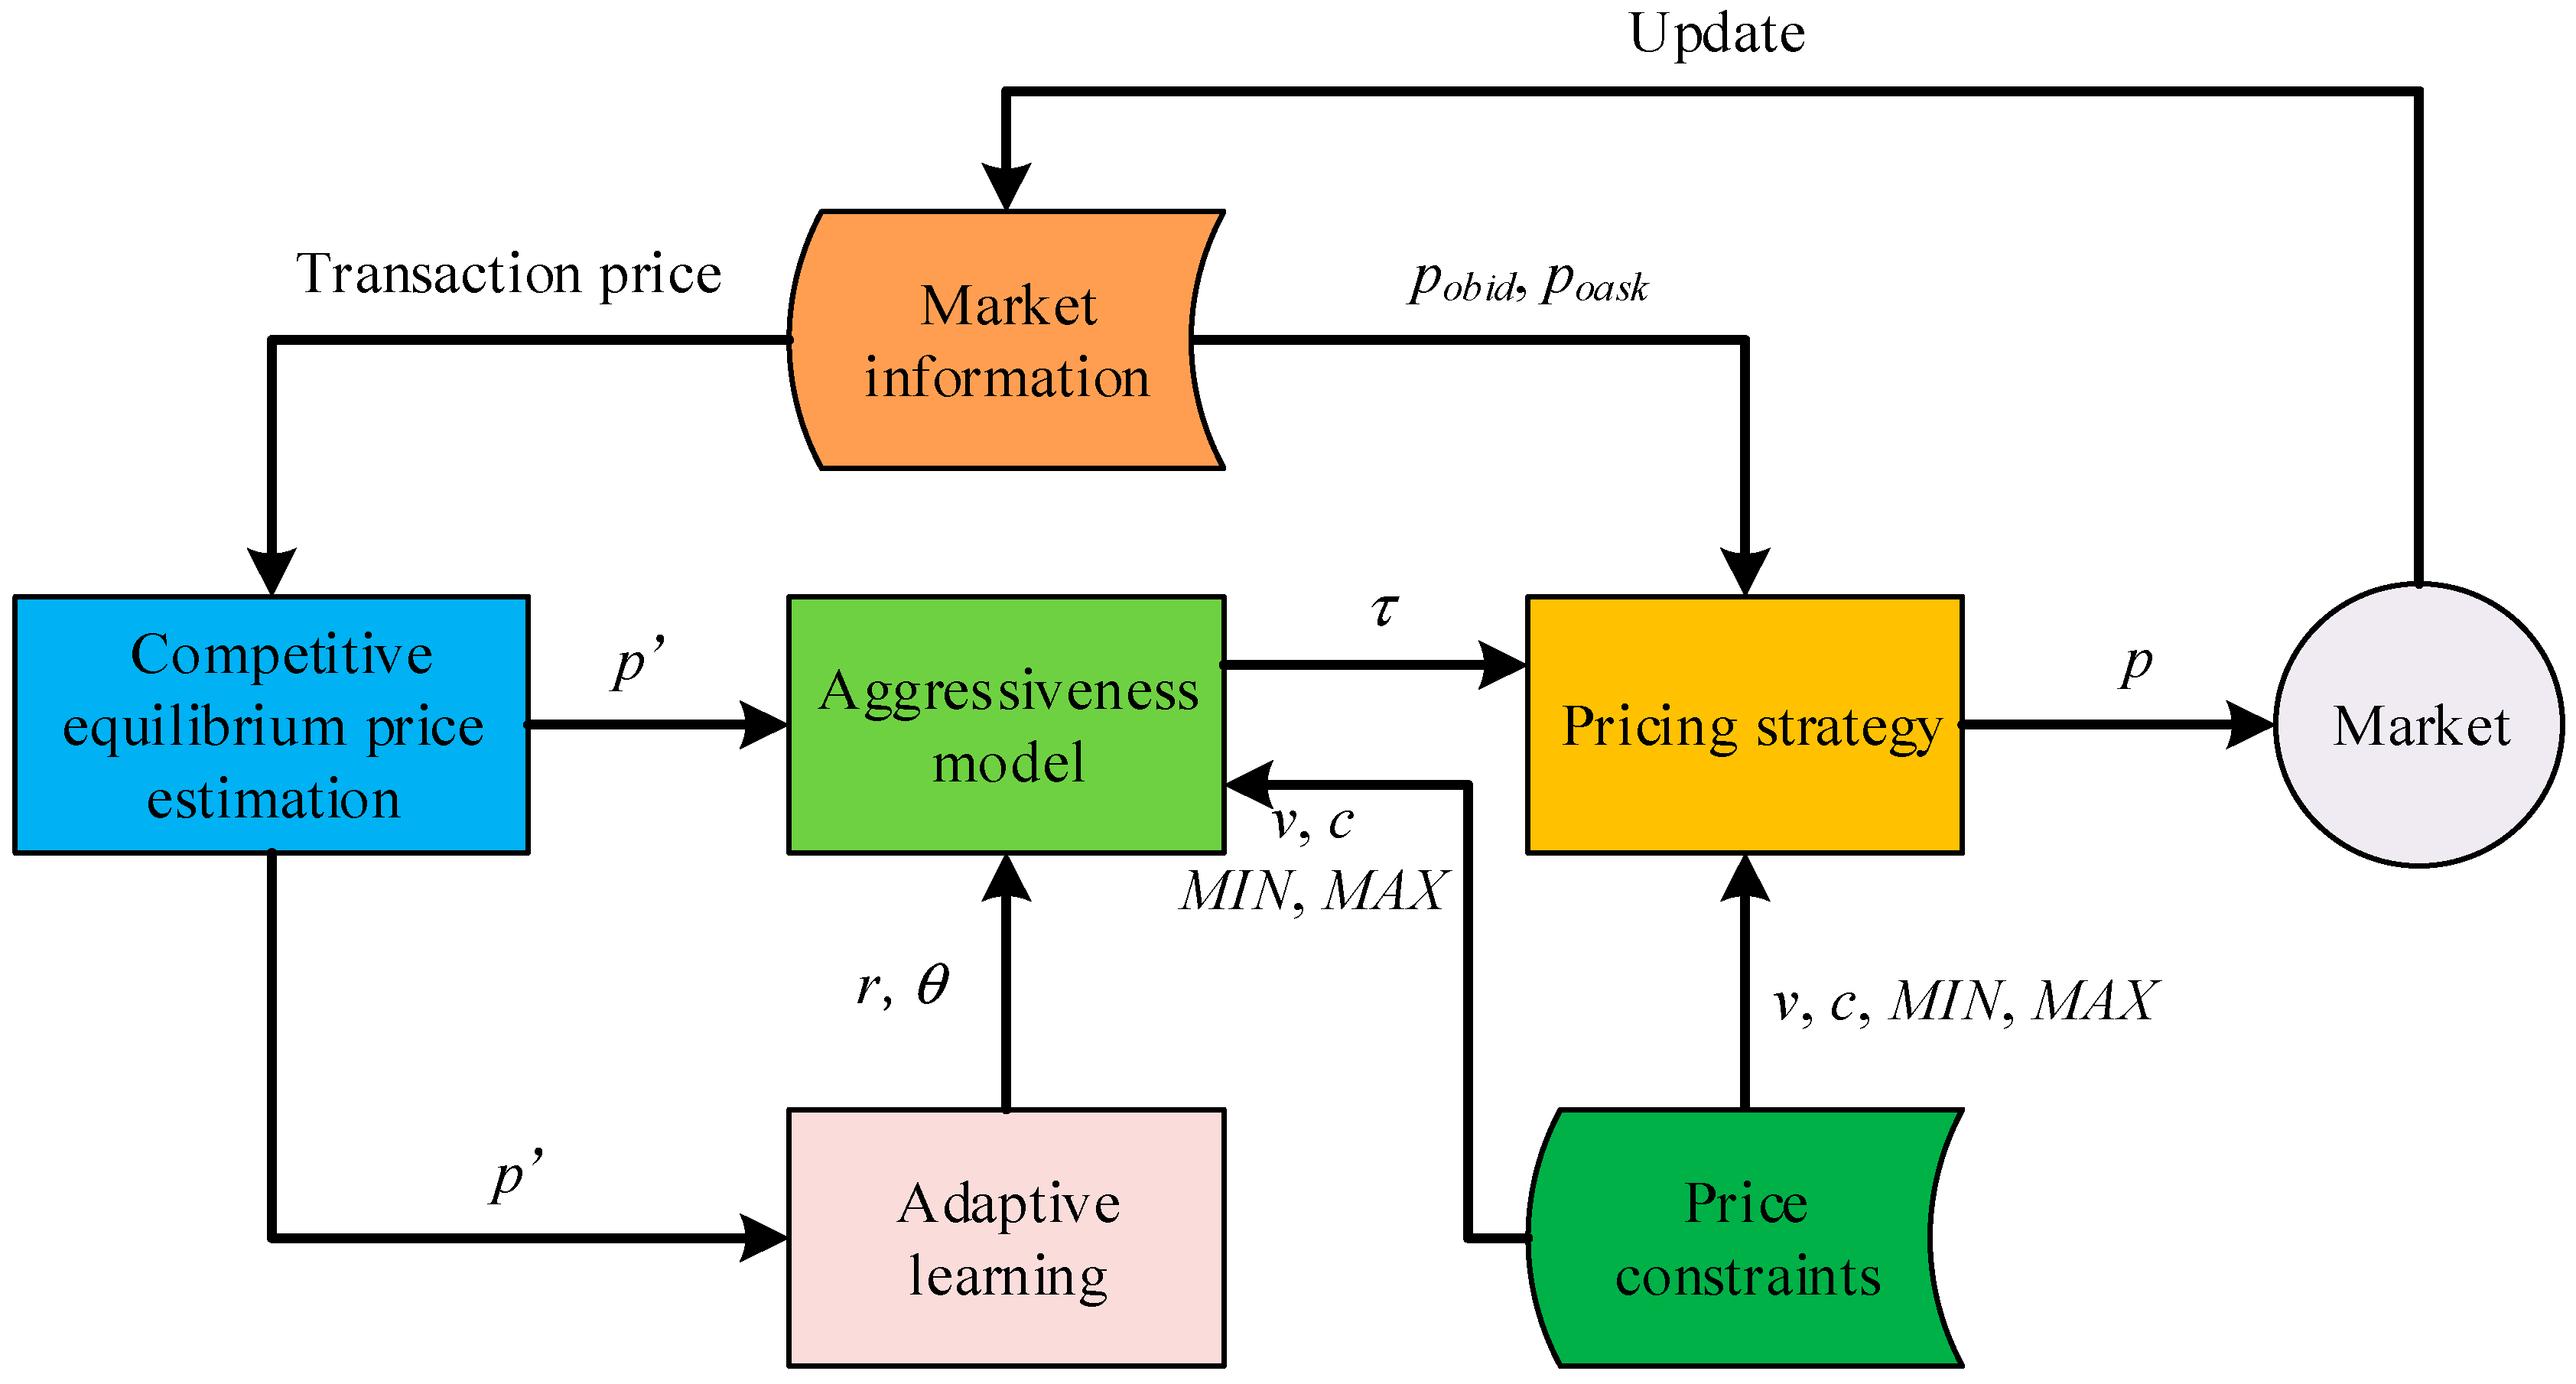
AA strategy is an adaptive learning quotation strategy (Figure 5) [24]. AA strategy is submitted to the market quotation through the competitive equilibrium price (CEP) estimation, aggressiveness model, and pricing strategy according to market information and price constraints. When the transaction is successful, the trading system updates the market information immediately.
In the transaction process, the market releases the transaction price, outstanding bid price pobid, and outstanding ask price poask. AA strategy estimates the current market CEP p' based on transaction price (see Section 4.2.1). CEP reflects the concentration of the current transaction price. The agent then determines the target quotation τ through the aggressiveness model based on CEP p′, aggressiveness degree r, market price volatility parameter θ, and price constraints v, c, MIN, and MAX (see Section 4.2.2). Aggressiveness degree r is a variable in the range of [−1, 1]. The desire of market participants to trade successfully increases with the gradual increase of r. The market price volatility parameter θ determines the shape of the mapping function in the aggressiveness model. v is the maximum price a buyer willing to offer (limit price of buyer), and c is the cost of DG (limit price of DG). MIN and MAX are the minimum and maximum quotes allowed in the market, respectively. Parameters r and θ are obtained through adaptive learning (see Section 4.2.3), and price constraints are set by market participants and markets. The target price is the ideal price for market participants. The final quotation should be determined in combination with the current outstanding bid or ask price and then offer p is submitted. (see Section 4.2.4).
4.2.1. CEP Estimation
Market competitive equilibrium indicates that the competitive equilibrium is the balance between the supply and demand in the market or economy, which characterizes perfect competition. Perfect competition is a market structure without any hindrance and interference, which refers to the market that does not exist sufficiently to affect the price of the enterprise or consumer [24]. Multiple small-scale DGs and consumers exist in the microgrid electricity market, and nobody has the dominant influence in the market, especially in the community and rural microgrid. These microgrid markets can be considered as a competitive market [30], and the transaction price approaches to CEP gradually. CEP cannot be acquired in advance but can be estimated from weighted moving average of transaction prices in the latest n deals in the same trading period:
when the number of transactions is less than eight, parameter n is equal to the previous transaction number; otherwise, parameter n is set to 8. pi is the transaction price of deal i, and ωi is the weight of deal i, which is solved according to rank correlation analysis, as shown as follows [31]:
where p is the ratio of two adjacent weights and is generally 0.9.
4.2.2. Aggressiveness Model
Aggressiveness reflects the willing strength of market subjects to participate in market competition. If the consumer has a strong intention to win the bid, then the target quote will increase initiatively; otherwise, it will decrease accompanied with a profit growth. The change trend of the target quote of DG is the opposite. According to the relationship of the limit purchase price v of consumers and DG cost c with the estimated CEP p′, trading parties are classified into intra-marginal and extra-marginal buyers or sellers. The buyer is intra-marginal if the limit purchase price v of the consumer is higher than CEP p′; otherwise, the buyer is extra-marginal. DG is an intra-marginal seller if DG cost c is lower than CEP p′; otherwise, the DG is an extra-marginal seller.
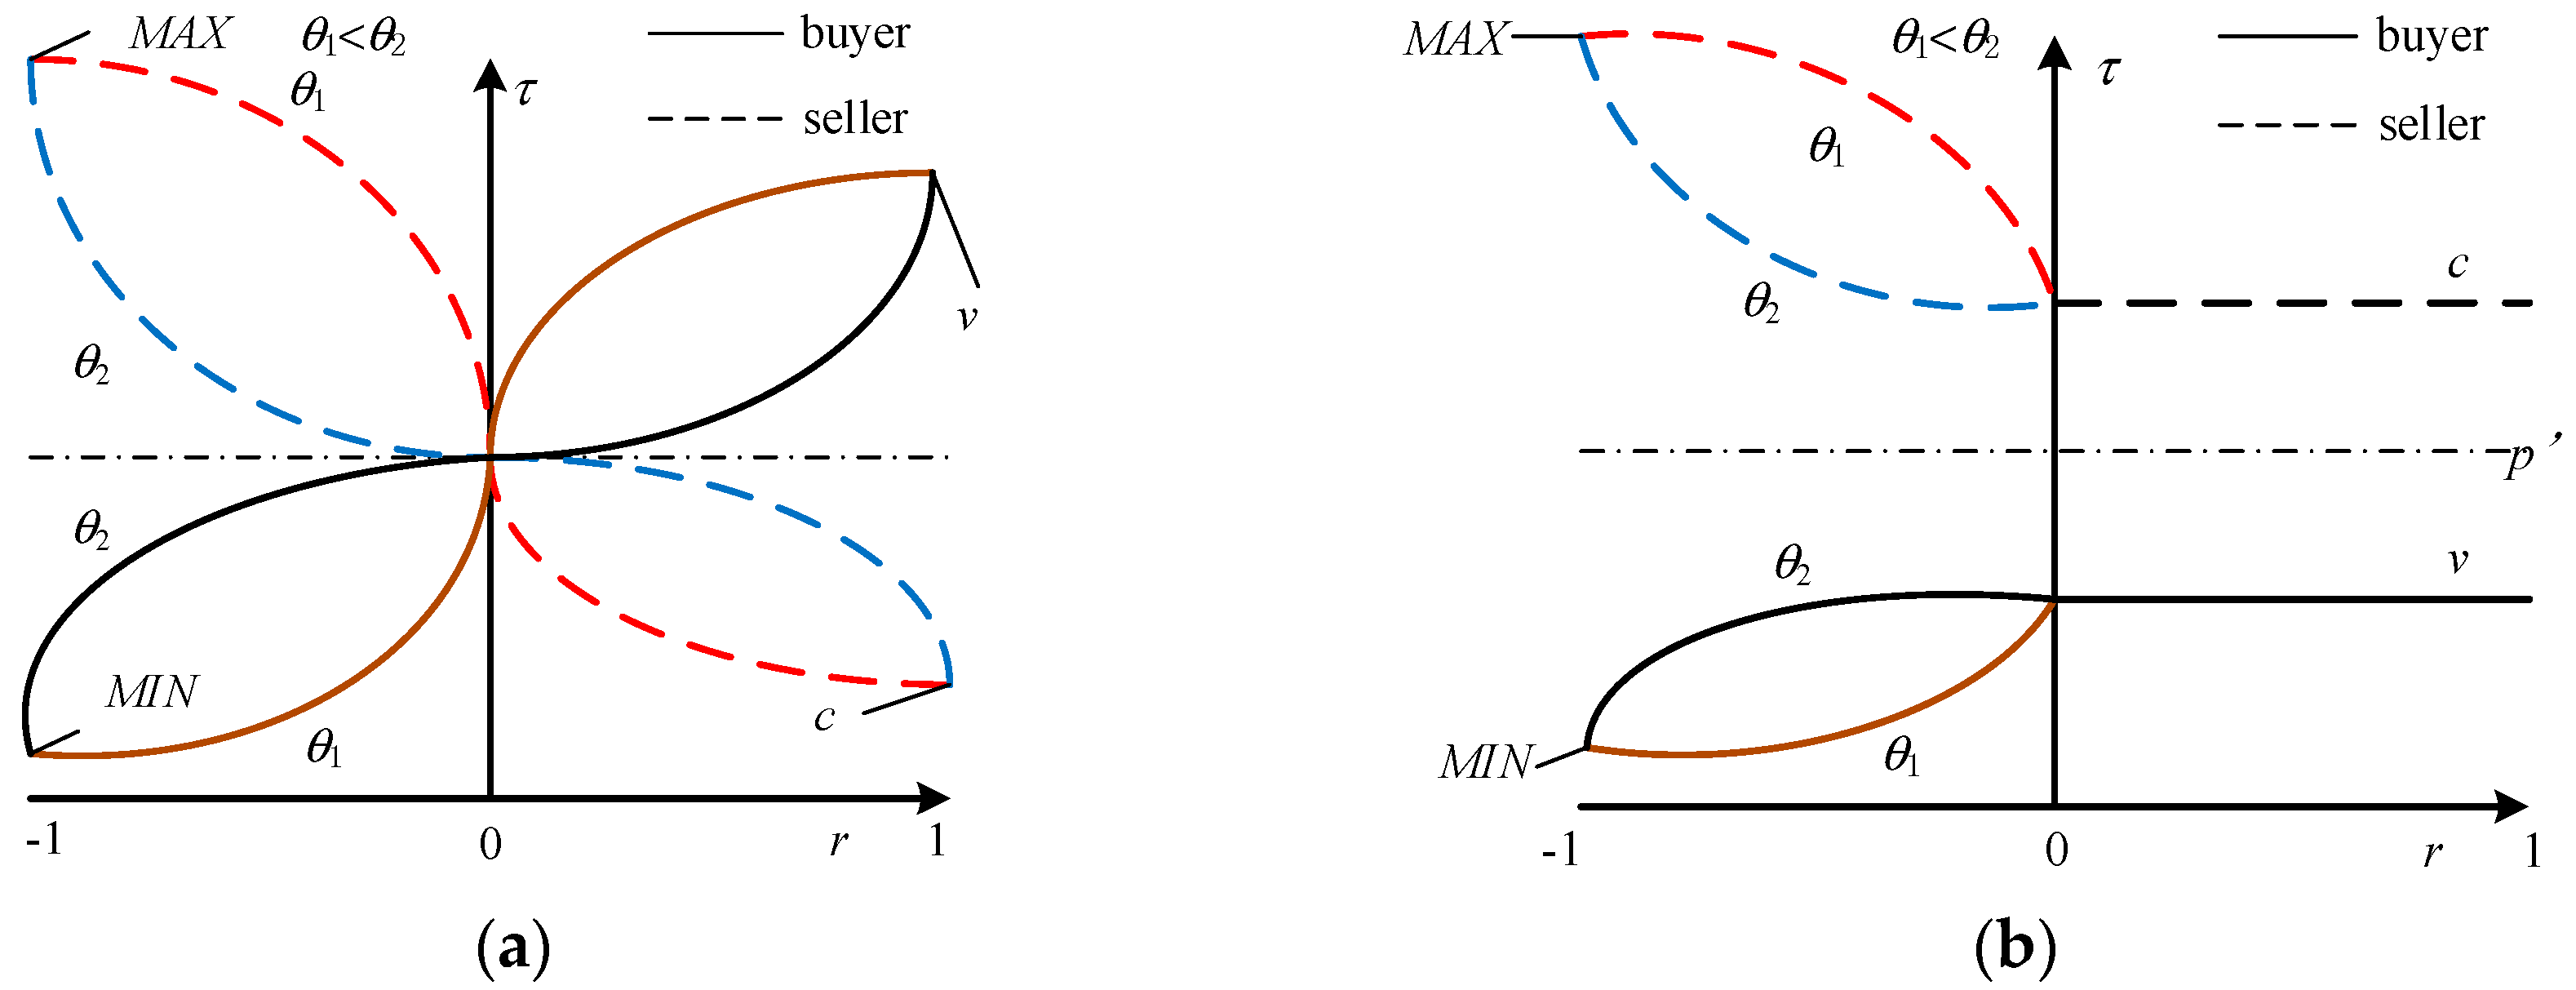
Aggressiveness degree r is a parameter that reflects the strength of aggressiveness. r is a real number in the range of [−1,1]. As r approaches to 1, the market participant has a strong will to win the bid. As r approaches to −1, the market subject is passive in bidding. If r = 0, the market subject keeps a neutral attitude toward the transaction. The relation curve between the target prices of intra-marginal and extra-marginal trading parties and aggressiveness degree is shown in Figure 6. Solid lines represent the buyer’s function, and the dashed lines represent the seller’s function. θ is a parameter that relates to market price volatility and determines the shape of the target price function.
Figure 6 shows that the price range of the buyer is subject to parameters v and MIN, whereas the seller’s price range is dependent on parameters c and MAX. The target price of the consumer increases continuously as his aggressiveness degree approaches to 1 while the target price of DG increases continuously, thereby increasing the probability of a deal. When the target price of an extra-marginal buyer will not be higher than the CEP although r is higher than 0, the limit price v is lower than the CEP. Therefore, the target price of an extra-marginal buyer is set as a constant, that is, the limit price v. Similarly, the target price of an extra-marginal seller is the limit price c when r is higher than 0. Obviously, the probability of transaction success is lower than that of the intra-marginal seller and it is the same with extra-marginal buyer due to the high cost of the extra-marginal seller. Specifically, market participants can obtain considerable profit when the target price converges to CEP [24]. In addition, the variation law of target price τ is sensitive to parameter θ. The target price close to r = 0 changes quickly with a small value of θ. The value of θ is influenced by the fluctuation of market price. When market price fluctuates intensely, the participant with a low θ is suitable to explore the market by allowing a fast update of its degree of aggressiveness. Target prices of different consumers and DGs can be expressed as:
where τin,b, τin,s, τex,b, and τex,s are the target prices of the intra-marginal buyer, intra-marginal seller, extra-marginal buyer, and extra-marginal seller, respectively.
4.2.3. Adaptive Learning Process
Adaptive learning process is where trading parties adjust r and θ through short- and long-term learning according to market information. Short-term learning is expressed as:
where r(t) is the aggressiveness degree of the t round of transactions. δ(t) is the desired aggressiveness degree of the t round of transactions, which represents the aggressiveness degree that would allow the buyer to bid the minimum price and a price slightly higher than the outstanding bid, or the seller to ask the maximum price and a price slightly lower that the outstanding ask. δ(t) is a factor of rshout(t). rshout(t) is the aggressiveness degree corresponding to the optimal quote of the t round of transactions. If the agent fails to make deals in the t round of transactions, then the optimal quote is the transaction price. If this agent is a consumer (or DG) and makes deals in the t round of transactions, then the optimal quote is the purchase price (selling price) of the t round. λ is the ideal progress factor. When λ = −0.05, the agent increases benefits by decreasing the aggressiveness degree. When λ = 0.05, the agent increases possibility of deals by increasing the aggressiveness degree. When λ = 0, the agent uses the same strategy. β1 ∈ (0, 1) is the short-term learning speed. β1 is drawn from the uniform distribution interval (0.2, 0.6).
When the target price of the consumer is higher than the transaction price or purchase price (success of the transaction) of the previous round, the consumer agent should decrease r; otherwise, it should increase r. When the target price of the DG is lower than the transaction price or the selling price (success of the transaction) of the previous round, the DG agent should decrease r; otherwise, it should increase r. The long-term learning is expressed as follows:
where α is the normalized standard deviation value of the transaction prices in the current n rounds and reflects the fluctuation of market prices. β2 ∈ (0, 1) is the long-term learning speed. β1 is drawn from the uniform distribution interval (0.2, 0.6), and the initial value of θ is set as −4. θ′(α) is a function about α, and the optimal θ(t + 1) can be searched by the fluctuation of transaction prices. The function equation can be expressed as:
where θmin and θmax are the limits of θ; and αmin and αmax are the minimum and maximum values of α. Obviously, θ′ is the monotone decreasing function of α.
4.2.4. Pricing Strategy
As mentioned above, the target price is the ideal price for market participants. When two trading parties follow the target price completely, complete failure of electricity transactions may occur. The buyer may offer too low and the offer of the seller may be too high because the target price does not include the outstanding price. Therefore, two trading parties should adjust quotes continuously according to the current outstanding bid and outstanding ask before each round of transactions until deals are completed. The pricing strategy of the consumer is expressed as follows:
where η ∈ (0, 1) is the increment rate of consumer’s quote. PObid(t) and PObid(t) are the outstanding bid and outstanding ask in the t round of transactions, respectively. In the first round of transactions, determining the target prices according to market information is difficult because no transaction price can be used as reference in the market. Consumers can only increase quotes appropriately according to the current outstanding bid and outstanding ask in the market. In the following transactions, both trading parties should increase their quotes appropriately in terms of target price and current outstanding ask if they cannot conclude the transaction. The pricing strategy of DG is:
The principle of the pricing strategy of DG can refer to the pricing strategy of the consumer, which is not introduced in detail.
4.2.5. Balance Mechanism
Maintaining the power balance of the microgrid based on bulk power grid is necessary due to the inevitable prediction errors of load and DG power generation. Specifically, the forecast accuracy of other market participants is 100% for each consumer or DG, and the error portion of electricity is balanced by trading with the bulk power grid.
Consumers will be offered no refund compensation when their actual electricity consumption is lower than the transaction volume. This condition is the same when the DG sells surplus electricity to the grid. However, consumers should purchase electricity from the grid when their actual electricity consumption is higher than the transaction volume. Suppose that a consumer is transaction power W and the load forecast error is ΔW, the actual cost of electricity purchased Factual is expressed as:
If the load forecast is completely correct, the expected cost of market trading Fexpected with the same consumption of electricity is:
where pb_grid is the electricity purchase price from the grid; and is the average transaction price of consumers in the market; in general, pb_grid > . From Equations (16) and (17), when ΔW < 0, that is, the actual consumption of electricity is less than the transaction power, the economic loss is −⋅ΔW; when ΔW > 0, that is, the actual consumption of electricity is more than the transaction power, the economic loss is (pb_grid − )⋅ΔW.
When the actual power generation of the DG is higher than the transaction volume, the DG will make transactions with the grid over excessive electricity energies. When the actual power generation of the DG is lower than the transaction volume, to the DG should purchase electricity from the grid to cover the shortage. Suppose that a DG is transaction power Q and the forecast error of power generation is ΔQ, the actual revenue of electricity selling Gactual is:
If the forecast of the power generation of DG is completely correct, the expected revenue of market trading Gexpected with the same generated energy is:
where ps_grid is the electricity selling price to the grid; and is the average transaction price of the DG in the market; generally, ps_grid < . From Equations (18) and (19), when ΔQ < 0, that is, the actual generated energy of DG is less than the transaction power, the economic loss of DG is ; when ΔQ > 0, that is, the actual generated energy of DG is more than the transaction power, the economic loss of DG is .
4.3. Settlement for Microgrid Electricity Transactions
Consumer and DG complete microgrid exchange payment and digital certificate of electricity transaction quantity through the blockchain after trade matching. In this study, the settlement in the microgrid is based on the bitcoin protocol. Consumers transfer bitcoin to the DG as an electricity purchase cost through the blockchain system, and the DG transfers token as a digital certificate for the sale of electricity. Token actually refers to the digitalization of assets and bearer bonds. The DG embeds token in the blockchain network for P2P transactions. The settlement process between the consumer and DG in the blockchain network is introduced as follows:
- (1)
- Issue token money: After the transaction matching, the DG issues one token money, which is proportional to the transaction volume in the blockchain network, as the input source of transaction script.
- (2)
- Transfer bitcoin: The consumer who transacts with this DG creates a common transaction of transferring bitcoins. Input: UTXO of previous transaction; Output: Bitcoins are transferred to the address of the public key of this DG attached with a digital signature.
- (3)
- Transfer token money: DG creates a trade after receiving bitcoins from the consumer. Input: Token money issued in Step 1; Output: Transfer token money to the public key of the consumer attached with a digital signature. At this moment, the consumer and DG accomplish the transaction.
This settlement process has a risk of breach of contract. After receiving bitcoins from the consumer, the DG might refuse to transfer token money to the consumer or might be unable to supply electricity to consumers due to system failures, which causes losses to the consumer. To avoid this shortcoming, the consumer’s bitcoin payment can use multiple signatures and a default management system can be introduced. The transaction takes effect upon the signatures of both parties. Moreover, the benefits of both parties are protected through dispute arbitration by the third party. The arbitrator only intervenes when a dispute occurs between the two parties; thus, the essence of direct decentralized transaction is unaffected. The settlement process based on multiple signatures is introduced as follows:
- (1)
- Issue token money: This step is similar with the aforementioned settlement.
- (2)
- Transfer bitcoin: The DG sends the consumer one redeemScript involving the public keys of the DG, the consumer, and the third party. The consumer creates one transaction of transferring common bitcoins. Input: UTXO of previous transaction; Output: Transfer the transaction to the redeemScript attached with a digital signature.
- (3)
- Transfer token money: This step is similar with the aforementioned settlement.
The DG requires the signatures of any two from the DG, the consumer, and the third party to gain the right of use of bitcoins in the redeemScript. This process can protect the legal rights and interests of the consumer through arbitration of the third party when the DG breaks the contract.
4.4. Digital Certificate of Electricity Assets
Token money is the proof of electric power energy in the blockchain system. In the physical world, consumers pay certain physical coins to the energy seller and sign an agreement or gain a piece of IC card to prove their ownership of a certain amount of energy sources. Given that bitcoins are the only transaction object in the blockchain network, several special labels can be added on bitcoins to distinguish them from common bitcoins and be used as the digital signature of physical assets. Such specially labeled bitcoins are called colored coins [32]. Colored coins are bitcoins and do not need a third party for storage and transfer. Therefore, colored coins provide a settlement for physical objects that are difficult to be decentralized by traditional methods.
Suppose the colored coins for microgrid electricity transactions are called energy coins. Colored coins are a common means to label bitcoins by setting the serial number in the input script [33]. The serial number (Sequence_N) is the 32-bit characters in the input script, and the last six bits are used as the tag of the transaction type (Tag_Tx). Tag_Tx = 110011 and Tag_Tx = 100101 are the transaction of transferring and issuing energy coins with hexadecimal values 0x33 and 0x25, respectively. The remaining transactions are common bitcoin transactions. The extraction method of Tag_Tx is:
where & is the AND operation bit-by-bit. When Tag_Tx = 0x25, the transaction is issuing of energy coins. When Tag_Tx = 0x33, the transaction is transferring of energy coins. If neither, it is a common bitcoin transaction.
Energy coins can only be used as proof of electricity transaction; thus, they do not require a large actual bitcoin amount. However, a padding variable is introduced considering the requirements on minimum bitcoin trading volume and fluctuation:
where Value is the bitcoin value in the output script, Padding is the padding variable, and Ve is the actual value of energy coins.
Similar with the labeling method of transaction type, the padding variable is calculated from 7–12 bits of characters in Sequence_N.
- (1)
- Extract 7–12 bits in Sequence_N:
- (2)
- Calculate the padding variable as:
The received bitcoin value, Sequence_N of input script, and quantity of energy coins, which are calculated according to Equations (21)–(23), are the proof of consumer’s electricity purchase. The digitalization of electricity assets is completed.
5. Analysis of Application Context
5.1. Parameter Setting
Suppose a microgrid has 8 consumers and 6 DGs. The transaction volume and quotes of all consumers and DGs are listed in Table 1.
5.2. Analysis of Microgrid Transaction Results
MATLAB simulation analysis is performed based on above trading strategies and parameter settings. The difference of quote time is neglected in the transaction. When there two or more buyers or sellers submit the same quotes in the system, the transaction selects one of them randomly.
Multiple transactions could occur in a round, as mentioned in Section 3. When the participants completed the match, they will stop trading if no remaining tradable power is available. Otherwise, the remaining electricity will enter the next round of trading. Thus, the relationship between the transaction round sequence and transaction sequence is obtained. The simulation results show that five rounds of transactions, including 13 transactions, are completed in the entire transaction period. The transaction and round sequences are (1–8, 1), (9, 2), (10, 3), (11–12, 4), and (13, 5). The variations of the transaction price and volume in a transaction period are shown in Figure 7, where Consumer 5 and DG 2, Consumer 1 and DG 2, Consumer 1 and DG 3, Consumer 6 and DG 3, Consumer 6 and DG 4, Consumer 8 and DG 4, Consumer 2 and DG 4, and Consumer 7 and DG 4 conclude the transactions (the numbers above the column represent the serial numbers of consumers and DG) in the first round. Their transaction volumes are 3, 2, 2, 2, 1, 2, 2, and 2 Units. These volumes are the collaborative result of the high quotes of the consumers and the low quotes of the DGs. The consumers are willing to offer a high price, whereas the DGs offer a low cost. Consumer 3 offers the lowest quote, and DG 6 offers the highest quote; thus, they conclude the transaction in the last round.
To analyze the participant quotation process in the transaction, Consumer 3 is used as an example. CEP estimation and short- and long-term learning outcomes of Consumer 3 in each transaction round are shown in Figure 8.
The buyer and seller’s quotations tend to be rational while the market information continues to be disclosed. Thus, the market CEP fluctuates significantly in the early stage and gradually tends to be stable in the latter period, as shown in Figure 8a.
When Consumer 3 fails to trade in the first round, the aggressiveness degree should be increased, which aims to increase the possibility of transactions. Thus, r(2) has a value greater than r(1) in Figure 8b. Consumer 3 fails in the second round of transactions again; thus, he increases the aggressiveness degree r to trade successfully in the third round. r(3) is nearly equal to r(4) because Consumer 3 does not adjust the aggressiveness degree after the third round of successful trading. The decline of r(5) is caused by the decline of market CEP, and Consumer 4 have taken many risky strategies to gain many benefits.
Figure 8c reveals that θ(2) is smaller θ(3) because the price fluctuation in the first round is stronger than that in the second round α(1) > α(2), and θ is the monotone decreasing function of α. The violent price fluctuations cause θ to decrease gradually and provide a fast update of the target price. By analogy, the changing trend of θ is continuously opposite to that of α.
In reality, the forecast error of the load and DG power generation is inevitable. For example, the average transaction prices , of Consumer 1 and DG 1 are 10,200 Satoshi/Unit and 10,055 Satoshi/Unit, respectively (Figure 6). Suppose that the price of electricity purchased from the bulk grid pb_grid is 18,000 Satoshi Unit−1 and the price of power sold to bulk grid ps_grid is 6000 Satoshi⋅Unit−1. Table 2 shows the expected and actual cost or revenue of the trading parties when the prediction errors are ± 1 Unit.
From Table 2, shows when the prediction error is considered, the actual cost of electricity purchased Factual by the consumer is higher than the expectation cost of electricity purchased Fexpected through market trading, and the actual revenue of electricity selling Gactual by DG is lower than expected revenues Gexpected from the market transaction. This result is caused by the consumer’s lack of refund compensation for less actual consumption than the predicted volume. Thus, the consumer should spend several additional expenditures during the transaction. When the actual consumption of electricity is higher than the predicted value, the consumer should buy electricity from the bulk grid at a higher price pb_grid.
The consumer should buy electricity from the power grid at a relatively higher price to cover the shortage when the actual power generation of the DG is lower than the transaction volume, which decreases its revenue with . The excess capacity can only be sold to the bulk grid at a low price when the actual power generation of the DG is higher than the predicted volume. Thus, the revenue of the DG is lower than the expected value. Obviously, the prediction error will cause economic losses to the trading parties. Hence, trading parties must increase their prediction accuracy to protect their profits.
5.3. Comparative Analysis of Different Trading Strategies
To test the pros and cons of the AA strategy, this study compares the AA strategy with ZI and ZIP strategies to analyze the profits of consumer and DG and the market efficiency under different strategies. The consumer’s profit PBA, the DG’s profit PSA, and the market efficiency E are denoted as [34]:
where Nb and Ns are the sum of all trading electricity by the consumer and DG, respectively; vx and cy are the limit prices for consumer trading unit x and DG trading unit y, respectively; px and pj are the transaction prices for consumer trading unit x and DG trading unit y, respectively; PBCE and PSCE are the profits that the consumer and the DG will obtain in competitive equilibrium, which are determined by parameters vx and cy, respectively; and PBA and PSA are the profits that the consumer and the DG will obtain in CDA, respectively.
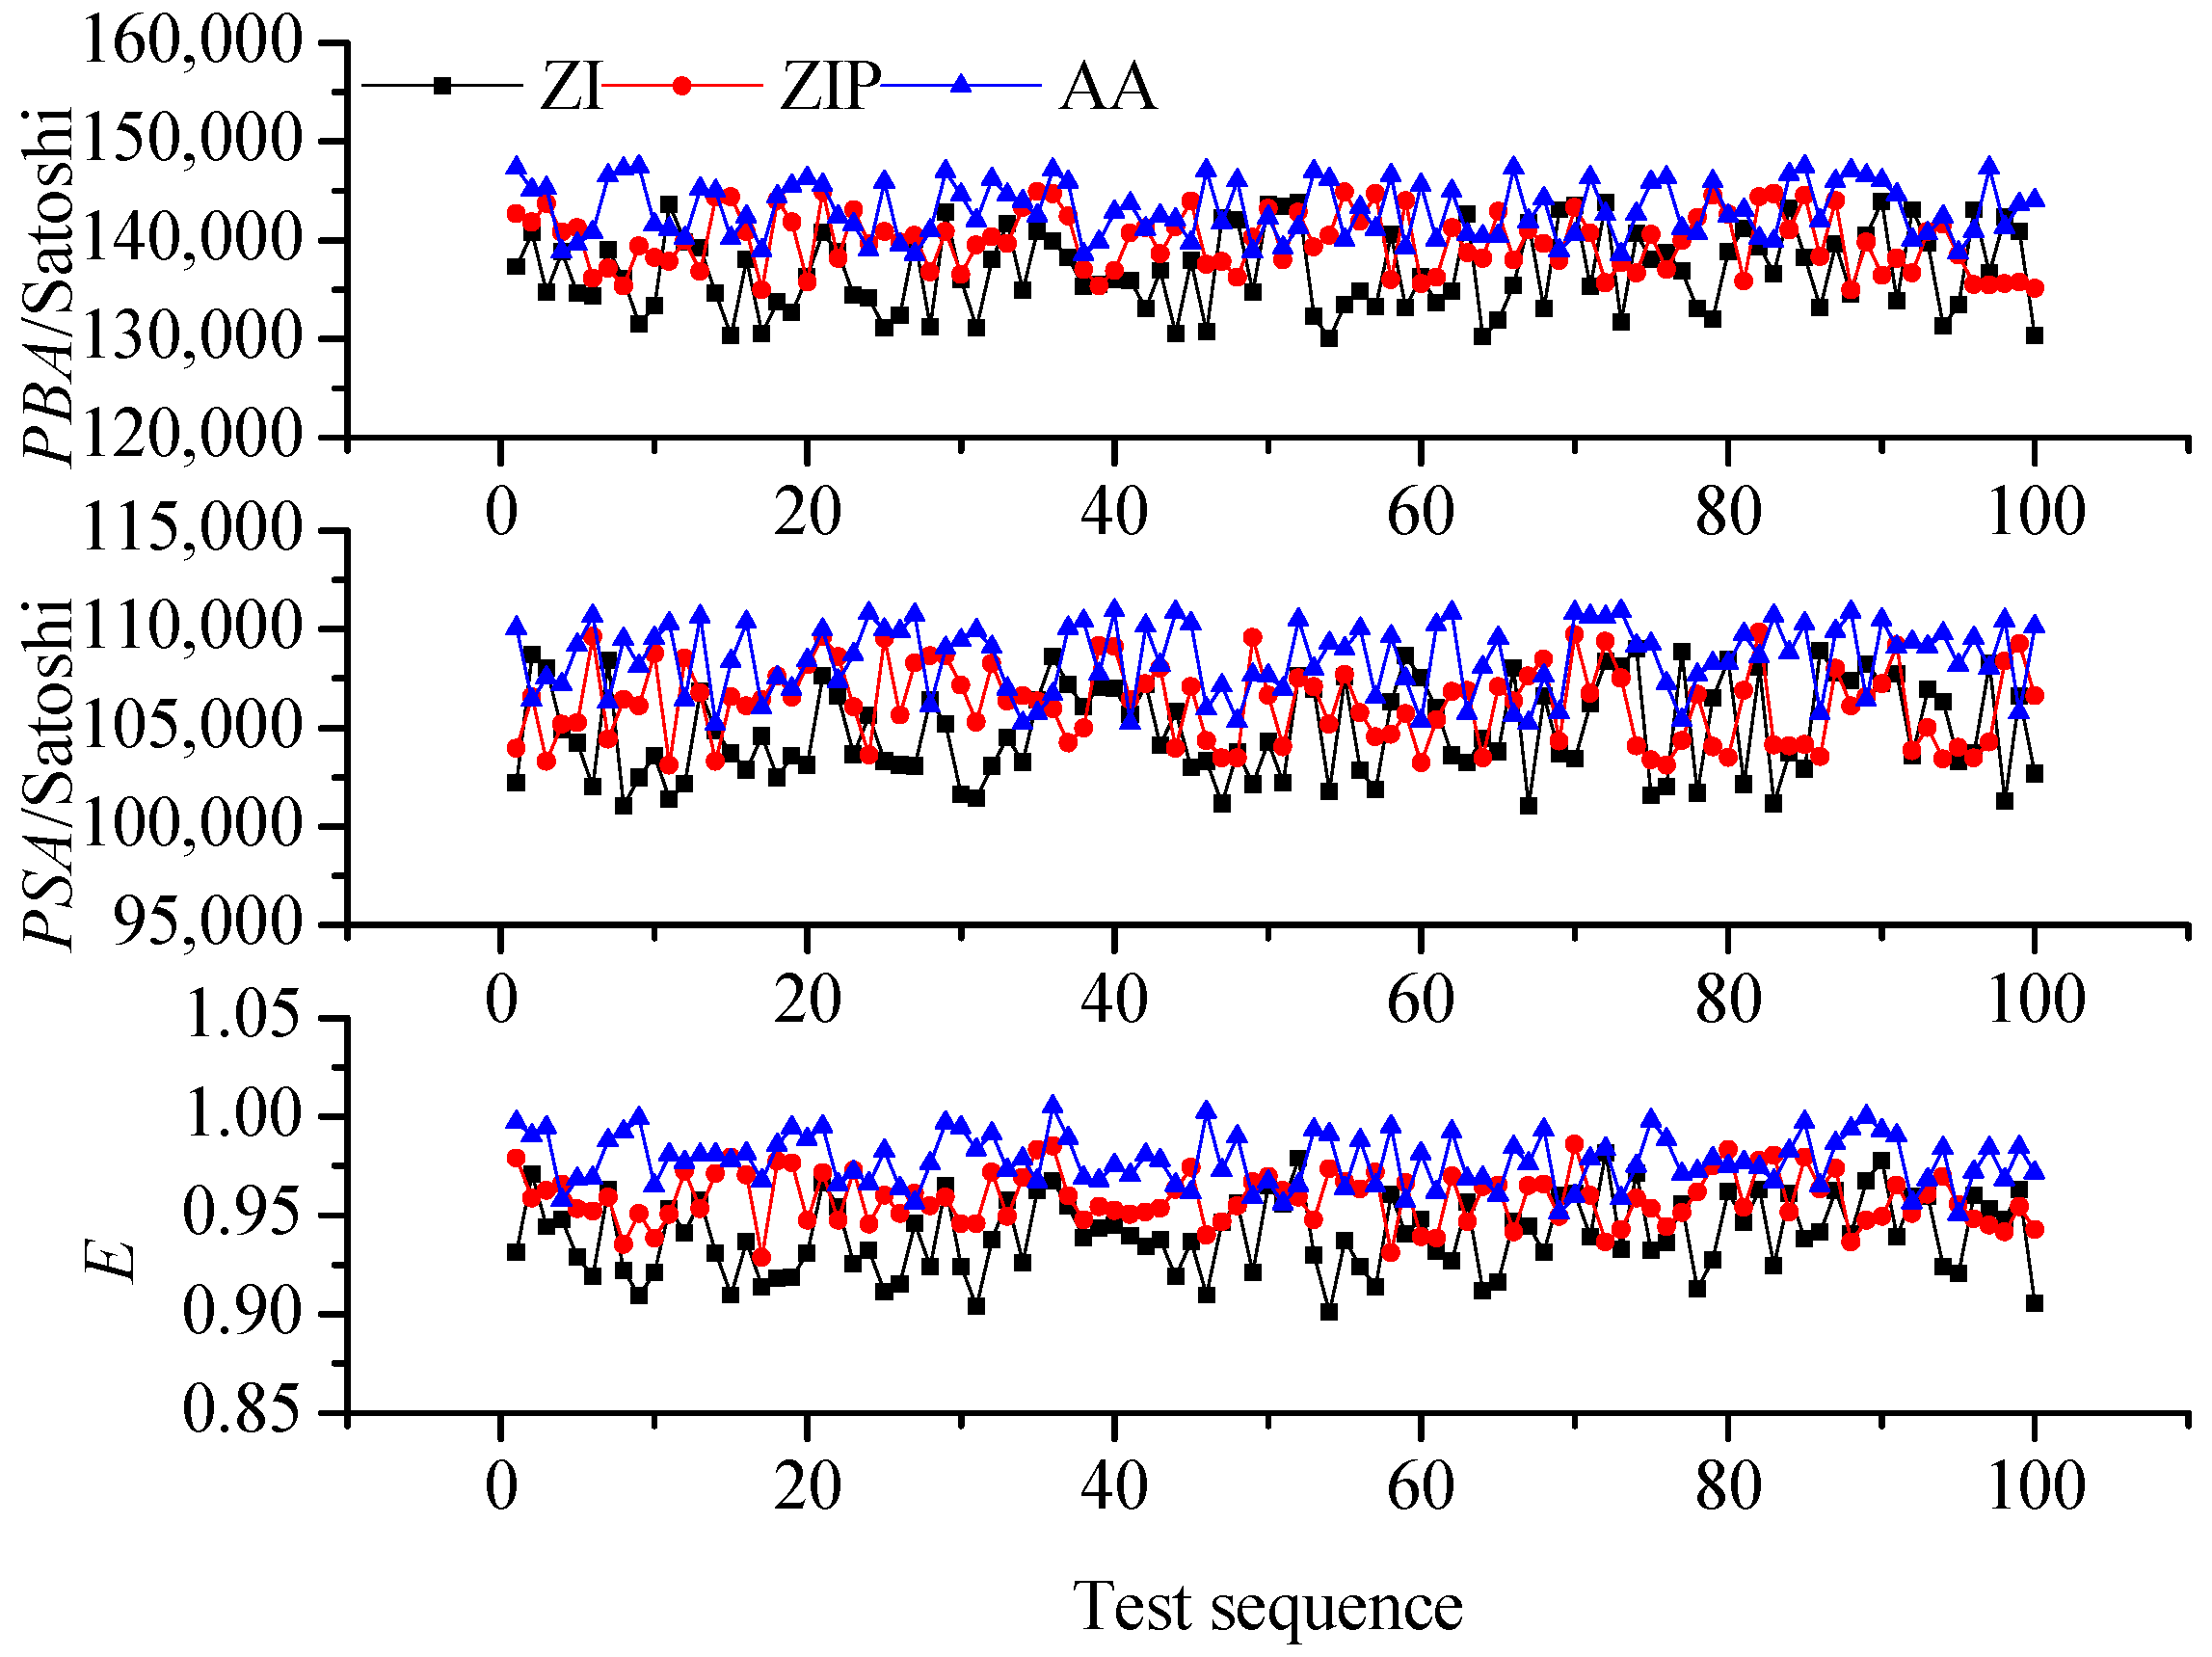
Set Nb = 50 Unit and Ns = 50 Unit for each test, such that the supply and demand curve will remain constant during each test, thereby blocking its influence on the trading strategy. The limit price v of the consumer is obtained randomly from uniform distribution U(8000, 16,000), whereas the cost c of DG is obtained randomly from uniform distribution U(4000, 10000); this process ensures that the sample has certain randomness. Figure 9 shows the change curves of consumer’s profit PBA, DG’s profit PSA, and market efficiency E after 100 tests.
As shown in Figure 9, PBA, PSA, and E vary in different trading strategies. Although the market efficiency can still reach above 0.9, the profits of the buyer and seller are significantly lower in the ZI strategy than those of ZIP and AA strategies because ZI is a stochastic quotation strategy. The ZIP strategy introduces the price adjustment mechanism, which can track the change of market price and adjust the quotes to increase the profits compared with that of the ZI strategy, and the market efficiency is over 0.93. The AA strategy has the highest return and market efficiency (over 0.98) among the three strategies because the AA strategy quotation considers not only the current transaction price but also the market price fluctuations with significant adaptability. Obviously, the AA strategy is a suitable approach.
5.4. Analysis of Settlement Process for Microgrid Electricity Transactions
Consumer and DG make settlements based on transaction volume and price through the blockchain. For Consumer 5 and DG 2, the transaction volume is 3 Unit and the transaction price is 10,500 Satoshi/Unit. Suppose that Consumer 5, DG 2, and the trusted third party in the blockchain are represented by letters A, B, and C, respectively. The settlement process is described as follows.
5.4.1. DG 2 Creates the Transaction of Issuing Energy Coins
After the matching process, DG 2 (replaced by A) creates a transaction of issuing energy coins and sets the transaction type with the last six bits in the serial number as Tag_Tx = 100101. Electricity of 1 Unit costs 100 Satoshi of energy coins. Therefore, DG 2 should issue 300 Satoshi of energy coins. In the bitcoin system, the minimum trading volume is currently 546 Satoshi. Equation (21) shows that Padding ≥ 246 Satoshi. In combination with Equation (23), the minimum padding variable that can satisfy the requirement is Padding = 256 Satoshi. Under this circumstance, the 7–12 bits of the serial number are Padding_N = 0x08 = 001000. Hence, the serial number can be set as Sequence_N = 1000100101 = 0x225. The output bitcoin value is 556 Satoshi. Table 3 shows the transaction of issuing energy coins based on the above results.
5.4.2. Consumer 5 Creates the Transaction of Multi-Signature Transferring Bitcoins
Consumer 5 (replaced by B) sends several bitcoins to A through the blockchain network after communicating with A. To protect property security, B requests the use of multiple signatures and asks third party C, in which both trading parties are believed as the warrantor.
The transaction only takes effect with any two signatures of them. A sends B a multi-signature script redeemScript = OP_2 <pubKeyA> <pubKeyB> <pubKeyC> OP_3OP_CHECKMULTISIG to ensure the inclusion of public keys from the two trading parties. Next, the script hash is operated and encoded into the output script. Consumer 5 pays 31,500 Satoshi to this script hash. The transaction of transferring bitcoins is shown in Table 4.
After Consumer 5 paid the bitcoins, third party C will intervene for arbitration when DG breaks the contract and Consumer 5 and DG cannot reach an agreement on compensation. Suppose C determines that DG 2 should pay 30% refund to Consumer 5 and charges the remaining 70% of bitcoins. After approvals of A and B, C can create a transaction of single-input and double-output arbitration refunds (Table 5). C verifies the transferring transaction of Consumer 5 with its signature and the signature of A or B. Bitcoins are transferred in <Hash160(redeemScript)> to <pubKeyAHash> and <pubKeyBHash> at the ratio of 3:7.
5.4.3. DG 2 Creates the Transaction of Transferring Energy Coins
DG 2 creates the transaction of transferring energy coins to pay 300 Satoshi energy coins to Consumer 5. The process is similar with the issuing process, except for the addition of transferring signs of energy coins in the serial number. After two trading parties create the transaction, the dealing slip is spread over the blockchain network. Each node will receive the transaction information and store it in one block. In public blockchain, each node seeks management right of the block through PoS. The node accomplishes the first informed transactions of the block to the entire network. After the other nodes in the network prove the accuracy of the accounts in the block, this block will be added into the blockchain. Finally, the direct settlement of transactions between DGs and consumers is accomplished.
5.5. Comparison of Different Electricity Transactions Modes
Table 6 shows the comparison of centralized and decentralized microgrid transactions mode. Centralizing microgrid transactions relies on a third-party entity, while decentralized transaction realizes the DGs and consumers P2P trading in microgrid, which suit the decentralized nature of micro-source and load. P2P trading not only realizes local consumption of renewable energy, which avoid long-distance transmission of energy and reduce the loss, but also reduces unnecessary intermediate links, thereby reducing transaction cost. Besides, the data is opaque and has the risk of tampering, and it does not have traceability in the existing centralized data storage mode. Blockchain technology addresses these data security issues through asymmetric encryption, digital signatures, and consensus mechanisms.
6. Conclusions
A direct electricity transaction mode between DGs and consumers in a microgrid based on the combination of blockchain and CDA mechanism is proposed in this study. The proposed mode is verified using a case study. The analysis results are as follows:
- (1)
- The proposed CDA mechanism can be used in microgrid electricity transactions. In this system, two trading parties can adjust quotes dynamically according to market information. Thus, this system can quickly reach the market equilibrium and is suitable for short-time microgrid transactions.
- (2)
- The AA strategy can make adaptive tracing of market information and search the optimal quotes according to transaction prices and price fluctuations. Compared with ZI and ZIP strategies, the AA strategy can aid market participants to obtain considerable profits, and the average market efficiency under this strategy can reach over 0.98.
- (3)
- Considering that the grid power purchase prices of the user are generally higher than the market price and the sale of DG on the grid electricity price is lower than the market price, the forecasting error of load or power generation of renewable energy will inevitably result in economic losses. This condition also indirectly shows that decentralized transactions can increase the revenue of DG and reduce the electricity cost of the consumer in the microgrid.
- (4)
- DGs and consumers realize direct settlement of transactions based on the blockchain. The multi-signature system can protect the benefits of the buyer from breach of contract of the seller, and the unique data structure of the blockchain ensures the security of transaction data.
Acknowledgments
This work was supported by the National Natural Science Foundation of China (51577018).
Author Contributions
Jian Wang and Qianggang Wang contributed to paper writing and the whole revision process. Niancheng Zhou and Jian Wang built the simulation model and analyzed the data. Yuan Chi helped organize the article. All the authors have read and approved the final manuscript.
Conflicts of Interest
The authors declare no conflict of interest.
References
- Shen, B.; Han, Y.; Price, L.; Lu, H.; Liu, M. Techno-economic evaluation of strategies for addressing energy and environmental challenges of industrial boilers in China. Energy 2017, 118, 526–533. [Google Scholar] [CrossRef]
- Lv, T.; Ai, Q. Interactive energy management of networked microgrids-based active distribution system considering large-scale integration of renewable energy resources. Appl. Energy 2016, 163, 408–422. [Google Scholar] [CrossRef]
- WEC. World Energy Issues Monitor 2017—Exposing the New Energy Realities. Available online: https://www.worldenergy.org/wp-content/uploads/2017/04/1.-World-Energy-Issues-Monitor-2017-Full-Report.pdf (accessed on 8 October 2017).
- Lee, W.; Xiang, L.; Schober, R.; Wong, V.W.S. Direct Electricity Trading in Smart Grid: A Coalitional Game Analysis. IEEE J. Sel. Areas Commun. 2014, 32, 1398–1411. [Google Scholar] [CrossRef]
- Vasirani, M.; Ossowski, S. Smart consumer load balancing: State of the art and an empirical evaluation in the Spanish electricity market. Artif. Intell. Rev. 2013, 39, 81–95. [Google Scholar] [CrossRef]
- Kim, B.G.; Ren, S.; Schaar, M.V.D.; Lee, J.W. Bidirectional Energy Trading and Residential Load Scheduling with Electric Vehicles in the Smart Grid. IEEE J. Sel. Areas Commun. 2013, 31, 1219–1234. [Google Scholar] [CrossRef]
- Cui, T.; Wang, Y.; Nazarian, S.; Pedram, M. An electricity trade model for microgrid communities in smart grid. In Proceedings of the Innovative Smart Grid Technologies Conference, Washington, DC, USA, 19–22 February 2014; pp. 1–5. [Google Scholar]
- Mengelkamp, E.; Gärttner, J.; Rock, K.; Kessler, S.; Orsini, L.; Weinhardt, C. Designing microgrid energy markets: A case study: The Brooklyn Microgrid. Appl. Energy 2017. [Google Scholar] [CrossRef]
- Hesmondhalgh, S. Is NETA the blueprint for wholesale electricity trading arrangements of the future? IEEE Trans. Power Syst. 2003, 18, 548–554. [Google Scholar] [CrossRef]
- Roggenkamp, M.M.; Hendriks, R.L.; Ummels, B.C.; Kling, W.L. Market and regulatory aspects of trans-national offshore electricity networks for wind power interconnection. Wind Energy 2010, 13, 483–491. [Google Scholar] [CrossRef]
- Nakamoto, S. Bitcoin: A peer-to-peer electronic cash system. Available online: https://s3.amazonaws.com/academia.edu.documents/32413652/BitCoin_P2P_electronic_cash_system.pdf?AWSAccessKeyId=AKIAIWOWYYGZ2Y53UL3A&Expires=1510887420&Signature=HbogS3BtyAHMacgiw4Q%2BLn4TC8E%3D&response-content-disposition=inline%3B%20filename%3DBitcoin_A_Peer-to-Peer_Electronic_Cash_S.pdf (accessed on 8 October 2017).
- Underwood, S. Blockchain Beyond Bitcoin. Commun. ACM 2016, 59, 15–17. [Google Scholar] [CrossRef]
- Blockchain: Putting Theory into Practice. Available online: http://www.businessinsider.com/goldman-blockchain-beyond-the-hype-practical-uses-2016-5/#sharing-economy-building-trust-on-platforms-like-airbnb-1 (accessed on 8 October 2017).
- Sikorski, J.J.; Haughton, J.; Kraft, M. Blockchain technology in the chemical industry: Machine-to-machine electricity market. Appl. Energy 2017, 195, 234–246. [Google Scholar] [CrossRef]
- Nurzhan, Z.A.; Davor, S. Security and Privacy in Decentralized Energy Trading through Multi-Signatures, Blockchain and Anonymous Messaging Streams. IEEE Trans. Dependable Secur. Comput. 2016. [Google Scholar] [CrossRef]
- Iosifidis, G.; Koutsopoulos, I. Double auction mechanisms for resource allocation in autonomous networks. IEEE J. Sel. Areas Commun. 2009, 28, 95–102. [Google Scholar] [CrossRef]
- Wurman, P.R.; Walsh, W.E.; Wellman, M.P. Flexible Double Auctions for Electronic Commerce: Theory and Implementation. Decis. Support Syst. 1998, 24, 17–27. [Google Scholar] [CrossRef]
- Chaggar, S.; Noble, J.; Cliff, D. The effects of periodic and continuous market environments on the performance of trading agents. In Artificial Life XI: Proceedings of the Eleventh International Conference on the Simulation and Synthesis of Living Systems, Winchester, UK, 5–8 August 2008; MIT Press: Cambridge, MA, USA, 2008; pp. 110–117. [Google Scholar]
- Izakian, H.; Abraham, A.; Ladani, B.T. An auction method for resource allocation in computational grids. Future Gener. Comput. Syst. 2010, 26, 228–235. [Google Scholar] [CrossRef]
- Charlish, A.; Woodbridge, K.; Griffiths, H. Phased array radar resource management using continuous double auction. IEEE Trans. Aerosp. Electron. Syst. 2015, 51, 2212–2224. [Google Scholar] [CrossRef]
- Li, Y.; Zhang, W.; Zhang, Y.; Zhang, X.; Xiong, X. Calibration of the agent-based continuous double auction stock market by scaling analysis. Inf. Sci. 2014, 256, 46–56. [Google Scholar] [CrossRef]
- Aloud, M.; Fasli, M. Exploring Trading Strategies and their Effects in the Foreign Exchange Market. Comput. Intell. 2016, 33, 280–307. [Google Scholar] [CrossRef]
- Cliff, D. ZIP60: Further explorations in the evolutionary design of trader agents and online auction-market mechanisms. IEEE Trans. Evol. Comput. 2009, 13, 3–18. [Google Scholar] [CrossRef]
- Vytelingum, P. The Structure and Behaviour of the Continuous Double Auction. Ph.D. Thesis, University of Southampton, Southampton, UK, December 2006. [Google Scholar]
- Kondratieva, V.; Seo, S.W. Optimized Hash Tree for Authentication in Sensor Networks. IEEE Commun. Lett. 2006, 11, 149–151. [Google Scholar] [CrossRef]
- Roussel-Huchettea, S.; Hemswortha, P.H.; Boissyb, A.; Duvaux-Ponterc, C. Customer Perspectives on E-business Value: Case Study on Internet Banking. J. Internet Bank. Commer. 2010, 15, 1–13. [Google Scholar]
- Bitcoin Developer Guide. Available online: https://bitcoin.org/en/developer-guide#block-chain-overview (accessed on 8 October 2017).
- Vytelingum, P.; Ramchurn, S.D.; Voice, T.D.; Rogers, A.; Jennings, N.R. Trading agents for the smart electricity grid. In Proceedings of the International Conference on Autonomous Agents & Multiagent Systems, Toronto, ON, Canada, 10–14 May 2010; pp. 897–904. [Google Scholar]
- Houy, N. It Will Cost You Nothing to ‘Kill’ a Proof-of-Stake Crypto-Currency; Social Science Electronic Publishing: Rochester, NY, USA, 2014; p. 34. [Google Scholar]
- Krovvidi, S.S. Competitive Microgrid Electricity Market Design. Ph.D. Thesis, Virginia Polytechnic Institute and State University, Arlington, VA, USA, 5 May 2010. [Google Scholar]
- Ji, Z.; Jing, P.; Su, Y.; Pang, Y. Rank canonical correlation analysis and its application in visual search reranking. Signal Process. 2013, 93, 2352–2360. [Google Scholar] [CrossRef]
- Colored Coins. Available online: https://en.bitcoin.it/wiki/Colored_Coins (accessed on 8 October 2017).
- EPOBC_simple. Available online: https://github.com/chromaway/ngcccbase/wiki/EPOBC_simple (accessed on 8 October 2017).
- Nicolaisen, J.; Petrov, V.; Tesfatsion, L. Market power and efficiency in a computational electricity market with discriminatory double-auction pricing. IEEE Trans. Evol. Comput. 2001, 5, 504–523. [Google Scholar] [CrossRef]
Figure 1.
Blockchain structure.
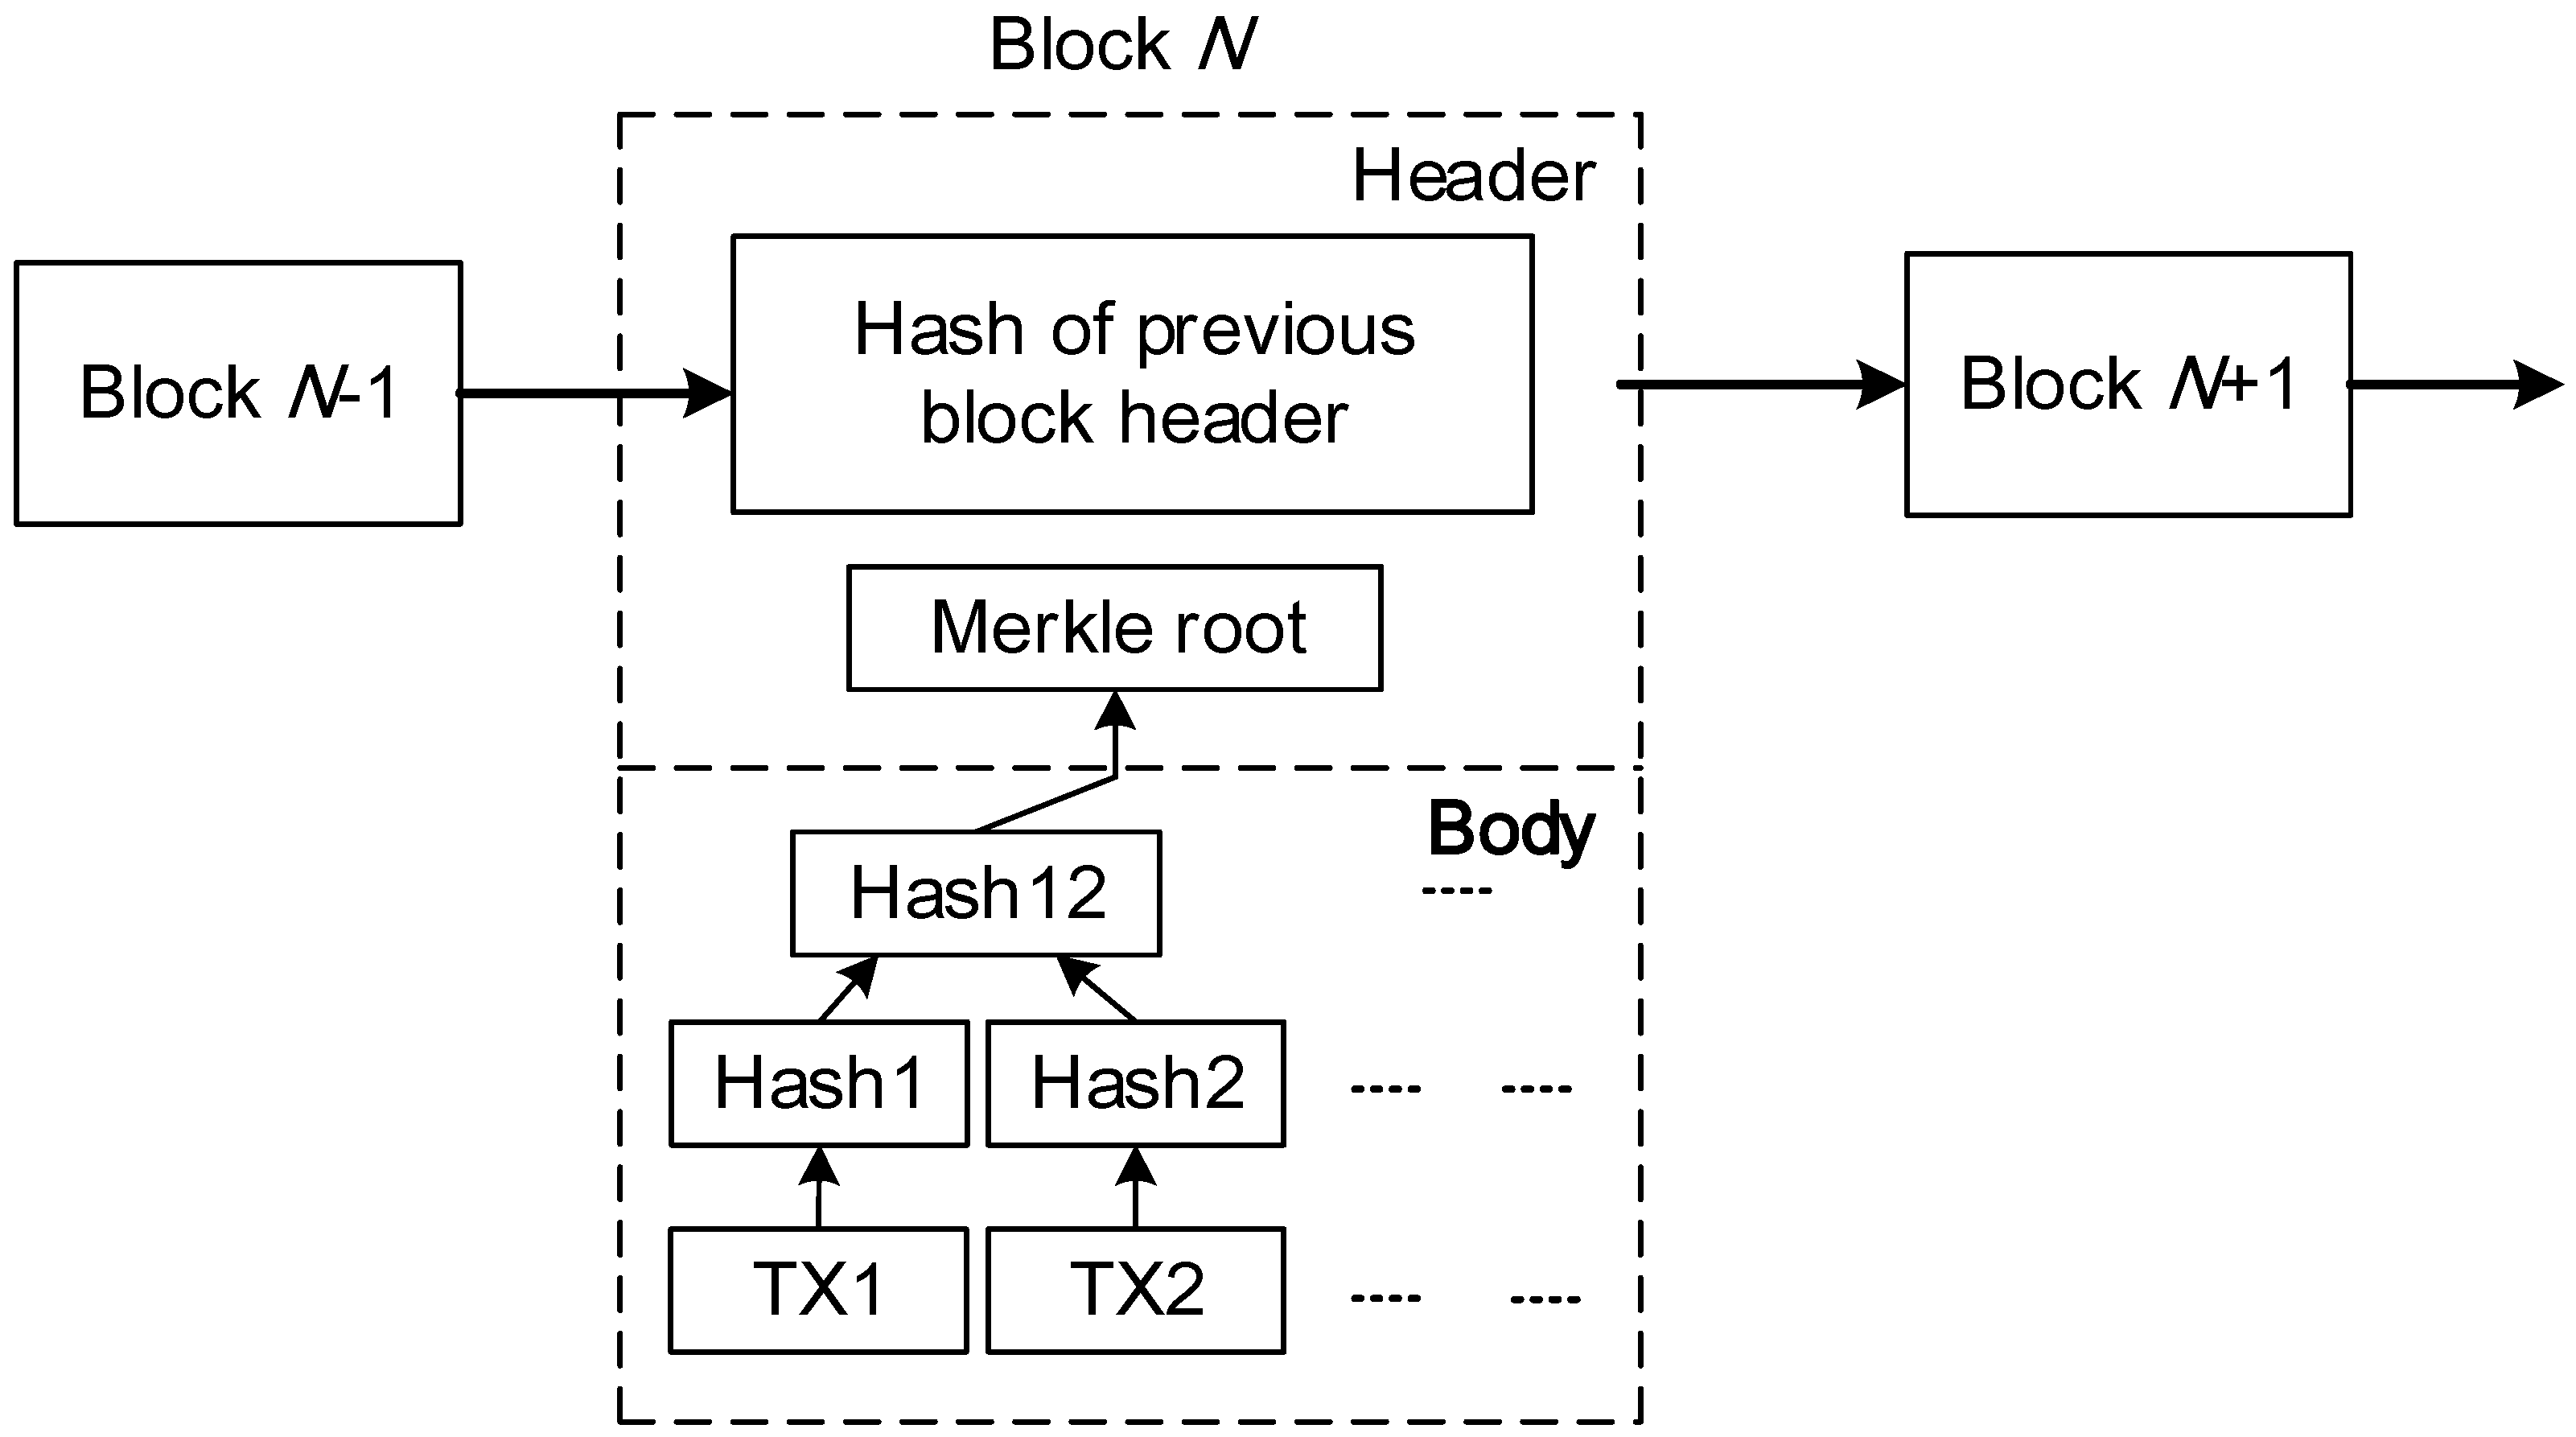
Figure 2.
Script execution process.

Figure 3.
Order book in the CDA market. (a) order book before clearing (shaded area represents that the buyer and seller can match); (b) order book after clearing.
Figure 3.
Order book in the CDA market. (a) order book before clearing (shaded area represents that the buyer and seller can match); (b) order book after clearing.

Figure 4.
Overall structure of microgrid electricity transactions.

Figure 5.
Schematic of AA strategy.

Figure 6.
Relationship curve between target price and aggressiveness degree. (a) intra-marginal; (b) extra-marginal.
Figure 6.
Relationship curve between target price and aggressiveness degree. (a) intra-marginal; (b) extra-marginal.

Figure 7.
Variation curves of transaction price and volume in a transaction period.
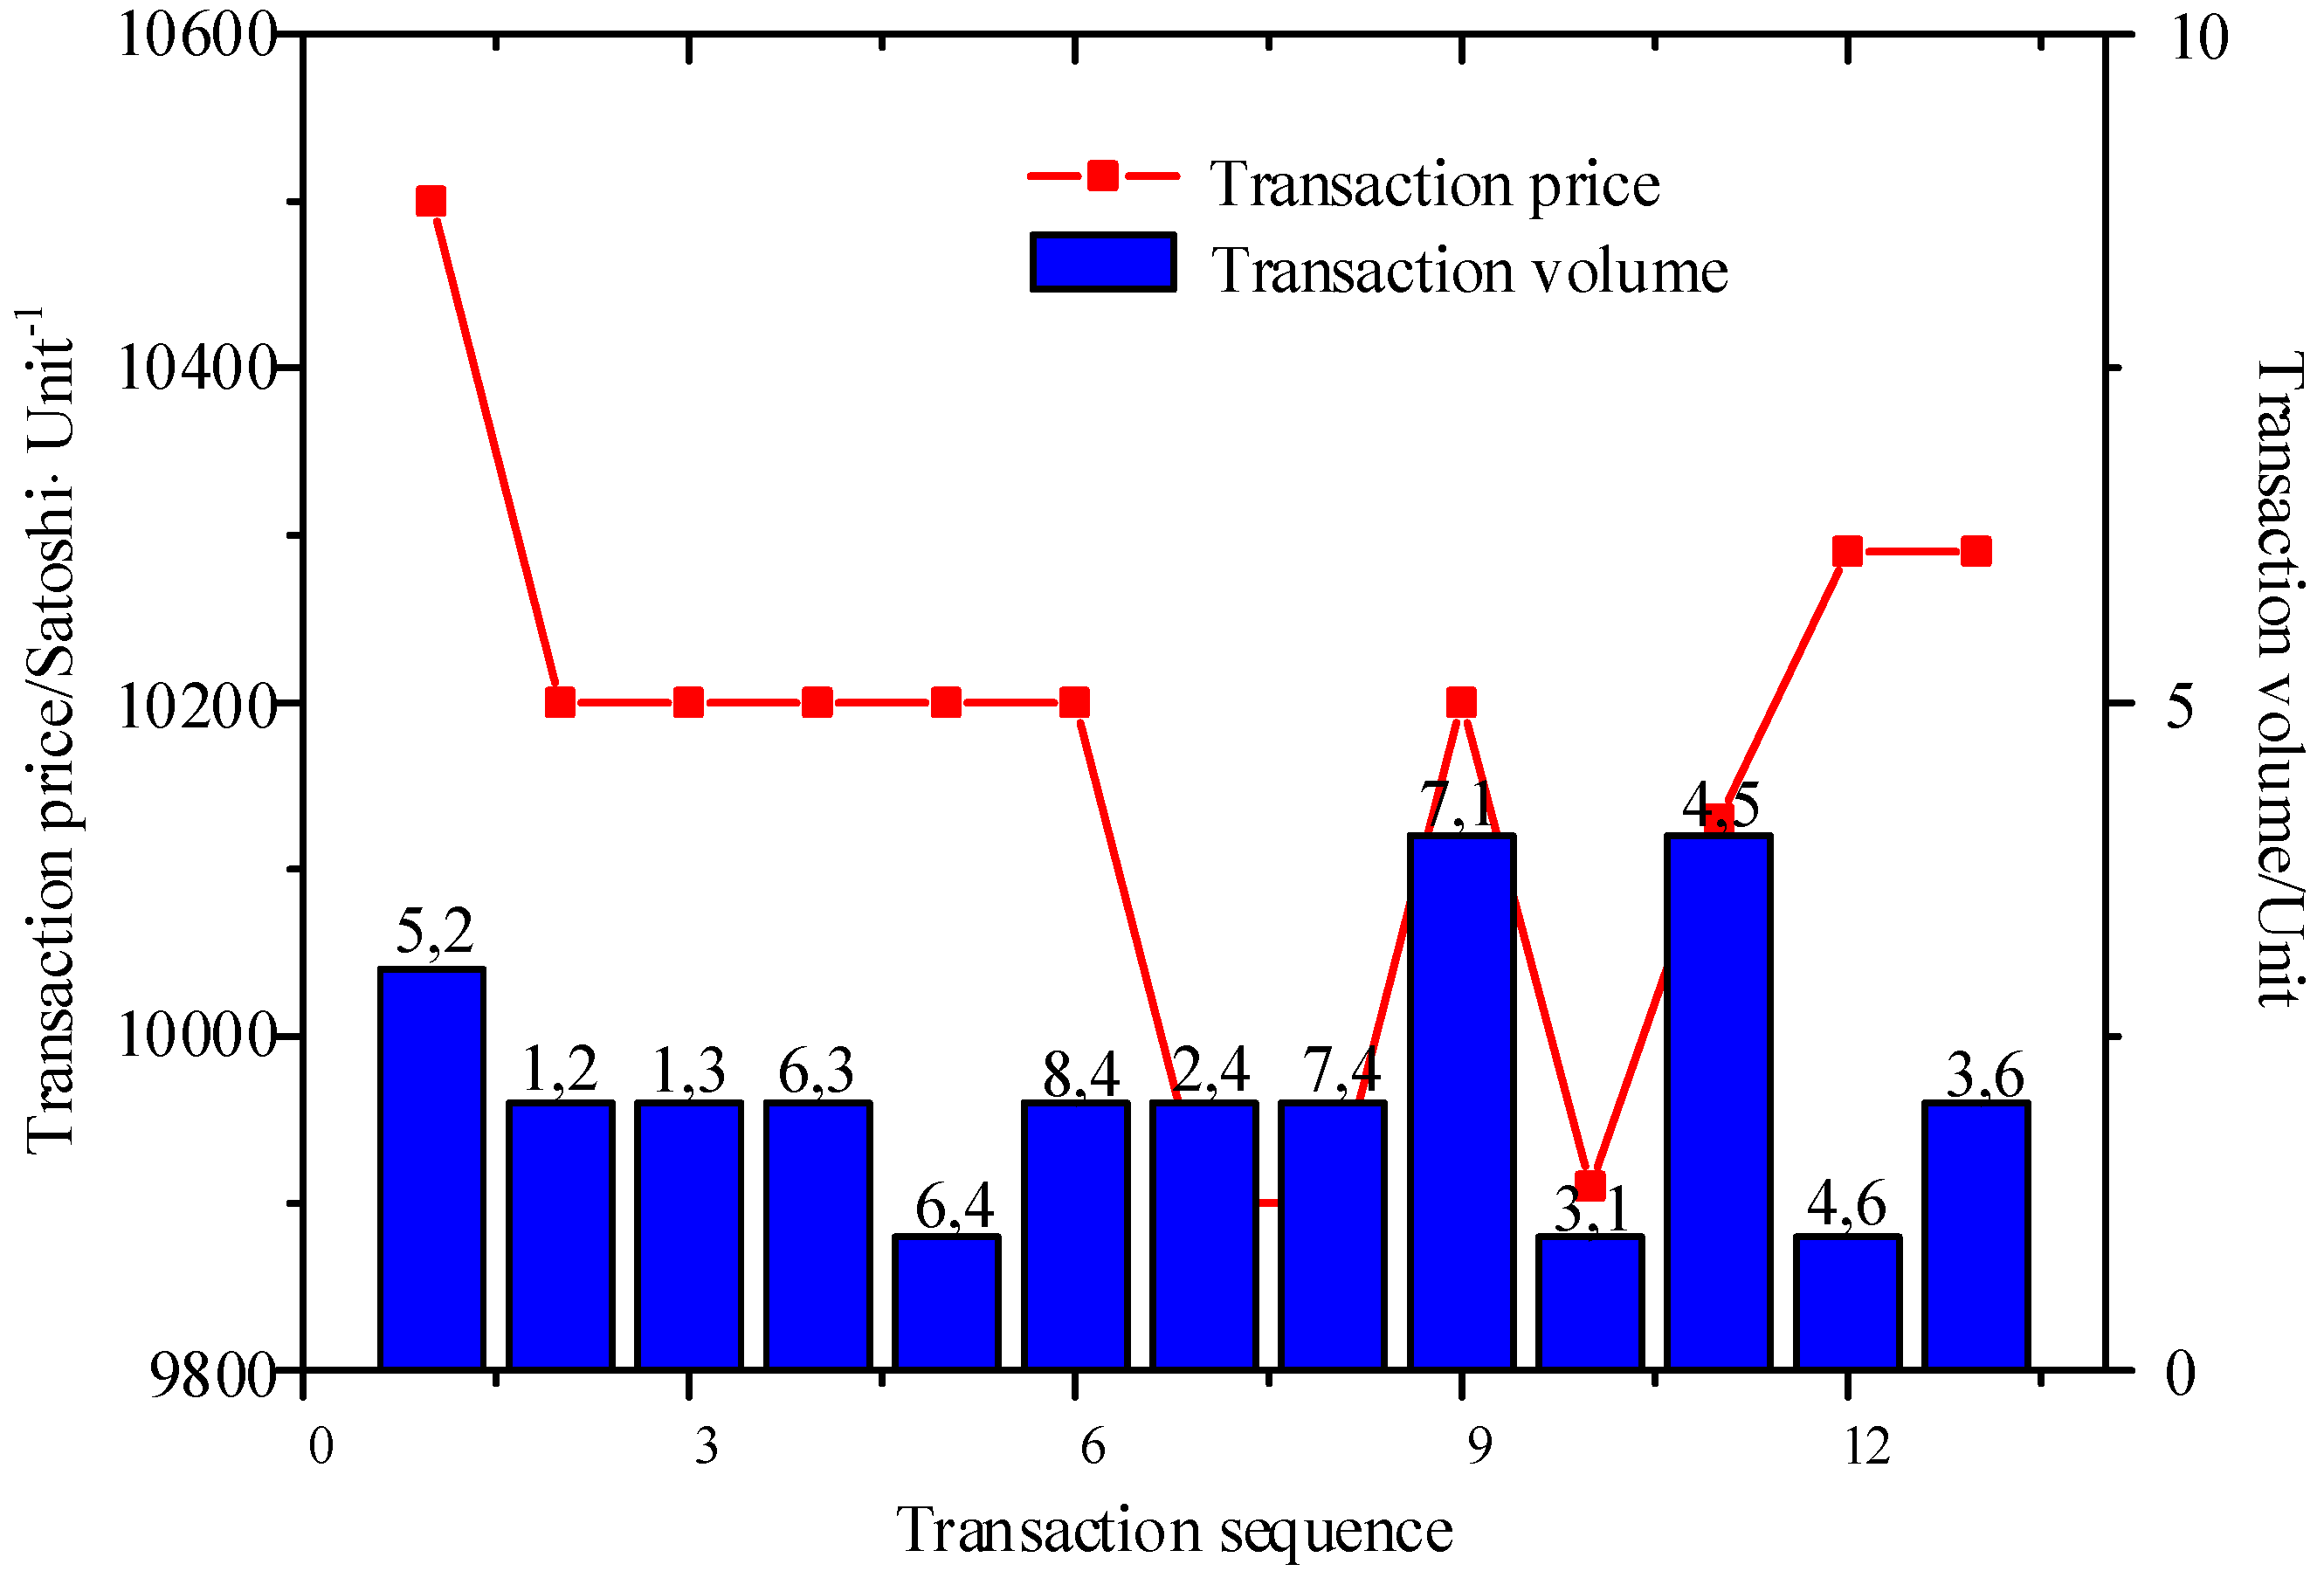
Figure 8.
CEP and short- and long-term learning outcomes. (a) CEP estimation; (b) short-term learning outcome; (c) long-term learning outcome.
Figure 8.
CEP and short- and long-term learning outcomes. (a) CEP estimation; (b) short-term learning outcome; (c) long-term learning outcome.
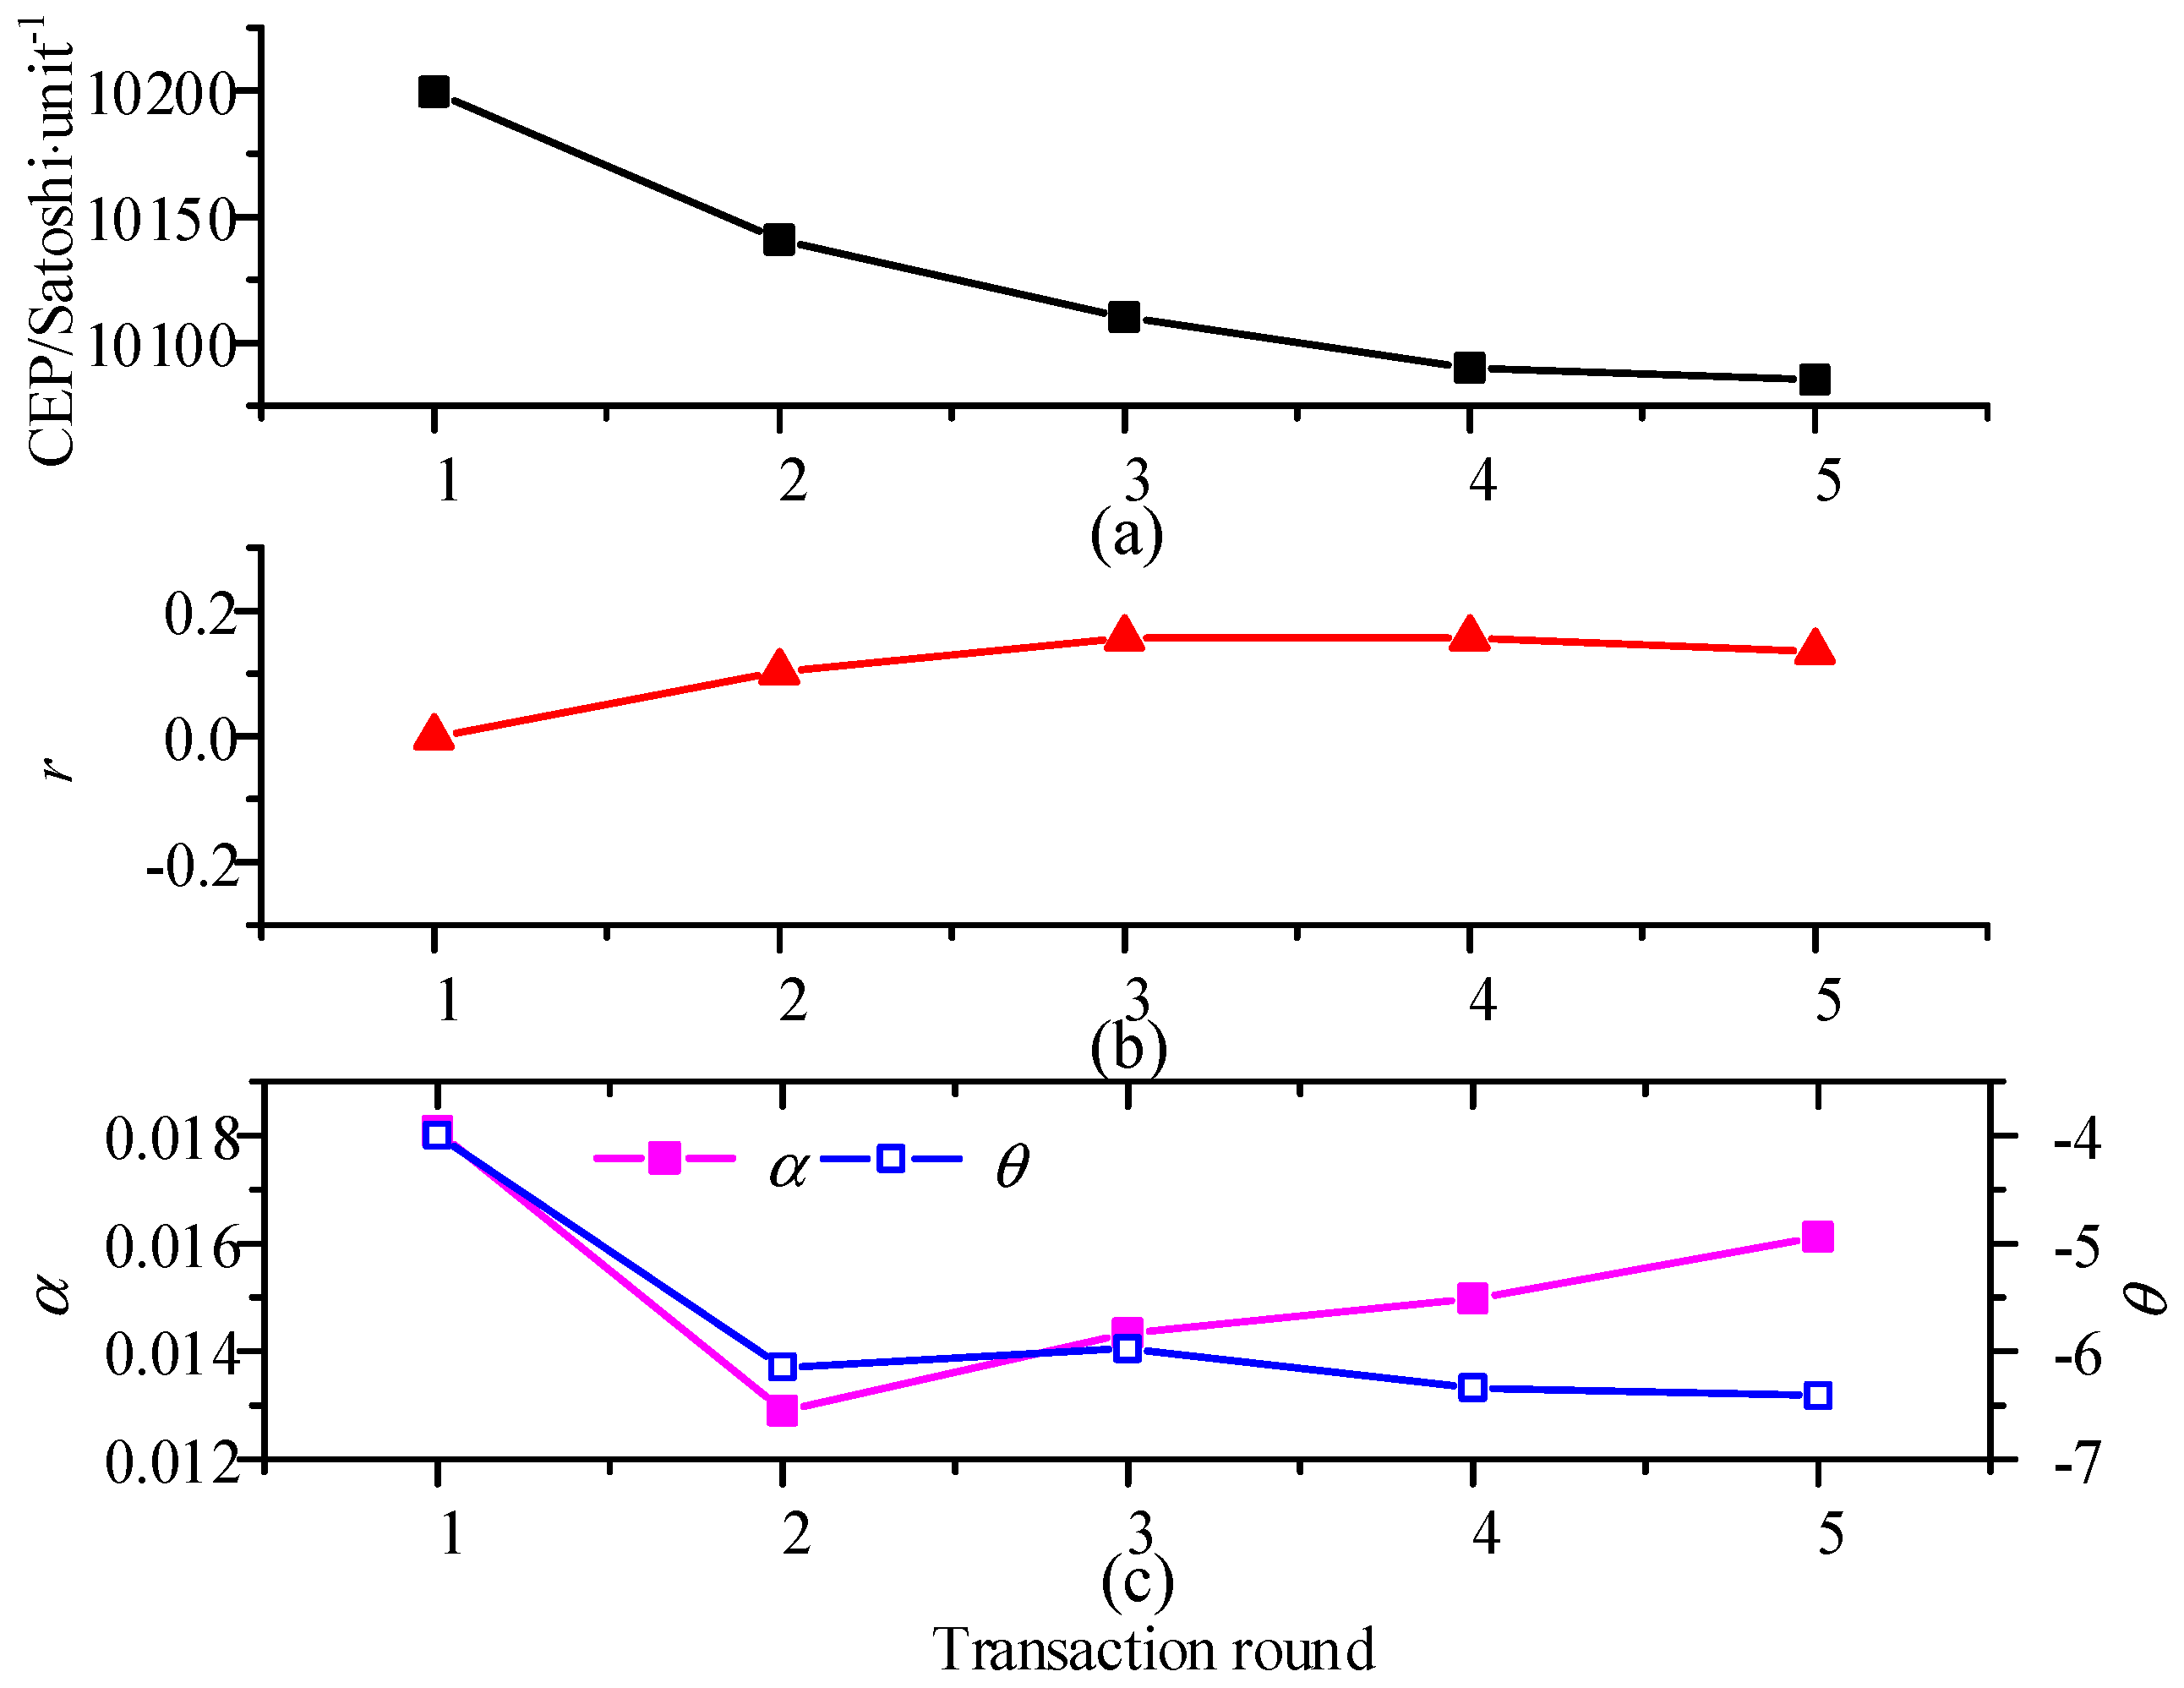
Figure 9.
PBA, PSA, and E of different trading strategies.

Table 1.
Transaction parameters of consumers and DGs.
| Type | Transaction Volume/Unit | MIN/Satoshi Unit−1 | v/Satoshi Unit−1 |
| Consumer 1 | 4 | 5000 | 15,000 |
| Consumer 2 | 2 | 5000 | 14,000 |
| Consumer 3 | 3 | 5000 | 13,000 |
| Consumer 4 | 5 | 5000 | 13,000 |
| Consumer 5 | 3 | 5000 | 16,000 |
| Consumer 6 | 3 | 5000 | 15,000 |
| Consumer 7 | 6 | 5000 | 14,000 |
| Consumer 8 | 2 | 5000 | 15,000 |
| Type | Transaction Volume/Unit | c/Satoshi Unit−1 | MAX/Satoshi Unit−1 |
| DG 1 | 5 | 6000 | 16,000 |
| DG 2 | 5 | 4500 | 16,000 |
| DG 3 | 4 | 4000 | 16,000 |
| DG 4 | 7 | 5000 | 16,000 |
| DG 5 | 4 | 6500 | 16,000 |
| DG 6 | 5 | 8000 | 16,000 |
Note: Unit is the transaction unit, 1 Unit = 10 kWh. Satoshi is the minimum unit of bitcoins (it can be replaced by other digital currencies in microgrid electricity transactions).
Table 2.
Expected and actual cost or revenue of trading parties when prediction error is considered.
Table 2.
Expected and actual cost or revenue of trading parties when prediction error is considered.
| Type | ΔW/Unit | /Satoshi Unit−1 | Fexpected/Satoshi | Factual/Satoshi | Economic Loss/Satoshi |
| Consumer | −1 | 10,200 | 30,600 | 40,800 | 10,200 |
| 1 | 10,200 | 51,000 | 58,800 | 7800 | |
| Type | ΔQ/Unit | /Satoshi Unit−1 | Gexpected/Satoshi | Gactual/Satoshi | Economic loss/Satoshi |
| DG | −1 | 10,055 | 40,220 | 32,275 | 7945 |
| 1 | 10,055 | 60,330 | 56,275 | 4055 |
Table 3.
Transaction of issuing energy coins.
| Input | Prev_Tx hash1//hash of previous transaction Vout: 0//UTXO scriptSig: <A sig>, <pubKeyA>//input script Sequence_N: 0x225//serial number |
| Output | Value: 556//output bitcoin value scriptPubKey: OP_DUP OP_HASH160 <pubKeyAHash> OP_EQUALVERIFY OP_CHECKSIG//output script |
| Process | (1) Acquire hash of previous unspent transaction “Prev_Tx hash1” and output of the current transaction “Vout”; (2) Execute script by stack language in Figure 2 to verify UTXO; (3) If the script execution fails, then terminate the transaction. Otherwise, proceed to Step 4); (4) Determine the transaction type: Tag_Tx = Sequence_N&0x3F =0x25 is the transaction of issuing energy coins; (5) Calculate: Padding_N = Sequence_N&0x0FC0 = 0x08 = 8; (6) Calculate Padding = 28 = 256; (7) Transfer 556 Satoshi to <pubKeyAHash>; (8) Determine quantity of energy coins: Ve = Value−Padding = 300 Satoshi; (9) Conclude the transaction. |
Table 4.
Transaction of transferring bitcoins.
| Input | Prev_Tx hash2//hash of previous transaction Vout: 0//output of the previous transaction scriptSig: <B sig>, <pubKeyB>//input script Sequence_N: 0xFFFFFFFF//serial number |
| Output | Value: 31,500//output bitcoins scriptPubKey: OP_HASH160 <Hash160(redeemScript)> OP_EQUAL//output script |
| Process | (1) Acquire hash of previous unspent transaction “Prev_Tx hash2” and output of the current transaction “Vout”; (2) Execute script by stack language in Figure 2 to verify whether the previous transaction output has been spent; (3) If the script execution fails, then terminate the transaction. Otherwise, proceed to Step 4); (4) Determine the transaction type: Sequence_N = 0xFFFFFFFF is the transcription of transferring bitcoins; (5) Transfer 31,500 Satoshi to <Hash160(redeemScript)>; (6) Conclude the transaction. |
Table 5.
Transaction of arbitration refund.
| Input | Pre_Tx hash3//hash of previous transaction Vout: 0//output of the previous transaction scriptSig: OP_0 <A sig or B sig> <C sig> <redeemScript>//multi-signature input script Sequence_N: 0xFFFFFFFF//serial number |
| Output | {Value1: 9450//bitcoins transferred to DG 2 scriptPubKey: OP_DUP OP_HASH160 <pubKeyAHash> OP_EQUALVERIFY OP_CHECKSIG//output script} {Value2: 22050//bitcoins transferred to Consumer 5 scriptPubKey: OP_DUP OP_HASH160 <pubKeyBHash> OP_EQUALVERIFY OP_CHECKSIG////output script} |
| Process | (1) Acquire hash that B transferred to “Hash160(redeemScript) Prev_Tx hash3” and output of the current transaction “Vout”; (2) Execute P2SH script by stack language and verify whether the transaction output has been spent by multi-signature script; (3) If the script execution fails, then terminate the transaction. Otherwise, proceed to Step 4); (4) Determine the transaction type: Sequence_N = 0xFFFFFFFF is the transaction of transferring bitcoins; (5) Transfer 9450 Satoshi to <pubKeyAHash>; (6) Transfer 22,050 Satoshi to <pubKeyBHash>; (7) Conclude the transaction. |
Table 6.
Comparison of traditional transactions mode and decentralized transactions mode of proposed method.
Table 6.
Comparison of traditional transactions mode and decentralized transactions mode of proposed method.
| Type | Traditional Transactions Mode | Decentralized Transactions Mode of Proposed Method |
|---|---|---|
| Transaction form | To complete the transaction by the third party | P2P |
| Energy loss | High | Low |
| Transaction cost | High | Low |
| Data storage | Centralized database | Decentralized database |
| Data security | Opaque data, Risk of tampering, Untraceable | Transparent, Non-tampering, Traceable |
© 2017 by the authors. Licensee MDPI, Basel, Switzerland. This article is an open access article distributed under the terms and conditions of the Creative Commons Attribution (CC BY) license (http://creativecommons.org/licenses/by/4.0/).
Share and Cite
MDPI and ACS Style
Wang, J.; Wang, Q.; Zhou, N.; Chi, Y. A Novel Electricity Transaction Mode of Microgrids Based on Blockchain and Continuous Double Auction. Energies 2017, 10, 1971. https://doi.org/10.3390/en10121971
AMA Style
Wang J, Wang Q, Zhou N, Chi Y. A Novel Electricity Transaction Mode of Microgrids Based on Blockchain and Continuous Double Auction. Energies. 2017; 10(12):1971. https://doi.org/10.3390/en10121971
Chicago/Turabian StyleWang, Jian, Qianggang Wang, Niancheng Zhou, and Yuan Chi. 2017. "A Novel Electricity Transaction Mode of Microgrids Based on Blockchain and Continuous Double Auction" Energies 10, no. 12: 1971. https://doi.org/10.3390/en10121971
Note that from the first issue of 2016, this journal uses article numbers instead of page numbers. See further details here.