Market Analysis during the First Year of Korea Emission Trading Scheme


1
Energy Institute, Seoul Energy Corporation, 20, Mokdongseo-ro, Yangcheon-gu, Seoul 07978, Korea
2
Department of Economics, Hongik University 94, Wausan-ro, Mapogu, Seoul 121-791, Korea
*
Author to whom correspondence should be addressed.
Energies 2017, 10(12), 1974; https://doi.org/10.3390/en10121974
Submission received: 19 October 2017
/
Revised: 17 November 2017
/
Accepted: 23 November 2017
/
Published: 28 November 2017
(This article belongs to the Special Issue Lessons from the Evaluation of Existing Emission Trading Schemes)
Abstract
:To derive the supply and demand issues during the first phase of the Korea Emission Trading Scheme (KETS), we investigated the excess or shortage, and the carry-over inflow of carbon emission permits for all of the domestic industries and major corporations. In particular, this study explored the supply and future prospects of offset credits, as well as the allocated permits, by forecasting the inflows of offset credits using the amount of certified reduction in domestic boundaries and overseas sources. We observed both the supply and demand of permits and changes in carbon dioxide (CO2) emission levels during the first phase (2015–2017) by comparing the estimated emission levels and the total permit supply. The results showed that permits were either in surplus or insufficient, depending on the sub-sector, and that a surplus in the supply of permits would occur if companies do not carry over more than 70 million tons of permits to the next period.
1. Introduction
The Emission Trading Scheme (ETS) is a market-based greenhouse gas (GHG) reduction regulatory system, as defined by Article 17 of the Kyoto Protocol. The ETS allocates the tradable emission permits to companies, which is subject to the allocation of emission permits based on GHG emissions standards, and allows them to trade any excess or shortage of permits with other companies. To attain the cost-effective achievement of the national GHG reduction target, and to establish GHG reduction policies that are consistent with global trends, the Korean government enacted “the Act on the Allocation and Trading of Greenhouse Gas Emission Permits” in May 2012. In 2014, the Korean government established the ETS basic plan and formulated the First National Emission Permit Allocation Plan. The Ministry of Environment allocated approximately 1598 million Korea allowance units (KAUs) to 525 companies for the first compliance year in 2015 [1]. The true-ups for credits, during the first compliance year of the first phase, were completed in August 2016 and ETS has entered its third compliance year in 2017, operating for 599 allocated companies.
Significant research in environmental economics has been conducted in relation to carbon emissions [2,3,4,5,6]. Studies on the carbon trading market have been actively conducted, and most existing literature on ETS focused on the European Union (EU) [7,8,9]. Korea Emissions Trading Scheme (KETS) was the second largest national carbon trading scheme in the world before China launched its national ETS. While the EU ETS was established in 2005, the KETS, launched in 2015, has not been the focus of many studies.
Most research conducted before KETS was established focused on the feasibility of introducing the program. Kang et al. [10] studied the status of the carbon credit markets in different countries, arguing that sufficient facilities and legal infrastructure would be required to manage emission trading, and that the government should create a gradual and incentive-based voluntary emission trading market when considering domestic circumstances. Lho et al. [11] explored the current operations of the carbon emission trading market in other countries, and suggested future strategies for the establishment and long-term direction of KETS, arguing that to implement ETS in Korea, the supporting legal system and infrastructure for its management should be prepared. Lho et al. [11] also asserted that KETS should be linked to the carbon trading markets in other countries. By using an optimization model, Han et al. [12] explored the effects of the ETS introduction on domestic industries and various macroeconomic variables, such as gross domestic product (GDP), employment, and exports. They analyzed the effects of introducing ETS on the actual production costs of each industry, assuming that the distributed emission permits were either 100% or 50% free. Park et al. [13] analyzed the current KETS framework and discussed policy design issues for achieving the cost-efficient reduction of CO2 emission levels with the emission trading system. Additionally, several recommendations were proposed for identified issues with allowance allocation, allowance reserve, and market stabilization measures.
Since the introduction of KETS in 2015, studies on its present status of operations and its future development have been conducted. Chae et al. [14] provided overall information about KETS and compared it with the ETS of other countries, especially with the operation and the development strategy of the EU-ETS. They stated that the Korean government’s efforts to initiate the carbon offsetting system, and promote small- and medium-sized enterprises’ (SMEs) participation, were important to further improve KETS. A 2017 report of the Ministry of Strategy and Finance showed the current status of KETS. The report presented the trends of permit transition volumes and the prices during the first phase (2015–2017) and analyzed the economic impacts of KETS, suggesting government policies for achieving the GHG reduction target and minimizing the negative impacts on economic growth and employment. Yu et al. [15] investigated the relationship between GHG emissions and the corporate social responsibility (CSR) index with ETS emissions data. Research studies have also been conducted on KETS issues. Etienne et al. [16] performed a representative analysis of the current trading liquidity problem in KETS, through exploring the cause of the inverse price relationship between offset credit and carbon allowances.
The aim of this study was to analyze KETS’ present issues and to estimate the surplus or inefficiency in the emission permit scheme. To solve the current problems that are faced by KETS, such as trading liquidity and oversupply, and to further develop the system, an analysis of the current KETS framework and forecasting the supply and demand of emission permits should be preferentially conducted. However, no studies have yet estimated the supply and demand of emission permits with a focus on KETS. Our study differs from the previous literature in being the first study to analyze the future outlook of KETS. Because of the short history of KETS, insufficient data related to the scheme exist, such as the number of permits or price of credits, for quantitative analysis. Instead, we adopted a qualitative method by observing potential supply and demand mismatches with available cross-sectional data analysis. Particularly, we estimated the supply and demand of emission permits during the entire first compliance period (2015–2017) based on the CO2 emission levels and the number of emission permits in 2015. In this paper, we observed the actual CO2 emission levels in the first compliance year and estimated the maximum and minimum emission levels by conducting a sensitivity analysis. Then, we estimated the surplus or deficit of emission permits during the first phase by comparing the estimated emission levels and the permit supply. Annual emission level data were obtained from the Greenhouse Gas Inventory and Research (GIR) Center. The emission permits annual data were obtained from the Electric Power Information Center (EPIC) and Korea Environment Corporation (KECO).
The prediction of trends in emissions and emission permits plays an important role in accurately analyzing KETS and suggesting policies and strategies for further development. Furthermore, we explored the supply and demand of emission permits by sub-sector (steel, power generation, paper, etc.), because the supply-demand imbalances in a certain sector could have a significant impact on its profitability. This analysis will help policymakers to understand the implications of predicting market imbalance due to excess or insufficient permits in the market, and thus our study will contribute to the guidance on stabilizing KETS to develop the system.
The remainder of this paper is organized as follows. Section 2 describes the forecasting of emissions permits during the first compliance period. Section 3 analyzes the status of reduction projects outside KETS and offset credit issues. Section 4 concludes the paper by suggesting policy implications.
2. Forecasts of Emission Permits during the First Phase
Table 1 shows the emission permit excess and shortage analysis results for companies with the allocated emission permits in the first compliance year (2015). The companies’ total emissions in 2015 were 543 million tons, whereas the quantity of pre-allocated free allowances was 539 million tons, resulting in a shortage of approximately 29 million tons. When considering an additional allocation of allowances and inflows of the offset credits, Table 1 shows that the total amount of emission permits had a surplus of approximately 6 million tons compared to actual GHG emission levels.
In addition, we verified whether the excess or shortage of emission permits by sector arose due to differences in the pre-allocated adjustment coefficient. For example, the adjustment coefficient in the first phase of the power plant and energy sector, that emits the most GHGs among all of the industrial sectors in Korea, was 0.73, meaning that permits allocated to the power plant and energy sector only covered 73% of its certified emissions. Due to this shortage in the allocation of permits, the power plant and energy sector had difficulty meeting the reduction obligation under ETS. On the other hand, the adjustment coefficient for the steel industry was 0.94, being relatively high as compared to the adjustment coefficients for the other industrial sectors. Therefore, most steel companies were able to adopt the ETS with sufficient emission permits. The excess and shortage analysis results for each sector are shown in Table 1. The number of permits for the power plant and energy, petrochemical, cement, semiconductor, display, waste, nonferrous metals sectors, and others were insufficient, whereas the steel, oil refining, and paper industries registered surpluses.
Most industries had an excess or shortage of emission permits within 5%, but the shortage in the non-ferrous metal industry exceeded 10%. This implies that insufficient permits resulted in relatively higher costs for GHG reduction in the non-ferrous metal industry when compared to other industries, confirming that a liability in emissions of at least 11,500 million KRW existed in the non-ferrous metal industry in 2015 (The latest (14 August 2017) exchange rate: €1 = 1344.45 KRW). Additionally, numerous companies in the non-ferrous metals industry fulfilled their reduction obligation in 2015 by purchasing emission permits and/or inflowing offset credits.
After the announcement of the allocation plan for the first phase, concern was expressed about the under-allocation of emission permits, mainly by various industrial groups, such as the Federation of Korean Industries (FKI). They argued that the demand for emission permits during the first phase would be 2.02 billion tons. The FKI’s estimate was about 420 million tons lower than the demand for allowances, and companies argued that above 12.6 trillion KRW, with an annual average of 4.2 trillion KRW, would be levied under the assumption that the maximum penalty rate would be imposed. However, no significant difference was actually found between the actual total emissions (permit demand) and the total number of allocated permits (permit supply), as had been feared in the industry. Furthermore, additional offsets of about 11.9 million tons could be supplied, worth around 154.7 billion KRW with the average transaction price of 13,000 KRW/ton. The actual emission trading volume was 169.9 billion KRW, which was significantly different from FKI’s estimate of 4.2 trillion KRW under the same conditions.
In 2014, 525 companies were designated allocated companies, and, as of March 2017, the number of ETS participating companies had increased to 599. The cumulative total emissions of these companies were 551.9 million tons in 2015, as shown in Table 2.
To estimate the market price, we need to calculate the aggregate supply and demand of all the permits during the first phase; since other vintage permits within a phase can be used interchangeably by banking-and-borrowing of permits between years. Currently, only the demand data for permit in 2015 is verified. It is necessary to estimate the emission demand data for other years during the first phase based on data in 2015, so that the supply and demand of the entire first phase can be derived. Therefore, we set the annual rate of change in 2016 and 2017 based on the 2015 emissions, and calculated the maximum and minimum emission levels for each rate of change as shown in Table 3.
Assuming that the emission levels are maintained at the estimated 2015 emission levels on average, 1640.5 million tons are expected to be emitted during the first phase. However, if GHG emissions increase by a maximum of 5% per year, 1724.1 million tons will be emitted. The emissions sensitivity analysis for the various rates of change will play an important role in planning the number of emission permits that should be allocated to the market.
The permit supply can be calculated as the sum of the allocated permits, including government reserves, through the allocation plan, and the offset credits can be calculated through external reduction projects. To estimate the emission permits that can be supplied to the market from the total permit supply, the quantities carried forward to the next compliance period, and self-used quantities among the offset credits should be excluded. Table 4 shows the available supply quantity of allocated permits. After modifying the allocation plan in 2017, 14.1 million tons of additional allowances are injected into the market, and the offset credits of more than 15.6 million tons become available to supply.
We also analyzed the changes in the excess or shortage of emission permits as the non-market supply, or inter-temporal permit transfer, shifts. As shown in Table 5 and Table 6, we estimated the permit demand for the scenario where the amount of additional offset credits during the compliance period was approximately 15.6 million tons with “non-market supplies”. (The sum carried-over to the next plan period, plus the self-used quantities among offset permits, plus the unused amounts among reserve quantities. The total certified reductions from January 2015 to January 2017 were 15.6 million tons. Thus, we defined the amount of offset credits during the first phase as approximately 15.6 million tons.) As GHG emissions increased from the allocated companies, as shown in the first row of Table 5, and when the companies increase their carry-over volumes, as shown in the first column of Table 5, emission permits become insufficient. When emissions decrease, the permit supply becomes a surplus when the carry-over volume is below 80 million tons.
If the emissions have a specific directionality, short-term estimation is possible, considering the past growth rate of emissions levels. However, determining the direction of emission levels in Korea is challenging using the emission trends in the first compliance year. For example, as in the EU below (Figure 1), it would reasonable to expect that the future emissions would decrease or increase if the emissions are reduced or increased in the mid- to long-term.
If the emissions have a specific directionality, short-term estimation is possible, taking into consideration the past growth rate of emission levels. However, it is difficult to determine the direction of emission levels in Korea using the emission trends in the first compliance year. For example, as in the case of the EU below (Figure 1), it would be reasonable to expect that the future emissions would decrease/increase if the emissions are reduced/increased over the mid- to long-term.
Since the introduction of ETS, GHG emissions appeared to decline in 2015. However, a direct correlation between policy effectiveness and emission reductions remains unclear. In Europe, many argued that actual emissions have decreased due to an economic downturn rather than the effects of ETS. According to International Energy Agency (IEA) data, from 2008 to 2009, when the global financial crisis was triggered by the Lehman Brothers collapse, GHG emissions decreased due to the recession. In Korea, despite an increase in GDP in 2015 over 2014, emissions in 2015 declined (Figure 2).
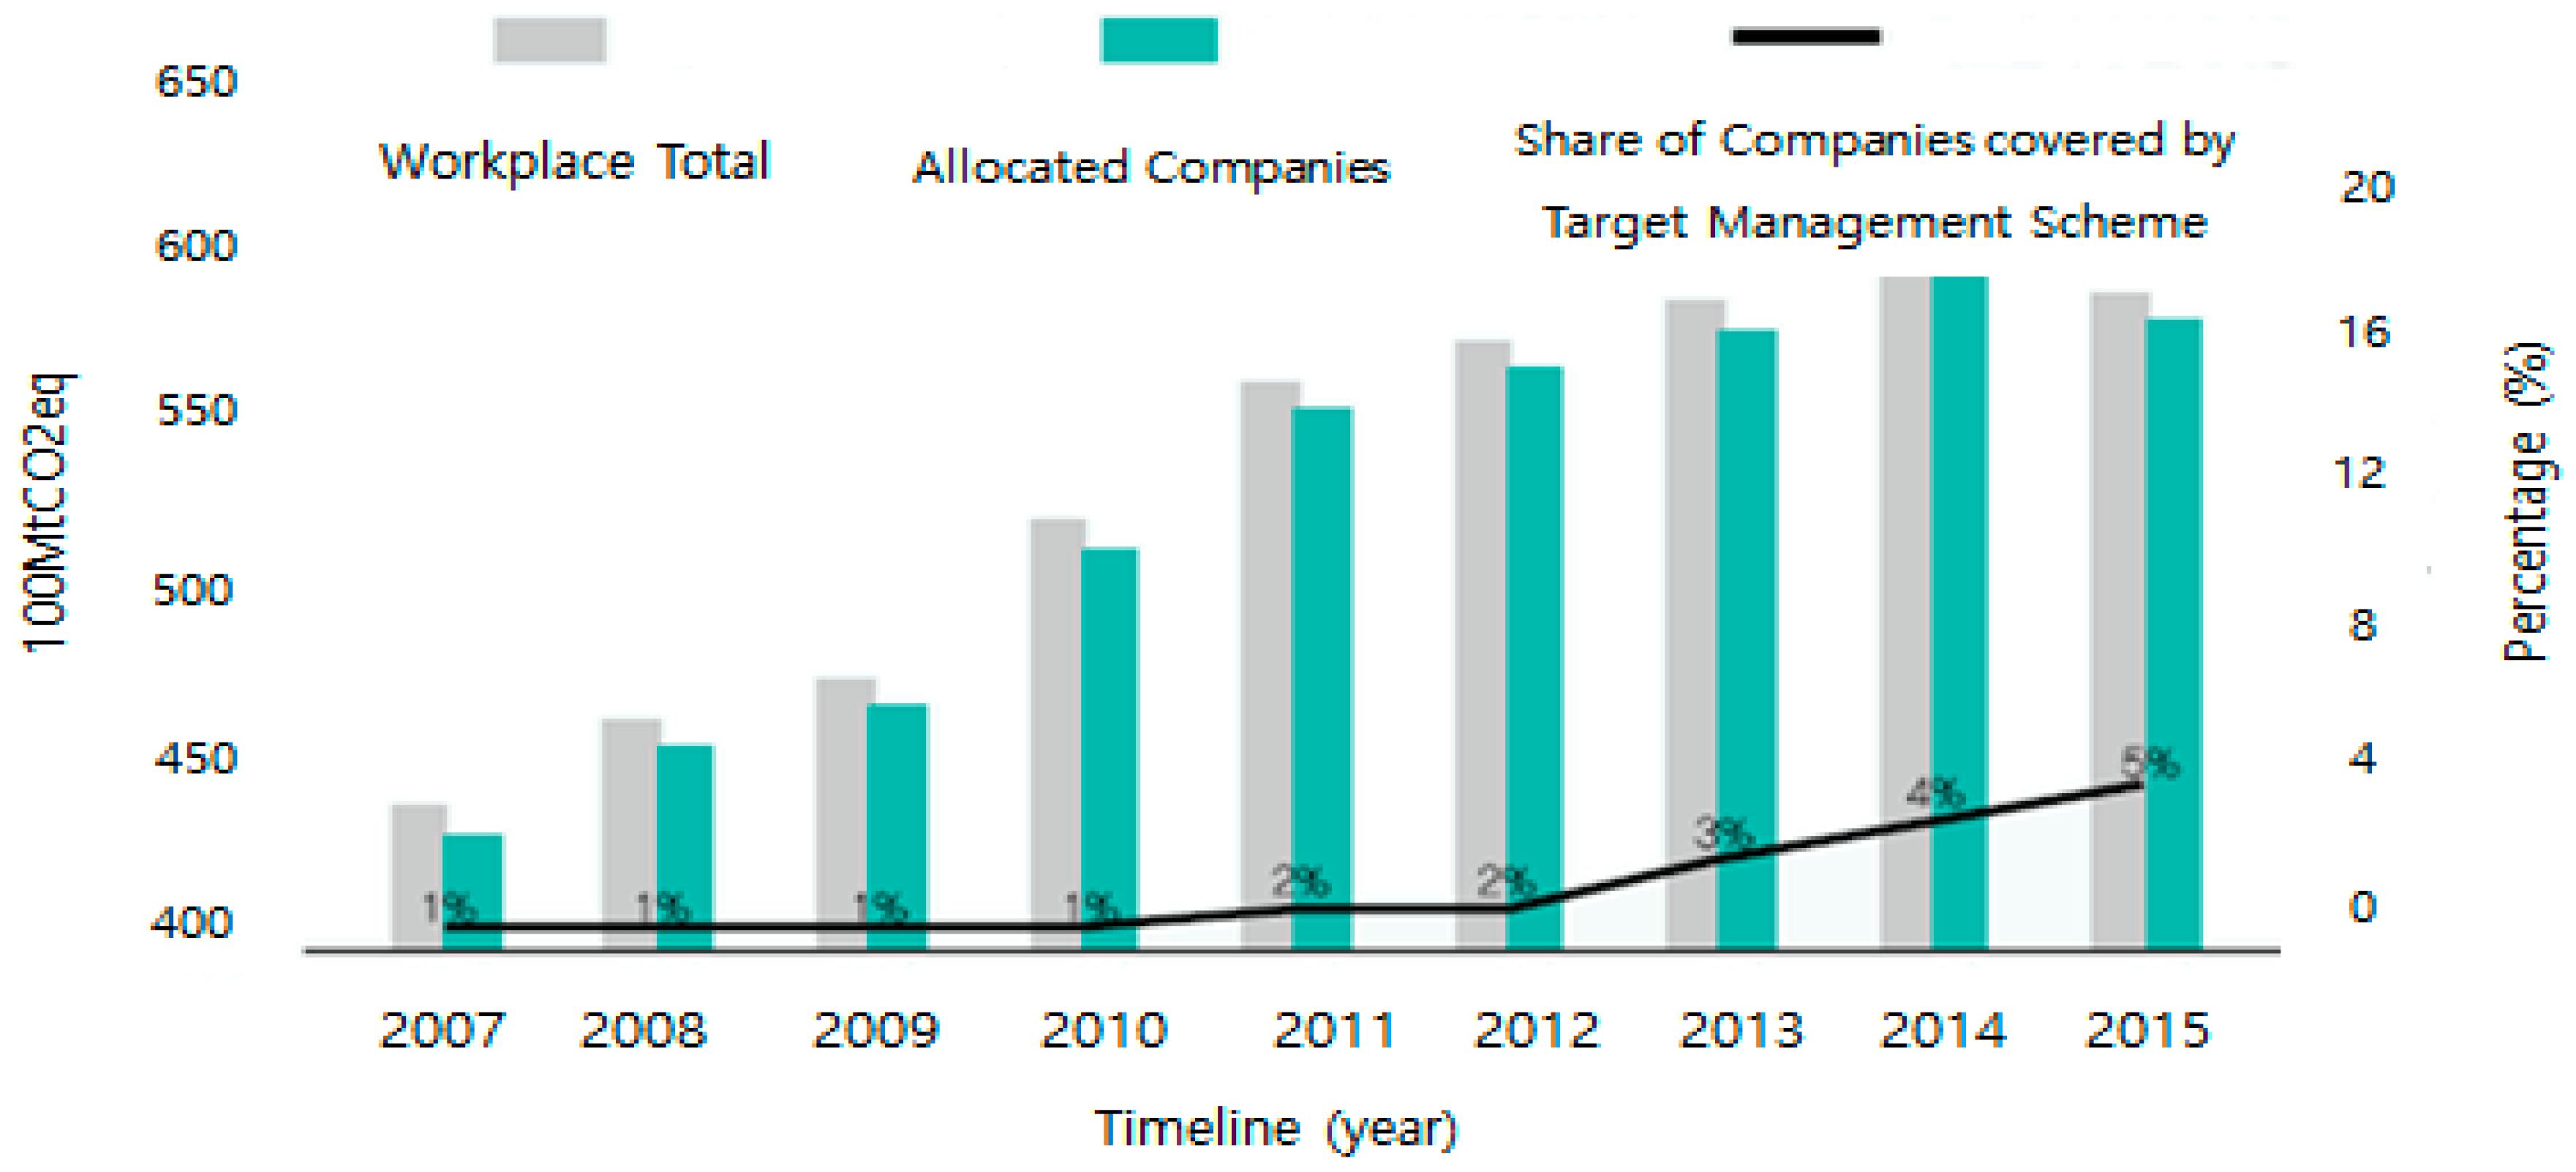
Nonetheless, according to the “Analysis on the status of workplace emissions” report of the Greenhouse GIR Center, the balance sheet of emissions for each regulated firm (Figure 3) increased from the 2007 starting point for calculating GHG emissions until 2014. Conversely, emissions decreased in 2015. However, we are unable to determine whether the reduction in 2015 was a temporary decline or a trend. One of the possible reasons for the reduction is the renewable energy policies implemented in Korea.
Figure 3 shows the trends of emissions from all GHG-emitting workplaces and all of the allocated companies.
3. Analysis on the Offset Credit Influx
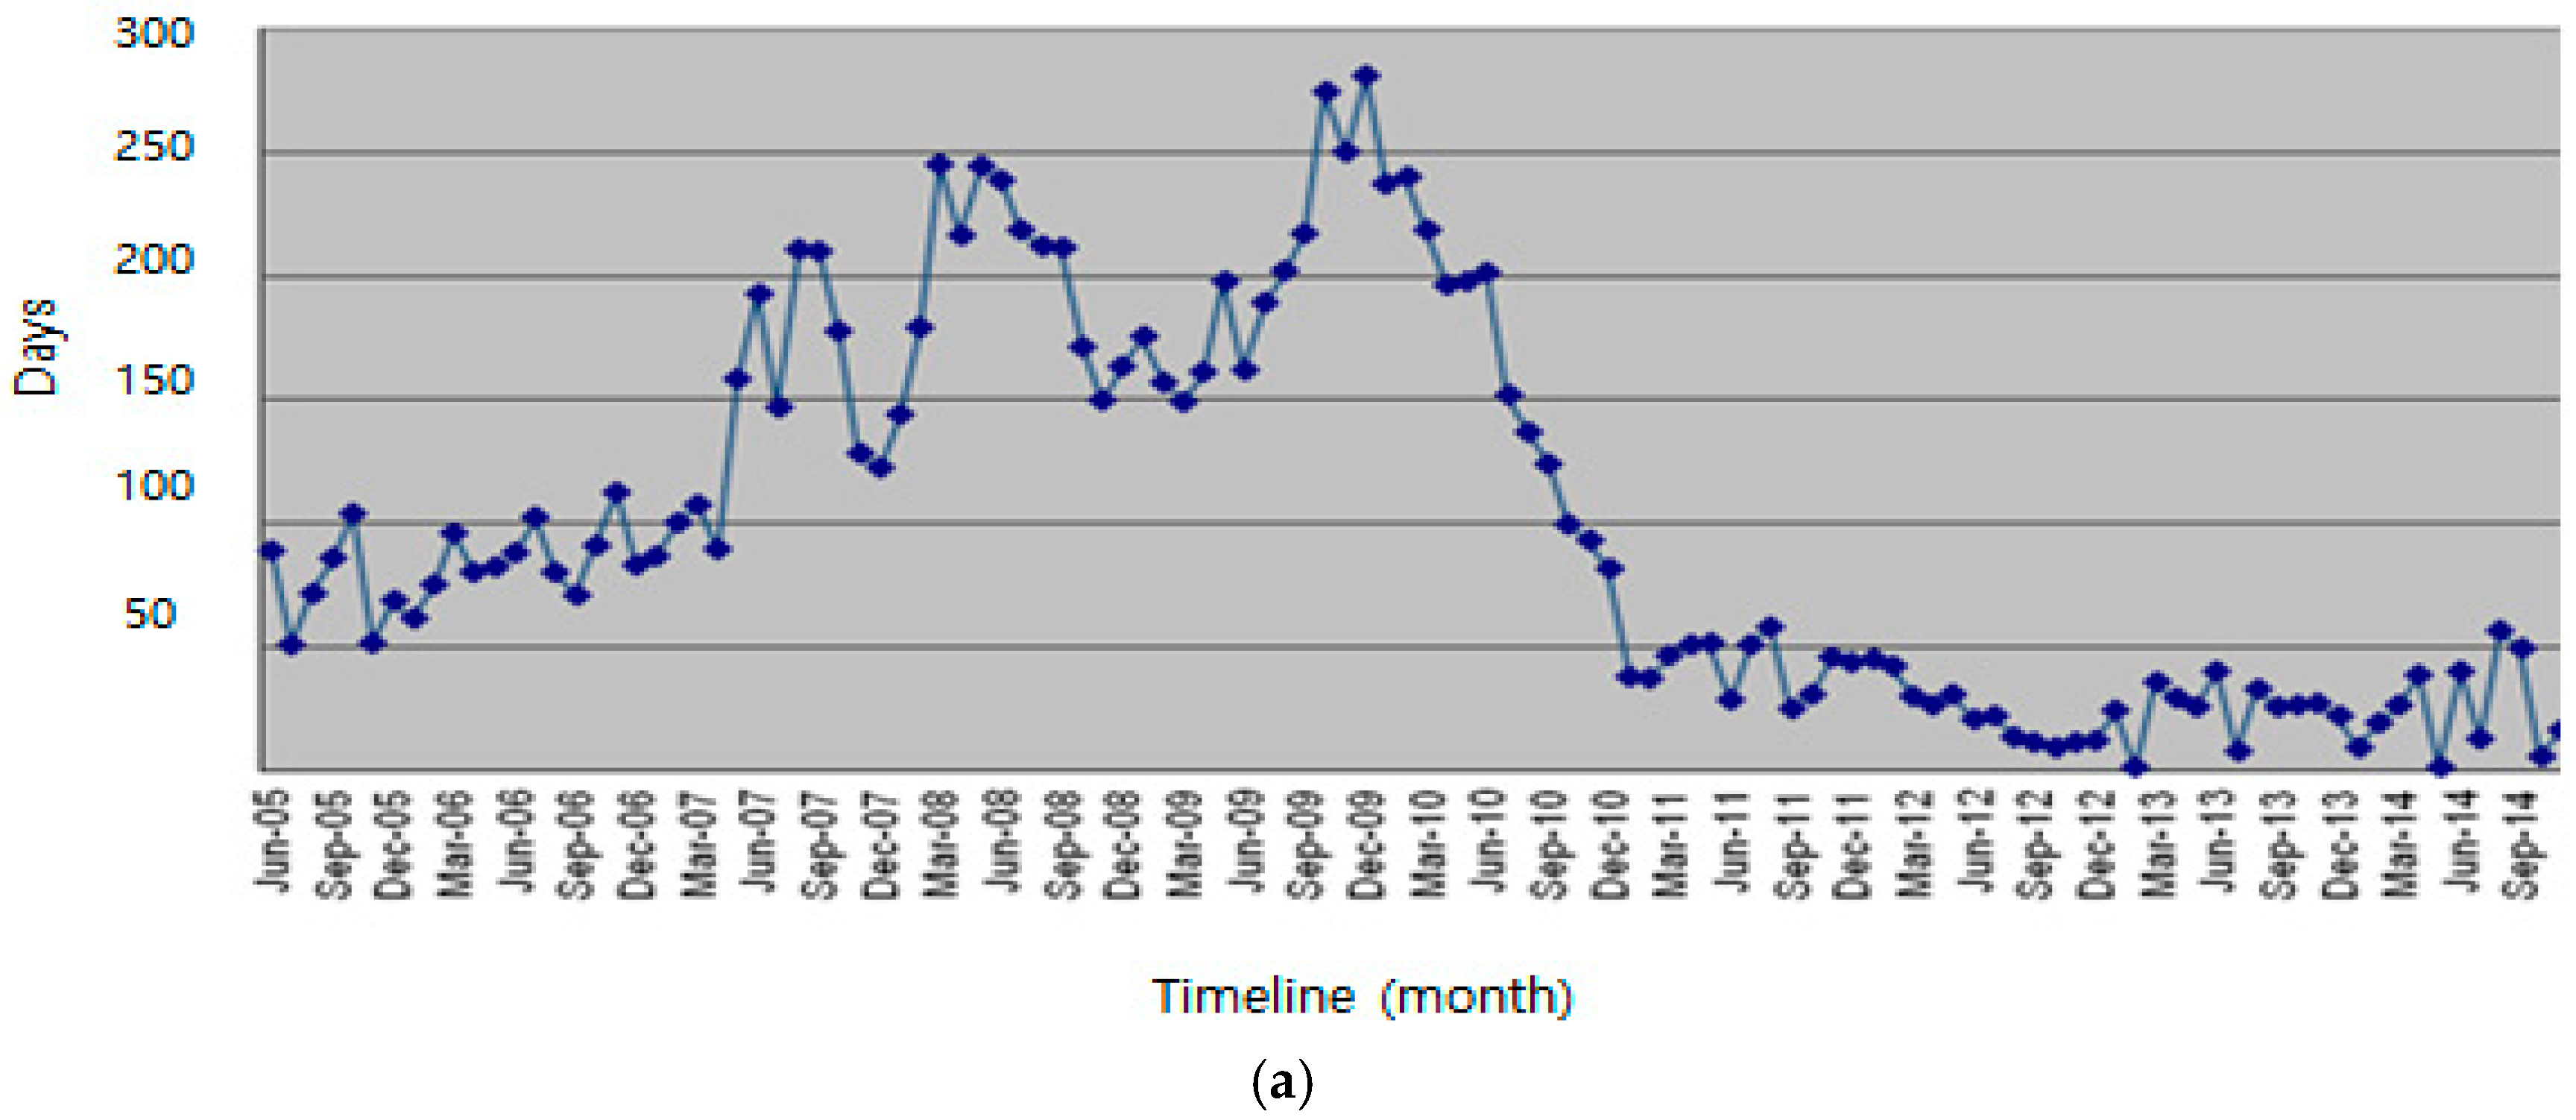
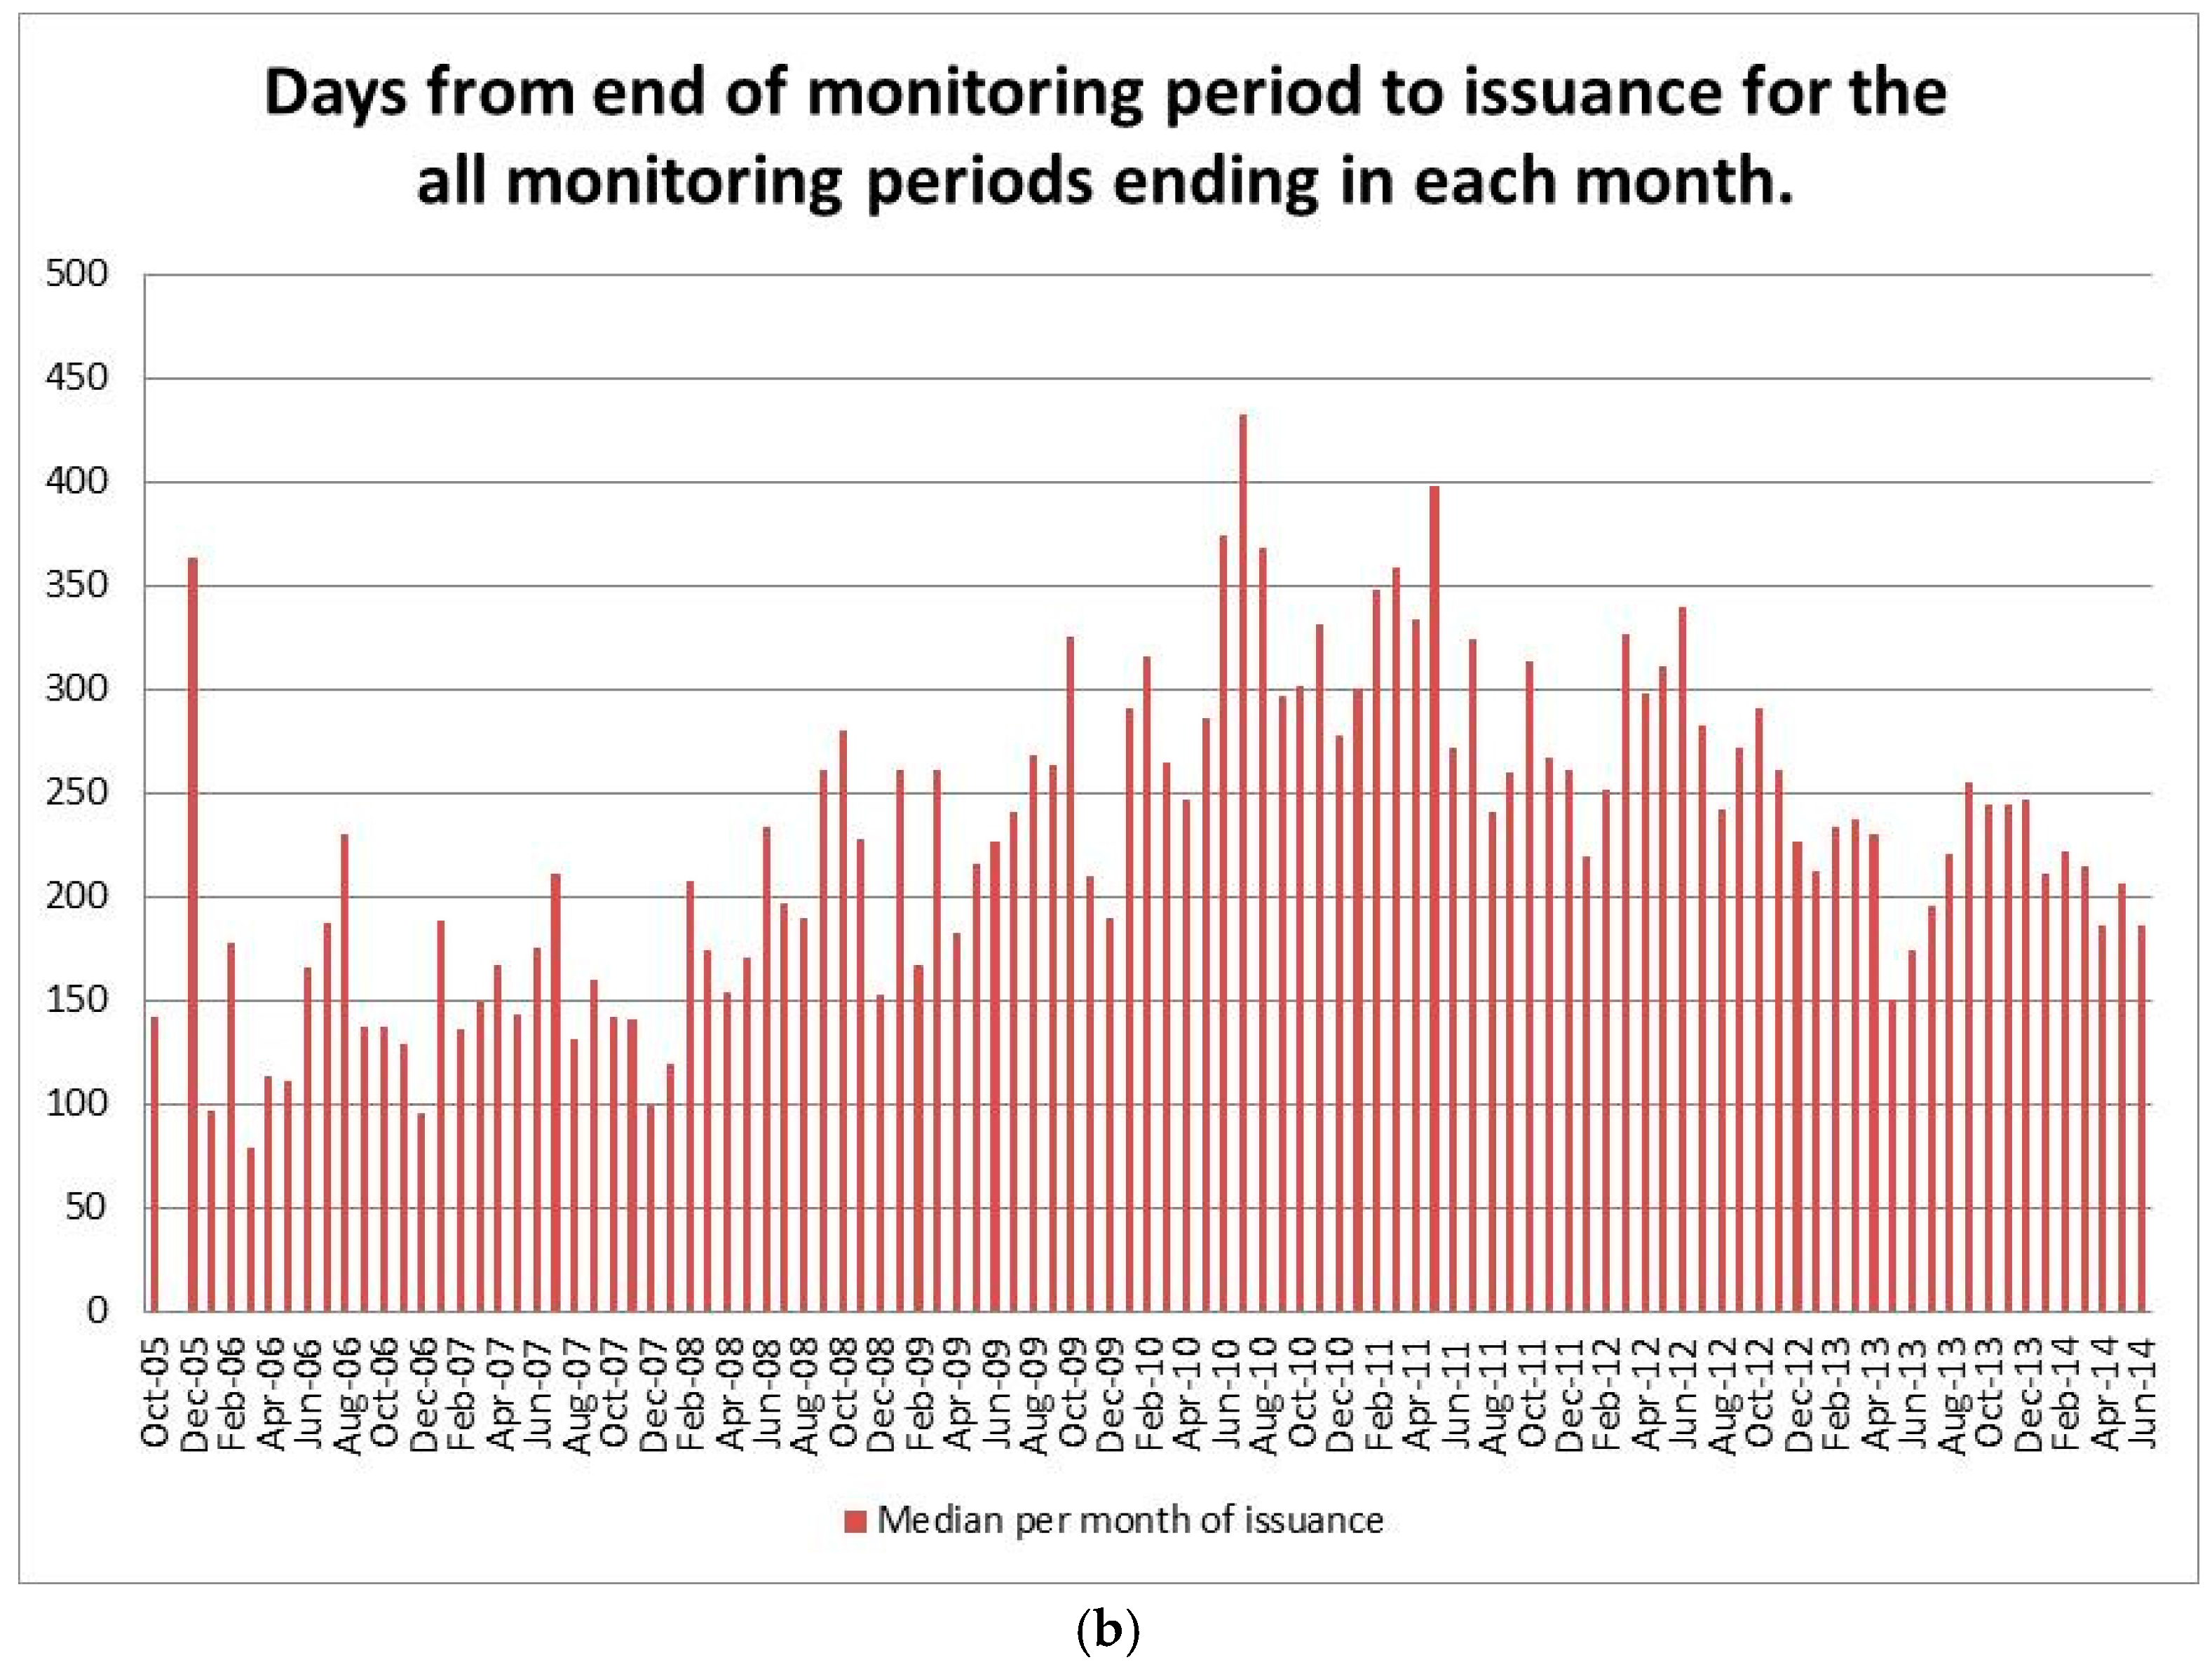
All of the offsets issued to the project owner have a unique serial number and are listed in the registry to monitor ownership transfer or offset withdrawal. Credits are issued after the offset projects are validated, verified, and passed through other required processes. Generally, the process of issuing offset credits is completed through the following procedures: pre-feasibility study, project implementation, certification, and issue of emission permits. Reduction credits issued in the registered offset project can be traded in Korean offset credits (KOC) or Korean credit units (KCU). From the companies’ perspective, it usually takes a considerable amount of time to issue offset credits. For example, for the Clean Development Mechanism (CDM) project, it took a maximum of 10 months to register the project and about six months from the end of monitoring to issuing the mission credits (Figure 4). The x-axis in both graphs shows the timeline for Korea; no CDM applications occurred since 2014 because KETS also operated an independent offset management system. Currently, only CDM projects and offset projects within Korea can be used in KETS.
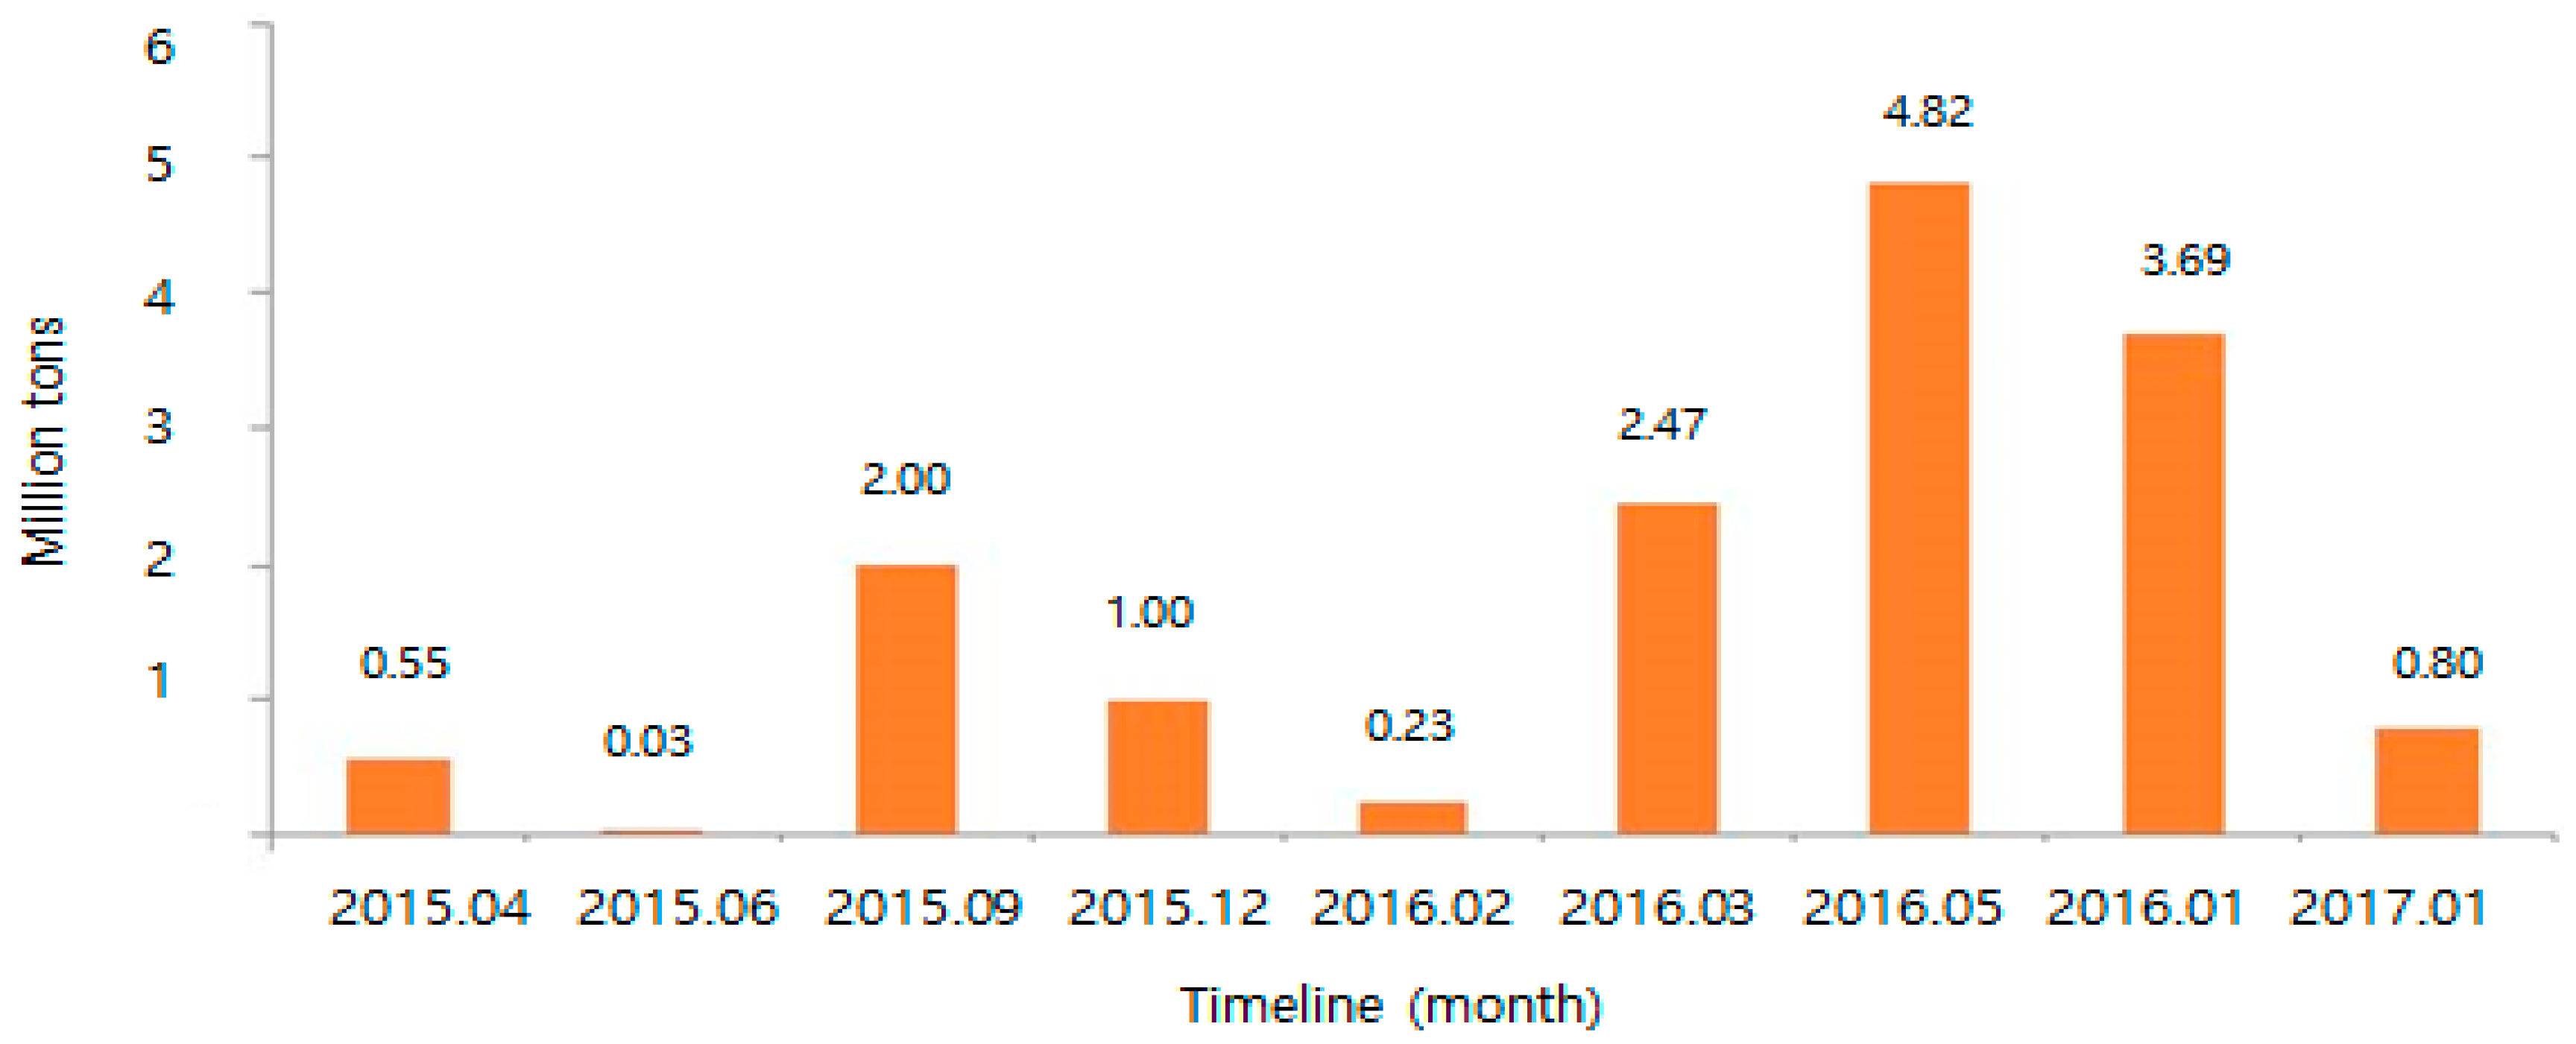
KETS recognizes the offset credits that are generated through domestic CDM projects as external reduction credits. All of the reduction credits issued from outside the KETS boundary (KOC), and issued in Korea until the present, are the conversion of CER generated in the domestic CDM projects implemented in the past. KOCs have been flowing onto the market since the offset certification committee held in April 2015, and the total amount of certified reductions from 2015 to January 2017 is about 15.6 million tons (Figure 5).
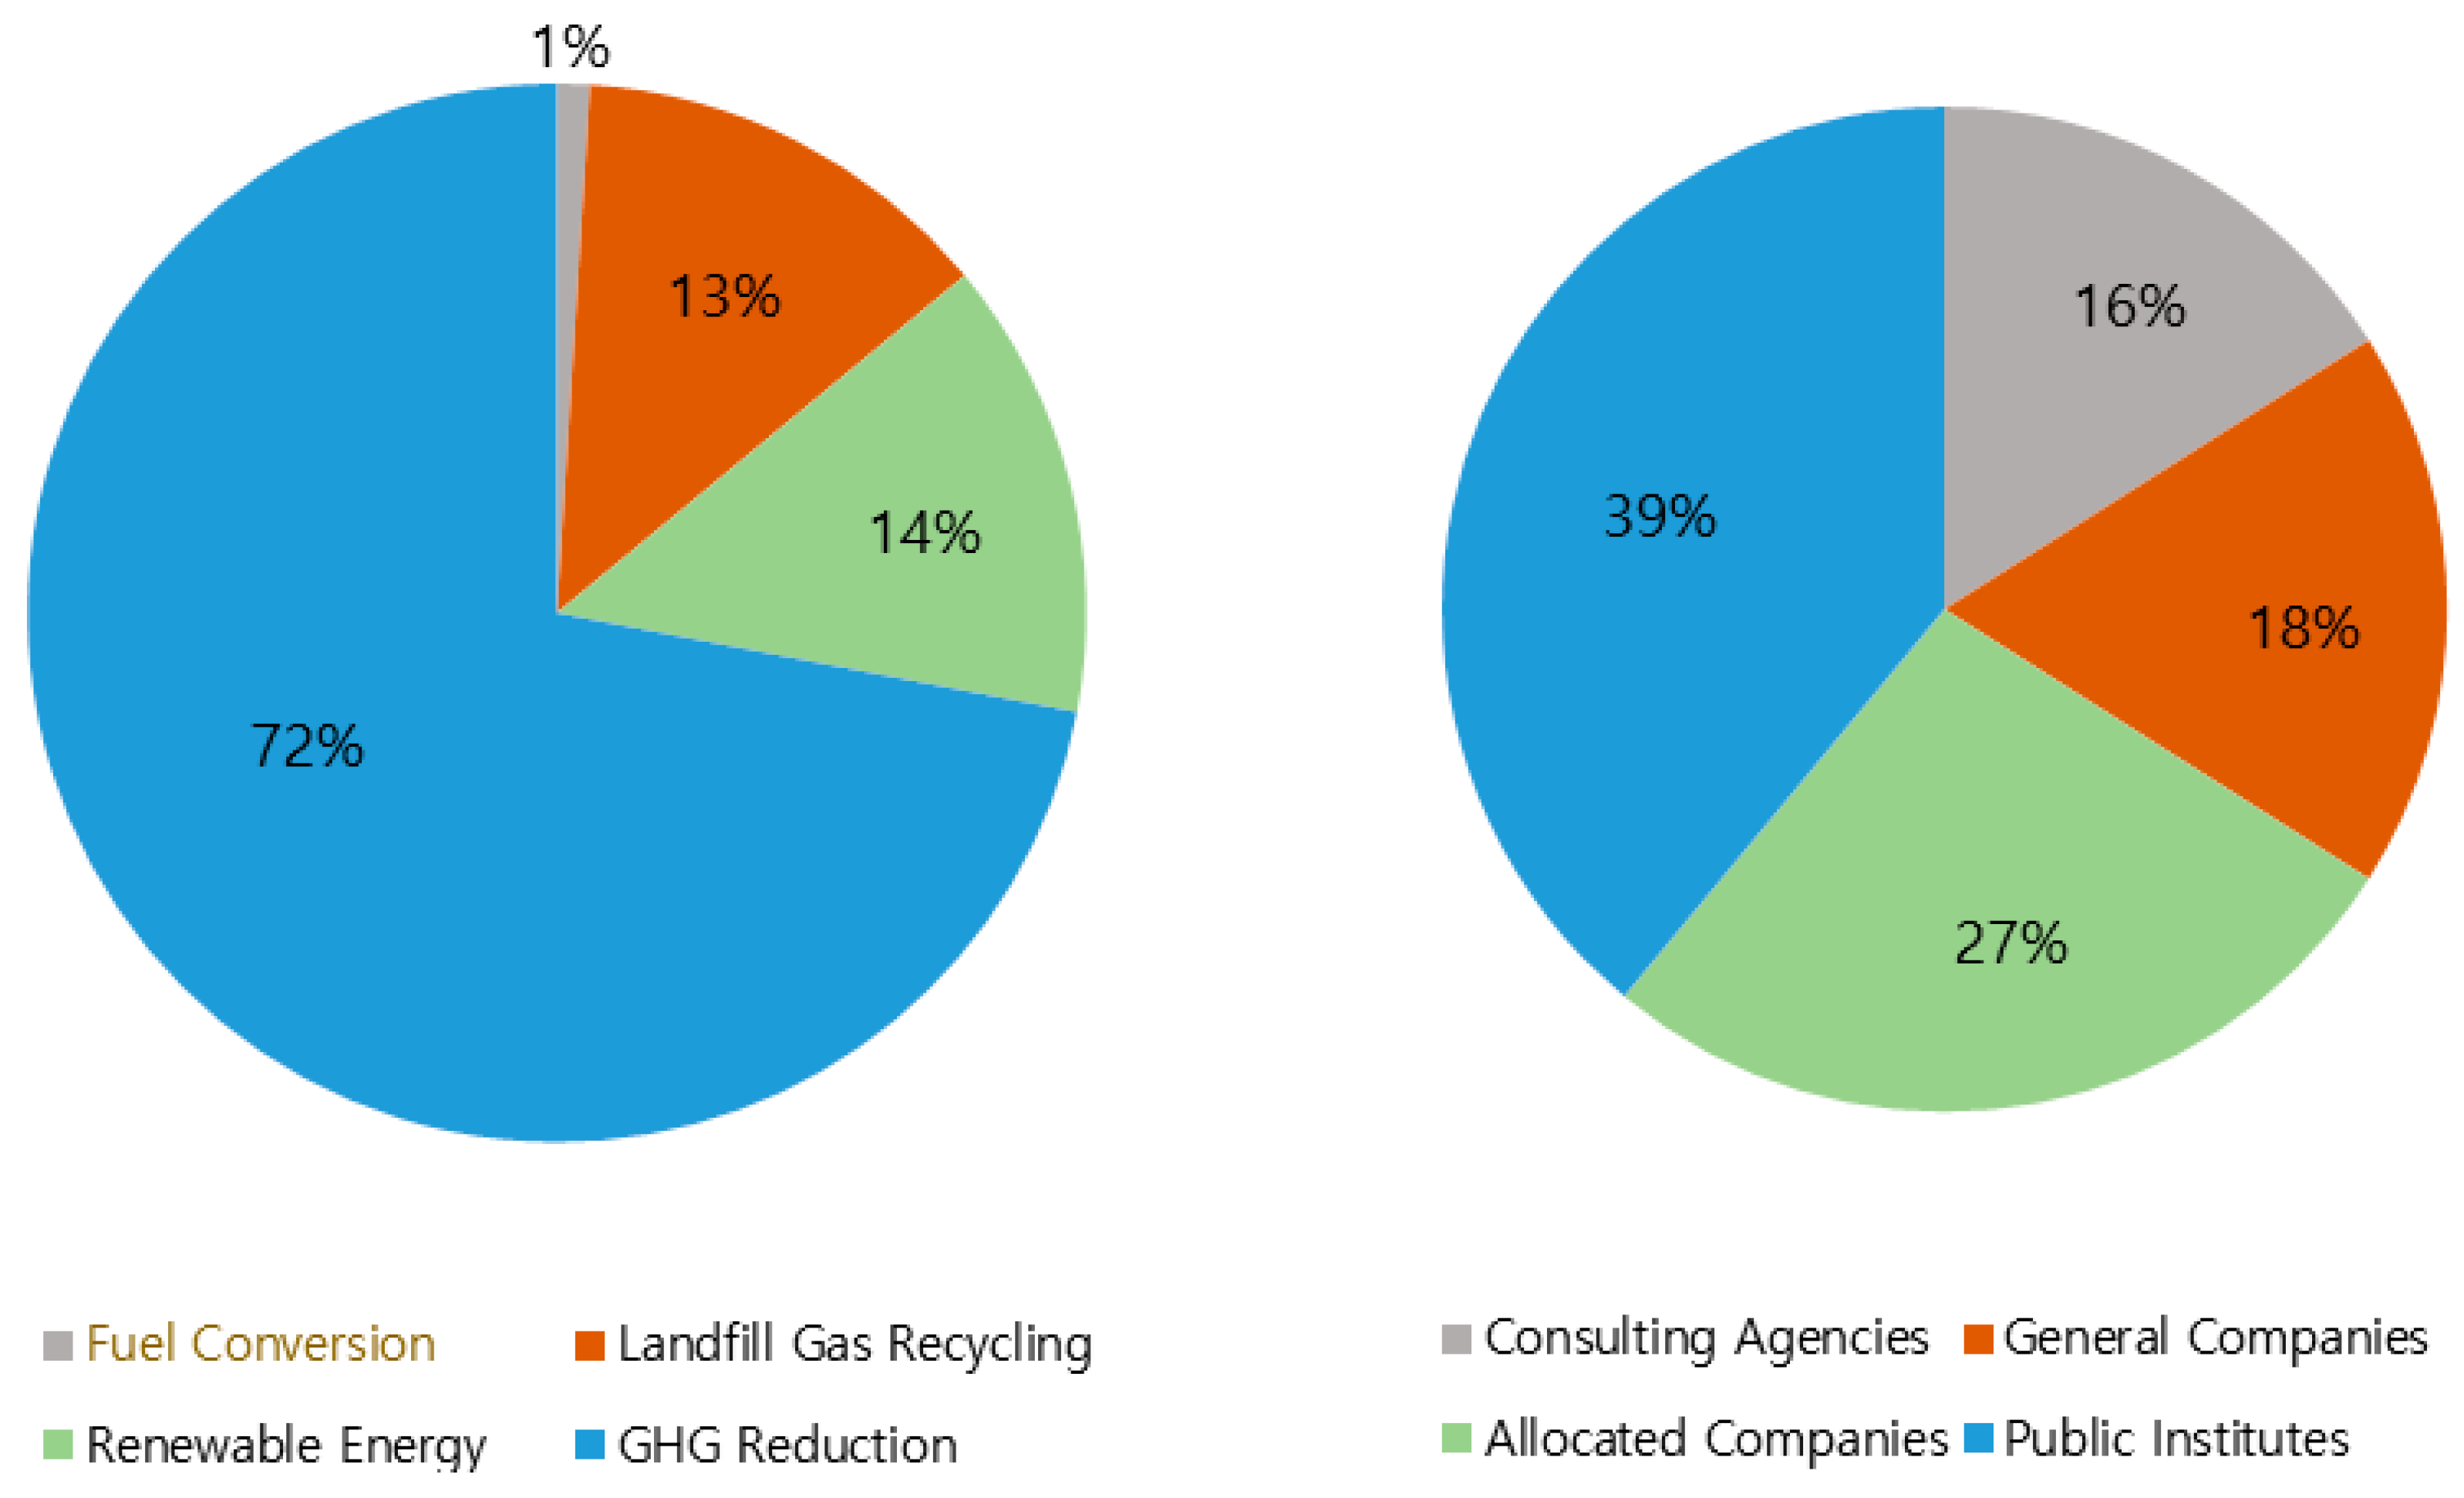
The project types that received the highest level of certifications are nitrous oxide (N2O) reduction in chemical processes and sulfur hexafluoride (SF6) reduction in display manufacturing processes (Figure 6). Although a large number of new and renewable energy-type businesses are registered, only about 1.9 million tons, or 14% of the total, of KOC were successfully issued. This is because new and renewable energy type projects have received fewer certifications per project when compared to GHG reduction projects. Additionally, if a renewable energy project is used in the renewable portfolio standard (RPS) project, the reduction will not be duplicated as reduction credits.
Figure 6 shows the companies that applied for the issue of reduction credits by enterprise type. Consulting agencies account for the greatest share of reduction credits among the four enterprise types. Some of the private consulting companies mainly received certified reduction credits for many projects. Furthermore, allocated companies, non-allocated companies (e.g., trading companies, financial institutes, and consulting companies), and public institutes received reduction credits of 27%, 34%, and 39%, respectively. Most reductions were triggered by offset projects administrated by non-allocated companies, including public institutes, by reducing N2O. Many of the GHG reduction projects are administrated and funded by public institutes or specialized consulting agencies, therefore, many certified emission credits are given to those investors and not to the companies that were actually emitting GHGs.
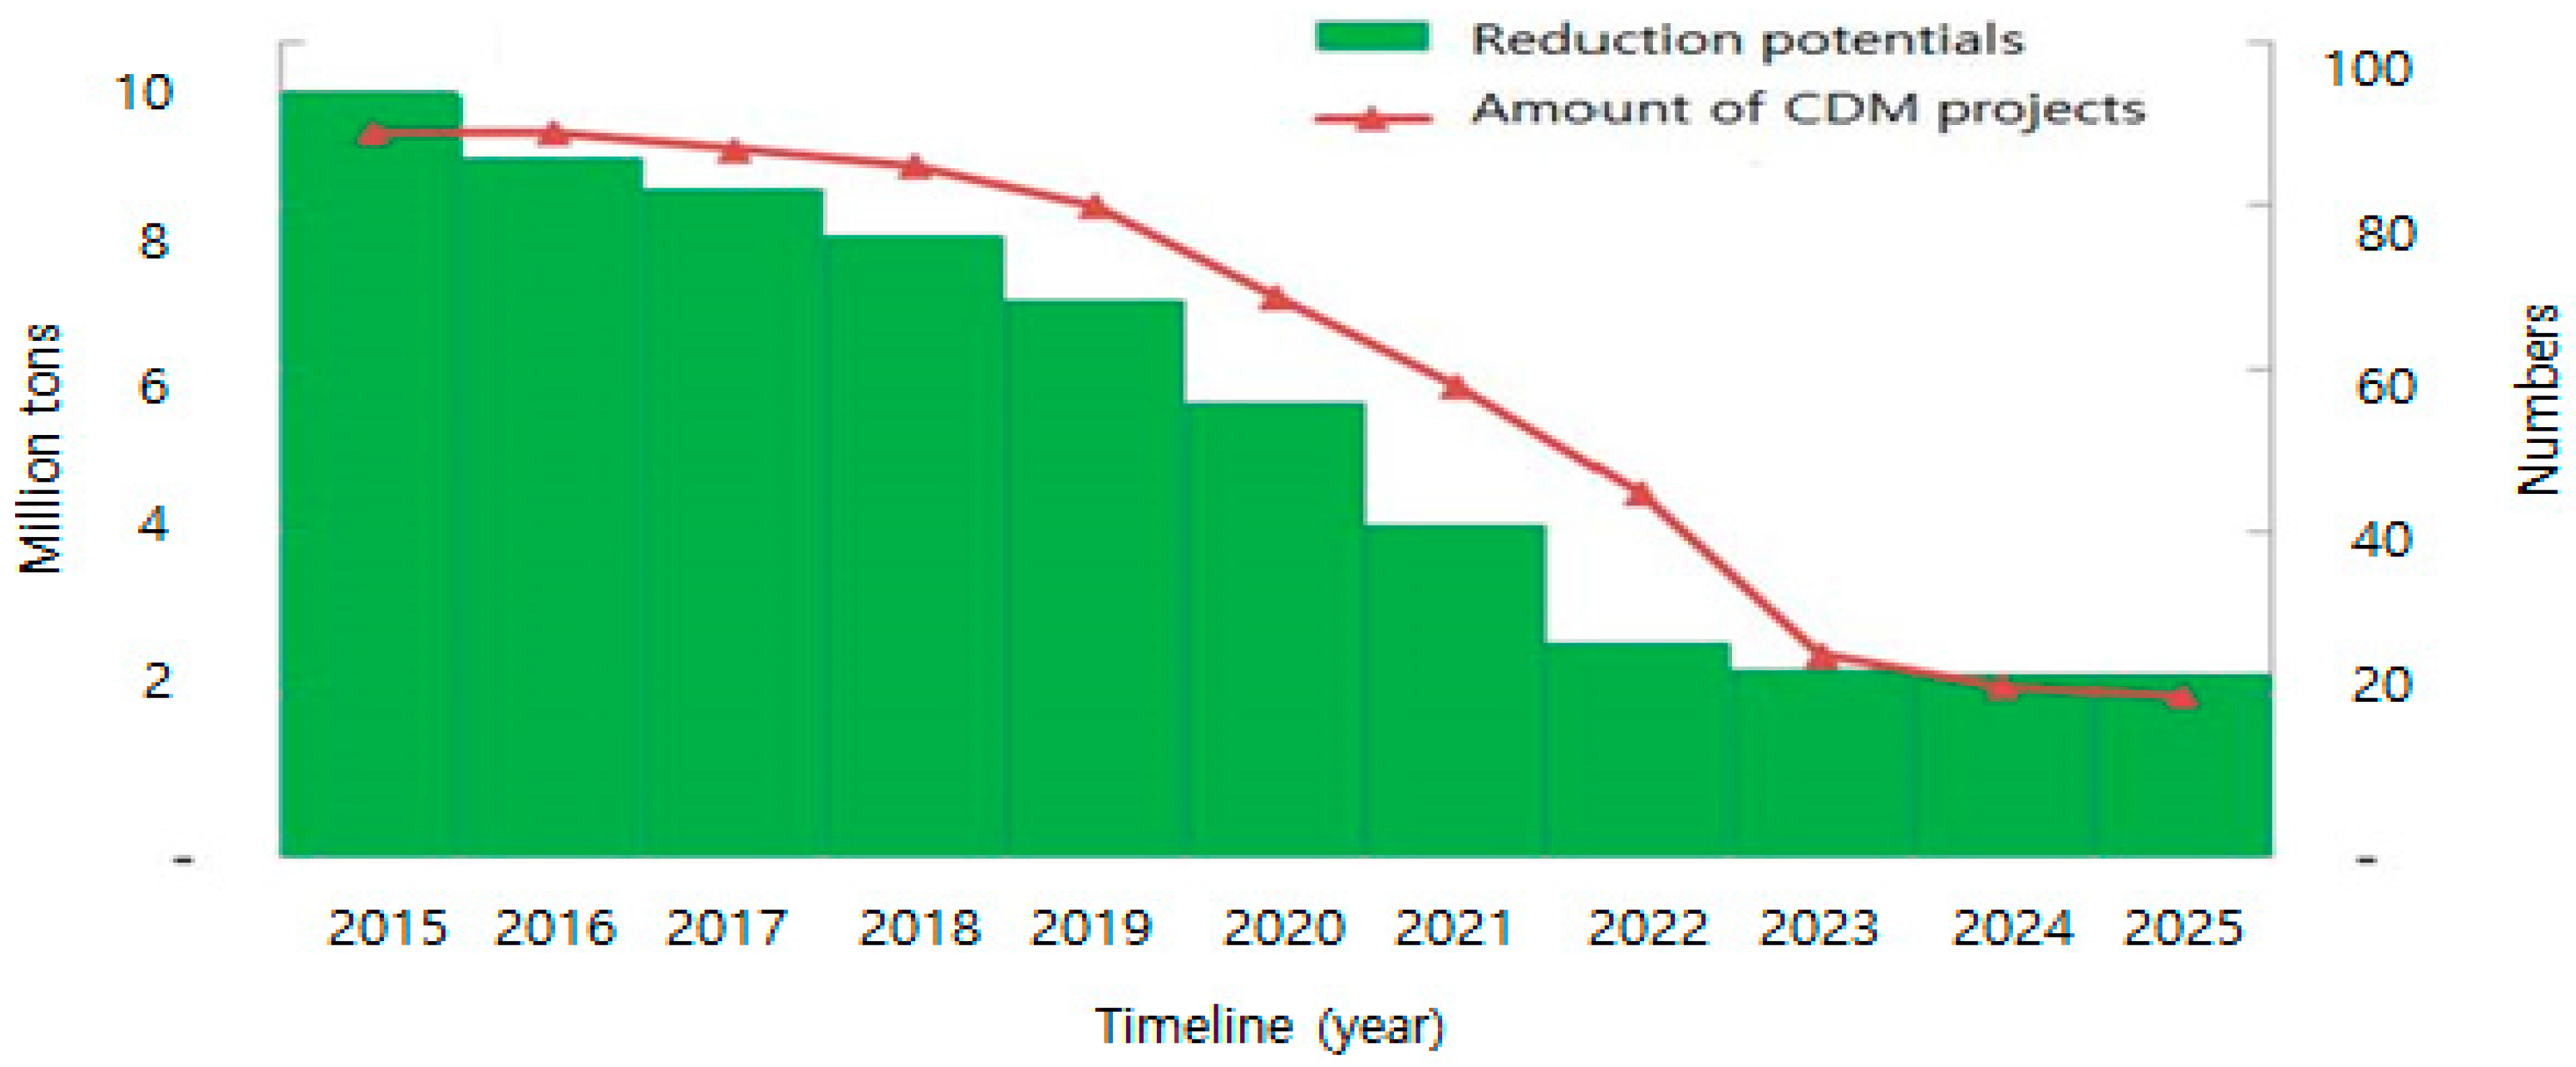
Figure 7 shows the estimates for the number of effective reduction CDM projects and their potential reductions. As shown in Figure 7, even if all of the reduction credits of the effective projects are issued, the offset credits expected to flow into the market will be somewhat limited. Regarding project numbers, the registered CDM projects in Korea increased sharply from 2006 to 2015, but are expected to gradually decline after peaking in 2015. This implies a sufficient market supply of reduction credits through CDM projects should not be expected. Particularly, from the third compliance period, the reduction credits issued by domestic CDM projects are expected to decline by more than 90% as compared to the first phase.
One possible reason for the insufficient market supply of reduction credits through the CDM projects is companies’ self-consumption. The project with the largest reduction potential among domestic CDM projects is a non-CO2 reduction project in a chemical, display, or semiconductor process. Since most of these projects are owned by companies that are subject to the allocation of emission permits, the offset credits issued by the project are more likely to be used to fulfill their obligations than to be sold to other companies. Moreover, some of the reductions to be credited in the future can be sold before issuance under forward contracts. For example, one anonymous chemical company listed on the Korea Stock Exchange is known to have a three to five year forward contract with other companies for the reduction credits to be issued by a N2O reduction CDM project, and the company discloses the transaction through the Electronic Disclosure System (DART) at each permit transaction.
If the amount of offset credits from the new emission reduction projects outside the cap boundaries is larger than the decrease in the offset credits issued through an existing CDM project, the net issue volume increases. However, when considering the current situation of the reduction projects, an increase in net issue is not expected to be easy. According to data from one consulting agency (Table 7), 170 projects were registered as reduction projects outside KETS, but the annual reduction potential of these projects was only 0.110000 million tons (0.000645 million tons per project). This implies that registering new reduction projects outside KETS is difficult, which mitigate large amounts of GHG emissions.
In addition, when considering the prospect of offset credits issue through CDM projects, and the registration status of new reduction projects outside the cap boundaries, among others, the circulation quantity of offset credits is not expected to be issued up to the maximum offset usage limit as a whole. In this case, the offset credit transactions are likely to proceed with a similar price level to the assigned permit price, and the price fluctuation might not be large due to a lack of liquidity.
4. Conclusions
The Korean government established a mid- to long-term plan to reduce GHG emissions by 37% from the emission levels of business-as-usual (BAU), by 2030. The KETS is the one of the major policy responses to climate change in Korea. Specifically, the Korean government introduced ETS, the world’s second-largest carbon trading market, in 2015. However, the performance of the KETS in the first year (2015) was not as expected: only 525 allocated companies in 23 industries were involved, and the total traded permits were only 0.8% of the total quantity of pre-allocated allowances, for a total of 543 million tons. We presume that this lack of trading liquidity occurred because 2015 was the first year for compliance. A company tends to observe how the ETS works and waits to determine whether to trade their permits. Similarly, EU companies did not actively participate in ETS during the first year of implementation.
In the new climate era, numerous countries, including Korea, are making efforts to reduce GHGs by introducing and managing ETS. To continuously reduce GHG emissions through the successful operation of the domestic carbon trading market, research on the supply and demand of emission permits and forecasts on emission permits are important. Thus, focusing on the first phase (2015–2017) of the KETS, we analyzed the actual emission levels for major industries, and found a shortage of emission permits in the power generation and energy sector, whereas the steel industry had a relatively sufficient number of permits. Additionally, assuming an influx of offset credits, we analyzed the changes in the demand of emission permits as the non-market supply increases by setting the increase or decrease rate of emissions based on the 2015 emission levels, and calculated the future excess or shortages of permits. KETS is mainly and currently focused on a shortage of permit supply, since at least 37% of BAU emissions are proposed to be cut by 2030, which is far beyond the sustainable reduction level of the regulated parties. Therefore, we consider a liquidity control system, such as the market stability reserve (MSR) operated under the EU-ETS, as a large carry-over to the next compliance period as likely.
The goal of this paper was the phenomenological analysis of the supply and demand of permits, not government intervention. However, this paper has important implications for ETS policymakers by providing a guideline on how to react to market imbalances due to excess or insufficient permits on the market. Currently, Korea does not have a specific scheme, like the EU-ETS MRS system. Thus, this study provides an analysis platform to guide the government in intervening in the market through analyzing supply and demand. For example, if an undersupply exists, policymakers might be forced to consider providing incentives to firms to not carry-over their permits to the next compliance year to prevent liquidity problems. Conversely, if permits are oversupplied, policymakers should consider resolving the oversupply problem by not discouraging abatement efforts by firms. Subsequent studies could design how the market would efficiently work under given trading liquidity or the MSR scheme, when abrupt liquidity problems cause distortions for permit prices.
Acknowledgments
We would like to express our sincere gratitude to the anonymous referee for his/her helpful comments that will help to improve the quality of the manuscript. We thank Jinhyo Kim, The ITC (International Trade Consultant), Seoul Case law in Korea for sharing valuable data and contribution during the project funded by GIR.
Author Contributions
Jaeseok Lee wrote the paper and performed the experiments; Jongmin Yu designed the experiments and analyzed the data.
Conflicts of Interest
The authors declare no conflict of interest.
References
- IETA. Republic of Korea: An Emissions Trading Case Study. 2015. Available online: http://www.ieta.org/resources/2016%20Case%20Studies/Korean_Case_Study_2016.pdf (accessed on 28 November 2017).
- Farhani, S.; Rejeb, J.B. Energy consumption, economic growth and CO2 emissions: Evidence from panel data for MENA region. Int. J. Energy Econ. Policy 2012, 2, 71–81. [Google Scholar]
- Lee, J.; Yue, C. Impacts of the US dollar (USD) exchange rate on economic growth and the environment in the United States. Energy Econ. 2017, 64, 170–176. [Google Scholar] [CrossRef]
- Manne, A.; Richels, R. The impact of learning-by-doing on the timing and costs of CO2 Abatement. Energy Econ. 2004, 26, 603–619. [Google Scholar] [CrossRef]
- Magazzino, C. The relationship between CO2 emissions, energy consumption and economic growth in Italy. Int. J. Sustain. Energy 2016, 35, 844–857. [Google Scholar] [CrossRef]
- Munksgaard, J.; Pedesen, K.A.; Wien, M. Impact of household consumption on CO2 Emissions. Energy Econ. 2000, 22, 423–440. [Google Scholar] [CrossRef]
- Chevallier, J. Carbon futures and macroeconomic risk factors: A view from the EU ETS. Energy Econ. 2009, 31, 614–625. [Google Scholar] [CrossRef]
- Delarue, E.; Voorspools, K.; D’haeseleer, W. Fuel switching in the electricity sector under the EU ETS: Review and prospective. J. Energy Eng. 2008, 134, 40–46. [Google Scholar] [CrossRef]
- Yu, J.; Mallory, M.L. Exchange rate effect on carbon credit price via energy markets. J. Int. Money Financ. 2014, 47, 145–161. [Google Scholar] [CrossRef]
- Kang, S. The Role of Carbon Permit Market and Capital Market; Korea Securities Depository: Busan, Korea, 2008. [Google Scholar]
- Lho, S. A study on introduction of greenhouse gas emission trading system in Korea. J. Environ. Policy 2009, 8, 25–35. [Google Scholar]
- Han, K.; Lim, D.; Kwak, D. A Study on the Effect of Introduction of Greenhouse Gas Emission Trading System on the Competitiveness of Major Industries; 2010-57; Korea Institute for Industrial Economics and Trade (KIET): Seoul, Korea, 2010. [Google Scholar]
- Park, H.; Hong, W. Korea’s emission trading scheme and policy design issues to achieve market-efficiency and abatement targets. Energy Policy 2014, 75, 73–83. [Google Scholar] [CrossRef]
- Chae, J.; Park, S. Status of Korea ETS and Strategies to improve in one year after launching—Through comparing with EU ETS. J. Clim. Chang. Res. 2016, 7, 41–48. [Google Scholar] [CrossRef]
- Yu, J.; Lee, S. The impact of greenhouse gas emissions on corporate social responsibility in Korea. Sustainability 2017, 9, 1135. [Google Scholar] [CrossRef]
- Etienne, X.L.; Yu, J. Inverse price spread and illiquid trading in Korea-ETS. Carbon Manag. 2017, 8, 225–235. [Google Scholar] [CrossRef]
Figure 1.
Greenhouse gas (GHG) emission trends in the European Union (EU). Source: European Environment Agency (EEA); Available online: https://www.eea.europa.eu/ (accessed on 27 April 2017).
Figure 1.
Greenhouse gas (GHG) emission trends in the European Union (EU). Source: European Environment Agency (EEA); Available online: https://www.eea.europa.eu/ (accessed on 27 April 2017).
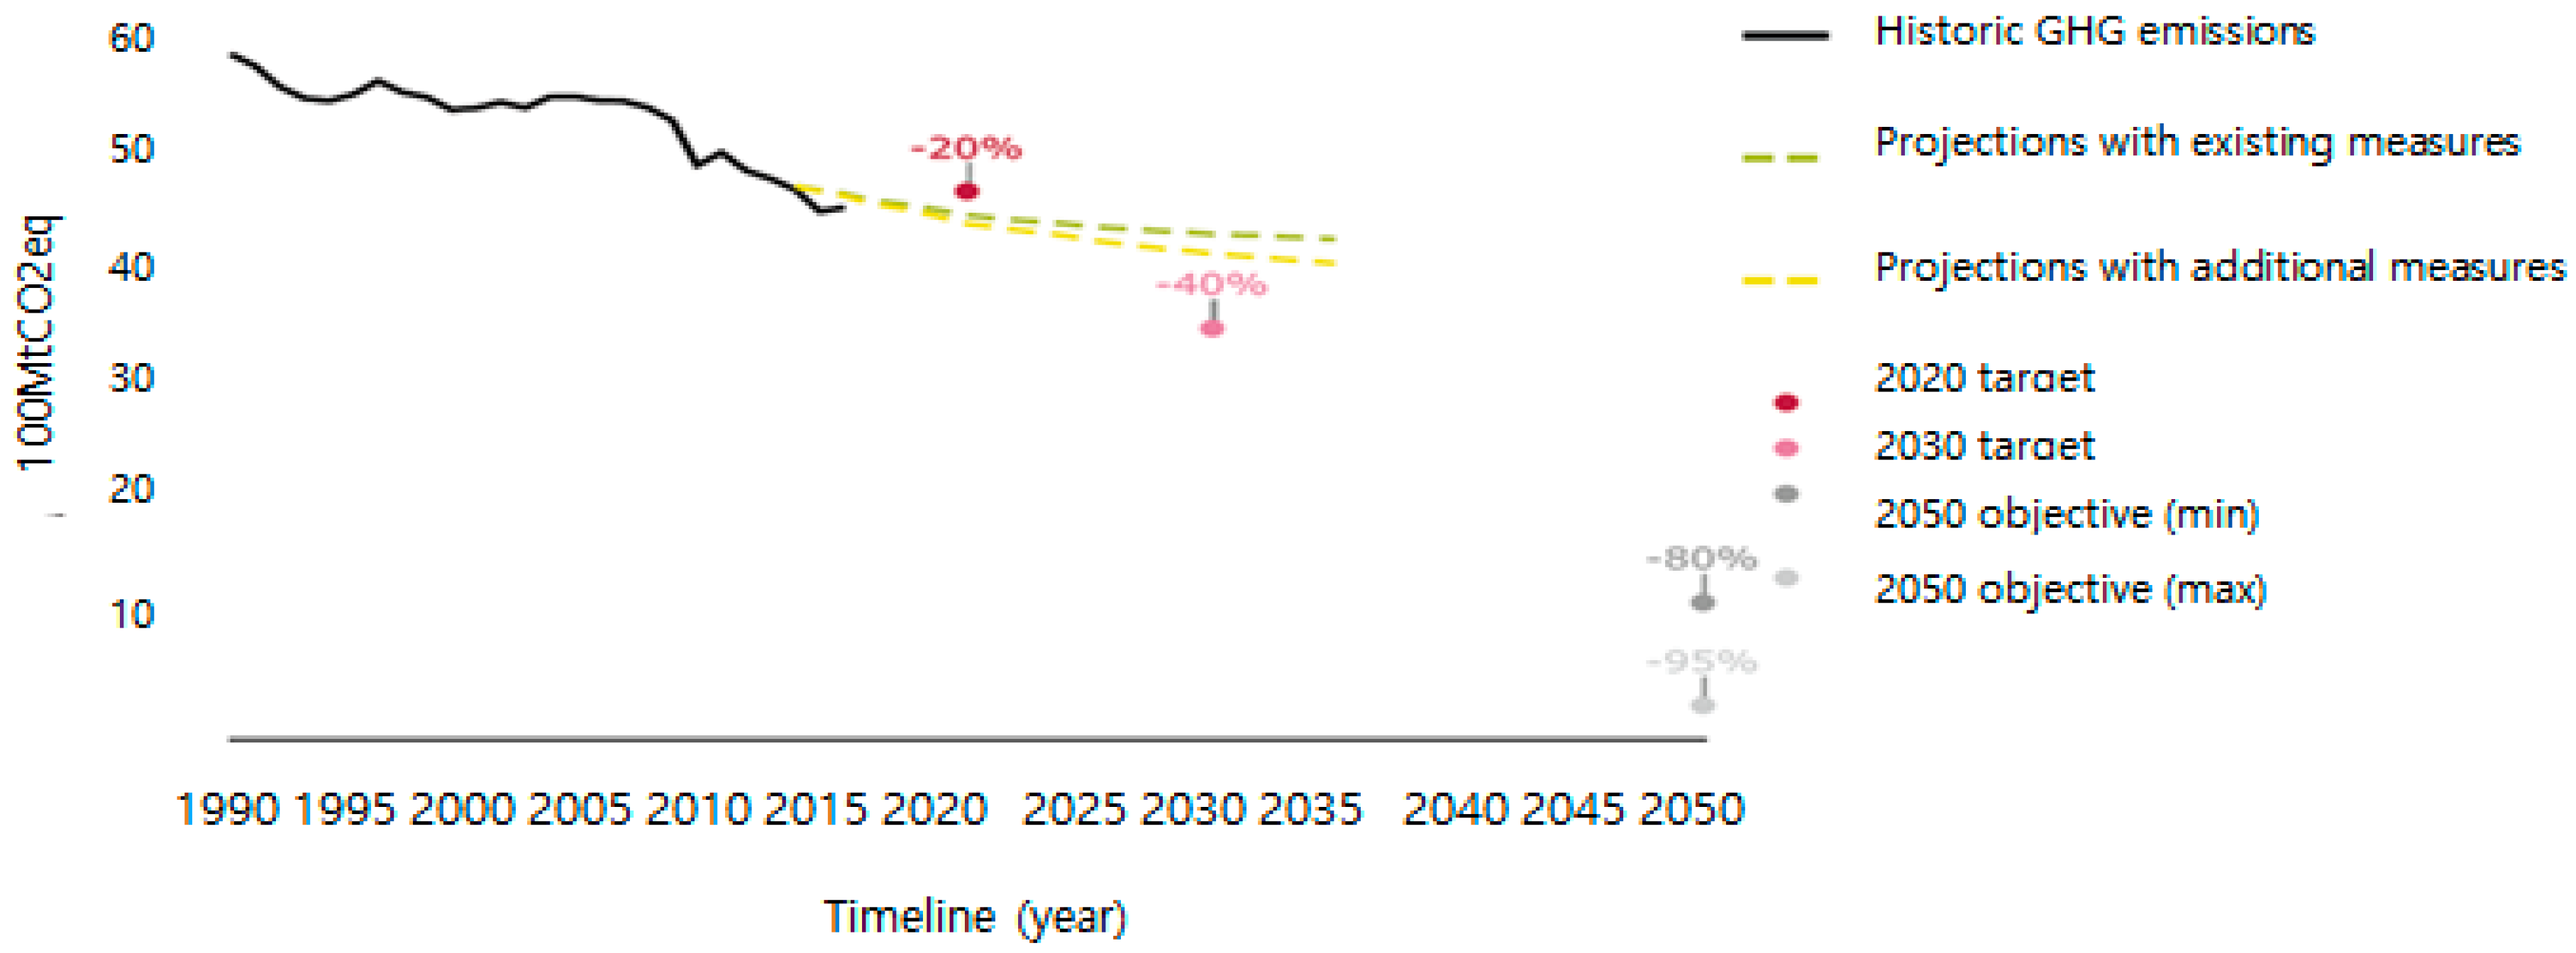
Figure 2.
Gross domestic product (GDP) and emission trends in Korea. Sources: Bank of Korea; Available online: https://www.bok.or.kr/ (accessed on 18 January 2017).
Figure 2.
Gross domestic product (GDP) and emission trends in Korea. Sources: Bank of Korea; Available online: https://www.bok.or.kr/ (accessed on 18 January 2017).
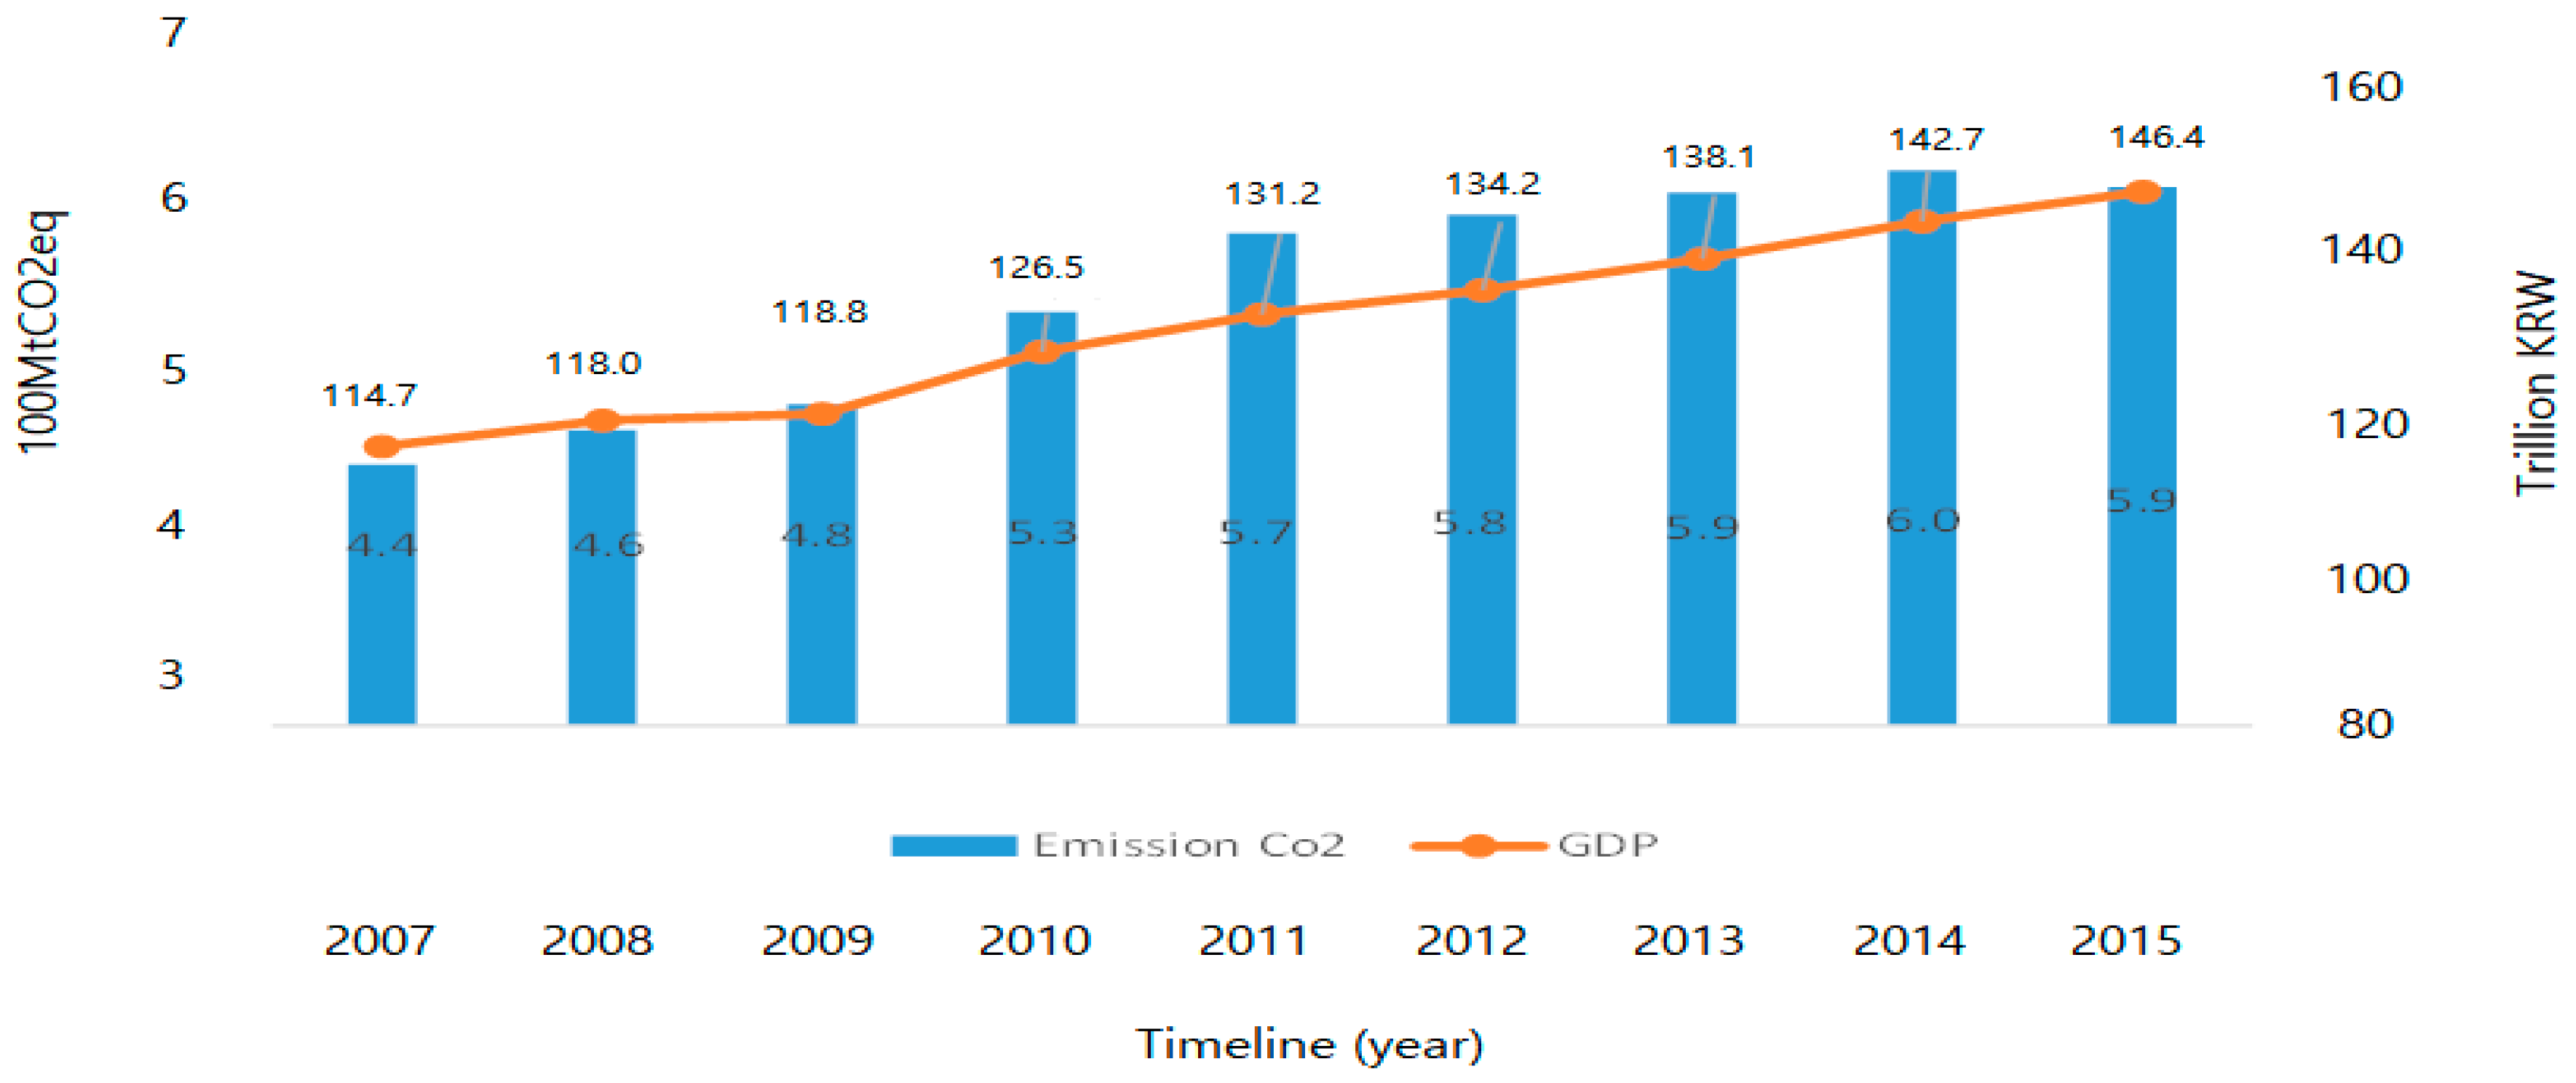
Figure 3.
Emission trends in workplaces and allocated companies. Source: GIR. Available online: https://www.gir.or.kr/ (accessed on 27 April 2017).
Figure 3.
Emission trends in workplaces and allocated companies. Source: GIR. Available online: https://www.gir.or.kr/ (accessed on 27 April 2017).

Figure 4.
(a) Average time from registration request until registration in days; (b) Median per month of issuance in days. Source: UNEP DTU CDM/JI Pipeline Analysis and Database. Available online: http://www.cdmpipeline.org/ (accessed on 14 June 2017).
Figure 4.
(a) Average time from registration request until registration in days; (b) Median per month of issuance in days. Source: UNEP DTU CDM/JI Pipeline Analysis and Database. Available online: http://www.cdmpipeline.org/ (accessed on 14 June 2017).


Figure 5.
Trend in certified reductions in millions of tons. Source: Ministry of Environment and Ministry of Strategy and Finance.
Figure 5.
Trend in certified reductions in millions of tons. Source: Ministry of Environment and Ministry of Strategy and Finance.

Figure 6.
The amount of certified emission permits by project type and by enterprise type. Source: Ministry of Strategy and Finance.
Figure 6.
The amount of certified emission permits by project type and by enterprise type. Source: Ministry of Strategy and Finance.

Figure 7.
The prospects for the number of effective reduction projects and reduction potential of domestic Clean Development Mechanism (CDM) in Korea projects by year. Source: UNEP DTU CDM/JI Pipeline Analysis and Database; Available online: http://www.cdmpipeline.org/ (accessed on 14 June 2017).
Figure 7.
The prospects for the number of effective reduction projects and reduction potential of domestic Clean Development Mechanism (CDM) in Korea projects by year. Source: UNEP DTU CDM/JI Pipeline Analysis and Database; Available online: http://www.cdmpipeline.org/ (accessed on 14 June 2017).

Table 1.
Excess and shortage analysis of emission permits in main sectors in the first compliance year. Unit is 1000 Mt carbon dioxide (CO2). Pink and white cells indicate shortage and excess of carbon permits respectively. In addition, dark grey cells (last row) indicate the total number of each column.
| Sectors | 2015 Emissions | 2015 Free Allocation | 2015 Excess or Shortage | Rate of Excess or Shortage (%) | |
|---|---|---|---|---|---|
| Pre-Allocation | After Adjustment * | ||||
| Power and Energy | 249,148 | 250,190 | 247,395 | −1753 | −0.7 |
| Steel | 101,850 | 103,960 | 102,568 | 718 | 0.7 |
| Petrochemical | 49,369 | 48,459 | 47,832 | −1538 | −3.1 |
| Cement | 44,547 | 43,519 | 43,608 | −939 | −2.1 |
| Oil Refining | 18,719 | 19,153 | 19,313 | 595 | 3.2 |
| Semiconductor | 11,730 | 10,494 | 11,505 | −225 | −1.9 |
| Display | 10,316 | 9169 | 10,045 | −271 | −2.6 |
| Waste | 9002 | 8920 | 8875 | −127 | −1.4 |
| Non-ferrous metal | 7617 | 6888 | 6800 | −817 | −10.7 |
| Paper | 7157 | 7631 | 7377 | 220 | 3.1 |
| Others | 33,196 | 30,618 | 34,437 | 1240 | 3.7 |
| Total | 542,651 | 539,000 | 539,753 | −2898 | −0.5 |
* The total amount after additional allocation or removal of permits during the period. Sources: Greenhouse Gas Inventory and Research Center (GIR). Available online: http://www.gir.go.kr (accessed on 16 May 2017).
Table 2.
Newly regulated emissions under ETS during 2014–2016.
| Industry | Year | |||
|---|---|---|---|---|
| 2014 | 2015 | 2016 | Total | |
| Petrochemical | 85 | 4 | 7 | 96 |
| Waste | 44 | 13 | 10 | 67 |
| Power and Energy | 39 | 1 | 5 | 45 |
| Paper | 44 | - | - | 44 |
| Steel | 36 | 5 | - | 41 |
| Building | 40 | - | - | 40 |
| Automobile | 26 | 3 | 3 | 32 |
| Glass and Ceramics | 24 | 1 | 2 | 27 |
| Non-Ferrous metal | 24 | 1 | 1 | 26 |
| Electrical and Electronic | 22 | 2 | 2 | 26 |
| Food and Beverage | 22 | 1 | 2 | 25 |
| Cement | 22 | - | 2 | 24 |
| Semiconductor | 20 | 3 | - | 23 |
| Machinery | 19 | - | - | 19 |
| Textile | 15 | 1 | - | 16 |
| Shipbuilding | 8 | 4 | - | 12 |
| Wood | 7 | - | - | 7 |
| Aircraft | 5 | 2 | - | 7 |
| Telecommunication | 6 | - | - | 6 |
| Mine | 2 | 3 | - | 5 |
| Refinery | 5 | - | - | 5 |
| Display | 5 | - | - | 5 |
| Water | 3 | - | - | 3 |
| Total | 523 | 44 | 34 | 601 |
| 2015 Emissions (Estimate) | 542.6 | 3.400 | 5.9 | 551.9 |
Source: Greenhouse Gas Inventory and Research (GIR) Center: Available online: http://www.gir.go.kr (accessed on 16 May 2017).
Table 3.
Sensitivity analysis of maximum and minimum emission levels during the first phase in millions of tons (The average increase over the last 10 years was 1.7% in Korea (Trends in Global CO2 emissions: 2016 report) and, based on 2015 emission levels, the average rate required for reducing carbon emissions by 37% by 2030 is below 5% (approximately 2.07% by the authors’ calculation). Therefore, we assumed that 5% is the maximum increase rate (or minimum rate of decrease) of emissions.).
| Stats | Rate of Change (+/−) | |||||||
|---|---|---|---|---|---|---|---|---|
| 0% | 0.50% | 1% | 1.50% | 2% | 3% | 4% | 5% | |
| Maximum | 1640.50 | 1648.70 | 1657.00 | 1665.30 | 1673.60 | 1690.30 | 1707.10 | 1724.10 |
| Average | 1640.50 | 1640.50 | 1640.50 | 1640.50 | 1640.50 | 1640.50 | 1640.50 | 1640.50 |
| Minimum | 1640.50 | 1632.30 | 1624.10 | 1616.00 | 1607.80 | 1591.70 | 1575.60 | 1559.70 |
| Max–Min | - | 16.4 | 32.9 | 49.3 | 65.8 | 98.6 | 131.5 | 164.4 |
Sources: Authors’ calculation assuming that the total emission for the first phase (2015–2017) was about 1640.5 million tons. The rates of change could be due to economic developments or improved emission efficiency.
Table 4.
Supply of emission permits in millions of tons.
| Sources of Credits | Allowance/Supply | Cumulative Sum | |
|---|---|---|---|
| 2014 Allocation Plan | Pre-Allocated Allowances | 1597.7 | 1597.7 |
| Reserve Amount | 88.8 | 1686.6 | |
| Total Allowances | 1686.6 | - | |
| 2017 Allocation Plan (Modified) | Additional Allowances | 14.1 | 1700.6 |
| Offset Permits | Offset Credits | 15.6 + α | 1716.2 + α |
Source: Electric Power Information Center (EPIC); Available online: www.epic.or.kr (accessed on 4 April 2017).
Table 5.
Supply and demand comparison in the first phase: maximum level by demand growth rate, shown in millions of tons.
Table 5.
Supply and demand comparison in the first phase: maximum level by demand growth rate, shown in millions of tons.
| Demand | 0% | 0.50% | 1% | 1.50% | 2% | 3% | 4% | 5% |
|---|---|---|---|---|---|---|---|---|
| Supply | ||||||||
| (Carry-Over) | ||||||||
| No carry-over | 75.7 | 67.5 | 59.2 | 50.9 | 42.6 | 25.9 | 9.1 | −7.9 |
| 10 million tons | 65.7 | 57.5 | 49.2 | 40.9 | 32.6 | 15.9 | −0.9 | −17.9 |
| 20 million tons | 55.7 | 47.5 | 39.2 | 30.9 | 22.6 | 5.9 | −10.9 | −27.9 |
| 30 million tons | 45.7 | 37.5 | 29.2 | 20.9 | 12.6 | −4.1 | −20.9 | −37.9 |
| 40 million tons | 35.7 | 27.5 | 19.2 | 10.9 | 2.6 | −14.1 | −30.9 | −47.9 |
| 50 million tons | 25.7 | 17.5 | 9.2 | 0.9 | −7.4 | −24.1 | −40.9 | −57.9 |
| 60 million tons | 15.7 | 7.5 | −0.8 | −9.1 | −17.4 | −34.1 | −50.9 | −67.9 |
| 70 million tons * | 5.7 | −2.5 | −10.8 | −19.1 | −27.4 | −44.1 | −60.9 | −77.9 |
Source: KECO (Korea Environment Corporation: Available online: https://www.keco.or.kr/ (accessed on 15 March 2017)) and authors’ calculation. * The most likely maximum amount of carry-over under the regulation during the first compliance period.
Table 6.
Supply and demand comparison in the first phase: minimum level by demand growth rate in millions of tons.
Table 6.
Supply and demand comparison in the first phase: minimum level by demand growth rate in millions of tons.
| Demand | 0% | −0.50% | −1% | −1.50% | −2% | −3% | −4% | −5% |
|---|---|---|---|---|---|---|---|---|
| Supply | ||||||||
| (Carry-Over) | ||||||||
| No carry-over | 75.7 | 83.9 | 92.1 | 100.2 | 108.4 | 124.5 | 140.6 | 156.5 |
| 10 million tons | 65.7 | 73.9 | 82.1 | 90.2 | 98.4 | 114.5 | 130.6 | 146.5 |
| 20 million tons | 55.7 | 63.9 | 72.1 | 80.2 | 88.4 | 104.5 | 120.6 | 136.5 |
| 30 million tons | 45.7 | 53.9 | 62.1 | 70.2 | 78.4 | 94.5 | 110.6 | 126.5 |
| 40 million tons | 35.7 | 43.9 | 52.1 | 60.2 | 68.4 | 84.5 | 100.6 | 116.5 |
| 50 million tons | 25.7 | 33.9 | 42.1 | 50.2 | 58.4 | 74.5 | 90.6 | 106.5 |
| 60 million tons | 15.7 | 23.9 | 32.1 | 40.2 | 48.4 | 64.5 | 80.6 | 96.5 |
| 70 million tons | 5.7 | 13.9 | 22.1 | 30.2 | 38.4 | 54.5 | 70.6 | 86.5 |
Sources: KECO (Korea Environment Corporation: Available online: https://www.keco.or.kr/ (accessed on 15 March 2017)) and authors’ calculation.
Table 7.
The status of the reduction projects in 2016: a total of 12.31, in millions of tons.
| Sources | Number | Annual Reduction Potential | |
|---|---|---|---|
| Reduction Project Outside the Boundaries of KETS | Completed | 25 | 0.000792 |
| Accepted | 102 | 0.107661 | |
| Forest Carbon Offset Project | Completed | 36 | 0.002168 |
| Accepted | 9 | 0.000316 | |
| Total | 172 | 0.110932 | |
Source: Korea Research Institute on Climate Change; Available online: http://ceg.crik.re.kr/ (accessed on 24 May 2017).
© 2017 by the authors. Licensee MDPI, Basel, Switzerland. This article is an open access article distributed under the terms and conditions of the Creative Commons Attribution (CC BY) license (http://creativecommons.org/licenses/by/4.0/).
Share and Cite
MDPI and ACS Style
Lee, J.; Yu, J. Market Analysis during the First Year of Korea Emission Trading Scheme. Energies 2017, 10, 1974. https://doi.org/10.3390/en10121974
AMA Style
Lee J, Yu J. Market Analysis during the First Year of Korea Emission Trading Scheme. Energies. 2017; 10(12):1974. https://doi.org/10.3390/en10121974
Chicago/Turabian StyleLee, Jaeseok, and Jongmin Yu. 2017. "Market Analysis during the First Year of Korea Emission Trading Scheme" Energies 10, no. 12: 1974. https://doi.org/10.3390/en10121974
Note that from the first issue of 2016, this journal uses article numbers instead of page numbers. See further details here.