Diurnal Thermal Behavior of Photovoltaic Panel with Phase Change Materials under Different Weather Conditions


1
ELTEC College of Engineering, Ewha Womans University, Seoul 03760, Korea
2
Center for Climatic Environment Real-scale Testing, Korea Conformity Laboratories, Chungbuk 27873, Korea
*
Author to whom correspondence should be addressed.
Energies 2017, 10(12), 1983; https://doi.org/10.3390/en10121983
Submission received: 16 October 2017
/
Revised: 22 November 2017
/
Accepted: 27 November 2017
/
Published: 1 December 2017
(This article belongs to the Special Issue Solar Energy Application in Buildings)
Abstract
:The electric power generation efficiency of photovoltaic (PV) panels depends on the solar irradiation flux and the operating temperature of the solar cell. To increase the power generation efficiency of a PV system, this study evaluated the feasibility of phase change materials (PCMs) to reduce the temperature rise of solar cells operating under the climate in Seoul, Korea. For this purpose, two PCMs with different phase change characteristics were prepared and the phase change temperatures and thermal conductivities were compared. The diurnal thermal behavior of PV panels with PCMs under the Seoul climate was evaluated using a 2-D transient thermal analysis program. This paper discusses the heat flow characteristics though the PV cell with PCMs and the effects of the PCM types and macro-packed PCM (MPPCM) methods on the operating temperatures under different weather conditions. Selection of the PCM type was more important than the MMPCM methods when PCMs were used to enhance the performance of PV panels and the mean operating temperature of PV cell and total heat flux from the surface could be reduced by increasing the heat transfer rate through the honeycomb grid steel container for PCMs. Considering the mean operating temperature reduction of 4 °C by PCM in this study, an efficiency improvement of approximately 2% can be estimated under the weather conditions of Seoul.
1. Introduction
The electric power generation efficiency of photovoltaic (PV) panels depends on the solar irradiation flux, and operating temperature of the solar cell. This means that the power output of PV panels is dependent mostly on direct sunlight. In addition, atmospheric conditions, such as dust and clouds can affect the power output. Moreover, the power generation output decreases with increasing operating temperature of the PV panels. For example, silicon-based PV shows an electric power drop at panel temperatures above 25 °C with a temperature coefficient ranging from −0.3%/K to −0.65%/K [1]. Therefore, the basic environmental variables and numerical parameters of a PV system should be examined carefully with a specific mounting geometry or building integration level to estimate the operating temperatures. For this reason, various mathematical equations have been developed to describe the operating temperature of different PV types and weather conditions [2].
In general, the solar irradiation cannot be controlled due to various weather conditions. Therefore, it is important to maintain the low operating temperature of solar cells for the better power generation efficiency. Several studies have examined passive and active heat removal technologies. To lower the operating temperature of a solar cell, free cooling on the back side of panel the due to the natural convection can generally be applied. In addition, passive cooling using phase change materials (PCMs) can also be used for heat absorption or release during the power generation process. Brinkworth examined the passive cooling performance in a free-standing PV panel with a duct, in which the heat removal depends on the buoyancy-driven air flow [3]. He suggested how the operating conditions and the proportions of the duct affect the air flow and heat transfer characteristics graphically. Yun et al. revealed a complex interrelationship between a ventilated PV façade and the overall energy performance of a building and suggested that a maximum 5 °C temperature reduction in the monthly average temperature can be anticipated due to the buoyancy air flow behind the PV façade [4]. Tonui et al. reported the use of a suspended thin flat metallic sheet at the middle, or fins at the back wall of an air duct as heat transfer augmentations in an air-cooled photovoltaic/thermal (PV/T) solar collector to improve its overall performance [5,6]. Huang et al. examined the passive cooling of BIPV with PCMs due to the experiments and simulations. They concluded that the operating temperature of the PV system could be reduced by more than 30 °C using PCMs with a single flat aluminum plate, and PCMs could be an effective means of reducing the operating temperature in PV devices [7,8,9]. Hasan et al. analyzed the energy efficiency and financial benefits of a PV system with PCMs [10]. They concluded that a PV system with PCMs were expected to be attractive systems in hot climates, such as Pakistan, but not in moderate climates, like Ireland. This means that the power generation efficiency and cost effectiveness can be strongly dependent on the climatic conditions for the application of PCMs to PV panels. Therefore, when PCMs are applied to a PV system, it is important to evaluate the annual thermal behavior of a PV panel under different weather conditions. The PCM based passive cooling technique for PVs could only be an option in future terms if a significant PCM material price drop were to occur. Furthermore, the future development of passive cooling techniques could be focused on the research of hybrid cooling options [11]. Recently comprehensive analysis of pork fat was addressed in Nižetić et al. for passive cooling applications in photovoltaics as a potential phase change material [12].
Since 2012, the Korean government decided to introduce a renewable portfolio standards (RPS) program to gradually increase the production of renewable energy by electricity companies [13]. In this respect, electricity companies in Korea have investigated a range of new and renewable energy resources, such as solar energy. In particular, to meet the government’s target through this RPS program, PV systems have been propagated as a desirable renewable energy source in urban areas of Korea.
The main objective of this paper was to examine the feasibility of PCMs to reduce the temperature rise of solar cells under various weather conditions in Seoul, Korea to increase the power generation efficiency of a PV system. For this purpose, two different PCMs with different phase change characteristics were prepared and the phase change temperatures and thermal conductivities were compared. The diurnal thermal behavior of a PV panel with PCMs under the different weather conditions of Seoul was evaluated using the 2-D transient thermal analysis program. The heat flow characteristics of the PV cell with PCMs and effects of the PCM types and the macro-packed PCM (MPPCM) methods on the operating temperatures under the different weather conditions were examined.
2. Materials and Methods
2.1. Thermal Properties of PCMs
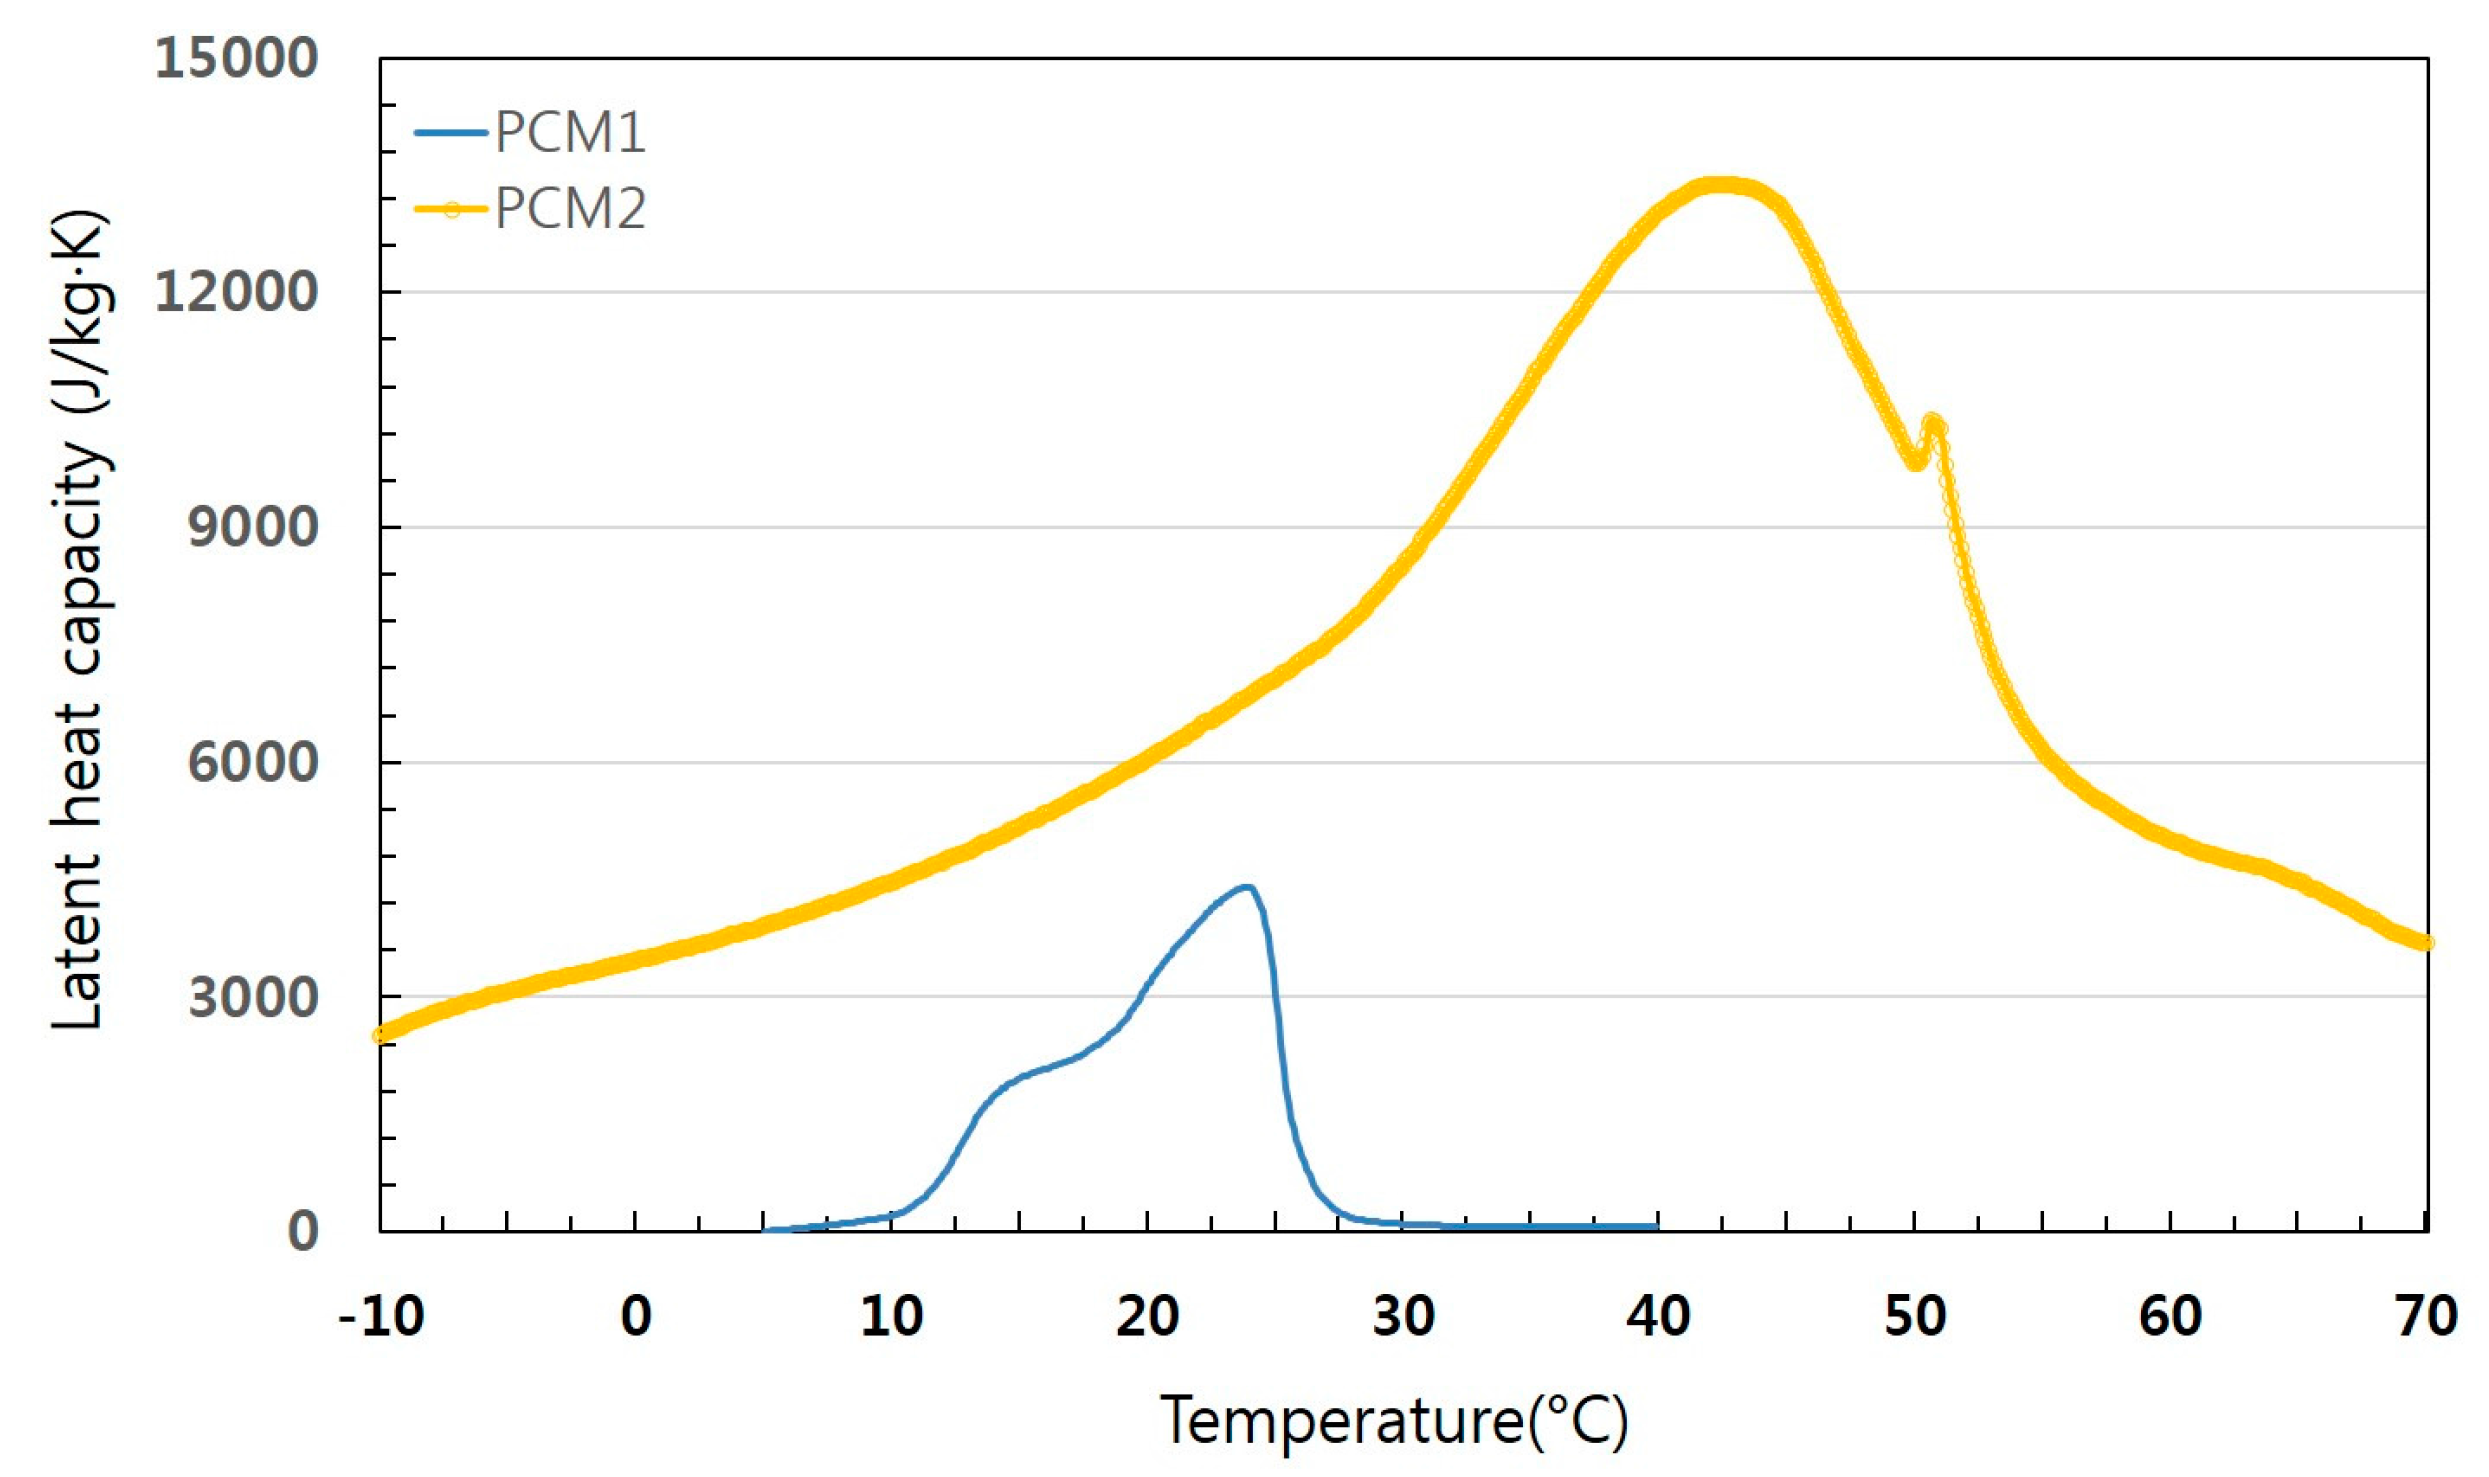
The operating temperature of a PV system can be affected by different weather conditions [2,14] and previous research has shown that the maximum PV temperature in southern Libya is approximately 125 °C, resulting in a 69% power reduction [15]. In general, the operating temperatures of a PV module should be below 85 °C to prevent the temperature-induced power failure and PV cell delamination. In the case of a PV panel integrated with the PCMs, the operating temperature rise depends on the thermal characteristics of the PCMs because PCMs can absorb excess heat until the PCM has melted completely. On the other hand, as the operating temperature decreases, the solidification of the PCM can act as an insulation material due to the low thermal conductivity of the PCM. In previous research, Cellura et al. reported that a PCM with a melting temperature between 28 °C and 32 °C can improve the power generation efficiency by 20% in summer [16]. To reduce the operating temperature under different weather conditions, the thermal properties, such as phase change temperature and specific heat capacity, are very important when PCMs are applied to PV modules. In this study, two different PCMs were prepared to compare the thermal behaviors due to the different phase change characteristics. In this research, fatty acid ester (coconut oil, referred to as PCM1) and petroleum jelly (Vaseline, referred to as PCM2) were obtained from the Korea Similac Corp. of Hanam, South Korea and DukSan Corp. of Seoul, South Korea, respectively and prepared as PCMs for a PV panel, which possess different phase change temperatures [17,18]. The phase change temperatures and specific heat capacities of the PCMs were analyzed by differential scanning calorimetry (DSC: TA instrument Q 1000). The temperature accuracy and calorimetric precision of DSC equipment were ±0.1 °C and ±1%, respectively. DSC measurements were carried out at a 5 °C/min heating-cooling rate, and a temperature range of 0–75 °C. The latent heat capacity of the PCMs was calculated by numerical integration of the area under the peaks at the state of the phase transitions. The phase change temperatures of PCM1 and PCM2 are around 24 °C and 44 °C, respectively, and Figure 1 shows the specific heat capacities. The thermal conductivities of the PCMs were measured through the TCi thermal conductivity analyzer. The precision and accuracy of this equipment were better than 1% and 5% according to ASTM 7984 respectively. The thermal conductivities of PCM1 and PCM2 are 0.321 W/m·K and 0.18 W/m·K, respectively.
2.2. Thermal Model for PV Panel with PCMs
The operating temperature of the PV panel can be affected by the physical variables of the PV cell materials, module structure and its configuration, outdoor weather conditions, and surrounding environment. In general, the PV panel is composed of various layers depending on the application of the PV system. In this study, a polycrystalline PV module was under consideration. This is made of crystalline silicon which is the dominant semiconducting material applied to PV technology for the products of solar cells. These solar cells were assembled into PV panels to generate electric power from sunlight. PV module has four different layers, as shown in Figure 2: a glass covering with anti-reflective coating (ARC), PV cells, ethylene vinyl acetate (EVA) layer, and a metal back sheet with a polyvinyl fluoride (PVF) layer. Table 1 lists the physical properties of the PV layers. In this study, PCM layer was attached to the backside of a PV panel not only by the macro-type container in the nylon bag, but also the honeycomb grid steel container to improve the conduction and convection heat transfer through the external surface. The thickness of PCM layer is 0.01 m. PCMs were assumed to be assembled on the metal back sheet of the PV panel, so that some part of the thermal energy from solar irradiation and conduction heat transfer could be absorbed by the PCM. It was assumed that there was no heat transfer in the cross-section direction of the PCM layer.
To simulate the operating temperature of the PV panel with PCMs under different weather conditions, heat transfer through solar irradiation, convection and radiation should be considered altogether. In addition, the heat capacity of a PV cell and PCMs should be modelled for transient conditions. To evaluate the thermal model for a PV panel with PCMs, the thermal analysis program, BISTRA, was used for transient heat transfer with a two-dimensional geometry [19]. In this program, the dynamic calculation parameters of time step interval and automatic triangulation and view factor calculation module were included. Multiple calculation cycles of linear equations for solving non-linear properties were applied. All the temperature calculations at time intervals were carried out through the Cranck-Nicolson finite difference method. In a previous study, the heat transfer model of PCM was validated for the prediction of the heat storage and dissipation characteristics of PCM concrete for the application in buildings. The verification results showed that the overall thermal behaviors of both the experiment and simulation of PCM concrete were similar [20]. In this program, the outdoor weather conditions are described with the external user-defined functions based on the typical weather data given at a fixed time interval. PCMs have the non-linear thermal properties. The specific heat capacity of the PCMs refer to temperature-dependent functions, which are described in the external text file inputs, between which linear interpolation is used. Direct and diffuse solar irradiation data were used to consider the solar irradiation from the sun. For the fixed time interval, the direct solar irradiation and diffuse solar irradiation on a horizontal surface were derived from the corresponding climate data. The solar position was calculated from the time of the current time-step and the geographical location (latitude, longitude, time zone). To consider the solar position under the different climate seasons, a latitude of 37.6 N and longitude of 127 E in Seoul were assumed. The position of the sun was described by azimuth angle (horizontal clockwise angle from the south to the sun) and elevation angle (vertical angle from the horizon to the sun).
Natural convective heat transfer from the panel surface to the surrounding air was considered based on ISO 6946 [21]. The convective heat transfer coefficients at the front and rear of the PV panel were determined by the following equations. For each case of the front and rear surface, the parameters of and were given different values.
where is convective heat transfer coefficient from surface to air, and are parameters based on heat flow direction, is the greatest difference between air temperature and surface temperature, is an air temperature, is the minimum surface temperature in contact with boundary condition, and is the maximum surface temperature in contact with boundary condition. In the RADCON module in BISTRA, each grey surface is connected to a black surface node and all black surface nodes are connected to each other in a so-called star diagram. Radiative heat transfer between the real surface with given emissivity and the corresponding black surface was given as follows.
where is the radiative heat transfer between real grey surface and black surface, is the surface area, is the surface emissivity, is radiation heat transfer coefficient of the black surface, is surface temperature of black surface, and is the surface temperature of the real surface. There can be a resultant radiation heat flow from the sky environment to the material surface.
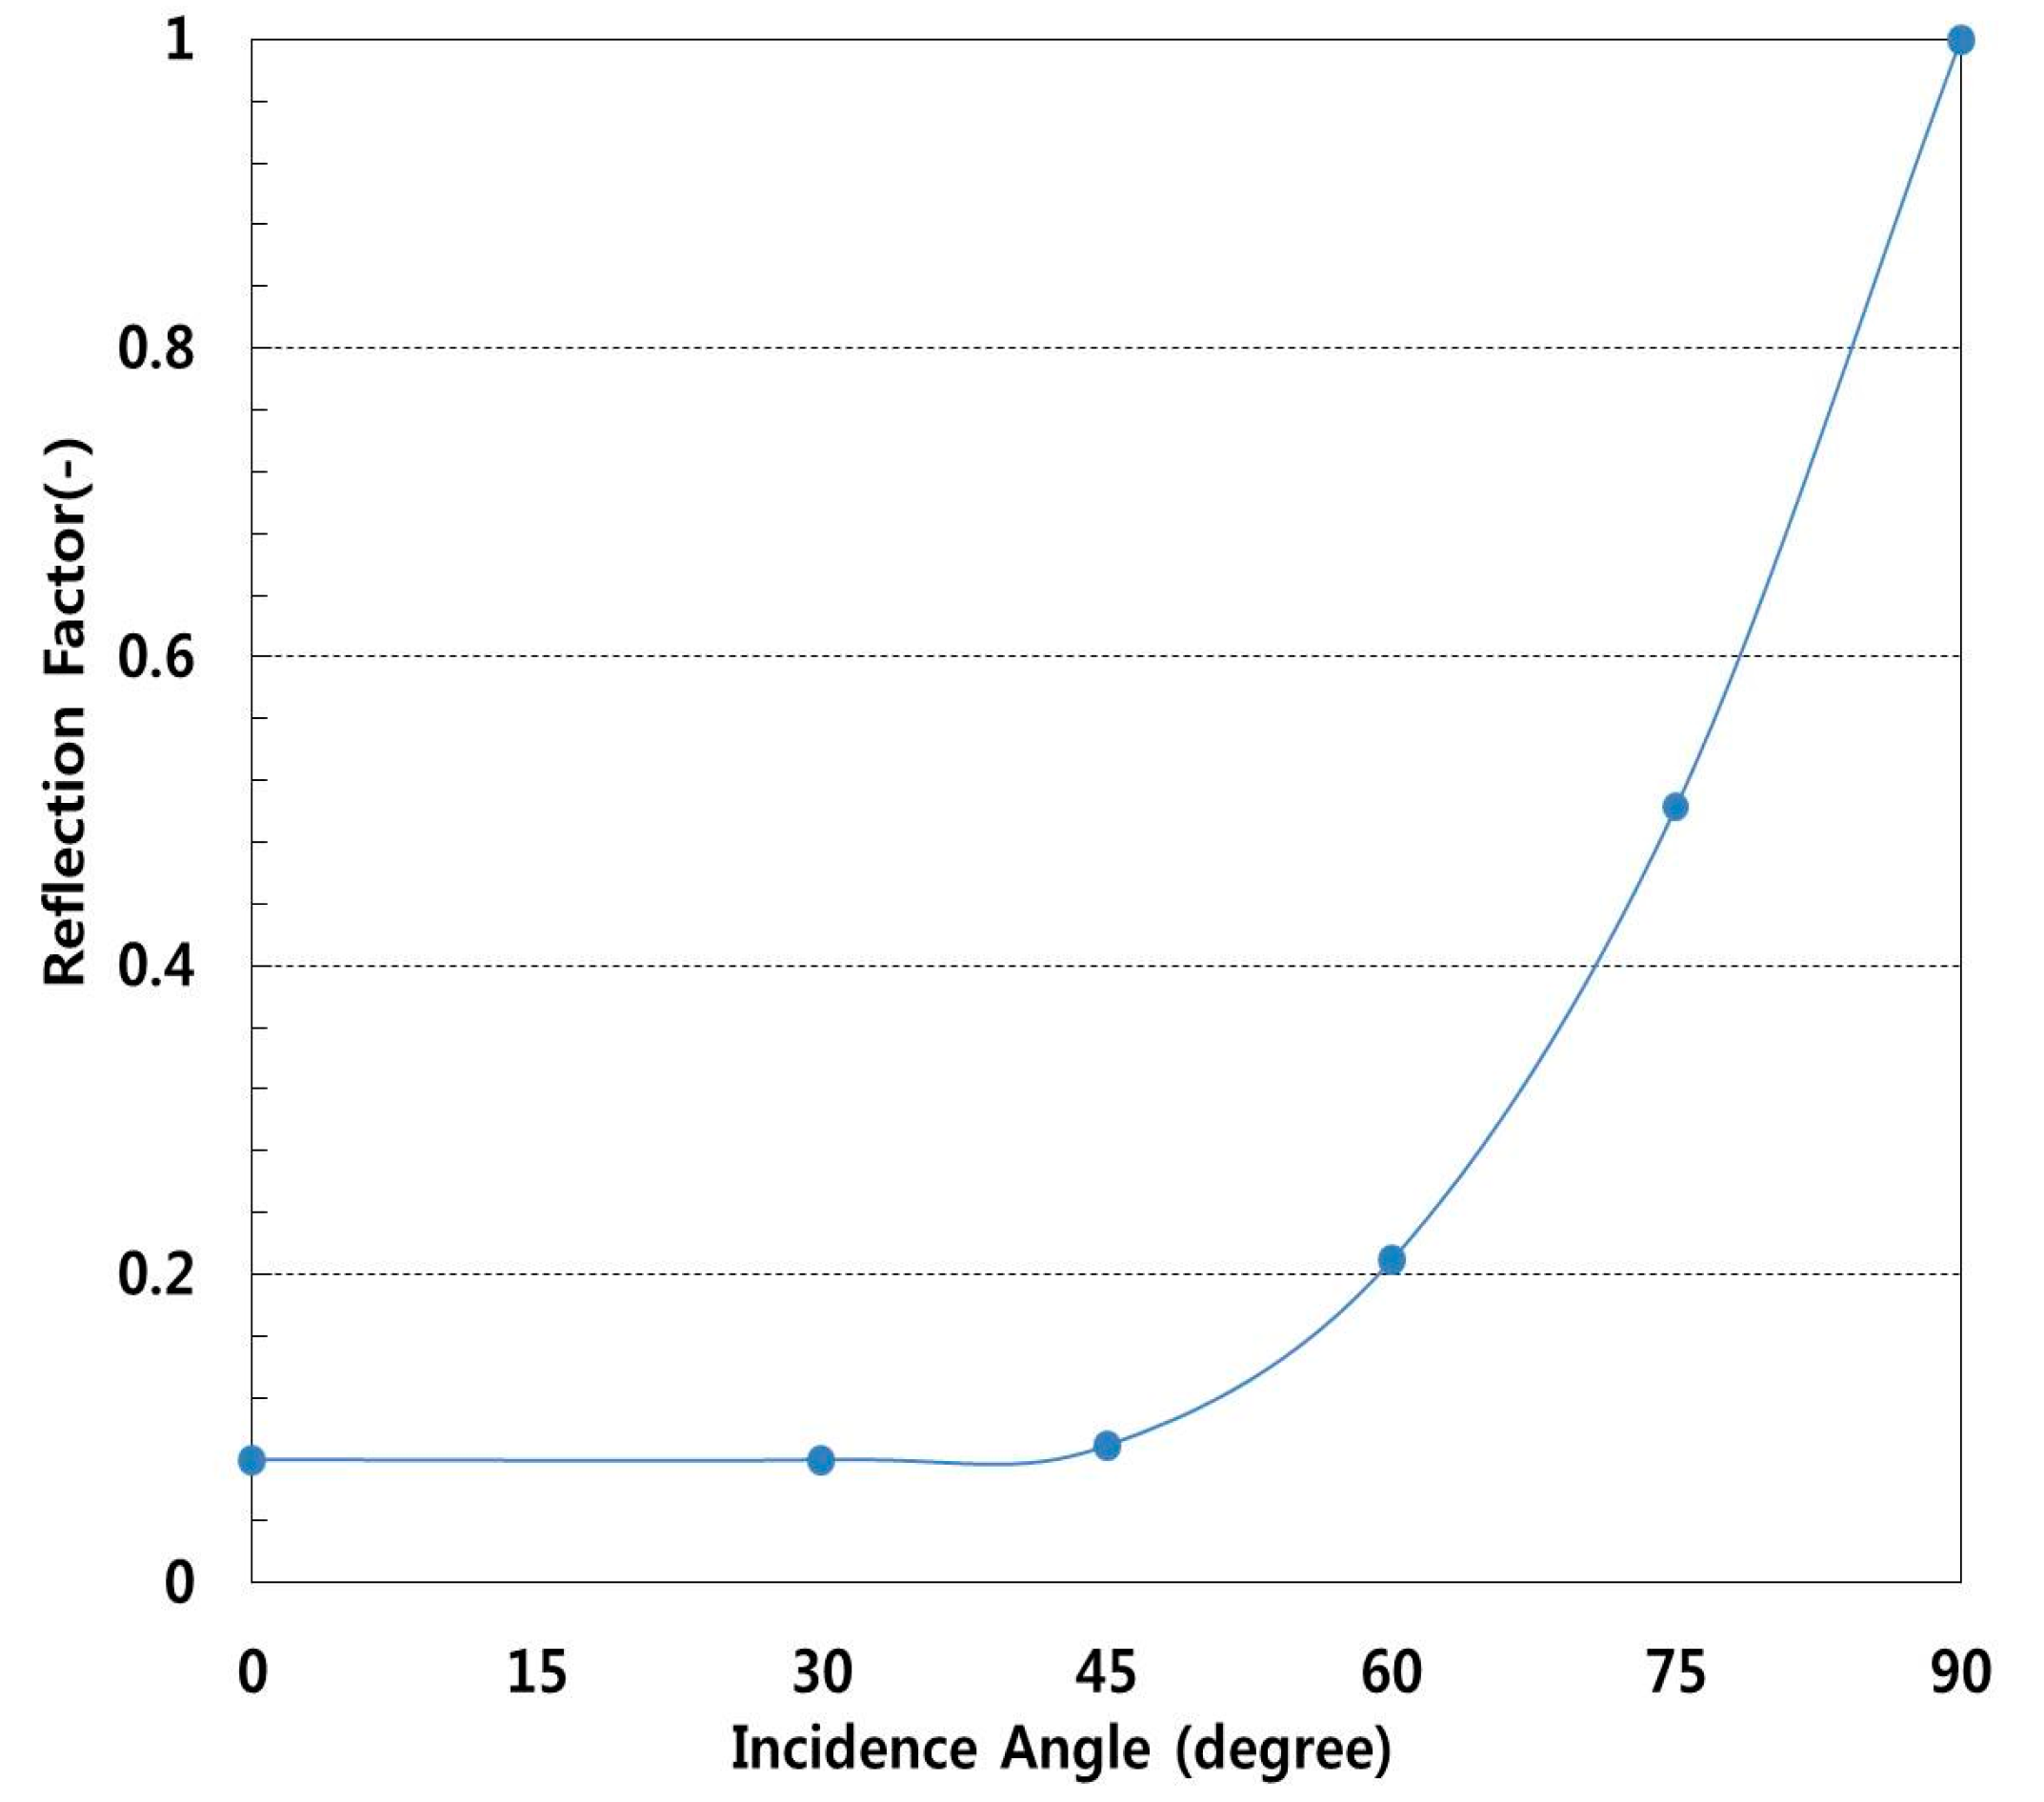
At the outer surface of the glass covering, an angle-dependent reflection factor, which is defined by a function referred to Figure 3, was considered. For normal incident solar irradiation, the solar properties of the outer surface of the glass covering are as follows: ρ0 = 0.08 and τ0 = 0.83. Here, the subscript 0 refers to the incident angle of 0°, irradiation normal to the PV panel surface. It was assumed that the PV panel faced the south and the tilt angle from the horizontal surface was fixed to 30°.
2.3. Validation of the Thermal Model for PV Panel with PCMs
The thermal model for PV panels with PCMs was validated through the experimental results. For this purpose, field experiments were carried out at Seosan, South Korea where a PV system coupled with PCM1 (coconut oil) was investigated. As shown in Figure 2b,c, polycrystalline PV panel was installed to the south and a PCM layer was attached to the backside of the PV panel by the macro-type container in the nylon bag. The PV cell temperatures were measured by attaching a T-type thermocouple between PCM container and the backside of the PV panel. Outdoor temperatures and solar irradiations were automatically measured every five minutes near the test facility from sunrise to sunset. These data were converted into input data in one hour intervals for verification of the thermal model for PV panels with PCMs using the BISTRA program. Based on the measured climate data and specific thermal property data, numerical simulations were conducted for the case of PCM1. Figure 4 shows the comparison of simulation results and experimental results, where there is good agreement between the simulation results and experimental results. Based on the validation results, it can be concluded that the thermal model for PV panel with PCMs of the BISTRA program is acceptable to evaluate the thermal performance of PV-PCM systems and that it can provide reasonable results.
2.4. Weather Conditions and Simulation Methods
2.4.1. Weather Conditions
The climate of Seoul is temperate with four distinct seasons. In summer, it is very hot and humid with temperatures soaring as high as 35 °C due to the influence of the North Pacific high-pressure zones. Most of the precipitation falls in summer between June and September. In winter, Seoul is influenced by the Siberian high-pressure zones and temperatures drop to as low as −20 °C. Figure 5 shows the four different weather conditions of Seoul, which are based on the typical weather data from the Korea Meteorological Administration (KMA). These data were referenced to the input functions of the outdoor temperatures (To), direct solar irradiation (Edir), and diffuse solar irradiation (Edif). In the case of an intermediate season with cloudy skies and moderate temperature, the outdoor temperatures range from 10 °C to 19.5 °C, and the maximum direct and diffuse solar irradiation reaches approximately 230 W/m2 and 65 W/m2. In the case of summer with clear skies and hot temperatures, the outdoor temperatures range from 21 °C to 29.5 °C, and the maximum direct and diffuse solar irradiation reaches approximately 650 W/m2 and 260 W/m2. In the case of summer with cloudy skies and hot temperatures, the outdoor temperatures range from 21 °C to 29.5 °C, and the maximum direct and diffuse solar irradiation reaches approximately 520 W/m2 and 200 W/m2. In the case of winter with cloudy skies and cold temperatures, the outdoor temperatures range from −4 °C to 4 °C, and the maximum direct and diffuse solar irradiation reaches approximately 230 W/m2 and 100 W/m2.
2.4.2. Simulation Methods
For the application of PCMs in buildings, leakage of the liquid-state PCM should be prevented. For this purpose, many studies have been conducted to evaluate the possibility of a container that can prevent the leakage of liquid-state PCM using the shape-stabilized PCM (SSPCM), or microencapsulated PCM (MPCM), or macro-packed PCM (MPPCM) [22,23,24,25]. In this study, the MPPCMs are applied to the backside of a PV panel not only by the macro-type container in the nylon bag [17], but also the honeycomb grid steel container to improve the conduction and convection heat transfer through the external surface [26]. Therefore, to evaluate the thermal behavior of a PV panel with different PCMs under the different weather conditions of Seoul, two MPPCM methods were selected as the simulation cases. As listed in Table 2, there are five different simulation cases according to the different MMPCM methods and PCM types. Case1 is the general PV panel without PCMs, and other cases are PV panels with PCMs. In this study, the calculation time-step was 10 min.
3. Results and Discussion
The thermal behavior of a PV panel with PCMs under the different weather conditions of Seoul was evaluated using the 2-D transient thermal analysis program, BISTRA. The total heat flux from a PV cell with PCMs to the surroundings and the effects of the PCM types and the MPPCM methods on the operating temperatures under different weather conditions are discussed.
3.1. Mean Opeating Temperatures of PV Cells
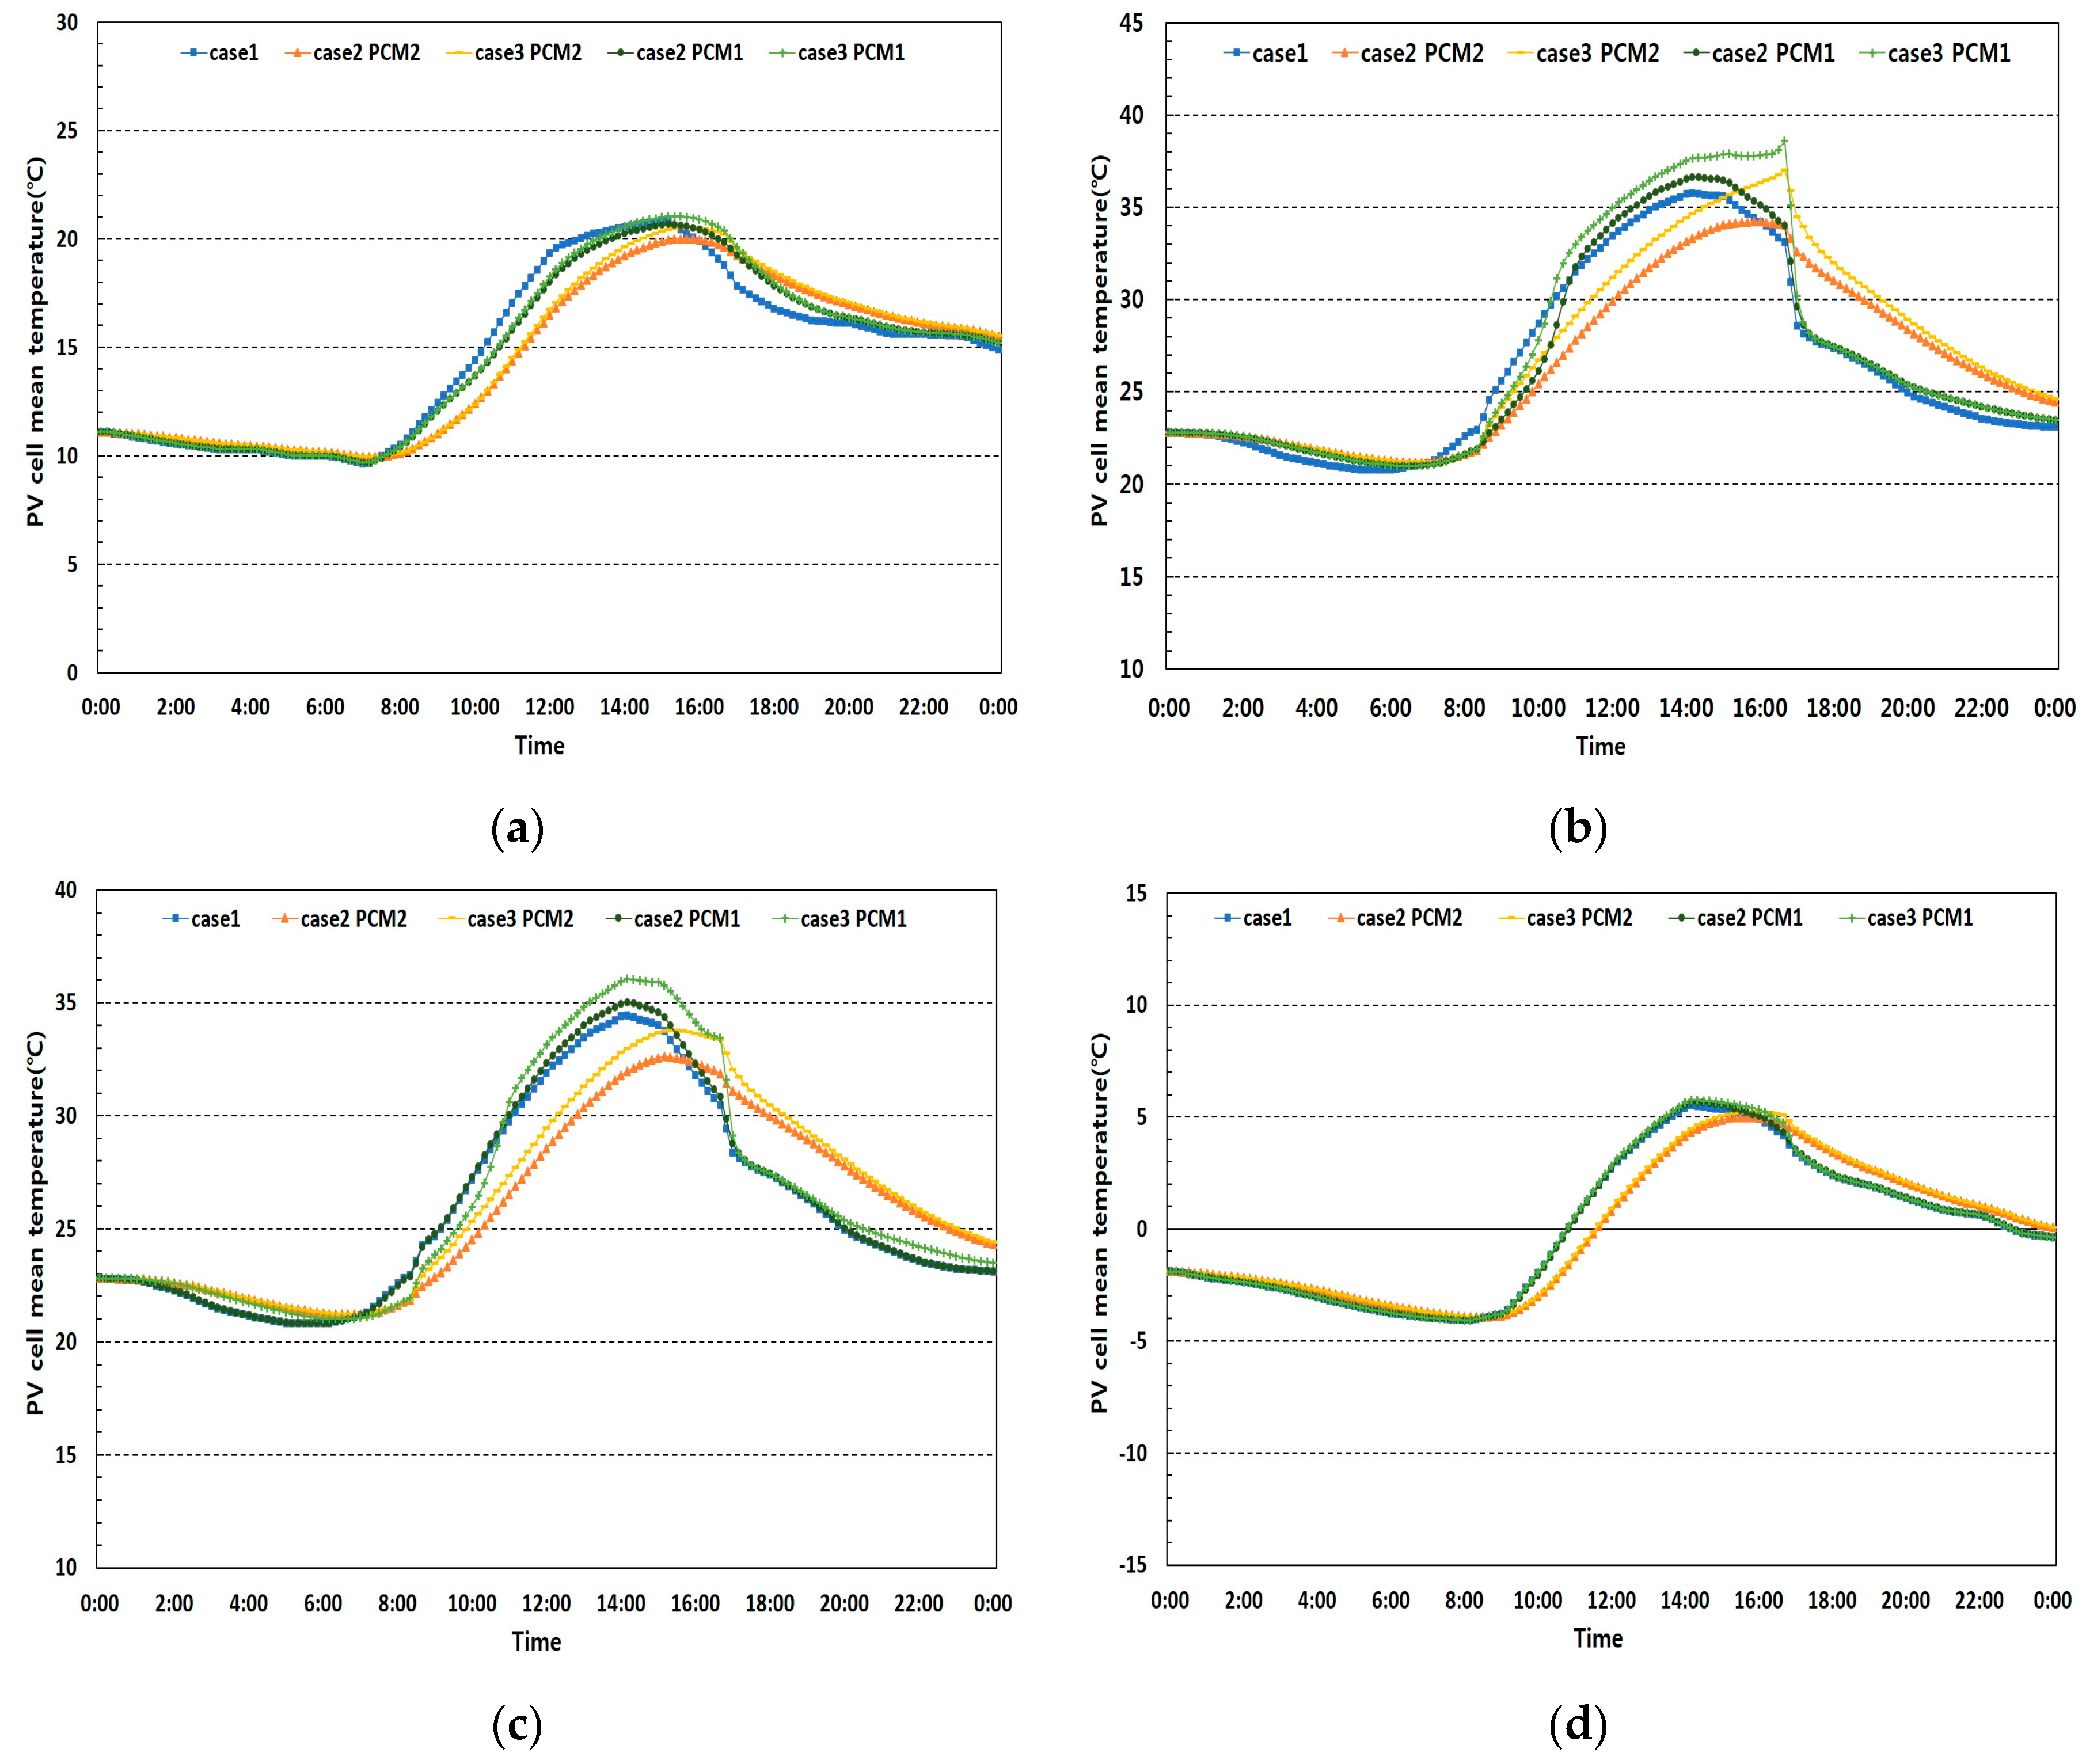
In this section, to evaluate the thermal behavior of a PV panel with PCMs, the mean operating temperatures of a PV cell were analyzed under different weather conditions. Figure 6 presents the results of the operating temperatures of a PV cell under different weather conditions. Due to the different phase change temperature ranges of which PCM1 and PCM2 were around 10 to 30 °C and 30 °C to 60 °C, respectively, the thermal behavior of the PV cells with PCMs were different. Especially since the phase change temperature of PCM1 is in the range of 10 °C to 30 °C, the thermal performance of Case3 PCM1 becomes worse than Case1 when the mean operating temperature of the PV cell becomes higher than 30 °C. In the morning, the mean operating temperatures increase gradually due to the solar heat gain and convective heat transfer at the panel surfaces. In the case of an intermediate season with cloudy skies and moderate temperatures, the mean operating temperatures of a PV cell with PCM1 and PCM2 decrease in the morning by 1.5 °C and 3.2 °C, respectively, compared to Case1. On the other hand, the mean operating temperatures of Case1 decrease considerably after 15:00 compared to those of PV cells with PCMs. This is related to the specific heat capacity and low thermal conductivity of PCMs. Owing to the small specific heat capacity of PCM1 compared to PCM2, the heat absorption rates of a PV cell with PCM1 can be smaller than the rates of a PV cell with PCM2. In addition, the heat release rates in Case2 and Case3 are reduced due to the low thermal conductivity of PCMs. Using a honeycomb grid steel container to increase the thermal conductance, a slight reduction of the mean operating temperatures is anticipated due to the low convective heat release to the surroundings.
In the case of summer with clear skies and hot temperatures, the mean operating temperatures of the PV cell with PCM2 decreased in the morning by 4.0 °C in the Case2 PCM2 and 2.5 °C in the Case3 PCM2 compared to Case1. On the other hand, the mean operating temperatures of a PV cell with PCM1 decreased before 10:00 a.m. but increased after 10:00 a.m. In addition, in the case of summer with cloudy skies and hot temperatures, the results were similar to the case of summer with clear skies and hot temperatures. This means that PCM1 is unsuitable for use in thermal storage due to the small specific heat capacity in summer. In the case of winter with cloudy skies and cold temperatures, the mean operating temperatures of the PV cell with PCM2 was 2.0 °C lower until 16:00 compared to Case1. On the other hand, the mean operating temperatures of the PV cells with PCM1 were similar to Case1. As shown in Figure 5, the operating temperature drop using a PCM2 with a phase change temperature of 44 °C was higher than that using a PCM1 with a phase change temperature of 24 °C under the weather conditions of Seoul due to the thermal properties, such as the phase change temperature, and specific heat capacity, and thermal conductivity. Therefore, the selection of PCM type was more important than the MMPCM methods when the PCMs are used for the performance enhancement of a PV panel.
3.2. Total Heat Flux from the PV Panel to the Surroundings
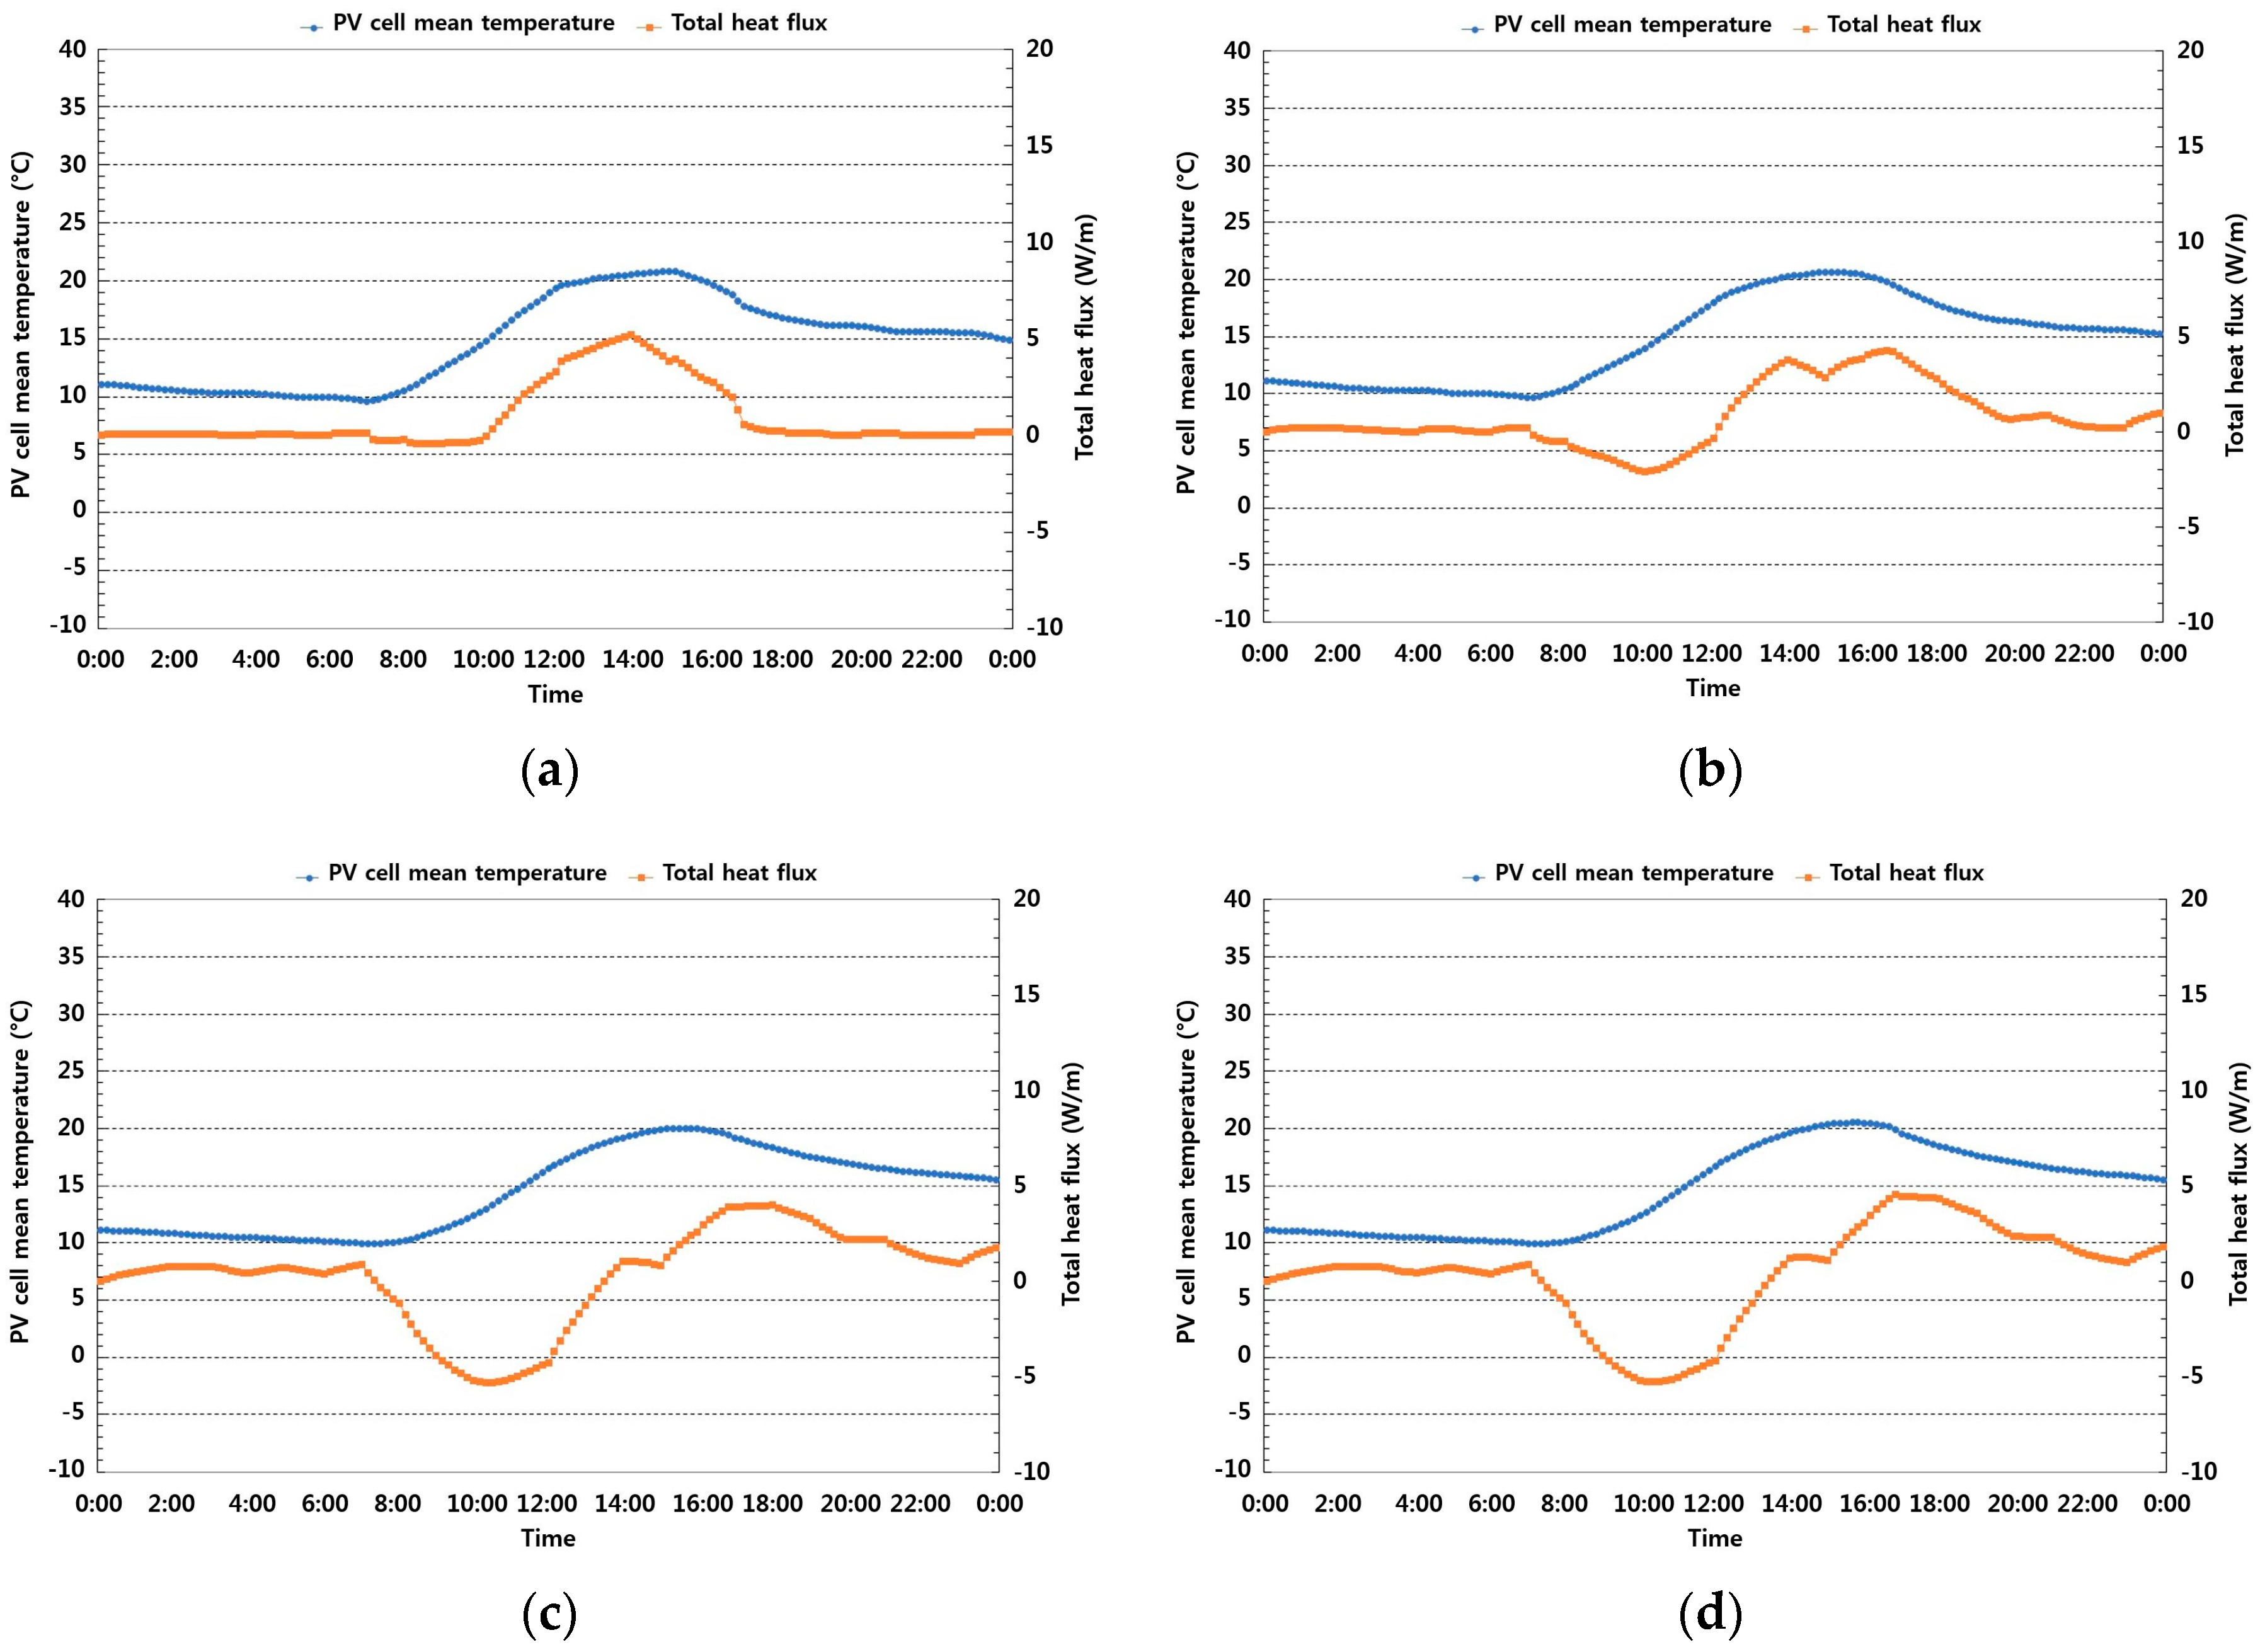
In this section, the total heat flux from a PV panel to the surroundings was analyzed to estimate the heat balance of a PV panel under different weather conditions. Figure 7 compares the mean operating temperatures of a PV cell and total heat flux from a PV panel under clear skies and hot temperatures in summer. In Case1, the total heat flux changed with the solar irradiation and outdoor temperature due to the small heat capacity of the PV panel. In the afternoon, there was a sudden change in the time of the total heat flux because of the sudden decrease in absorbed solar irradiation due to the reflection factor of the glass covering. When the sun was not shining, the total heat flux from the PV panel showed little change. The maximum heat flux was approximately 14.5 W/m when the total solar irradiation was at a maximum during the day. In Case2 PCM1, the total heat flux changed slightly until 10:00, but this increased abruptly after 10:00. This is because the specific heat capacity of PCM1 was too small. In the afternoon, the difference in the total heat flux was similar to that of Case1. In Case2 PCM2, the total heat flux from the PV panel was smaller than that of Case1 due to the thermal effect of PCM2. The maximum total heat flux was approximately 12.1 W/m when there was a sudden decrease in the absorbed solar irradiation due to the reflection factor of the glass covering. When the sun was not shining in the afternoon, total heat flux from the PV panel decreased gradually to 3 W/m. In Case3 PCM2, the total heat flux change process was similar to Case2 PCM2. On the other hand, the maximum total heat flux of approximately 14.4 W/m was somewhat higher than Case2 PCM2 due to the difference in the heat transfer rate with the MPPCM methods. This means that the mean operating temperature of the PV cell and total heat flux from the surface can be reduced by increasing the heat transfer rate through the honeycomb grid steel container for PCMs.
Figure 8 compares the mean operating temperatures of a PV cell and the total heat flux from the PV panel under cloudy skies and moderate temperatures in intermediate season. In Case1, the total heat flux changed with the solar irradiation and outdoor temperature due to the small heat capacity of the PV panel. In addition, when the sun was not shining, the total heat flux from PV panel showed little change. The maximum total heat flux was approximately 5.0 W/m when the direct solar irradiation was a maximum during the day. Although the specific heat capacity of PCM1 was too small, the heat storage effect of PCM1 can be found by comparing the total changes in heat flux in Case1 with those in Case2 PCM1. The approximately two hour time delay effect was confirmed. Under the intermediate climatic conditions of low solar irradiation intensity and moderate temperatures, the mean operating temperature generally decreased in the morning and increased in the afternoon. This is because the amount of heat absorbed in the PCMs in the morning is released to the atmosphere in the afternoon. On the other hand, there was no large change in the mean operating temperature using PCM1 because the amount of direct solar irradiation during the day was less than approximately 230 W/m2 and the specific heat capacity of PCM1 was low.
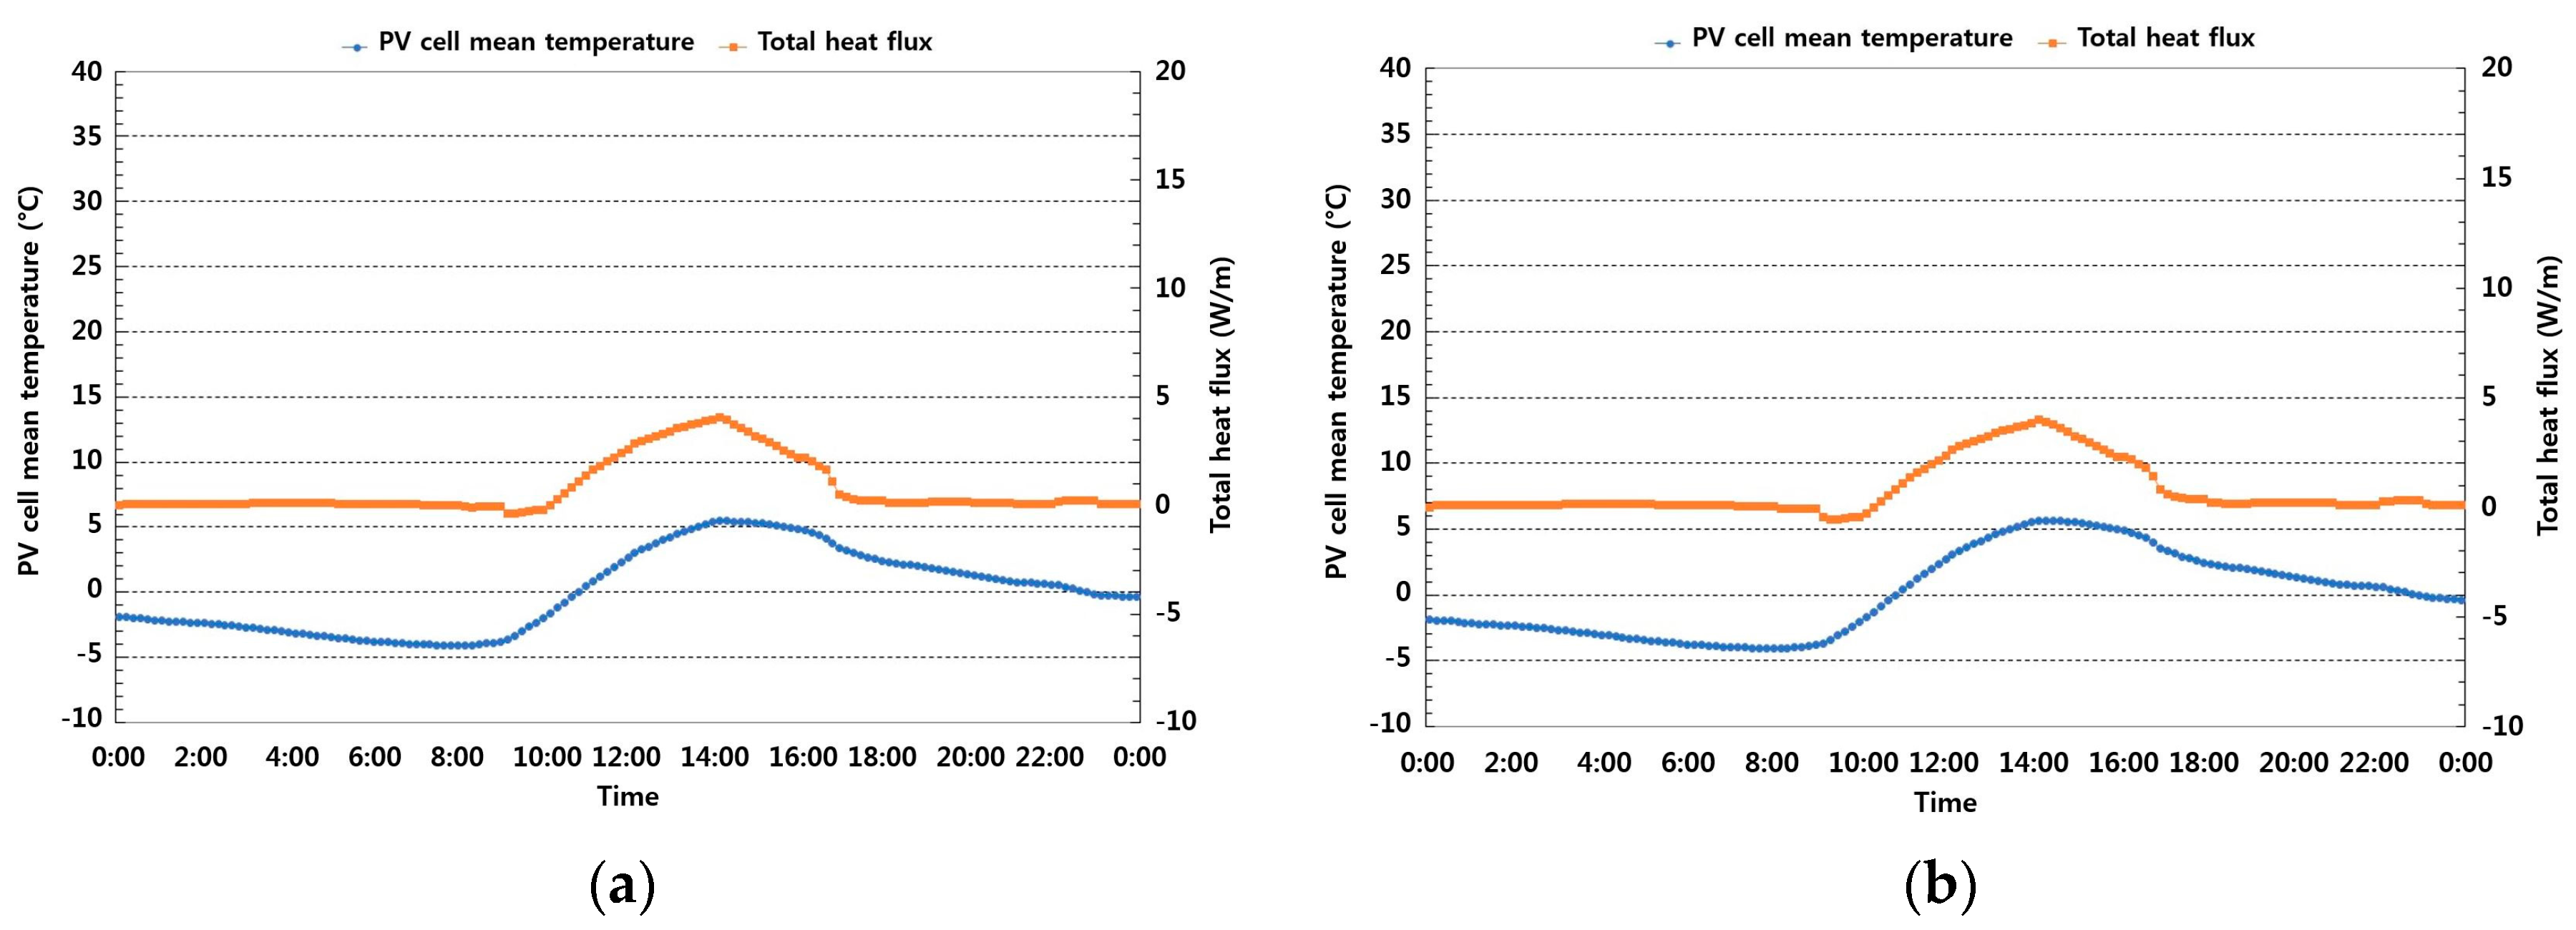
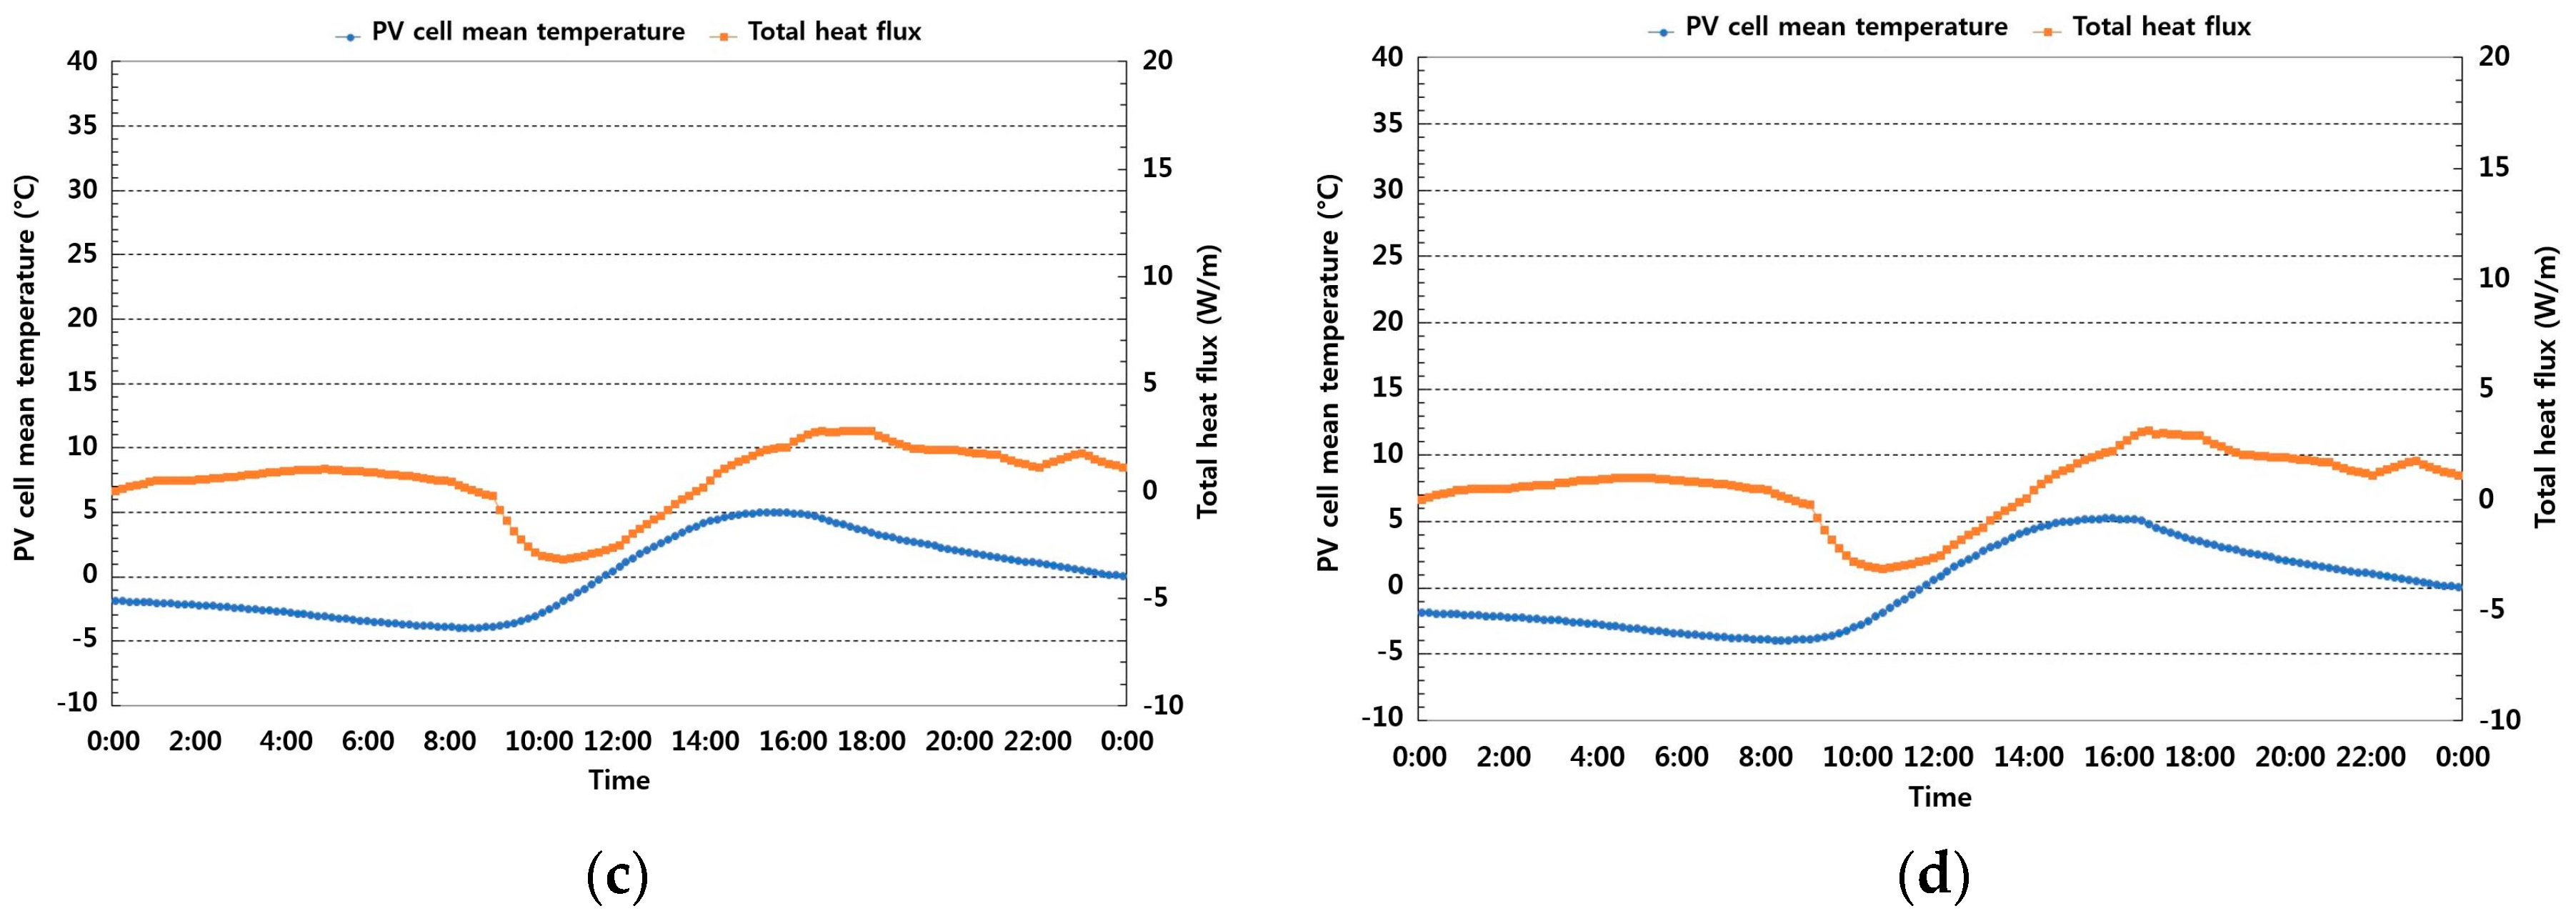
Figure 9 compares the mean operating temperatures of the PV cell and the total heat flux from PV panel under cloudy skies and cold temperatures in winter. A comparison of Case1 with Case2 PCM1 showed that the difference was not significant due to the small specific heat capacity of PCM1 in winter. Using PCM2 for the PV panel, the total heat flux can be changed due to the heat storage effect of PCM2, but the mean operating temperature change was not large during the day.
3.3. Discussions about the Improvement of Power Generation Efficiency
Several studies have expressed the PV cell temperature as a function of the weather variables, such as the outdoor temperature and the wind speed, as well as solar irradiation intensity with system-dependent properties. In general, the effect of the PV cell temperature on the power generation efficiency of a PV cell can be related to the fill factor (FF), open-circuit voltage, and short-circuit current. As the thermally-excited electrons begin to dominate the electrical properties of a PV cell, both the open-circuit voltage and the FF decrease substantially with temperature, whereas the short-circuit current increases slightly. The electrical power output of a PV module can be derived from the standard test conditions prepared by the manufacturer of the module. Many correlations have been reported for PV power generated as a function of the cell/module operating temperature and basic environmental variables [27]. Many of them are linear equations, whereas others are more complex, nonlinear multivariable regression equations [28]. In the case of PCM applications, however, it is difficult to predict the PV cell temperature based on existing studies because the heat transfer characteristics are different from those of existing products. The PV cell temperature can be predicted by evaluating the dynamic thermal behavior of the PCM, as in this study, and the improvement of the power generation efficiency can be evaluated using these results. In a typical PV panel, high operating temperatures induce an efficiency drop at an approximate rate of 0.5%/°C over a nominal PV cell operating temperature of 25 °C, as determined by the standard test conditions (STC) [29]. Considering the mean operating temperature reduction of 4 °C by PCM in this study, an efficiency improvement of approximately 2% can be estimated. On the other hand, the effect of PV cell temperature reduction by PCM depends on the climatic conditions, such as solar irradiation and outdoor temperature. Therefore, it is necessary to design and evaluate the performance considering the annual climate characteristics.
4. Conclusions
To lower the operating temperature of a solar cell, free cooling on the back side of the PV panel due to the natural convection can be applied. Nowadays, PV systems with PCMs are expected to be attractive systems in hot climates. To apply PCMs to PV systems, it is important to evaluate the annual thermal behavior of a PV panel under different weather conditions. Especially in Korea, there are four distinct seasons, so the effect of PCMs on the power generation efficiency should be clearly evaluated depending on the different climate conditions. This study aimed to examine the feasibility of phase change materials (PCMs) to reduce the temperature rise of a solar cell under the climate in Seoul, Korea. For this purpose, the diurnal thermal behavior of a PV panel with PCMs was evaluated under the different weather conditions of Seoul through the 2-D transient thermal analysis program. The heat flow characteristics though the PV cell with PCMs and the effects of the PCM types and the macro-packed PCM (MPPCM) methods on the operating temperatures under the different weather conditions were discussed.
In this study, two different PCMs were prepared by considering a melting temperature range, and thermal properties (specific heat, thermal conductivity) were measured. The phase change temperatures of PCM1 and PCM2 were around 24 °C and 44 °C, respectively. Thermal conductivities of PCM1 and PCM2 were 0.321 W/m·K and 0.18 W/m·K, respectively. To evaluate the thermal model for a PV panel with PCMs, thermal analysis program, BISTRA, was used for transient heat transfer with a two-dimensional geometry. Thermal model for PV panel with PCM was validated through the experimental results. Based on the validation results, it can be concluded that the thermal model for PV panel with PCMs of BISTRA program is acceptable to evaluate the thermal performance of the PV-PCM system and it can provide reasonable results.
The total heat flux from a PV cell with PCMs to the surroundings and the effect of the PCM types and MPPCM methods on the operating temperatures under different weather conditions are discussed. Considering the mean operating temperature reduction of 4 °C by PCMs in this study, an efficiency improvement of approximately 2% can be estimated under the weather conditions of Seoul. The selection of the PCM type was found to be more important than the MMPCM methods when the PCMs are used for the performance enhancement of a PV panel and the mean operating temperature of the PV cell and total heat flux from the surface can be reduced by increasing the heat transfer rate through the honeycomb grid steel container for PCMs. An improvement in the power generation efficiency of a PV panel can be anticipated by adding PCMs to the backside of PV panels.
Acknowledgments
This research was supported by a grant (15CTAP-C098006-01) from Technology Advancement Research Program funded by Ministry of Land, Infrastructure and Transport of Korean government.
Author Contributions
Jae-Han Lim conceived and designed the simulations, and analyzed the data and wrote the paper; Yoon-Sun Lee performed the simulations; Yoon-Bok Seong contributed materials and analysis tools.
Conflicts of Interest
The authors declare no conflict of interest.
References
- Radziemska, E. The effect of temperature on the power drop in crystalline silicon solar cell. Energy 2003, 28, 1–12. [Google Scholar] [CrossRef]
- Skoplaki, E.; Palyvos, J.A. Operating temperature of photovoltaic modules: A survey of pertinent correlations. Renew. Energy 2009, 34, 23–29. [Google Scholar] [CrossRef]
- Brinkworth, B.J. Estimation of flow and heat transfer for the design of PV cooling ducts. Sol. Energy 2000, 69, 413–420. [Google Scholar] [CrossRef]
- Yun, G.Y.; McEvoy, M.; Steemers, K. Design and overall energy performance of a ventilated photovoltaic façade. Sol. Energy 2007, 81, 383–394. [Google Scholar] [CrossRef]
- Tonui, J.K.; Tripanagnostopoulos, Y. Improved PV/T solar collectors with heat extraction by forced or natural air circulation. Renew. Energy 2007, 32, 623–637. [Google Scholar] [CrossRef]
- Tonui, J.K.; Tripanagnostopoulos, Y. Air-cooled PV/T solar collectors with low cost performance improvements. Sol. Energy 2007, 81, 498–511. [Google Scholar] [CrossRef]
- Huang, M.J.; Eames, P.C.; Norton, B. Phase change materials for limiting temperature rise in building integrated photovoltaics. Sol. Energy 2006, 80, 1121–1130. [Google Scholar] [CrossRef]
- Huang, M.J.; Eames, P.C.; Norton, B. Comparison of a small-scale 3D PCM thermal control model with a validated 2D PCM thermal control model. Sol. Energy Mater. Sol. Cells 2006, 90, 1961–1972. [Google Scholar] [CrossRef]
- Huang, M.J.; Eames, P.C.; Norton, B. Thermal regulation of building-integrated photovoltaics using phase change materials. Int. J. Heat Mass Transf. 2004, 47, 2715–2733. [Google Scholar] [CrossRef]
- Hasan, A.; McCormack, S.J.; Huang, M.J.; Norton, B. Energy and Cost Saving of a Photovoltaic-Phase Change Materials (PV-PCM) System through Temperature Regulation and Performance Enhancement of Photovoltaics. Energies 2014, 7, 1318–1331. [Google Scholar] [CrossRef]
- Nižetić, S.; Papadopoulos, A.M.; Giama, E. Comprehensive analysis and general economic-environmental evaluation of cooling techniques for photovoltaic panels, Part I: Passive cooling techniques. Energy Convers. Manag. 2017, 149, 334–354. [Google Scholar] [CrossRef]
- Nižetić, S.; Arici, M.; Bilgin, F.; Grubišić-Čabo, F. Investigation of pork fat as potential novel phase change material for passive cooling applications in photovoltaics. J. Clean. Prod. 2018, 170, 1006–1016. [Google Scholar] [CrossRef]
- International Energy Agency (IEA) Photovoltaic Power Systems Programme (PVPS). Available online: http://www.iea-pvps.org/index.php?id=146 (accessed on 1 June 2017).
- Bücher, K. Site dependence of the energy collection of PV modules. Sol. Energy Mater. Sol. Cells 1997, 47, 85–94. [Google Scholar] [CrossRef]
- Nassar, Y.F.; Salem, A.A. The reliability of the photovoltaic utilization in southern cities of Libya. Desalination 2007, 209, 86–90. [Google Scholar] [CrossRef]
- Cellura, M.; Ciulla, G.; Brano, V.L.; Marvuglia, A.; Orioli, A. A Photovoltaic panel coupled with a phase changing material heat storage system in hot climates. In Proceedings of the 25th Conference on Passive and Low Energy Architecture, Dublin, Ireland, 22–24 October 2008. [Google Scholar]
- Chang, S.J.; Kang, Y.; Wi, S.; Jeong, S.G.; Kim, S. Hygrothermal performance improvement of the Korean wood frame walls using macro-packed phase change materials (MPPCM). Appl. Ther. Eng. 2017, 114, 457–465. [Google Scholar] [CrossRef]
- Indartono, Y.S.; Suwono, A.; Pratama, F.Y. Improving photovoltaics performance by using yellow petroleum jelly as phase change material. Int. J. Low-Carbon Technol. 2016, 11, 333–337. [Google Scholar] [CrossRef]
- Physibel. Available online: http://www.physibel.be/bistra.htm (accessed on 1 June 2017).
- Song, J.H.; Jin, H.S.; Jeong, S.G.; Kim, S.; Song, S.Y.; Lim, J.H. Empirical validation of heat transfer performance simulation of Graphite/PCM concrete materials for thermally activated building system. Int. J. Polym. Sci. 2017, 2017, 6792621. [Google Scholar] [CrossRef]
- ISO. ISO 6946 Building Components and Building Elements—Thermal Resistance and Thermal Transmittance—Calculation Method; ISO: Geneva, Switzerland, 2007. [Google Scholar]
- Wang, Y.; Wang, S.; Wang, J.; Yang, R. Preparation, stability and mechanical property of shape-stabilized phase change materials. Energy Build. 2014, 77, 11–16. [Google Scholar] [CrossRef]
- Jurkowska, M.; Szczygieł, I. Review on properties of microencapsulated phase change materials slurries (mPCMS). Appl. Therm. Eng. 2016, 98, 365–373. [Google Scholar] [CrossRef]
- Wang, Y.; Xia, T.D.; Zheng, H.; Feng, H.X. Stearic acid/silica fume composite as form-stable phase change material for thermal energy storage. Energy Build. 2011, 43, 2365–2370. [Google Scholar] [CrossRef]
- Zhang, P.; Hu, Y.; Song, L.; Ni, J.; Xing, W.; Wang, J. Effect of expanded graphite on properties of high-density polyethylene/paraffin composite with intumescent flame retardant as a shape-stabilized phase change material. Sol. Energy Mater. Sol. C 2010, 94, 360–365. [Google Scholar] [CrossRef]
- Biwole, P.; Eclache, P.; Kuznik, F. Improving the performance of solar panels by the use of phase-change materials. In Proceedings of the World Renewable Energy Congress, Linköping, Sweden, 8–13 May 2011; pp. 2953–2960. [Google Scholar]
- Skoplaki, E.; Palyvos, J.A. On the temperature dependence of photovoltaic module electrical performance: A review of efficiency/power correlations. Sol. Energy 2009, 83, 614–624. [Google Scholar] [CrossRef]
- Rosell, J.I.; Ibáñez, M. Modelling power output in photovoltaic modules for outdoor operating conditions. Energy Convers. Manag. 2006, 47, 2424–2430. [Google Scholar] [CrossRef]
- Emery, K.; Burdick, J.; Caiyem, Y.; Dunlavy, D.; Field, H.; Kroposki, B.; Moriatry, T. Temperature dependence of photovoltaic cells, modules and systems. In Proceedings of the 25th IEEE PV Specialists Conference, Washington, DC, USA, 13–17 May 1996; pp. 1275–1278. [Google Scholar]
Figure 1.
Latent heat capacities of prepared PCMs.

Figure 2.
Thermal model for PV panel with PCMs: (a) schematic diagram of thermal model; (b) and example of a polycrystalline PV panel; and (c) an example of a PCM and macro-type container in the nylon bag.
Figure 2.
Thermal model for PV panel with PCMs: (a) schematic diagram of thermal model; (b) and example of a polycrystalline PV panel; and (c) an example of a PCM and macro-type container in the nylon bag.
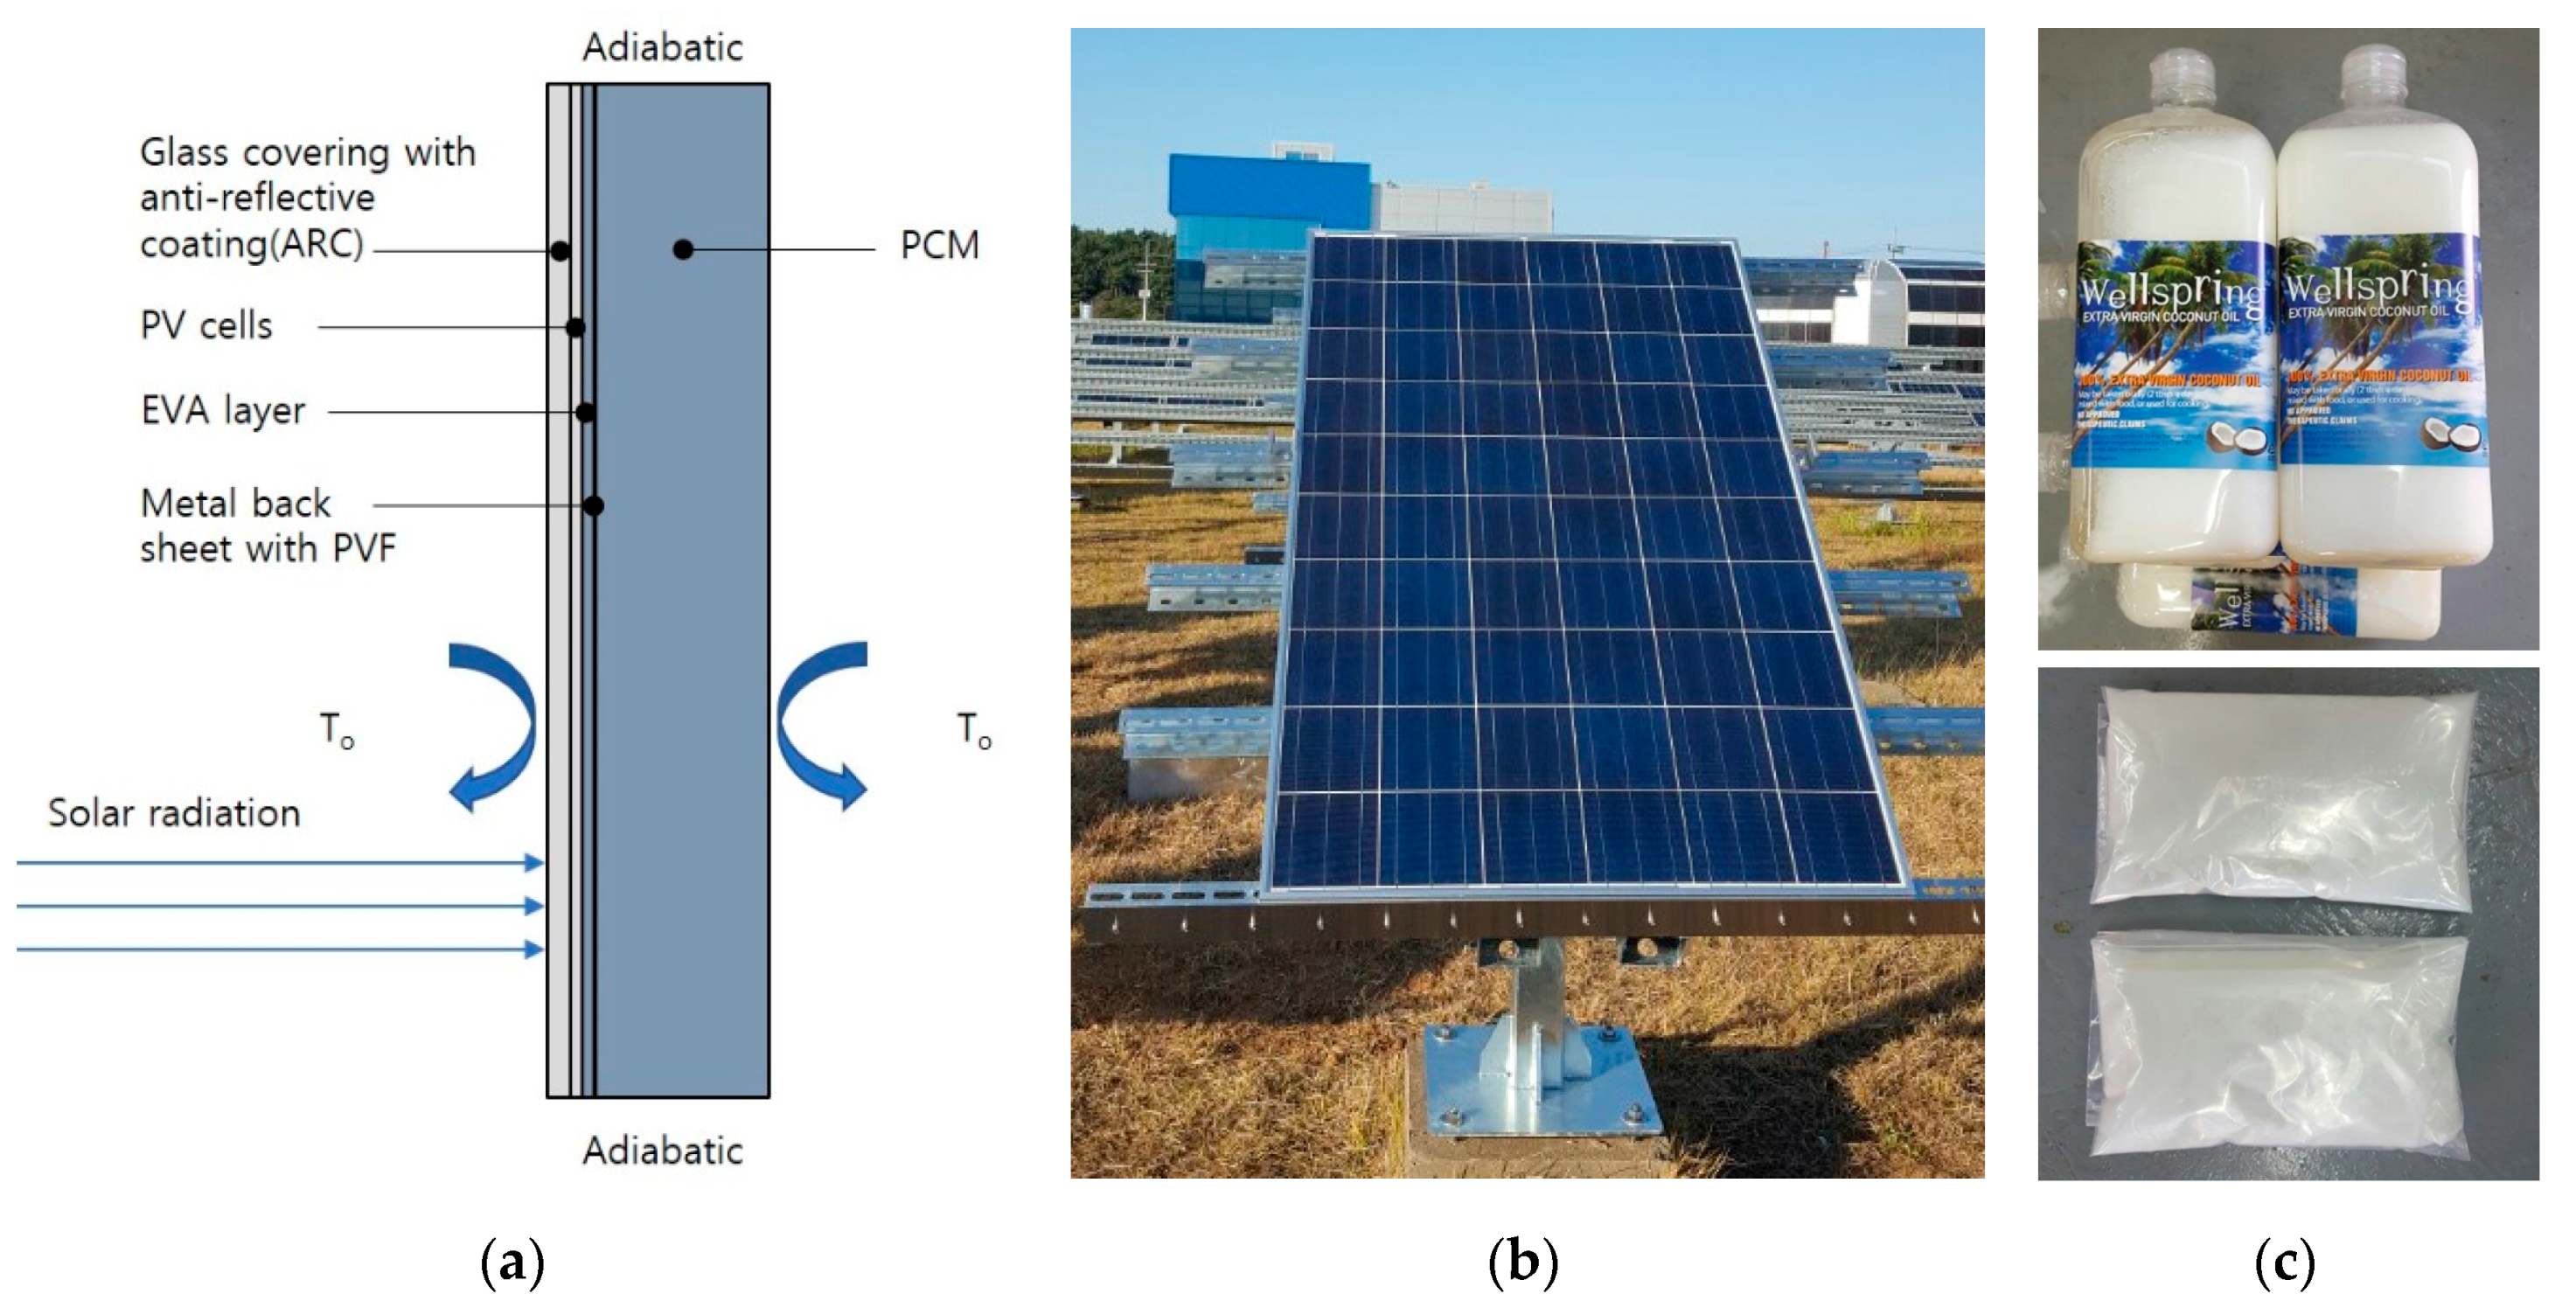
Figure 3.
Reflection factor of glass material according to the incidence angle.

Figure 4.
Comparison of the simulation results and experimental results.

Figure 5.
Four different weather conditions of Seoul: (a) cloudy sky and moderate temperature (intermediate season); (b) clear sky and hot temperature (summer season); (c) cloudy sky and hot temperature (summer season); (d) cloudy sky and cold temperature (winter season).
Figure 5.
Four different weather conditions of Seoul: (a) cloudy sky and moderate temperature (intermediate season); (b) clear sky and hot temperature (summer season); (c) cloudy sky and hot temperature (summer season); (d) cloudy sky and cold temperature (winter season).
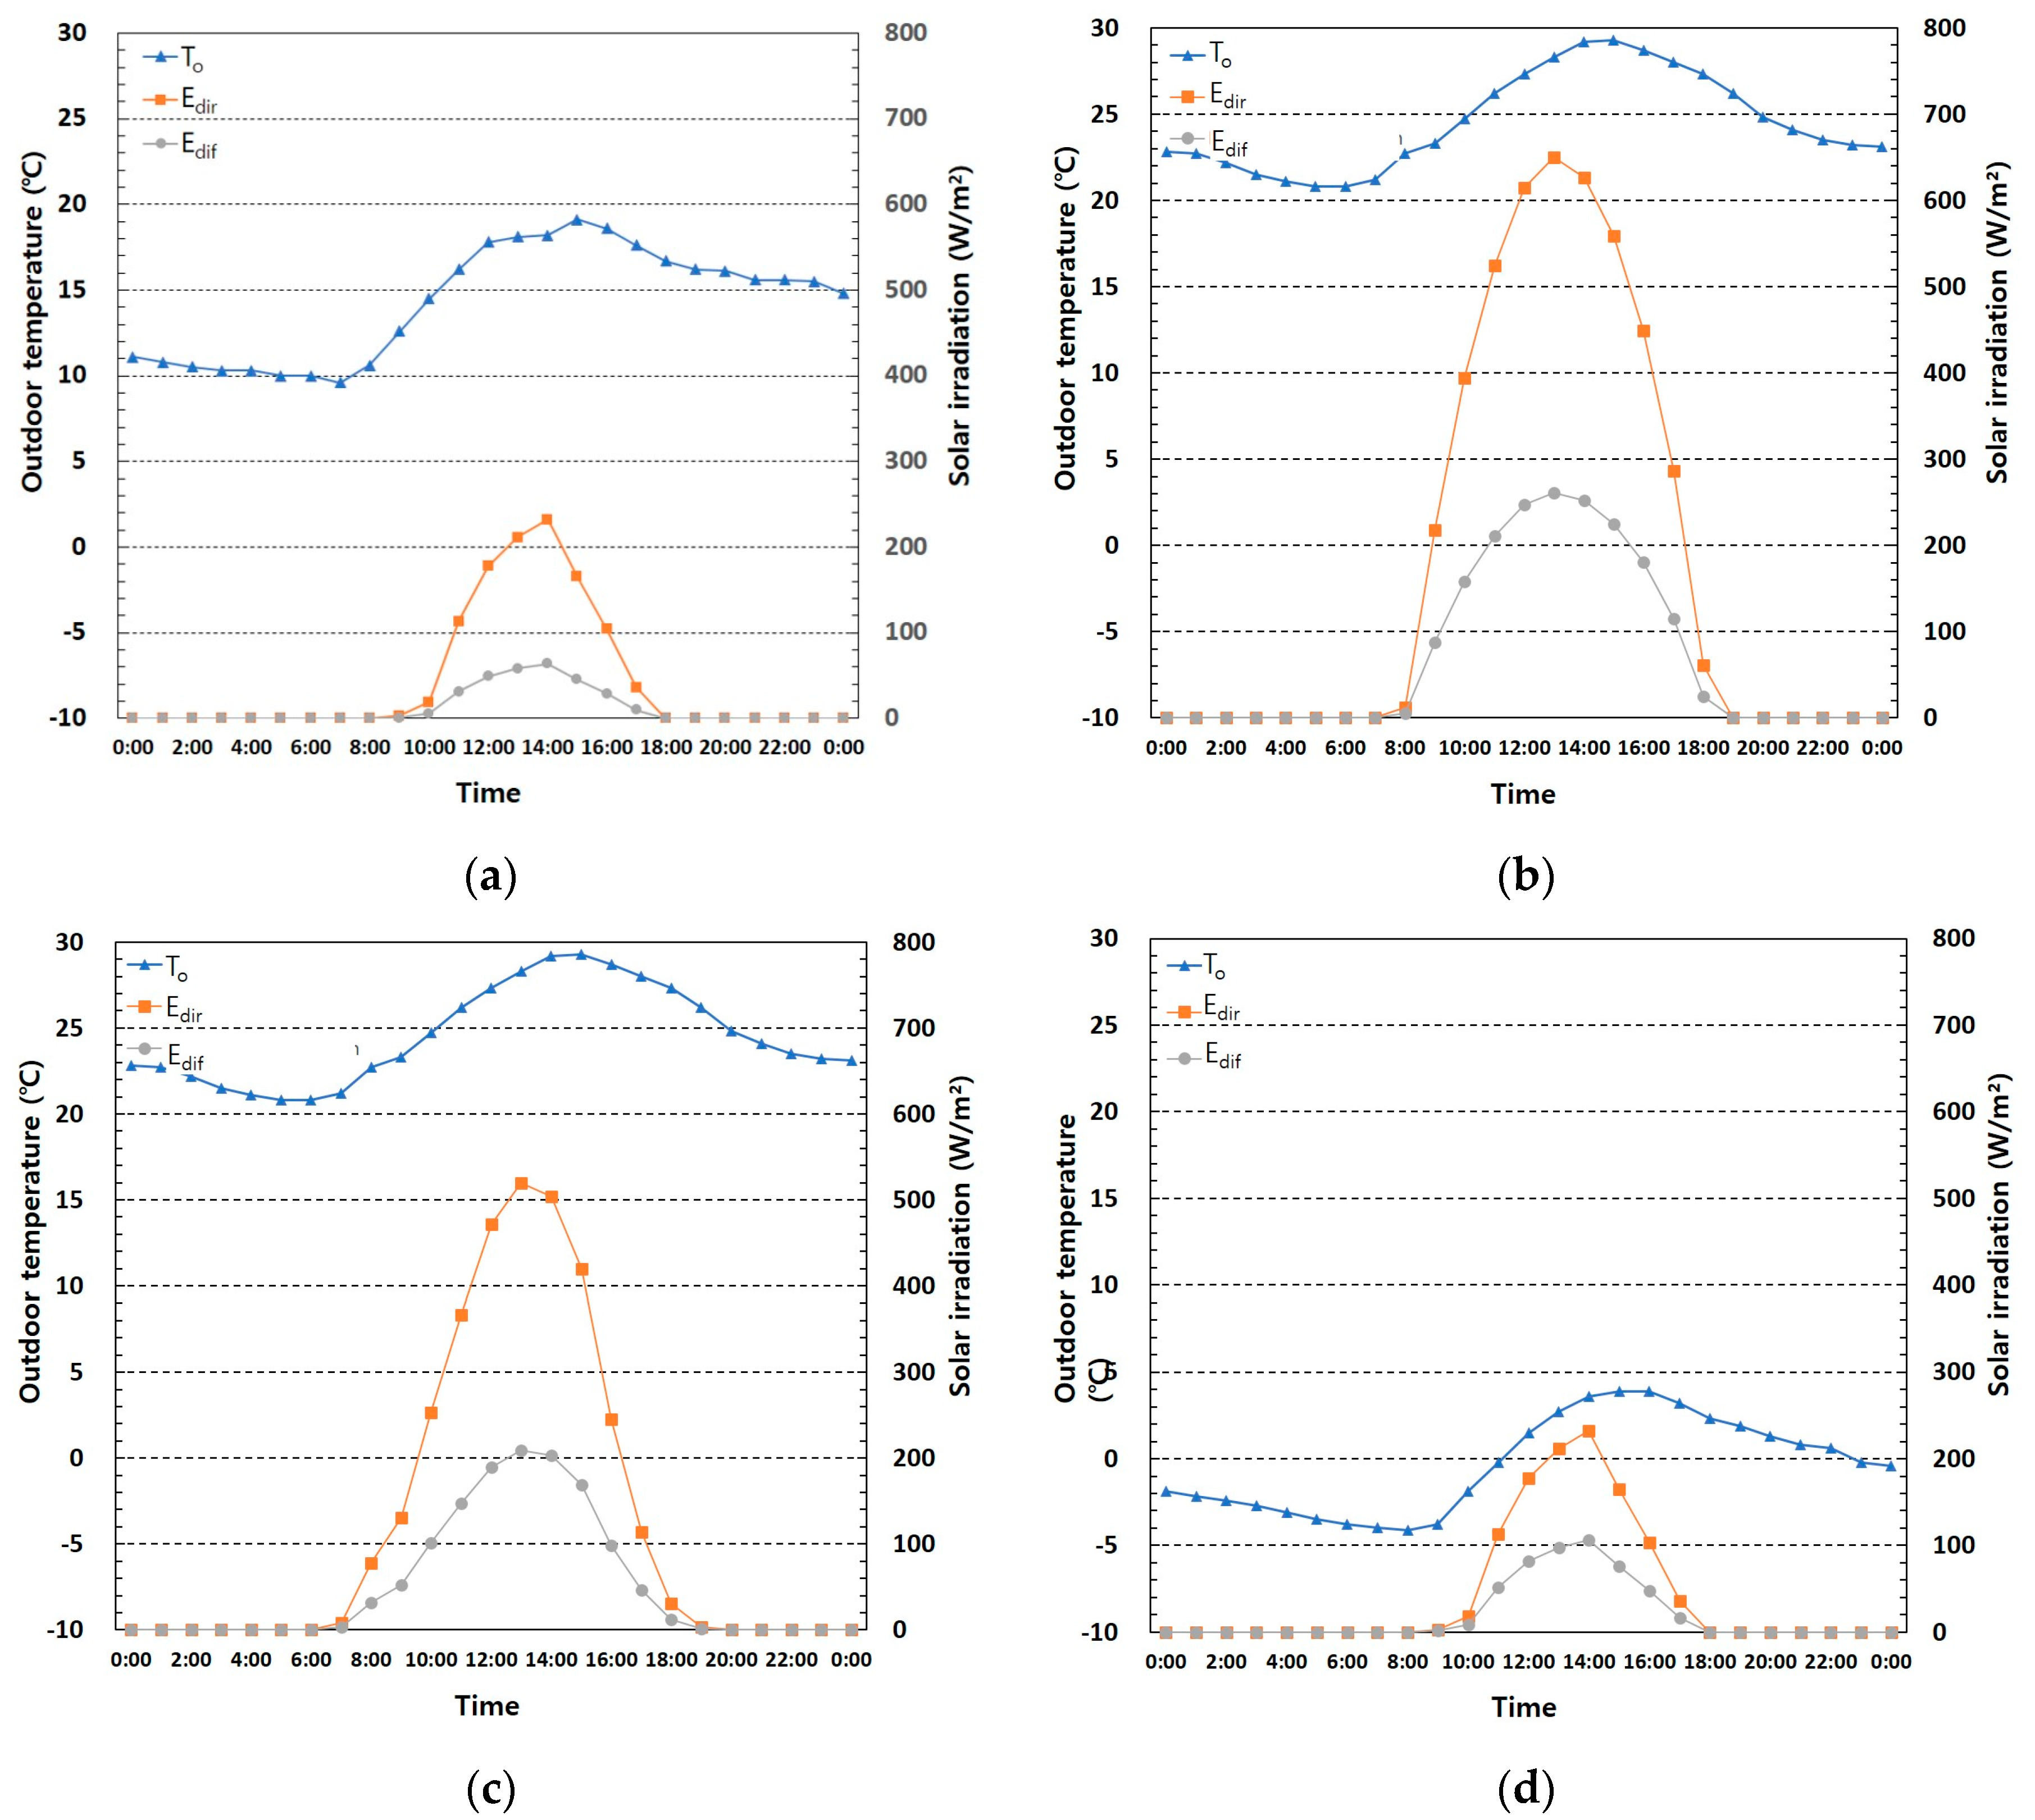
Figure 6.
Mean operating temperatures of PV cell under the different weather conditions: (a) cloudy sky and moderate temperature (intermediate season); (b) clear sky and hot temperature (summer season); (c) cloudy sky and hot temperature (summer season); and (d) cloudy sky and cold temperature (winter season).

Figure 7.
Comparison of mean operating temperatures of PV cell and total heat flux from panel to surrounding under the clear sky and hot temperature (summer season): (a) Case1; (b) Case2 PCM1; (c) Case2 PCM2; and (d) Case3 PCM2.
Figure 7.
Comparison of mean operating temperatures of PV cell and total heat flux from panel to surrounding under the clear sky and hot temperature (summer season): (a) Case1; (b) Case2 PCM1; (c) Case2 PCM2; and (d) Case3 PCM2.
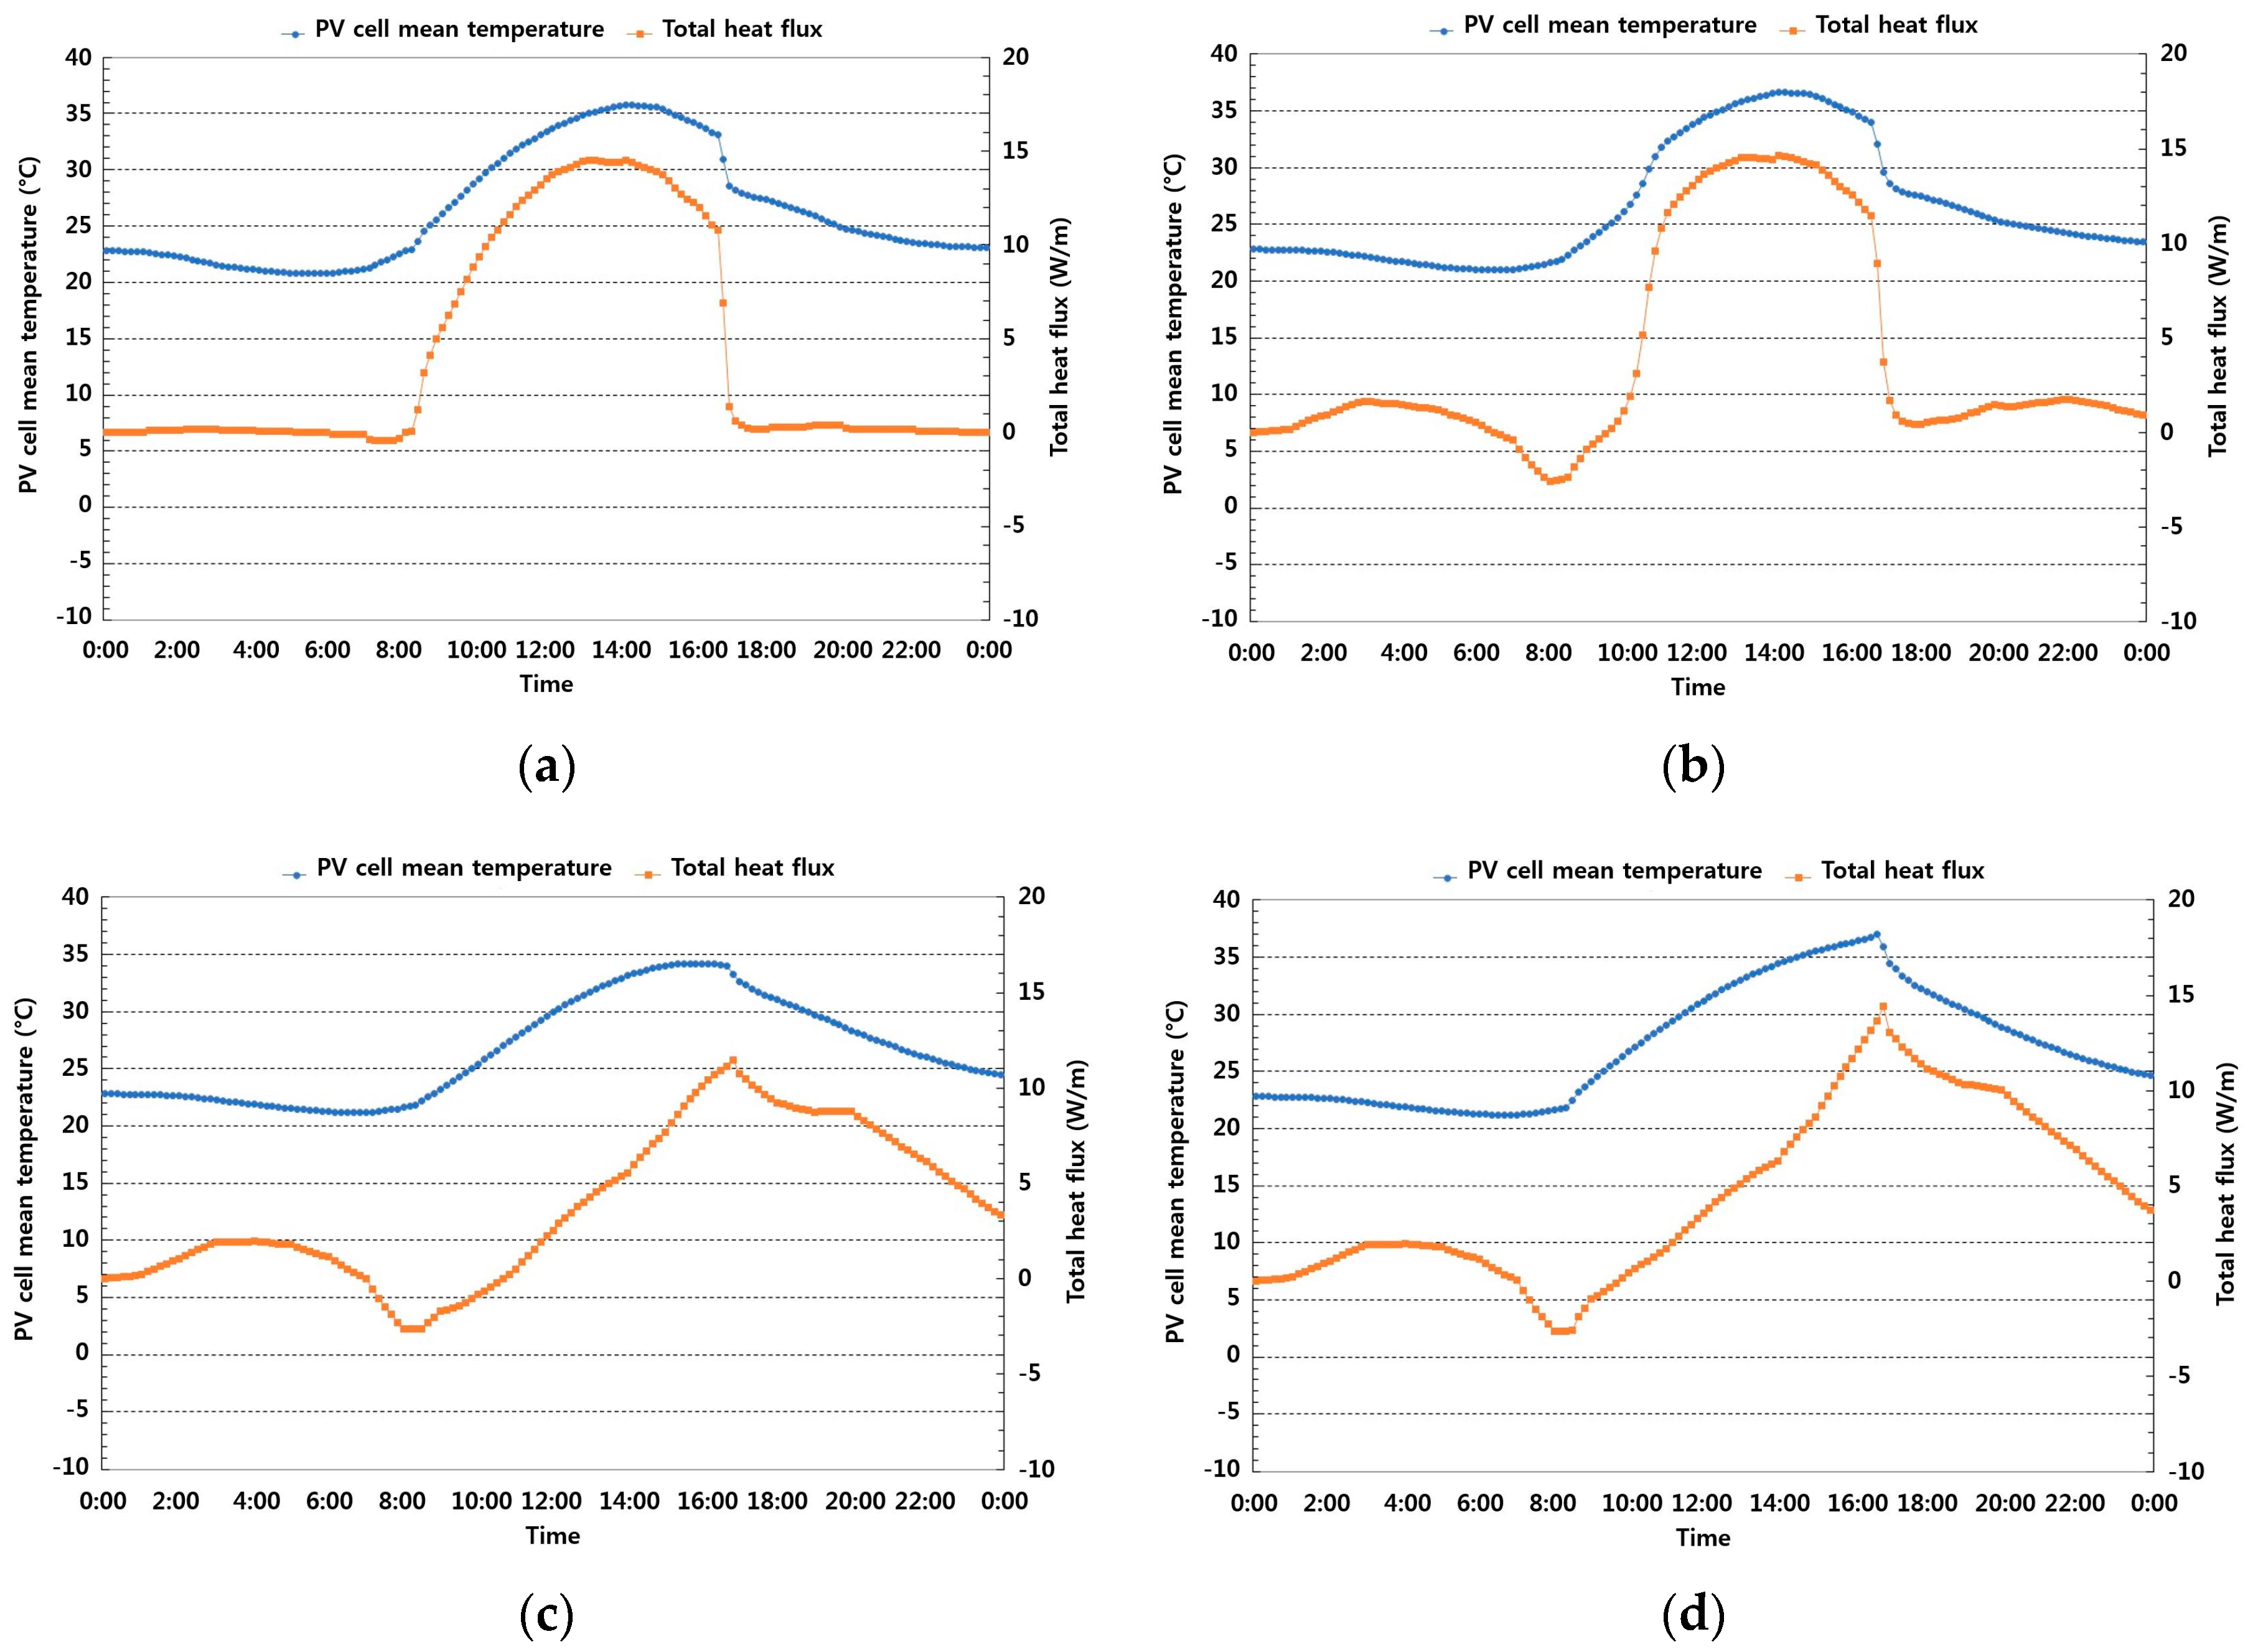
Figure 8.
Comparison of mean operating temperatures of PV cell and total heat flux from panel to surrounding under the cloudy sky and moderate temperature (intermediate season): (a) Case1; (b) Case2 PCM1; (c) Case2 PCM2; and (d) Case3 PCM2.
Figure 8.
Comparison of mean operating temperatures of PV cell and total heat flux from panel to surrounding under the cloudy sky and moderate temperature (intermediate season): (a) Case1; (b) Case2 PCM1; (c) Case2 PCM2; and (d) Case3 PCM2.

Figure 9.
Comparison of mean operating temperatures of PV cell and total heat flux from panel to surrounding under the cloudy sky and cold temperature (winter season): (a) Case1; (b) Case2 PCM1; (c) Case2 PCM2; and (d) Case3 PCM2.
Figure 9.
Comparison of mean operating temperatures of PV cell and total heat flux from panel to surrounding under the cloudy sky and cold temperature (winter season): (a) Case1; (b) Case2 PCM1; (c) Case2 PCM2; and (d) Case3 PCM2.

Table 1.
Physical properties of PV layers and PCMs.
| Layer Name | Thickness (m) | Conductivity (W/m·K) | Density (kg/m3) | Specific Heat Capacity (J/kg·K) |
|---|---|---|---|---|
| Glass covering | 0.003 | 1.8 | 3000 | 500 |
| PV cells | 0.00022 | 148 | 2330 | 677 |
| EVA | 0.00050 | 0.35 | 960 | 2090 |
| Metal back sheet | 0.00001 | 237 | 2700 | 900 |
| PCM1 | 0.01 | 0.321 | 872 | Refer to Figure 1 |
| PCM2 | 0.01 | 0.18 | 850 | Refer to Figure 1 |
Table 2.
Details for the simulation cases.
| Simulation Cases | MMPCM Methods | PCM Types |
|---|---|---|
| Case1 | - | - |
| Case2 PCM1 | Honeycomb grid steel container | Fatty acid ester (Coconut oil) |
| Case2 PCM2 | Honeycomb grid steel container | Petroleum jelly (Vaseline) |
| Case3 PCM1 | Nylon bag container | Fatty acid ester (Coconut oil) |
| Case3 PCM2 | Nylon bag container | Petroleum jelly (Vaseline) |
© 2017 by the authors. Licensee MDPI, Basel, Switzerland. This article is an open access article distributed under the terms and conditions of the Creative Commons Attribution (CC BY) license (http://creativecommons.org/licenses/by/4.0/).
Share and Cite
MDPI and ACS Style
Lim, J.-H.; Lee, Y.-S.; Seong, Y.-B. Diurnal Thermal Behavior of Photovoltaic Panel with Phase Change Materials under Different Weather Conditions. Energies 2017, 10, 1983. https://doi.org/10.3390/en10121983
AMA Style
Lim J-H, Lee Y-S, Seong Y-B. Diurnal Thermal Behavior of Photovoltaic Panel with Phase Change Materials under Different Weather Conditions. Energies. 2017; 10(12):1983. https://doi.org/10.3390/en10121983
Chicago/Turabian StyleLim, Jae-Han, Yoon-Sun Lee, and Yoon-Bok Seong. 2017. "Diurnal Thermal Behavior of Photovoltaic Panel with Phase Change Materials under Different Weather Conditions" Energies 10, no. 12: 1983. https://doi.org/10.3390/en10121983
Note that from the first issue of 2016, this journal uses article numbers instead of page numbers. See further details here.