Study on Flow in Fractured Porous Media Using Pore-Fracture Network Modeling


1
Institute of Mechanics, Chinese Academy of Sciences, Beijing 100190, China
2
College of Engineering, University of Chinese Academy of Sciences, Beijing 100049, China
3
State Key Laboratory for Enhanced Oil Recovery, Research Institute of Exploration and Development of PetroChina, Beijing100083, China
*
Author to whom correspondence should be addressed.
Energies 2017, 10(12), 1984; https://doi.org/10.3390/en10121984
Submission received: 30 October 2017
/
Revised: 25 November 2017
/
Accepted: 27 November 2017
/
Published: 1 December 2017
(This article belongs to the Section I: Energy Fundamentals and Conversion)
Abstract
:Microscopic flow in fractured porous media is a typical problem for the exploitation of tight reservoirs. The rapid-flow in the fractured porous-media is of great significance to efficient and continuous oil/gas exploitation. The fractures are expected to enhance flow conductivity and mass transfer between matrix and fractures, and to improve oil displacement during water flooding. However, the fractures may also lead to water channeling under some conditions. The understanding on the mechanism of the microscopic flow in the fractured porous media has been insufficient until now. In this paper, a two-dimensional pore-fracture network model is presented to study the role of fractures in the flow. The effects of two main dimensionless parameters, fracture length to network length lf/l and fracture density Nf/N, on the absolute permeability and the oil displacement efficiency are investigated. The results show that the flow in the matrix plays a controlling role at a low fracture density. Once the fracture density exceeds a certain value, the flow is controlled by fractures. With the increase of the fracture density, the oil displacement efficiency develops into three typical stages: when Nf/N < 0.1, the oil displacement efficiency increases rapidly; when 0.1 < Nf/N < 0.5, the oil displacement efficiency changes slowly; and when Nf/N > 0.5, the oil displacement efficiency decreases rapidly. In the case lf/l > 0.8, the water mainly flows through a concentrated path connected by some fractures, resulting in it bypassing most oil regions, and thus the oil displacement efficiency decreases rapidly, similar to the water channeling.
1. Introduction
The unconventional oil and gas resources, mainly stored in tight reservoirs, are of great importance to the national energy strategy [1,2]. Low permeability, the existence of fractures, and high heterogeneity are the main characteristics of these reservoirs. Fractures are capable of increasing the permeability, and commercial exploitation would be impossible without fracture networks. Hence hydraulic fracturing is widely used for oil/gas exploitation in tight reservoirs [3,4]. However, the hydraulic fracturing leads to a complex dual pore-fracture network, consisting of nanometer/micrometer pores and fracture magnitudes change from micrometers to kilometers [5,6,7]. The occurrence of reservoir anisotropy and water channeling will reduce the oil or gas recovery when the fractures are not appropriately distributed and connected. Therefore, there is a great deal of uncertainty about the flow properties in such reservoirs [8,9]. The micro-flow mechanism in the fractured porous media is important for understanding the flow characteristics in tight reservoirs and in finding new technologies for enhancing oil/gas recovery.
Laboratory experiments can reveal the physical processes of fluid flow in the fractured porous media and provide the data to verify numerical and theoretical analyses [10,11]. However, experiments are usually expensive and incapable of obtaining both the macro and micro information in detail. With the optimization of the algorithm and the improvement of computer technology, numerical simulations become an effective and economic choice for studying the flow mechanism in the dual pore-fracture networks. Several models based on either continuum or non-continuum mechanics have been presented for describing the flow in the fractured porous media [12,13,14,15,16].
The pore network model (PNM) was first proposed by Fatt, who idealized the pore structure of porous media as pore bodies (nodes) and pore throats (capillary tubes) with a topological configuration [12]. Wilkinson and Willemsen presented the concept of invasion percolation [17] and applied it to groundwater hydrology [18], during which the connectivity and the main flow path were described. Multiphase transport in the porous media and micro-mechanisms have been explained and analyzed by PNM. Previous studies have indicated that the piston-like flow transforms into the fingering flow when the capillary force exceeds the viscous force for the two-phase flow in the porous media. Quasi-static flow models are capable of investigating the effects of pore structure on the microscopic flow [19]. Dynamic models are applicable to capture the location of the moving phase interfaces [20]. Due to the development of microscopic measurements, 3D images were obtained by the micro-CT/NMR, giving detailed information on the pore structure [21], and which were used to reconstruct the pore network of PNM [22,23,24,25]. However, PNM is incapable of understanding the micro-mechanism of fluid flow in tight reservoirs with great heterogeneity and a multi-scale pore structure consisting of fractures, pores, and throats. The consistency, upscaling, and coupling across scales need to be solved [26,27].
Barenblatt et al. [28] and Warren [29] proposed the dual pore-fracture network model (D-PNM) in which the fractures are distributed in the matrix, and the multi-scale effect in the pore-fracture media was described. In recent years, D-PNMs have been developed and applied in extensive studies of flow phenomena in complex porous media [7,30,31]. These models have been classified into two types: pseudo-steady models [28,29] and transfer flow models [32,33]. The former type can be used to simulate non-steady-state seepage in fractured rocks, while the latter can be used to simulate the fluid transport in fractured rocks. Lemonnier et al. [34,35] described the main physical mechanism of two-phase displacement and presented a numerical model considering fluid exchange between the matrix and fractures. Liu et al. [36] developed a fluid-solid coupling model for low-permeability fractured reservoirs. Zheng and Yu [37] established a fractal permeability model for gas flowing, presenting a relationship between gas permeability and pore structure parameters. Xiao [38] studied the physical mechanisms of relative permeability by means of the Fractal-Monte Carlo technique, and found the relationship between the relative permeability and the saturation of the wetting phase. Noetinger et al. [39] and Ding [40] studied the details of the flow inside the dual pore-fracture seepage system, and modeled the fluid exchange between the fracture and matrix. In the dual pore-fracture seepage system, the fractures contribute to the paths of fluid transportation, while the matrix contributes to the storage of fluid due to its much lower permeability than fractures. The fractures and the matrix connect with each other, and the fluid in the matrix can flow into the fractures and vice versa. Great progress was made in up-scaling and improving the computation speed of the pore-fracture network model, facilitating engineering scale simulations of regional fractured reservoirs [41,42]. However, when the complexities of micro-fracture geometrics and distribution in the matrix are concerned, the microscopic flow mechanism and the effect of micro-fractures on oil or gas recovery are still not well understood [43].
In this paper, a pore-fracture network model (PFNM) is presented for exploring the microscopic flow mechanism in the fractured porous media, focused on the effect of fracture geometrics and distribution. A series of flow simulations with different pore-fracture structure characteristics were carried out. The absolute permeability, fracture sensitivity, and displacement efficiency change with the pore-fracture structure were studied.
2. Pore-Fracture Network Model
2.1. Brief Introduction of Model
A 2-D quasi-static PFNM is established to simulate the flows in the fractured porous media. The pore-fracture network consists of pores, throats, and fractures. In Figure 1a, the orange spherical nodes represent the pores. Each pore is connected with four neighboring cylindrical throats. The red line represents a fracture, connected with two non-adjacent pores. The pores act as a larger storage space and the throats provide relatively narrower and longer connective flow paths, while the fractures are the longest and widest flow paths. Each throat connects two neighboring pores, while each fracture connects two non-adjacent pores. The flow in throats is assumed to satisfy the Poiseuille equation, and the capillary force is considered during the process of two-phase displacement. Plate flow is used to describe the flow in fractures when the fracture width is far less than the height and the length. Micro fractures with widths and heights of the same magnitudes are considered here. The flow in fractures is equivalent to the Poiseuille flow in cylindrical tubes. The pressure equation system at pores is built according to the condition that the total flow rate at each pore is zero because the pore fluid is assumed to be incompressible. The pressure at each pore can be solved by the equation system. The displacement proceeds in throats and fractures with the highest pressure difference at each time with an update of the pressure distribution in the pores. The pressure difference between any two adjacent pores determines the displacement direction in the connected throat or fracture. For simplification, one pore is allowed to be occupied by one phase, hence trapping occurs when the two pores connecting a throat are both filled by the other phase [44], i.e., the throat will not be displaced as in Figure 1b.
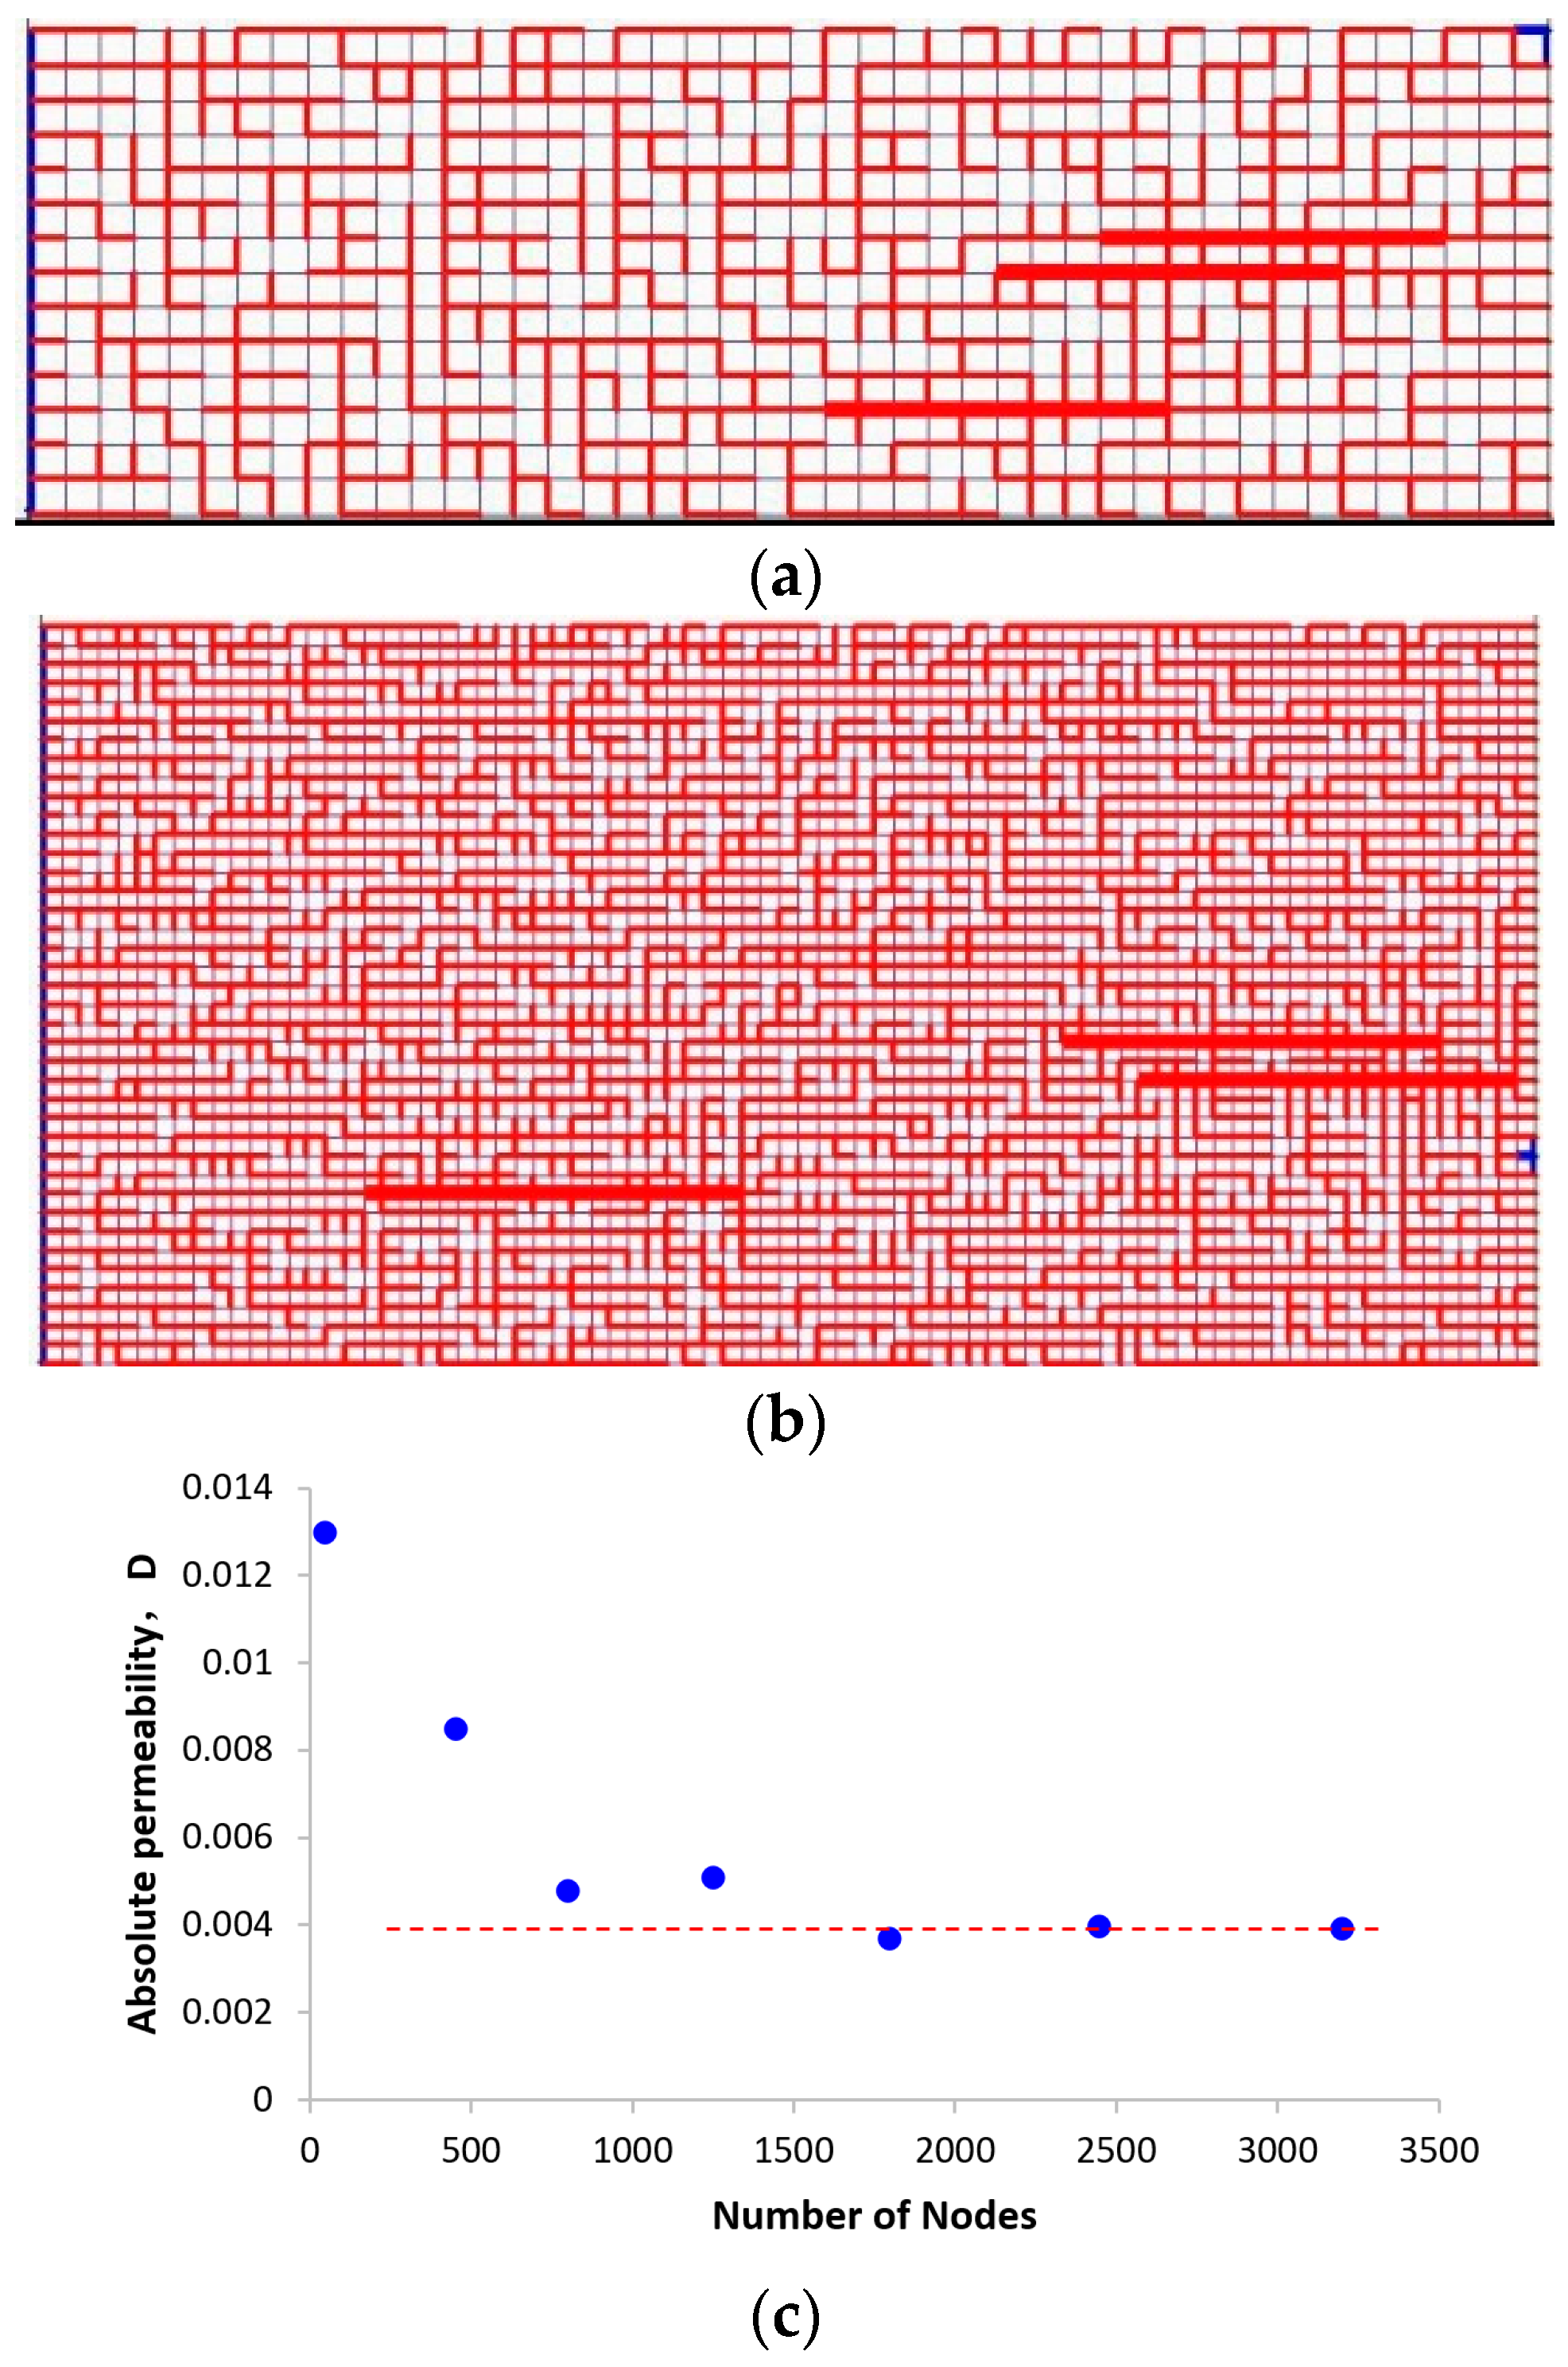
Different amounts of basic units establish PFNM in different scales as in Figure 2a,b. The scale in the simulation should be large enough to eliminate the boundary effects. Under the condition that the radius of the pores and throats are assumed to be in a normal distribution, a series of computations on single-phase flow are preformed to determine the representative scale of PFNM. The throats are given by the same radius distribution (Truncated normal distribution: 0.1~20 μm, standard deviation = 6, mean value = 10 μm). The results show that the fluctuation of the absolute permeability decreases when the number of nodes exceeds 1800 (as in Figure 2c). Hence, in the following computations, the nodes are more than 1800 in order to reduce the size and boundary effects.
2.2. Governing Equations
Fluid flow and geo-mechanical responses (deformation, fracture opening, fracture propagation) are two important physical processes in the pore-fracture dual porous media. Here, a decoupling method is applied, and the slower physical process, i.e., two-phase incompressible flow (water flooding) through the ideal pore-fracture network is concerned.
2.2.1. Equations for Flow in Throats and Fractures
The equation of single-phase flow in the throats is:
The equation of two-phase flow with a single interface is:
It is noticed that once two or more interfaces occur in the pore throat, the fluid is trapped, and the flow rate is multiplied by a factor to obtain a small value, which will eliminate the singularity of computation, as follows:
The capillary pressure is calculated by:
The capillary pressure in the fractures is neglected due to its larger radius than that of the throats, and the flow rate in the fractures is:
where is the flow rate; and are the radius of the throat and fracture, respectively; and are the lengths of the throat and fracture, respectively; is the dynamic viscosity of the fluid; is the contact angle; is the interfacial tension between the wetting and non-wetting phases; and and are the node pressures at node i and j, respectively. “+” is applied when a wetting phase (water) displaces a non-wetting phase (oil), otherwise “−” is chosen.
Considering the incompressibility of the fluids, the flow rate must be zero at each node:
When the simulations do not contain the fractures, then Equations (1)–(4) are substituted into Equation (6) as follows:
When the simulations contain the fractures, then Equations (1)–(5) are substituted into Equation (6) as follows:
The above Equations (7) and (8) form a matrix for the node pressure. The Newtonian iterative algorithm is adopted to obtain the solution.
2.2.2. Calculation of Macro-Parameters
(1) Permeability
The permeability is calculated by the total flow under the pressure difference . The absolute permeability of a single fluid phase in the network is calculated by Darcy’s law:
where is the viscosity of fluid, is the length of the network, and is the area of the cross section.
For two-phase displacement, the effective permeability of each phase or can be expressed as:
where and is the viscosity of oil and water, respectively.
The relative permeability of each phase, or , is expressed as the ratio of the effective permeability or to the absolute permeability of each phase during the displacement process: , where represents oil or water.
(2) Water saturation
In the displacement process (step k), the oil and water occupy different pores, throats, and fractures. The oil and water saturation, including irreducible water and residual oil, is calculated. The equation of water saturation is expressed as:
where m, n, and p represent the total number of throats, pores, and fractures, respectively; m′, n′, and p′ represent the total number of throats, pores, and fractures occupied by water at step k, respectively; , , and represent the radius of the throat, pore, and fracture, respectively, obeying a different distribution; and represent the length of the throat and fracture, respectively; , , and represent the total volume of the throats, pores, and fractures, respectively; mk, nk, and pk represent the total number of throats, pores, and fractures filled with water, respectively; and , , and represent the total volume of the throats, nodes, and fractures filled with water at step k, respectively. The irreducible water saturation and residual oil saturation can also be obtained by Equation (12) at the end of the oil displacing water and water displacing oil processes, respectively.
(3) Displacement efficiency
Displacement efficiency indicates the degree of recovery in water flooding. In the PFNM, the displacement efficiency is defined by:
where is the irreducible water saturation and is the residual oil saturation.
2.3. Computational Procedures
The computational procedures are as follows:
- Generation of PFNM: the statistical properties and topological parameters of the actual porous media are obtained first according to the measured data, including the size and direction distribution of the throats and fractures, coordination number, and spatial correlation. Then, PFNM is generated by the method introduced in Section 2.1.
- Computation of the absolute permeability: Let the wetting phase (water) flow through the network to obtain the absolute permeability using Equation (9).
- Computation of the irreducible water saturation: Let the non-wetting phase (oil) displace the wetting phase (water) based on the end status of Step ii. The water that has not been displaced forms the irreducible water.
- Computation of the residual oil saturation: Water flooding is processed to displace the oil in the network based on the end status of Step iii. Once the oil cannot flow out the network, the displacement is finished. Then, the residue oil, relative permeability, and oil displacement efficiency are calculated.
3. Results and Discussion
3.1. Two Flow Patterns in the Network
In the pore-fracture network, the pores are the main storage space while the throats and fractures provide the flow paths. For a single-phase flow, the difference in the geometrical distribution of throats and fractures leads to a two-flow pattern in the network: matrix-dominated flow and fracture-dominated flow. The former is the flow prevailing in the throats, while the latter is the flow prevailing in the fractures. The transition can be characterized by the change in the absolute permeability.
To investigate the transition of the two flow patterns, a series of simulations on the single-phase flow are conducted. The parameters such as pore radius, throat radius, fracture density, and fracture radius are involved.
The size of the network is 90 nodes and 30 nodes, respectively, in the parallel and vertical flow direction. The basic parameters of the network are listed in Table 1 and corresponding results for each case are shown in Figure 3.
St and Sf are sensitivities of the throat and fracture, respectively, which represent the ratio of permeability increment caused by the increase of the throat or fracture radius to the initial permeability. Figure 3 shows the changes in sensitivity of St and Sf with the dimensionless fracture density Nf/N, where Nf is the fracture number and N is the total number of nodes. When the fracture density is zero, the permeability changes only with the radius of the throats. The sensitivity Sf increases with the fracture density, which is induced by the decrease of throats participating in the flow. The sensitivity Sf exceeds St when the fracture density reaches a critical value. The increase of Sf enhances the fluid flow in fractures.
The critical fracture density decreases with the increase of the fracture radius and the transition from the matrix-dominated flow to the fracture-dominated flow occurs at a lower fracture density (as in Figure 4). The reason for this is that the flow resistance decreases rapidly with the increase of the fracture radius, and the flow capacity is enhanced.
3.2. The Effect of lf/l
Different matrix geometrical characteristics with the same fracture system lead to different developments of the two-phase flow in the pore-fracture network.
Three typical matrixes with different ranges of permeability are chosen in the simulation. The network parameters are shown in Table 2. The change in the flow properties such as the absolute permeability and displacement efficiency is investigated with the progressive increase in the fracture length.
With the increase in fracture length, the permeability of the three types of porous media presents similar variation as shown in Figure 5a. The absolute permeability increases with the increase of lf/l. The absolute permeability presents a sharp increase, while the transition occurs in the oil displacement efficiency when lf/l exceeds 0.8. The displacement efficiency decreases to about 0.2 at lf/l = 1, indicating the occurrence of water channeling.
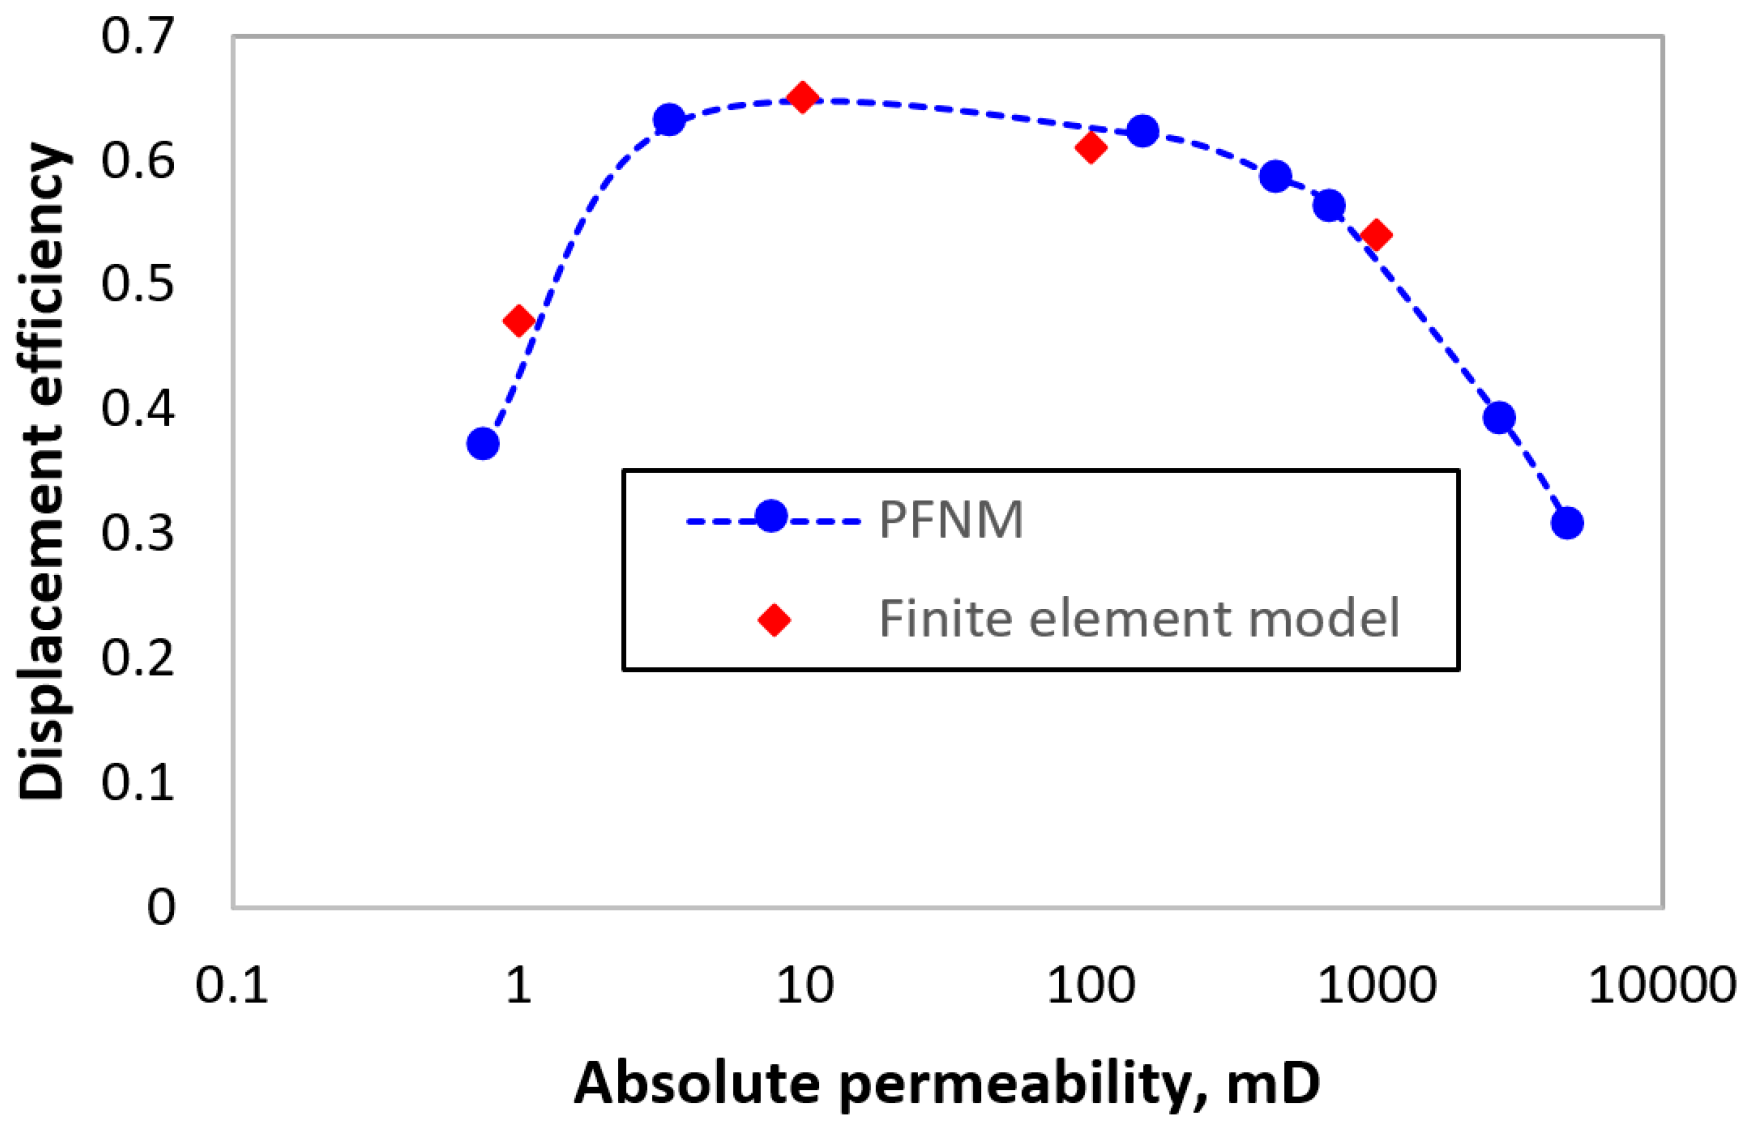
Kim and Deo presented a theoretical model for the water flooding problem in dual pore-fracture media [45]. The results indicate that the displacement efficiency changes with variation of the absolute permeability induced by the existence of fractures, and there is a transition that the displacement efficiency of non-wetting phase decreases with the increase of the absolute permeability (>10 mD). Figure 6 shows that the results simulated by PFNM for Type III with similar matrix absolute permeability and fracture characteristics are in good agreement with the theoretical results, validating the capacity of the microscopic PFNM method for water flooding in dual pore-fracture media.
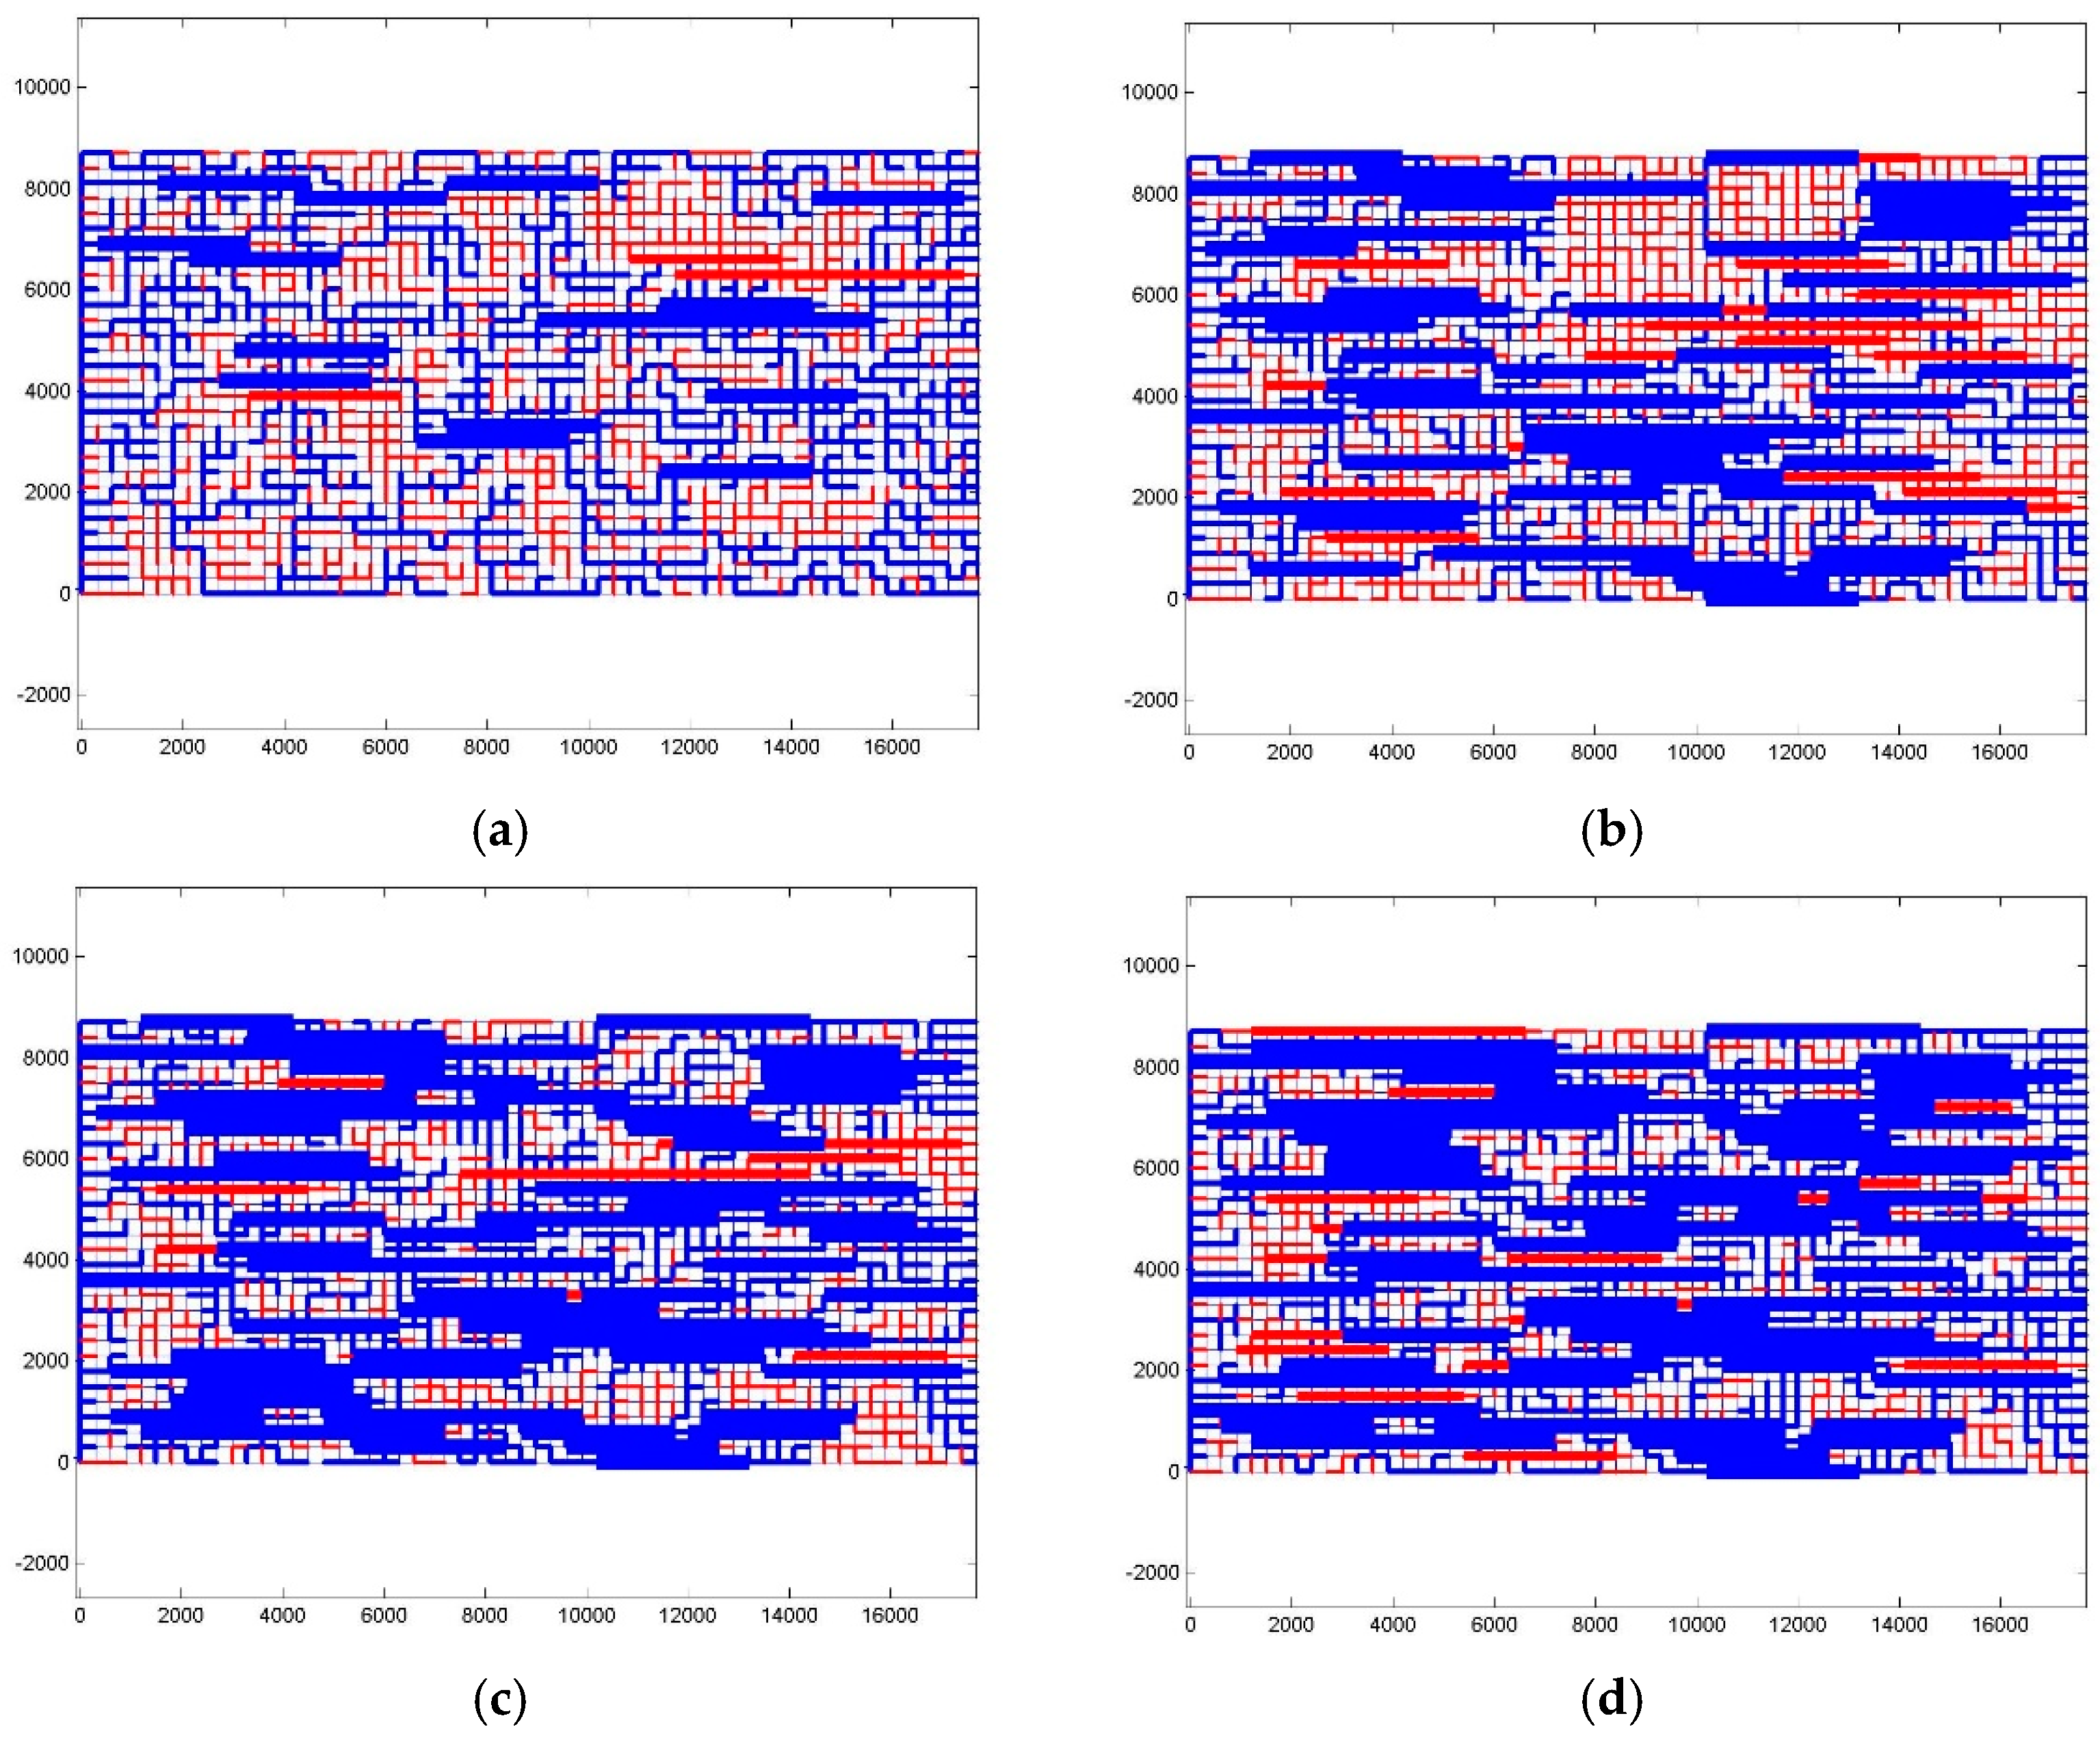
Figure 7 shows the distributions of oil and water at the end of water flooding under different fracture lengths. Displacement in the throats decreases with the increase in fracture length, resulting in the reduction of displacement efficiency. When lf/l exceeds 0.8, few throats participate in the displacement. The flow in the fractures is easier than in throats. Thus the fluids will preferentially flow through fractures and the surrounding throats will be bypassed. When the dimensionless fracture length is over a certain value, fluids almost flow from the inlet directly to the outlet, so the water flooding results in a lower swept area and displacement efficiency.
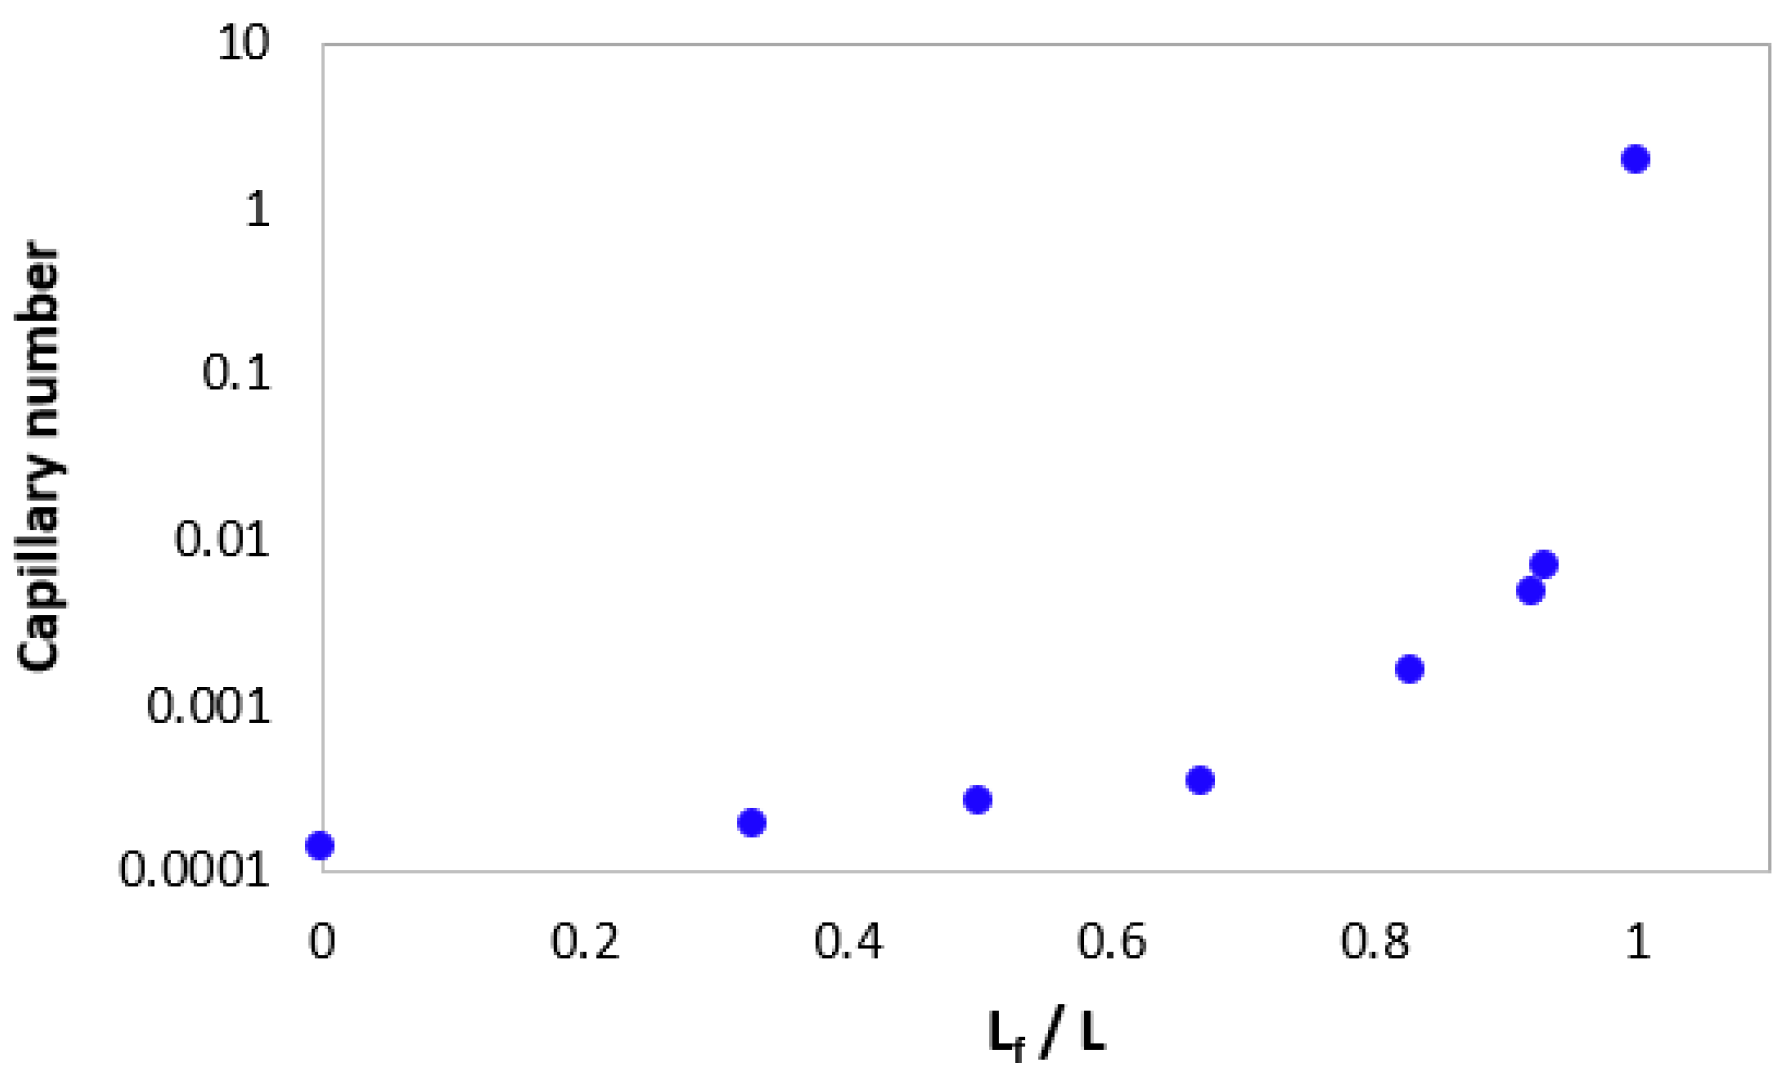
Dimensionless capillary number was first proposed by Moore and Slobod [46], representing the ratio of viscous forces to capillary forces in the two-phase incompressible flow:
When the product of permeability and pressure gradient of the network is substituted for that of flow velocity and fluid viscosity in Equation (11), a transformation form of the capillary number was presented [47]:
where , , , , , represent the superficial velocity, wetting fluid viscosity, absolute permeability, magnitude of pressure gradient, contact angle, and interfacial tension, respectively.
Recently, the aperture and roughness of the fracture were considered in the capillary number, and the residual saturation in natural fractures was captured and analyzed [48]. Here, the micro-fracture geometrics and distribution in the matrix are concerned, and one fracture is assumed to be occupied by one phase, so the capillary number in Equation (15) is applied to describe the two-phase flow in the PFNM computations.
The development of the capillary number is investigated in PFNM. The results show that Nc increases with the increase of the fracture length lf/l. When lf/l > 0.8, the Nc > 0.001, and the water flooding prevails in fractures, leading to a rapid increase in permeability and great decline in the displacement efficiency, as shown in Figure 8.
3.3. The Effect of Nf/N
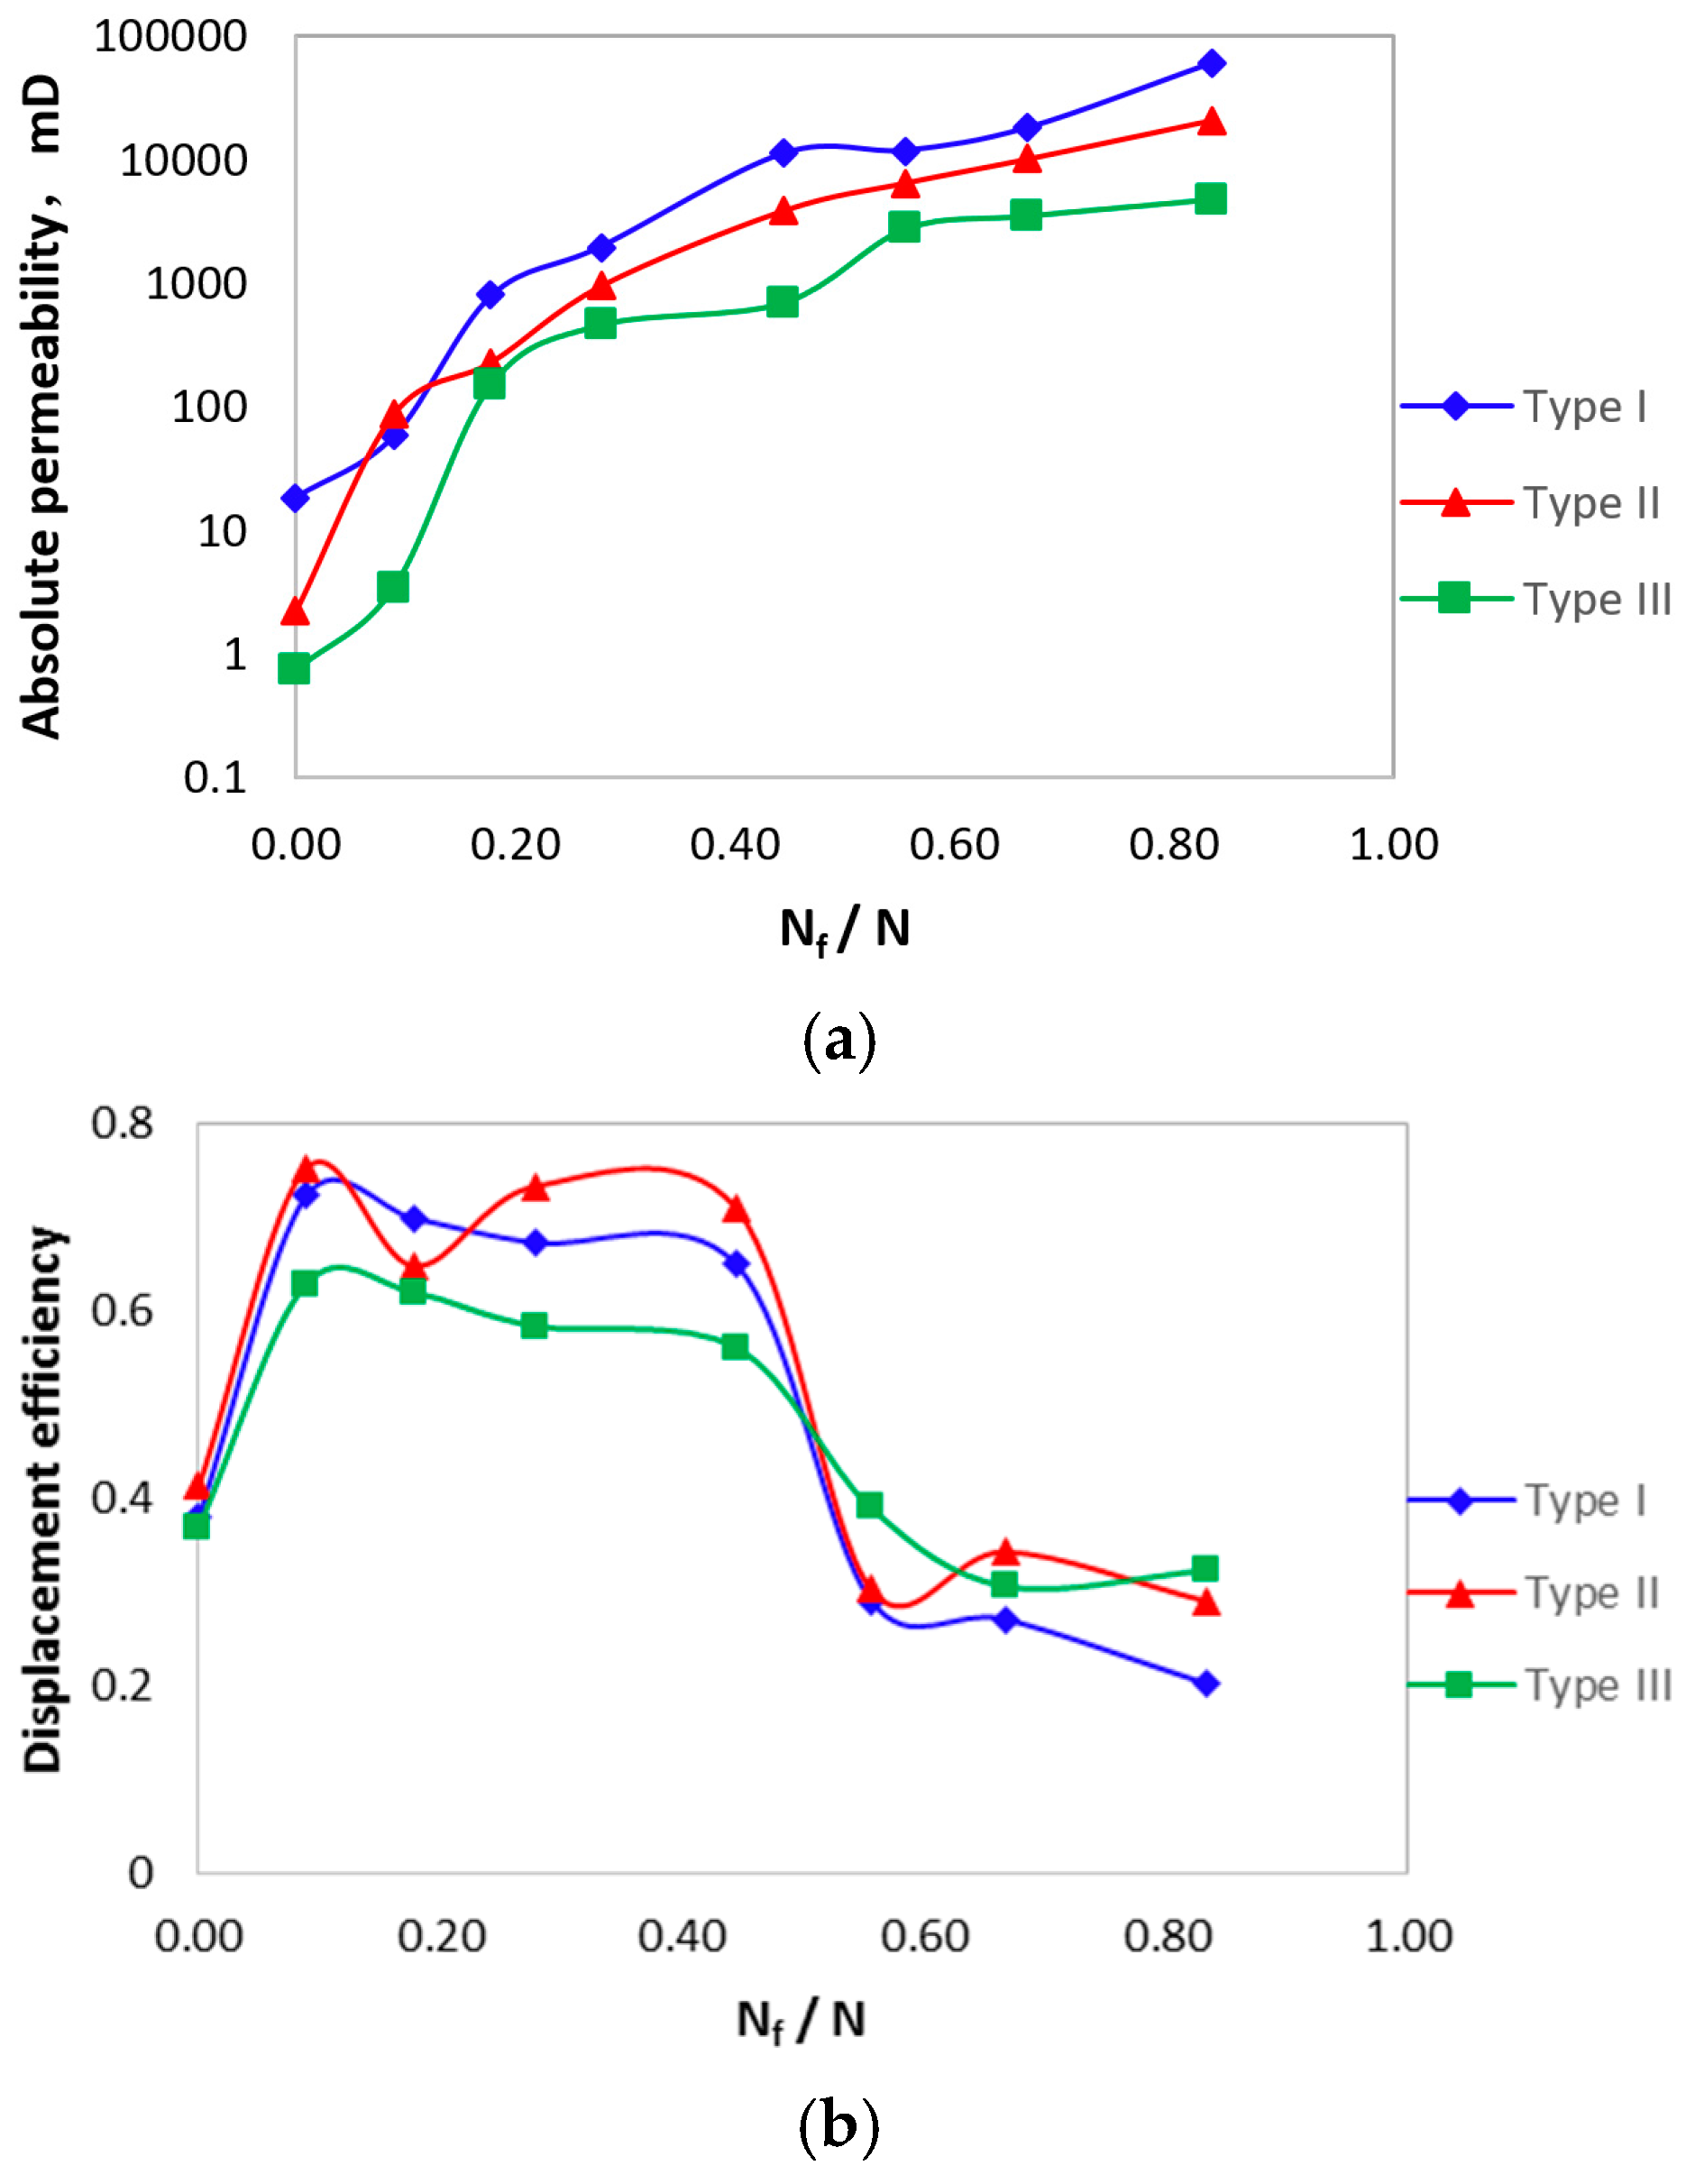
Figure 9a shows that the absolute permeability increases with the fracture density for Type I, II, and III. Under the same fracture density, the absolute permeability of Type I and Type III is the highest and lowest, respectively. The absolute permeability is determined by both the throats and fractures.
Figure 9b gives the change of oil displacement efficiency with the increase of the fracture density, which can be divided into three stages: (i) when Nf/N < 0.1, the displacement efficiency increases rapidly with the increase of fracture density; (ii) when 0.1 < Nf/N < 0.5, the oil displacement efficiency keeps a slow change, and Type I > Type II > Type III; and (iii) when Nf/N > 0.5, the oil displacement efficiency decreases rapidly to about 0.2.
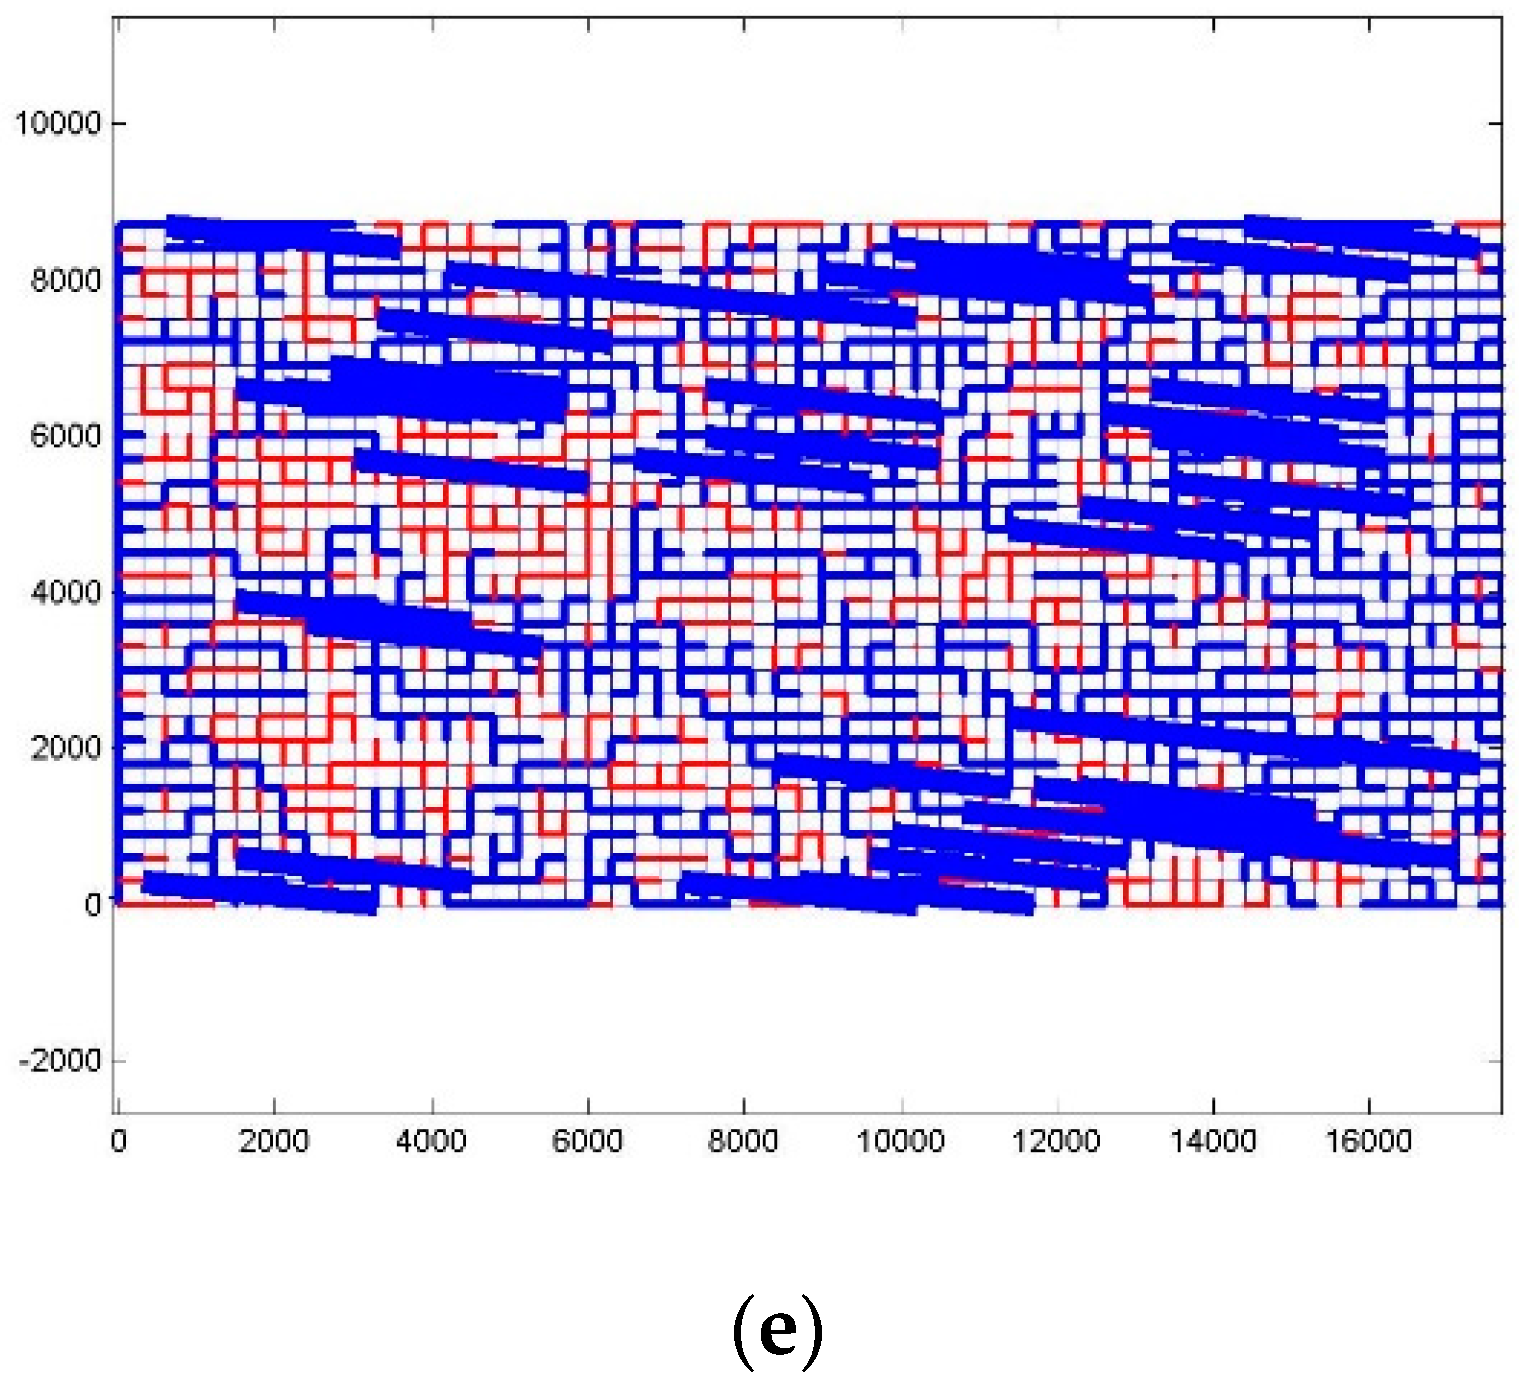
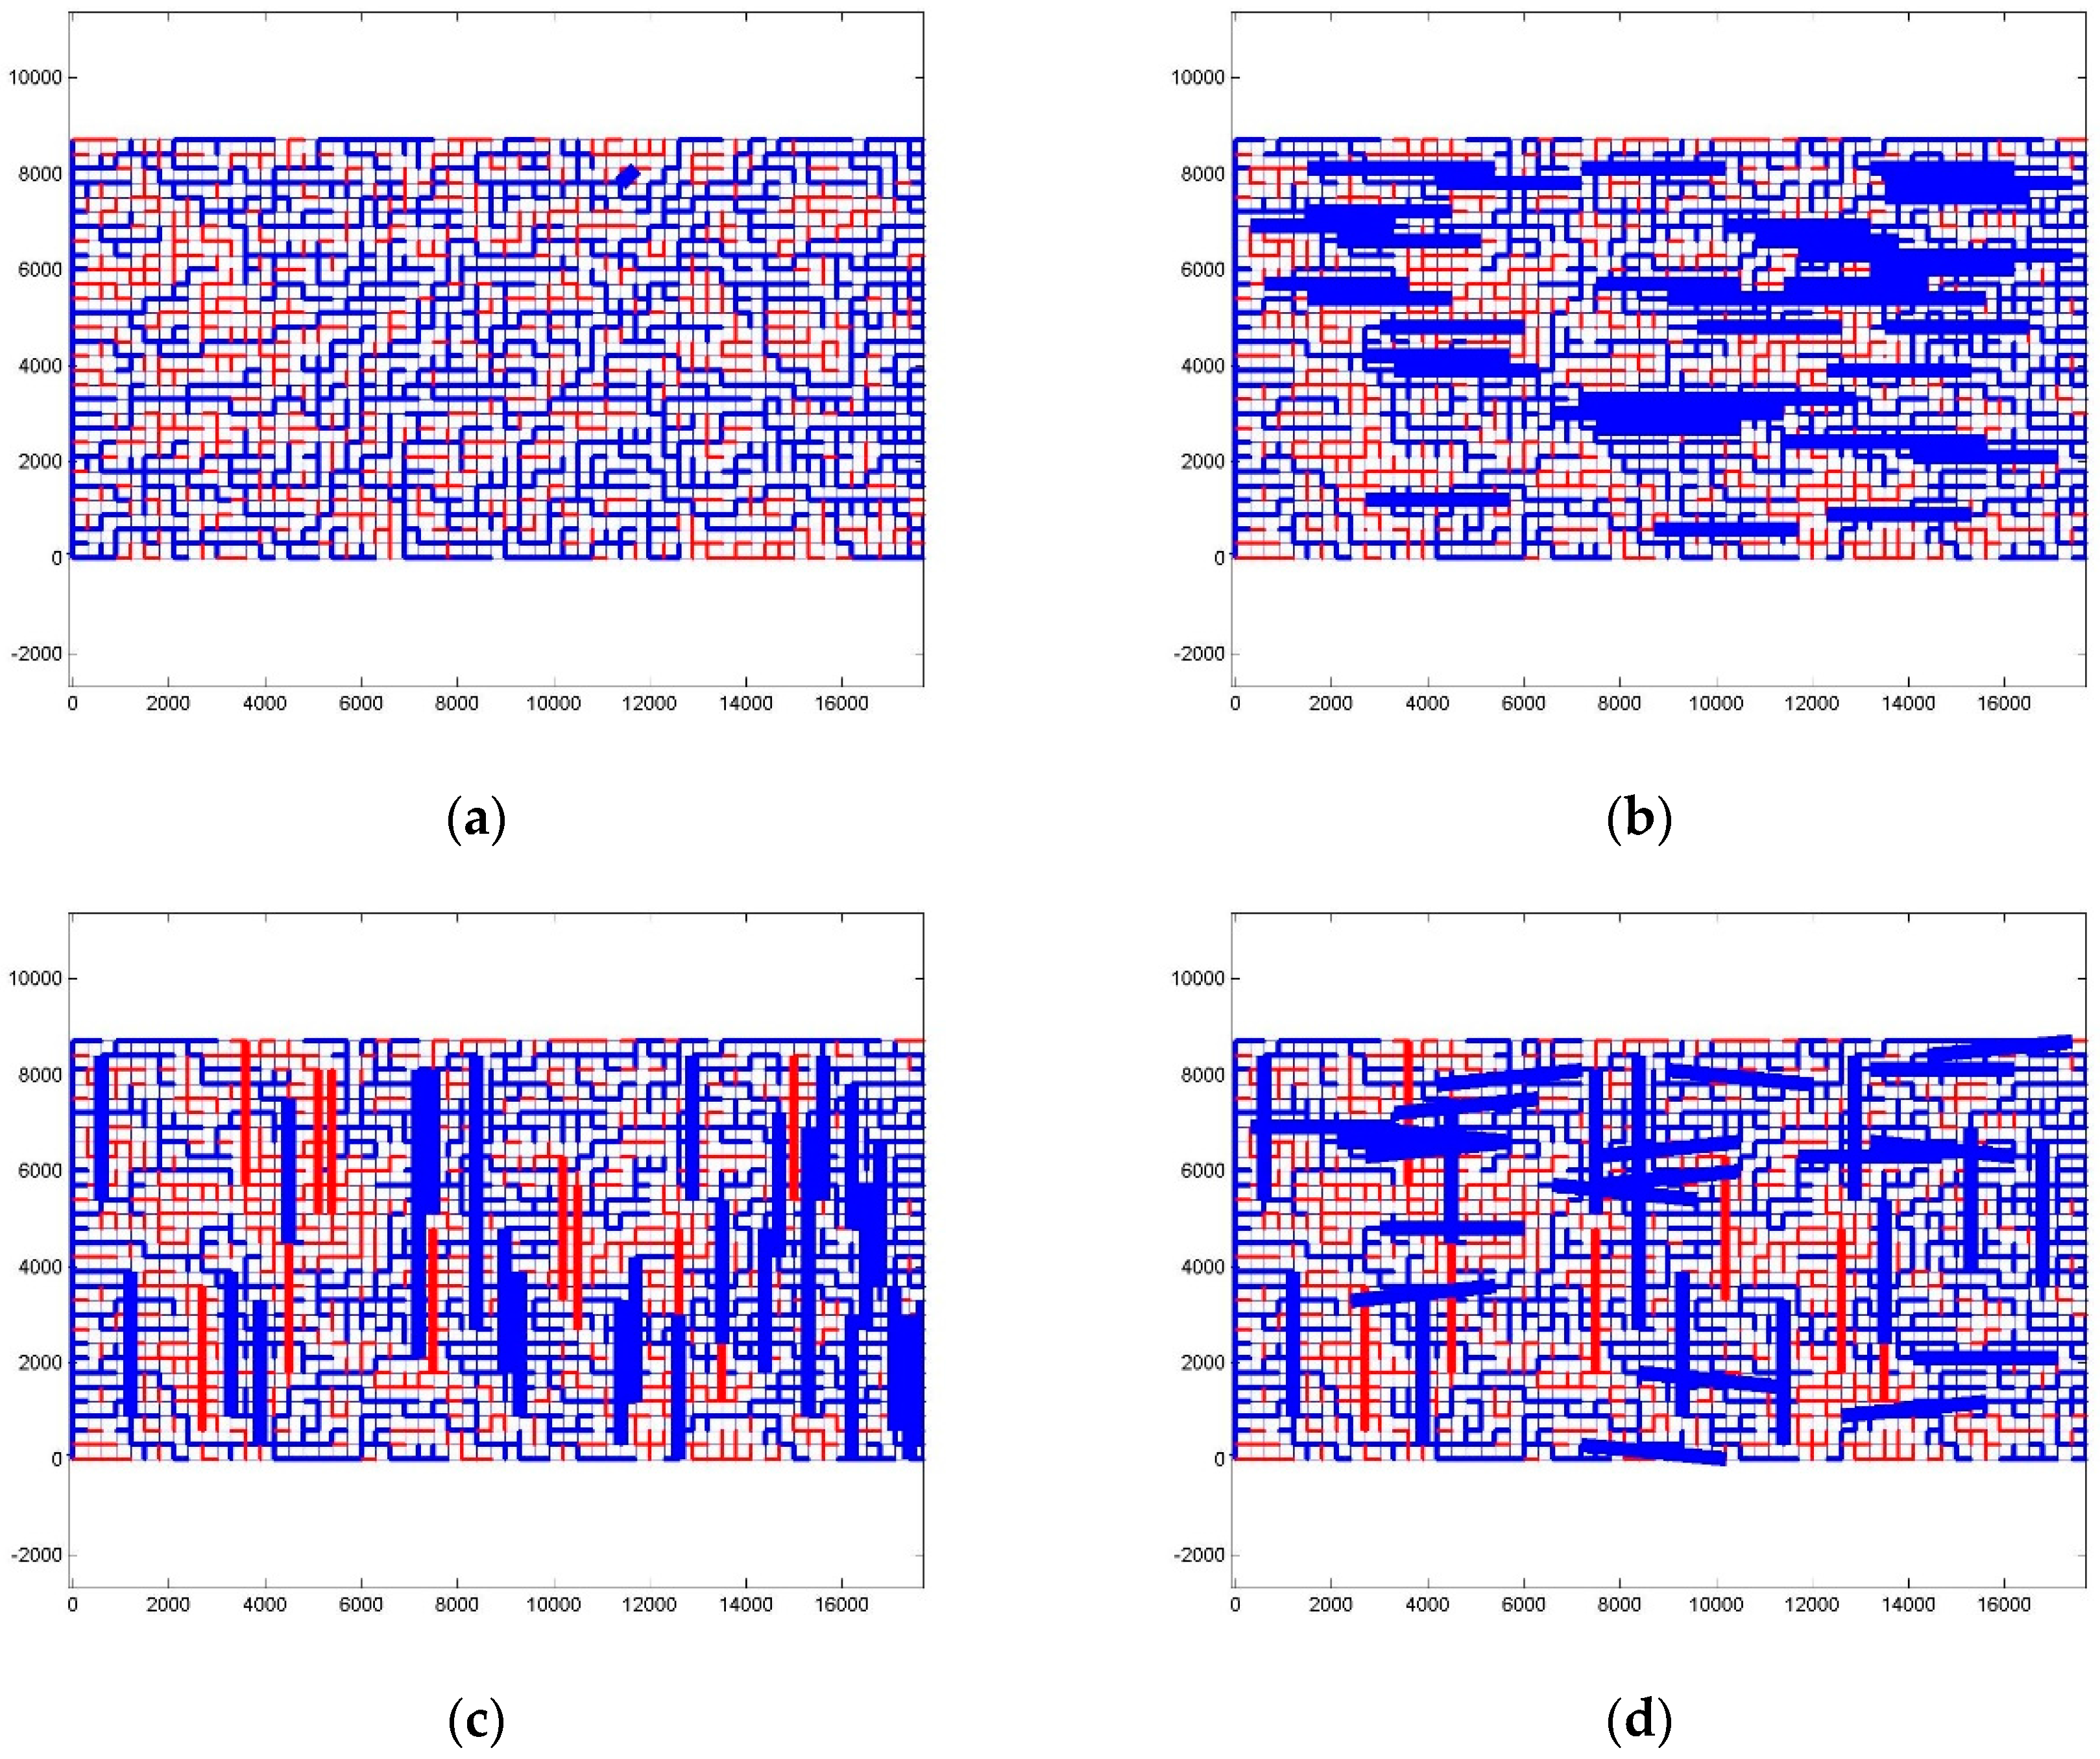
This phenomenon is related to the connectivity of fractures. When Nf/N < 0.1, the occurrence of fractures increases the local connectivity of the throats, and favors the two-phase displacement efficiency. When Nf/N > 0.5, the fractures connect and form approximate transfixion paths along the flow direction in the network, the pressure gradient is concentrated at the connected fractures, and the connected fractures become the main flow channels, leading to a decrease in the utilization rate of the fluid in the pores and throats, as shown in Figure 10.
3.4. The Effect of Direction
The existence of fractures can improve the absolute permeability and the displacement efficiency for the three types of fractured porous media, as seen in Table 3 and Table 4. The fractures parallel to the flow direction increase the absolute permeability and oil displacement efficiency greatly, while a little increase occurs when fractures are perpendicular to the flow direction. The non-wetting phase is easier to be displaced when the fractures are parallel to the flow direction for Type I and Type II, as shown in Figure 11.
4. Conclusions
Two-phase flow in the fractured porous media is a typical problem for the exploitation of tight reservoirs such as shale gas, tight oil, etc. The fractures can cause changes in the pressure distribution, flow paths, and displacement efficiency of the non-wetting phase. The flow behaviors related to fracture length, density, and direction are investigated. The main conclusions are as follows:
- (1)
- In the fractured pore-fracture network, matrix-dominant flow converts to fracture-dominant flow with the increase of fracture density and radius in the cases of single-phase flow. The critical fracture density for the transition decreases with the increase in the fracture radius.
- (2)
- The absolute permeability increases progressively with the increase in lf/l when lf/l < 0.8. Otherwise, it presents a sharp increase, at which point the water channeling occurs at lf/l = 1 and the displacement efficiency decreases to about 20%.
- (3)
- Both the fracture density and the pore structure of the matrix affect the absolute permeability and oil displacement efficiency. With the increase of fracture density, the absolute permeability increases rapidly and the oil displacement efficiency develops into three typical stages: when < 0.1, the oil displacement efficiency increases rapidly; when 0.1 < < 0.5, the oil displacement efficiency efficient changes slowly; and when > 0.5, the oil displacement efficiency decreases rapidly.
- (4)
- The absolute permeability increases when the fractures are parallel to the flow direction, while it decreases when the fractures are perpendicular to the flow direction. The existence of fractures can increase the displacement of the non-wetting phase, and the increase of the displacement efficiency is more pronounced when the fractures are parallel to the flow direction for Type I and Type II.
In further study, great efforts are required to establish PFNM in three-dimensional network construction, study the solid-fluid coupling effect, and track the phase interfaces.
Acknowledgments
This research is supported by National Science and Technology Major Project of China (No. 2016ZX05046003-002-001), National Key Basic Research Program of China (No. 2011CB707302), and Youth Innovation Promotion Association CAS (2017027). Thanks for the revisions of the grammar and editorial errors by Professor Boyi Wang (English Translation Association) at the Institute of Mechanics, Chinese Academy of Sciences.
Author Contributions
Xuhui Zhang, Xiaobing Lu and Qingjie Liu conceived of the presented idea. Haijiao Liu performed the computations and verified the methods. Haijiao Liu and Xuhui Zhang wrote and revised the article. All authors discussed the results and contributed to the final manuscript.
Conflicts of Interest
The authors declare no conflict of interest.
References
- Gaswirth, S.B.; Marra, K.R.; Cook, T.A.; Charpentier, R.R.; Gautier, D.L.; Higley, D.K.; Klett, T.R.; Lewan, M.D.; Lillis, P.G.; Schenk, C.J. Assessment of Undiscovered Oil Resources in the Bakken and Three Forks Formations, Williston Basin Province, Montana, North Dakota, and South Dakota, 2013; US Geological Survey: Reston, VA, USA, 2013.
- Jain, R. Natural resource development for science, technology, and environmental policy issues: The case of hydraulic fracturing. Clean Technol. Environ. Policy 2015, 17, 3–8. [Google Scholar] [CrossRef]
- Chitrala, Y.; Moreno, C.; Sondergeld, C.; Rai, C. An experimental investigation into hydraulic fracture propagation under different applied stresses in tight sands using acoustic emissions. J. Pet. Sci. Eng. 2013, 108, 151–161. [Google Scholar] [CrossRef]
- He, J.; Lin, C.; Li, X.; Zhang, Y.; Chen, Y. Initiation, propagation, closure and morphology of hydraulic fractures in sandstone cores. Fuel 2017, 208, 65–70. [Google Scholar] [CrossRef]
- Wang, C.; Xiong, Y.; Huang, Z.; Winterfeld, P.; Ding, D.; Wu, Y.-S. In A multi-porosity, multi-physics model to simulate fluid flow in unconventional reservoirs. In Proceedings of the SPE Reservoir Simulation Conference, Montgomery, TX, USA, 20–22 February 2017. [Google Scholar]
- Gale, J.F.; Reed, R.M.; Holder, J. Natural fractures in the Barnett Shale and their importance for hydraulic fracture treatments. AAPG Bull. 2007, 91, 603–622. [Google Scholar] [CrossRef]
- Bauer, D.; Youssef, S.; Fleury, M.; Bekri, S.; Rosenberg, E.; Vizika, O. Improving the estimations of petrophysical transport behavior of carbonate rocks using a dual pore network approach combined with computed microtomography. Transp. Porous Media 2012, 94, 505–524. [Google Scholar] [CrossRef]
- Jia, P.; Cheng, L.; Huang, S.; Wu, Y. A semi-analytical model for the flow behavior of naturally fractured formations with multi-scale fracture networks. J. Hydrol. 2016, 537, 208–220. [Google Scholar] [CrossRef]
- Wang, Y.; Song, X.; Tian, C.; Shi, C.; Li, J.; Gang, H.; Hou, J.; Gao, C.; Wang, X.; Liu, P. Dynamic fractures are an emerging new development geological attribute in water-flooding development of ultra-low permeability reservoirs. Pet. Explor. Dev. 2015, 42, 247–253. [Google Scholar] [CrossRef]
- Lu, W.; Zhang, Z.; Liu, Q.; Ma, D.; Wu, K. Measurement of three-phase relative permeabilities of various saturating histories and wettability conditions. In Proceedings of the International Symposium of the Society of Core Analysts, Aberdeen, UK, 27–30 August 2012; pp. 27–30. [Google Scholar]
- Deng, S.; Lu, W.; Liu, Q.; Leng, Z.; Li, T.; Liu, H.; Gu, H.; Xu, C.; Zhang, X.; Lu, X. Research on oil displacement mechanism in conglomerate using CT scanning method. Pet. Explor. Dev. 2014, 41, 365–370. [Google Scholar] [CrossRef]
- Fatt, I. The network model of porous media. Petroleum Trans. AIME, 1956, 207, 144–181. [Google Scholar]
- Ahmadpour, M.; Siavashi, M.; Doranehgard, M.H. Numerical simulation of two-phase flow in fractured porous media using streamline simulation and IMPES methods and comparing results with a commercial software. J. Cent. South Univ. 2016, 23, 2630–2637. [Google Scholar] [CrossRef]
- Fadlelmula, F.; Mohamed, M.; Fraim, M.; He, J.; Killough, J.E. Discrete fracture-vug network modeling in naturally fractured vuggy reservoirs using multiple-point geostatistics: A micro-scale case. In Proceedings of the SPE Annual Technical Conference and Exhibition, Houston, TX, USA, 28–30 September 2015. [Google Scholar]
- Noetinger, B. A quasi steady state method for solving transient Darcy flow in complex 3D fractured networks accounting for matrix to fracture flow. J. Comput. Phys. 2015, 283, 205–223. [Google Scholar] [CrossRef]
- Yan, B.; Wang, Y.; Killough, J.E. Beyond dual-porosity modeling for the simulation of complex flow mechanisms in shale reservoirs. Comput. Geosci. 2016, 20, 69–91. [Google Scholar] [CrossRef]
- Wilkinson, D.; Willemsen, J.F. Invasion percolation: A new form of percolation theory. J. Phys. A Math. Gen. 1983, 16, 3365. [Google Scholar] [CrossRef]
- Berkowitz, B.; Balberg, I. Percolation theory and its application to groundwater hydrology. Water Resour. Res. 1993, 29, 775–794. [Google Scholar] [CrossRef]
- Joekar-Niasar, V.; Hassanizadeh, S.M. Uniqueness of specific interfacial area-capillary pressure-saturation relationship under non-equilibrium conditions in two-phase porous media flow. Transp. Porous Media 2012, 94, 465–486. [Google Scholar] [CrossRef]
- Joekar-Niasar, V.; Hassanizadeh, S. Analysis of fundamentals of two-phase flow in porous media using dynamic pore-network models: A review. Crit. Rev. Environ. Sci. Technol. 2012, 42, 1895–1976. [Google Scholar] [CrossRef]
- Jiang, Z.; Van Dijke, M.; Wu, K.; Couples, G.; Sorbie, K.; Ma, J. Stochastic pore network generation from 3D rock images. Transp. Porous Media 2012, 94, 571–593. [Google Scholar] [CrossRef]
- Zhang, X.; Liu, Q.; Lu, X. Comparisons of static, quasi-static and dynamic 3D porous media scale network models for two-phase immiscible flow in porous media. In New Trends in Fluid Mechanics Research; Springer: Berlin/Heidelberg, Germany, 2007; pp. 530–533. [Google Scholar]
- Ramstad, T.; Idowu, N.; Nardi, C.; Øren, P.-E. Relative permeability calculations from two-phase flow simulations directly on digital images of porous rocks. Transp. Porous Media 2012, 94, 487–504. [Google Scholar] [CrossRef]
- Kim, D.; Lindquist, W. Dependence of pore-to-core up-scaled reaction rate on flow rate in porous media. Transp. Porous Media 2011, 89, 459–473. [Google Scholar] [CrossRef]
- Arns, C.H.; Bauget, F.; Limaye, A.; Sakellariou, A.; Senden, T.; Sheppard, A.; Sok, R.M.; Pinczewski, V.; Bakke, S.; Berge, L.I. Pore scale characterization of carbonates using X-ray microtomography. SPE J. 2005, 10, 475–484. [Google Scholar] [CrossRef]
- Joekar-Niasar, V.; Van Dijke, M.I.; Hassanizadeh, S. Pore-scale modeling of multiphase flow and transport: Achievements and perspectives. Transp. Porous Media 2012, 94, 461–464. [Google Scholar] [CrossRef]
- Bultreys, T.; Van Hoorebeke, L.; Cnudde, V. Multi-scale, micro-computed tomography-based pore network models to simulate drainage in heterogeneous rocks. Adv. Water Resour. 2015, 78, 36–49. [Google Scholar] [CrossRef]
- Barenblatt, G.; Zheltov, I.P.; Kochina, I. Basic concepts in the theory of seepage of homogeneous liquids in fissured rocks [strata]. J. Appl. Math. Mech. 1960, 24, 1286–1303. [Google Scholar] [CrossRef]
- Warren, J.; Root, P.J. The behavior of naturally fractured reservoirs. Soc. Pet. Eng. J. 1963, 3, 245–255. [Google Scholar] [CrossRef]
- Tsakiroglou, C.D. A multi-scale approach to model two-phase flow in heterogeneous porous media. Transp. Porous Media 2012, 94, 525–536. [Google Scholar] [CrossRef]
- Wang, P.; Zhang, X.; Lu, X.; Zheng, W.; Liu, Q. A dual percolation model for predicting the connectivity of fractured porous media. Water Resour. 2016, 43, 95–110. [Google Scholar] [CrossRef]
- Bibby, R. Mass transport of solutes in dual-porosity media. Water Resour. Res. 1981, 17, 1075–1081. [Google Scholar] [CrossRef]
- Gerke, H.H.; Van Genuchten, M.T. Macroscopic representation of structural geometry for simulating water and solute movement in dual-porosity media. Adv. Water Resour. 1996, 19, 343–357. [Google Scholar] [CrossRef]
- Lemonnier, P.; Bourbiaux, B. Simulation of naturally fractured reservoirs. State of the art-part 1-physical mechanisms and simulator formulation. Oil Gas Sci. Technol.-Revue de l’Institut Français du Pétrole 2010, 65, 239–262. [Google Scholar] [CrossRef]
- Lemonnier, P.; Bourbiaux, B. Simulation of naturally fractured reservoirs. State of the art-part 2-matrix-fracture transfers and typical features of numerical studies. Oil Gas Sci. Technol.-Revue de l’Institut Français du Pétrole 2010, 65, 263–286. [Google Scholar] [CrossRef]
- Liu, J.; Liu, X.; Hu, Y.; Zhang, S.-Z. The equivalent continuum media model of fracture sand stone reservoir. J. Chongqing Univ. (Nat. Sci. Ed.) 2000, 23, 161–180. [Google Scholar]
- Zheng, Q.; Yu, B. A fractal permeability model for gas flow through dual-porosity media. J. Appl. Phys. 2012, 111, 024316. [Google Scholar] [CrossRef]
- Xiao, B.; Chen, H.; Xiao, S.; Cai, J. Research on relative permeability of nanofibers with capillary pressure effect by means of fractal-monte carlo technique. J. Nanosci. Nanotechnol. 2017, 17, 6811–6817. [Google Scholar] [CrossRef]
- Noetinger, B.; Jarrige, N. A quasi steady state method for solving transient Darcy flow in complex 3D fractured networks. J. Comput. Phys. 2012, 231, 23–38. [Google Scholar] [CrossRef]
- Ding, D.; Farah, N.; Bourbiaux, B.; Wu, Y.; Mestiri, I. Simulation of matrix-fracture interaction in low-permeability fractured unconventional reservoirs. In Proceedings of the SPE Reservoir Simulation Conference, Montgomery, TX, USA, 20–22 February 2017. [Google Scholar]
- Noetinger, B.; Estebenet, T. Up-scaling of double porosity fractured media using continuous-time random walks methods. Transp. Porous Media 2000, 39, 315–337. [Google Scholar] [CrossRef]
- Jerbi, C.; Fourno, A.; Noetinger, B.; Delay, F. A new estimation of equivalent matrix block sizes in fractured media with two-phase flow applications in dual porosity models. J. Hydrol. 2017, 548, 508–523. [Google Scholar] [CrossRef]
- Fan, J.; Qu, X.; Wang, C.; Lei, Q.; Cheng, L.; Yang, Z. Natural fracture distribution and a new method predicting effective fractures in tight oil reservoirs in Ordos Basin, NW China. Pet. Explor. Dev. 2016, 43, 806–814. [Google Scholar] [CrossRef]
- Dahle, H.K.; Celia, M.A. A dynamic network model for two-phase immiscible flow. Comput. Geosci. 1999, 3, 1–22. [Google Scholar] [CrossRef]
- Kim, J.G.; Deo, M.D. Finite element, discrete-fracture model for multiphase flow in porous media. AIChE J. 2000, 46, 1120–1130. [Google Scholar] [CrossRef]
- Moore, T.; Slobod, R. Displacement of oil by water-effect of wettability, rate, and viscosity on recovery. In Proceedings of the Fall Meeting of the Petroleum Branch of AIME, New Orleans, LA, USA, 2–5 October 1955. [Google Scholar]
- Reed, R.L.; Healy, R.N. Some physicochemical aspects of microemulsion flooding: A review. Improv. Oil Recovery Surfactant Polym. Flooding 1977, 383–437. [Google Scholar]
- AlQuaimi, B.; Rossen, W. New capillary number definition for displacement of residual nonwetting phase in natural fractures. Geophys. Res. Lett. 2017. [Google Scholar] [CrossRef]
Figure 1.
Basic units of PFNM. (a) Structure of PFNM; (b) Trapping mechanism (The process of two-phase displacement, where blue represents the pores and the throats are filled with wetting phase, and orange represents the pores and the throats are filled with non-wetting phase).
Figure 1.
Basic units of PFNM. (a) Structure of PFNM; (b) Trapping mechanism (The process of two-phase displacement, where blue represents the pores and the throats are filled with wetting phase, and orange represents the pores and the throats are filled with non-wetting phase).
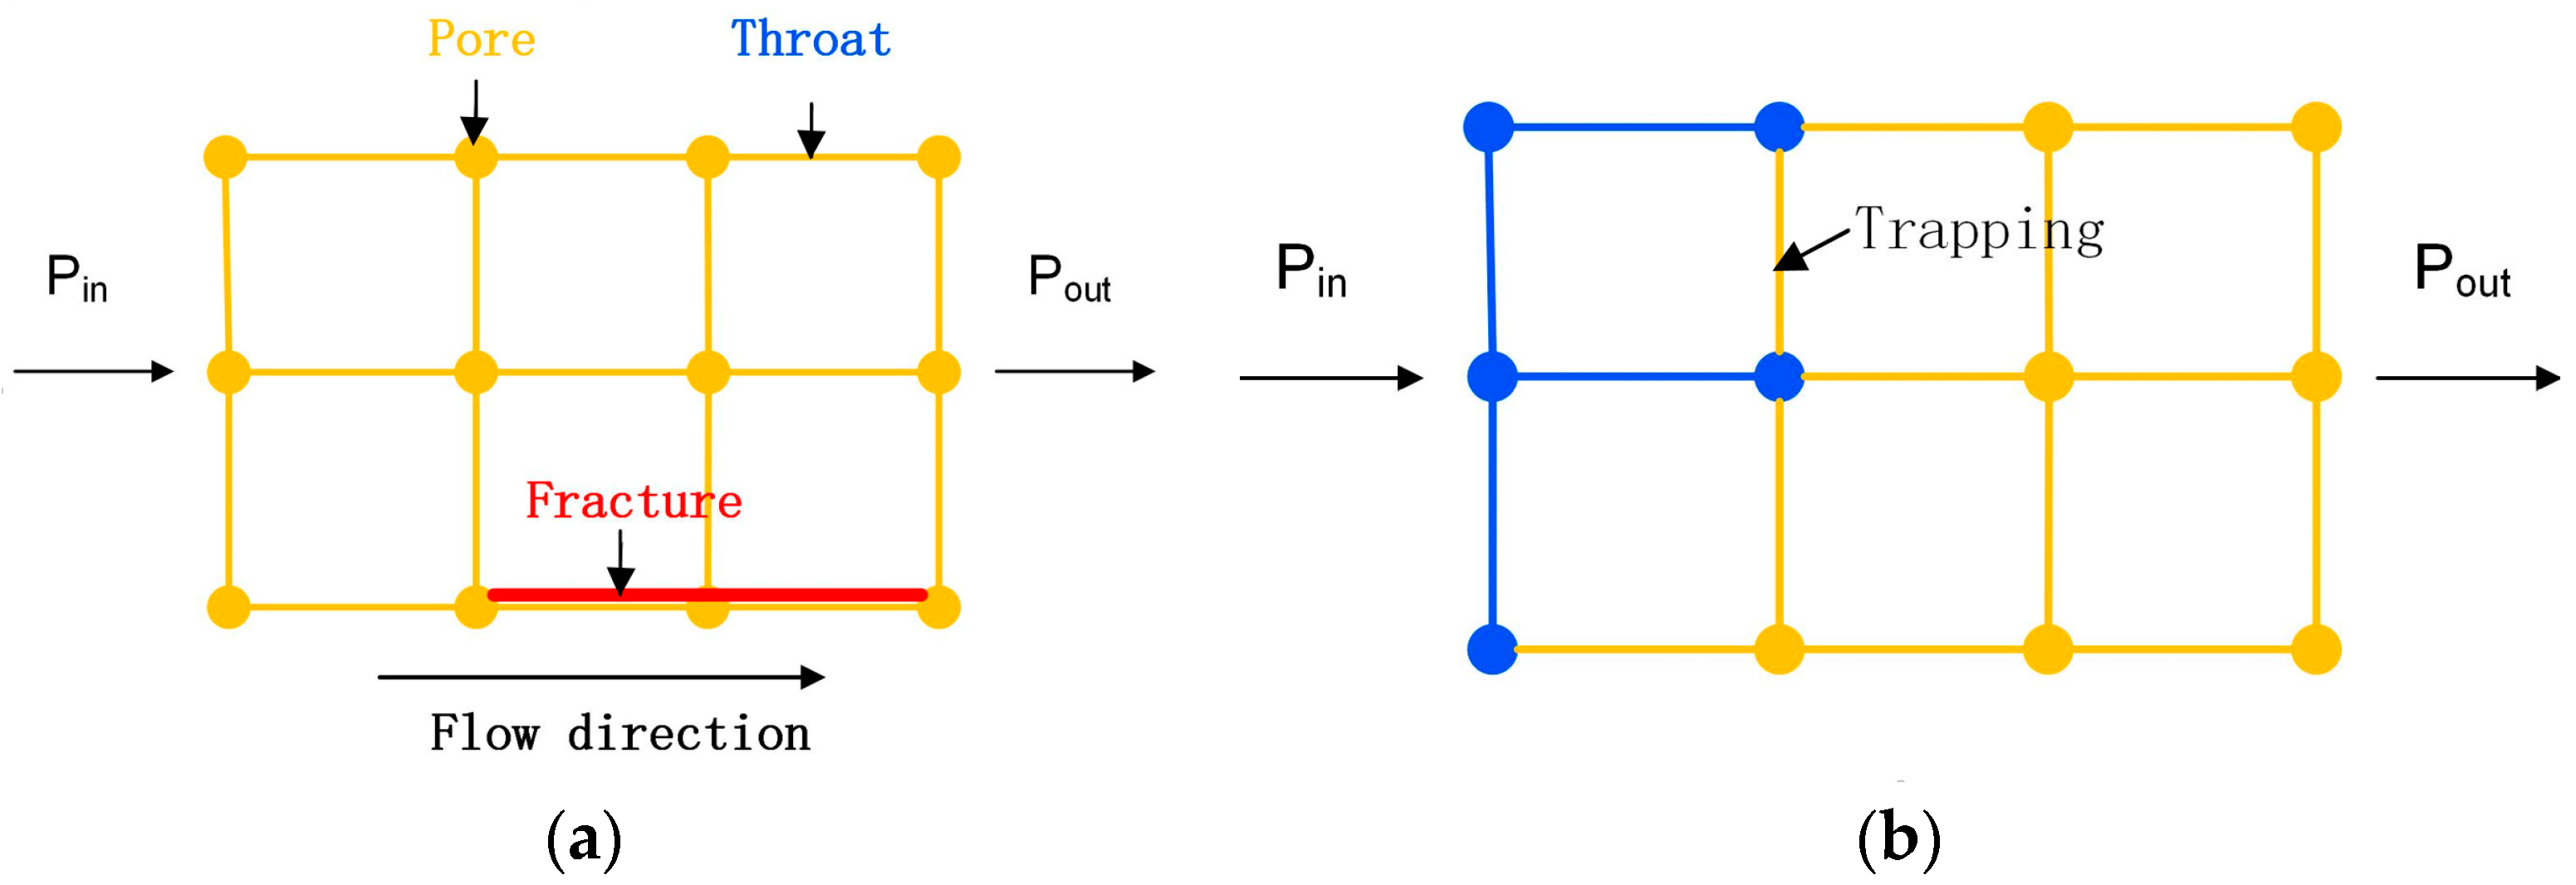
Figure 2.
PFNM in different scales. (a) 15 × 60; (b) 50 × 100; (c) Representative scale for simulations.
Figure 2.
PFNM in different scales. (a) 15 × 60; (b) 50 × 100; (c) Representative scale for simulations.

Figure 3.
Sensitivity of the pore network with fracture density (St1 and Sf1 are sensitivities when the fracture radius is 6 um, St2 and Sf2 are sensitivities when the fracture radius is 60 um, and St3 and Sf3 are sensitivities when the fracture radius is 90 um, respectively).
Figure 3.
Sensitivity of the pore network with fracture density (St1 and Sf1 are sensitivities when the fracture radius is 6 um, St2 and Sf2 are sensitivities when the fracture radius is 60 um, and St3 and Sf3 are sensitivities when the fracture radius is 90 um, respectively).
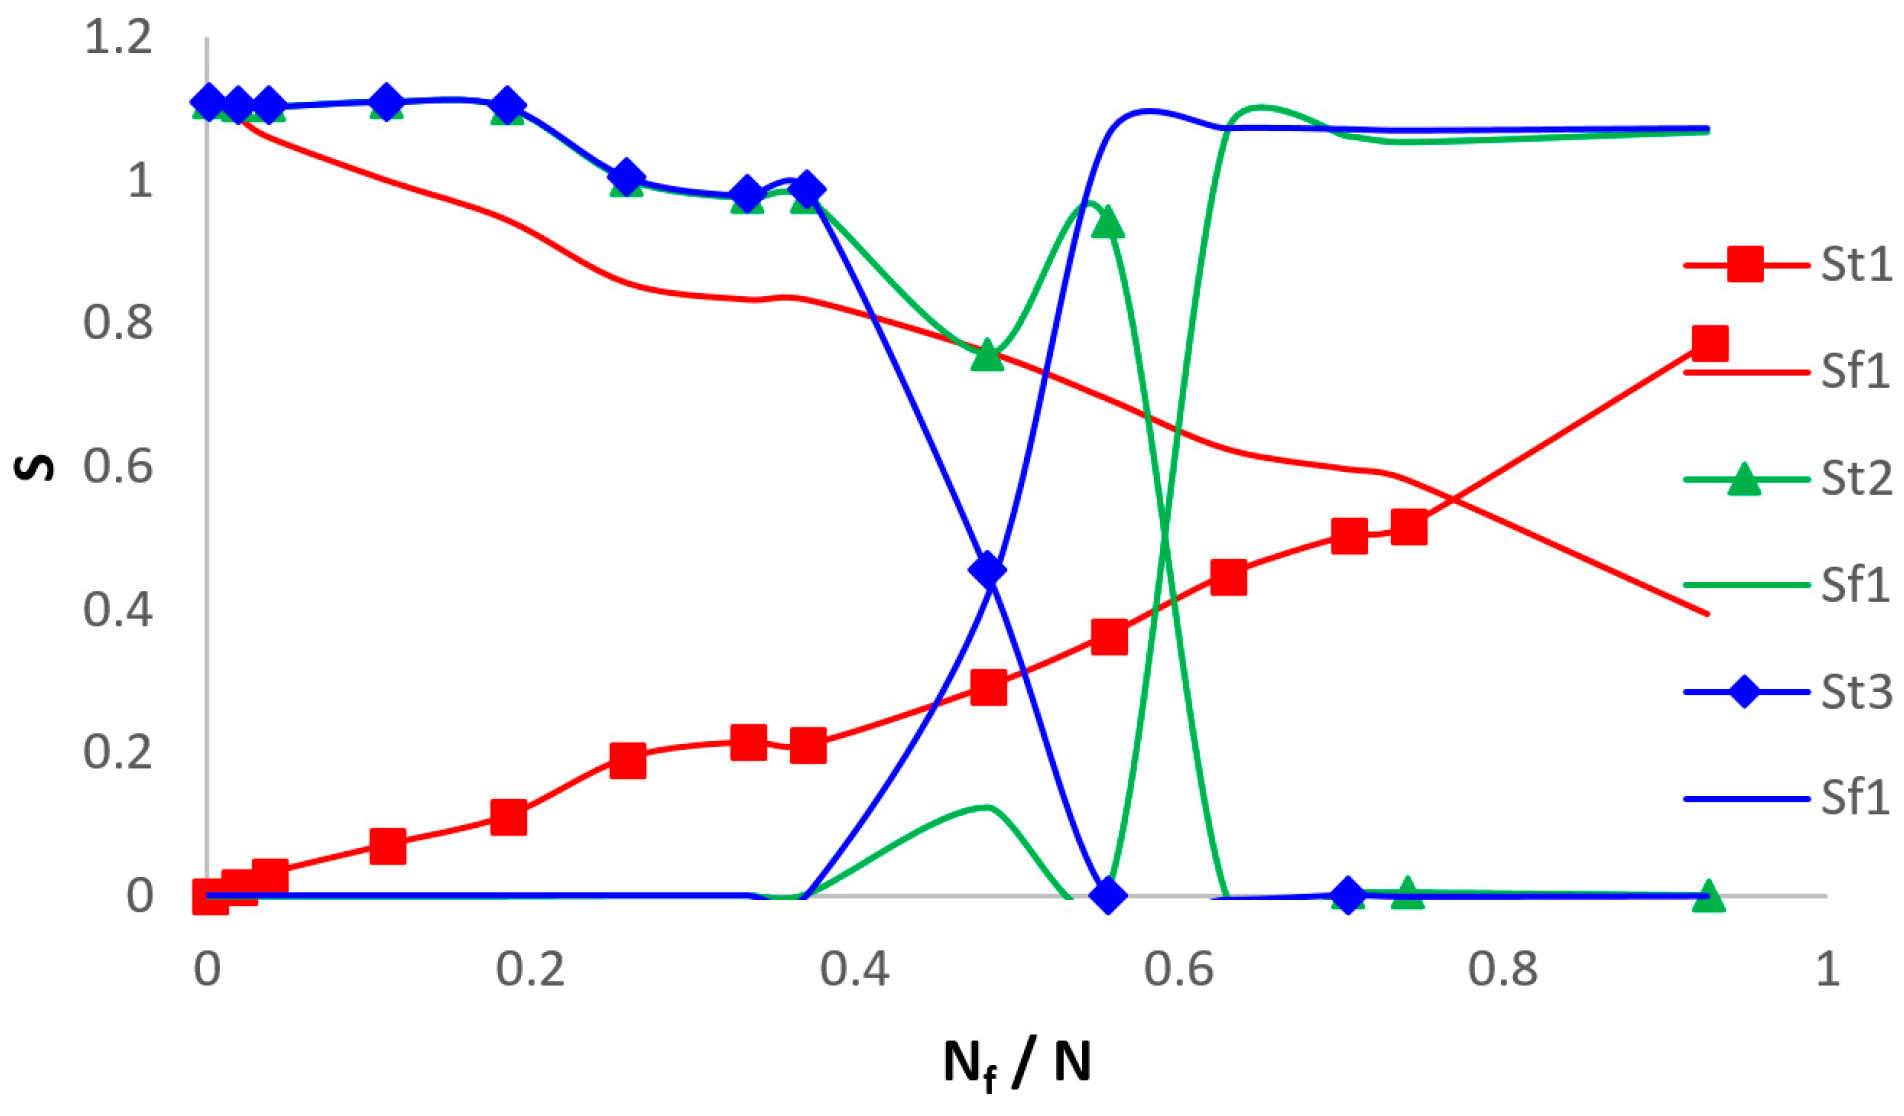
Figure 4.
The critical fracture density with .
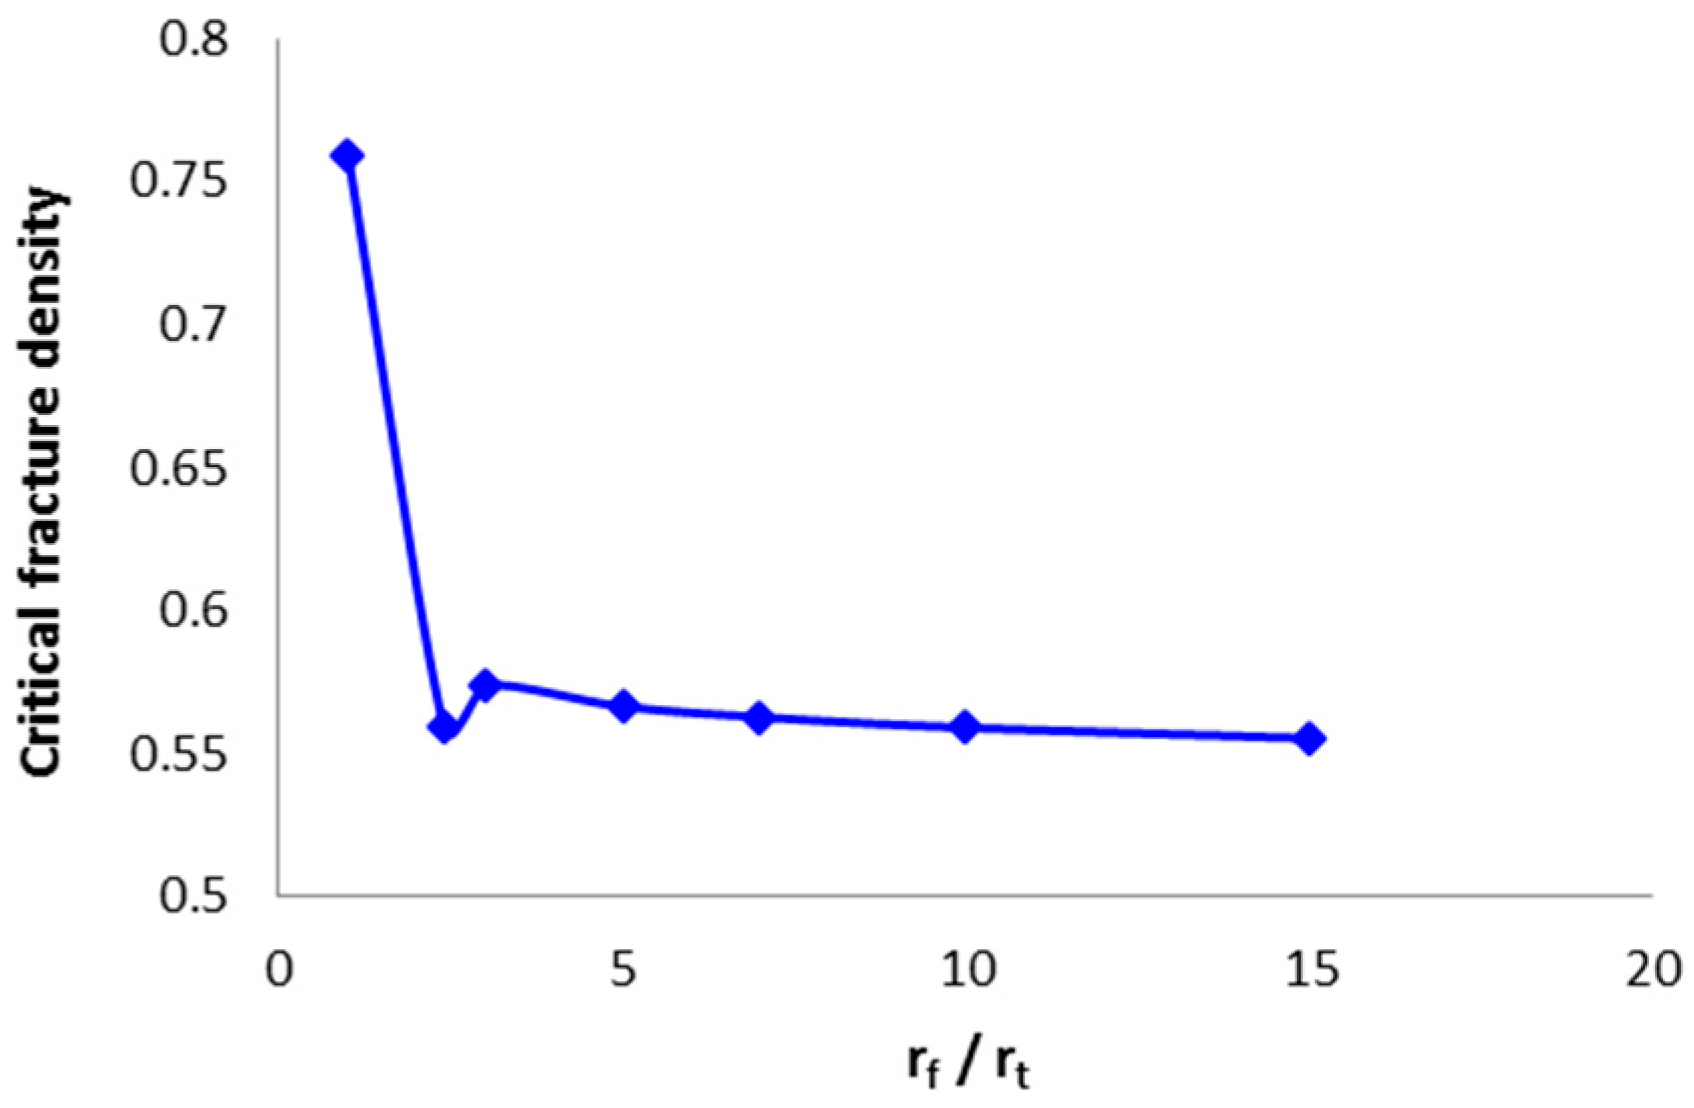
Figure 5.
The influence of fracture length on absolute permeability and displacement efficiency. (a) The influence of fracture length on absolute permeability; (b) The influence of fracture length on displacement efficiency.
Figure 5.
The influence of fracture length on absolute permeability and displacement efficiency. (a) The influence of fracture length on absolute permeability; (b) The influence of fracture length on displacement efficiency.
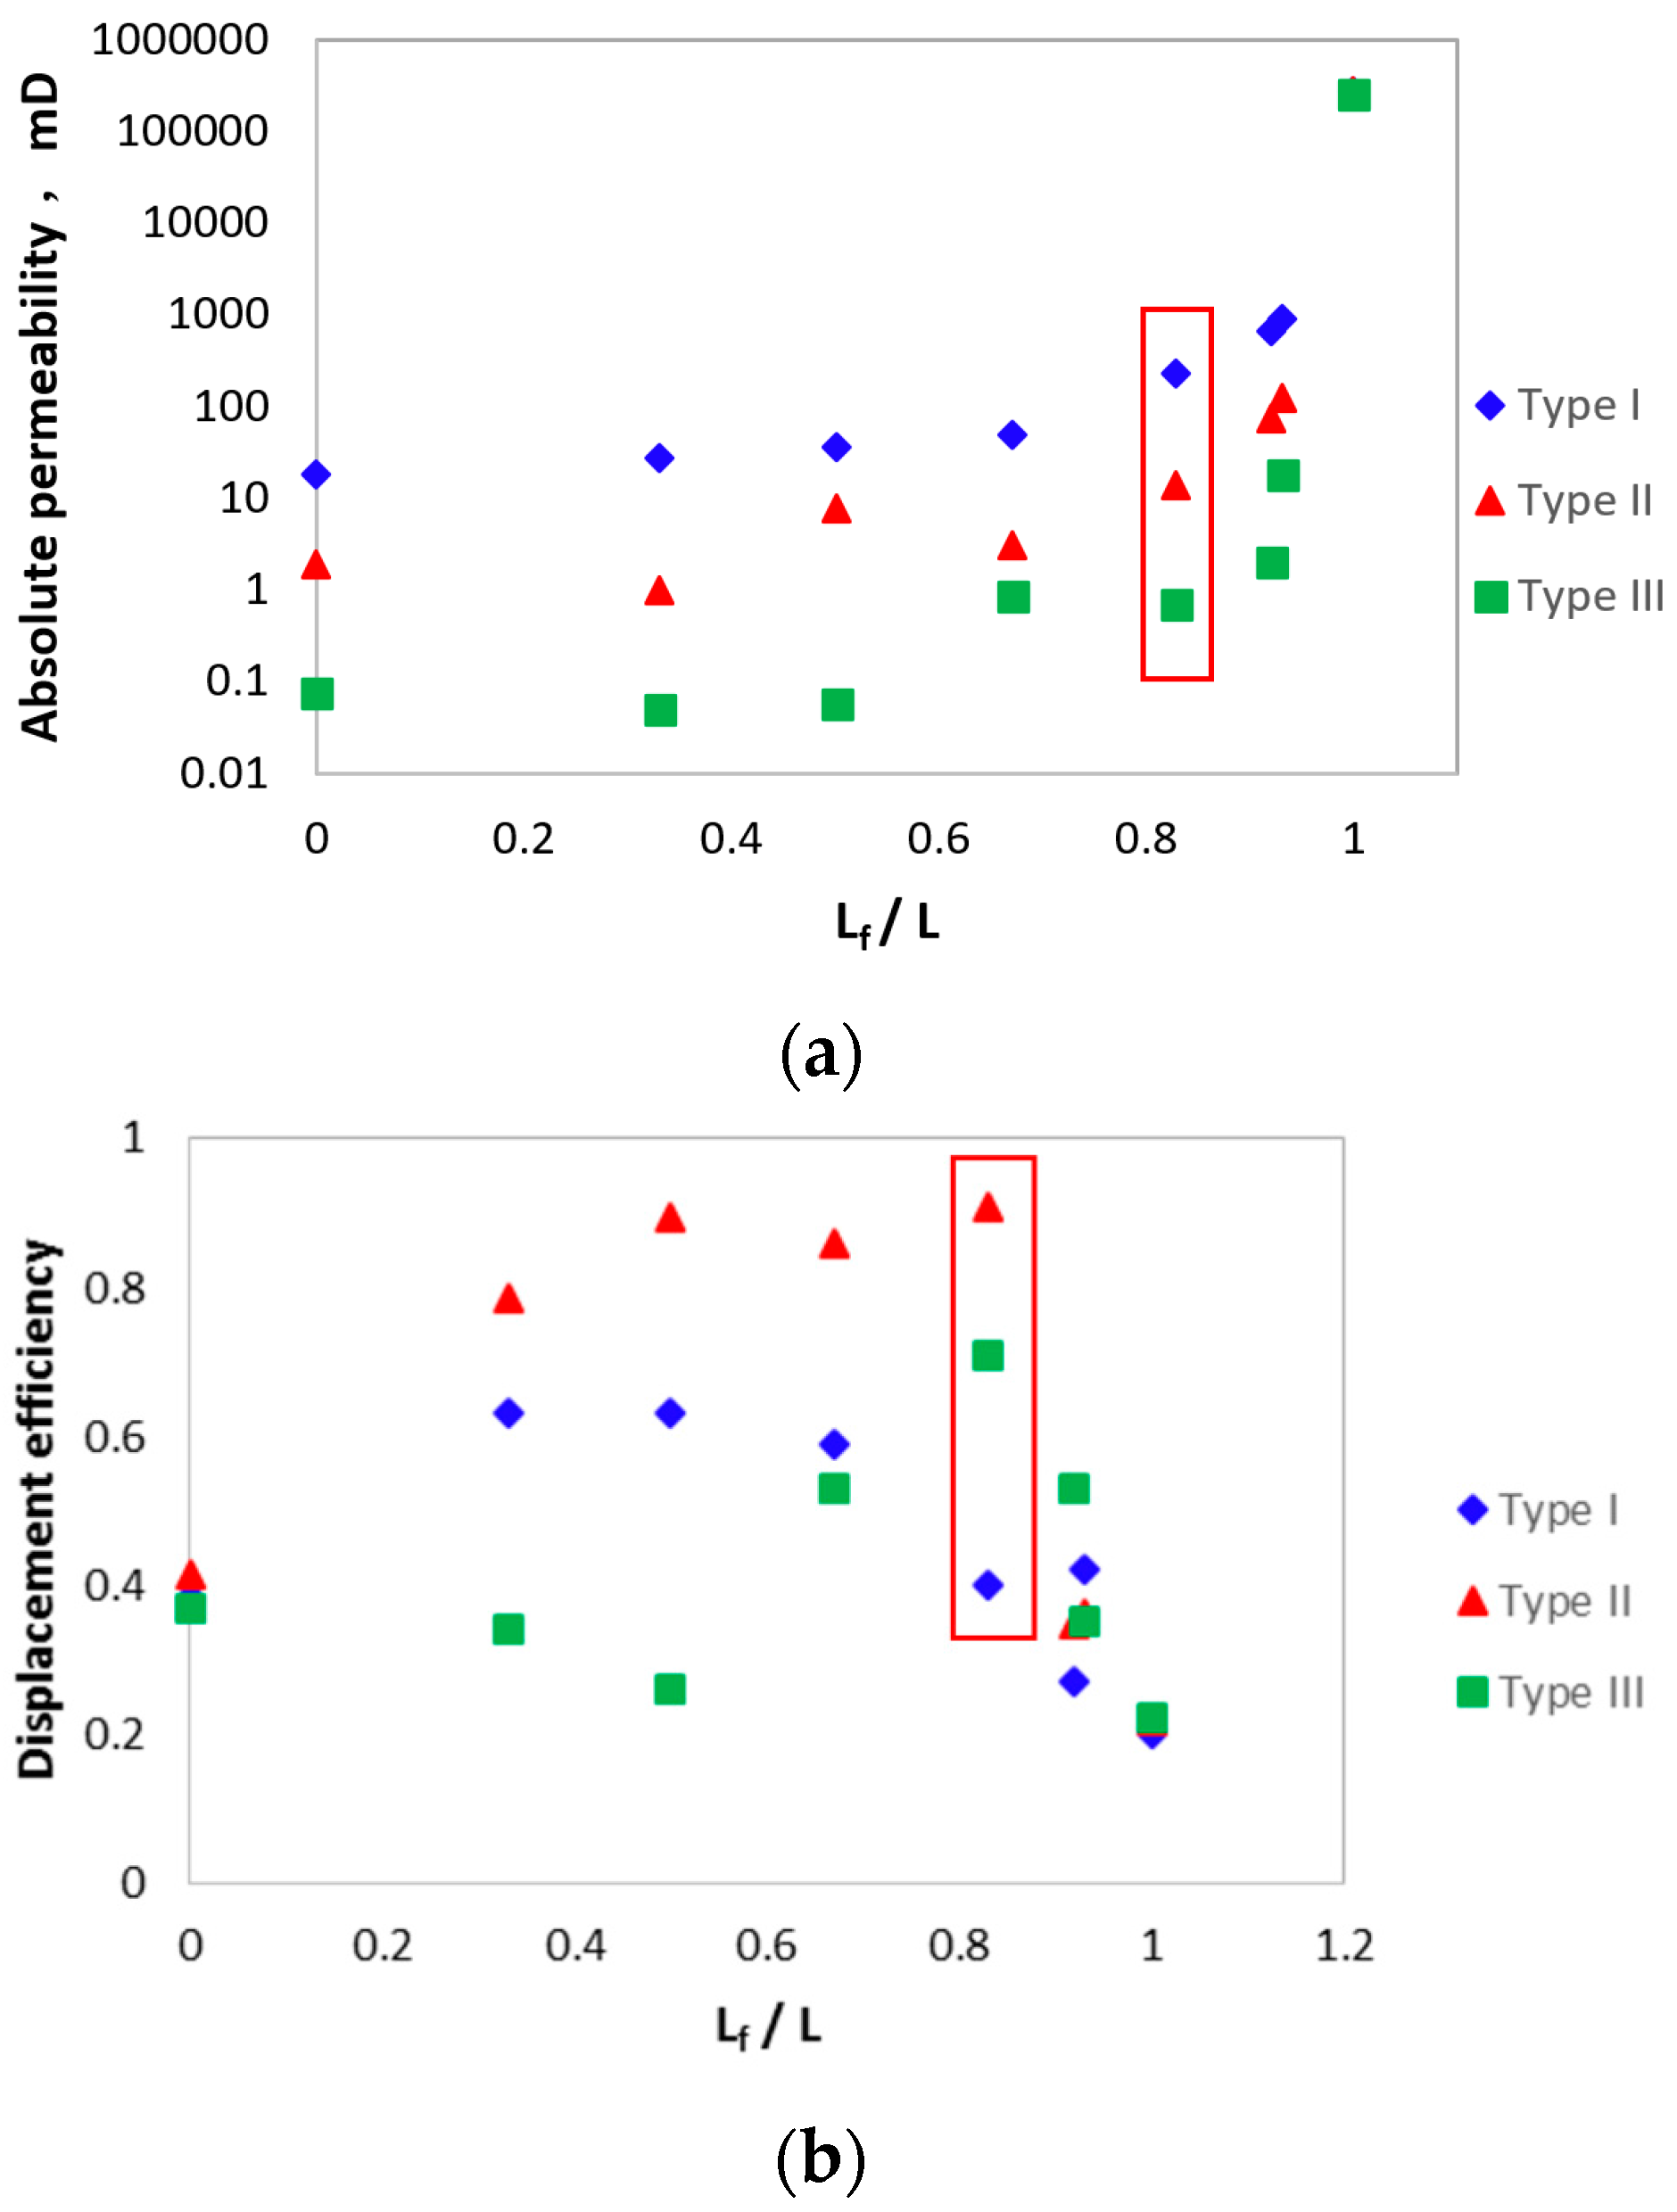
Figure 6.
Comparison of displacement efficiency for the finite element model and PFNM.

Figure 7.
The distribution of oil/water at the end of the displacement with different fracture lengths in Type II (The red throats and fractures are filled with oil and the blue throats and fractures are filled with water). (a) lf/l = 0.17; (b) lf/l = 0.34; (c) lf/l = 0.5; (d) lf/l = 0.67; (e) lf/l = 0.84; (f) lf/l = 1.
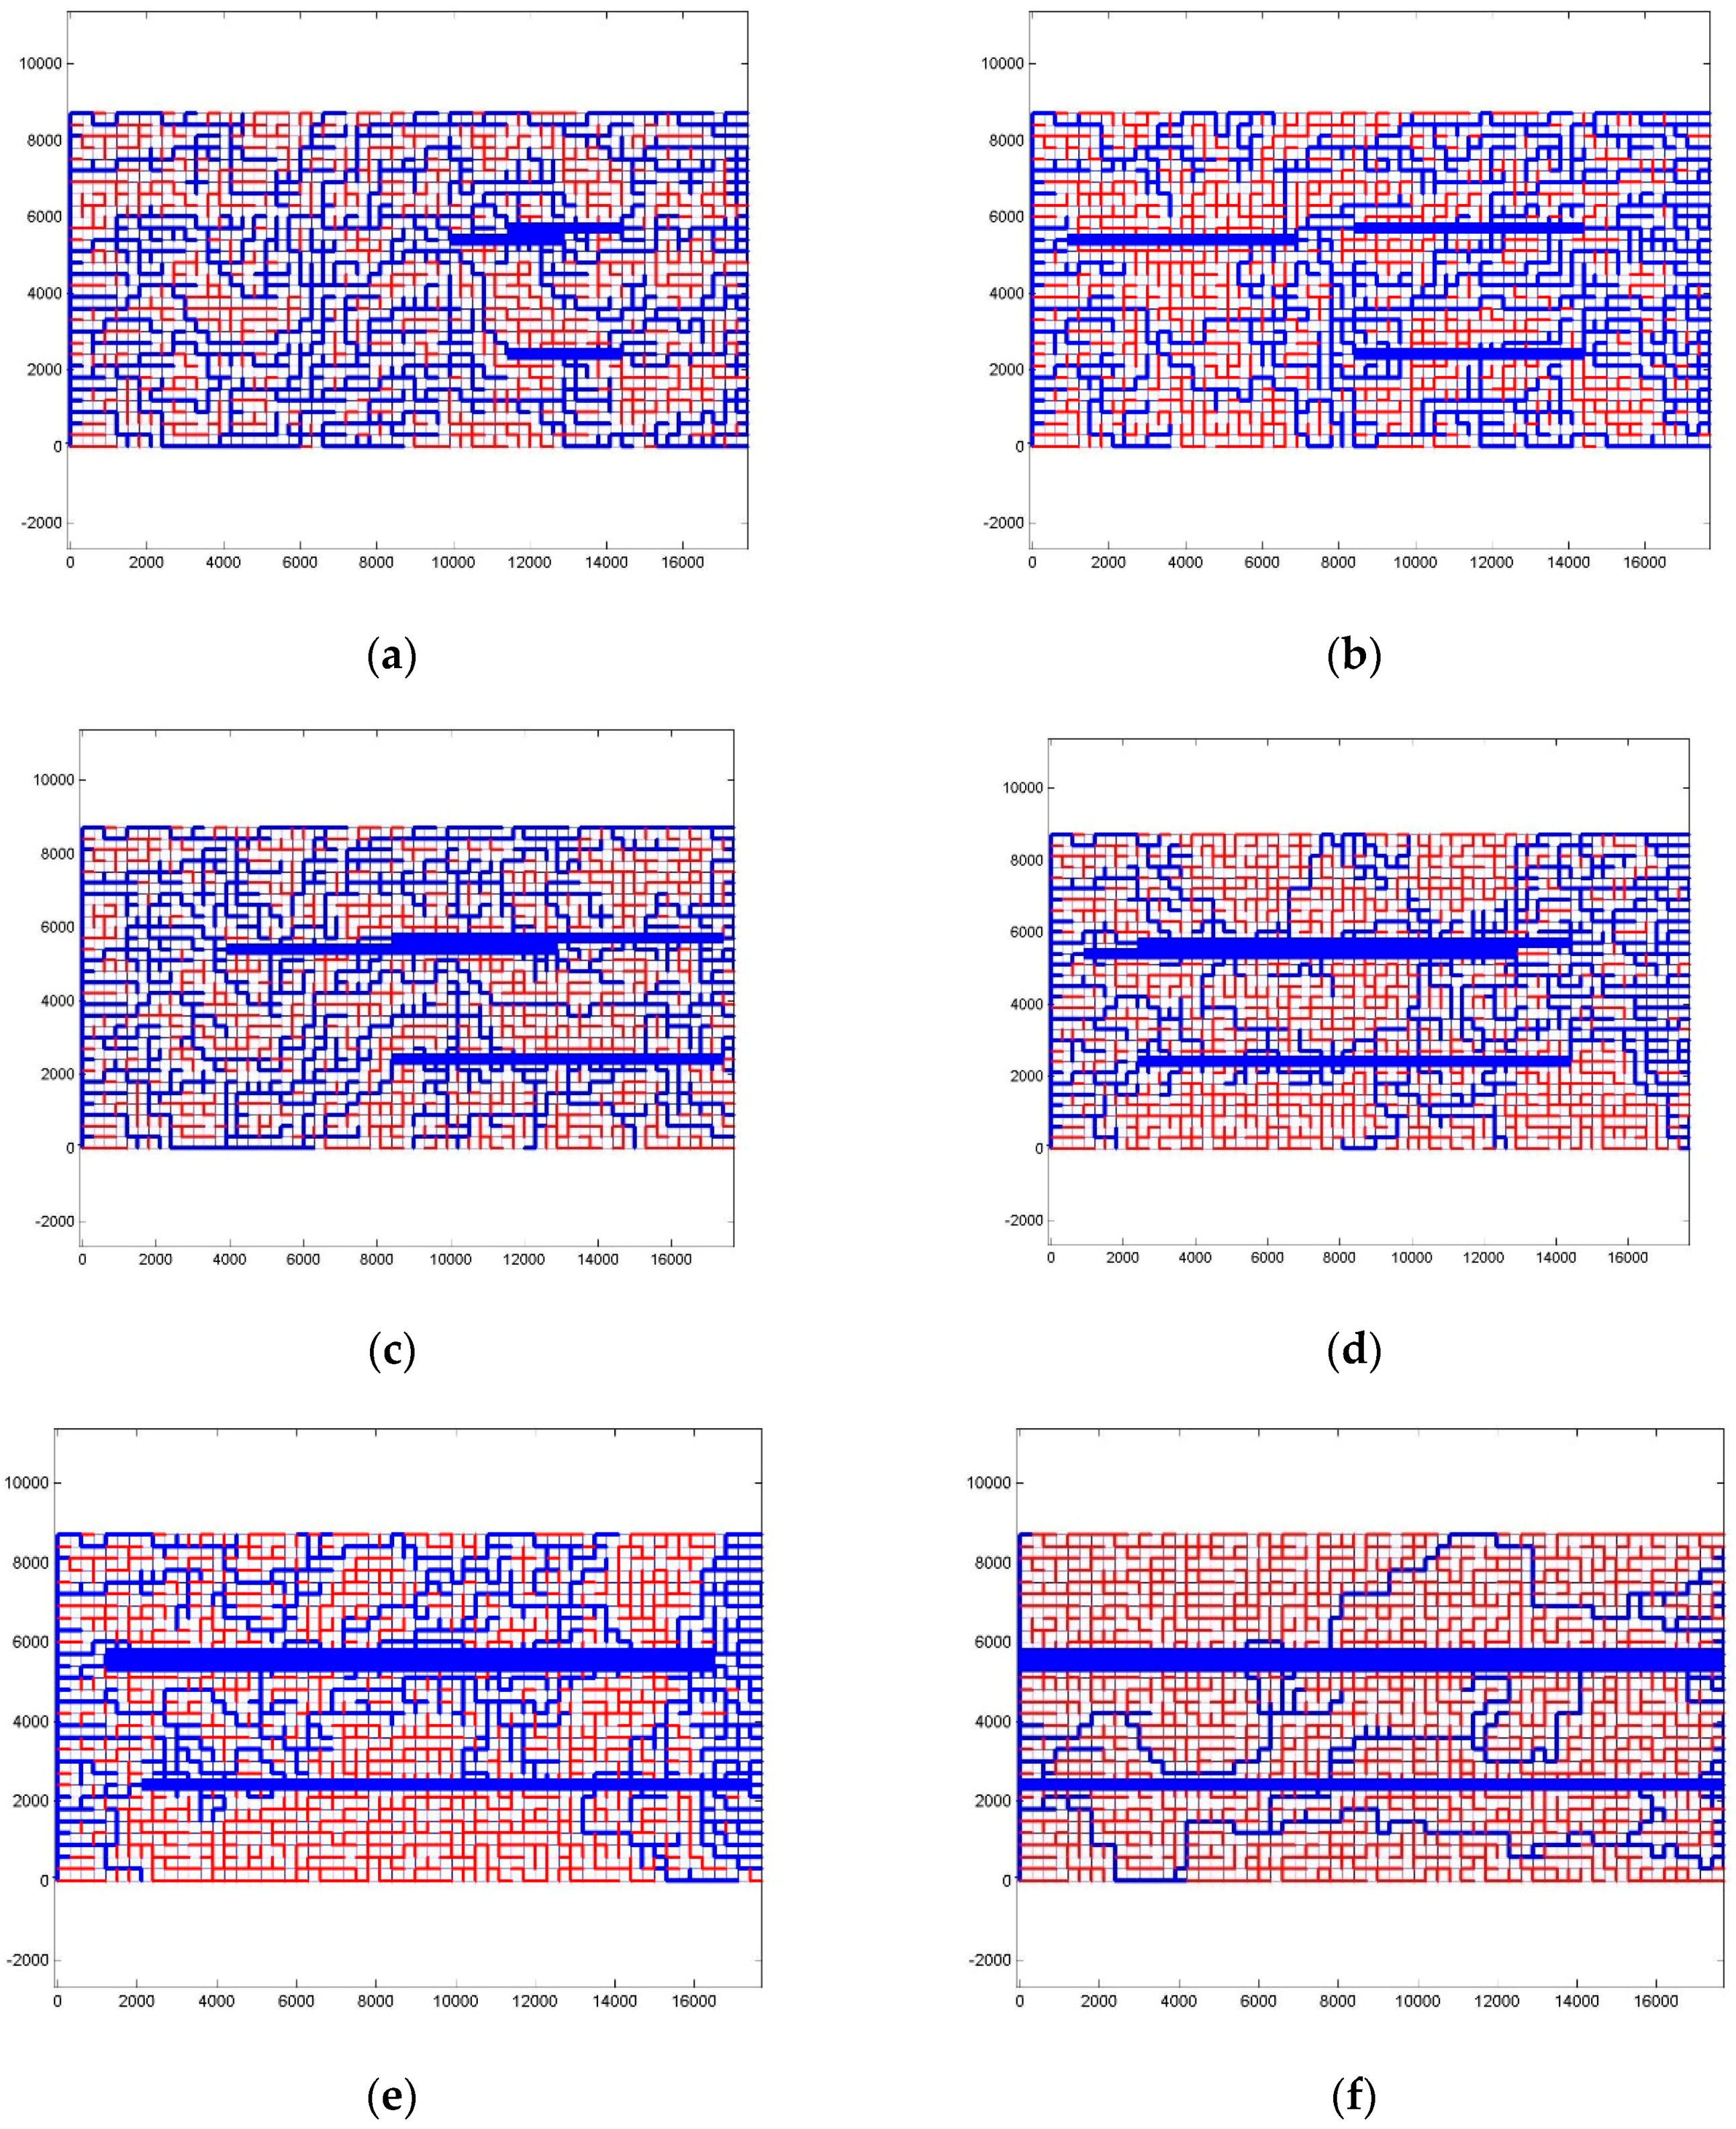
Figure 8.
The capillary number with different fracture lengths in Type I.

Figure 9.
The influence of fracture density on absolute permeability and displacement efficiency. (a) The influence of fracture density on absolute permeability; (b) The influence of fracture density on displacement efficiency.
Figure 9.
The influence of fracture density on absolute permeability and displacement efficiency. (a) The influence of fracture density on absolute permeability; (b) The influence of fracture density on displacement efficiency.

Figure 10.
The distribution of oil-water state at the end of displacement with different fracture numbers in Type II (The red throats and fractures are filled with oil and the blue throats and fractures are filled with water). (a) Nf = 20; (b) Nf = 80; (c) Nf = 120; (d) Nf = 160.
Figure 10.
The distribution of oil-water state at the end of displacement with different fracture numbers in Type II (The red throats and fractures are filled with oil and the blue throats and fractures are filled with water). (a) Nf = 20; (b) Nf = 80; (c) Nf = 120; (d) Nf = 160.

Figure 11.
The influence of the fracture direction on absolute permeability and displacement efficiency in Type II (The red throats and fractures are filled with oil and the blue throats and fractures are filled with water). (a) No fracture; (b) Parallel to the flow direction; (c) Perpendicular to the flow direction; (d) Multi-direction; (e) 30° of the flow direction.


Table 1.
Parameters used in the simulations.
| Fracture Density Nf/N (0~1) | ||
|---|---|---|
| Case 1 | Case 2 | Case 3 |
| = c1 = c2 | = c1 × t1 = c2 | = c1 × t2 = c2 |
c1, c2, t1, and t2 are constants.
Table 2.
Network parameters of different types.
| Permeability Classification | Throat Radius (Normal Distribution) | Porosity of the Matrix (%) | Absolute Permeability of the Matrix (mD) | Oil Displacement Efficiency of the Matrix |
|---|---|---|---|---|
| Type I (50~10 mD) | 0.1~20 μm, = 6, = 10 μm | 6.10 | 18.7 | 0.38 |
| Type II (10~1 mD) | 0.1~20 μm, = 6, = 8 μm | 4.38 | 2.23 | 0.64 |
| Type III (1~0.1 mD) | 0.1~20 μm, = 6, = 5 μm | 3.06 | 0.76 | 0.37 |
Table 3.
The influence of fracture direction on the absolute permeability.
| Cases | K/mD Type I | K/mD Type II | K/mD Type III |
|---|---|---|---|
| No fracture | 18.8 | 2.2 | 0.8 |
| Parallel to the flow direction | 50.0 | 8.3 | 0.7 |
| Perpendicular to the flow direction | 41.4 | 5.2 | 2.6 |
| Multi-direction | 37.8 | 5.1 | 0.8 |
| 30° with the flow direction | 9.8 | 4.3 | 0.2 |
Table 4.
The influence of fracture direction on the oil displacement efficiency.
| Cases | Type I | Type II | Type III |
|---|---|---|---|
| No fracture | 0.38 | 0.64 | 0.37 |
| Parallel to the flow direction | 0.89 | 0.80 | 0.53 |
| Perpendicular to the flow direction | 0.76 | 0.80 | 0.54 |
| Multi-direction | 0.78 | 0.77 | 0.53 |
| 30° of the flow direction | 0.73 | 0.66 | 0.56 |
© 2017 by the authors. Licensee MDPI, Basel, Switzerland. This article is an open access article distributed under the terms and conditions of the Creative Commons Attribution (CC BY) license (http://creativecommons.org/licenses/by/4.0/).
Share and Cite
MDPI and ACS Style
Liu, H.; Zhang, X.; Lu, X.; Liu, Q. Study on Flow in Fractured Porous Media Using Pore-Fracture Network Modeling. Energies 2017, 10, 1984. https://doi.org/10.3390/en10121984
AMA Style
Liu H, Zhang X, Lu X, Liu Q. Study on Flow in Fractured Porous Media Using Pore-Fracture Network Modeling. Energies. 2017; 10(12):1984. https://doi.org/10.3390/en10121984
Chicago/Turabian StyleLiu, Haijiao, Xuhui Zhang, Xiaobing Lu, and Qingjie Liu. 2017. "Study on Flow in Fractured Porous Media Using Pore-Fracture Network Modeling" Energies 10, no. 12: 1984. https://doi.org/10.3390/en10121984
Note that from the first issue of 2016, this journal uses article numbers instead of page numbers. See further details here.