Design and Experiment of Nonlinear Observer with Adaptive Gains for Battery State of Charge Estimation


1
Department of Control Science and Engineering, Harbin Institute of Technology, Harbin 150001, China
2
China First Automotive Works (FAW) Group Corporation New Energy Vehicle Branch, Changchun 130122, China
*
Author to whom correspondence should be addressed.
Energies 2017, 10(12), 2046; https://doi.org/10.3390/en10122046
Submission received: 9 November 2017
/
Revised: 29 November 2017
/
Accepted: 30 November 2017
/
Published: 3 December 2017
Abstract
:State of charge (SOC) is an important evaluation index for lithium-ion batteries (LIBs) in electric vehicles (EVs). This paper proposes a nonlinear observer with a new adaptive gain structure for SOC estimation based on a second-order RC model. It is able to dynamically adjust the gains and obtain a better balance between convergence speed and estimation accuracy with less computational time. A sufficient condition is derived to guarantee the uniform asymptotic stability of the observer, and its robustness with respect to disturbances and uncertainties is analyzed with the help of input-to-state stability (ISS) theory. A selection guide of the observer gains in practical application is presented. The estimation accuracy and convergence rate of the observer are evaluated and compared with those of extended Kalman filter (EKF) based on multi-temperature datasets from two different types of LIB cells. The robustness against different disturbances and uncertainties that may appear in a real vehicle is validated and discussed in detail. The experimental results show that the proposed observer is capable of achieving better performance with less computational time in comparison to EKF for different types of LIB cells under various working conditions. The observer is also capable of estimating SOC accurately for real life conditions according to the validation results of datasets from a battery management system (BMS) in an EV battery pack. Furthermore, the observer is simple enough, and is suitable for implementation on embedded hardware for LIB cells of EVs.
1. Introduction
For sustainable development with less air pollution and new job opportunities, electric vehicles (EVs) have a positive social impact and a greatly increased potential to revive as the dominant means of transportation in the coming decades [1]. The performance of EVs (driving range, acceleration, energy recovery, etc.) is highly dependent on the battery characteristics and the battery management system (BMS), which is employed to improve the performance, prolong the lifetime, prevent damage, and guarantee a safe and efficient usage of the batteries in EVs [2].
Various electrochemical energy storage systems have been used as batteries for EVs, such as nickel/metal hydride, valve-regulated lead acid, and lithium-ion batteries (LIBs) as well as other typessuch as ultra-capacitors or fuel cells [3]. Among the existing battery types, LIBs are widely considered as the most capable candidate in EVs for the advantages of its high energy density, long life and relatively good safety performance [4]. Therefore, this paper focuses on LIBs used in EVs. As mentioned above, an effective BMS must evaluate the current amount of energy stored in battery for an optimal battery performance and reliable operation of EVs. It needs to obtain the real-time value of state of charge (SOC) [5]. Because the battery is a complex electrochemical system, the SOC involves in intrinsic electrochemical reaction process, and cannot be measured directly by sensors. This means that it has to be estimated in real time making use of available measurements, such as terminal voltage, current and temperature of the battery call.
The SOC estimation of battery cell has been widely discussed in the literature, for example, see [6,7,8] and references therein. Several methods have been proposed to address this issue. One of the most straightforward methods to estimate the SOC is the Coulomb counting [9]. It can be implemented on embedded hardware simply. However, it is difficult to achieve an accurate SOC estimation just by a simple Coulomb counting method, mainly because of the initial SOC estimation error and the accumulated error from current sensor biases and noise. One solution for the initial estimation error is to establish a relationship between SOC and open circuit voltage (OCV) in advance. The OCV can be obtained by measuring the terminal voltage of a battery after a long time resting [10] or by real-time estimation algorithms [11], and then the SOC is available. Nevertheless, this requires long resting periods and high precision of the voltage measurement.
To improve the SOC estimation accuracy, and to benefit from a large number experimental datasets of batteries, other methods for estimating the SOC based on data driven and machine learning have been reported, such as artificial neural networks [12,13] and support vector machine [14]. The aforementioned methods can estimate SOC accurately without battery model if sufficient complete training datasets of the battery are available. Since the working conditions of the batteries used in EVs are complicated, it is difficult to obtain complete training datasets. It is also difficult for embedded hardware to handle the massive computation loads caused by a large number of training datasets [15].
To solve the problems mentioned above, many different model-based approaches have been developed and published in recent years. Kalman filter (KF), which is a classical state estimation approach, has been applied to estimate the SOC [16,17], and some extended Kalman filter (EKF) techniques based on nonlinear equivalent circuit modes have been employed [18,19] to improve the estimation accuracy further. The aforementioned methods can enhance the robustness and accuracy of the SOC estimation. However, they may engender a significant number of calculations for implementation because an error covariance matrix must be propagated at each sampling instance [20]. Other model-based approaches with constant gains, such as Luenberger observer [21,22], sliding mode observer [23,24], and nonlinear observer [25], have also been adopted to estimate the SOC. These methods depend on the exhaustive understanding of battery dynamics for the appropriate selection of the gains, which affect the estimation accuracy and convergence rate of the observer. Nevertheless, the significant nonlinearity of SOC-OCV function means the sensitivity of the output with respect to the state varies greatly and constant gain is not suitable [26]. More recently, the SOC estimation methods based on sliding mode observer with gains adaption has been proposed to overcome the limitation [4,27]. They are able to reduce the chattering magnitudes and improve the SOC estimation accuracy by dynamically adjusting the switching gains of the observer. In addition, nonlinear observers with gains adaption proposed in [28,29] have been used to balance the estimation accuracy and convergence rate of the SOC. However, the methods proposed in [28,29] need additional calculation to obtain the Jacobian of the output with respect to currently estimated states, which is used to weight the gain at each sampling instance. It is worth noting that the computational cost of SOC estimation algorithm is important for its implementation on embedded hardware.
In this paper, a nonlinear observer with a new adaptive gain structure for SOC estimation is presented. The proposed adaptive law of gains uses the difference between measured and estimated terminal voltage of battery cell. Benefiting from the adaptive gain structure, the observer can achieve a better balance between convergence speed and estimation accuracy with less computational time. In addition, a sufficient condition based on Lyapunov stability theory is derived to guarantee the uniform asymptotic stability of the observer, and the robustness of the observer with respect to disturbances and uncertainties is analyzed with the help of input-to-state stability (ISS) theory, which has not been used for nonlinear observer design for SOC estimation to the best of the authors’ knowledge. The main contribution of this paper lies in the design of a valid nonlinear with a new adaptive gain structure, analysis of observer stability and robustness in a theoretical way, discussion about the selection of observer gains in practical application, detailed experimental evaluations and comparison with EKF based on datasets from two different types of cells at different temperatures, robustness testing for a variety of conditions which may appear in real vehicle, validation of the proposed observer based on datasets from real life conditions of actual battery pack, and obtaining good performance for all tests. Moreover, the observer is simple enough, and is suitable for implementation on embedded hardware.
The rest of the paper is organized as follows. In Section 2, a second-order RC model and a nonlinear function to approximate the inherently nonlinear relationship between OCV and SOC are presented. Estimation model, observer design and robustness analysis in a theoretical way are revealed in Section 3. Section 4 gives the measurement equipment, validation tests design, battery model parameters identification, selection of the observer gains, experimental and robustness testing results and discussion. Application of the proposed methods to EV battery is listed in Section 5. Finally, conclusions and future work are drawn in Section 6.
2. LIB Cell Model
SOC is a relative quantity that describes the ratio of the remaining capacity to nominal one in a battery [30]. According to the definition, it has
where denotes the initial value of SOC, is the nominal capacity of the battery in ampere-hours, characterizes the columbic efficiency, which is usually taken as 1 for discharging and smaller than or close to 1 for charging for LIBs in a wide range of current and temperature, and represents the charging/discharging current with and for discharge and charge processes, respectively.
The SOC can be directly calculated by integrating Equation (1) using the current measurement and an initial value of SOC. However, as discussed above, this method often leads to unacceptable estimation results due to the presence of current measurement errors, such as sensors biases and noise [31]. Thus, some feedback should be used to make the SOC estimation results converge, and a dynamic model of battery is needed.
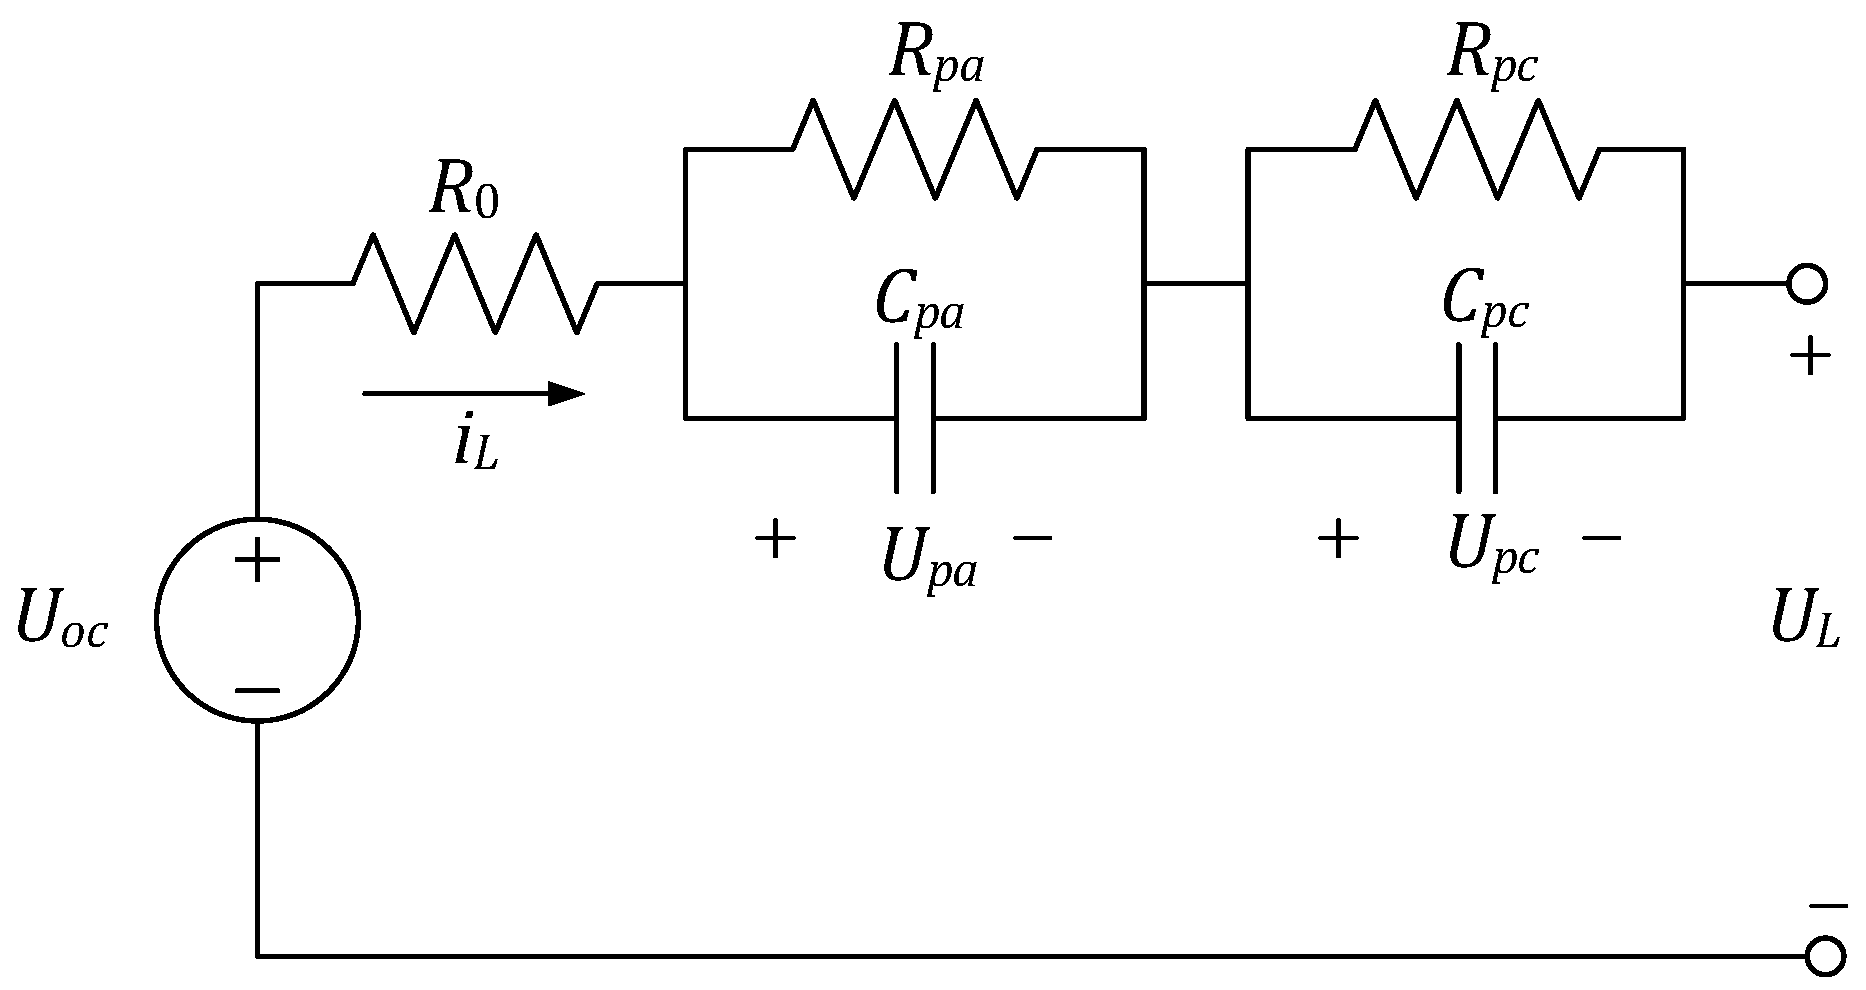
The two most commonly used battery models are known as equivalent circuit model and electrochemical model [32]. Since the equivalent circuit model is simple and can describe the main dynamics of battery, it is usually used for the battery controller design and state estimation [33]. In this paper, a second-order RC model is selected and shown in Figure 1, in which an extra RC branch is added to the Thevenin model to achieve sufficient model accuracy. In the second-order RC model, and denote the OCV and terminal voltage of the battery, respectively. Two parallel resistive and capacitive branches consist of electrochemical polarization resistance and capacitance , and concentration polarization resistance and capacitance . They are used to reflect the short-term and long-term transient responses due to the relaxation effect of battery. This relaxation effect is mostly caused by a diffusion effect and a double-layer charging or discharging effect in the battery [34]. and represent the polarization voltages across and , respectively. An Ohmic resistance can be used to characterize the resistive behavior of battery electrolyte and reproduce the Ohmic voltage drop during current pulse. The self-discharge resistance is neglected in this model as the LIBs have extremely low self-discharge rate.
According to Figure 1 and the Kirchhoff’s voltage law in circuit theory, the relationship among the terminal voltage , the open circuit voltage , the polarization voltages and , and the current measurement of the battery can be described as follows
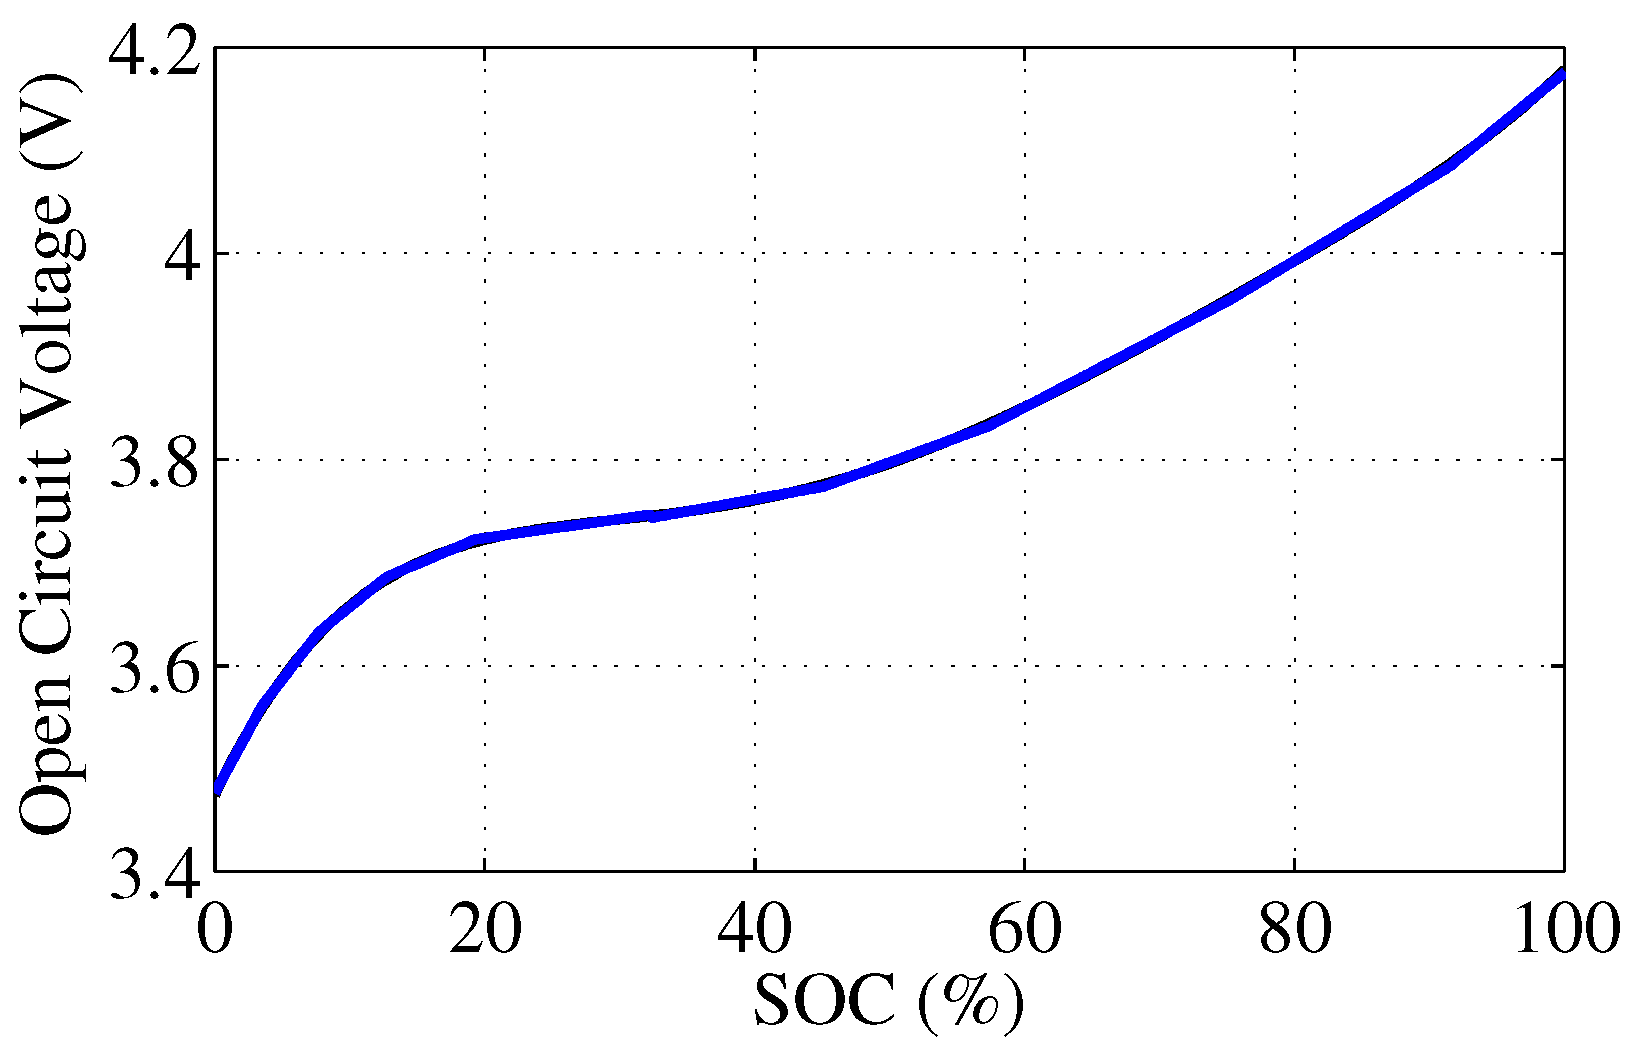
As indicated by experimental results, the open circuit voltage is a function of SOC, and the relationship between and SOC is intrinsically nonlinear as shown in Figure 2. It is also clear that is strictly increasing with respect to SOC within the range of operation if the SOC-OCV curve is exactly accurate. In this paper, the relationship between and SOC is described by a nonlinear function as
with coefficients , . Here, n can be used to balance the accuracy and computational time, and is set as 6.
3. SOC Observer Design
3.1. Estimation Model
The objective of this paper is to design an observer to estimate the SOC of the LIB cell for EVs under different working conditions. Therefore, it needs to establish an appropriate estimation model for the system shown in Figure 1 firstly.
Define the system state vector as , the system input and output are and . Furthermore, combining Equations (2)–(5), the battery dynamics based on the second-order RC model can be represented by the following equations
It is clear that this is a nonlinear system, and the estimation of SOC can be achieved by estimating of the system states.
3.2. Observer Design
According to the model (6), a nonlinear observer with a variable gain structure for SOC estimation is proposed as follows
where is the feedback gain of the observer, and is defined as
with , and . Here, the time-varying term is used to weight the gains of the observer and balance the convergence speed and estimation accuracy.
Differing from the exist methods with constant observer gains for SOC estimation [21,22,23,25], the observer proposed in this paper is able to dynamically adjust the gains and obtain a better balance between convergence speed and estimation accuracy. The proposed adaptive law is based on the feedback term, and additional calculations as the methods in [28,29] to obtain the gains are avoided. It also differs from the sliding mode observer with adaptive switching gains in [4,27] due to the chattering phenomena of sliding mode observer, which can be avoided in the proposed observer. Furthermore, the proposed observer has only 3 gains to be adjusted, and is suitable for implementation on embedded hardware for EVs.
In the following, the selection of , and to guarantee the convergence of the observer will be discussed. Define the estimation error vector of the observer (7) as , and the observer error dynamics can be obtained by subtracting Equation (7) from Equation (6) as follows
Define
where . According to Figure 2 and Equation (3), it is clear that describes the slope of the SOC-OCV curve for LIB cells, and the function is strictly increasing and continuously differentiable with respect to the state x within the range of operation based on the assumption that the SOC-OCV curve is accurate. Therefore, the values of should be always positive, and it has
It is worth noting that the SOC-OCV curve of battery can be obtained accurately by off-line measurement, and the assumption is reasonable.
Define , it has
Obviously, is a symmetric matrix, and the observer error dynamics (Equation (9)) can be rewritten as
Sylvester’s criterion states that a necessary and sufficient condition for a symmetric matrix to be positive definite is that its successive principal minors are positive. Consequently, if the observer gains are chosen as
all successive principal minors of the symmetric matrix is positive, and then is positive definite.
Define a Lyapunov function as
its time derivative along the trajectories of Equation (14) is given by
It is clear that is positive definite and the observer error dynamics (Equation (9)) achieves uniform asymptotic stability. This implies that the estimated states of the system (Equation (6)) including SOC can converge to their true values.
According to Equation (15), we can obtain
This is a sufficient condition for the stability of the observer error dynamics. The upper bounds of and depend on the value of the time-varying term . A larger value of the time-varying term means a smaller upper bounds of and . As it is well known that the value of the time-varying term must be upper bounded, it is not a difficult thing to determine the ranges of and . This will be discussed in detail combining with the values of the battery model parameters in the following section.
3.3. Robustness Analysis
The design of the observer presented above is based on the nominal model of battery. However, the parametric uncertainties (such as the uncertainties on the SOC-OCV curve caused by temperature, cell-to-cell diversity, lifetime, and so on), unmodeled nonlinearity of cell like hysteresis, and input disturbances (current sensor biases), cannot be avoided in a battery system for EVs due to the complex electrochemical characteristics of battery and the cost limitation of current sensor in BMS. As a generic and almost artificial measure, they are considered as additive disturbances. To analyze the robustness of the proposed observer (Equation (7)) with respect to additive disturbances, the battery dynamics (Equation (6)) is rewritten as
where represents the uncertain items caused by disturbances, and denotes the uncertain and unmodeled items on the SOC-OCV curve. Subtracting Equation (7) from Equation (19) yields the observer error dynamics in this case
with
Based on the same Lyapunov function as above, its time derivative along the trajectories of Equation (20) is given by
If the observer gains is chosen as Equation (15), the matrix is positive definite, and then
where , and denotes the minimum eigenvalue of the matrix . It follows from Equation (23) that the observer error dynamics (Equation (20)) is ISS with respect to d according to the Theorem 4.19 in [35]. Therefore, if the items d caused by parametric uncertainties, unmodeled nonlinearity and input disturbances are bounded, the estimation errors of the proposed observer (Equation (7)) are always bounded.
4. Experimental Validation and Discussion
In this section, the proposed observer is validated using experimental datasets from two different types of cells. The estimation results are compared with those of EKF, which has been widely used for SOC estimation in the literature. The measurement equipment, validation tests, battery model parameters identification, selection of the observer gains, experimental and robustness testing results and discussion are presented in the following.
4.1. Measurement Equipment and Validation Tests
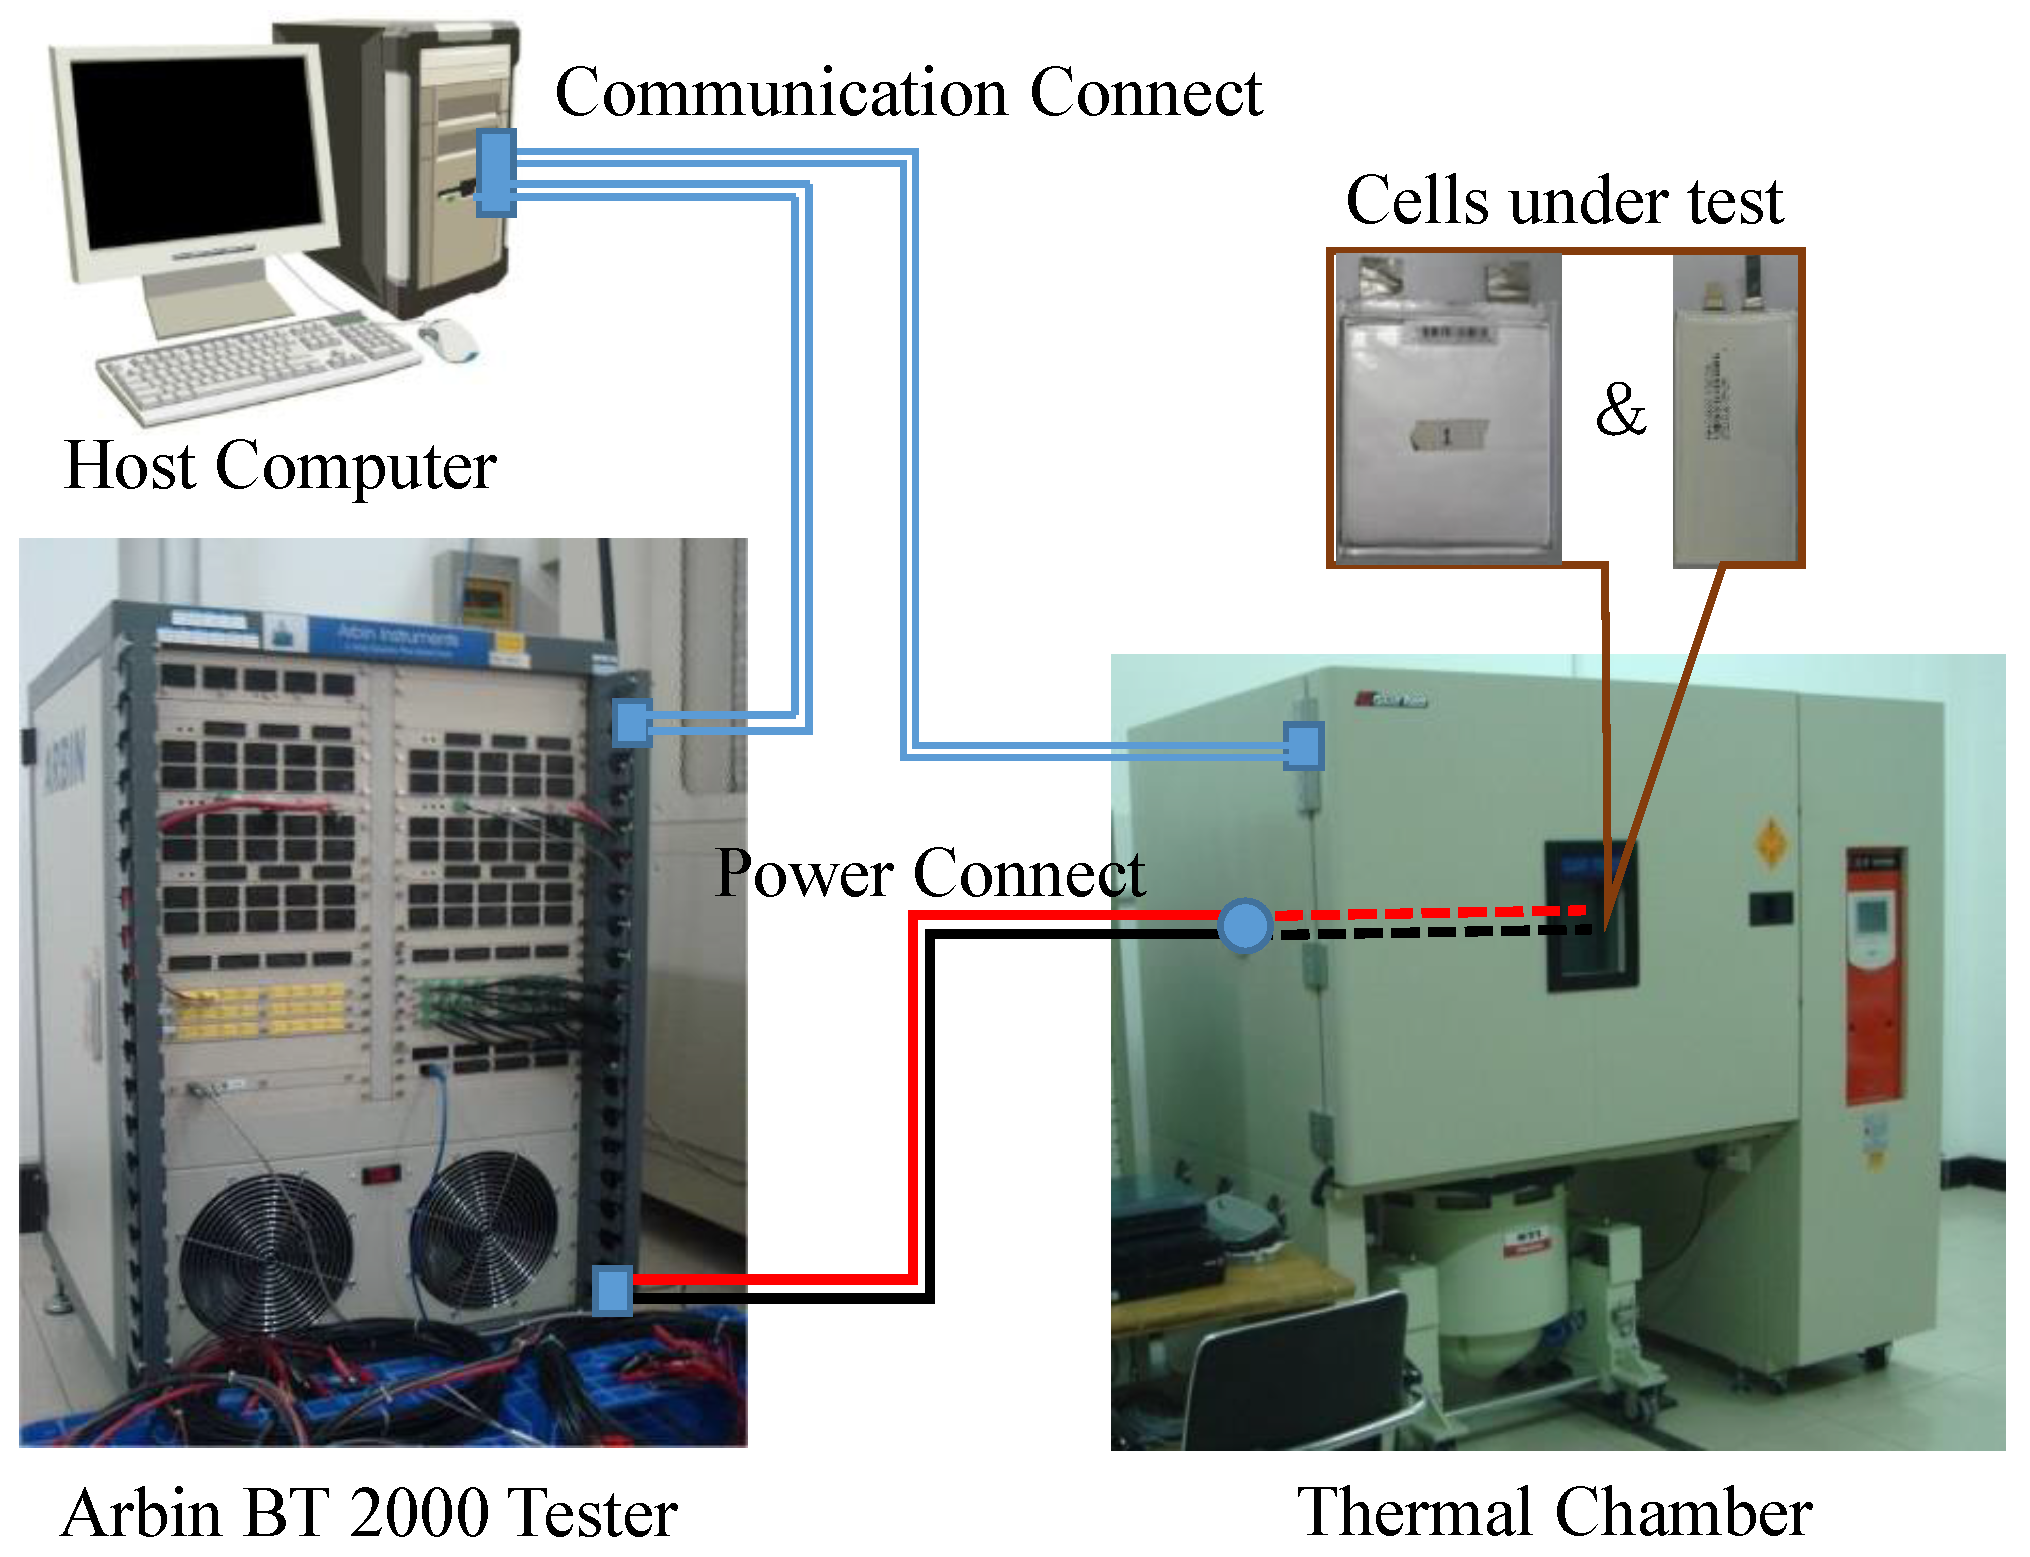
The experimental datasets used in this paper are collected through a battery test bench as shown in Figure 3, which consists of an Arbin battery test system BT2000 with MITS PRO software (version 4.30)(Arbin Instruments, Arbin, China) for programming the test process, a thermal chamber for the temperature control of cells, a host computer for the human-machine interface and experimental data storage, and the LIB cells under test. The sampling rate of voltage and current is 10 Hz for all tests in the following.
To fully validate the proposed observer, two types of LIB cells with different cathode materials are selected and purchased on the market for the tests. Type 1 is HPPF60100131 from Henan Huanyu (Henan Huanyu Group Co., Ltd., Xinxiang, China) and type 2 is PGF6354B3 from Samsung (Samsung Group, Yongin, Korea). Their main specifications are listed in Table 1. The consistency of type 1 cells is not as good as that of type 2 cells due to their different cathode materials (the former uses LiFePO). Therefore, this paper will focus on performance and robustness validation of the proposed observer based on different cells’ datasets of HPPF60100131 and multi-temperature datasets of PGF6354B3, and the test schedules designed for the two types of LIB cells are different.
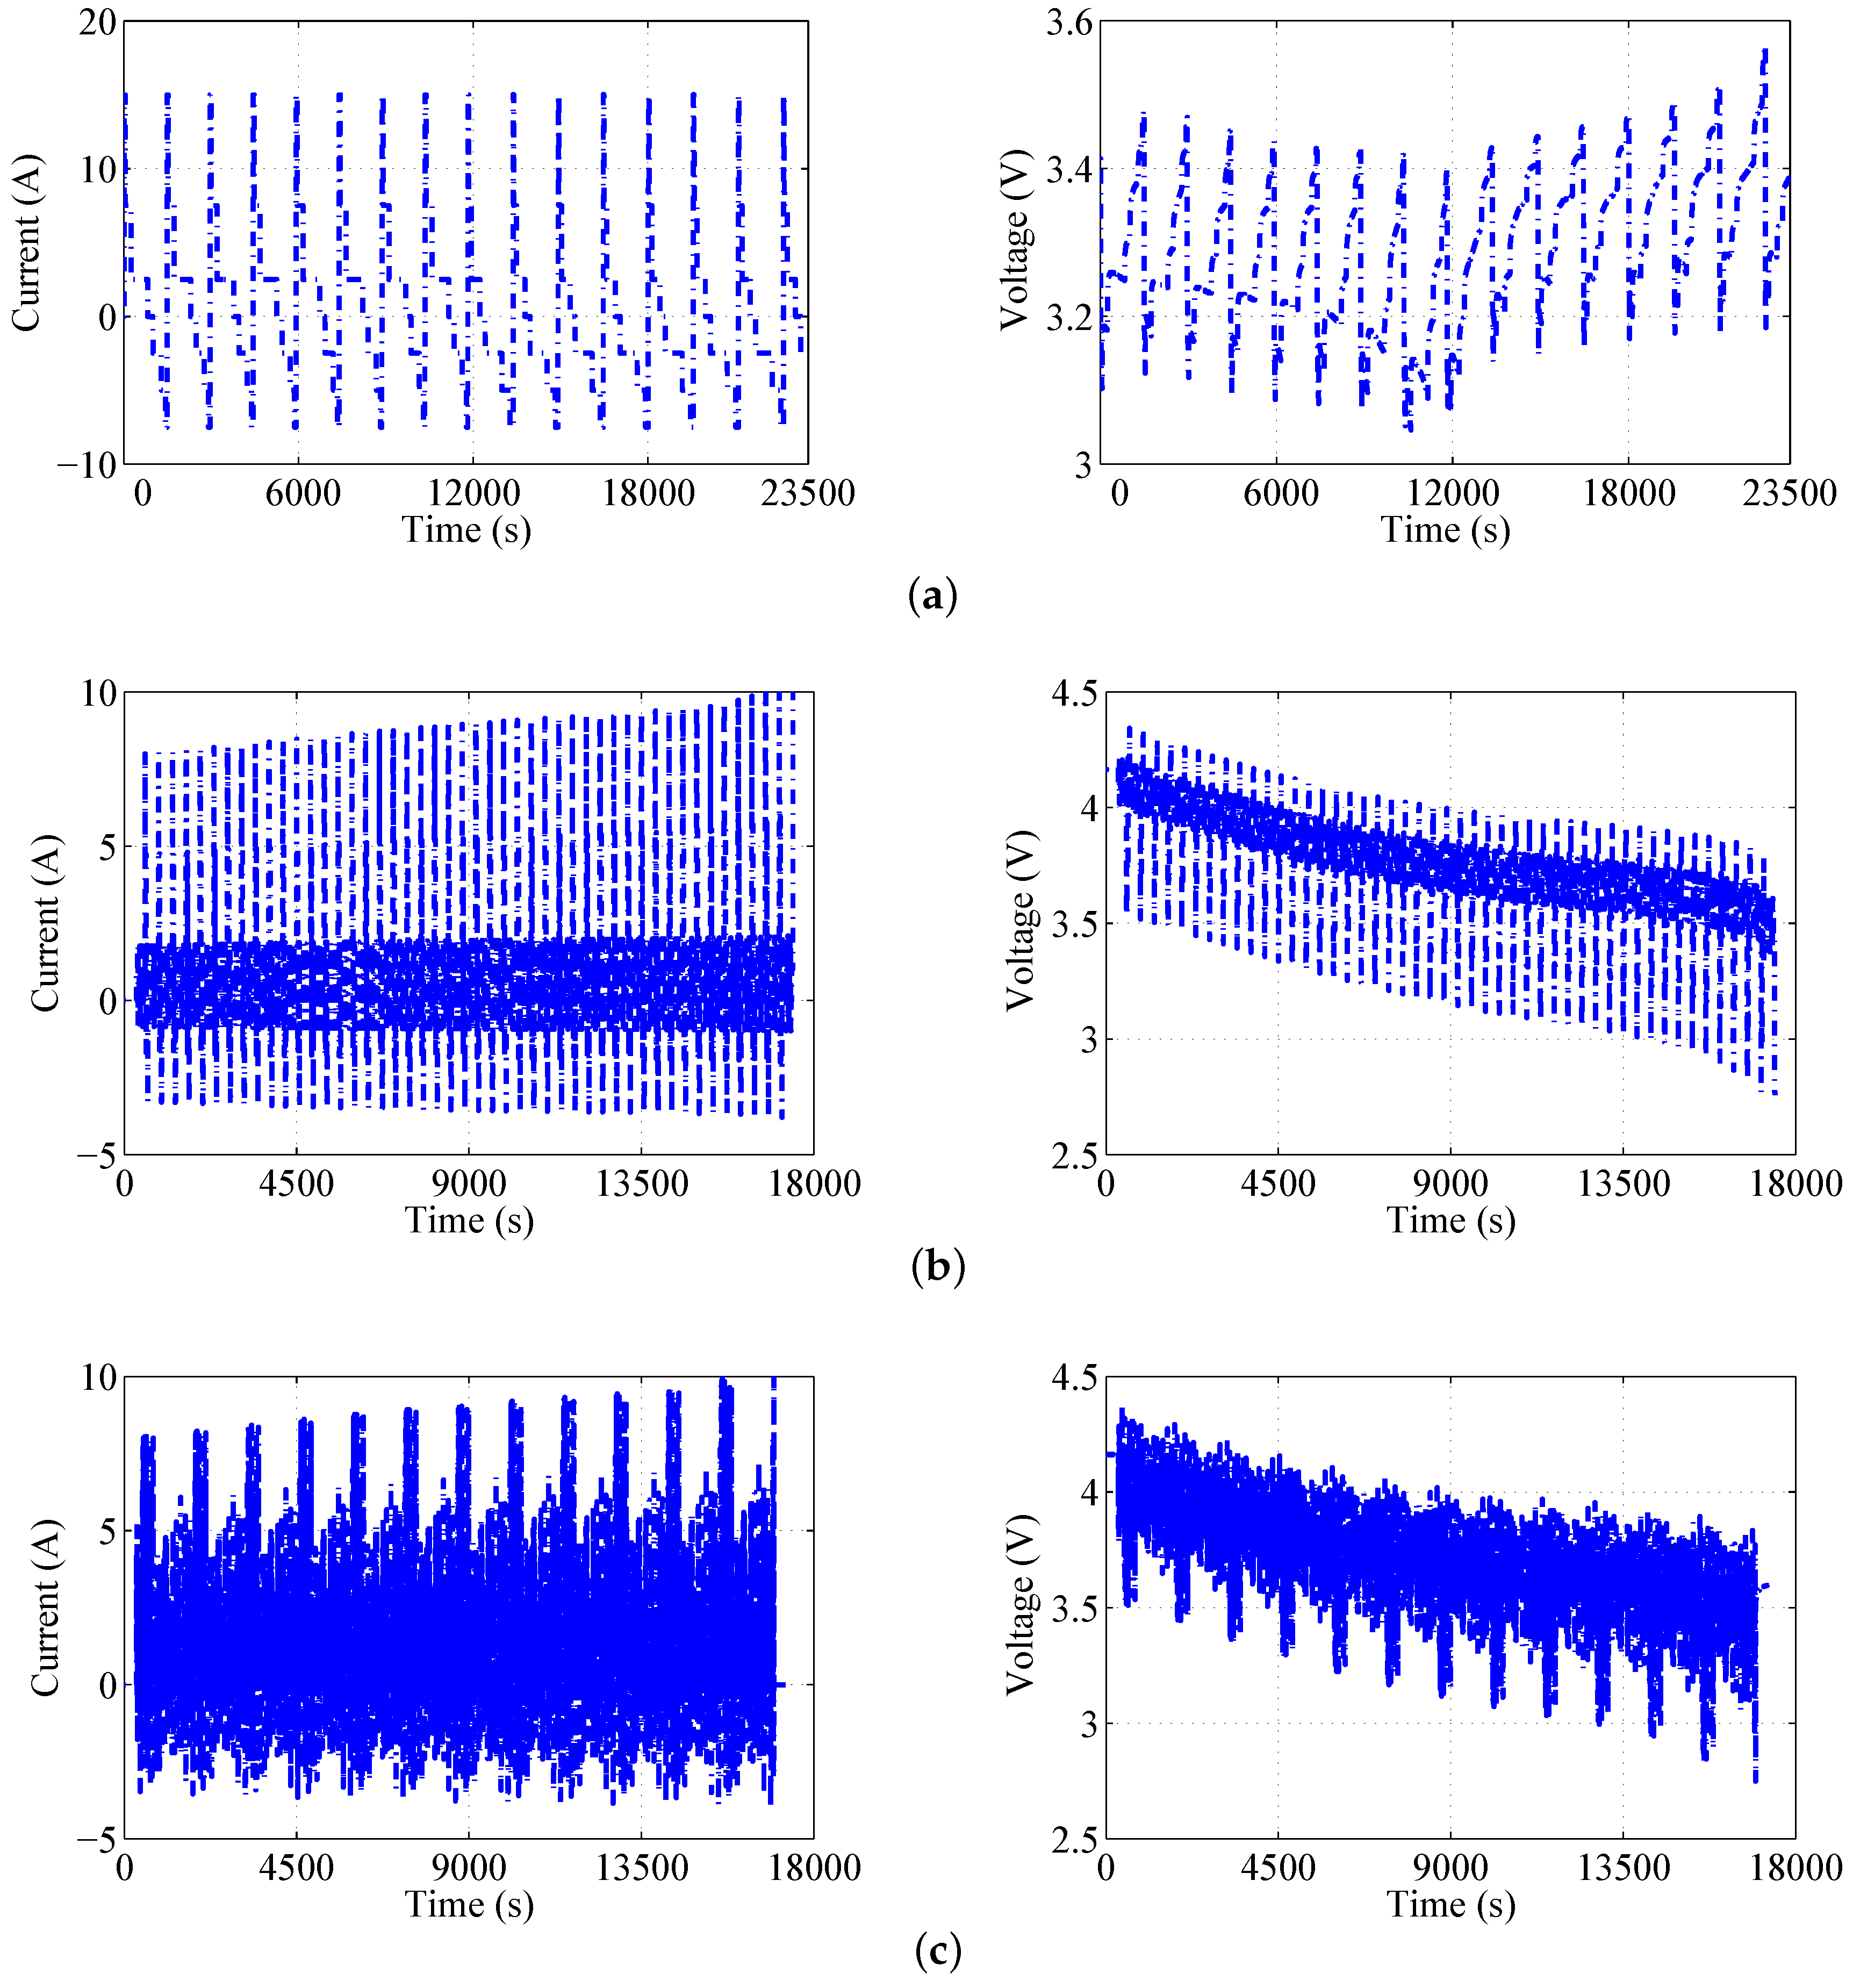
For type 1 cells, the first set of experimental data is obtained by discharging one cell from fully charged state to 10% of the capacity at room temperature (about 20 ), and resting for one hour after each discharging 10% of the capacity to record the OCV for that SOC. The SOC of the battery for the current profile is computed based on the discharge capacity calculated by the Arbin battery test system BT2000 with MITS PRO software (version 4.30). This dataset is used to obtain the SOC-OCV curve of the type 1 cells. The other datasets are acquired by discharging and charging two different cells with the same hybrid pulse current at room temperature. The hybrid pulse test (HPT) is a sequence of pulse cycles, and the current and terminal voltage curves of one cell under test are shown in Figure 4a. During the charging and discharging, the voltage and current are measured and recorded at 10 Hz.
A multi-temperature test schedule is designed to generate rich excitations for type 2 cells. Generally, LIB is preferred at temperature between 10 and 40 [36], and this can be achieved with the help of temperature control systems in EVs. Therefore, the experimental temperatures include 10 , 20 and 40 to cover the low, normal and high temperatures during the battery operation. The schedule for each temperature is same, and is designed in accordance with the United States Advanced Battery Consortium (USABC) testing procedures [37]. It is used to simulate a variable-power discharge regime that represents the expected demands of an EV battery. A static capacity test, a peak power test, an OCV test, a Dynamic Stress Test (DST) and a Federal Urban Dynamic Schedule (FUDS) are consecutively conducted in the schedule. The purpose of the static capacity test is to measure the cell capacity at different temperatures. The peak power test is designed to obtain the peak power of the cell under different test condition, which will be used in the DST and FUDS. The datasets of OCV test are used to obtain the SOC-OCV curves. The DST and FUDS excite the cells in driving cycle-based conditions. Between two adjacent test points in the schedule, the cells under test are charged to reach the initial SOC values (100%) and rested to reach cell equilibrium. The experimental current and terminal voltage curves of DST and FUDS for one cell at 20 are shown in Figure 4b,c.
4.2. Battery Model Parameters Identification
The battery model parameters to be identified include the coefficients of the SOC-OCV function, the Ohmic resistance , the polarization resistances and , and the polarization capacitances and . The datasets of OCV test are used to determine the coefficients of the SOC-OCV function. The least squares method is adapted here to obtain the values of the coefficients , and the results are shown in Table 2.
Based on the battery model (6), the SOC-OCV relationship determined by the function (3) and Table 2, the tested capacity, and the dynamics test dataset of battery cell, a hybrid particle swarm optimization algorithm in [3] was adopted to identify the Ohmic resistance , the polarization resistances and , and the polarization capacitances and . A HPT dataset from a type 1 cell and FUDS datasets at different temperatures from a type 2 cell are used to identify the optimal model parameters, respectively. The identification results are presented in Table 3.
Based on the battery model and identification results of parameters, the root mean square errors (RMSEs) of predicted terminal voltage for different datasets are calculated and listed in Table 4. The RMSE presents the standard deviation of the model prediction error. A smaller value indicates better model performance. The formula for the RMSE is given as
where denotes the true value or measurement, and is the model prediction or estimation result, correspondingly.
The calculation results show that the RMSEs for all datasets are between 5.0 mV and 18.4 mV. It is worth noting that the values of the parameters used in this paper are obtained from one cell’s dataset as shown in Table 2 and Table 3, and then are employed for all cells’ datasets for each type of cell to validate the robustness of the proposed observer in the following.
4.3. Observer Gains and Initial Values
It follows from (18) that the upper bounds of and depend on the value of the time-varying term . As discussion in the previous section, the value of the time-varying term for an effective observer is usually limited in a certain range, and no more than one for a LIB cell. The value of the time-varying term equates to one means that the estimation error of the terminal voltage is 1 V in this case. Generally, the difference between charge and discharge cut-off voltages of a LIB cell is about 1.5 V as shown in Table 1, and the variation range of battery terminal voltage for a certain discharge or charge process is no more than 1 V as shown in Figure 4. Therefore, if the value of the time-varying term is more than one, it can predicate that the observer is invalid.
One feasible way to determine the ranges of and is to take the maximum value of the time-varying term in the upper bounds. This method may be conservative, since Equation (18) is only a sufficient condition. However, it provides a useful starting point for selection of the observer gains. Based on the analysis, the value of the time-varying term is set as one, and the upper bounds of and for type 1 cell and type 2 cell at different temperatures are shown in Table 5. can be high to achieve fast convergence of the SOC estimation results. Too high value of the observer gain may cause noisy estimation results. Therefore, and are chosen as 0.001, and are chosen as 0.004 and 0.005, respectively, for type 1 and 2 cells.
The states of the proposed observer include , and SOC. Their initial values need to be determined when the observer starts. The initial values of and are usually set as zero or a small positive real number. The SOC estimation results are compared for the initial polarization voltages of 0 V and 0.001 V. We can hardly find any difference in the SOC estimation results for the both cases. In this paper, they are chosen as zero.
Generally, the initial value of SOC can be obtained from the internal memory of BMS when the observer starts. However, the data loss or reading data error may occur at some time. This requires that the estimation algorithm have to be able to converge quickly to the true value of SOC if the observer is not initialized correctly. To test this dynamic behavior, the initial SOC is smaller than its true value of 20% for HPT and DST datasets, and is smaller than its true value of 50% for FUDS datasets.
4.4. Experimental Results
The proposed observer is validated using the datasets from two different types of battery cells. Its results are compared with those of EKF and the SOC measurements, which are calculated based on the charge and discharge capacity provided by BT2000 with MITS PRO software. In order to compare the estimation results under the same conditions, the battery model (6) is used in EKF, and the system noise covariance, measurement noise covariance, and initial error covariance are chosen as , 5, and for all cells under test. The SOC measurements, the results from the proposed observer and EKF are respectively noted as Ref., NO and EKF in the following figures and tables for the sake of convenience.
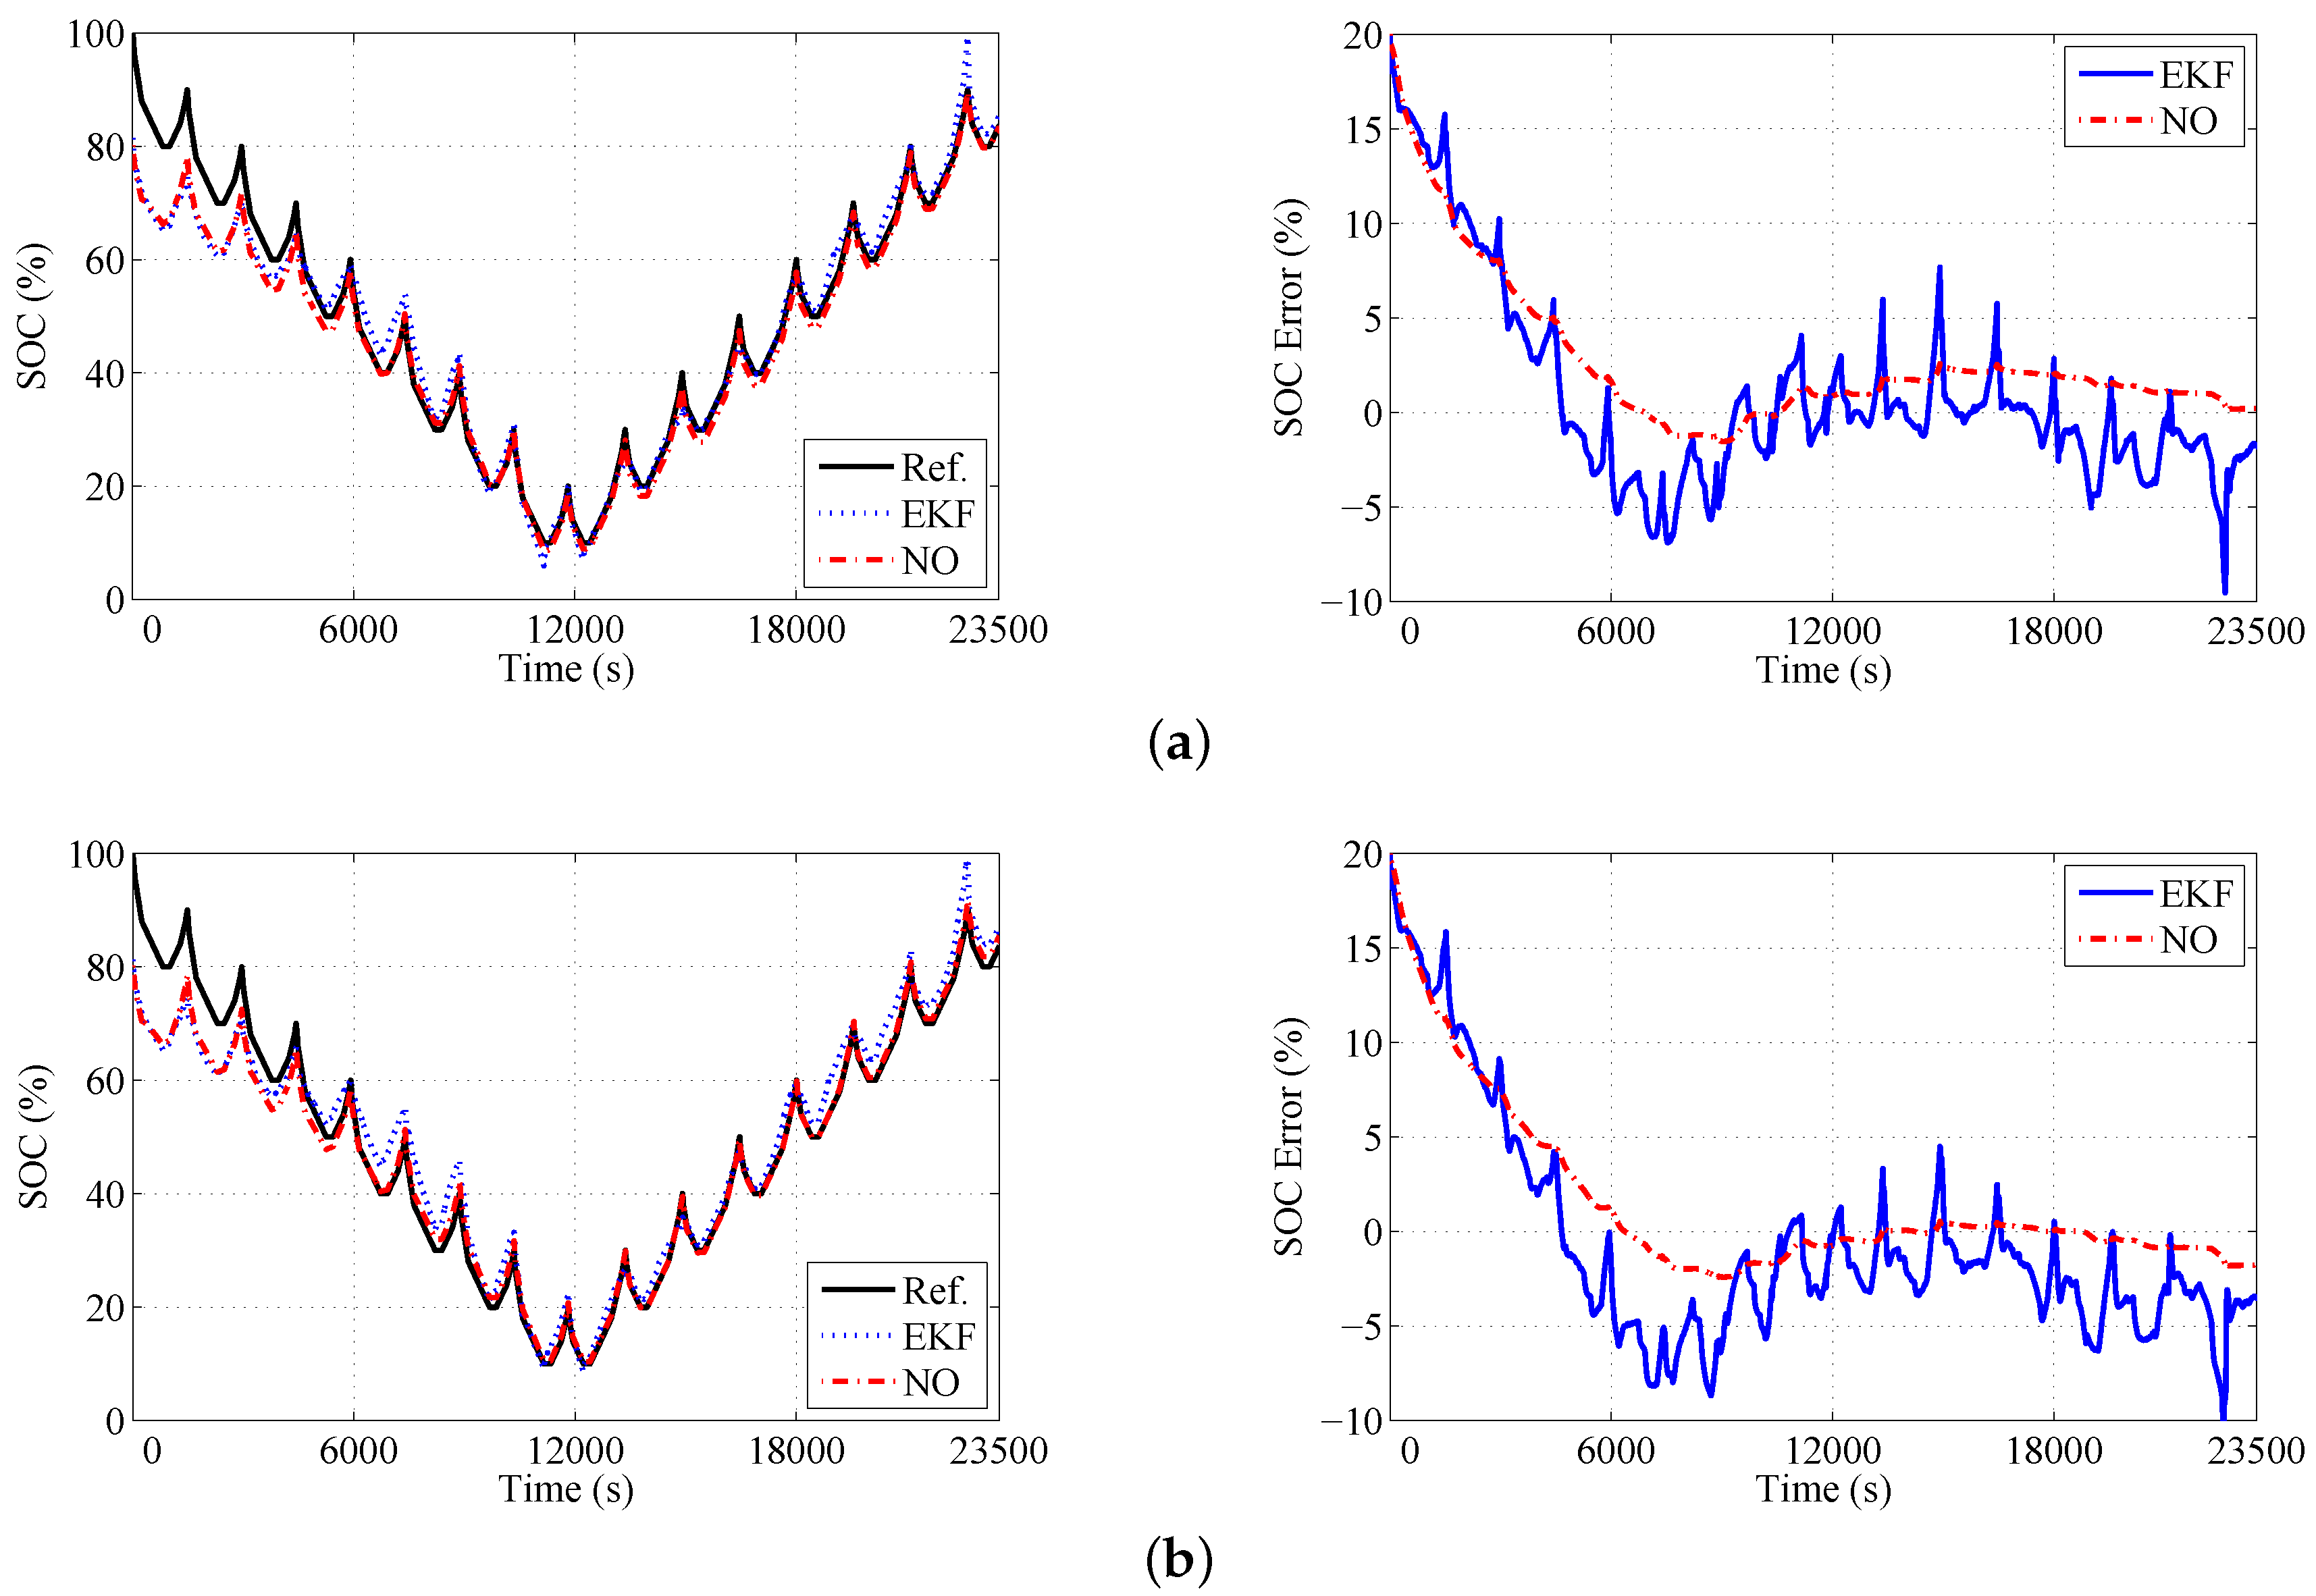
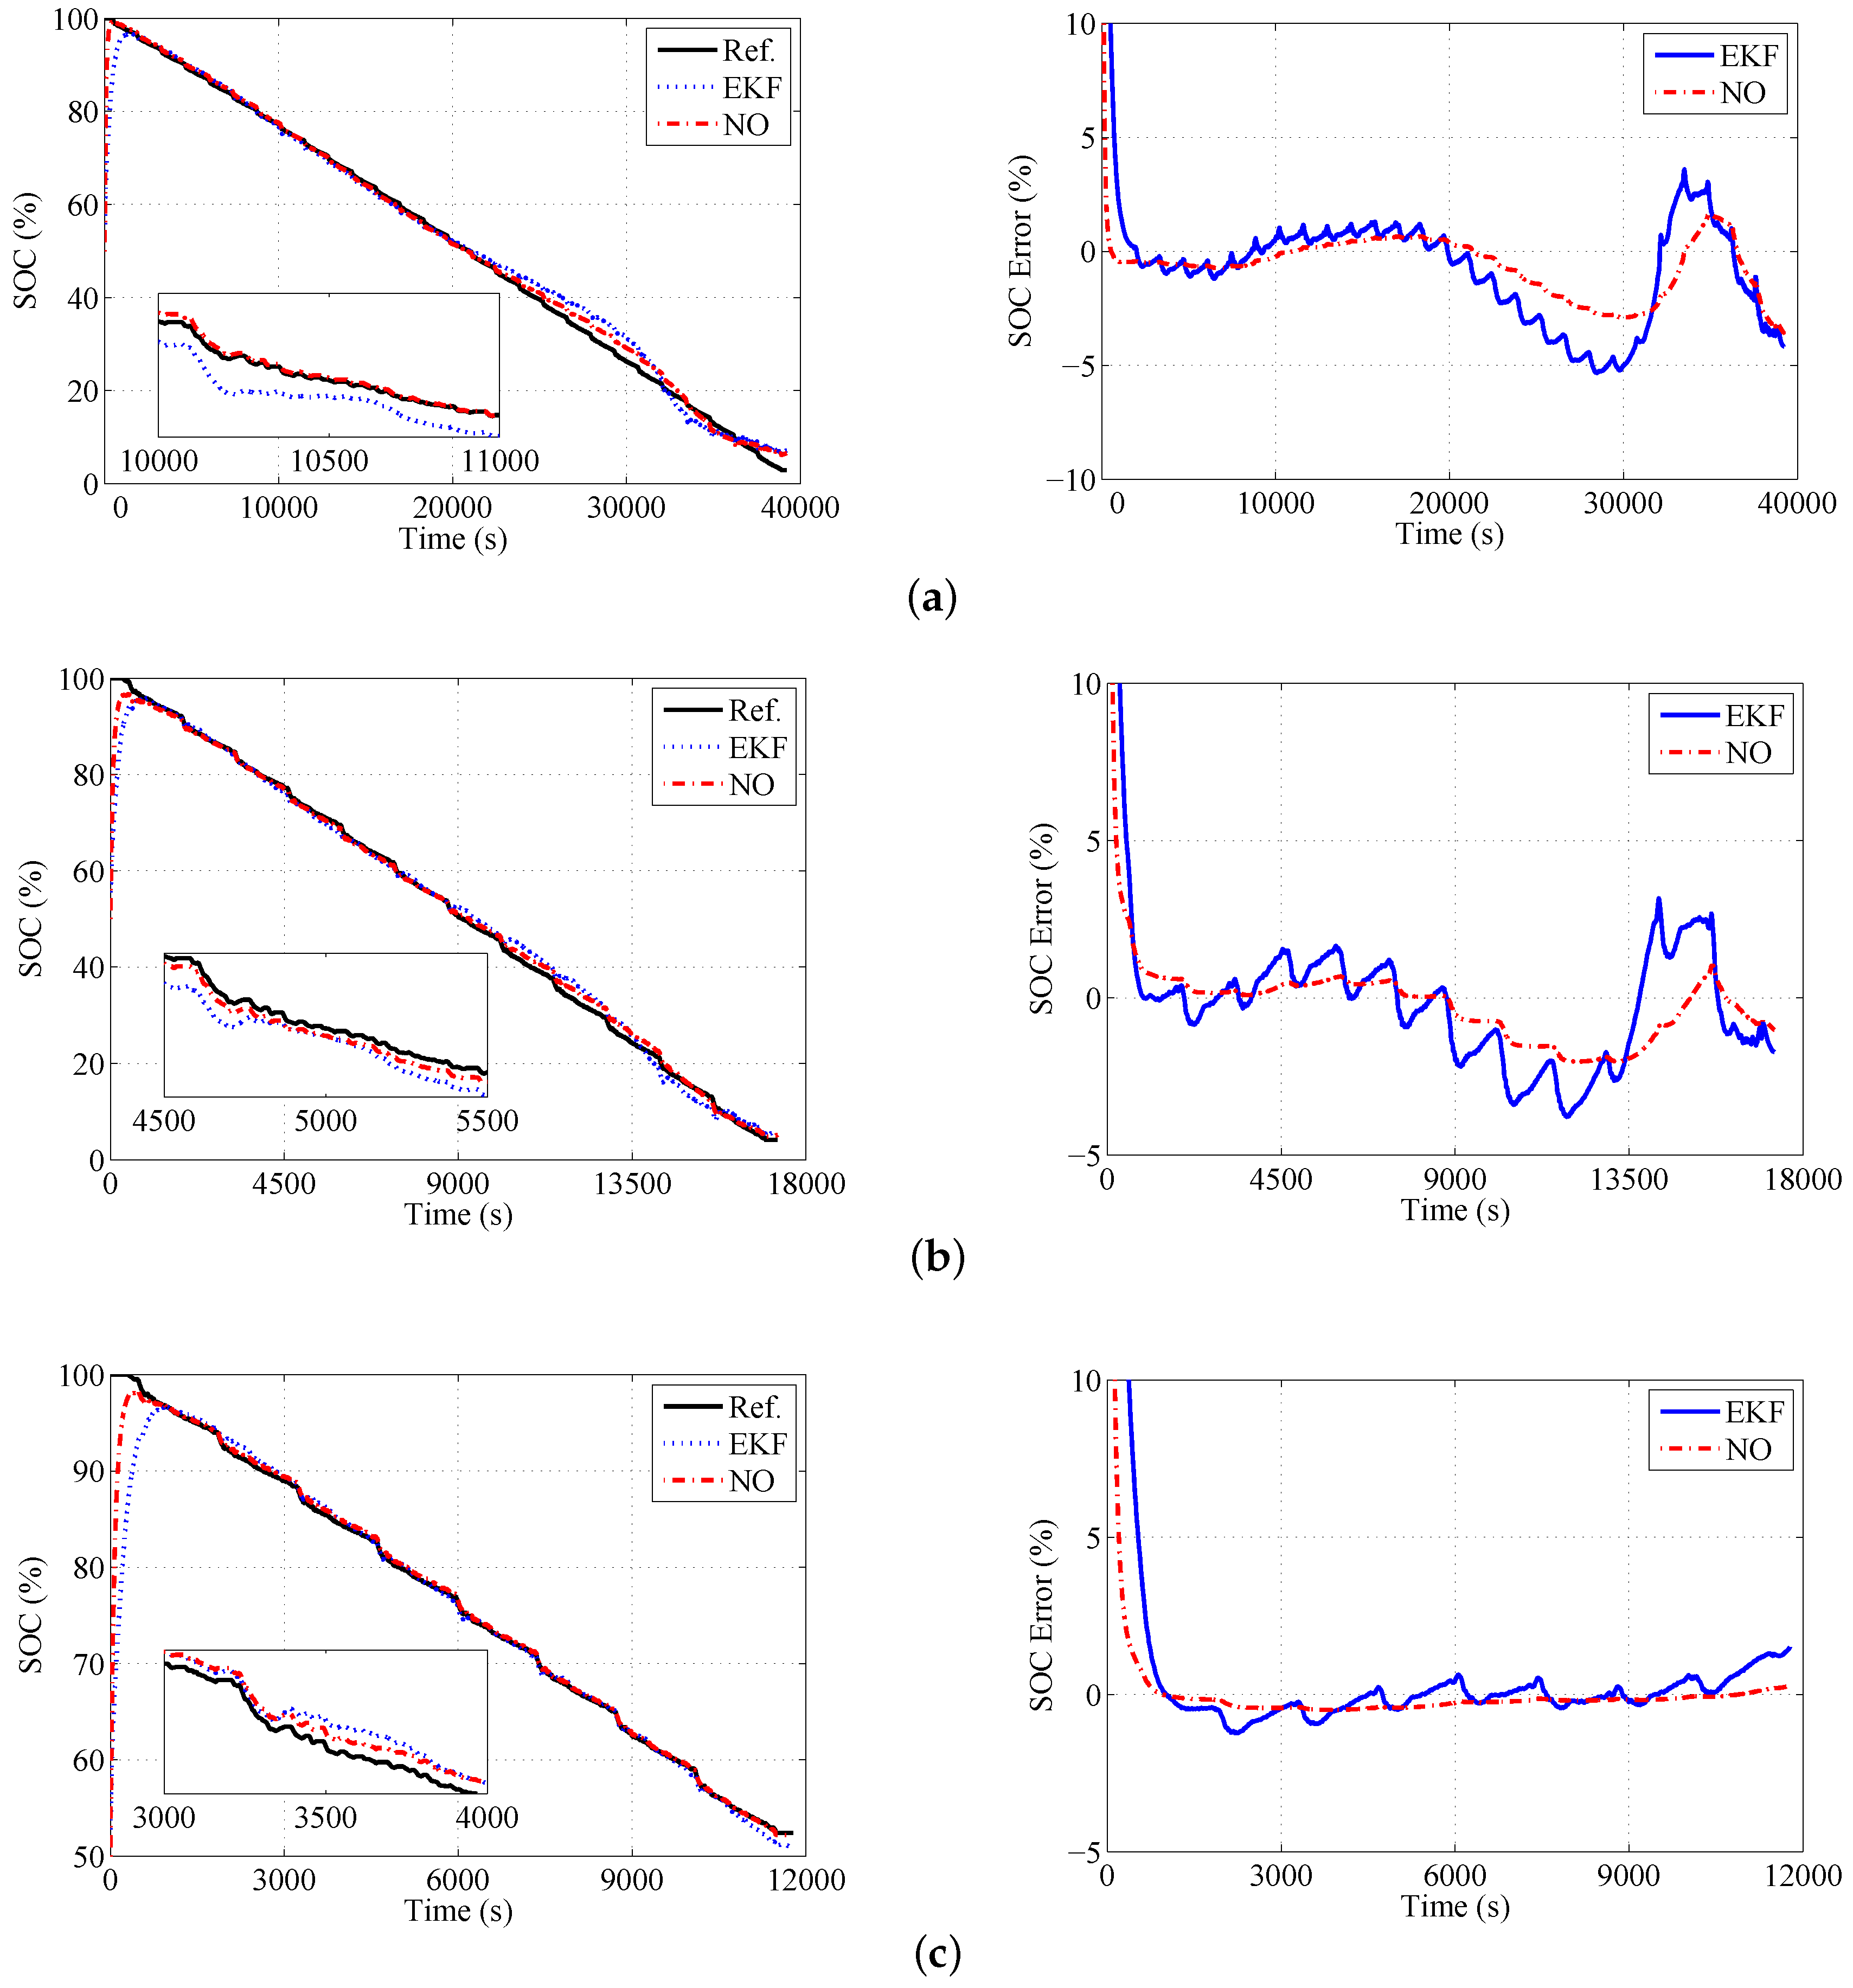
For type 1 cell, the proposed observer and EKF are used for HPT datasets from two different cells, and the results are compared in Figure 5.
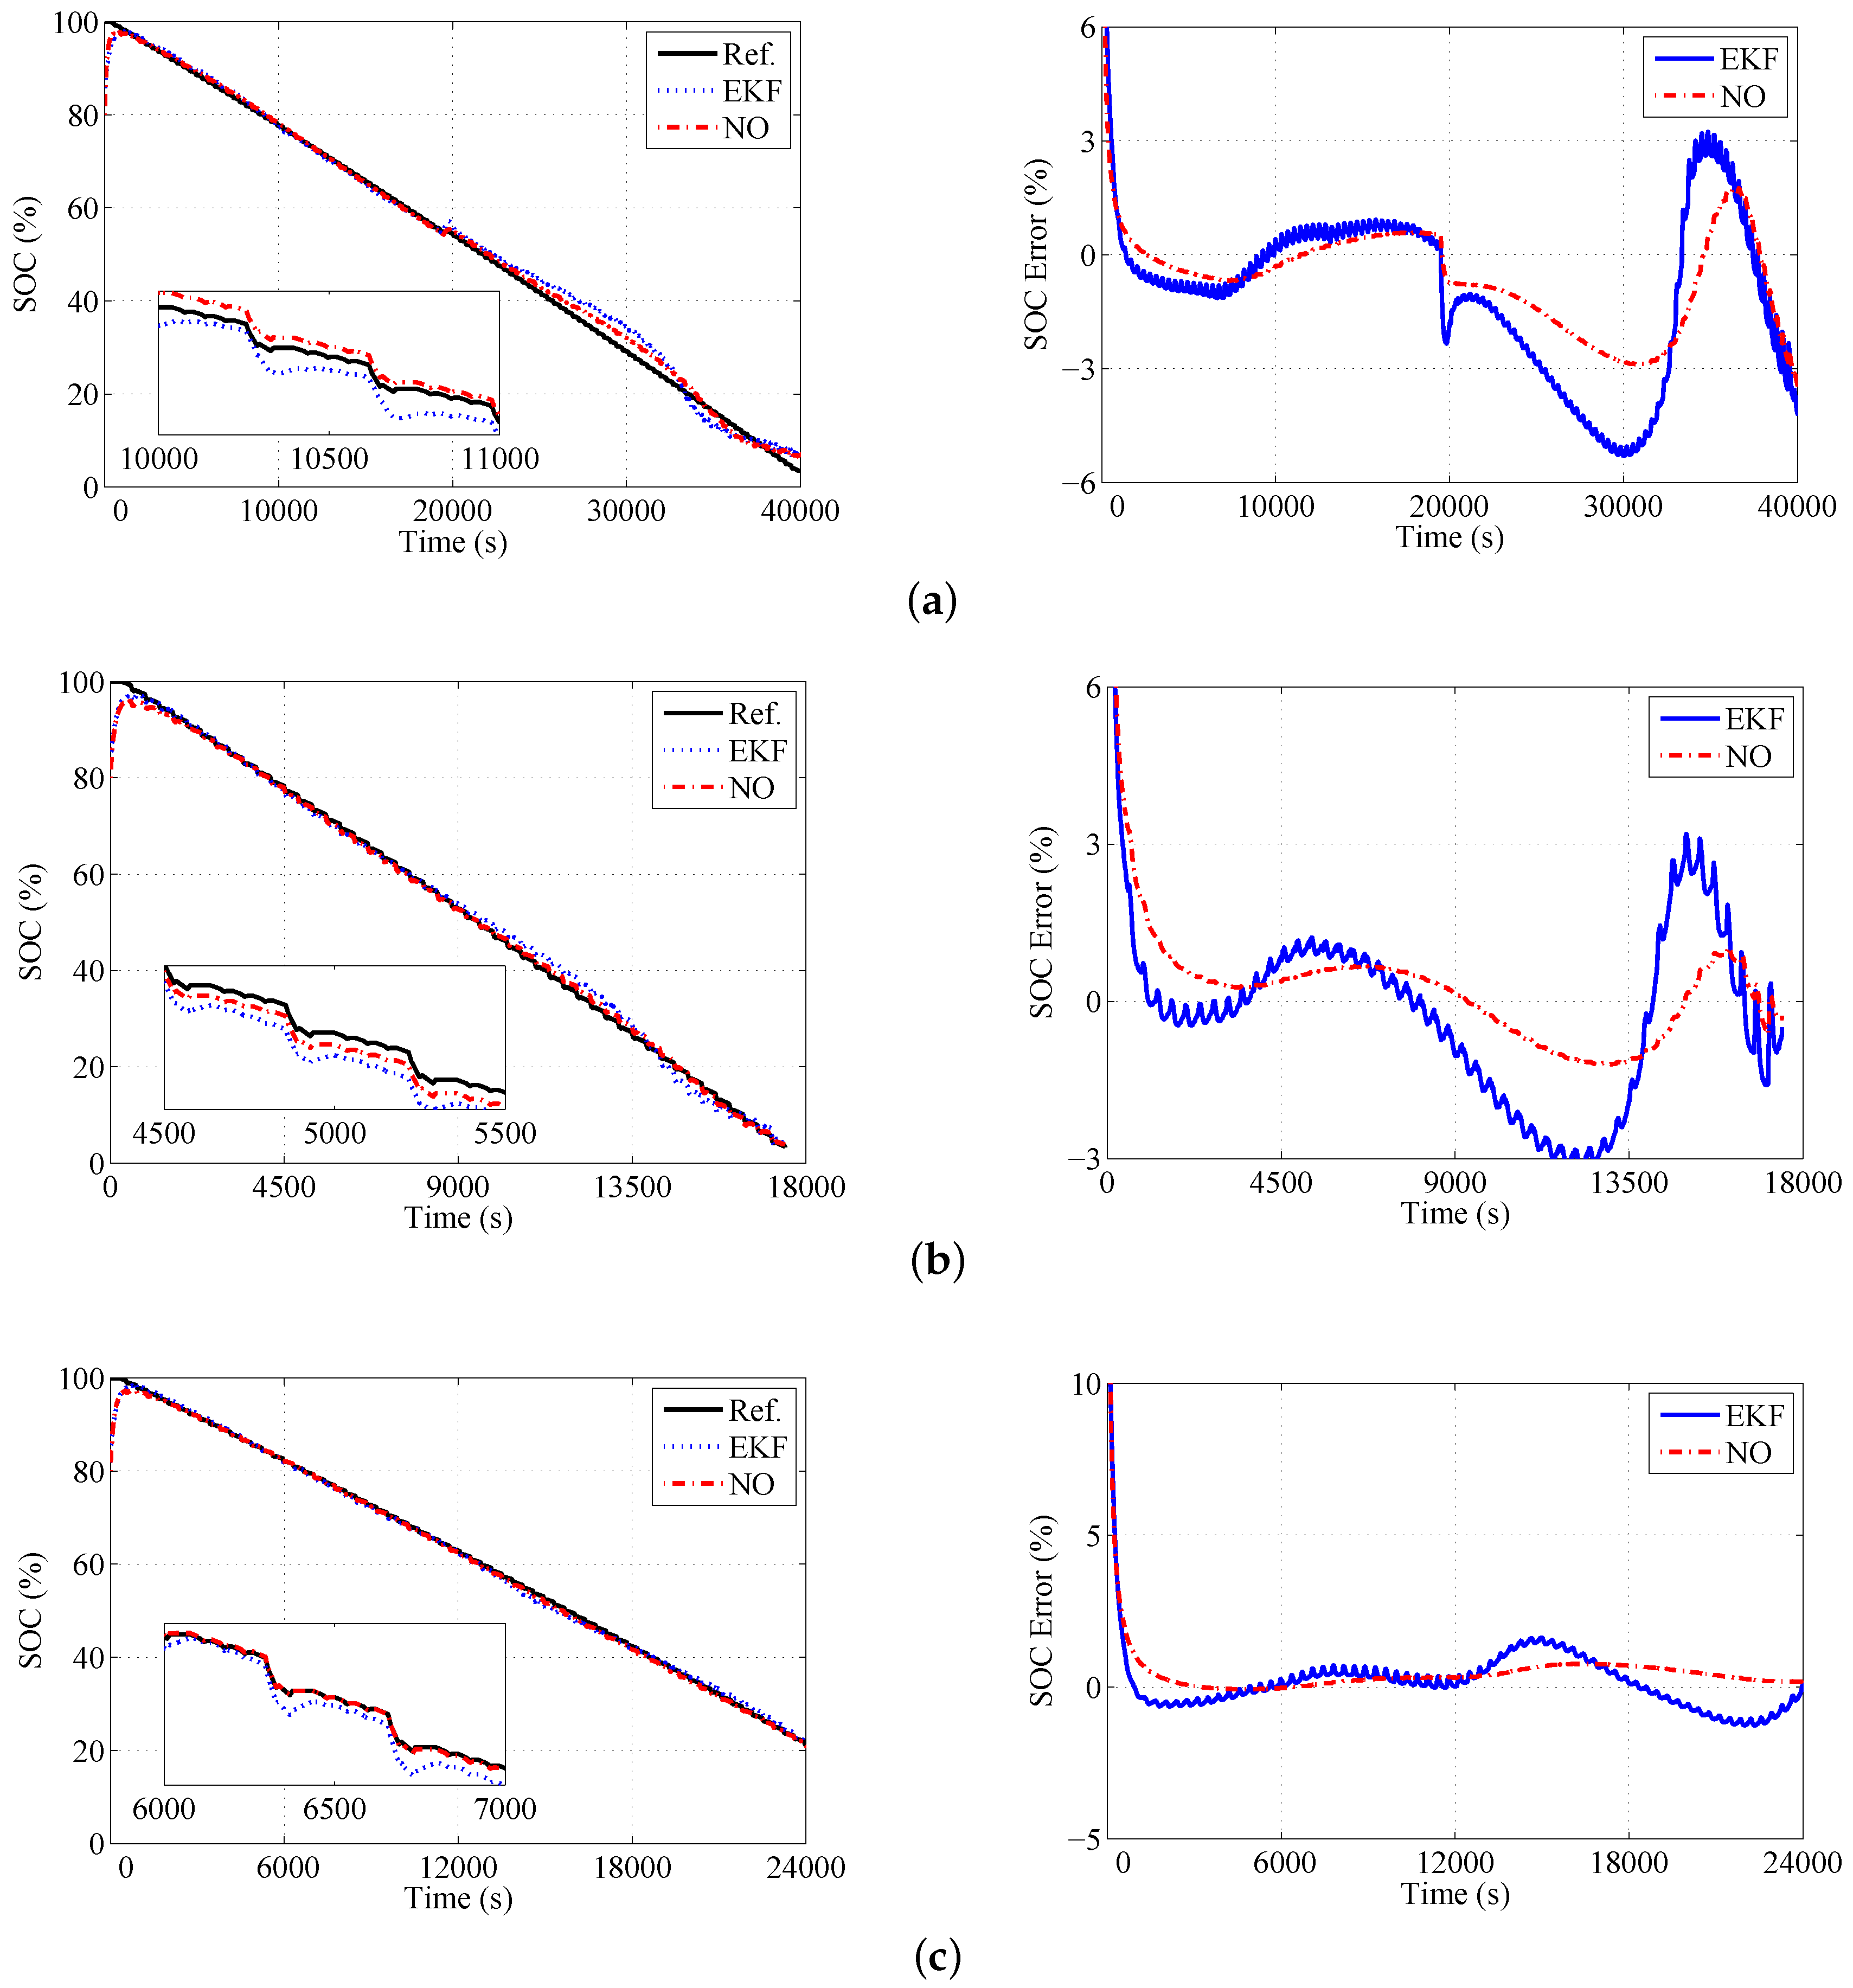
The two methods are also validated based on DST and FUDS datasets of the type 2 cell at 10 , 20 and 40 , and the results are plotted in Figure 6 and Figure 7.
Experimental results show that both methods have a similar convergence rate for all datasets of two types of cells. To compare the estimation accuracy of the two methods quantitatively, the RMSEs of the estimated SOC after the estimation results converge are calculated and listed in Table 6. The estimation results are considered as convergence when the absolute value of the estimation error is less than 5% in this paper. The calculation results indicate that the maximum RMSE of the proposed observer is 1.73% for all datasets. On the other hand, that of EKF is 3.83%. In addition, the analysis results also show that the proposed observer can reduce the estimation bias obviously, while the estimation variance of the two methods is very close.
As can be seen in Figure 5, Figure 6 and Figure 7, both the proposed observer and EKF achieve good estimation accuracy and convergence rate for all datasets of each type of cell. Although there is a large estimated error due to the initial SOC setting, two methods are able to estimate an accurate SOC value in a short time. Moreover, the errors of the proposed observer and EKF are small after the estimation results converge. Especially for the proposed observer, it is no more than 3.6% in the worst case. These mean that the gains of the two methods are a good compromise between the estimation accuracy and convergence rate. However, it can be found that the estimation accuracy of the proposed observer is slightly better than that of EKF for all datasets, and the consistency of the estimated accuracy for different datasets is also better than that of EKF. This indicates that the proposed observer is able to adapt to different type of cells and different working conditions. Furthermore, EKF includes many matrix multiplication and inversion operations performed in each iteration, and this is avoided in the proposed observer. We take the FUDS dataset at 10 as example, the average cycle times of the proposed observer and EKF in the MATLAB environment are calculated. A computer with a clock frequency of 3.20 GHz was used. The results are presented in Table 7, and show that the proposed observer saves around 72% computational time in comparison to EKF. In addition, to calculate the estimated SOC, the proposed observer only needs two steps (one for estimated output calculation, and other for estimated SOC calculation), while EKF requires three extra steps to calculate the prediction and update of error covariances, and the filter gain. This means that the proposed observer requires less RAM and ROM space than EKF. In addition to the SOC estimation, there are many tasks to be handled in BMS in an EV battery pack, such as information measurement, equilibrium control, fault diagnosis and processing. Therefore, it is worth noting that the restriction of computational time and memory is an important issue for the embedded system in EVs due to the limitation of the cost.
The experimental results also show that there are a little bit more estimation errors by the proposed observer when the SOC is lower than 10%, especially for the DST and FUDS datasets at 10 and 20 . One main reason for this is that the values of the model parameters may change with the SOC of battery, and the battery dynamics is not well described by the model with fixed parameter values in this case. In spite of this, the estimation errors of the proposed observer are no more than 3.6% in the worst case for all datasets. Moreover, the BMS usually does not allow SOC below 10% for the purpose of protecting the battery. In addition, we all know that the accuracy and real-time performance of SOC estimation method are critical issues for BMS in EVs. Generally, an error of estimated SOC within 3∼5% is reasonable [38]. The more accurate battery models and corresponding estimation methods, such as electrochemical models and fractional models [39,40], can fully improve the SOC estimation accuracy. On the other hand, an increasing complexity of the model and method may leads to a higher computational load. It may also exceed the limitations of BMS or increase its costs. Therefore, it is important to achieve a good balance between estimation accuracy and computational costs.
4.5. Robustness Testing
The experimental results show that the proposed observer achieves a good performance in normal cases. However, a method to be used in a real vehicle must be able to suppress the influence of system disturbances and uncertainties, such as measurement noise, sensors biases and model parameter uncertainties. In the following, the results and discussion regarding robustness testing of the proposed observer and EKF are presented.
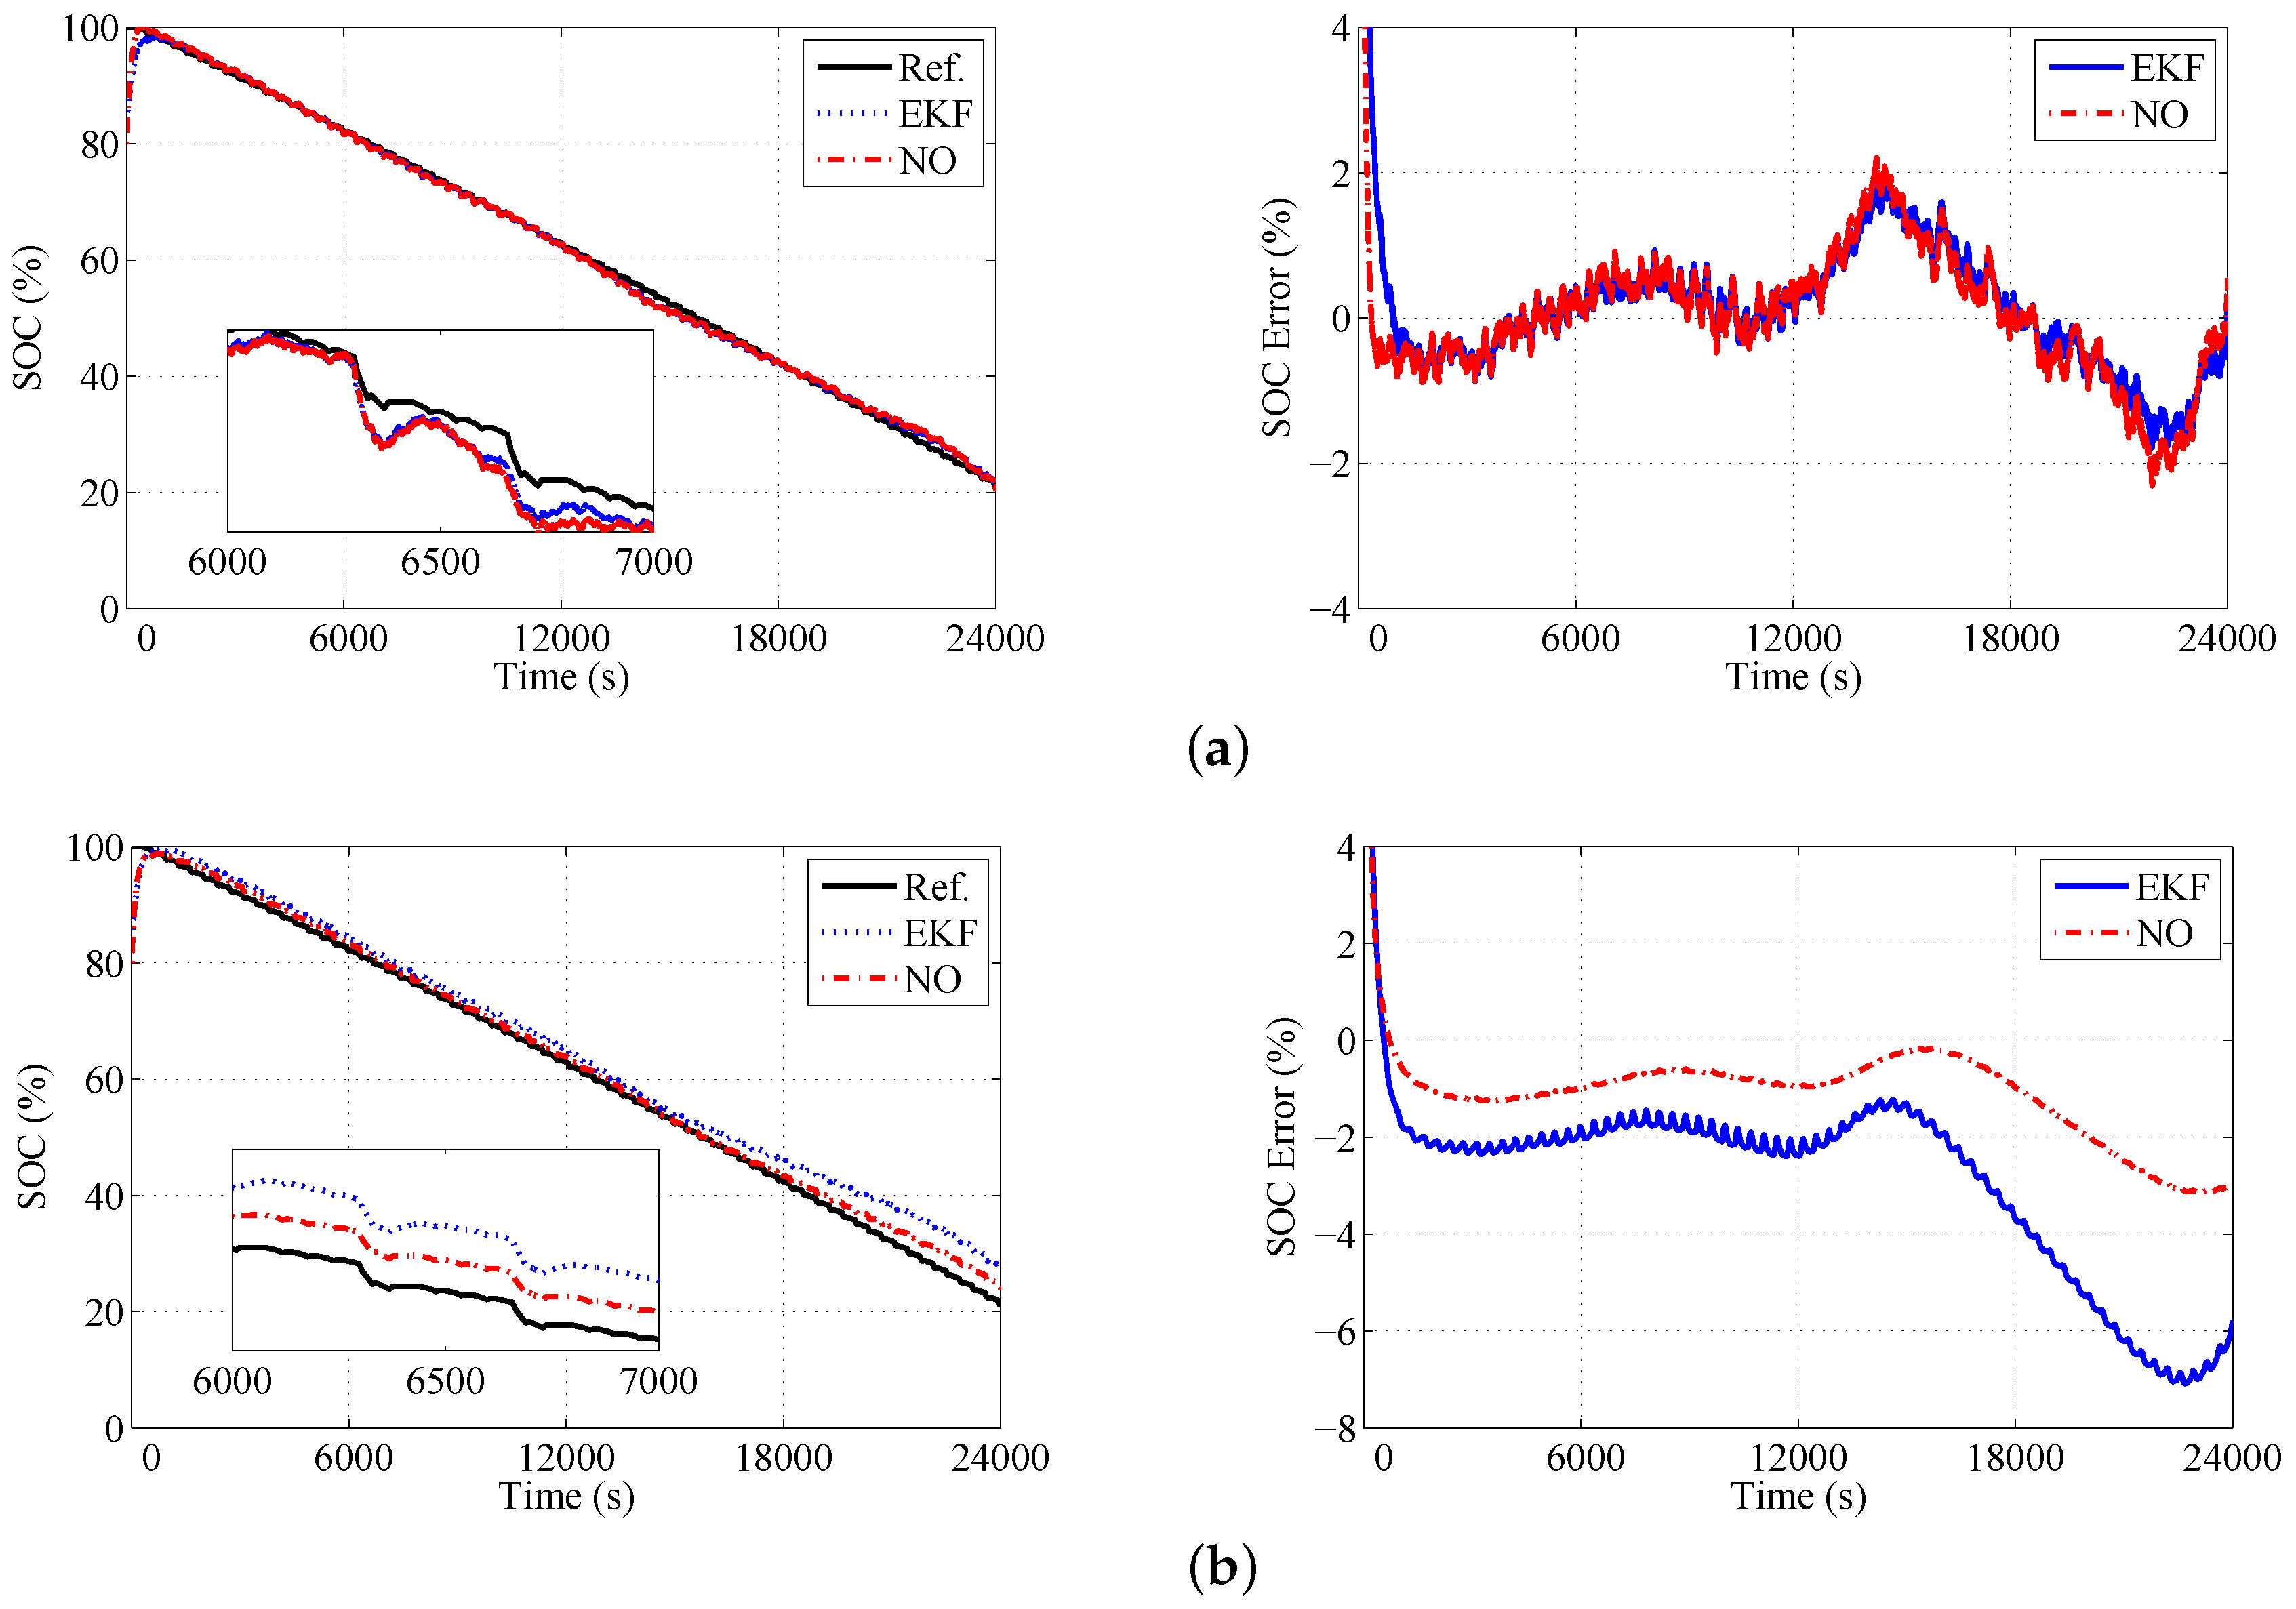
The DST dataset of type 2 cell at 40 is taken as example and carry out the following tests. Zero-mean-value random noise with Gaussian distribution is introduced into the current and voltage measurements to represent the most likely cause of error in true data acquisition, and the results of the proposed observer and EKF are presented in Figure 8a. It can be found that both methods are capable of determining the SOC with an acceptable accuracy for the testing case with measurement noise. Additionally, the current measurement drafts may appear due to an aged sensor in BMS. An offset of 100 mA is added to the measured current to validate the performance of two methods in this case. The estimation results are compared in Figure 8b and indicate that the proposed observer has enough robustness against the current sensor biases in comparison to EKF.
Generally, it is difficult to obtain the accurate capacity of an aged cell in real time. This will lead to a deviation in the estimation of SOC. A deviation of 3% is added to to simulate the error. The estimation results are plotted in Figure 9 and show that the proposed observer has enough robustness against the mode parameter uncertainties caused by capacity deterioration.
With the help of temperature control systems in battery pack, the temperature of each cell can be held in a certain range, for example 10 ∼40 . Nevertheless, the temperature has significant influence on battery mode parameters, as shown in Table 2 and Table 3. In the following test, the model parameters obtained from the dataset at 40 are used to the one at 10 , and the results are shown in Figure 10. This means that all model parameters have a deviation due to the effect of temperature. It can be found from Figure 10 that there is a bit more estimation errors by the proposed observer and EKF. This indicates that the effect of temperature has to be considered in the SOC estimation method. To overcome the effect of temperature, a feasible solution is to divide the operating temperature range of battery into several intervals based on experimental data analysis, not fixed interval, and to set unified parameters for each interval. Then, the model parameters used in the observer can be changed depending on the temperature of cell.
It is worth noting that the battery-aging factor can gradually change the parameters of the battery model besides the temperature factor. The experimental investigation of impedance characteristic of the LIB cell in [41] shows that the model parameters, such as the Ohmic resistance, the polarization resistances, and the polarization capacitances, change significantly during the battery lifetime. Generally, it is hardly to set model parameters for aged battery in advance due to the unpredictability of battery aging. Therefore, the SOC estimation based on the proposed observer together with model parameters adaption will be considered in our future work to make the observer valid over the lifetime of battery.
5. Application of the Method to EV
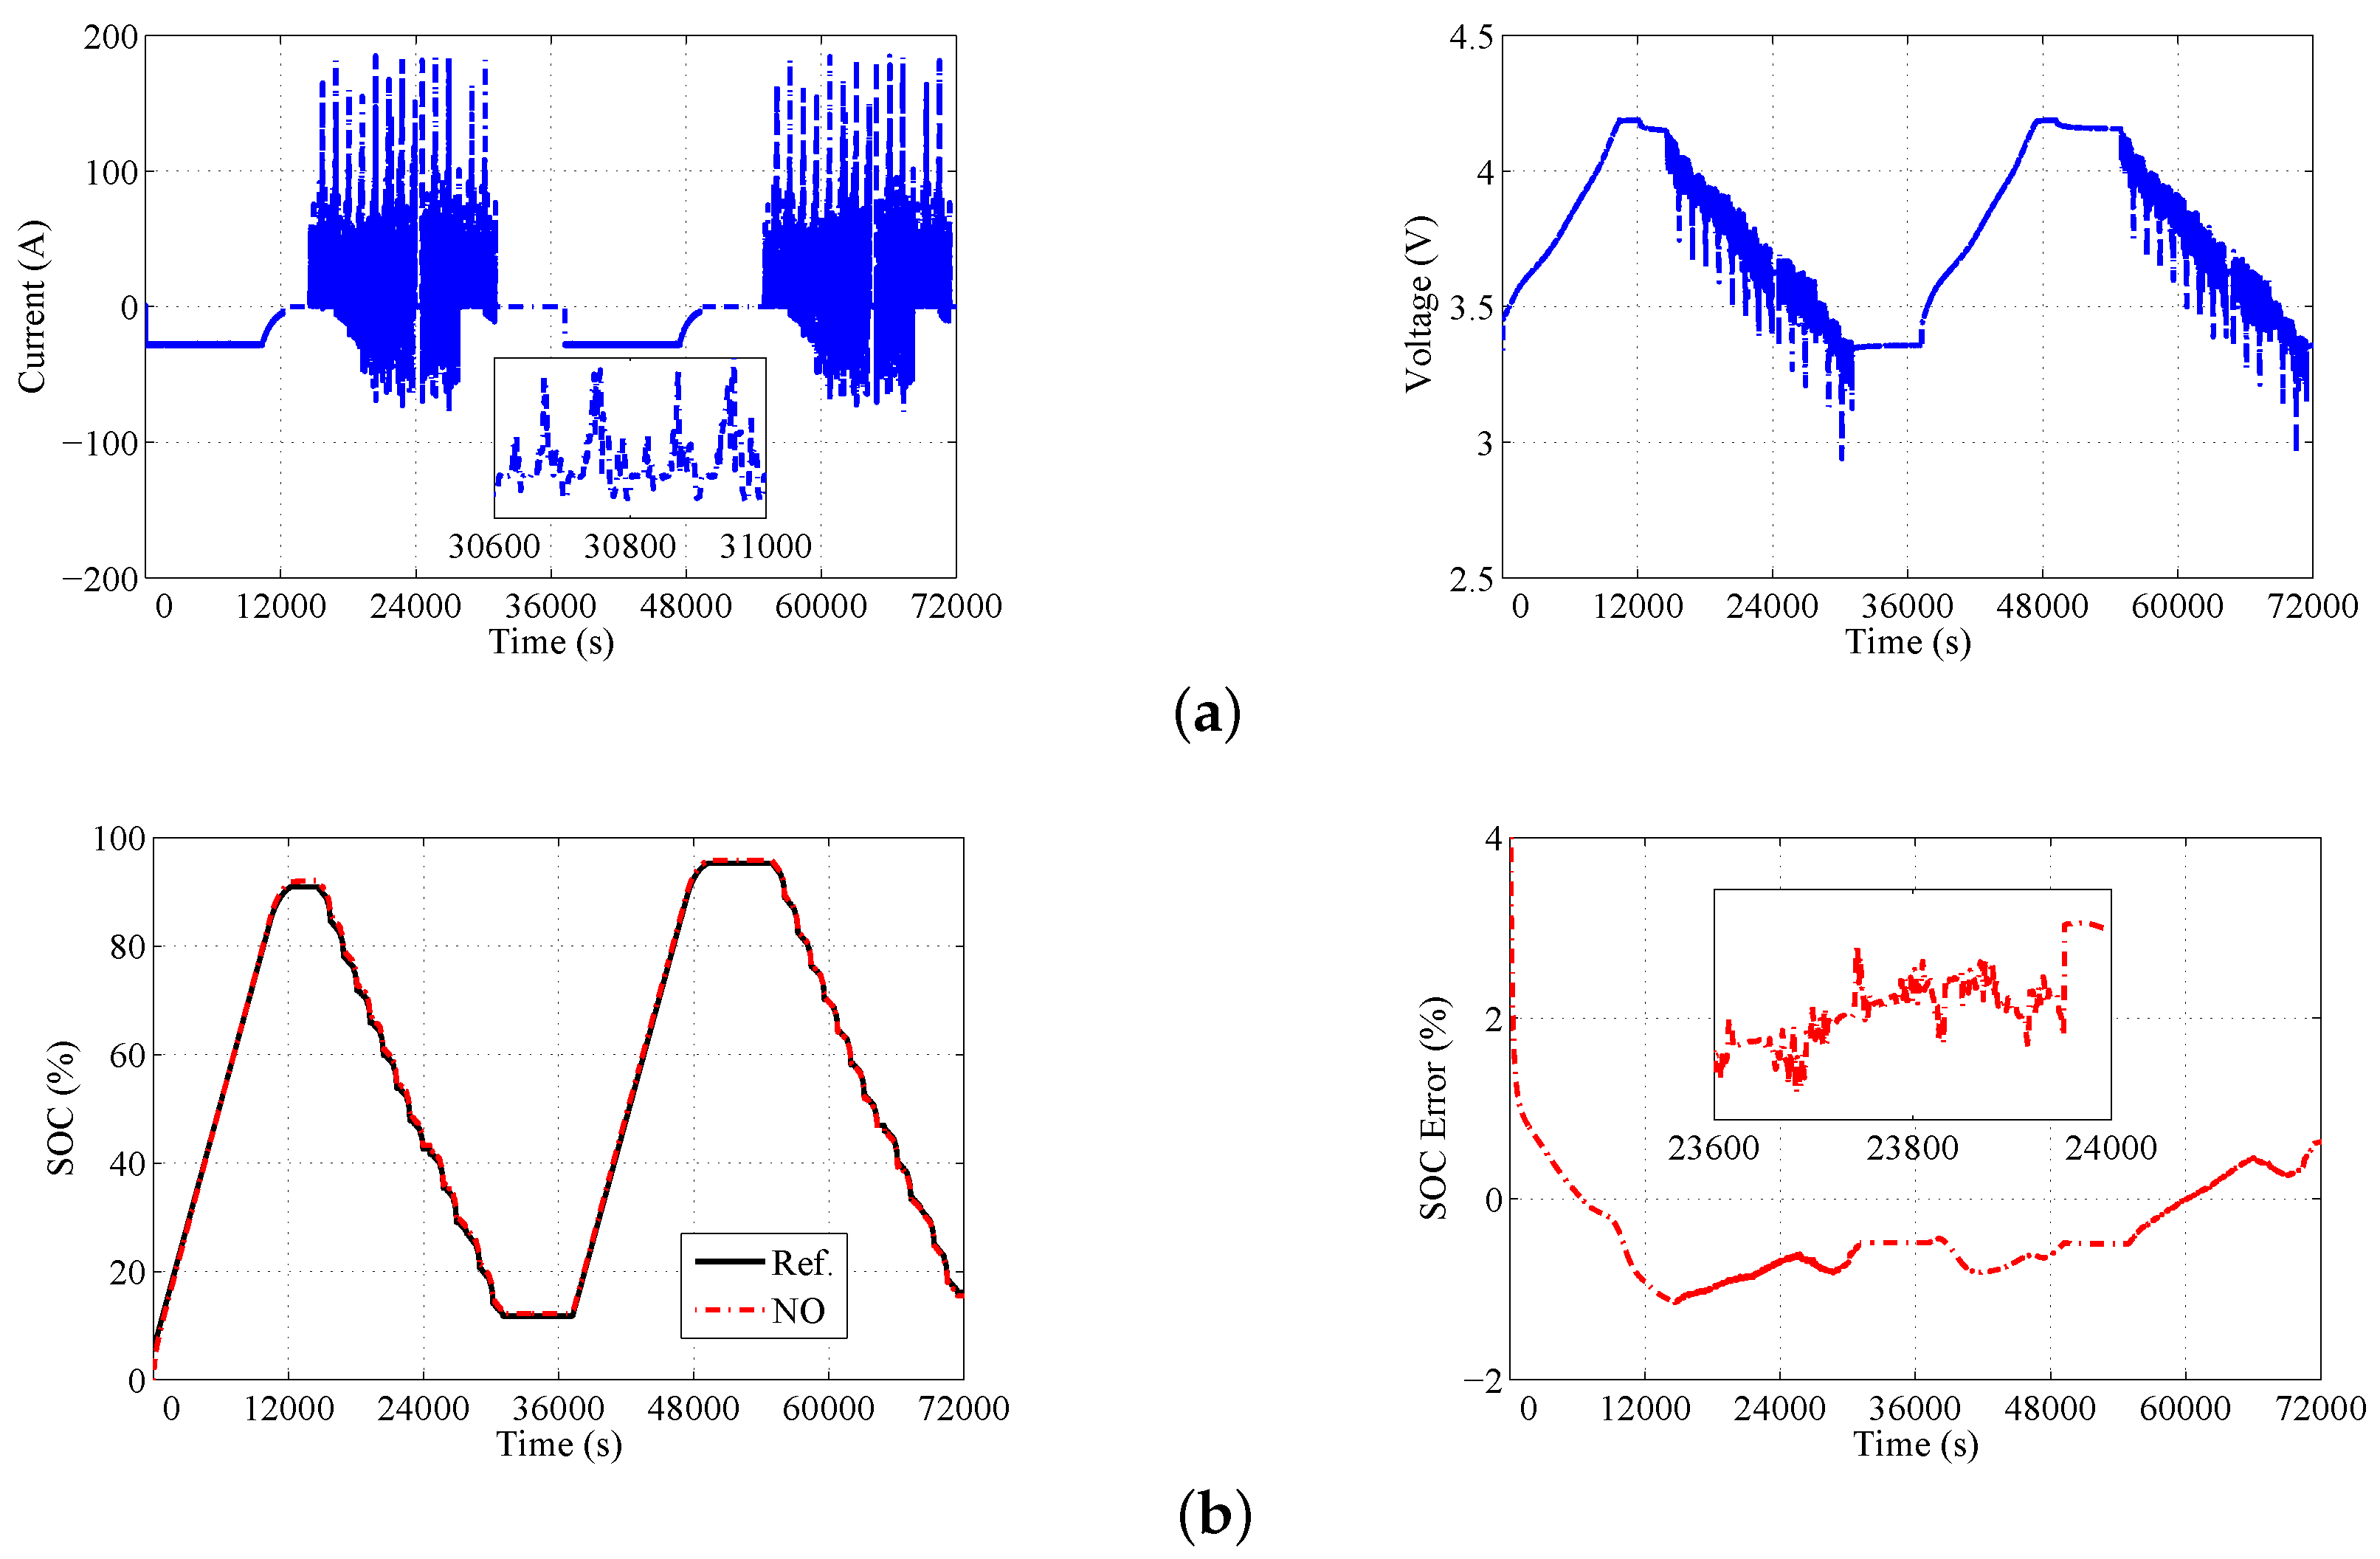
EV is a potential application for the proposed observer. A battery pack in an EV, which is composed of 3200 LIB cells (NCR18650BD from Panasonic), is selected, and the New European Driving Cycle (NEDC) test is adopted to evaluate the performance of the proposed observer. A battery module in the battery pack consists of 32 cells in parallel, which is considered as one single cell with large capacity and is monitored by a voltage sensor. In addition, the battery pack is monitored by a current sensor. All measurements of the voltage and current sensors in the battery pack are collected by a BMS, and the sampling time is 1 s.
The proposed methods are validated for different cells based on the datasets at different temperatures, and only the NEDC datasets and results of one cell at 30 are shown in this section due to space limitations. Differing from the datasets obtained by Arbin BT2000 used in the above section, Figure 11a shows the experimental current and terminal voltage curves of one cell, which are collected by the BMS in the battery pack. The SOC estimation results from the proposed observer are presented in Figure 11b, in which the initial SOC for the proposed observer is set as zero. The estimation results show that the proposed observer can achieve good performance for real life conditions, and the estimation errors of the proposed observer are no more than 1.5% after the estimation convergence for the test.
Generally, a LIB pack is composed of hundreds battery cells connected in series to provide the required voltage and in parallel to satisfy the capacity requirement. Due to the inconsistency of in-pack cells, the SOC must be considered for each cell individually to monitor the battery charging and discharging operations. However, the results of this paper can be extended to battery pack with considering the connections of battery pack (in series and in parallel) and the impact of balance control (passive and active balance control). One solution can be found in [42]. In addition, the charging and discharging characteristics of battery pack and the difference among the cells should be considered to avoid estimating SOC of each cell at each sampling interval and reduce computation cost. One method, where the highest and lowest SOCs are estimated at each sampling interval, and others are estimated for a certain longer sampling intervals, can be found in [43].
6. Conclusions
This paper proposes an observer for SOC estimation of LIB cells with stability guarantees based on a second-order RC model. The observer has an adaptive gain structure, and is simple to implement on embedded hardware. Moreover, the robustness of the observer can be guaranteed in a theoretical way based on ISS theory. A selection guide of the observer gains is presented from the practical application point of view. The experimental results demonstrate that the proposed observer provides relatively good estimation of SOC in comparison to EKF for different types of cells at different temperatures. Furthermore, it shows favorable robustness properties with respect to disturbances and uncertainties, such as measurement noise, sensor biases, and model parameter uncertainties. The robustness testing results also illustrate that there are a bit more estimation errors by the proposed observer when the model parameter uncertainties caused by temperature is significantly. One main reason for this is that the battery dynamics is not well described by the equivalent circuit model with fixed parameter values, which does not consider the effect of the temperature. In addition, the battery-aging factor can also gradually change the parameters of the battery model. Therefore, our future work will consider SOC estimation based on the proposed observer together with model parameters adaption to make the observer valid over the lifetime of battery under different working conditions.
Acknowledgments
This work was supported by China Automobile Industry Innovation and Development Joint Fund [No. U1564213] and by China Scholarship Council [No. 201706125075].
Author Contributions
Linhui Zhao conceived this paper and designed the experiments; Guohuang Ji carried out the experiments; Linhui Zhao wrote the paper; and Zhiyuan Liu revised the paper.
Conflicts of Interest
The authors declare no conflict of interest.
References
- Gu¨nther, H.O.; Kannegiesser, M.; Autenrieb, N. The role of electric vehicles for supply chain sustainability in the automotive industry. J. Clean. Prod. 2015, 90, 220–233. [Google Scholar] [CrossRef]
- Lu, L.; Han, X.; Li, J.; Hua, J.; Ouyang, M. A review on the key issues for lithium-ion battery management in electric vehicles. J. Power Sources 2013, 226, 272–288. [Google Scholar] [CrossRef]
- Mesbahi, T.; Khenfri, F.; Rizoug, N.; Chaaban, K.; Bartholomeüs, P.; Moigne, P.L. Dynamical modeling of Li-ion batteries for electric vehicle applications based on hybrid Particle Swarm-Nelder-Mead (PSO-NM) optimization algorithm. Electr. Power Syst. Res. 2016, 131, 195–204. [Google Scholar] [CrossRef]
- Chen, X.; Shen, W.; Cao, Z.; Kapoor, A. A novel approach for state of charge estimation based on adaptive switching gain sliding mode observer in electric vehicles. J. Power Sources 2014, 246, 667–678. [Google Scholar] [CrossRef]
- He, H.; Xiong, R.; Guo, H. Online estimation of model parameters and state-of-charge of LiFePO4 batteries in electric vehicles. Appl. Energy 2012, 89, 413–420. [Google Scholar] [CrossRef]
- Rahimi-Eichi, H.; Baronti, F.; Chow, M.Y. Online adaptive parameter identification and state-of-charge coestimation for lithium-polymer battery cells. IEEE Trans. Ind. Electron. 2014, 61, 2053–2061. [Google Scholar] [CrossRef]
- Xiong, B.; Zhao, J.; Wei, Z.; Skyllas-Kazacos, M. Extended Kalman filter method for state of charge estimation of vanadium redox flow battery using thermal-dependent electrical model. J. Power Sources 2014, 262, 50–61. [Google Scholar] [CrossRef]
- Wang, J.; Cao, B.; Chen, Q.; Wang, F. Combined state of charge estimator for electric vehicle battery pack. Control Eng. Pract. 2007, 15, 1569–1576. [Google Scholar] [CrossRef]
- Ng, K.S.; Moo, C.S.; Chen, Y.P.; Hsieh, Y.C. Enhanced coulomb counting method for estimating state-of-charge and state-of-health of lithium-ion batteries. Appl. Energy 2009, 86, 1506–1511. [Google Scholar] [CrossRef]
- Sun, F.; Xiong, R.; He, H. Estimation of state-of-charge and state-of-power capability of lithium-ion battery considering varying health conditions. J. Power Sources 2014, 259, 166–176. [Google Scholar] [CrossRef]
- Zhang, Y.; Song, W.; Lin, S.; Feng, Z. A novel model of the initial state of charge estimation for LiFePO4 batteries. J. Power Sources 2014, 248, 1028–1033. [Google Scholar] [CrossRef]
- Weigert, T.; Tian, Q.; Lian, K. State-of-charge prediction of batteries and battery-supercapacitor hybrids using artificial neural networks. J. Power Sources 2011, 196, 4061–4066. [Google Scholar] [CrossRef]
- Gharavian, D.; Pardis, R.; Sheikhan, M. ZEBRA battery SOC estimation using PSO-optimized hybrid neural model considering aging effect. IEICE Electr. Express 2012, 9, 1115–1121. [Google Scholar] [CrossRef]
- Antón, J.C.Á.; Nieto, P.J.G.; Juez, F.J.D.C.; Lasheras, F.S.; Vega, M.G.; Gutiérrez, M.N.R. Battery state-of-charge estimator using the SVM technique. Appl. Math. Model. 2013, 37, 6244–6253. [Google Scholar]
- Zhong, F.; Li, H.; Zhong, S.; Zhong, Q.; Yin, C. An SOC estimation approach based on adaptive sliding mode observer and fractional order equivalent circuit model for lithium-ion batteries. Commun. Nonlinear Sci. Numer. Simul. 2015, 24, 127–144. [Google Scholar] [CrossRef]
- Mastali, M.; Vazquez-Arenas, J.; Fraser, R.; Fowler, M.; Afshar, S.; Stevens, M. Battery state of the charge estimation using Kalman filtering. J. Power Sources 2013, 239, 294–307. [Google Scholar] [CrossRef]
- Xu, L.; Wang, J.; Chen, Q. Kalman filtering state of charge estimation for battery management system based on a stochastic fuzzy neural network battery model. Energy Convers. Manag. 2012, 53, 33–39. [Google Scholar] [CrossRef]
- Sepasi, S.; Ghorbani, R.; Liaw, B.Y. Improved extended Kalman filter for state of charge estimation of battery pack. J. Power Sources 2014, 255, 368–376. [Google Scholar] [CrossRef]
- Plett, G.L. Extended Kalman filtering for battery management systems of LiPB-based HEV battery packs. Part 1. Background. J. Power Sources 2004, 134, 252–261. [Google Scholar] [CrossRef]
- Hu, Y.; Yurkovich, S. Battery cell state-of-charge estimation using linear parameter varying system techniques. J. Power Sources 2012, 198, 338–350. [Google Scholar] [CrossRef]
- Barillas, J.K.; Li, J.; Günther, C.; Danzer, M.A. A comparative study and validation of state estimation algorithms for Li-ion batteries in battery management systems. Appl. Energy 2015, 155, 455–462. [Google Scholar] [CrossRef]
- Li, J.; Barillas, J.K.; Guenther, C.; Danzer, M.A. A comparative study of state of charge estimation algorithms for LiFePO4 batteries used in electric vehicles. J. Power Sources 2013, 230, 244–250. [Google Scholar] [CrossRef]
- Kim, I.S. The novel state of charge estimation method for lithium battery using sliding mode observer. J. Power Sources 2006, 163, 584–590. [Google Scholar] [CrossRef]
- Xia, Q.; Liu, Z. State-of-charge estimation method for electric vehicle battery using sliding mode observer. J. Southeast Univ. 2011, 41, 97–101. (In Chinese) [Google Scholar]
- Dey, S.; Ayalew, B. Nonlinear observer designs for state-of-charge estimation of Lithium-ion batteries. In Proceedings of the 2014 American Control Conference, Portland, OR, USA, 4–6 June 2014; pp. 248–253. [Google Scholar]
- Johansson, A.; Medvedev, A. An observer for systems with nonlinear output map. Automatica 2003, 39, 909–918. [Google Scholar] [CrossRef]
- Belhani, A.; M’Sirdi, N.K.; Naamane, A.; Kapoor, A. Adaptive sliding mode observer for estimation of state of charge. Energy Procedia 2013, 42, 377–386. [Google Scholar] [CrossRef]
- Xia, B.; Chen, C.; Tian, Y.; Sun, W.; Xu, Z.; Zheng, W. A novel method for state of charge estimation of lithium-ion batteries using a nonlinear observer. J. Power Sources 2014, 270, 359–366. [Google Scholar] [CrossRef]
- Tian, Y.; Chen, C.; Xia, B.; Sun, W.; Xu, Z.; Zheng, W. An adaptive gain nonlinear observer for state of charge estimation of lithium-ion batteries in electric vehicles. Energies 2014, 7, 5995–6012. [Google Scholar] [CrossRef]
- Verbrugge, M.; Tate, E. Adaptive state of charge algorithm for nickel metal hydride batteries including hysteresis phenomena. J. Power Sources 2004, 126, 236–249. [Google Scholar] [CrossRef]
- He, Y.; Liu, X.; Zhang, C.; Chen, Z. A new model for State-of-Charge (SOC) estimation for high-power Li-ion batteries. Appl. Energy 2013, 101, 808–814. [Google Scholar] [CrossRef]
- Fotouhi, A.; Auger, D.J.; Propp, K.; Longo, S.; Wild, M. A review on electric vehicle battery modelling: From Lithium-ion toward Lithium-Sulphur. Renew. Sustain. Energy Rev. 2016, 56, 1008–1021. [Google Scholar] [CrossRef]
- He, H.; Xiong, R.; Zhang, X.; Sun, F.; Fan, J. State-of-charge estimation of the lithium-ion battery using an adaptive extended Kalman filter based on an improved Thevenin model. IEEE Trans. Veh. Technol. 2011, 60, 1461–1469. [Google Scholar]
- Chen, M.; Rincón-Mora, G.A. Accurate electrical battery model capable of predicting runtime and I–V performance. IEEE Trans. Energy Convers. 2006, 21, 504–511. [Google Scholar] [CrossRef]
- Khalil, H.K. Nonlinear Systems, 3rd ed.; Prentice-Hall: Upper Saddle River, NJ, USA, 2002; pp. 175–180. ISBN 0-13-067389-7. [Google Scholar]
- Liu, X.; Liu, Z.; Zhang, C.; Wu, J. A novel temperature-compensated model for power Li-ion batteries with dual-particle-filter state of charge estimation. Appl. Energy 2014, 123, 263–272. [Google Scholar] [CrossRef]
- USCAR. Manuals: Electric Vehicle Battery Test Procedures Manual. Revision 2, Last Updated: 15 August 2006. Available online: http://www.uscar.org/guest/publications.php (accessed on 5 November 2017).
- Weicker, P. A Systems Approach to Lithium-Ion Battery Management; Artech House: Norwood, MA, USA, 2014; ISBN 978-1-60807-659-8. [Google Scholar]
- Wang, B.; Li, S.E.; Peng, H.; Liu, Z. Fractional-order modeling and parameter identification for lithium-ion batteries. J. Power Sources 2015, 293, 151–161. [Google Scholar] [CrossRef]
- Dao, T.S.; Vyasarayani, C.P.; Mcphee, J. Simplification and order reduction of lithium-ion battery model based on porous-electrode theory. J. Power Sources 2012, 198, 329–337. [Google Scholar] [CrossRef]
- Waag, W.; Käbitz, S.; Sauer, D.U. Experimental investigation of the lithium-ion battery impedance characteristic at various conditions and aging states and its influence on the application. Appl. Energy 2014, 102, 885–897. [Google Scholar] [CrossRef]
- Zhong, L.; Zhang, C.; He, Y.; Chen, Z. A method for the estimation of the battery pack state of charge based on in-pack cells uniformity analysis. Appl. Energy 2014, 113, 558–564. [Google Scholar] [CrossRef]
- Wei, J.; Dong, G.; Chen, Z.; Kang, Y. System state estimation and optimal energy control framework for multicell lithium-ion battery system. Appl. Energy 2017, 187, 37–49. [Google Scholar] [CrossRef]
Figure 1.
Schematic of the second-order RC model.

Figure 2.
Experimental SOC-OCV relationship of a LIB cell.

Figure 3.
Configuration of the battery test bench.

Figure 4.
Dynamic current profiles and voltage responses of different tests: (a) HPT for one type 1 cell; (b) DST for one type 2 cell; and (c) FUDS for one type 2 cell.
Figure 4.
Dynamic current profiles and voltage responses of different tests: (a) HPT for one type 1 cell; (b) DST for one type 2 cell; and (c) FUDS for one type 2 cell.

Figure 5.
Estimation results of HPT datasets from two type 1 cells: (a) estimation results of cell 1; and (b) estimation results of cell 2.
Figure 5.
Estimation results of HPT datasets from two type 1 cells: (a) estimation results of cell 1; and (b) estimation results of cell 2.

Figure 6.
Estimation results of DST datasets from type 2 cell at different temperatures: (a) estimation results at 10 ; (b) estimation results at 20 ; and (c) estimation results at 40 .
Figure 6.
Estimation results of DST datasets from type 2 cell at different temperatures: (a) estimation results at 10 ; (b) estimation results at 20 ; and (c) estimation results at 40 .

Figure 7.
Estimation results of FUDS datasets from type 2 cell at different temperatures: (a) estimation results at 10 ; (b) estimation results at 20 ; and (c) estimation results at 40 .
Figure 7.
Estimation results of FUDS datasets from type 2 cell at different temperatures: (a) estimation results at 10 ; (b) estimation results at 20 ; and (c) estimation results at 40 .

Figure 8.
Robustness validation 1, measurements with noise and sensor basies: (a) with voltage and current measurement noise; and (b) with current sensor biases.
Figure 8.
Robustness validation 1, measurements with noise and sensor basies: (a) with voltage and current measurement noise; and (b) with current sensor biases.

Figure 9.
Robustness validation 2, capacity uncertainties caused by deterioration.
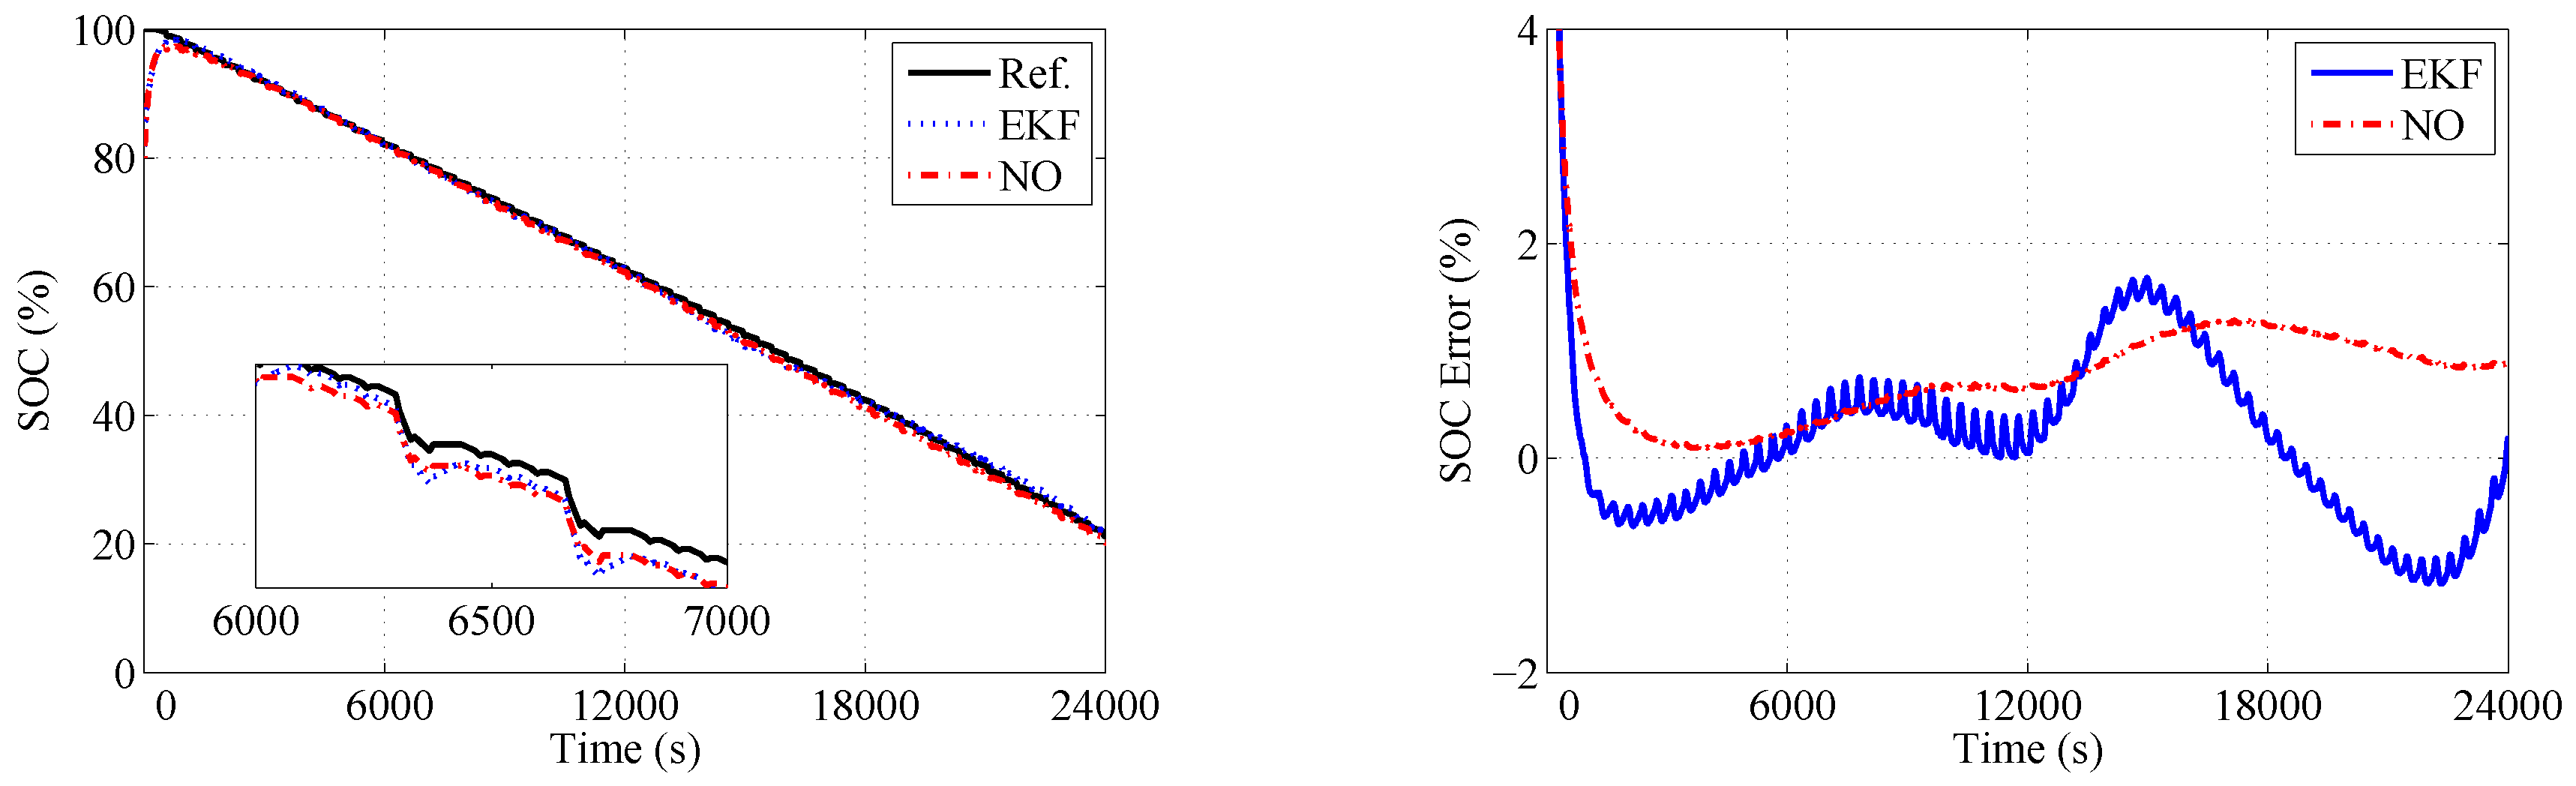
Figure 10.
Robustness validation 3, model parameter uncertainties caused by temperature.
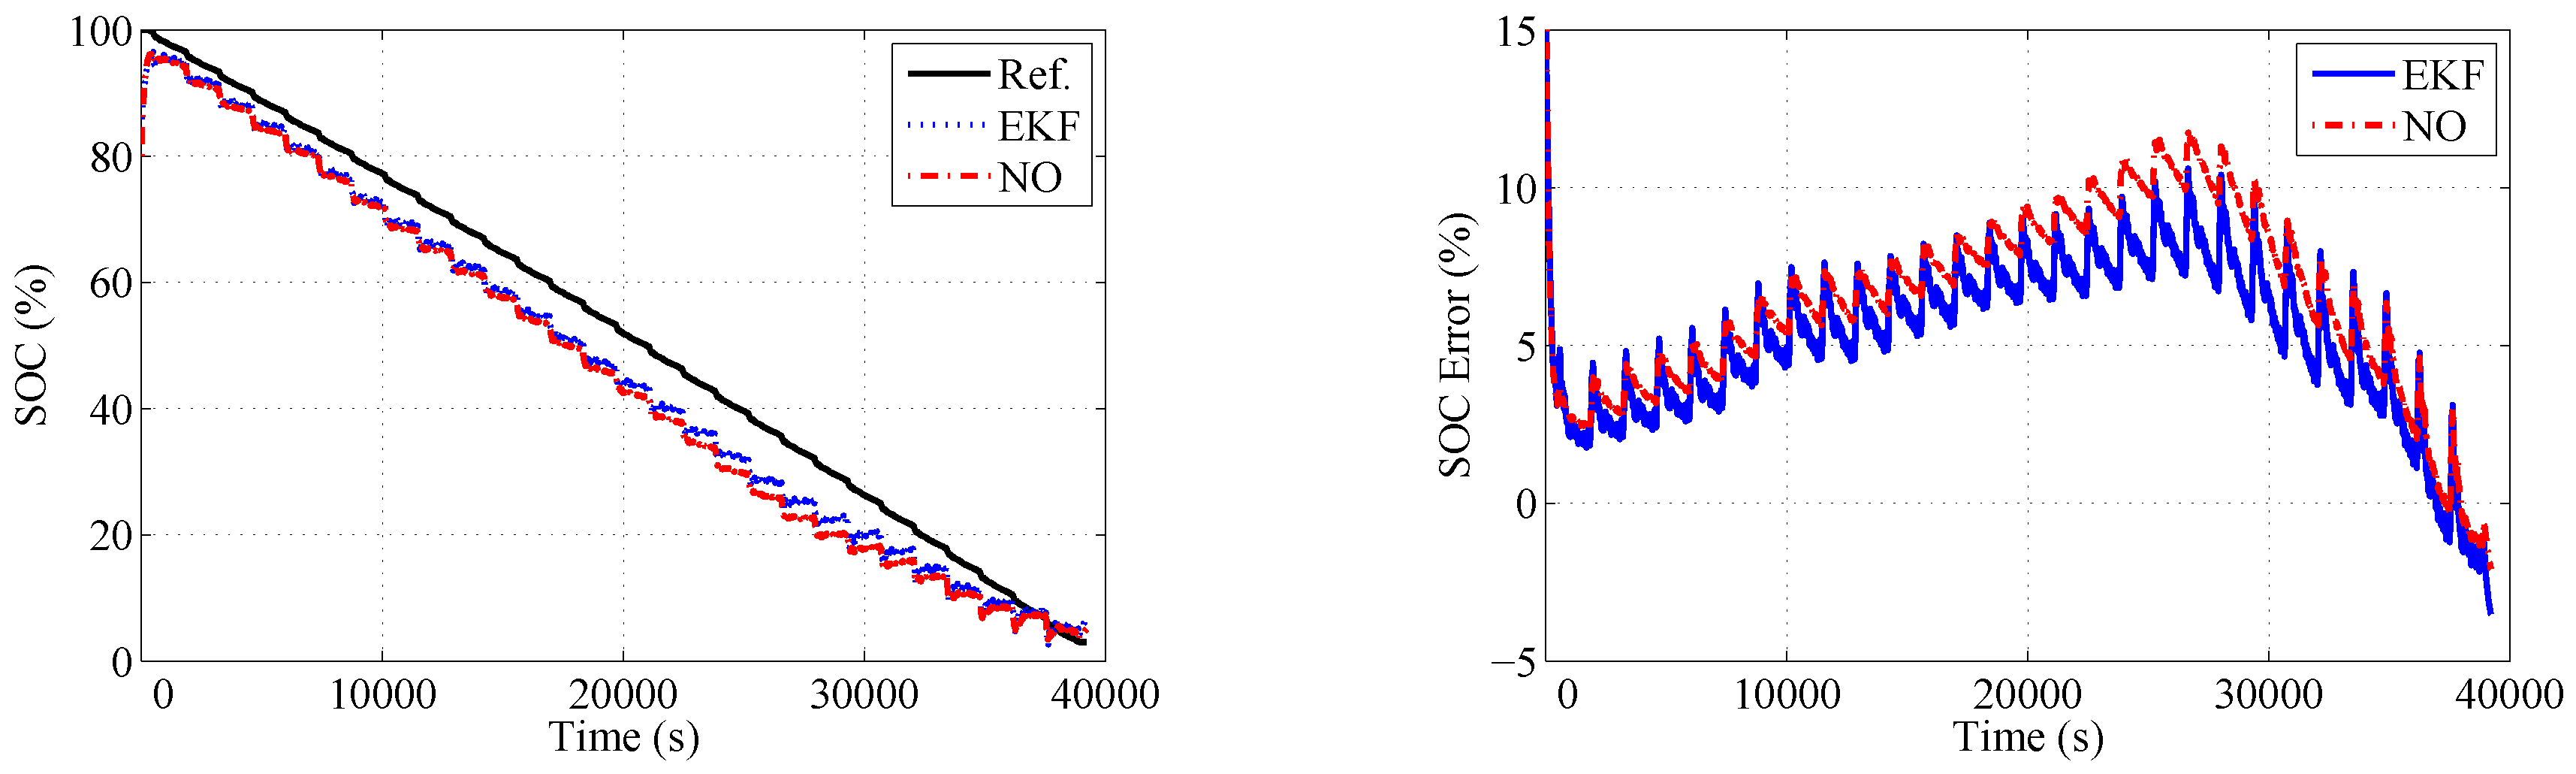
Figure 11.
Validation results of datasets from a BMS in an electric EV pack: (a) dynamic current profile and voltage response of NEDC test collected by a BMS; and (b) estimation results of SOC.
Figure 11.
Validation results of datasets from a BMS in an electric EV pack: (a) dynamic current profile and voltage response of NEDC test collected by a BMS; and (b) estimation results of SOC.


Table 1.
The main specifications of LIB cells under test.
| Cell Type | Type 1 | Type 2 |
|---|---|---|
| Nominal capacity | 5.00 Ah | 5.00 Ah |
| Nominal voltage | 3.20 V | 3.70 V |
| Charge cut-off voltage | 3.70 V | 4.20 V |
| Discharge cut-off voltage | 2.00 V | 2.75 V |
| Maximum continuous charge current | 1.00 C | 0.50 C |
| Maximum instant discharge current | 3.00 C | 1.50 C |
| Operating temperature | −20 ∼60 | −20 ∼60 |
Table 2.
The identification results of SOC-OCV coefficients for two types of cells.
| Cells | |||||||
|---|---|---|---|---|---|---|---|
| Type 1 cell | 3.151 | 0.401 | 4.140 | 57.835 | 19.808 | ||
| Type 2 cell at 10 | 3.416 | 4.074 | 49.800 | 36.910 | |||
| Type 2 cell at 20 | 3.475 | 2.786 | 23.078 | 6.713 | 0 | ||
| Type 2 cell at 40 | 3.498 | 2.108 | 16.034 | 4.579 | 0 |
Table 3.
The identification results of parameters , , , and for two types of cells.
| Cells | (F) | (F) | |||
|---|---|---|---|---|---|
| Type 1 cell | 0.012 | 0.017 | 0.008 | 6606 | 46386 |
| Type 2 cell at 10 | 0.126 | 0.063 | 0.006 | 3964 | 30480 |
| Type 2 cell at 20 | 0.121 | 0.052 | 0.005 | 4542 | 52577 |
| Type 2 cell at 40 | 0.109 | 0.018 | 0.002 | 5865 | 84719 |
Table 4.
RMSEs (mV) of predicted terminal voltages based on battery model for different datasets.
| Cells | Type 1 Cell | Type 2 Cell | ||||||
|---|---|---|---|---|---|---|---|---|
| Cell 1 | Cell 2 | DST | FUDS | |||||
| 10 | 20 | 40 | 10 | 20 | 40 | |||
| RMSEs | 14.7 | 16.3 | 16.8 | 11.1 | 5.0 | 18.4 | 12.5 | 6.2 |
Table 5.
The upper bounds of and for two types of cells.
| Cells | Upper Bounds of | Upper Bounds of |
|---|---|---|
| Type 1 cell | 0.009 | 0.003–0.303 |
| Type 2 cell at 10 | 0.004 | 0.005–1.366 |
| Type 2 cell at 20 | 0.004 | 0.004–0.898 |
| Type 2 cell at 40 | 0.009 | 0.006–0.623 |
Table 6.
RMSEs (%) of SOC estimation results for different datasets.
| Cells | Type 1 Cell | Type 2 Cell | ||||||
|---|---|---|---|---|---|---|---|---|
| Cell 1 | Cell 2 | DST | FUDS | |||||
| 10 | 20 | 40 | 10 | 20 | 40 | |||
| NO RMSEs | 1.69 | 1.73 | 1.41 | 0.92 | 0.59 | 1.37 | 1.08 | 0.49 |
| EKF RMSEs | 2.80 | 3.83 | 2.63 | 1.55 | 0.77 | 2.28 | 1.67 | 0.69 |
Table 7.
The computational cost comparison of the proposed observer and EKF.
| Methods | NO | EKF |
|---|---|---|
| Average cycle time | 0.0158 ms | 0.0566 ms |
© 2017 by the authors. Licensee MDPI, Basel, Switzerland. This article is an open access article distributed under the terms and conditions of the Creative Commons Attribution (CC BY) license (http://creativecommons.org/licenses/by/4.0/).
Share and Cite
MDPI and ACS Style
Zhao, L.; Ji, G.; Liu, Z. Design and Experiment of Nonlinear Observer with Adaptive Gains for Battery State of Charge Estimation. Energies 2017, 10, 2046. https://doi.org/10.3390/en10122046
AMA Style
Zhao L, Ji G, Liu Z. Design and Experiment of Nonlinear Observer with Adaptive Gains for Battery State of Charge Estimation. Energies. 2017; 10(12):2046. https://doi.org/10.3390/en10122046
Chicago/Turabian StyleZhao, Linhui, Guohuang Ji, and Zhiyuan Liu. 2017. "Design and Experiment of Nonlinear Observer with Adaptive Gains for Battery State of Charge Estimation" Energies 10, no. 12: 2046. https://doi.org/10.3390/en10122046
Note that from the first issue of 2016, this journal uses article numbers instead of page numbers. See further details here.