Improving the Performance Attributes of Plug-in Hybrid Electric Vehicles in Hot Climates through Key-Off Battery Cooling

1
The Warwick Manufacturing Group, University of Warwick, Coventry CV4 7AL, UK
2
Jaguar LandRover, Coventry CV3 4LF, UK
*
Author to whom correspondence should be addressed.
Energies 2017, 10(12), 2058; https://doi.org/10.3390/en10122058
Submission received: 22 September 2017
/
Revised: 16 November 2017
/
Accepted: 27 November 2017
/
Published: 5 December 2017
(This article belongs to the Special Issue Thermal Energy Storage and Thermal Management (TESM2017))
Abstract
:Ambient conditions can have a significant impact on the average and maximum temperature of the battery of electric and plug-in hybrid electric vehicles. Given the sensitivity of the ageing mechanisms of typical battery cells to temperature, a significant variability in battery lifetime has been reported with geographical location. In addition, high battery temperature and the associated cooling requirements can cause poor passenger thermal comfort, while extreme battery temperatures can negatively impact the power output of the battery, limiting the available electric traction torque. Avoiding such issues requires enabling battery cooling even when the vehicle is parked and not plugged in (key-off), but the associated extra energy requirements make applying key-off cooling a non-trivial decision. In this paper, a representative plug-in parallel hybrid electric vehicle model is used to simulate a typical 24-h duty cycle to quantify the impact of hot ambient conditions on three performance attributes of the vehicle: the battery lifetime, passenger thermal comfort and fuel economy. Key-off cooling is defined as an optimal control problem in view of the duty cycle of the vehicle. The problem is then solved using the dynamic programming method. Controlling key-off cooling through this method leads to significant improvements in the battery lifetime, while benefiting the fuel economy and thermal comfort attributes. To further improve the battery lifetime, partial charging of the battery is considered. An algorithm is developed that determines the optimum combination of key-off cooling and the level of battery charge. Simulation results confirm the benefits of the proposed method.
1. Introduction
The most significant obstacle in the way of the transition from conventional vehicles to electric vehicles (EVs) is the under-developed traction battery technology [1,2]. As this transition takes place, most technology road maps and policy trends indicate that plug-in hybrid electric vehicles (PHEVs) will dominate the passenger vehicles markets in the next decade [3,4,5]. Limited experience with batteries in the automotive industry and scarce field data [6] mean that production vehicles should continue to evolve in order to fully accommodate the challenges posed by the battery [7]. Ageing of battery cells, defined as the irreversible reduction of their energy storage capacity and power [8,9], is one such challenge [10]. Lithium-ion cells, which are believed to be the most promising choice for automotive applications [11,12] have ageing mechanisms that are sensitive to real world usage conditions [13]. Cycling ageing (ageing due to the conditions of charge-discharge cycles) accelerates at high temperature, as well as with a high degree of discharge, and high charge-discharge rates [14,15]. Storage ageing (ageing due to storage conditions) increases with elevated temperature [8,16] and state of charge (SoC) [17,18]. Heat transfer from the ambient environment, the passenger cabin and other adjacent components, in addition to internal heat generation, contribute to high battery temperature [19] that can reach as high as 65 °C [20]. Therefore, some form of battery cooling system is necessary. Battery cooling is traditionally a “key-on” function, that is, it is only activated when the vehicle is switched on [21].
In hot climate conditions, the heat gain from the ambient environment alone is enough to heat the battery to extreme temperatures [22,23]. Although key-on cooling can significantly reduce the daily maximum battery temperature in most cases [24,25], extreme battery temperatures can be still experienced when vehicles are parked (“key-off”). Since typical passenger vehicles are parked for most of their lifetime, markedly short battery lifetimes have been observed in hot geographical locations [20,22].
In hot climate conditions, the only practical source of cooling power is the refrigeration circuit of the air conditioning system [26]; therefore, battery cooling systems are often integrated into the refrigeration circuit [27,28]. This integration creates two challenges. First, the compressor of the refrigeration circuit is powered by the battery itself [29,30]. Therefore, key-on cooling has a negative impact on the vehicle’s energy efficiency and electric drive range (EDR) [31,32]. Second, to cool the cabin and perform key-on battery cooling at the same time, the cooling power of the refrigeration circuit is distributed between cabin air conditioning and battery cooling. When the air conditioning load is high (i.e., when the cabin is hot), allocating part of the available cooling power to the battery causes a noticeable rise in the average cabin air temperature [33,34,35]. Therefore, key-on cooling can negatively affect the passengers’ thermal comfort [36].
Observation of short battery lifetime in hot geographical locations indicates the need for extending battery cooling beyond a key-on function. Previous research in this area have assumed that vehicles can be always plugged in when they are parked; therefore, combining key-on cooling with additional “plugged-in cooling” (cooling using the grid energy) has been proposed to enable frequent and aggressive cooling [20,22,32,34,37,38,39]. Since it uses an external energy source, plugged-in cooling is effectively ‘free’ for the vehicle. Battery lifetime improvements of approximately 1–2 years have been reported in hot climate conditions through this approach [34,37,38,39]. Enabling plugged-in cooling also benefits the energy efficiency and thermal comfort attributes of the vehicle, as the ‘free’ nature of plugged-in cooling encourages intensive precooling of the battery to reduce the need for key-on cooling during the subsequent trip [32].
A further benefit of precooling which has not received sufficient previous attention concerns the electric traction capability of the vehicle. As a safety function and to avoid damage to the battery, typical automotive battery management systems limit the power output of the battery at high temperatures [34,40,41]. This reduces the electric traction capability until the cooling system brings the temperature of the battery back into the prescribed range [42]. Reduced electric traction in plug-in parallel hybrid electric vehicles (PPHEVs) can lead to poor fuel economy on aggressive drive cycles, as the engine will be used more to fulfil the traction requirement. Precooling can help prevent the negative effect of hot battery on fuel economy.
The fact that most vehicles are not always plugged in when they are parked [43,44] limits the opportunity for plugged-in cooling. A comprehensive battery cooling strategy should therefore combine key-on and plugged-in cooling with additional cooling when the vehicle is parked and not plugged in (key-off cooling) [22,34]. However, two critical concerns have discouraged any previous consideration of key-off cooling. First, as key-off cooling is supported by the battery, it will reduce the vehicle EDR, which is equivalent to higher fuel consumption in PHEVs. Second, discharging the battery to support key-off cooling increases cycling ageing, which may adversely affect the battery lifetime.
Reducing the average SoC of the battery through optimized partial charging is another method that has been used to improve the battery lifetime [45,46,47,48]. The method typically involves using advanced knowledge of the vehicle duty cycle and charging the battery only as much as the vehicle will consume until it is plugged-in next time. However, this method is only effective when the vehicle is always plugged-in when it is parked. If the vehicle is plugged-in less frequently, as is commonly the case, limited opportunity for partial charging will be available as the battery charge should be high enough to support an extended operation. Further, the majority of the previous studies in this area ignored the benefit of lower SoC relative to lower temperature, and considered controlling the level of charge independent of controlling cooling, even when plugged-in cooling was available.
This paper, for the first time proposes the application of key-off cooling and develops an underpinning methodology for optimal control of key-off cooling in a PPHEV. For the first time, three performance attributes of fuel economy, battery lifetime, and passenger thermal comfort are considered in cooling the battery, and their trade-off is addressed. Furthermore, for the first time, this paper proposes that for improving battery lifetime in hot climates, partial charging optimisation and cooling optimisation should be integrated. A method is developed that determines the best combination of the level of charge and key-off cooling control for improved battery lifetime, while considering the fuel economy and passenger thermal comfort attributes.
To achieve this, a representative vehicle model is simulated, over a 24-h duty cycle composed of two trips and two park phases per day. The vehicle is subjected to hot climate conditions and undergoes a hot soak when it is parked during the day, experiencing high battery temperatures. The impact of the climate conditions on the fuel economy, battery lifetime and thermal comfort attributes of the vehicle are quantified through comparison with milder climate conditions. The need for key-off cooling of the battery in hot climate conditions is established from this comparison. Then, the optimal control of key-off cooling is defined as the minimization of a cost function composed of the weighted sum of fuel consumption, capacity loss of the battery, and a thermal discomfort index that represents the deterioration of the passengers’ thermal comfort due to key-on battery cooling. Solving the problem for different weightings of the cost function demonstrates the ability of the method to target individual or a combination of the represented performance attributes. The effect of key-off cooling for improving each performance attribute is analyzed. Later, the proposed method is expanded to include partial charging, and the benefit of integrating partial charging and key-off cooling on battery lifetime is demonstrated.
The paper is organized as follows. Section 2 defines a 24-h vehicle duty cycle, which constitutes the basis for subsequent simulations and analyses. Section 3 introduces the vehicle model developed for the purpose of this research. Section 4 discusses the result of simulating the model over the defined duty cycle and quantifies the negative effect of high battery temperature on each performance attribute of the vehicle. Section 5 defines key-off cooling as an optimal control problem. Section 6 discusses the control of key-off cooling in view of the 24-h duty cycle of the vehicle based on improving individual, and combinations, of the performance attributes. Section 7 proposes a method for integrating key-off cooling and partial charging. Section 8 discusses the applicability of the proposed methods to EVs. Section 9 provides additional discussion of the results. Section 10 outlines how the research will continue in the future. Finally, Section 11highlights the conclusions of the research.
2. The Duty Cycle
In this paper, a vehicle duty cycle is defined by three elements:
- (1)
- the usage case, which includes details such as the number and timing of the trips, charge frequency, etc.;
- (2)
- the drive cycles of the trips;
- (3)
- the climate conditions in which the vehicle operates.
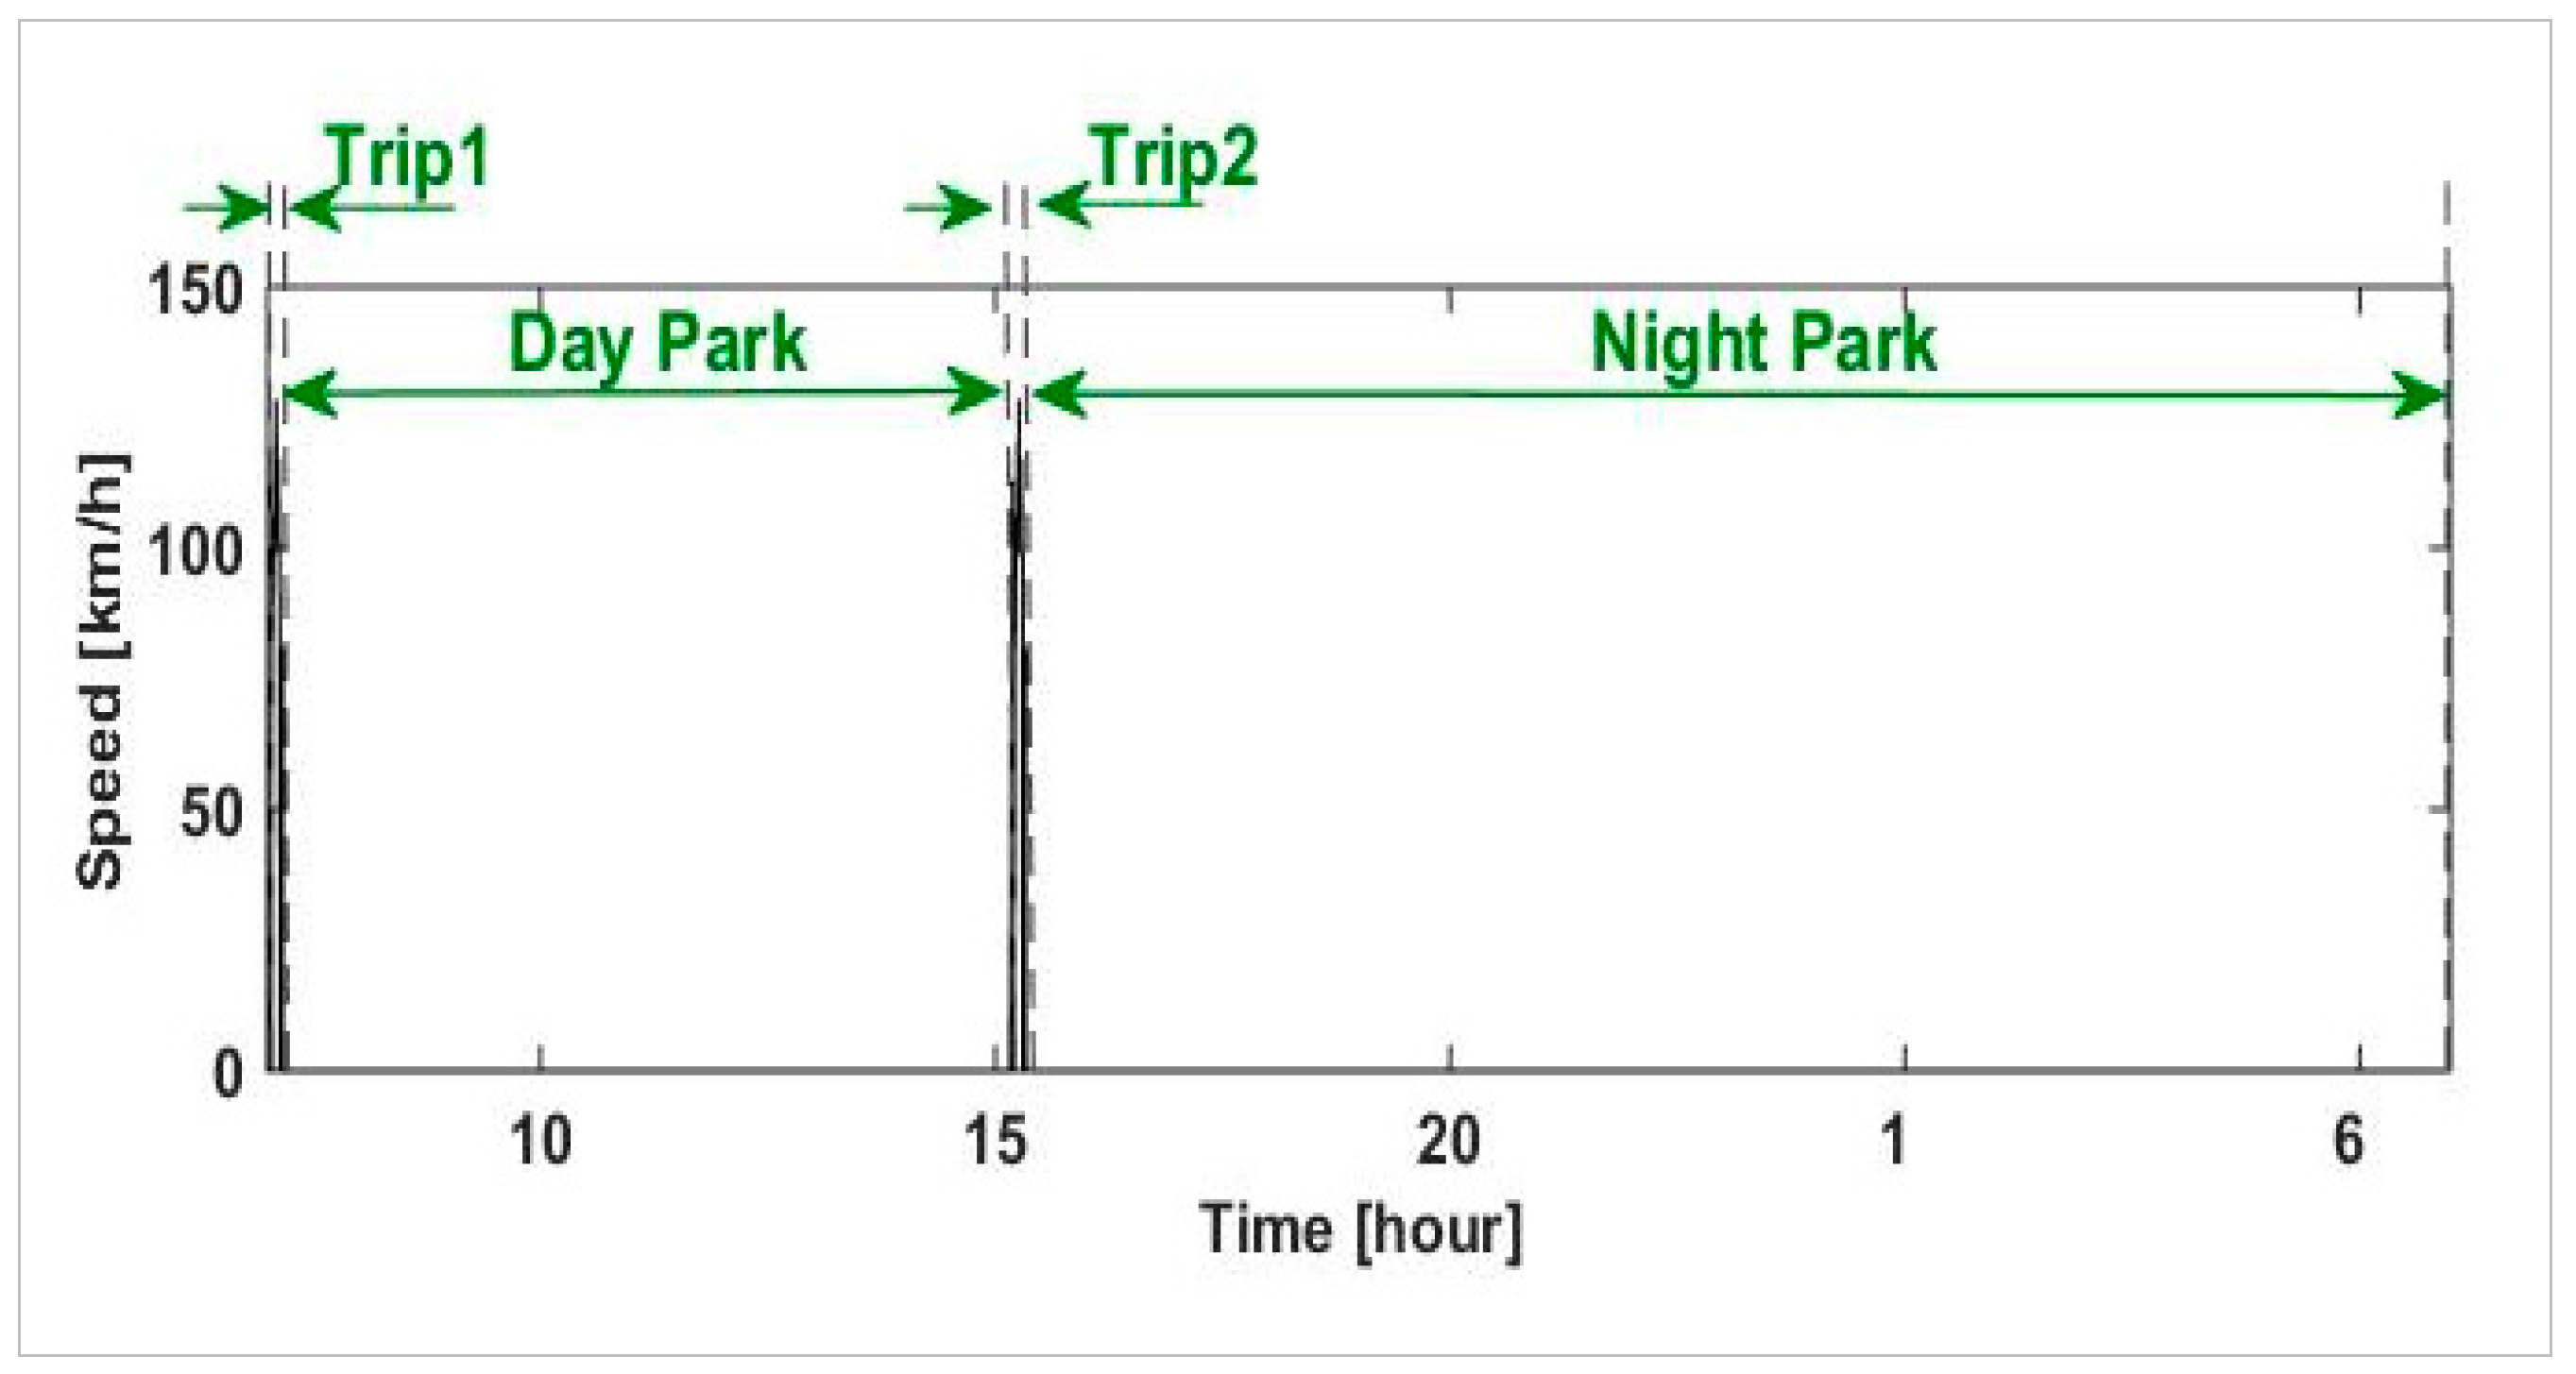
The usage case considered in this research was a work commute, which starts at 7 a.m. with a trip (Trip 1), followed by an 8-h park (Day Park) and another trip (Trip 2), after which the vehicle is parked and plugged-in until the next day (Night Park). In Figure 1, different phases of the duty cycle are marked on the daily profile of the vehicle speed. For simplicity, Trip 1 and Trip 2 are assumed to have identical drive cycles.
The vehicle was assumed to operate in Phoenix, AZ, USA, which has hot climate conditions. In the interest of simplicity and generality, it was assumed that a year in Phoenix can be divided into a six-month warm season, from May to October, and a six-month cold season, from November to April. These will be loosely referred to as summer and winter. The daily air temperature and the solar load profiles were created for each season, as shown in Figure 2, by averaging the hourly climate conditions of the relevant months [49]. The vehicle is subjected to the above conditions during the two daily trips, and during Day Park when it is parked in the open. In the interest of simplicity, it was assumed that in Night Park, the vehicle is parked in a garage maintained at constant temperature of 25 °C in summer and 15 °C in winter.
Both trips were assumed to be on the US06 drive cycle. The aggressiveness of the US06 is representative of most real-life drive cycles [22]. The distance covered by the US06 is approximately eight miles, which is comparable with the distance covered by the current European homologation drive cycle (NEDC) [50], although it is shorter than the average commutes in the U.S. [51]. Nevertheless, the purpose of the drive cycle for the analyses that will follow is to create the necessary boundary conditions for the park phases of the duty cycle; hence, the US06 is a sufficiently representative drive cycle to showcase the methodology of this research. A summary of the duty cycle assumptions is given in Table 1.
3. The Vehicle Model
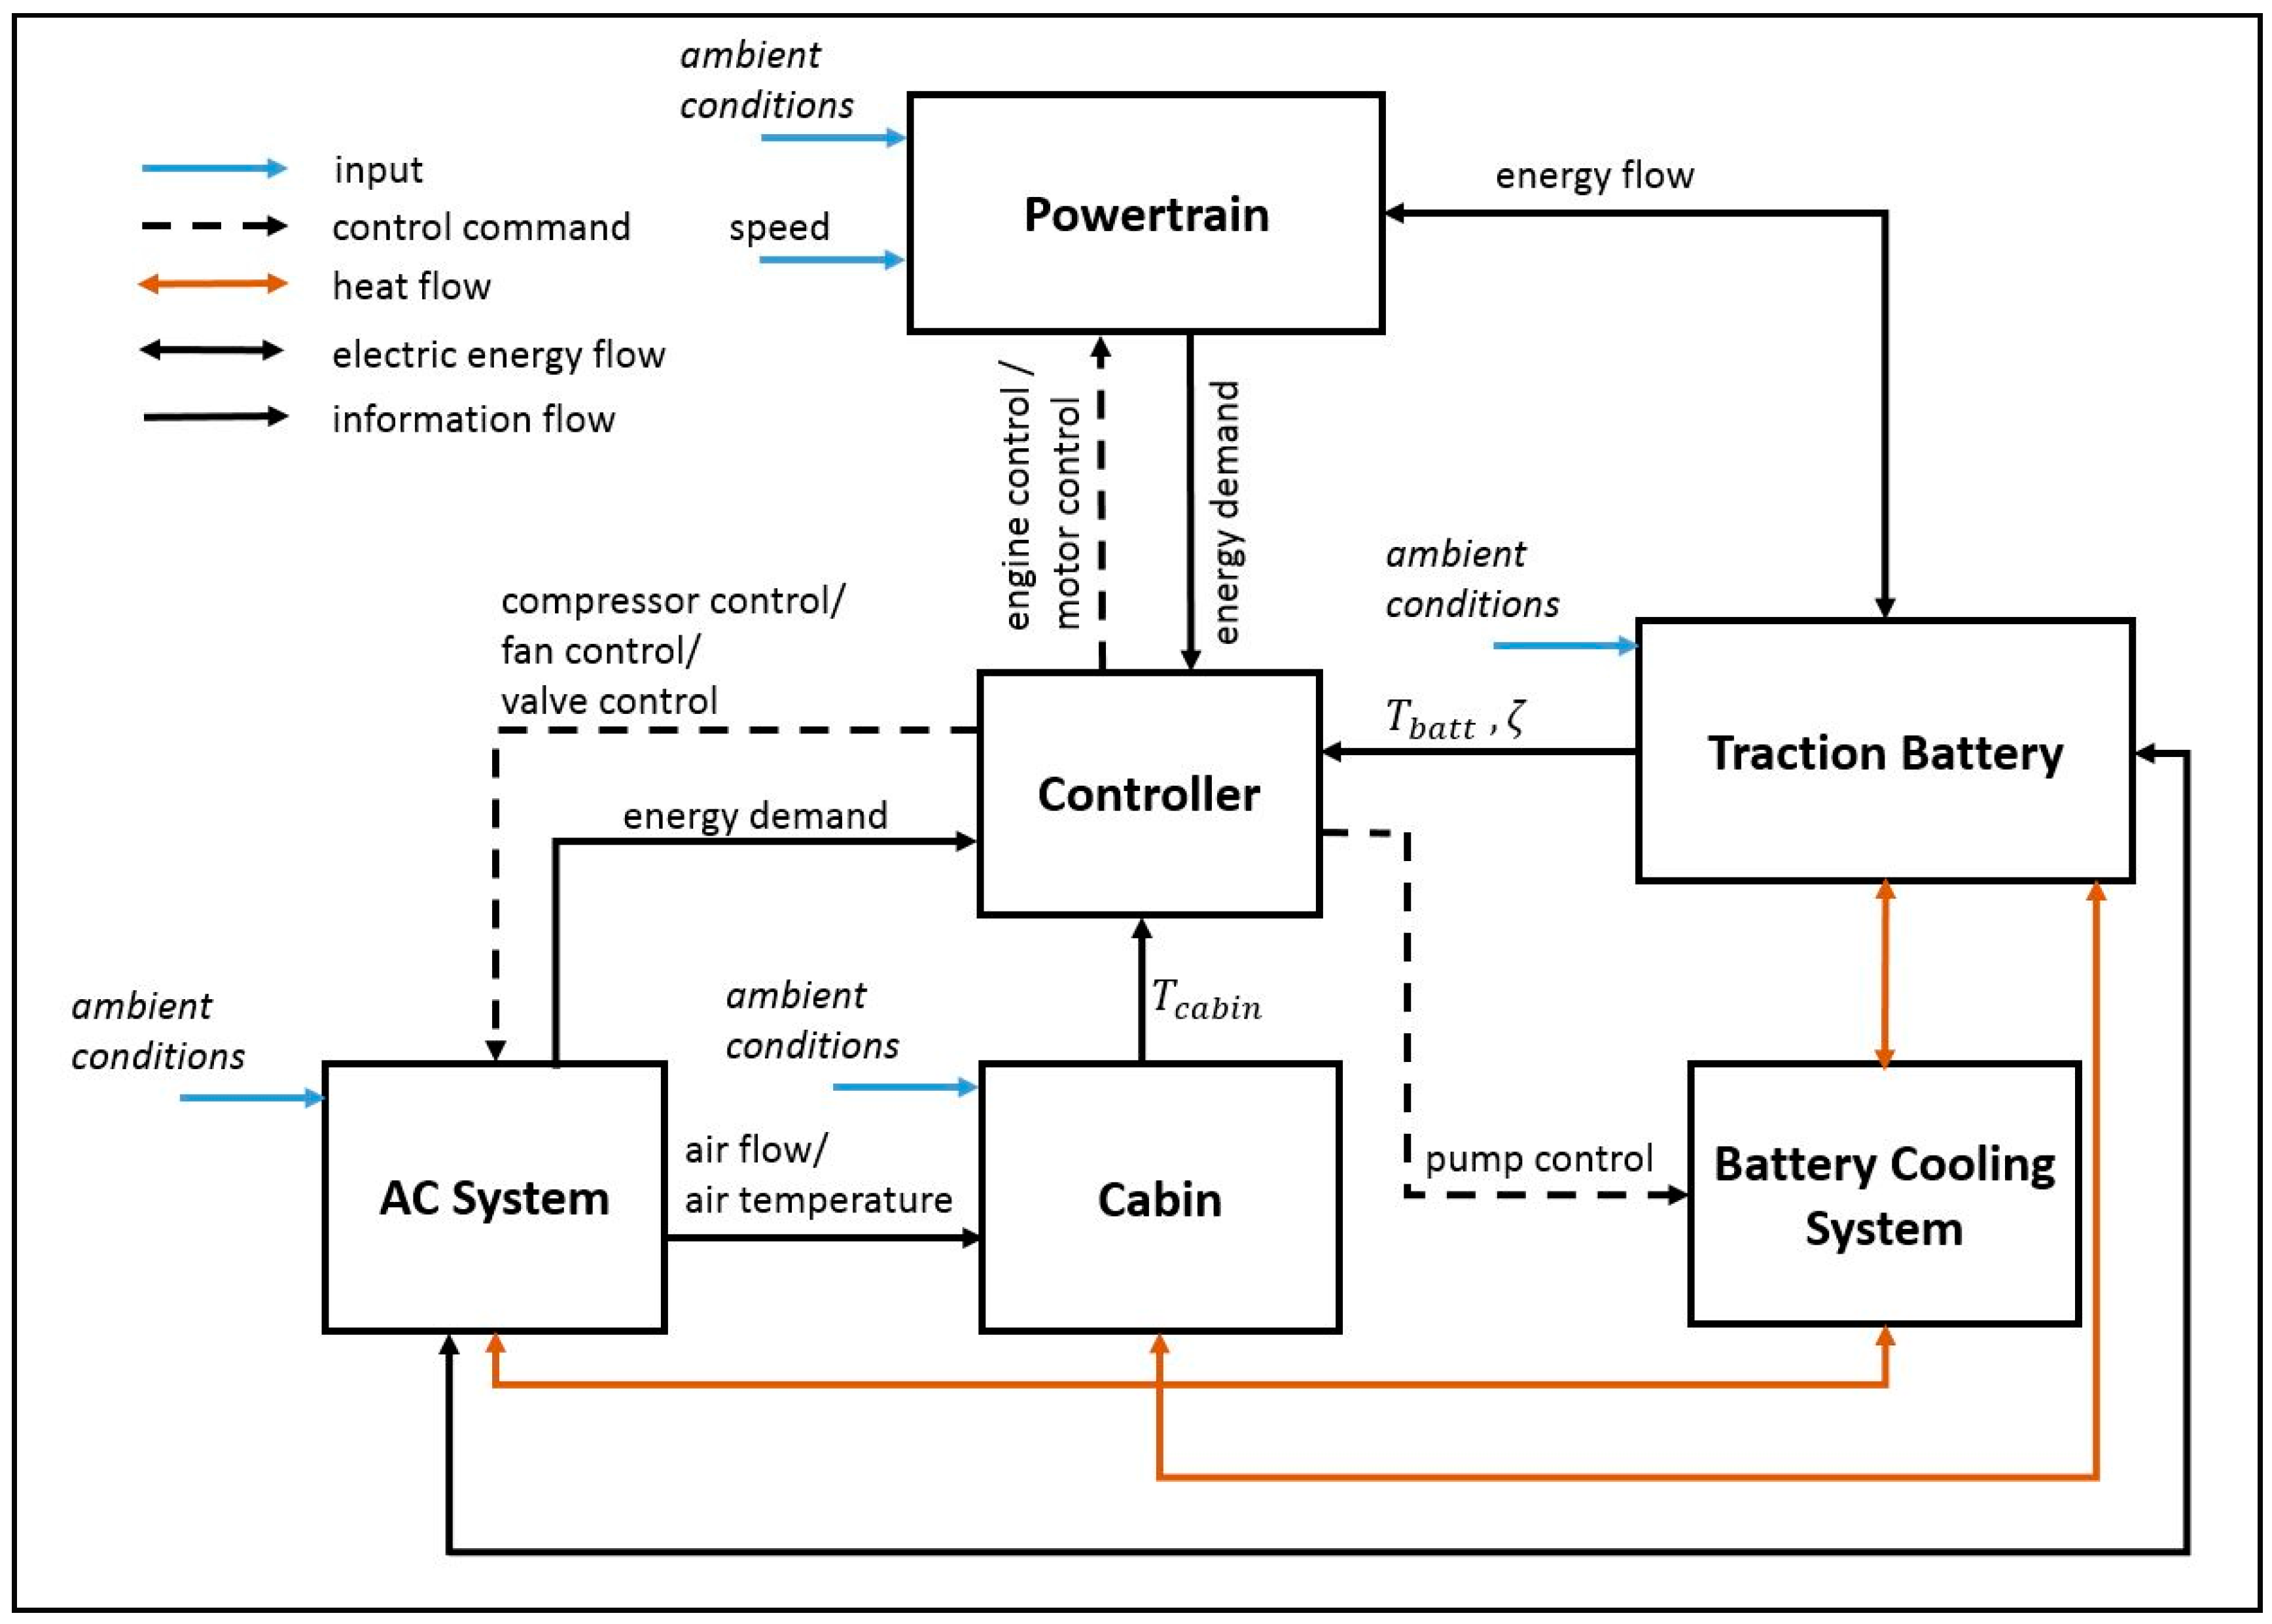
To simulate the duty cycle defined above, a model was developed that represents a commercially available PPHEV with the high-level specifications given in Table 2. The layout of the model is shown in Figure 3. Details of the model and its experimental verification are explained in [52,53]. For completeness, a summary of the key attributes of the model pertinent to the problem considered here is provided below.
The battery cooling system includes a water-glycol coolant circuit that rejects heat to the refrigeration circuit of the AC system. The battery is represented by a lumped parameter thermal mass, and includes an internal heat generation model based on Joule heating [54], as well as heat transfer paths to the coolant, the ambient environment and the cabin. The electrical behavior of the battery cells is represented by a zero-order equivalent electric circuit model [55]. In this model, the open-circuit voltage and the resistance of the cells are calculated from look-up tables. The open-circuit voltage is a function of SoC, while resistance is a function of SoC and temperature. The SoC of the cells is estimated from current, based on the method of Coulomb counting [56]. The cabin model includes lumped parameter representations of the cabin interior (seats, dashboard, etc.) and the enclosed air, as well as the glass and the wall that form the shell of the cabin.
The controller block in Figure 3 includes a set of rule-based algorithms that regulate the operation modes of the powertrain, and those that set the high level set points for the AC and the battery cooling systems. These rules are developed based on the control algorithms of the target vehicle. The key parameters implemented in the rules are given in Table 3. The AC system is controlled to cool the cabin and maintain it at 22 °C during the trips. The battery cooling system is controlled in a thermostatic fashion in the temperature range of 25 °C–30 °C; and is activated during the trips (key-on cooling), as well as when the vehicle is plugged in, that is in Night Park (plugged-in cooling). The control rules include overheating thresholds: the battery power is limited at 50% when the battery temperature exceeds 45 °C and is cut off when the temperature exceeds 50 °C.
The capacity loss of the battery cells of this vehicle has been analyzed in [57,58]. These analyses give the storage capacity loss of the cells for different SoC levels and temperatures. They also give the cycling capacity loss of the cells based on the number of charge-discharge cycles at different temperatures. As a general trend, the data presented in [57,58] show that storing the battery at higher SoC or temperature increases the rate of capacity loss. Furthermore, a higher number of cycles increases the capacity loss, especially when the cells are cycled at higher temperatures. Using these data, the capacity loss of the battery and its lifetime can be calculated as the vehicle undergoes its duty cycle. To achieve this, it was assumed that the total capacity loss of a cell is equal to the sum of its storage and cycling capacity losses [59]. It was also assumed that all cells within the battery pack age at the same rate. Defining the state of the battery as , the capacity loss calculations can be notationally described as below:
Simulating the duty cycle of the vehicle gives the variations in the temperature, the SoC; and the current of the battery. The charge-discharge cycles of the cells can be calculated from the battery current:
and the total time that the battery is stored at any particular condition, as well as the number of cycles at any particular temperature can be calculated. The annual capacity loss of the battery can be then calculated as the sum of the capacity loss in different seasons of the year; and across different phases of the duty cycle. Having calculated the annual capacity loss, the battery lifetime can be determined based on the end of life (EoL) at 30% capacity loss [16,60,61,62]. It is assumed here that the vehicle undergoes the same duty cycle seven times per week. Although this assumption does not strictly apply to most vehicles, it simplifies the simulations without invalidating the subsequent analyses.
4. Baseline Simulation Results
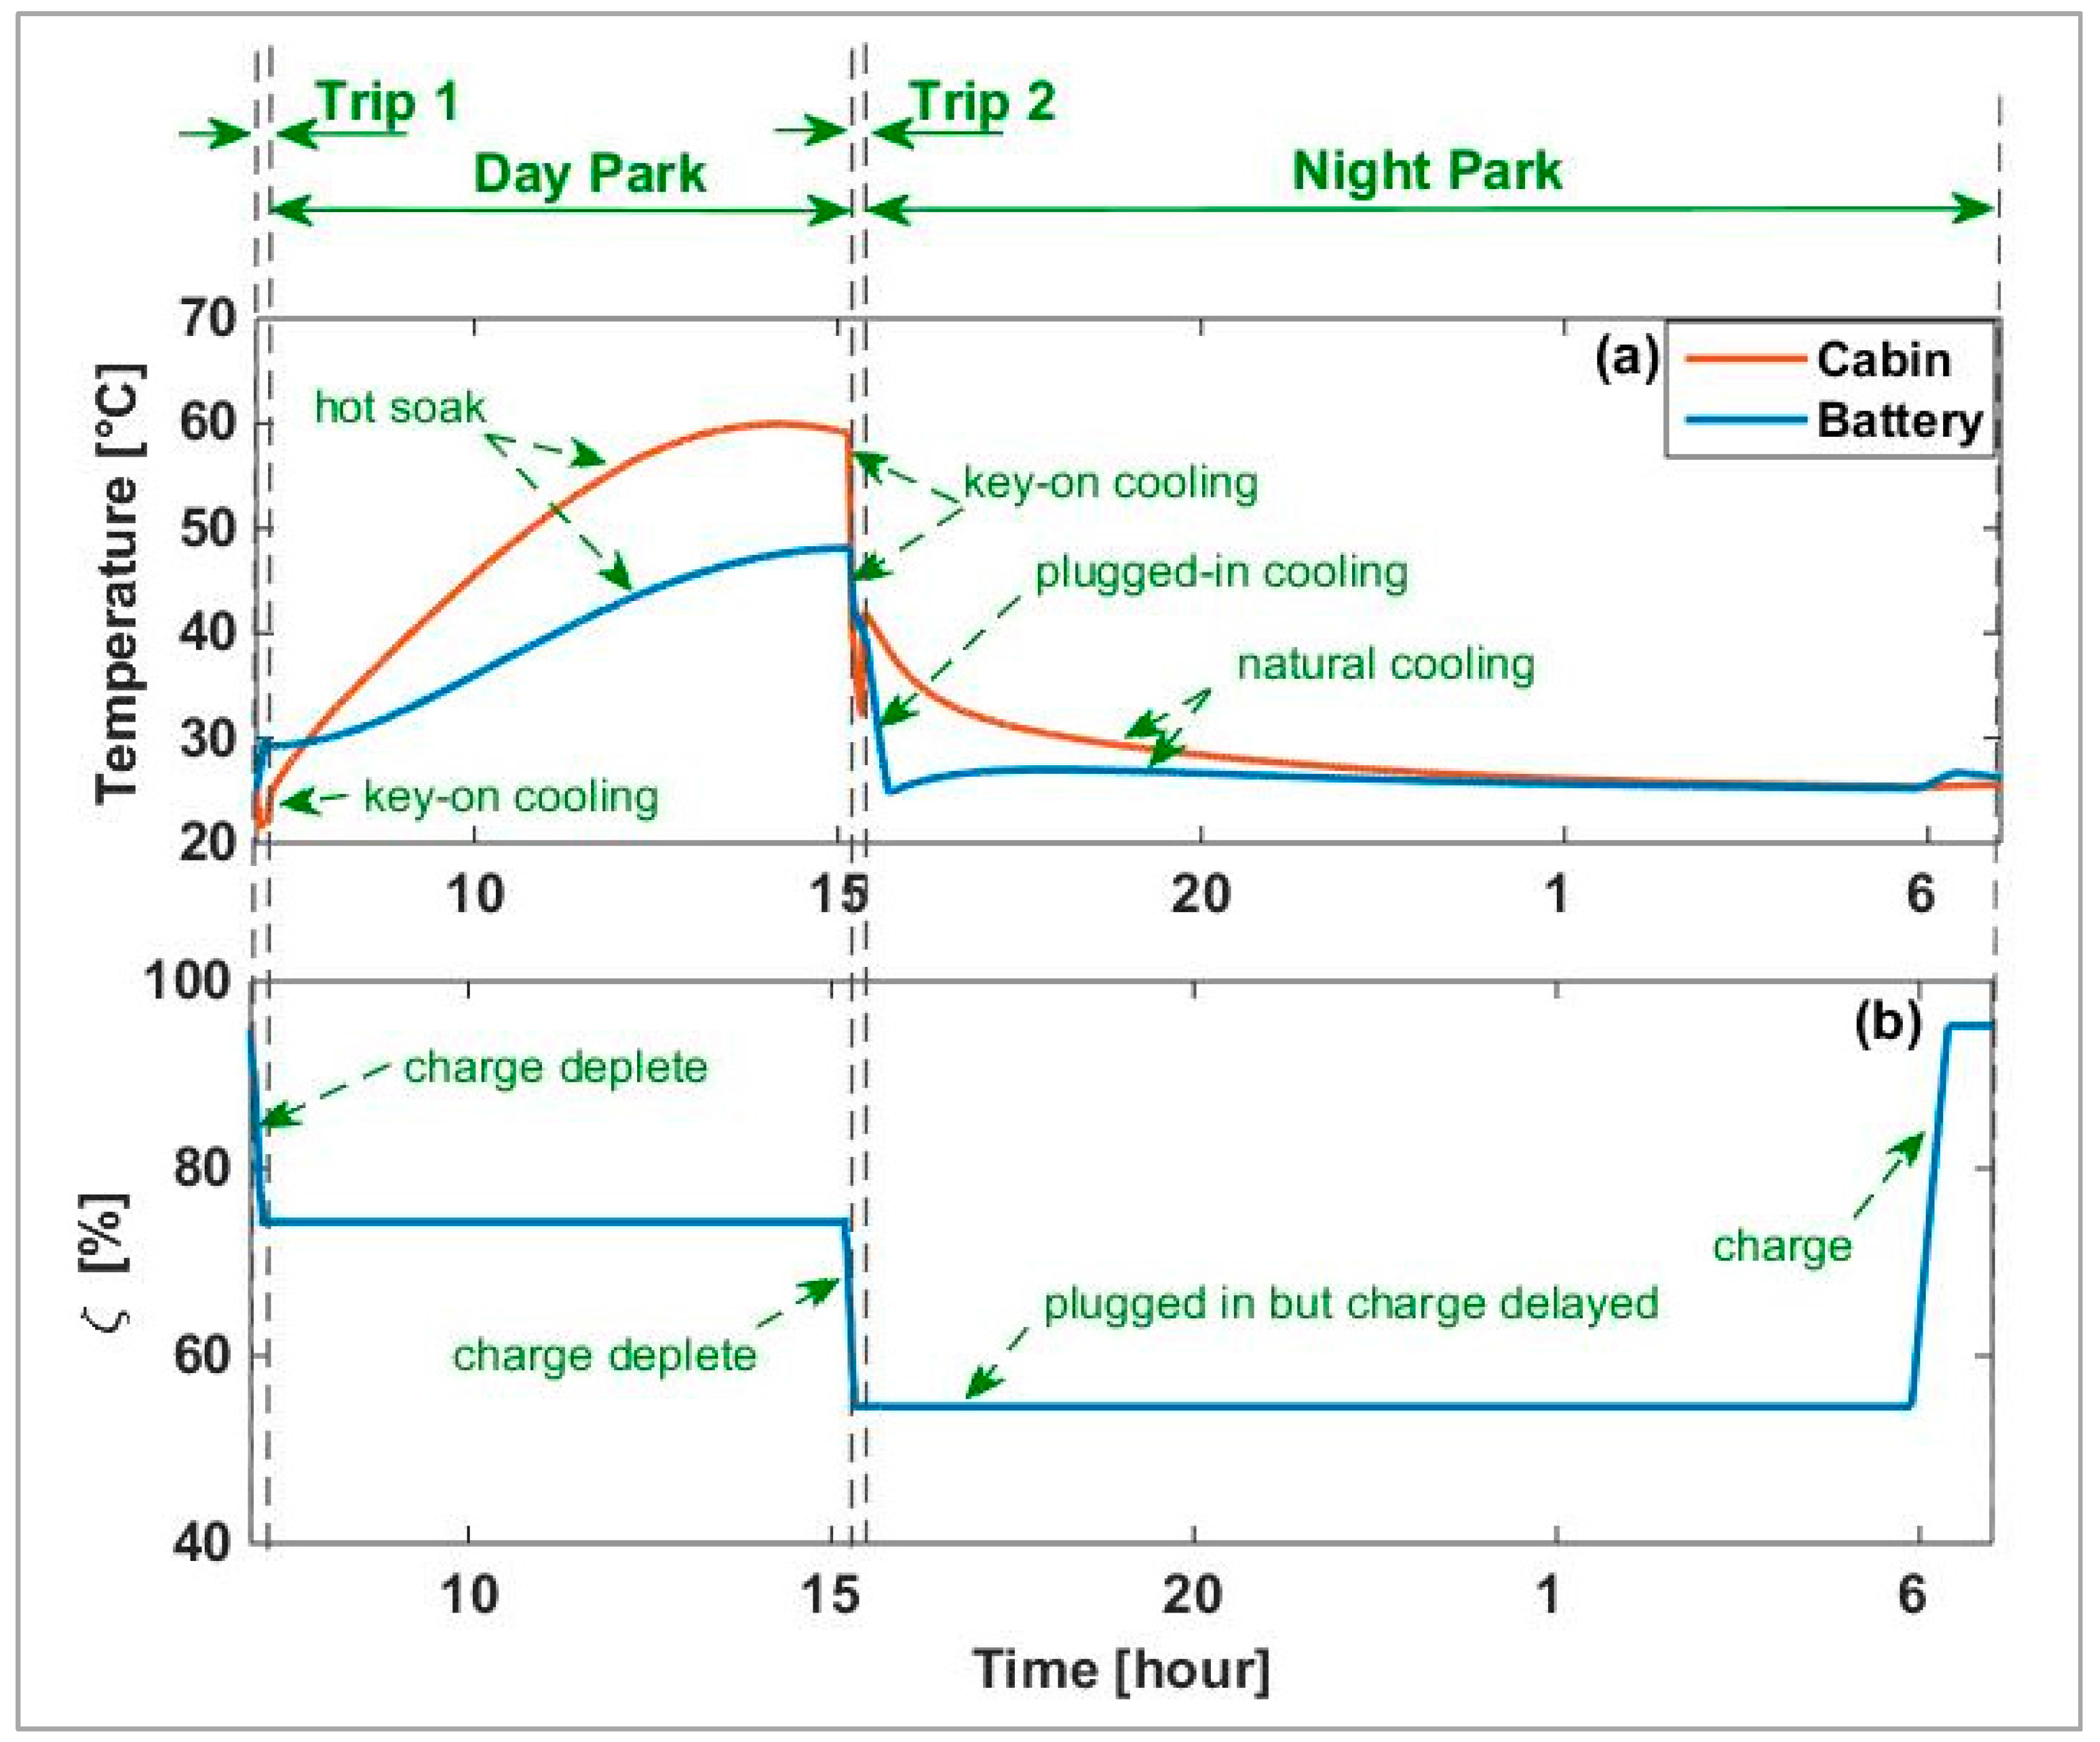
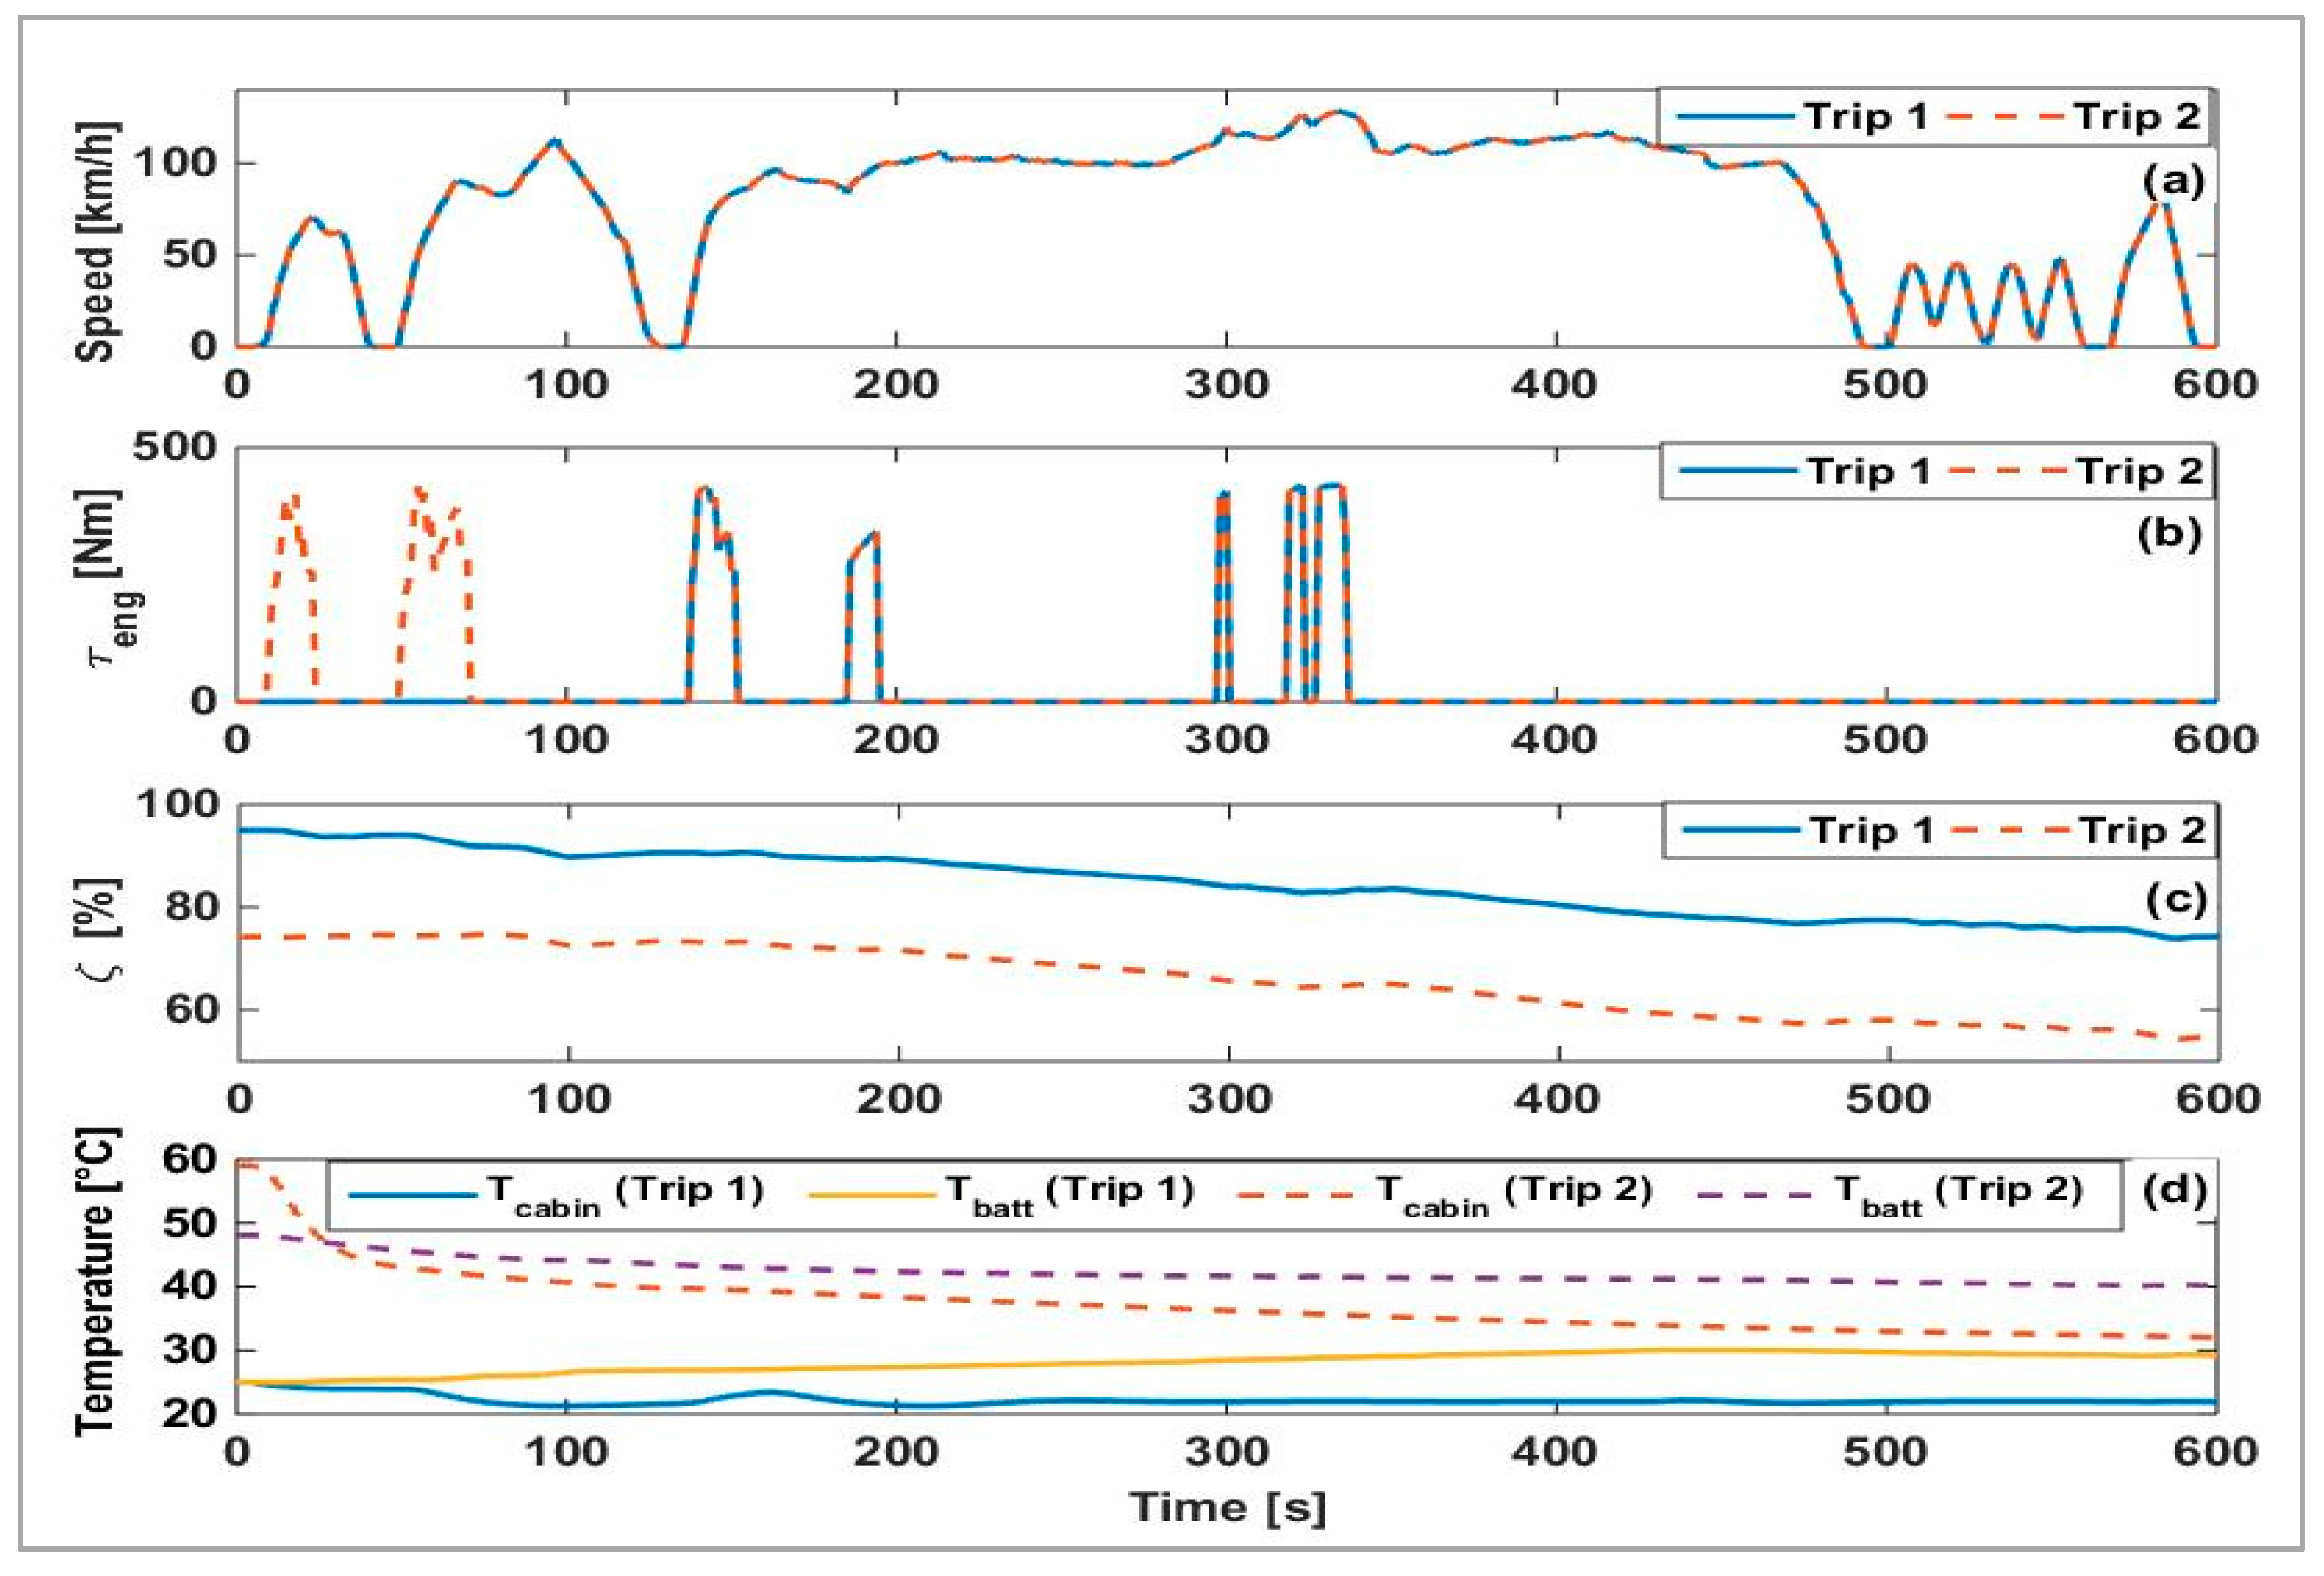
In this section, the result of simulating the vehicle model over the assumed duty cycle will be presented. The variation of the battery temperature during the duty cycle will be demonstrated, and the effect of the battery temperature on the performance attributes of the vehicle will be quantified from the simulation results. Figure 4 shows the daily profile of the vehicle state in summer. These results can be explained as follows:
Trip 1: The cabin and the battery are both initially at 25 °C. During the trip, air conditioning maintains the cabin at 22 °C, while the battery gradually warms up until it reaches 30 °C and cooling initiates. The vehicle operates mostly in CD mode, discharging the battery from 95% to about 74%.
Day Park: Influenced by the ambient conditions, the vehicle undergoes a hot soak. As a result, the temperature of the cabin and the battery rise to 60 °C and 48 °C respectively, while the SoC remains constant. It is worth noting that since six-month average climate conditions are assumed, the simulations do not represent the worst-case scenario.
Trip 2: Air conditioning and battery cooling are applied to cool down the vehicle from hot conditions. Within the duration of the trip, the cabin and battery are only cooled to about 33 °C and 39 °C, respectively. The battery is discharged to about 54% SoC. Considering that the CS operation can commence at 13% SoC, the battery has approximately 40% excess charge over this duty cycle.
Night Park: When the vehicle is parked again, air conditioning terminates. Plugged-in battery cooling is applied until the battery temperature drops to 25 °C. Both the cabin and the battery continue to exchange heat with the ambient environment until they are stabilized at 25 °C. Whilst the vehicle is plugged-in at the start of Night Park, the just-in-time charging strategy [22,63] is applied (i.e., charging is delayed until just before the next trip) to minimize the adverse effect of high SoC on the battery.
4.1. The Impact on Battery Lifetime
Table 4 gives the time average of the battery temperature and SoC, as well as the number of its charge-discharge cycles in each phase of the duty cycle in summer and winter. The seasonal storage and cycling capacity losses are also calculated for each phase, as explained in Section 3. For example, the table shows that in summer Day Park, the battery is stored at an average SoC of 74.6% and at an average temperature of 39 °C, and it is not cycled (the vehicle is key-off and no cooling is applied). Due to the storage conditions, the battery loses 1.07% of its capacity, while the cycling capacity loss is zero. Adding the cycling and storage capacity losses for different phases of the duty cycle in each season leads to 2.72% capacity loss in summer, compared to 2.05% in winter. The total capacity loss in one year is therefore 4.76%, which indicates a battery lifetime of just over six years.
The calculated lifetime is significantly shorter than the eight-year target of most warranty schemes [64]. The calculations in Table 4 indicate that the high battery temperature in summer Day Park is a major contributor to the low battery lifetime. The battery loses more than 1% of its capacity in summer Day Park compared to 0.64% in winter Day Park. The average battery temperature is 14 °C higher in summer Day Park compared to winter Day Park, while the SoC levels are similar. A similar difference also occurs in peak temperatures (not given in Table 4). The variability of battery lifetime with geographical location can be highlighted here: if the climate conditions of the winter season, which is not particularly mild, were to apply year-round, the battery could last one year more. Key-off cooling in Day Park can be beneficial to the battery if it does not lead to a disproportionately high cycling capacity loss.
4.2. The Impact on Fuel Consumption
Allowing the battery temperature to rise above 45 °C in Day Park limits the electric traction capability of the vehicle. Given that limited time is allowed for natural cooling prior to Trip 2, and that the US06 drive cycle starts aggressively, limited electric traction capability leads to high fuel consumption in Trip 2. This can be better explained with the help of Figure 5 in which more details about the two trips of the vehicle are shown. Despite having identical drive cycles, the vehicle operates differently in the two trips. In Trip 1, the vehicle operates mostly in CD mode, depleting about 21% of the battery charge, with the engine starting several times in the high power-demanding parts of the drive cycle, as expected from a PPHEV. Furthermore, the cabin is maintained at its set point while the battery temperature gradually rises until cooling is initiated.
In Trip 2, with the battery initially overheated, the vehicle is forced to enter hybrid mode (engine is used) in the first 100 s of the trip, despite having adequate battery charge (compare the engine torque profiles in Figure 5b). Once the battery is sufficiently cooled, the engine operates in a similar fashion to Trip 1, the battery is gradually discharged and its temperature continues to fall. Therefore, due to the high battery temperature at the start of Trip 2, the vehicle consumes approximately 0.37 liters of fuel in Trip 2 (67.5 liter per season), compared to approximately 0.23 liters in Trip 1 (41.7 liter per season). Enabling key-off cooling allows key-off pre-cooling of the battery for Trip 2 or maintaining a low battery temperature will eliminate the extra fuel consumption in Trip 2.
4.3. The Impact on Thermal Comfort
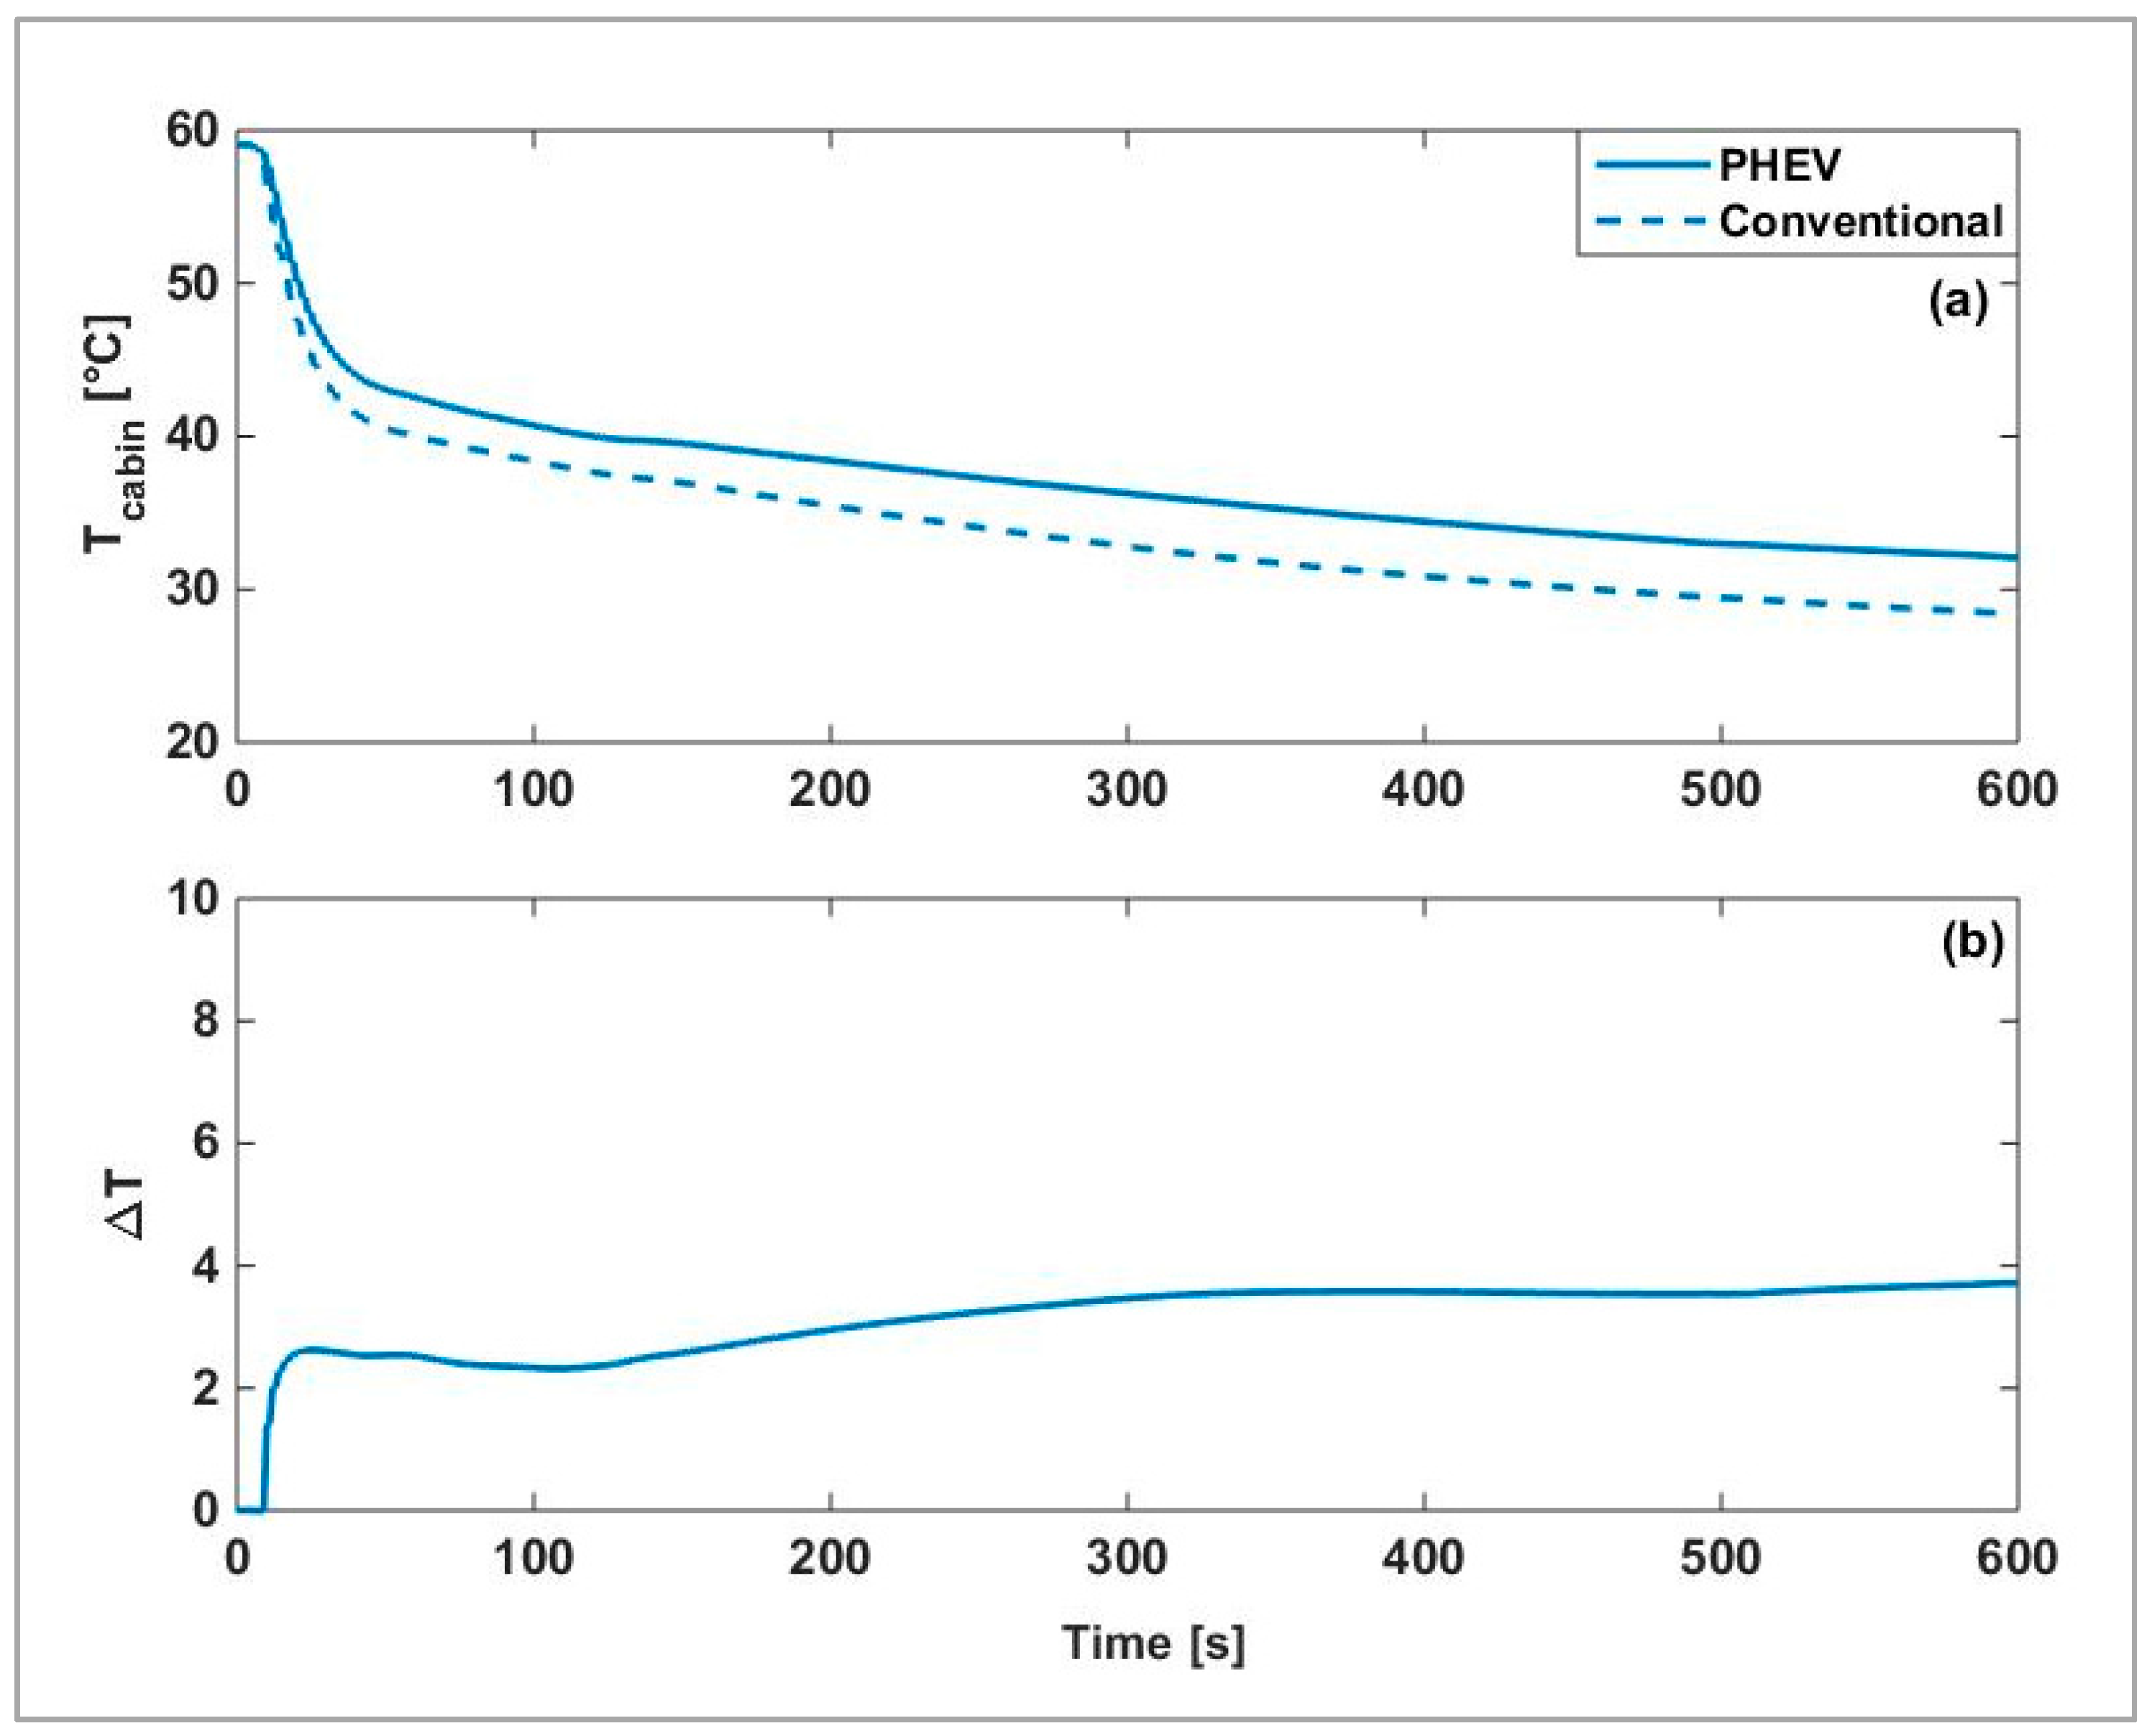
High battery temperature also negatively affects the passengers’ thermal comfort. Figure 5d shows that in Trip 1 the average cabin temperature is maintained close to its set point, implying a thermally comfortable cabin. However, following the hot soak in Day Park, the thermal load of the cabin in Trip 2 is so high that it does not cool down to its set point within the duration of the trip. As such, allocating a part of the available cooling power of the refrigeration circuit to the battery deteriorates the thermal condition of the cabin. Figure 6 compares the conditions of the cabin of the PHEV in Trip 2 to that of an equivalent conventional vehicle in similar circumstances. Although the cabin remains hot throughout the trip even in the conventional vehicle, the cooling load of the battery in the PHEV leads to a higher cabin temperature by up to approximately 4 °C.
To quantify this impact, the discomfort index of the PHEV is defined here as the increase in the cabin average temperature due to the existence of the battery in the vehicle, as:
In the above equation, and are the time histories of cabin temperature in the PHEV and the conventional vehicle, respectively. is primarily applicable to Trip 2 since the cooling demand of the cabin in Trip 1 is low, making the impact of cooling the battery negligible. is a positive integer, with an ideal value of zero which indicates that the PHEV cabin is cooled at a rate similar to, or faster than, the conventional vehicle cabin. Precooling the battery for Trip 2 can help minimize the thermal discomfort by reducing the need for key-on battery cooling. In the ideal case, the battery can be precooled sufficiently to shift its cooling load to after Trip 2 (i.e., to Night Park). It is worth noting that precooling the cabin can further improve thermal comfort, but requires significantly higher energy [33] and addressing it is beyond the scope of this paper.
4.4. Summary of the Simulation Results
Table 5 summarizes the performance attributes of the vehicle based on the results discussed above. It can be inferred from the simulation results that the benefits of key-off cooling extend beyond its potential for reducing the capacity loss resulting from the high temperature in Day Park, to attributes such as fuel economy and thermal comfort. However, allocating the energy of the battery to key-off cooling increases cycling ageing which can negate the benefit of cooling, and it reduces the EDR which can worsen the fuel economy. Therefore, determining the appropriate key-off cooling strategy is a non-trivial task that requires solving an optimal control problem considering all the implications mentioned above. The following sections of this paper address this problem. Table 5 summarizes the key aspects of the simulation results discussed so far. These values will be considered as the baseline in the forthcoming discussions.
5. Optimal Control Statement for Key-Off Cooling
For simplicity, it is assumed in this work that key-off battery cooling takes place at maximum cooling power. Therefore, to control key-off cooling, it will be sufficient to control a flag command (binary control input indicating cooling on/off). A key-off cooling flag of “1” will be translated as the refrigeration system working at maximum power and the cooling pump switched on, while a flag of “0” indicates a passive system. With the above assumption, the number of the charge-discharge cycles, , in Day Park, is related to the cooling flag, . Therefore:
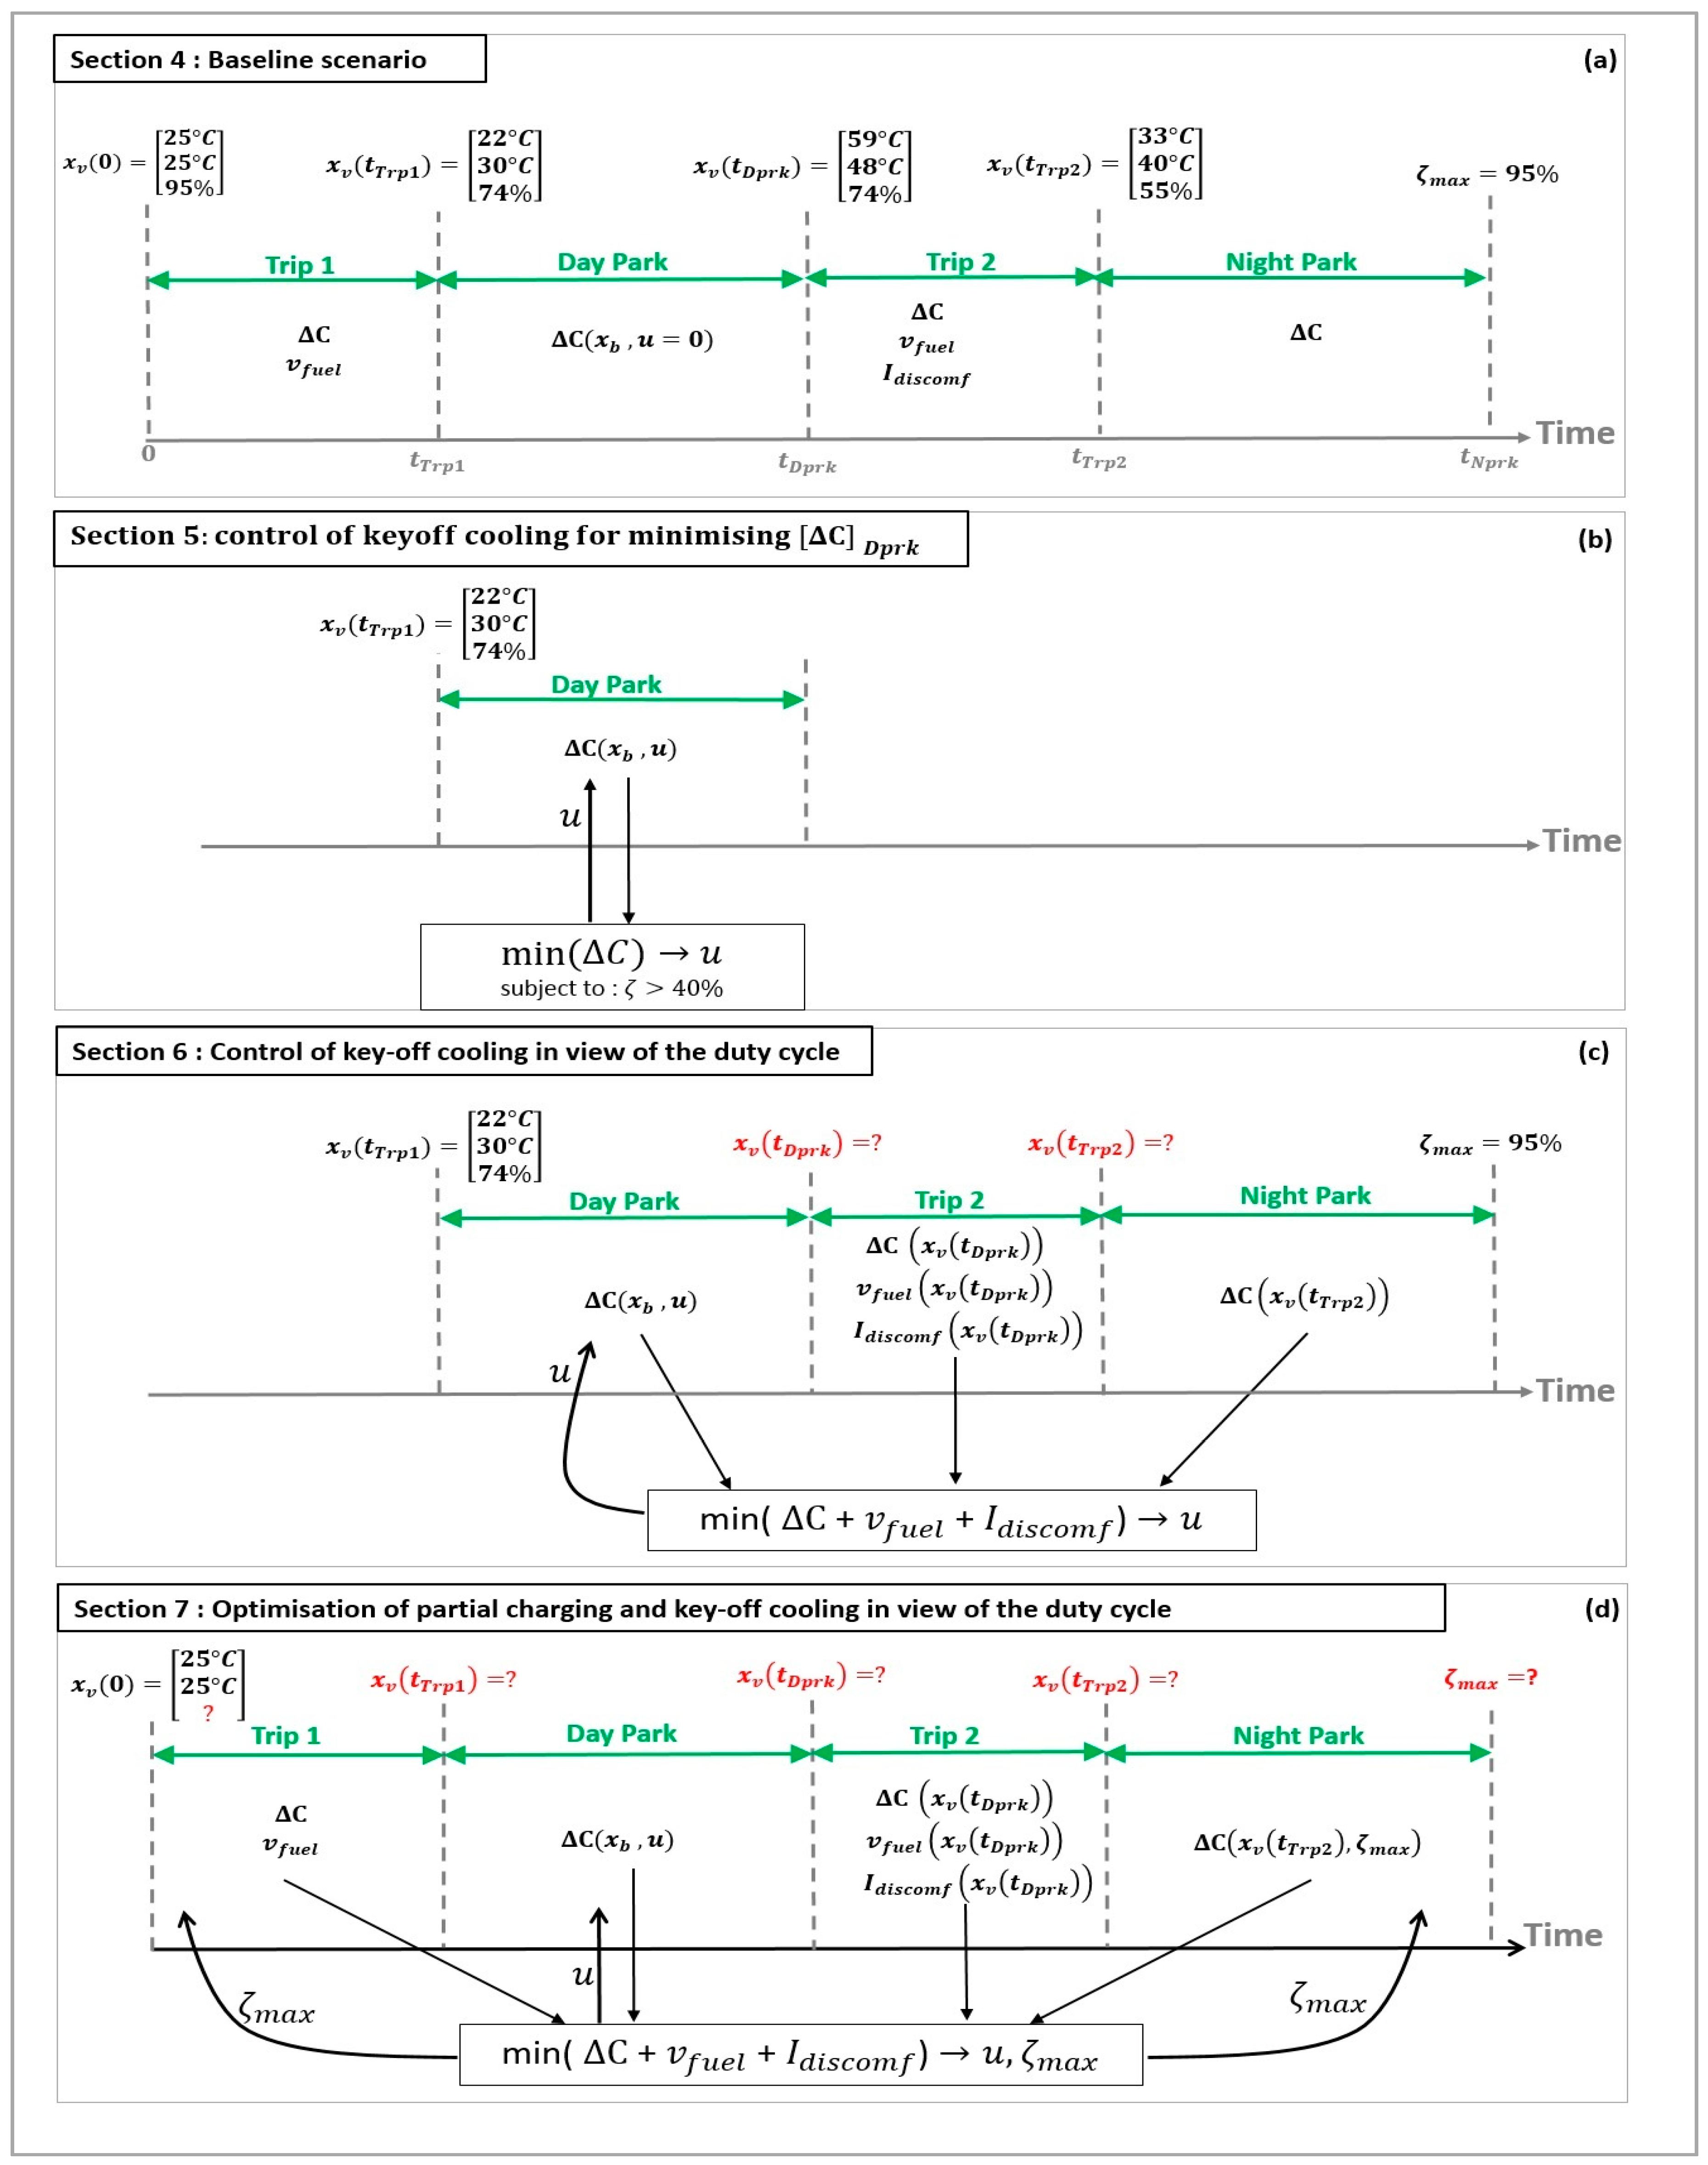
Key-off cooling of the battery can be defined as an optimal control problem in which the aim is to find the optimum cooling flag trajectory. Here, to address all aspects of the problem, the formulation will be developed in three steps, within the remainder of the current section, as well as in Section 6 and Figure 7 shows the focus of each section and its relation to the baseline simulation results presented in Section 4. In the remainder of the current section, key-off cooling is optimally controlled to minimize Day Park capacity loss, ignoring the other phases of the duty cycle. This solution is expanded in Section 6 by considering the effects of key-off cooling on the performance attributes of the vehicle in Day Park and the subsequent phases of the duty cycle. In Section 7, optimization of partial charging and its integration with optimal key-off cooling is discussed.
To enable a numerical solution for the optimum control problem, the duration of Day Park is divided to into N intervals of seconds, and the cooling flag is assumed to be piece-wise constant, changing only at instances . Hence, the total capacity loss in Day Park is the sum of the capacity losses over all N intervals:
The trajectory of the optimum cooling flag ( is the solution of a minimization problem of the following form
The first term on the right-hand side (6) of is the arc-cost, which results from progression through consecutive time intervals, while the second term depends on the state at final time and is referred to as the terminal cost. The above problem can be solved with dynamic programming (DP) which is a common method for solving optimal control problems numerically [65,66,67]. To achieve this, the terms on the right-hand side of (6).
Should be evaluated for a grid of the vehicle states. To account for every possible scenario, the following range was assumed for the vehicle state:
, , and in the state grid were discretized into steps of 1 °C, 2% and 2 °C, respectively. For discretization in time, increments of 240 s (4 min) are assumed. It is worth noting that the boundaries of the state grid act as hard constraints for the solution of DP.
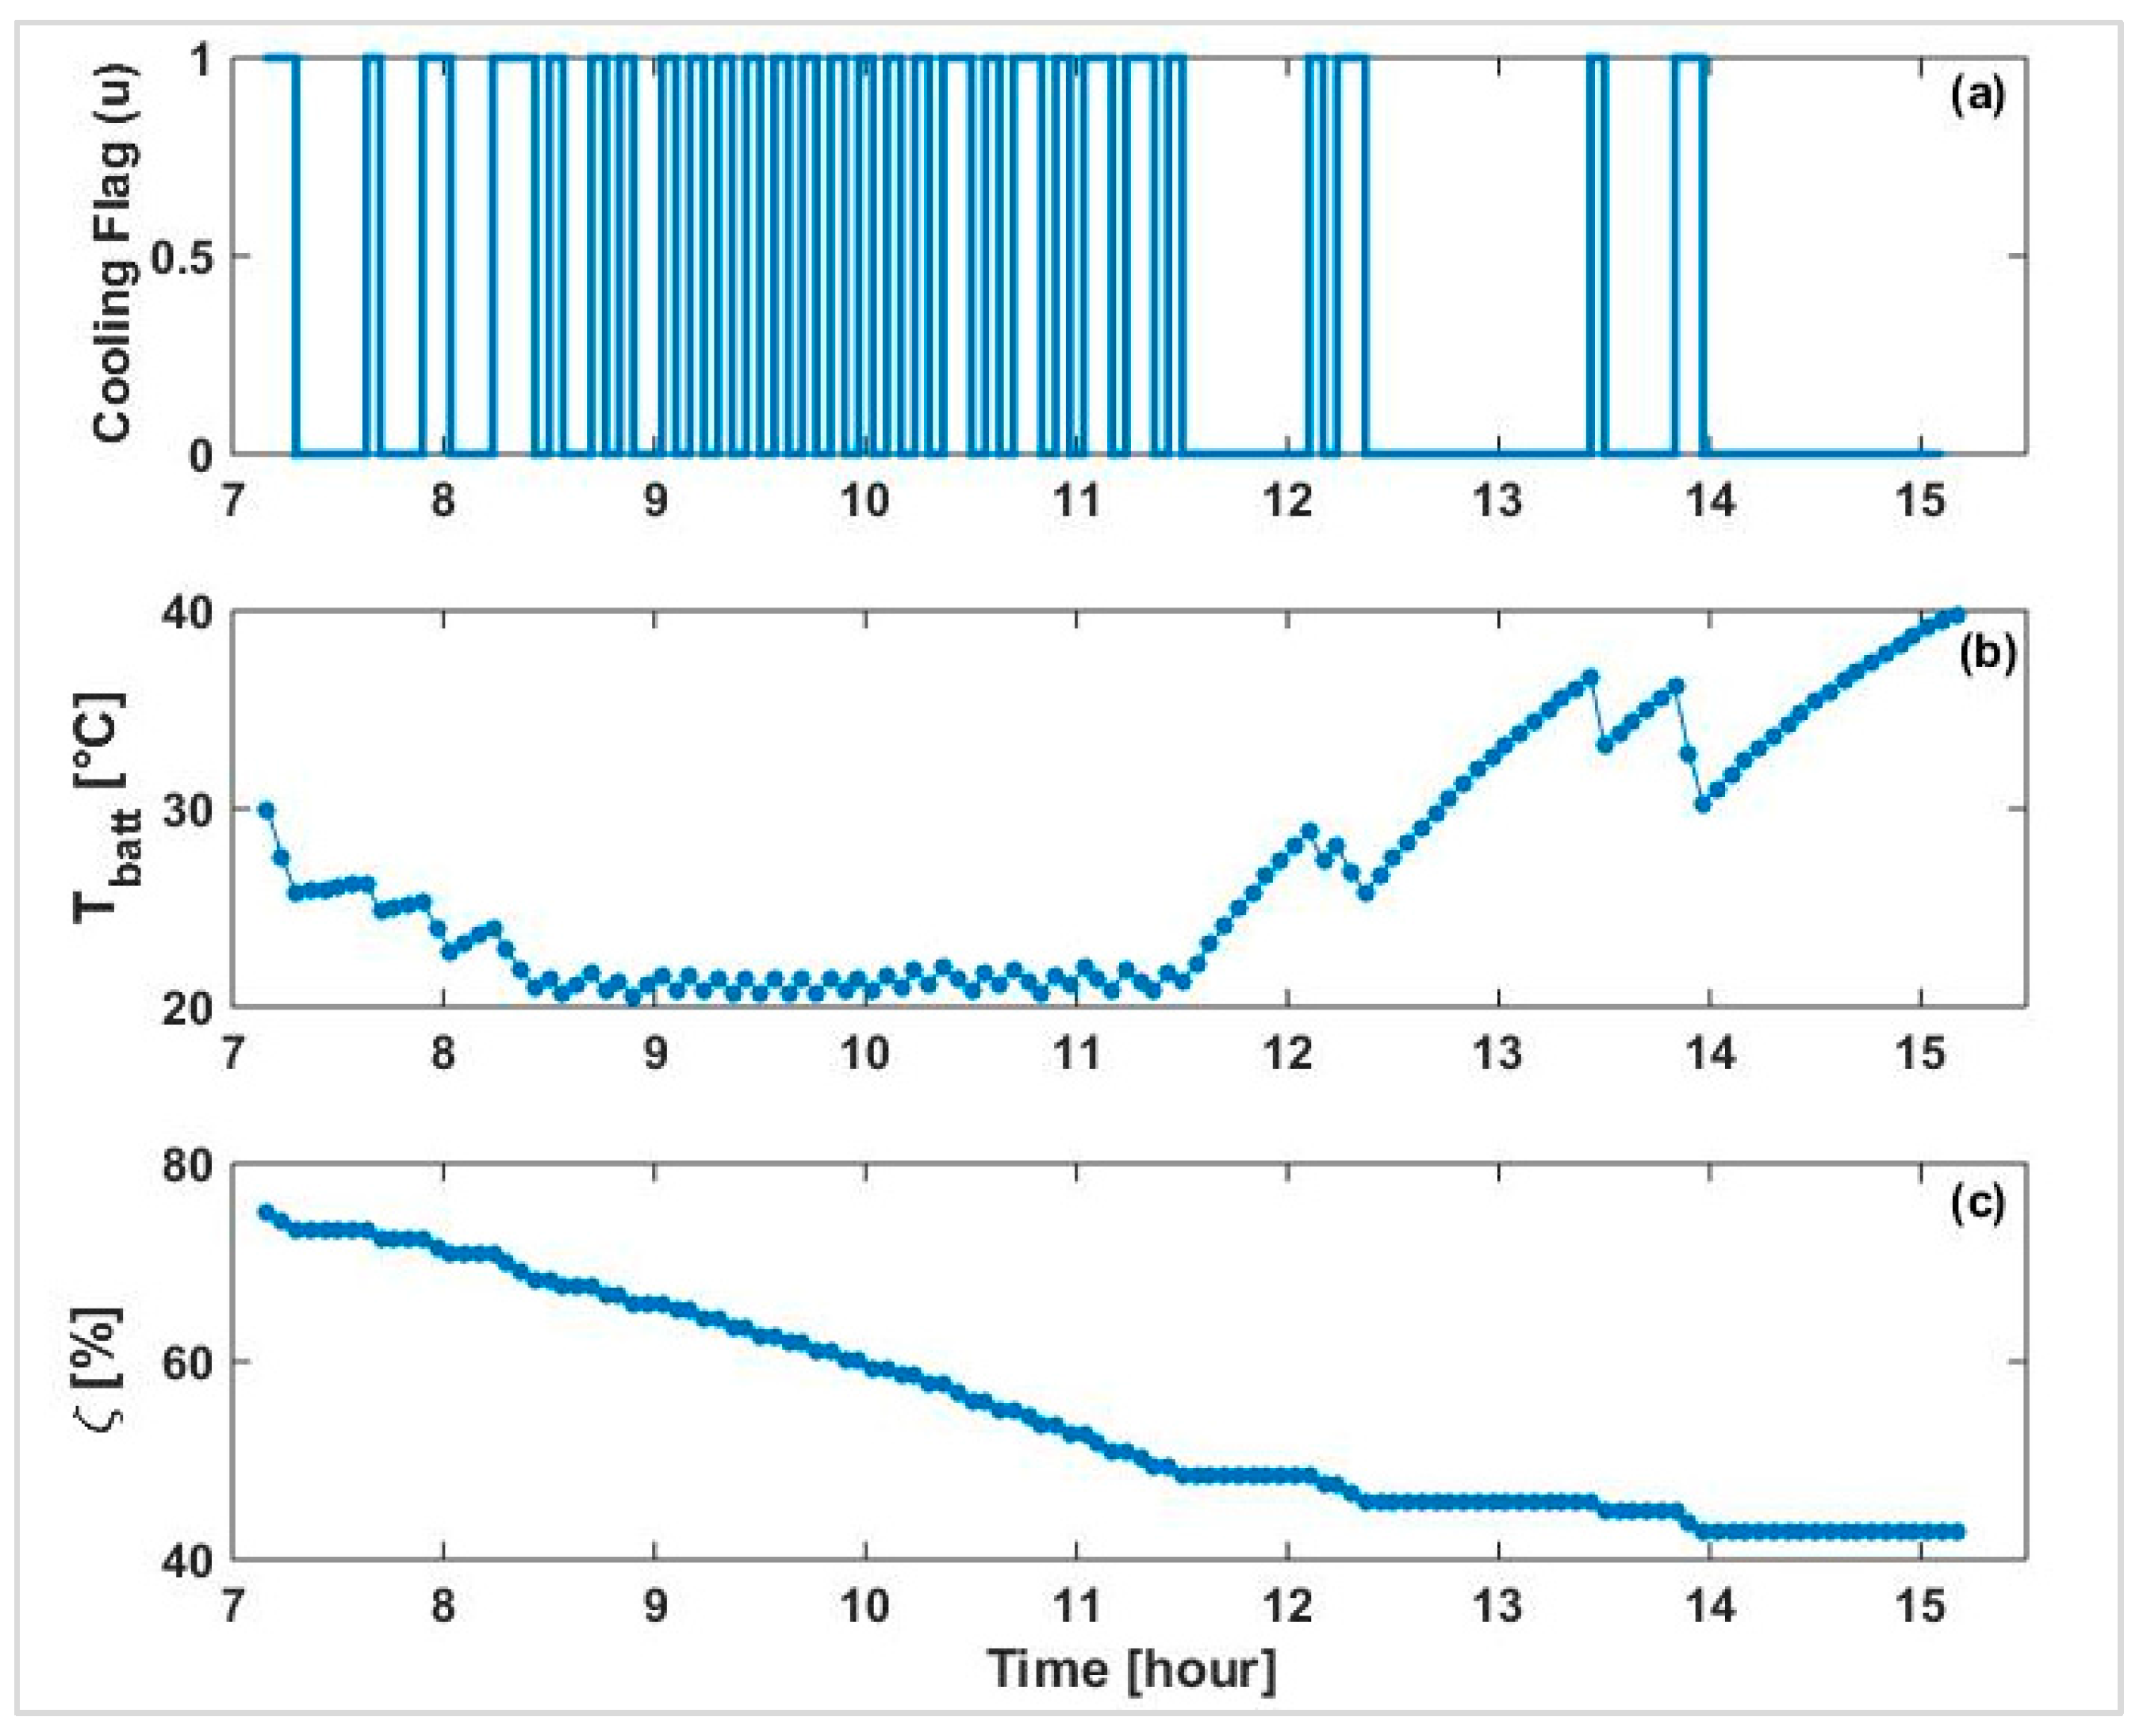
The definition of in (6) has a high significance. For an initial examination of the behavior of the optimization algorithm, consider controlling key-off cooling only to minimize the capacity loss in Day Park, (without accounting for any subsequent phase of the duty cycle nor other performance attributes). can be defined as a lower SoC limit, for example 40%:
Figure 8 shows the trajectories of the cooling flag as well as the temperature and the SoC of the battery achieved from solving (6) considering (8) and the initial condition of . Since charge is abundant, cooling is applied both to cool the battery and to spend the excess charge in order to minimize the storage capacity loss, as long as the resulting cycling ageing does not negate the benefits. Examining Figure 8 and refereeing to Figure 2 and Figure 4, three trends can be identified. First, during the morning hours when the heat gain from the ambient environment is comparatively low, a mild level of cooling is applied to maintain the battery in the range of 23 °C–25 °C. Second, cooling intensifies when the SoC drops below 70% (at approximately 8 a.m.). This is because the capacity loss in the battery cells is highest in the SoC range of 50–70%, according to the dataset implemented in the model [57,58]. Therefore, the cooling decisions are dominated by the tendency to discharge the battery below 50% SoC. Note that the lower boundary of the battery temperature in the state grid (i.e., 20 °C) is observed. Third, continuing to the afternoon hours when the heat gain from the ambient environment and cabin is high, it becomes increasingly inefficient to maintain a low temperature. Therefore, the cooling is targeted at keeping the battery temperature below 40 °C.
The impact of controlling key-off cooling as above on the battery can be inferred from Table 6. Key-off cooling has noticeably reduced the storage capacity loss while leading to a small cycling capacity loss. The effect of key-off cooling on the subsequent phases of the duty cycle will be discussed in the following section.
6. Optimal Control of Key-Off Cooling in View of the Daily Duty Cycle
In view of the daily duty cycle of the vehicle, improving the fuel economy, the battery lifetime and the thermal comfort can be considered as the objectives of key-off battery cooling. This can be achieved through minimizing a cost function composed of the weighted sum of three cost terms: the fuel consumption, the capacity loss and the thermal discomfort index as:
in which is the relative weighting of the cost terms. All terms in (9) depend, among other factors, on how the vehicle is controlled during Trip 2. Since the focus here is on key-off control, it was assumed that the key-on control strategies of the vehicle were already optimized. In other words, the powertrain and cooling are optimally controlled in the trips, for any given initial conditions. This assumption enables defining the cost terms as a function of vehicle states. As shown in Figure 7c, can be written as:
which states that the fuel consumption in Trip 2 depends on the state of the vehicle after the Day Park, . Similarly, the capacity loss in Trip 2 depends on . In the Night Park, given that plugged-in cooling controls the battery temperature, the capacity loss is a function of the remaining battery SoC after Trip 2, which only depends on . Therefore, in (9) can be written as:
where capacity loss in Day Park is replaced from (5). The discomfort index also depends on :
The problem described by (9) can be reformulated in form of (6)
for which the terminal cost is derived from (10)–(12) as:
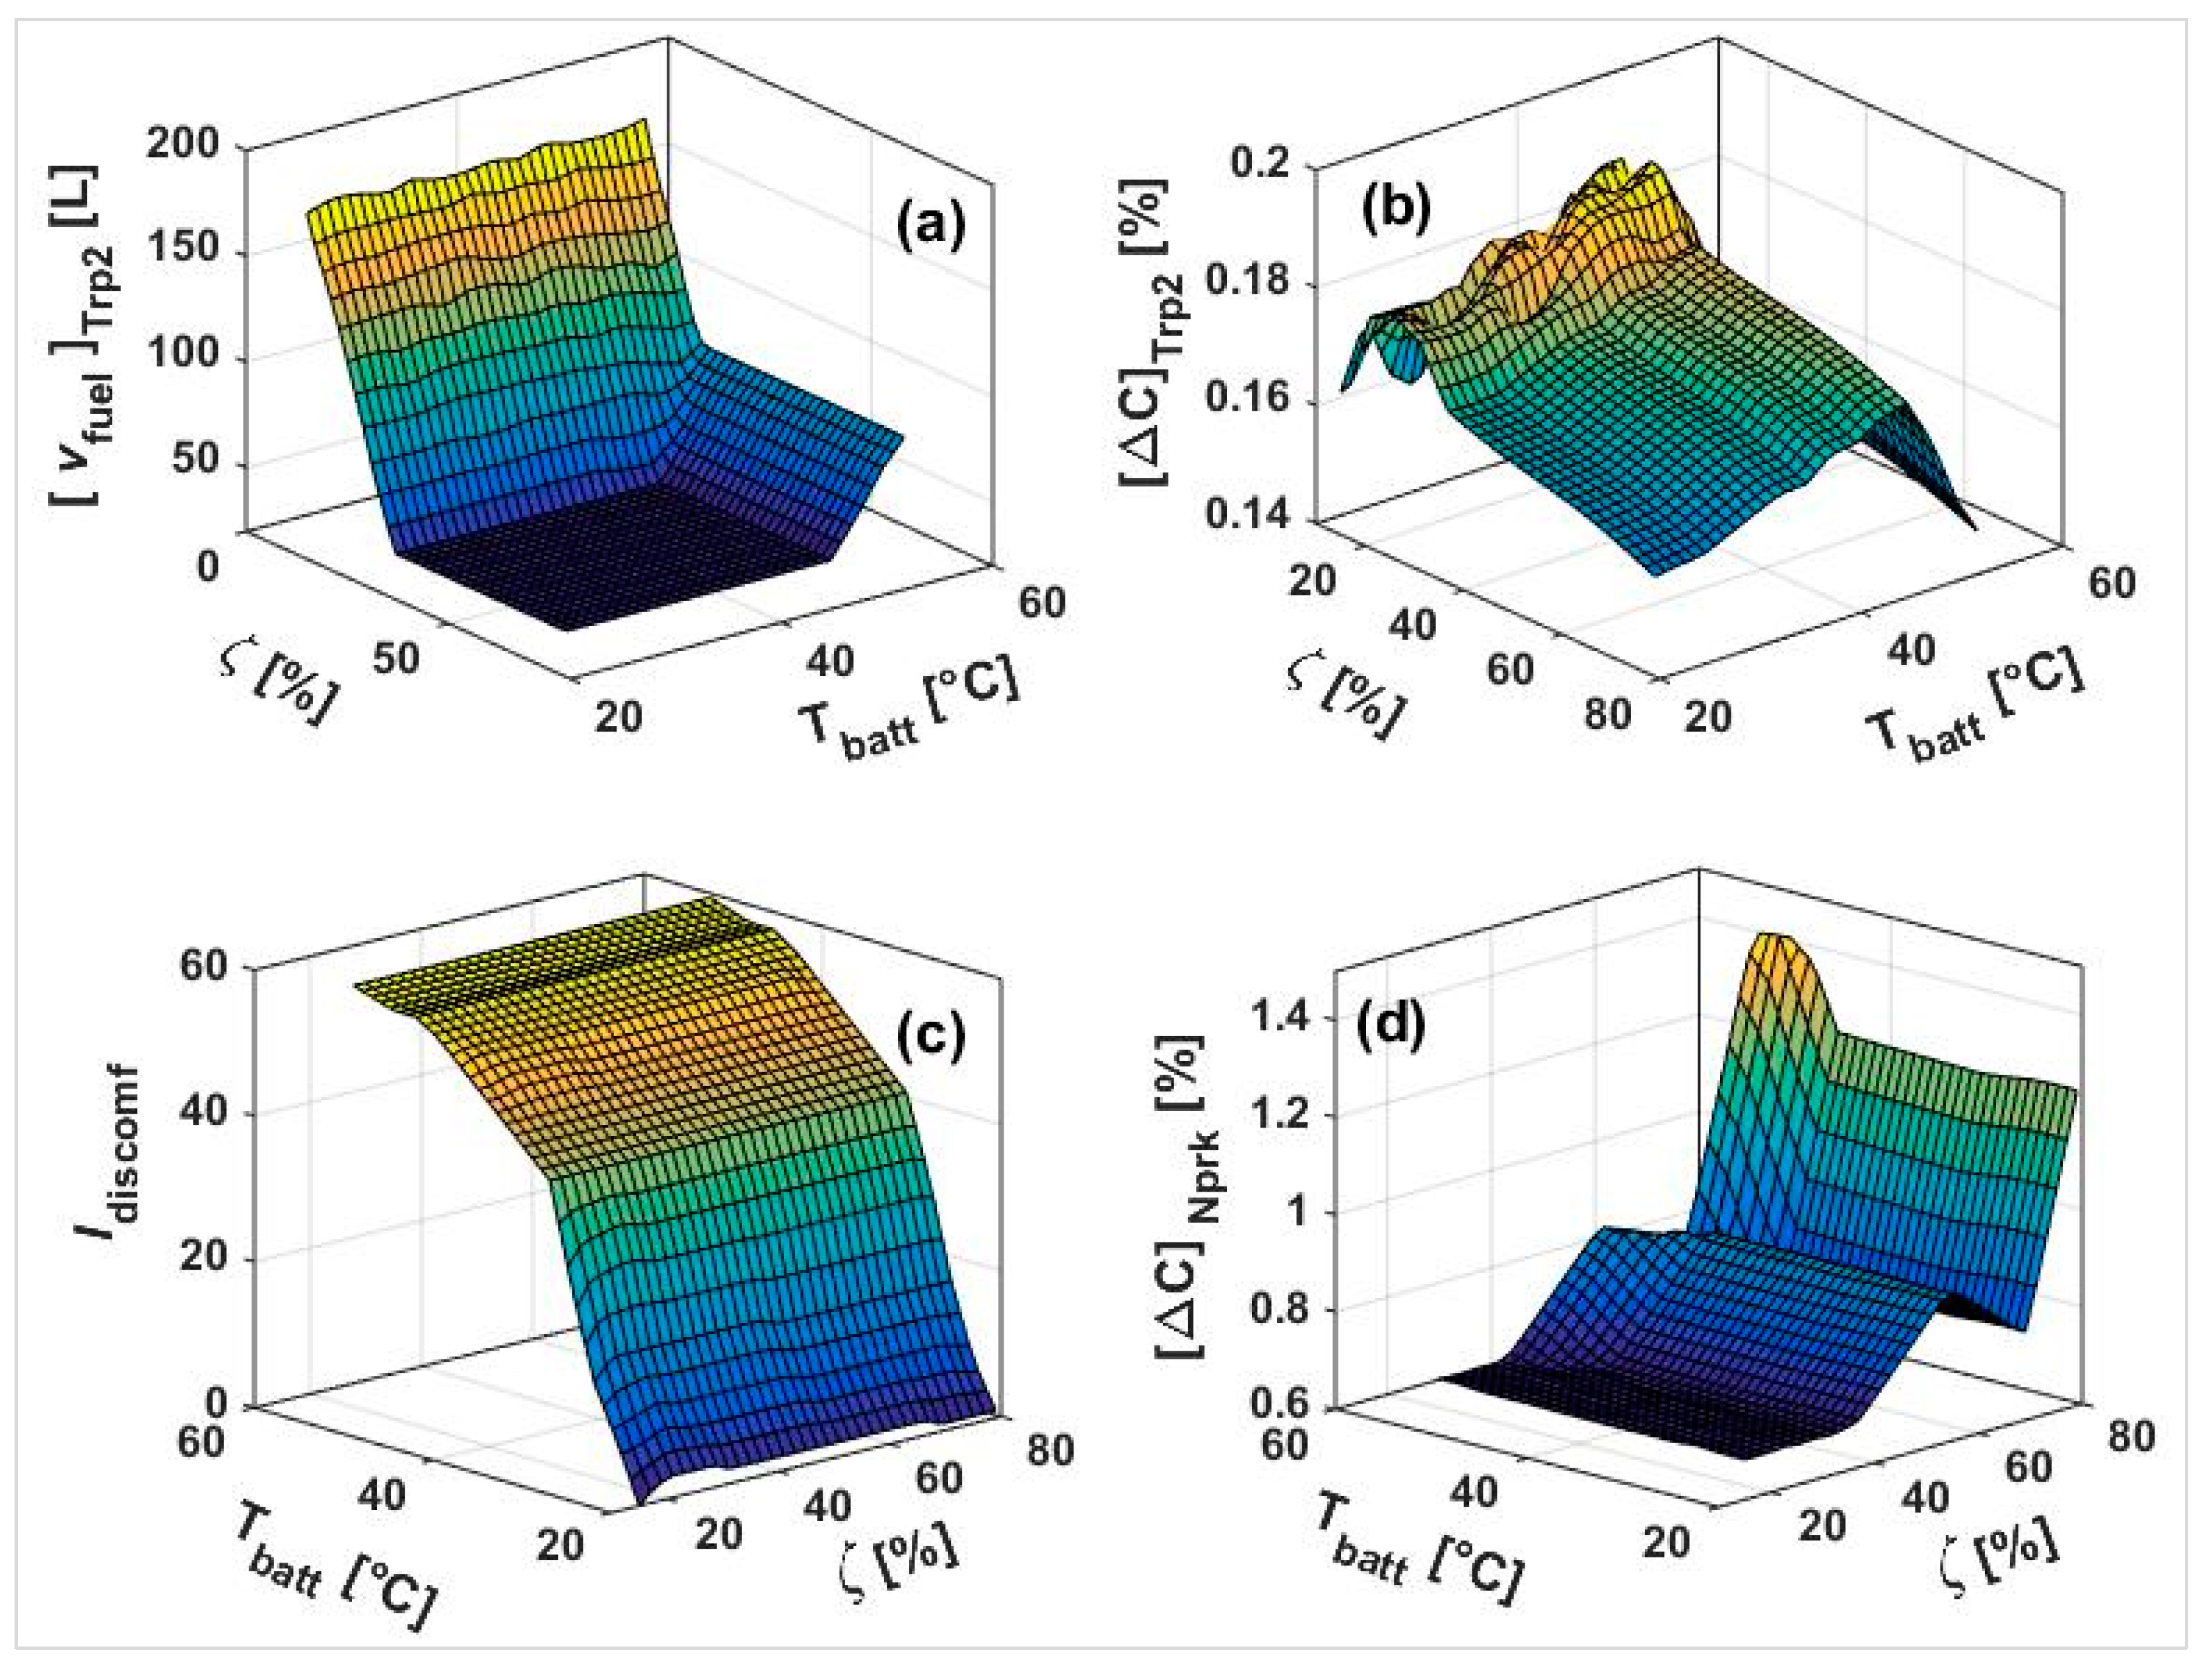
Solving (13) with DP requires a priori knowledge of the terminal cost that results from each value of within the state grid. In other words, the effect of on the cost terms over Trip 2 and the Night Park should be evaluated in advance. To achieve this, Trip 2 and the Night Park were simulated for all possible values of as initial state. The cost terms were then evaluated and mapped onto to evaluate (14). As an example, Figure 9 shows the resulting maps for a cabin temperature of 60 °C at the end of Day Park.
Figure 9a shows the fuel consumption in Trip 2, which has a non-zero value. The fuel consumption gradually increases as the initial SoC reduces below 50% (due to entering CS operation) or as the battery temperature increases above 45 °C (due to reduced electric traction capability).
Figure 9b shows the capacity loss in Trip 2. When the initial SoC is in the range of approximately 50–80%, the capacity loss decreases with any increase in the SoC (due to lower current throughput at higher voltage), but increases with temperature. Below 50% SoC, the capacity loss map is noisy since any small change in the SoC or the battery temperature can alter the sequence of supervisory rules triggered in Trip 2, changing the current throughput and the temperature.
Figure 9c shows the discomfort index which is high when the battery is initially hot, and low when the trip starts with a low battery temperature.
Figure 9d shows the capacity loss in Night Park. The shape of this map is driven by the dataset used in propagating the ageing model. In calculating this map, the variation in the duration of charge with the remaining battery SoC is neglected for simplicity.
Results: Effect of Key-Off Cooling on the Performance Attributes
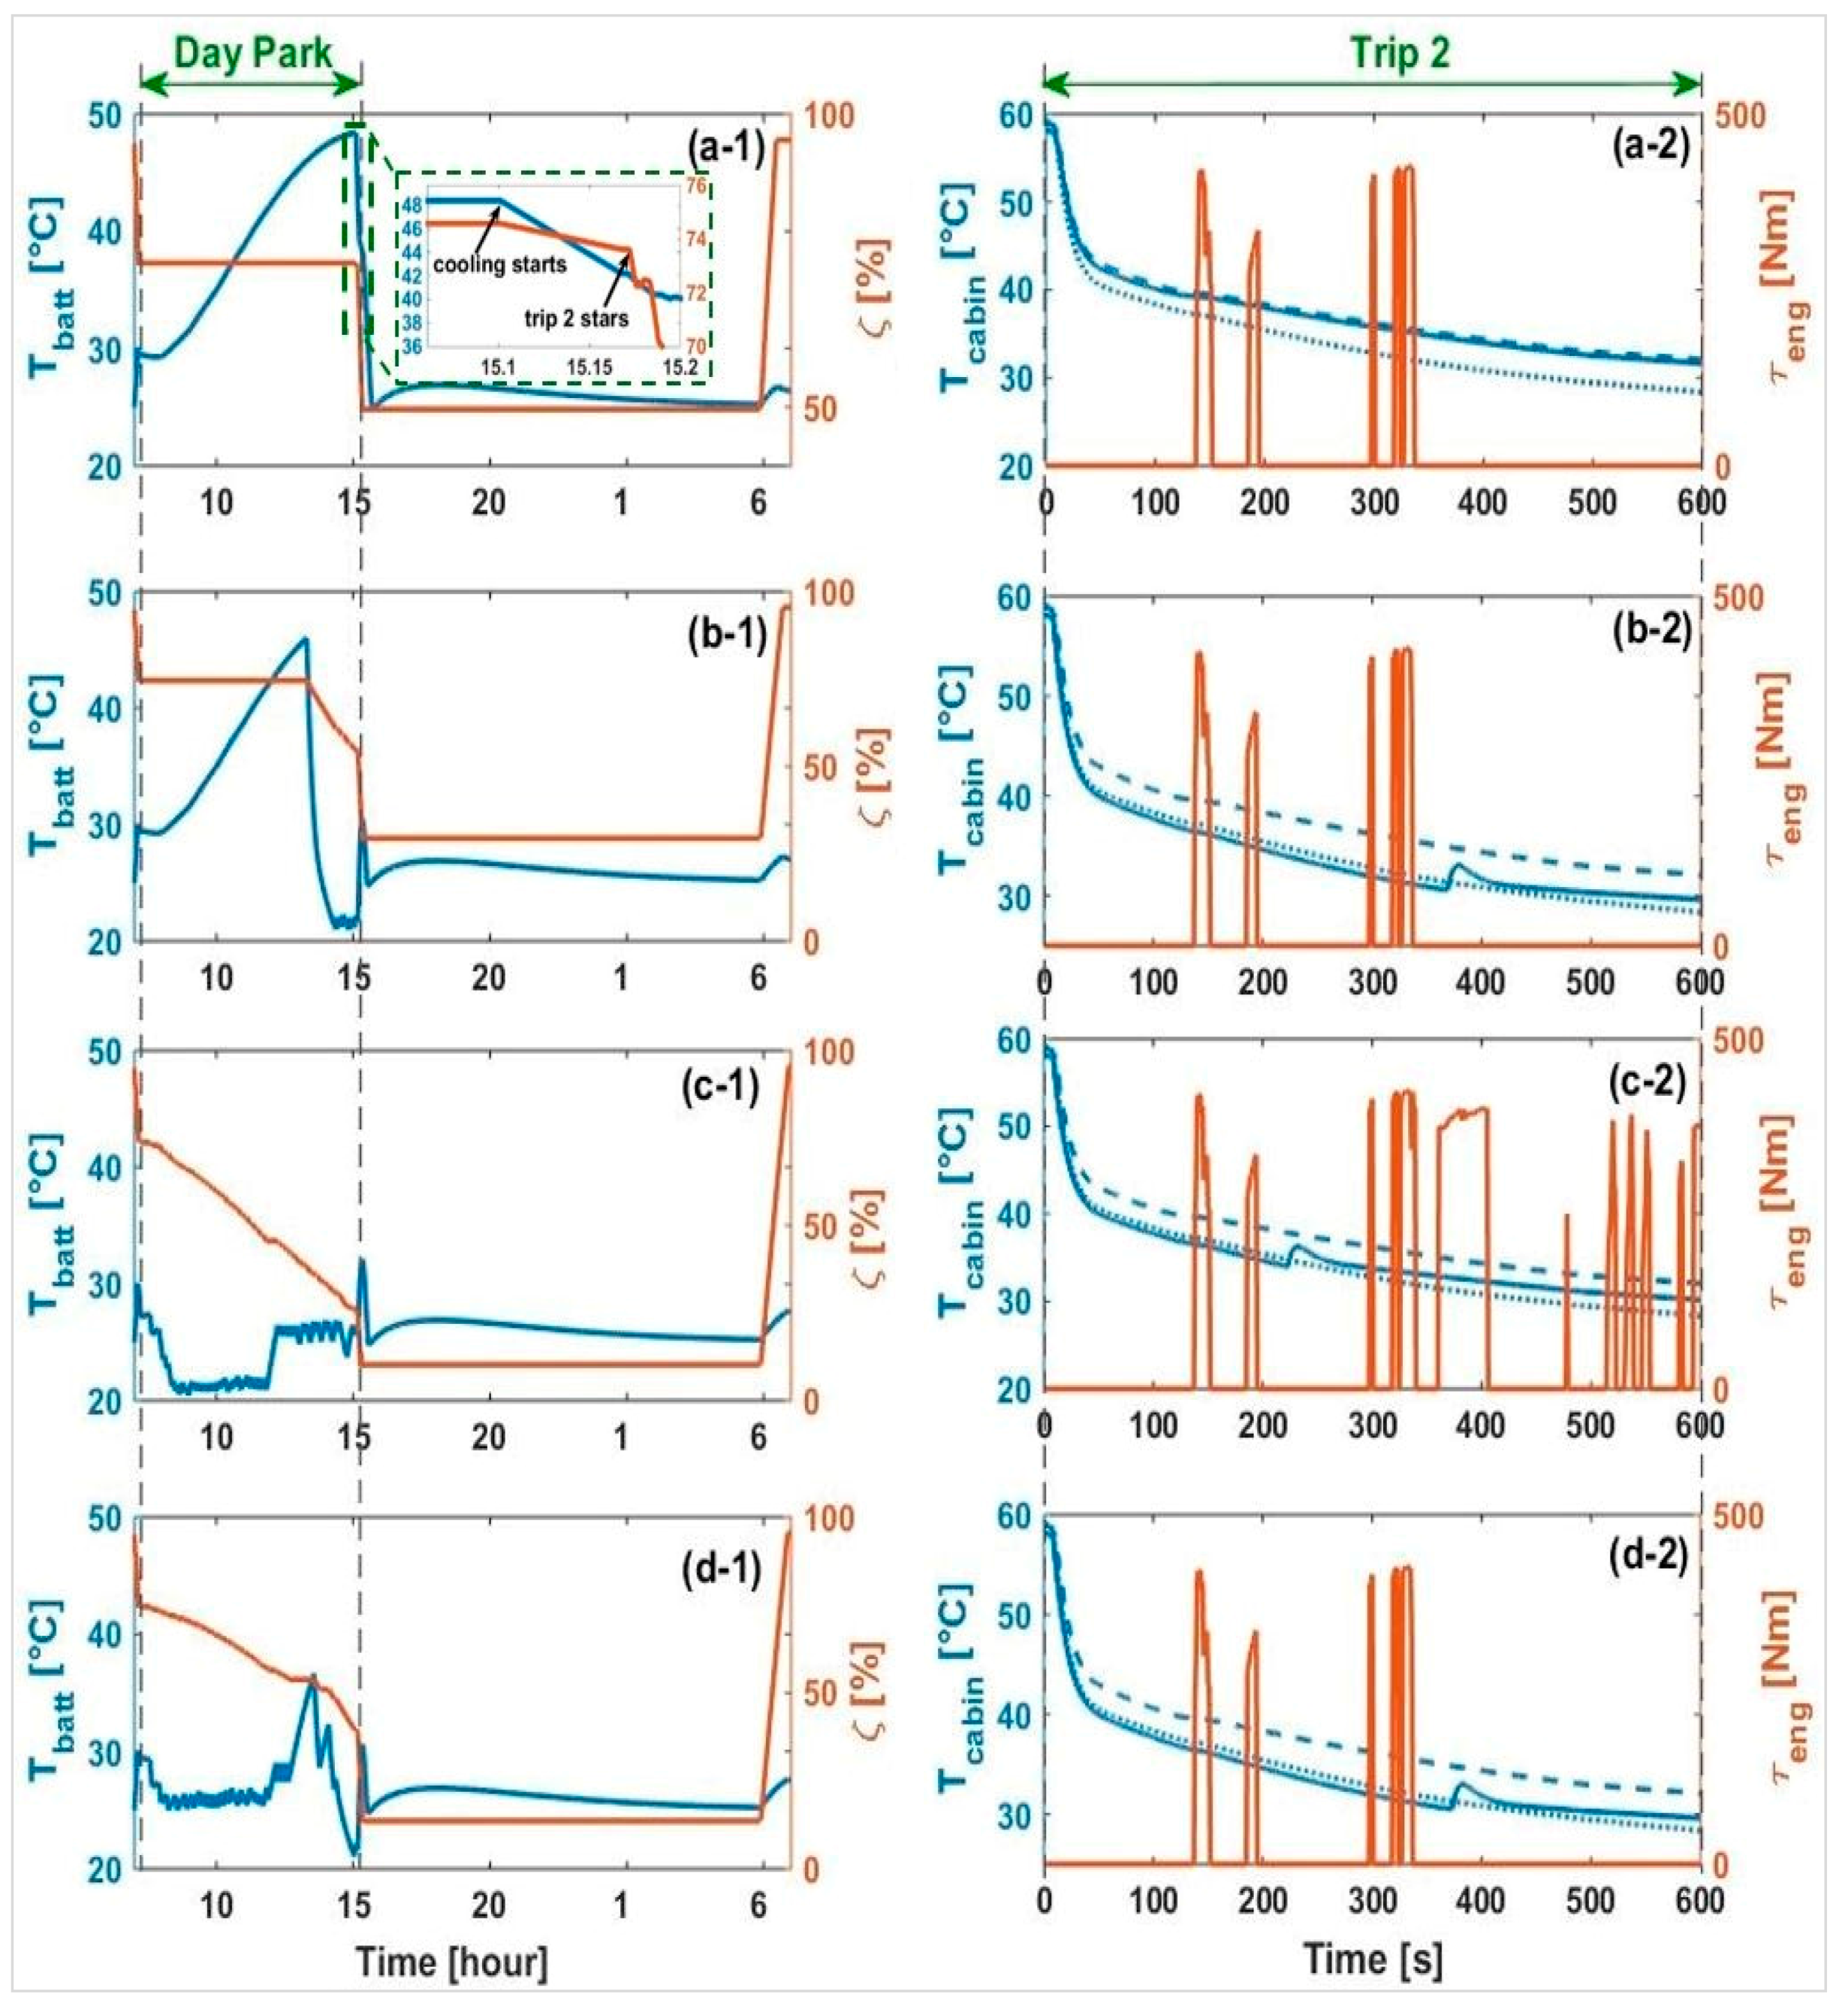
Figure 10 shows the result of simulating the duty cycle with the optimum key-off cooling flag achieved through solving (13) with four different choices for the weighting vector . For each the 24-h profile of the battery temperature and SoC are given alongside the profile of the cabin temperature and the engine torque in Trip 2.
Figure 10a-1,a-2 are related to the scenario in which minimizing fuel consumption is the only objective. In this solution, the temperature of the battery is allowed to rise during Day Park but (key-off) cooling starts just before Trip 2, precooling the battery to approximately 42 °C. Comparing the profile of engine torque in Trip 2 with the baseline scenario (Figure 5b) suggests that this degree of precooling has eliminated the unwanted operation in hybrid mode in the initial part of the trip.
Figure 10b-1,b-2 are related to minimization of the thermal discomfort. Figure 10b-1 shows that the battery is cooled and maintained at approximately 21 °C, well before Trip 2 starts. Consequently, the key-on cooling in Trip 2 has been shifted backward by 400 s, making the cabin temperature similar to that of the conventional vehicle, suggesting improved thermal comfort. Battery cooling initiates after approximately 400 s into Trip 2, leading to a slight rise in the cabin temperature.
In Figure 10c-1,c-2 minimization of the capacity loss is considered as the only objective. In this solution, key-off cooling has been intensely applied to maintain a low battery temperature. This has consumed approximately 50% of the battery charge and has forced the vehicle to operate in CS mode for most of Trip 2, suggesting high fuel consumption. As a result of the low battery temperature in Day Park, the cabin temperature has improved in the first 250 s of the trip. Note that this solution highlights a trade-off between minimizing the capacity loss on the one hand, and minimizing fuel consumption and discomfort on the other hand.
When all three objectives are considered simultaneously, a solution similar to that shown in Figure 10d-1,d-2 can be expected. Here, key-off cooling has limited the temperature of the battery during Day Park. Furthermore, sufficient energy has been allocated to precool the battery to 21 °C, which has eliminated the unwanted operation in hybrid mode and has improved the thermal comfort, in Trip 2.
The evolution of the cost terms in the results presented in Figure 10 are given in Table 7. When minimization of the capacity loss is set as the only objective, key-off cooling improves the battery lifetime to 8.5 years (from 6.3 years in the baseline scenario), although fuel consumption inevitably increases. When all objectives are accounted for, the fuel consumption and the discomfort index are minimized (to their lower bounds), and still, a significant improvement in the battery lifetime is achieved. The solutions obtained above with different weighting of the cost terms fall on the Pareto of optimality that governs the optimum trade-off between the objectives.
An important observation from Table 7 is that a part of the gain in battery lifetime that is achieved by key-off cooling is a result of the lower capacity loss in Night Park. Key-off cooling increases the cycling component of the capacity loss in Night Park, given that the battery will receive more charge to compensate for the extra spent energy. Temperature variations are negligible as plugged-in cooling is applied in Night Park. Therefore, the reduction in Night Park capacity loss is due to lower storage capacity loss enabled by the lower storage SoC. Recall from Section 4 that the vehicle has approximately 40% excess charge over its summer duty cycle. This highlights an opportunity for achieving further improvements in the battery lifetime through partial charging as it will result in lower storage ageing without the need for extra cycling. Since the ability to perform key-off cooling depends on the available battery charge, it is necessary to integrate the optimization of partial charging and key-off cooling to maximize their benefit for the battery. This will be addressed in the following section.
7. Integrated Control of Partial Charging and Key-Off Cooling in View of the Daily Duty Cycle
In previous sections, it was assumed that the battery was fully charged every day (). Partial charging refers to optimizing . Since is equivalent to initial SoC for every repeat of the duty cycle , partial charging affects the fuel consumption and capacity loss in Trip 1:
So they should be included when propagating the cost function (9). Therefore, to optimize partial charging and key-off cooling, a minimization of the following form is required:
where denotes the optimum level of charge. in the above equation is of the same form as (14) but since partial charging affects the cycling component of capacity loss in Night Park, should be calculated as:
leading to:
For every choice of , the minimization in (16) reduces to optimal control of key-off battery cooling described by (13). which can be solved with DP, as done previously. By iterating over different choices for , the combination of the level of charge and the key-off cooling flag trajectory that solves (16) can be determined. It is worth noting that solving (16) only requires one evaluation of the arc-cost term for the grid of the vehicle states in Day Park, since the arc-cost term is independent of the initial conditions of Day Park (hence it is independent of ). Therefore, the computation is inexpensive.
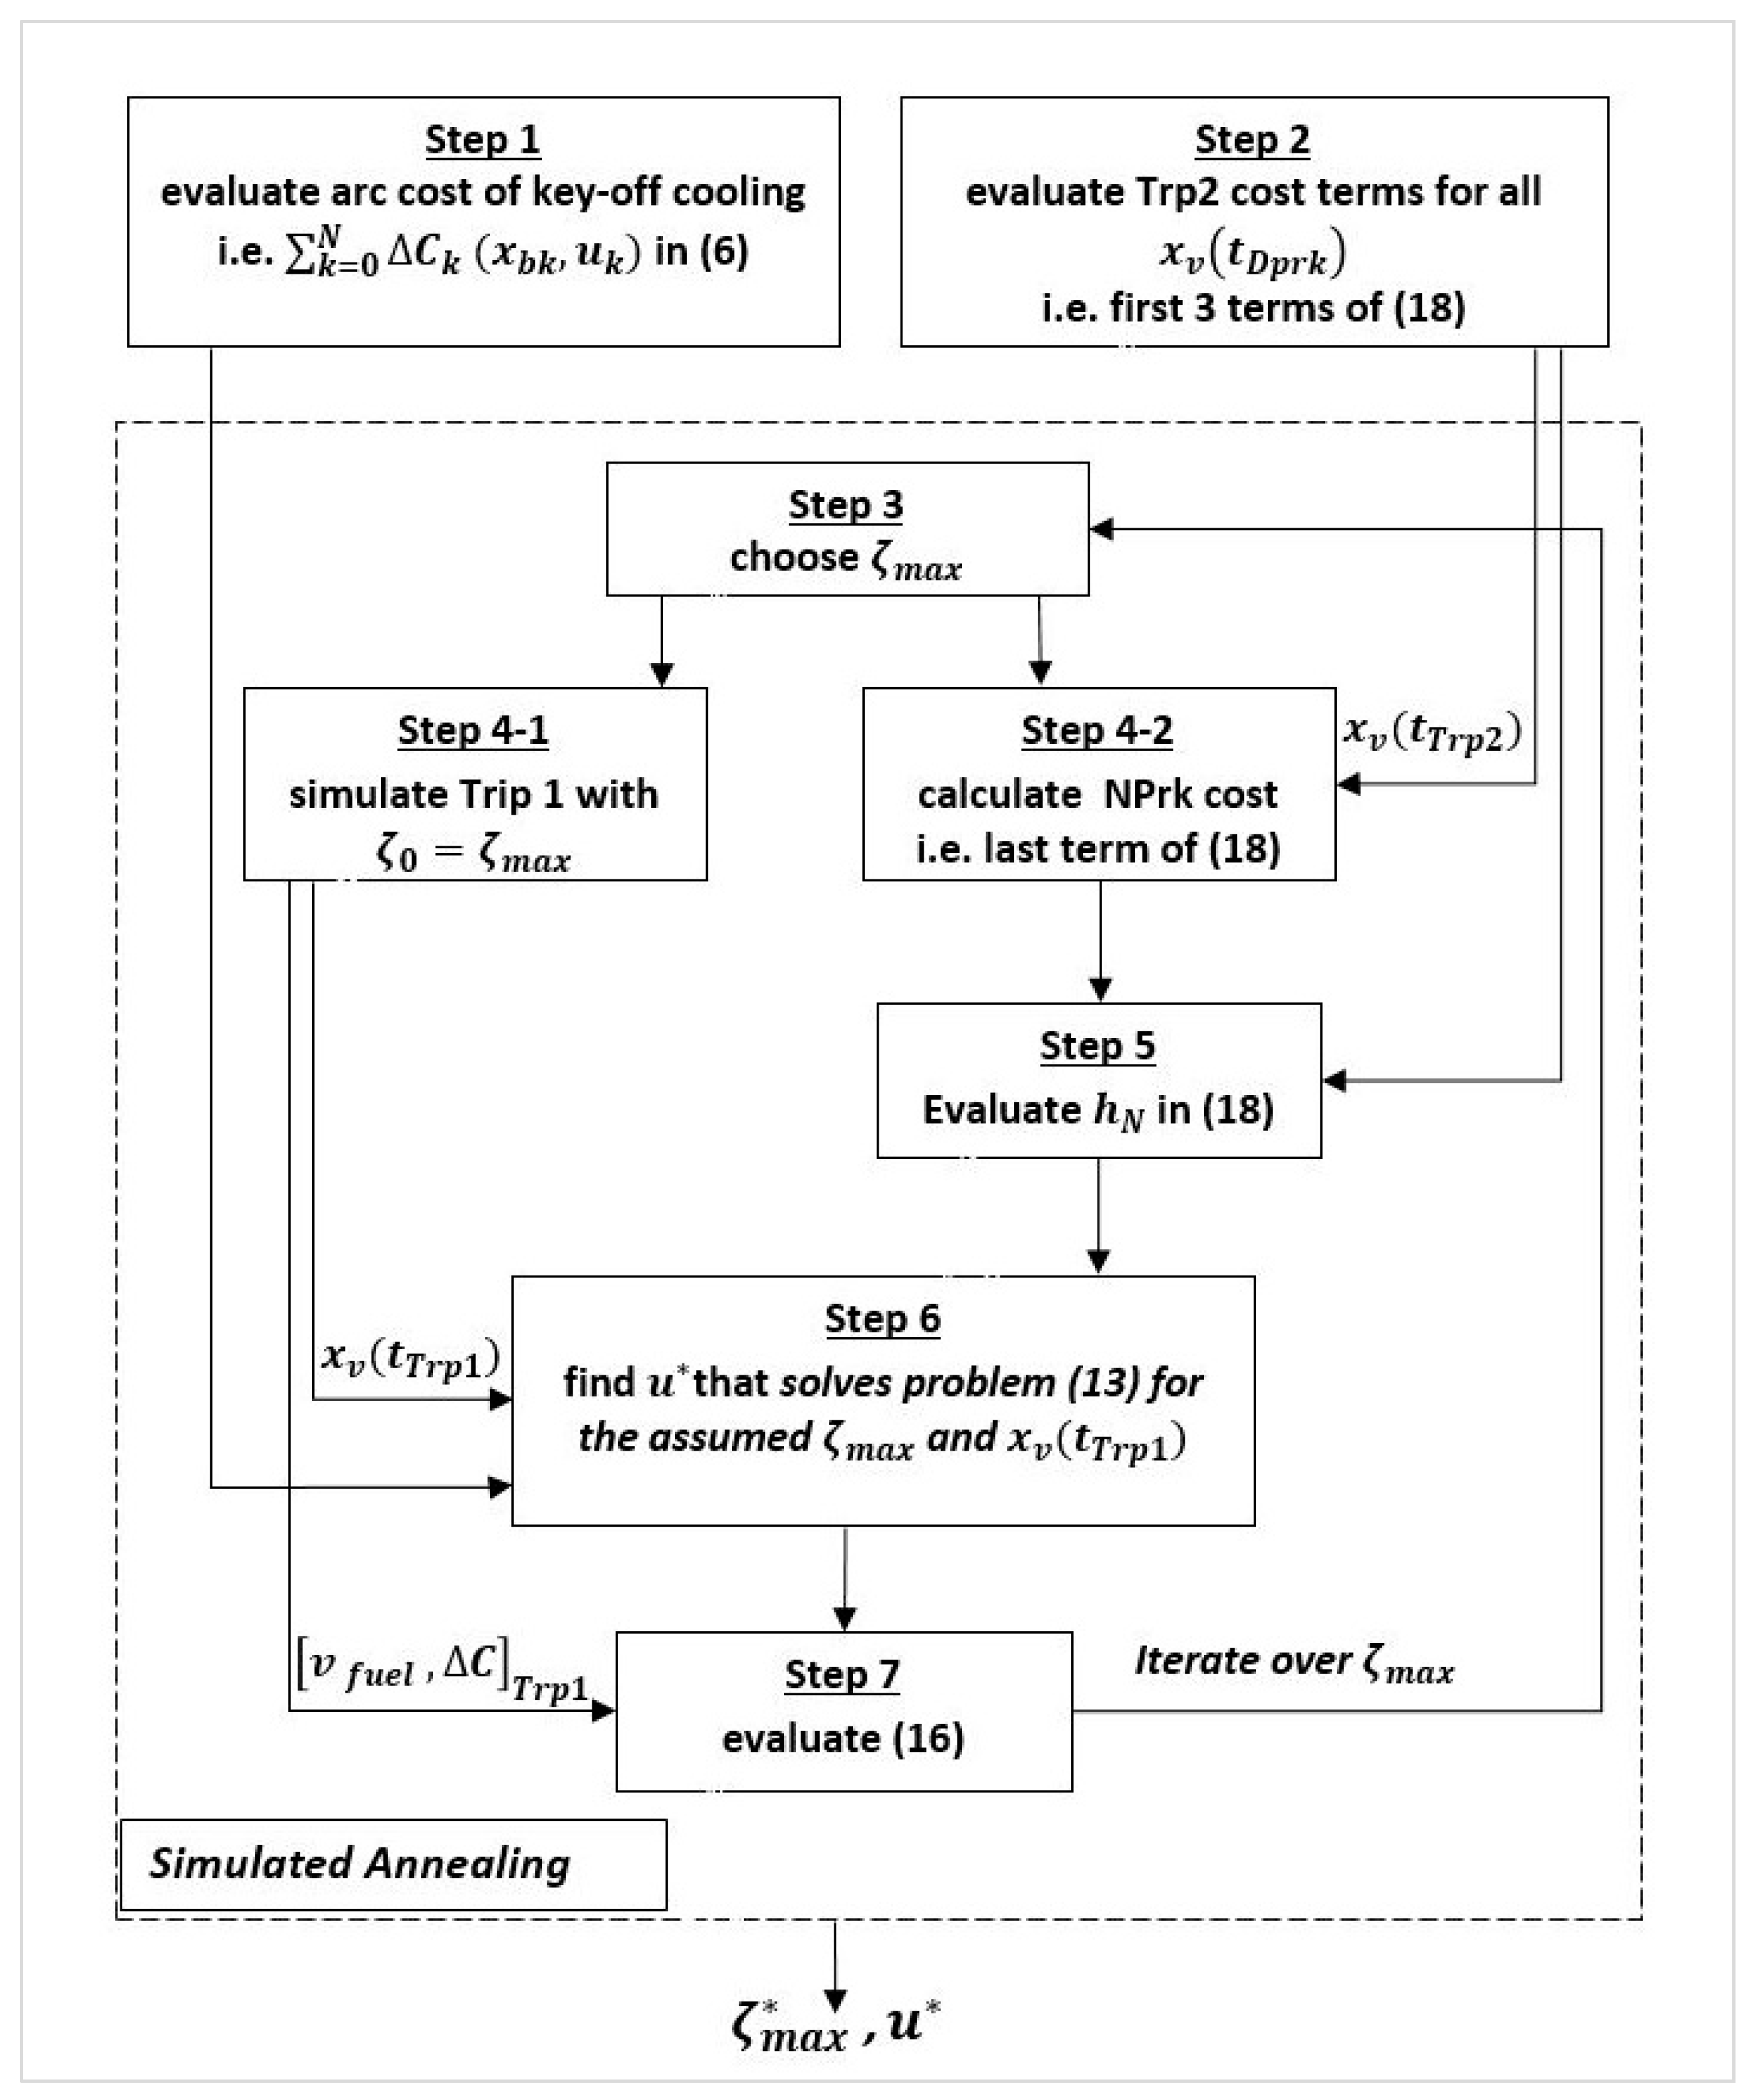
The simulated annealing (SA) algorithm [68], which has been regularly applied to parametric optimization of HEV control strategies [69,70], is used to find . Figure 11 shows the flowchart of the process.
Results: Effect of Partial Charging and Key-Off Cooling on the Performance Attributes
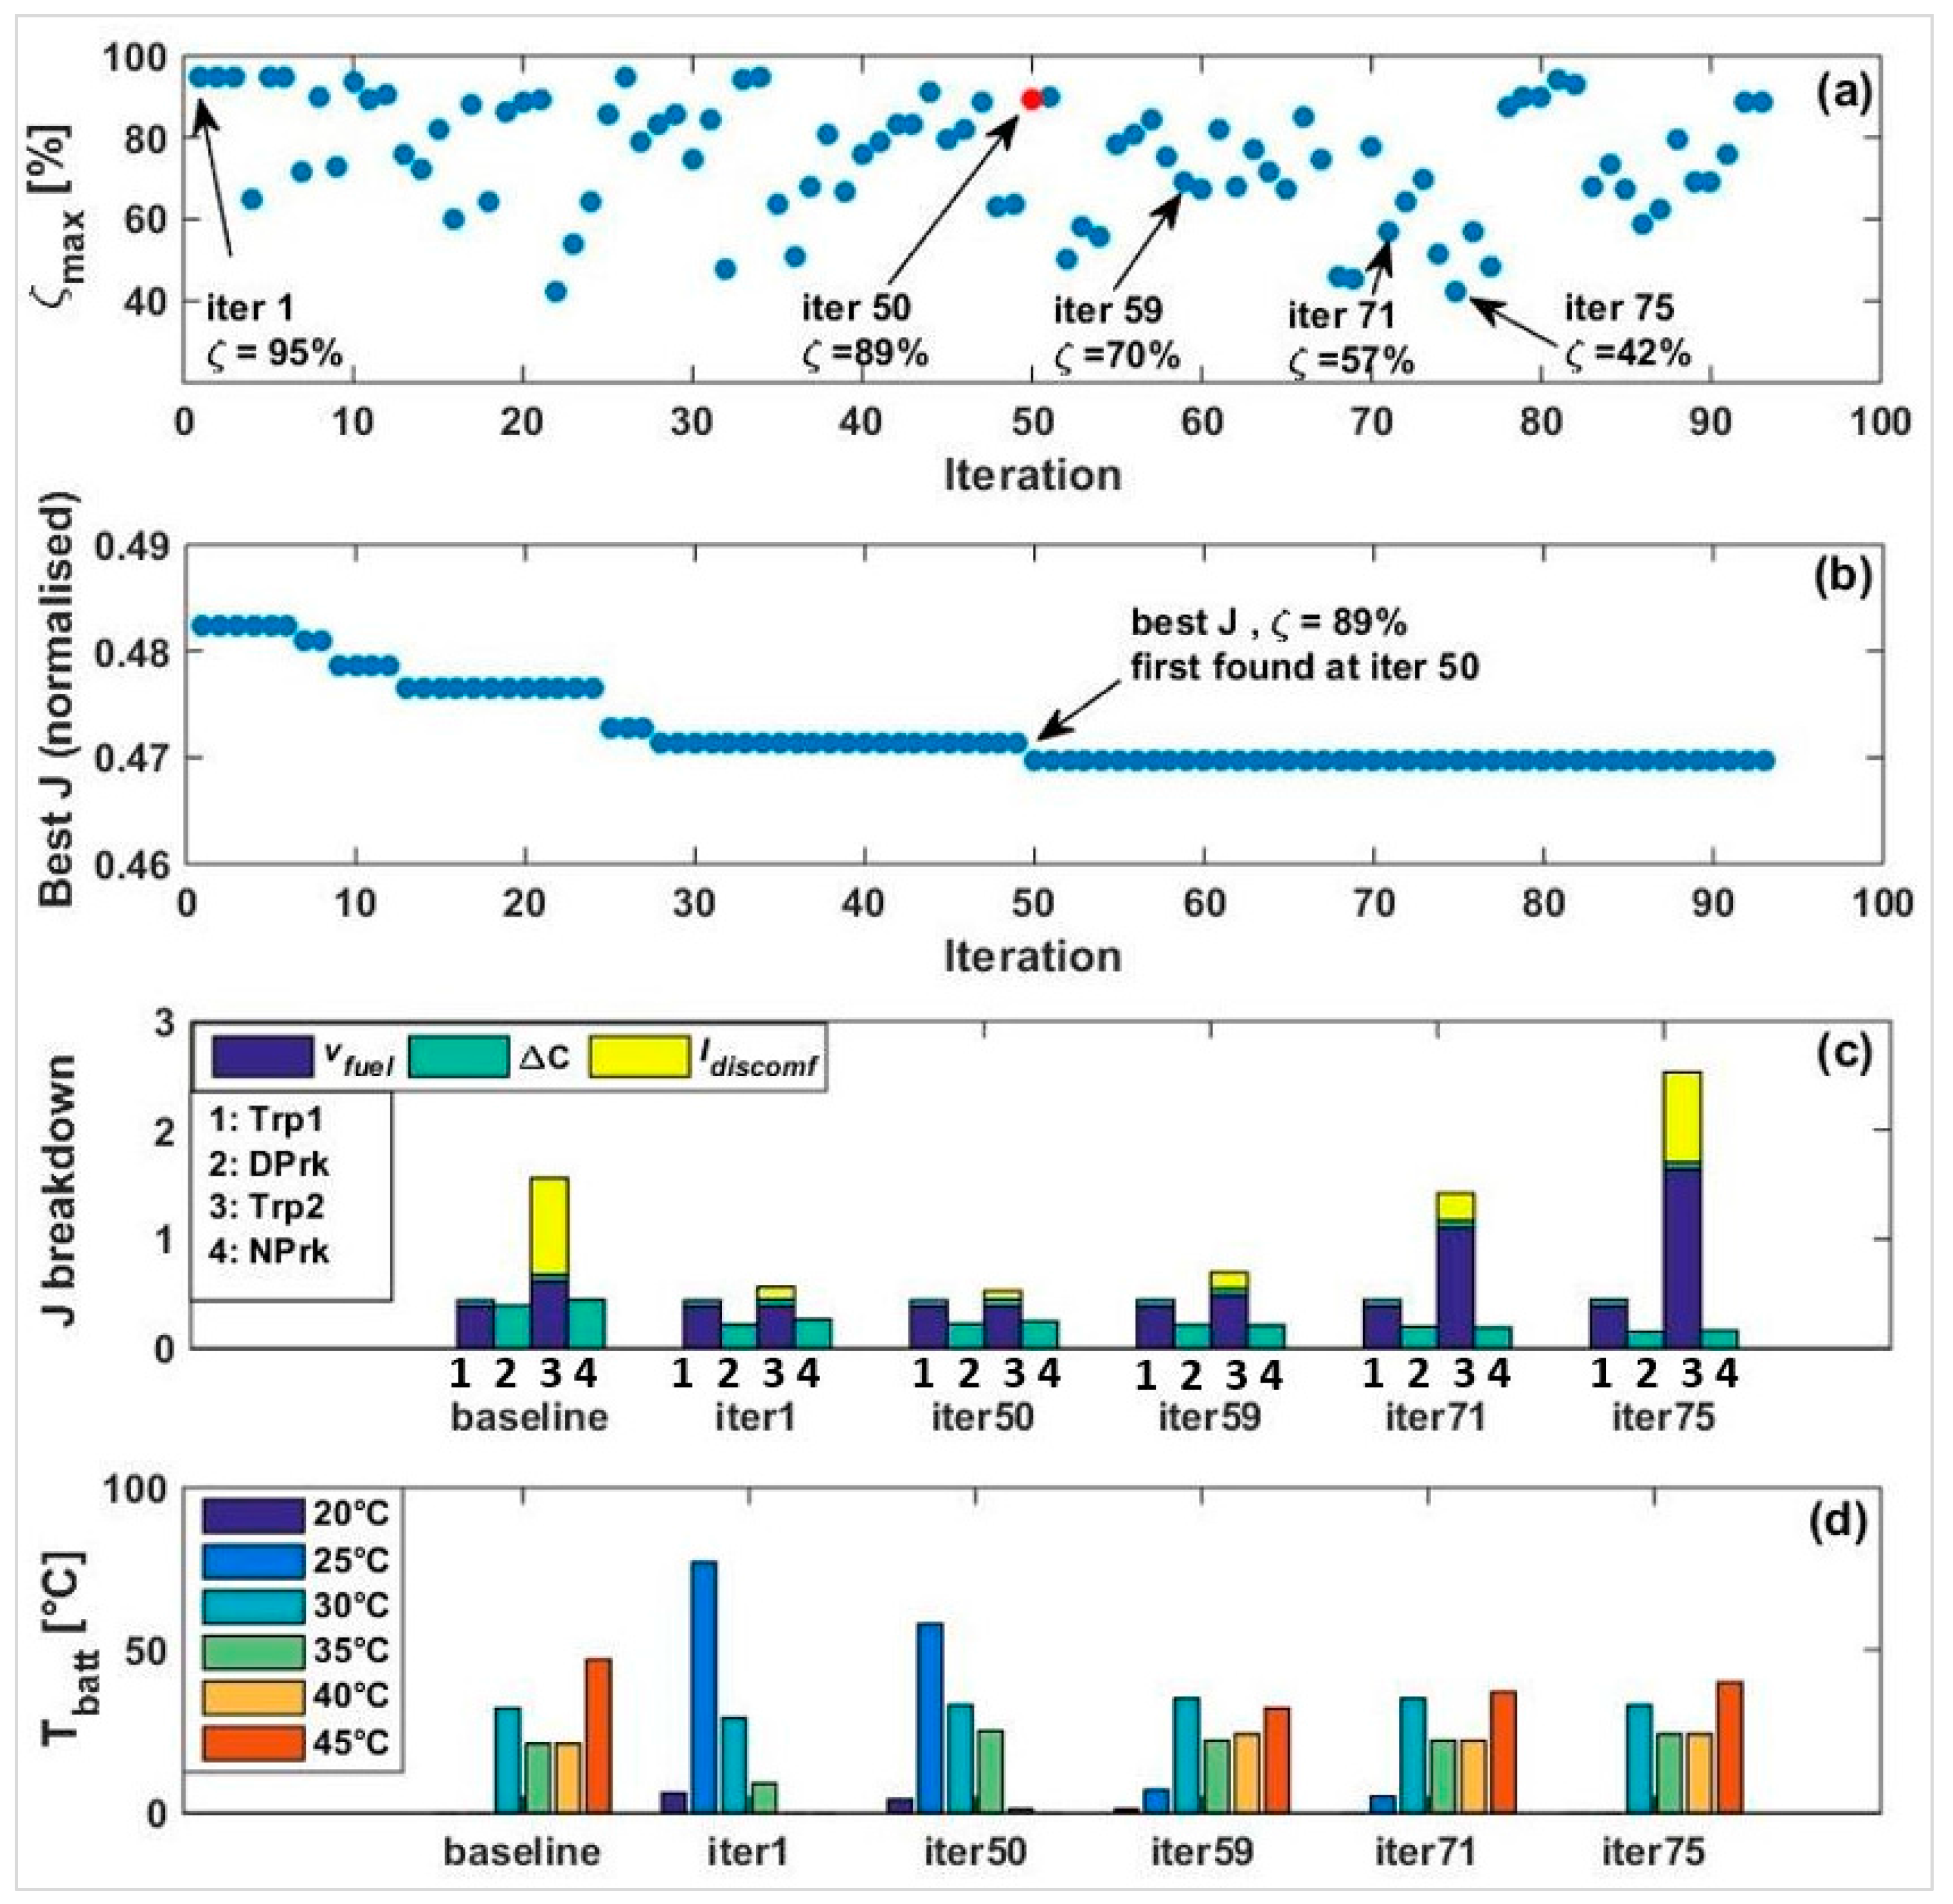
Figure 12 shows the progress of the SA algorithm when (16)–(18) have been weighted with . The search space is again limited to (with resolution of 0.5%) to accelerate convergence. The high weights assigned to fuel economy and thermal comfort make it imperative that the battery is sufficiently charged to deliver maximum CD operation in both trips, as well as an intense key-off precooling. This effectively limits the window of SoC that is available for partial charging, so the choice is between higher charge that enables more key-off cooling, or lower charge that only supports the CD operation and precooling.
Figure 12a shows the values of for each iteration, suggesting that the search space has been thoroughly sampled. The algorithm has converged to after 93 iterations. Figure 12b shows that the best achieved (normalized) value of which is first attained at Iteration 50 (. For Iterations 1, 50, 59, 71, and 75 (with respective of 95%, 89%, 70%, 57%, and 42%) the breakdown of the normalized components of are compared with the baseline scenario (full charging and no key-off cooling, see Section 4) in Figure 12c. Note that the fuel consumption in trip 1 has remained unchanged in these iterations, due to the limit set on the minimum level of charge. Besides, the capacity loss in the two trips is small and relatively unaffected by the level of charge, as expected. Figure 12d shows the histogram of the battery temperature in Day Park for Iterations 1, 50, 59, 71, and 75 with the baseline. The battery temperature is higher when the level of charge is lower, since less key-off cooling is applied. Therefore, in Iteration 50 (89% charge, optimum solution), the battery temperature is higher than in iteration 1, but it is still much lower than the baseline.
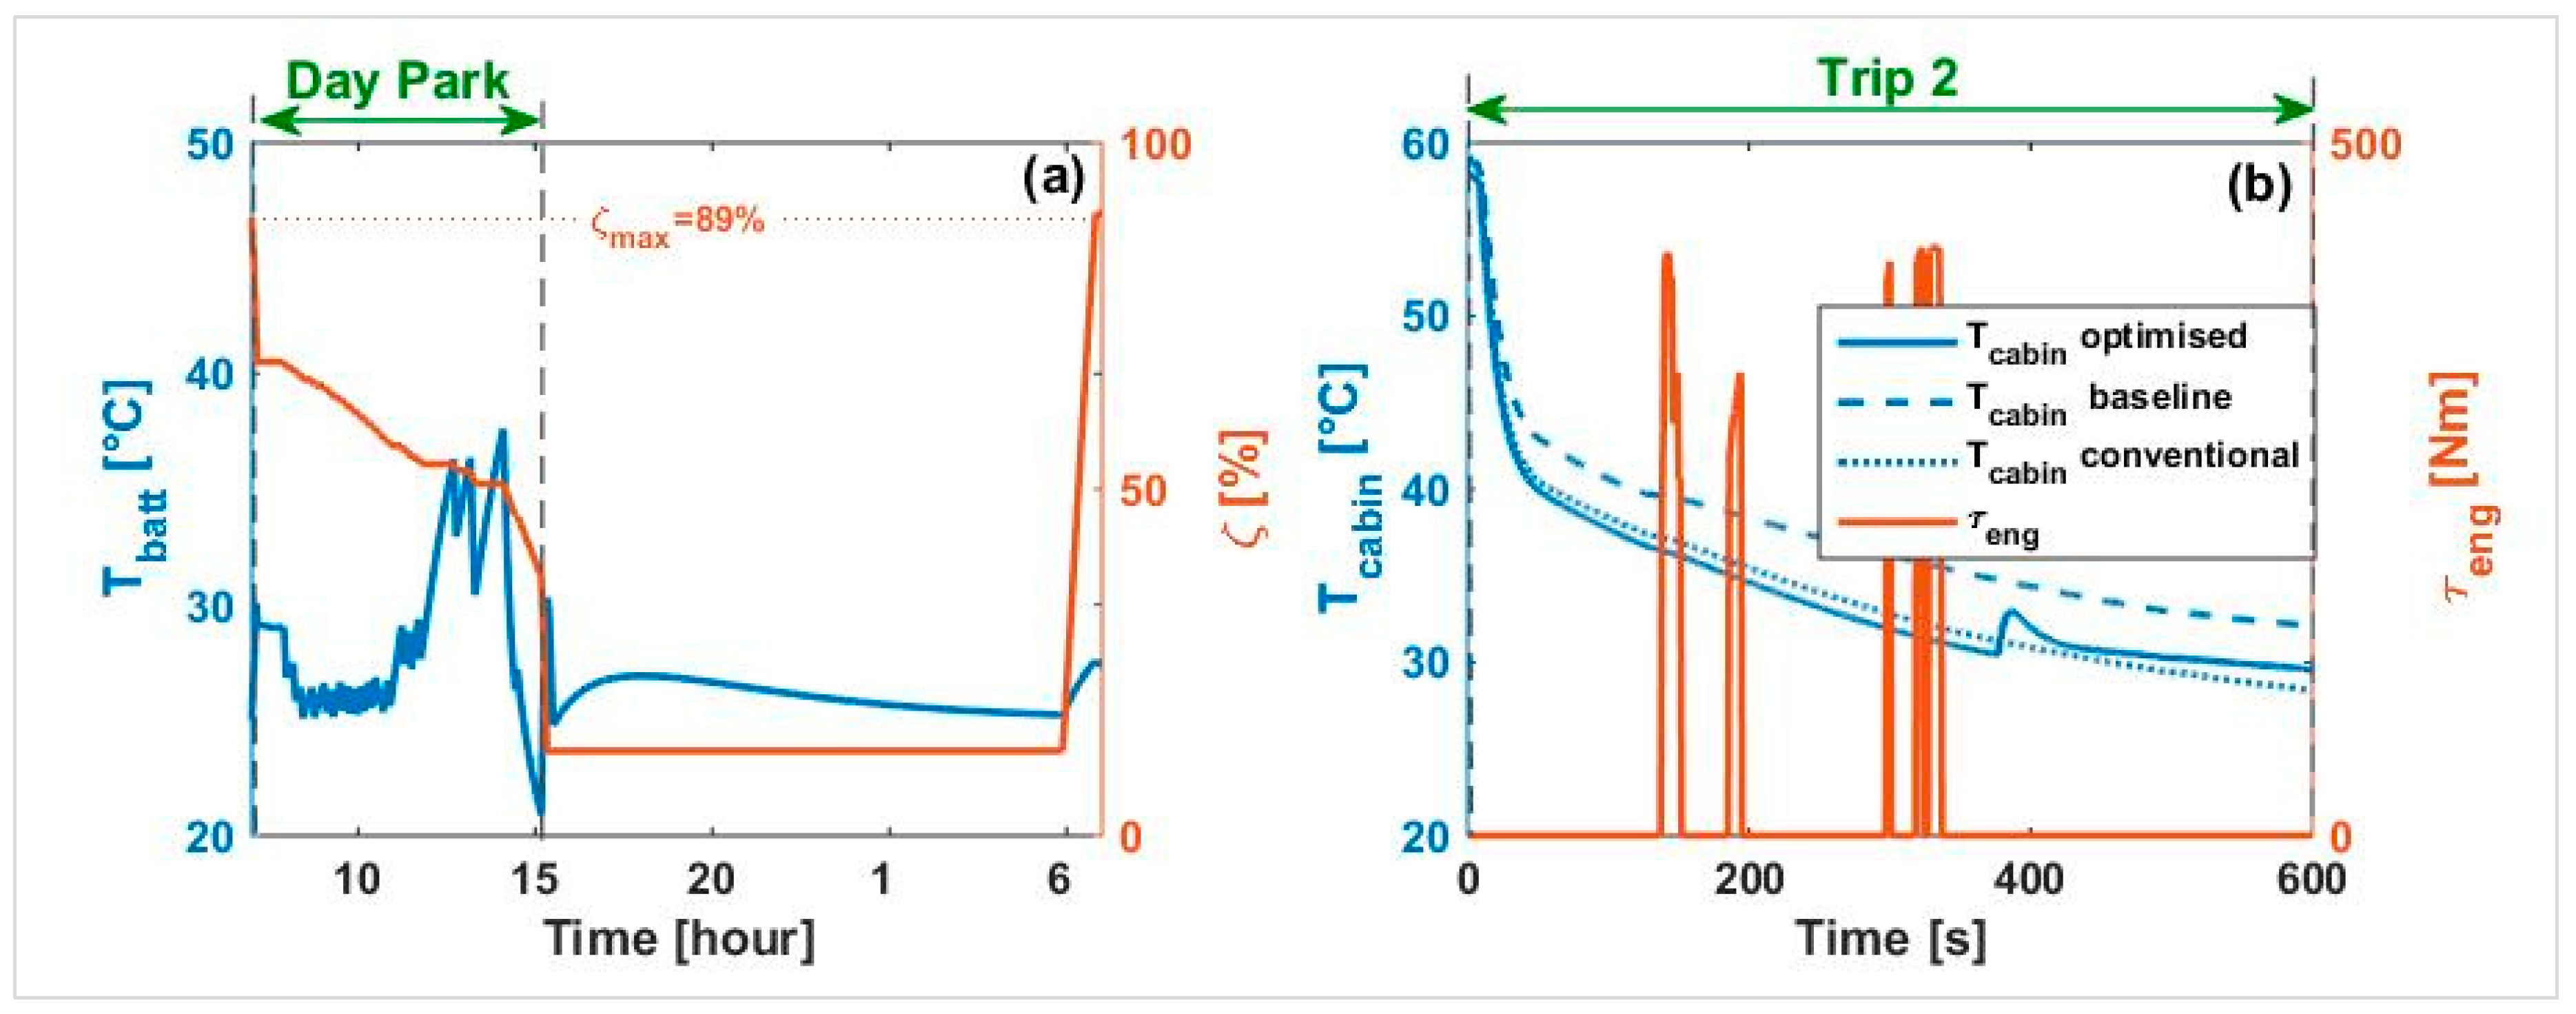
Figure 13 shows the result of simulating the duty cycle with the optimum level of charge and the key-off cooling flag trajectory achieved through the process explained above. Comparing the profile of the battery temperature in Figure 13 with the case of key-off cooling for the fully charged battery (Figure 10d-1,d-2) shows that temperatures above 30 °C have been more frequently allowed in Day Park, as less key-off cooling has been possible with a partially charged battery. The profiles of engine torque and cabin temperature have been unaffected by partial charging since the battery is precooled to 21 °C, as was the case with the fully-charged battery.
More details about the result shown in Figure 13 are given in Table 8 (Row 3), where they are compared with the baseline results (Row 1) and the results of key-off cooling optimization which was shown in Figure 10d-1,d-2 (Row 2). Integrated partial charging and key-off cooling, through reducing the capacity loss in Day Park and Night Park, has enabled a longer battery lifetime compared to key-off cooling alone. This comparison confirms the benefits of the proposed method. The fact that despite the higher battery temperature, partial charging has reduced the capacity loss in Day Park indicates that partial charging compensates for the higher temperature. Furthermore, as was previously seen in Figure 13, partial charging has not negatively affected the thermal comfort and fuel economy improvements that key-off cooling enables.
Table 8 also includes details of two additional cases:
- Row 4 represents the solution of (16) considering only the fuel economy and the battery lifetime (i.e., , which leaves a wider widow of SoC for partial charging, at the expense of poor thermal comfort. Therefore, the battery is only charged to 68%. This still allows some key-off cooling, although less than was seen in Figure 13. As Table 8 suggests, the combination of lower battery charge and some key-off cooling improves the battery lifetime to 8.7 years.
- Row 5 represents the case in which the battery is minimized (to 55% which is the limit of the excess charge) but key-off cooling is not applied. In this case, the battery lifetime is improved to 8.5 years, which is less than the 8.7 years that can be achieved with partial charging and key-off cooling if thermal comfort is neglected. Note that lack of key-off cooling leads to high fuel consumption and thermal discomfort in this case.
Comparing the above cases proves that combining partial charging and key-off cooling is more beneficial than applying partial charging or key-off cooling alone, unless a significant compromise on fuel consumption is acceptable.
Solving (16) with alternative weighting vectors does not necessarily lead to distinct results. Solving (16) for fuel consumption alone ( has non-unique solutions. This is because any sufficiently high level of charge (approximately above 57%) combined with any key-off cooling flag trajectories that sufficiently pre-cools the battery for Trip 2 will lead to equal fuel consumption. Similarly, solving (16) for thermal discomfort alone ( does not have a unique solution. On the other hand, solving (16) for the capacity loss alone ( leads to the lowest possible level of charge at the expense of high fuel consumption, as can be inferred from the results of Iteration 75 in Figure 12.
8. Applicability to EVs
To adapt the methods proposed in this paper for EVs, it will be sufficient to choose a cost function that matches the characteristics of a fully electric powertrain. That is, fuel consumption in Equation (9) should be replaced with measures of acceleration and distance travelled (equivalent to the EDR in EVs). For any drive cycle, the difference between the achieved and demanded acceleration and distance, respectively denoted as and , can be used to form the following cost function:
Equation (19) can be implemented in the form of Equations (13) and (14) for the key-off cooling problem, and in the form of Equations (16)–(18) for the integrated partial charging and key-off cooling problem. It is worth noting that given the generality of other assumptions in this paper and the similarity of battery technologies commonly used in these vehicles, the overall benefit of key-off cooling and partial charging will be unaffected by the vehicle type.
9. Discussion
The analyses presented in this paper demonstrate the ability of the proposed methods in controlling key-off cooling and partial charging, and maximizing their effectiveness in mitigating the negative impacts of hot climate conditions on the battery of electrified vehicles. Application of key-off cooling that is proposed in this paper is an important enhancement to the current state-of-the-art of combining key-on and plugged-in cooling [20,34,39]. Key-off cooling expands the scope of battery cooling, and enables maintaining a low battery temperature throughout the day, as well as performing precooling regardless of whether an external power source is available. Further, integration of partial charging and key-off cooling that is proposed in this paper enhances the current state-of-the-art of optimized charging without considering its benefit relative to cooling.
The battery lifetime improvement that is enabled by key-off cooling and partial charging serves the greater fulfilment of warranty targets across wider geographical locations, resulting in off-cycle credit for the manufacturer [71]. The improvements achieved in the fuel economy through key-off precooling can be similarly evaluated. Any improvement in the passengers’ thermal comfort through key-off precooling contributes to higher acceptability of electrified vehicles. Realizing the benefits of the methods proposed here will require the implementation of additional control algorithms in the vehicle. Nevertheless, this will be more cost effective than any alternatives such as using advanced insulation technologies and over-sizing the battery [72] which need to be applied to the whole fleet while the issue only affects the subset of the fleet that operate in hot climate conditions.
The opportunity for applying key-off cooling and partial charging without affecting the electric range of the vehicle depends on the availability of excess battery charge over the duty cycle. The assumptions of this work represent the common subset of all battery size and duty cycle combinations that leave some excess battery charge. When little or no excess charge is available, defining the relative importance of fuel economy, battery lifetime, and thermal comfort in controlling key-off cooling becomes more critical. Addressing such circumstances requires a separate analysis, but it is evident that the methodology proposed in this work will produce the ‘optimum’ results.
The methodology proposed in this paper relies on a priori knowledge of the ambient conditions and the duty cycle. When such a priori knowledge is absent, the relevant functionalities can be implemented through a rule-based algorithm inferred from offline simulation of a range of ambient conditions and duty cycle combinations. In a more advanced setting, weather forecasts, route planning technologies and interaction with parking management systems can provide the information needed for online optimal control of key-off cooling and partial charging.
10. Future Work
The simulation results presented in this paper are promising and suggest that applying key-off cooling through the proposed methodology can enable significant improvements in the performance attributes of PHEVs and EVs in hot climates. One way to enhance the confidence in the analyses is to employ a comprehensive battery ageing model to calculate the increase in the internal resistance of the cells, as well as their capacity loss, and update the battery lifetime calculations. This will be carried out in the feature using the model presented in [73]. Furthermore, experimental validation of the proposed methodology will be carried out in the future to establish its effectiveness in real life conditions.
Since the purpose of this research is to show the ultimate benefit of key-off battery cooling, practical considerations such as the additional cost of electrical energy, component wear, and noise pollution resulting from the operation of the cooling system were neglected. The possible impact of such considerations on the key-off cooling strategy will be analyzed in the future.
11. Conclusions
The key conclusions that can be drawn from the analyses presented in this paper are as follows:
- (1)
- Three performance attributes of PPHEVs, namely their fuel economy, battery lifetime, and passengers’ thermal comfort, can be negatively affected by the high battery temperature that results from hot climate conditions.
- (2)
- Key-off cooling can be applied to reduce this effect, hence reducing the unwanted variability in the performance attributes of the vehicle with climate conditions.
- (3)
- The control method proposed in this paper maximizes the benefits of key-off cooling, by accounting for and containing the risks associated with using the battery to support key-off cooling, i.e., extra fuel consumption and disproportionately high cycling capacity loss. The formulation proposed for the key-off cooling control problem can be tuned to target individual, as well as combinations of, the affected performance attributes.
- (4)
- Integration of partial charging and key-off cooling enhances their individual benefits for the battery lifetime. The method proposed for integrated optimization of partial charging and key-off cooling can determine the combination of the level of charge and key-off cooling that maximizes the battery lifetime. This can be also tuned to achieve a trade-off between fuel economy, battery lifetime and thermal comfort.Within the context of the assumptions of this paper, the following observations were made:
- Key-off cooling reduced the seasonal capacity loss of the battery in the Day Park phase by approximately 42% and this helped improve the battery lifetime from 6.3 years to 8 years.
- Key-off precooling eliminated the impact of battery overheating on the electric drive capability of the vehicle. This reduced the seasonal fuel consumption by approximately 23%.
- Key-off precooling improved the passengers’ thermal comfort by shifting the key-on cooling loads in Trip 2 by 400 s, reducing the thermal discomfort index from 59 to 6.
- Integrating partial charging and key-off cooling enabled further improvements in battery lifetime. By partially charging the battery (to 89% instead of 95%) and applying some key-off cooling, the battery lifetime was improved by 2.5% compared to when only key-off cooling was applied (8.2 years, compared to the eight years). When the window of excess charge was widened by neglecting the thermal comfort attribute, combining partial charging to 68% and key-off cooling improved the battery lifetime by 9%, compared to when only key-off cooling was applied (8.7 years compared to eight years). This was more than the improvements partial charging or key-off cooling can individually enable, unless a significant compromise in fuel consumption is acceptable.
Acknowledgments
The research presented within this paper is supported by Innovate UK, through the WMG Centre High Value Manufacturing (HVM) Catapult, in collaboration with Jaguar LandRover.
Author Contributions
All authors have made substantial contributions to the paper including: the design of the study; acquisition and interpretation of results; drafting and revising the manuscripts; and final approval of the version being submitted to the journal. Native speakers of the English language have drafted and proof read this manuscript.
Conflicts of Interest
The authors declare no conflict of interest.
Nomenclature
| Notation | Description | Unit |
| average cabin air temperature | °C | |
| battery temperature (bulk) | °C | |
| average battery temperature | °C | |
| state of charge (SoC) | % | |
| battery current | ||
| engine torque | Nm | |
| maximum SoC (level of battery charge) | % | |
| optimum maximum SoC (optimum level of charge) | % | |
| average of SoC | % | |
| n | number of charge-discharge cycles of battery | – |
| Initial battery capacity | Ah | |
| storage capacity loss | % | |
| cycling capacity loss | % | |
| total capacity loss | % | |
| fuel consumption (fuel consumed) | L | |
| discomfort index | – | |
| Trip 1 (phase of the duty cycle) | – | |
| Day Park (phase of the duty cycle) | – | |
| Trip 2 (phase of the duty cycle) | – | |
| Night Park (phase of the duty cycle) | – | |
| total capacity loss in trip 1 | % | |
| total capacity loss in Day Park | % | |
| total capacity loss in trip 2 | % | |
| total capacity loss in Night Park | % | |
| fuel consumed in Trip 1 | L | |
| fuel consumed in Trip 2 | L | |
| time at end of Trip 1 | s | |
| time at end of Day Park | s | |
| time at end of Trip 2 | s | |
| time at end of Night Park | s | |
| engine torque | Nm | |
| state (vector) of the battery: | – | |
| state (vector) of the vehicle: | – | |
| key-off cooling flag trajectory | – | |
| optimum trajectory of key-off cooling flag | – | |
| J | total cost minimized in optimal control problems | – |
| h | terminal cost (used in the definition of cost functions) | – |
| vector of weights (used in the definition of cost functions) | – |
Abbreviations
| EV | electric vehicle |
| PHEV | plug-in hybrid electric vehicle |
| PPHEV | plug-in parallel hybrid electric vehicle – a class of PHEVs |
| EDR | electric drive range |
| AC | air conditioning (system) |
| SoC | state of charge |
| CD | charge depleting |
| CS | charge sustaining |
| NEDC | The New European Drive Cycle |
| EoL | end of life |
| DP | dynamic programming |
References
- Hannan, M.A.; Hoque, M.M.; Mohamed, A.; Ayob, A. Review of energy storage systems for electric vehicle applications: Issues and challenges. Renew. Sustain. Energy Rev. 2017, 69, 771–789. [Google Scholar] [CrossRef]
- Pesaran, A. Battery Requirements for Plug-In Hybrid Electric Vehicles—Analysis and Rationale. In Proceedings of the EVS 23 Sustainability: The Future of Transportation, Anaheim, CA, USA, 2–5 December 2007; p. 26. [Google Scholar]
- Boston Consulting Group. Batteries for Electric Cars: Challenges, Opportunities, and the Outlook to 2020; Boston Consulting Group: Boston, MA, USA, 2010. [Google Scholar]
- Jackson, N. Technology Roadmap; Automotive Council: London, UK, 2011. [Google Scholar]
- Axsen, J.; Burke, A.; Kurani, K. Batteries for Plug-in Hybrid Electric Vehicles (PHEVs): Goals and the State of Technology Circa 2008. Available online: https://escholarship.org/content/qt1bp83874/qt1bp83874.pdf (accessed on 20 Augest 2017).
- Nykvist, B.; Nilsson, M. Rapidly falling costs of battery packs for electric vehicles. Nat. Clim. Chang. 2015, 5, 329–332. [Google Scholar] [CrossRef]
- Zubaryeva, A.; Thiel, C. Paving the Way to Electrified Road Transport Publicly Funded Research, Development and Demonstration Projects on Electric and Plug-In Vehicles in Europe; Europen Commission Joint Research Centre: Petten, The Netherlands, 2013; pp. 5–12. [Google Scholar] [CrossRef]
- Eddahech, A.; Briat, O.; Vinassa, J.M. Performance comparison of four lithium-ion battery technologies under calendar aging. Energy 2015, 84, 542–550. [Google Scholar] [CrossRef]
- Waag, W.; Käbitz, S.; Sauer, D.U. Experimental investigation of the lithium-ion battery impedance characteristic at various conditions and aging states and its influence on the application. Appl. Energy 2013, 102, 885–897. [Google Scholar] [CrossRef]
- Neubauer, J.; Pesaran, A.; Bae, C.; Elder, R.; Cunningham, B. Updating United States Advanced Battery Consortium and Department of Energy battery technology targets for battery electric vehicles. J. Power Sources 2014, 271, 614–621. [Google Scholar] [CrossRef]
- Scrosati, B.; Garche, J. Lithium batteries: Status, prospects and future. J. Power Sources 2010, 195, 2419–2430. [Google Scholar] [CrossRef]
- Lu, L.; Han, X.; Li, J.; Hua, J.; Ouyang, M. A review on the key issues for lithium-ion battery management in electric vehicles. J. Power Sources 2013, 226, 272–288. [Google Scholar] [CrossRef]
- Yuksel, T.; Michalek, J.J.; Michalek, J. Evaluation of the Effects of Thermal Management on Battery Life in Plug-in Hybrid Electric Vehicles. In Proceedings of the Battery Congress, Ann Arbor, MI, USA, 23–24 April 2012. [Google Scholar]
- Zhang, C.; Yan, F.; Du, C.; Kang, J.; Turkson, R. Evaluating the Degradation Mechanism and State of Health of LiFePO4 Lithium-Ion Batteries in Real-World Plug-in Hybrid Electric Vehicles Application for Different Ageing Paths. Energies 2017, 10, 110. [Google Scholar] [CrossRef]
- Guan, T.; Sun, S.; Gao, Y.; Du, C.; Zuo, P.; Cui, Y.; Zhang, L.; Yin, G. The effect of elevated temperature on the accelerated aging of LiCoO2/mesocarbon microbeads batteries. Appl. Energy 2016, 177, 1–10. [Google Scholar] [CrossRef]
- Barré, A.; Deguilhem, B.; Grolleau, S.; Gérard, M.; Suard, F.; Riu, D. A review on lithium-ion battery ageing mechanisms and estimations for automotive applications. J. Power Sources 2013, 241, 680–689. [Google Scholar] [CrossRef]
- Bloom, I.; Cole, B.W.; Sohn, J.J.; Jones, S.A.; Polzin, E.G.; Battaglia, V.S.; Henriksen, G.L.; Motloch, C.; Richardson, R.; Unkelhaeuser, T.; et al. An accelerated calendar and cycle life study of Li-ion cells. J. Power Sources 2001, 101, 238–247. [Google Scholar] [CrossRef]
- Schmalstieg, J.; Kabitz, S.; Ecker, M.; Sauer, D.U. A holistic aging model for Li(NiMnCo)O2 based 18650 lithium-ion batteries. J. Power Sources 2014, 257, 325–334. [Google Scholar] [CrossRef]
- Shi, Y.; Smith, K.; Wood, E.; Pesaran, A. A multi-node thermal system model for lithium-ion battery packs. In Proceedings of the 2015 American Control Conference, Chicago, IL, USA, 1–3 July 2015; pp. 723–727. [Google Scholar]
- Neubauer, J.; Wood, E. Thru-life impacts of driver aggression, climate, cabin thermal management, and battery thermal management on battery electric vehicle utility. J. Power Sources 2014, 259, 262–275. [Google Scholar] [CrossRef]
- Rao, Z.; Wang, S. A review of power battery thermal energy management. Renew. Sustain. Energy Rev. 2011, 15, 4554–4571. [Google Scholar] [CrossRef]
- Smith, K.; Earleywine, M.; Wood, E.; Neubauer, J.; Pesaran, A. Comparison of Plug-In Hybrid Electric Vehicle Battery Life Across Geographies and Drive Cycles. SAE Tech. Pap. 2012. [Google Scholar] [CrossRef]
- Shirk, M.; Wishart, J. Effects of Electric Vehicle Fast Charging on Battery Life and Vehicle Performance. SAE Tech. Pap. 2015. [Google Scholar] [CrossRef]
- Chen, D.; Jiang, J.; Kim, G.H.; Yang, C.; Pesaran, A. Comparison of different cooling methods for lithium ion battery cells. Appl. Therm. Eng. 2016, 94, 846–854. [Google Scholar] [CrossRef]
- Hosseinzadeh, E.; Barai, A.; Marco, J.; Jennings, P. A Comparative Study on Different Cooling Strategies for Lithium-Ion Battery Cells. In Proceedings of the European Battery Hybrid and Fuel Cell Electric Vehicle Congress, Geneva, Switzerland, 14–16 March 2017; pp. 1–9. [Google Scholar]
- Pesaran, A.A. Battery Thermal Management in EV and HEVs: Issues and Solutions. Batter. Man 2001, 43, 34–49. [Google Scholar]
- Wang, Y.; Gao, Q.; Zhang, T.; Wang, G.; Jiang, Z.; Li, Y. Advances in Integrated Vehicle Thermal Management and Numerical Simulation. Energies 2017, 10, 1636. [Google Scholar] [CrossRef]
- Yokoyama, A.; Osaka, T.; Imanishi, Y.; Sekiya, S. Thermal Management System for Electric Vehicles. SAE Int. J. Mater. Manuf. 2011, 4. [Google Scholar] [CrossRef]
- Lohse-Busch, H.; Duoba, M.; Rask, E.; Stutenberg, K.; Gowri, V.; Slezak, L.; Anderson, D. Ambient Temperature (20°F, 72°F and 95°F) Impact on Fuel and Energy Consumption for Several Conventional Vehicles, Hybrid and Plug-In Hybrid Electric Vehicles and Battery Electric Vehicle. SAE Tech. Pap. 2013. [Google Scholar] [CrossRef]
- Kandasamy, N.; Whelan, S. Numerical Investigations of Vehicle Climate Control Strategies Impact on Plug-In Electrical Vehicle Battery Range. SAE Tech. Pap. 2017. [Google Scholar] [CrossRef]
- Kambly, K.R.; Bradley, T.H. Estimating the HVAC energy consumption of plug-in electric vehicles. J. Power Sources 2014, 259, 117–124. [Google Scholar] [CrossRef]
- Barnitt, R.A.; Brooker, A.D.; Ramroth, L.; Rugh, J.; Smith, K.A. Analysis of Off-Board Powered Thermal Preconditioning in Electric Drive Vehicles. In Proceedings of the 25th World Battery, Hybrid and Fuel Cell Electric Vehicle Symposium & Exhibition, Shenzhen, China, 5–9 November 2010. [Google Scholar]
- Shojaei, S.; Robinson, S.; McGordon, A.; Marco, J. Passengers vs. Battery: Calculation of Cooling Requirements in a PHEV. SAE Tech. Pap. 2016. [Google Scholar] [CrossRef]
- Rugh, J.A.; Pesaran, A.; Smith, K. Electric Vehicle Battery Thermal Issues and Thermal Management Techniques. In Proceedings of the SAE 2011 Alternative Refrigerant and System Efficiency Symposium, Scottsdale, AZ, USA, 27–29 September 2011. [Google Scholar]
- Krüger, I.L.; Limperich, D.; Schmitz, G. Energy Consumption Of Battery Cooling In Hybrid Electric Vehicles. In Proceedings of the International Refrigetation and Air Conditioning Conference, Lafayette, IN, USA, 16–19 July 2012. [Google Scholar]
- Oh, M.S.; Ahn, J.H.; Kim, D.W.; Jang, D.S.; Kim, Y. Thermal comfort and energy saving in a vehicle compartment using a localized air-conditioning system. Appl. Energy 2014, 133, 14–21. [Google Scholar] [CrossRef]
- Pesaran, A.; Santhanagopalan, S.; Kim, G.-H. Addressing the Impact of Temperature Extremes on Large Format Li-Ion Batteries for Vehicle Applications. In Proceedings of the 30th International Battery Seminar, Ft. Lauderdale, FL, USA, 11–14 March 2013. [Google Scholar]
- Neubauer, J.S.; Wood, E. Will Your Battery Survive a World With Fast Chargers? SAE Tech. Pap. 2015. [Google Scholar] [CrossRef]
- Gross, O.; Clark, S. Optimizing Electric Vehicle Battery Life through Battery Thermal Management. SAE Int. J. Engines 2011, 4, 1928–1943. [Google Scholar] [CrossRef]
- Young, K.; Wang, C.; Wang, L.Y.; Strunz, K. Chapter 2: Electric vehicle battery technologies. In Electric Vehicle Integration into Modern Power Networks; Springer: New York, NY, USA, 2013. [Google Scholar]
- Williamson, S.S. EV and PHEV battery technologies. In Energy Management Strategies Electric and Plug-In Hybrid Electric Vehicles; Springer: New York, NY, USA, 2013; pp. 65–90. [Google Scholar]
- Xing, Y.; Ma, E.W.M.; Tsui, K.L.; Pecht, M. Battery Management Systems in Electric and Hybrid Vehicles. Energies 2011, 4, 1840–1857. [Google Scholar] [CrossRef]
- Idaho National Laboratory (INL). Plugged In: How Americans Charge Their Electric Vehicles; INL: Idaho Falls, ID, USA, 2015.
- Quirós-tortós, J.; Lees, B. A statistical analysis of EV charging behavior in the UK. In Proceedings of the 2015 IEEE PES Innovative Smart Grid Technologies Latin America (ISGT LATAM), Montevideo, Uruguay, 5–7 October 2015; pp. 445–449. [Google Scholar] [CrossRef]
- Hoke, A.; Brissette, A.; Maksimovic, D.; Kelly, D.; Pratt, A. Maximizing lithium ion vehicle battery life through optimized partial charging. In Proceedings of the 2013 IEEE PES Innovative Smart Grid Technologies (ISGT), Washington, DC, USA, 24–27 February 2013. [Google Scholar]
- Neubauer, J.; Brooker, A.; Wood, E. Sensitivity of plug-in hybrid electric vehicle economics to drive patterns, electric range, energy management, and charge strategies. J. Power Sources 2013, 236, 357–364. [Google Scholar] [CrossRef]
- Bashash, S.; Moura, S.J.; Forman, J.C.; Fathy, H.K. Plug-in hybrid electric vehicle charge pattern optimization for energy cost and battery longevity. J. Power Sources 2011, 196, 541–549. [Google Scholar] [CrossRef]
- Hoke, A.; Brissette, A.; Smith, K.; Pratt, A.; Maksimovic, D. Accounting for Lithium-Ion Battery Degradation in Electric Vehicle Charging Optimization. IEEE J. Emerg. Sel. Top. Power Electron. 2014, 2, 691–700. [Google Scholar] [CrossRef]
- Sengupta, M.; Habte, A.; Gotseff, P.; Weekley, A.; Lopez, A.; Anderberg, M.; Molling, C.; Heidinger, A. National Solar Radiation Data Base. Available online: http://rredc.nrel.gov/solar/old_data/nsrdb (accessed on 5 November 2015).
- United Nations Economic Commission for Europe (UNECE). Regulation 101 of the Economic Commission for Europe of the United Nations. Off. J. Eur. Union 2017, 10, 1–67. [Google Scholar]
- Santos, A.; McGuckin, N.; Nakamoto, H.Y.; Gray, D.; Liss, S. Summary of Travel Trends: 2009 National Household Travel Survey; U.S. Department of Transportation Federal Highway Administration: Washington, DC, USA, 2011; pp. 31–34.
- Shojaei, S.; McGordon, A.; Robinson, S.; Marco, J.; Jennings, P. Developing a model for analysis of the cooling loads of a hybrid electric vehicle by using co-simulations of verified submodels. Proc. Inst. Mech. Eng. Part D J. Autombile Eng. 2017. [Google Scholar] [CrossRef]
- Shojaei, S.; Robinson, S.; Chatham, C.; McGordon, A.; Marco, J. Modelling the Electric Air Conditioning System in a Commercially Available Vehicle for Energy Management Optimisation. SAE Tech. Pap. 2015. [Google Scholar] [CrossRef]
- Srinivasan, R.; Baisden, A.C.; Carkhuff, B.G.; Butler, M.H. The five modes of heat generation in a Li-ion cell under discharge. J. Power Sources 2014, 262, 93–103. [Google Scholar] [CrossRef]
- He, H.; Xiong, R.; Fan, J. Evaluation of Lithium-Ion Battery Equivalent Circuit Models for State of Charge Estimation by an Experimental Approach. Energies 2011, 4, 582–598. [Google Scholar] [CrossRef]
- Ng, K.S.; Moo, C.S.; Chen, Y.P.; Hsieh, Y.C. Enhanced coulomb counting method for estimating state-of-charge and state-of-health of lithium-ion batteries. Appl. Energy 2009, 86, 1506–1511. [Google Scholar] [CrossRef]
- Uddin, K.; Jackson, T.; Widanage, W.D.; Chouchelamane, G.; Jennings, P.A.; Marco, J. On the possibility of extending the lifetime of lithium-ion batteries through optimal V2G facilitated by an integrated vehicle and smart-grid system. Energy 2017. [Google Scholar] [CrossRef]
- Keil, P.; Jossen, A. Aging of Lithium-Ion Batteries in Electric Vehicles: Impact of Regenerative Braking. In Proceedings of the 28th International Electric Vehicle Symposium and Exhibition, Kintex, Korea, 3–6 May 2015; pp. 1–11. [Google Scholar] [CrossRef]
- Broussely, M.; Biensan, P.; Bonhomme, F.; Blanchard, P.; Herreyre, S.; Nechev, K.; Staniewicz, R.J. Main aging mechanisms in Li ion batteries. J. Power Sources 2005, 146, 90–96. [Google Scholar] [CrossRef]
- Neubauer, J.; Pesaran, A. The ability of battery second use strategies to impact plug-in electric vehicle prices and serve utility energy storage applications. J. Power Sources 2011, 196, 10351–10358. [Google Scholar] [CrossRef]
- Ecker, M.; Nieto, N.; Käbitz, S.; Schmalstieg, J.; Blanke, H.; Warnecke, A.; Sauer, D.U. Calendar and cycle life study of Li(NiMnCo)O2-based 18650 lithium-ion batteries. J. Power Sources 2014, 248, 839–851. [Google Scholar] [CrossRef]
- Watanabe, S.; Kinoshita, M.; Nakura, K. Capacity fade of LiNi(1−x−y)CoxAlyO2 cathode for lithium-ion batteries during accelerated calendar and cycle life test. I. Comparison analysis between LiNi(1−x−y)CoxAlyO2 and LiCoO2 cathodes in cylindrical lithium-ion cells during long term storage test. J. Power Sources 2014, 247, 412–422. [Google Scholar] [CrossRef]
- Wood, E.; Neubauer, J.; Brooker, A.D.; Gonder, J.; Smith, K.A. Variability of battery wear in light duty plug-in electric vehicles subject to ambient temperature, battery size, and consumer usage. In Proceedings of the International Battery, Hybrid and Fuel Cell Electric Vehicle Symposium 26 (EVS26), Los Angeles, CA, USA, 6–9 May 2012; pp. 270–281. [Google Scholar]
- Cherry, J. Battery Durability in Electrified Vehicle Applications: A Review of Degradation Mechanisms and Durability Testing; Prepared for Environmental Protection Agency: Ann Arbor, MI, USA, 2015.
- Waschl, H.; Kolmanovsky, I.; Steinbuch, M.; Del Re, L. Optimization and Optimal Control in Automotive Systems; Springer: Berlin, Germany, 2014. [Google Scholar]
- Sundström, O. Optimal Control and Design of Hybrid-Electric Vehicles. Ph.D. Thesis, Chalmers University of Technology, Göteborg, Sweden, 2009. [Google Scholar]
- Zhang, S.; Xiong, R. Adaptive energy management of a plug-in hybrid electric vehicle based on driving pattern recognition and dynamic programming. Appl. Energy 2015, 155, 68–78. [Google Scholar] [CrossRef]
- Kirkpatrick, S.; Gelatt, C.D.; Vecchi, M.P. Optimization by Simulated Annealing. Science 1983, 220, 671–680. [Google Scholar] [CrossRef] [PubMed]
- Lei, Z.; Cheng, D.; Liu, Y.; Qin, D.; Zhang, Y.; Xie, Q. A dynamic control strategy for hybrid electric vehicles based on parameter optimization for multiple driving cycles and driving pattern recognition. Energies 2017, 10. [Google Scholar] [CrossRef]
- Shojaei, S.; Strickland, D.; Scott, D.; Tucker, M.; Kirkpatrick, G.; Price, B.; Luke, S.; Richmond, J. Powertrain optimisation in a hybrid electric bus. In Proceedings of the VPPC 2012: IEEE Vehicle Power and Propulsion Conference, Seoul, Korea, 9–12 October 2012; pp. 857–862. [Google Scholar] [CrossRef]
- Environmental Protection Agency and Deprartment of Transportation. 2017 and Later Model Year Light-Duty Vehicle Greenhouse Gas Emissions and Corporate Average Fuel Economy Standards: Final Rule. Fed. Regist. 2012, 77, 62623–63200. [Google Scholar]
- Shen, J.; Dusmez, S.; Khaligh, A. Optimization of Sizing and Battery Cycle Life in Battery/Ultracapacitor Hybrid Energy Storage System for Electric Vehicle Applications. IEEE Trans. Ind. Inform. 2014, 10, 2112–2121. [Google Scholar] [CrossRef]
- Ashwin, T.R.; McGordon, A.; Widanage, W.D.; Jennings, P.A. Modified electrochemical parameter estimation of NCR18650BD battery using implicit finite volume method. J. Power Sources 2017, 341, 387–395. [Google Scholar] [CrossRef]
Figure 1.
Daily vehicle speed profile.

Figure 2.
Daily air temperature and solar load profiles assumed for the summer and winter seasons.
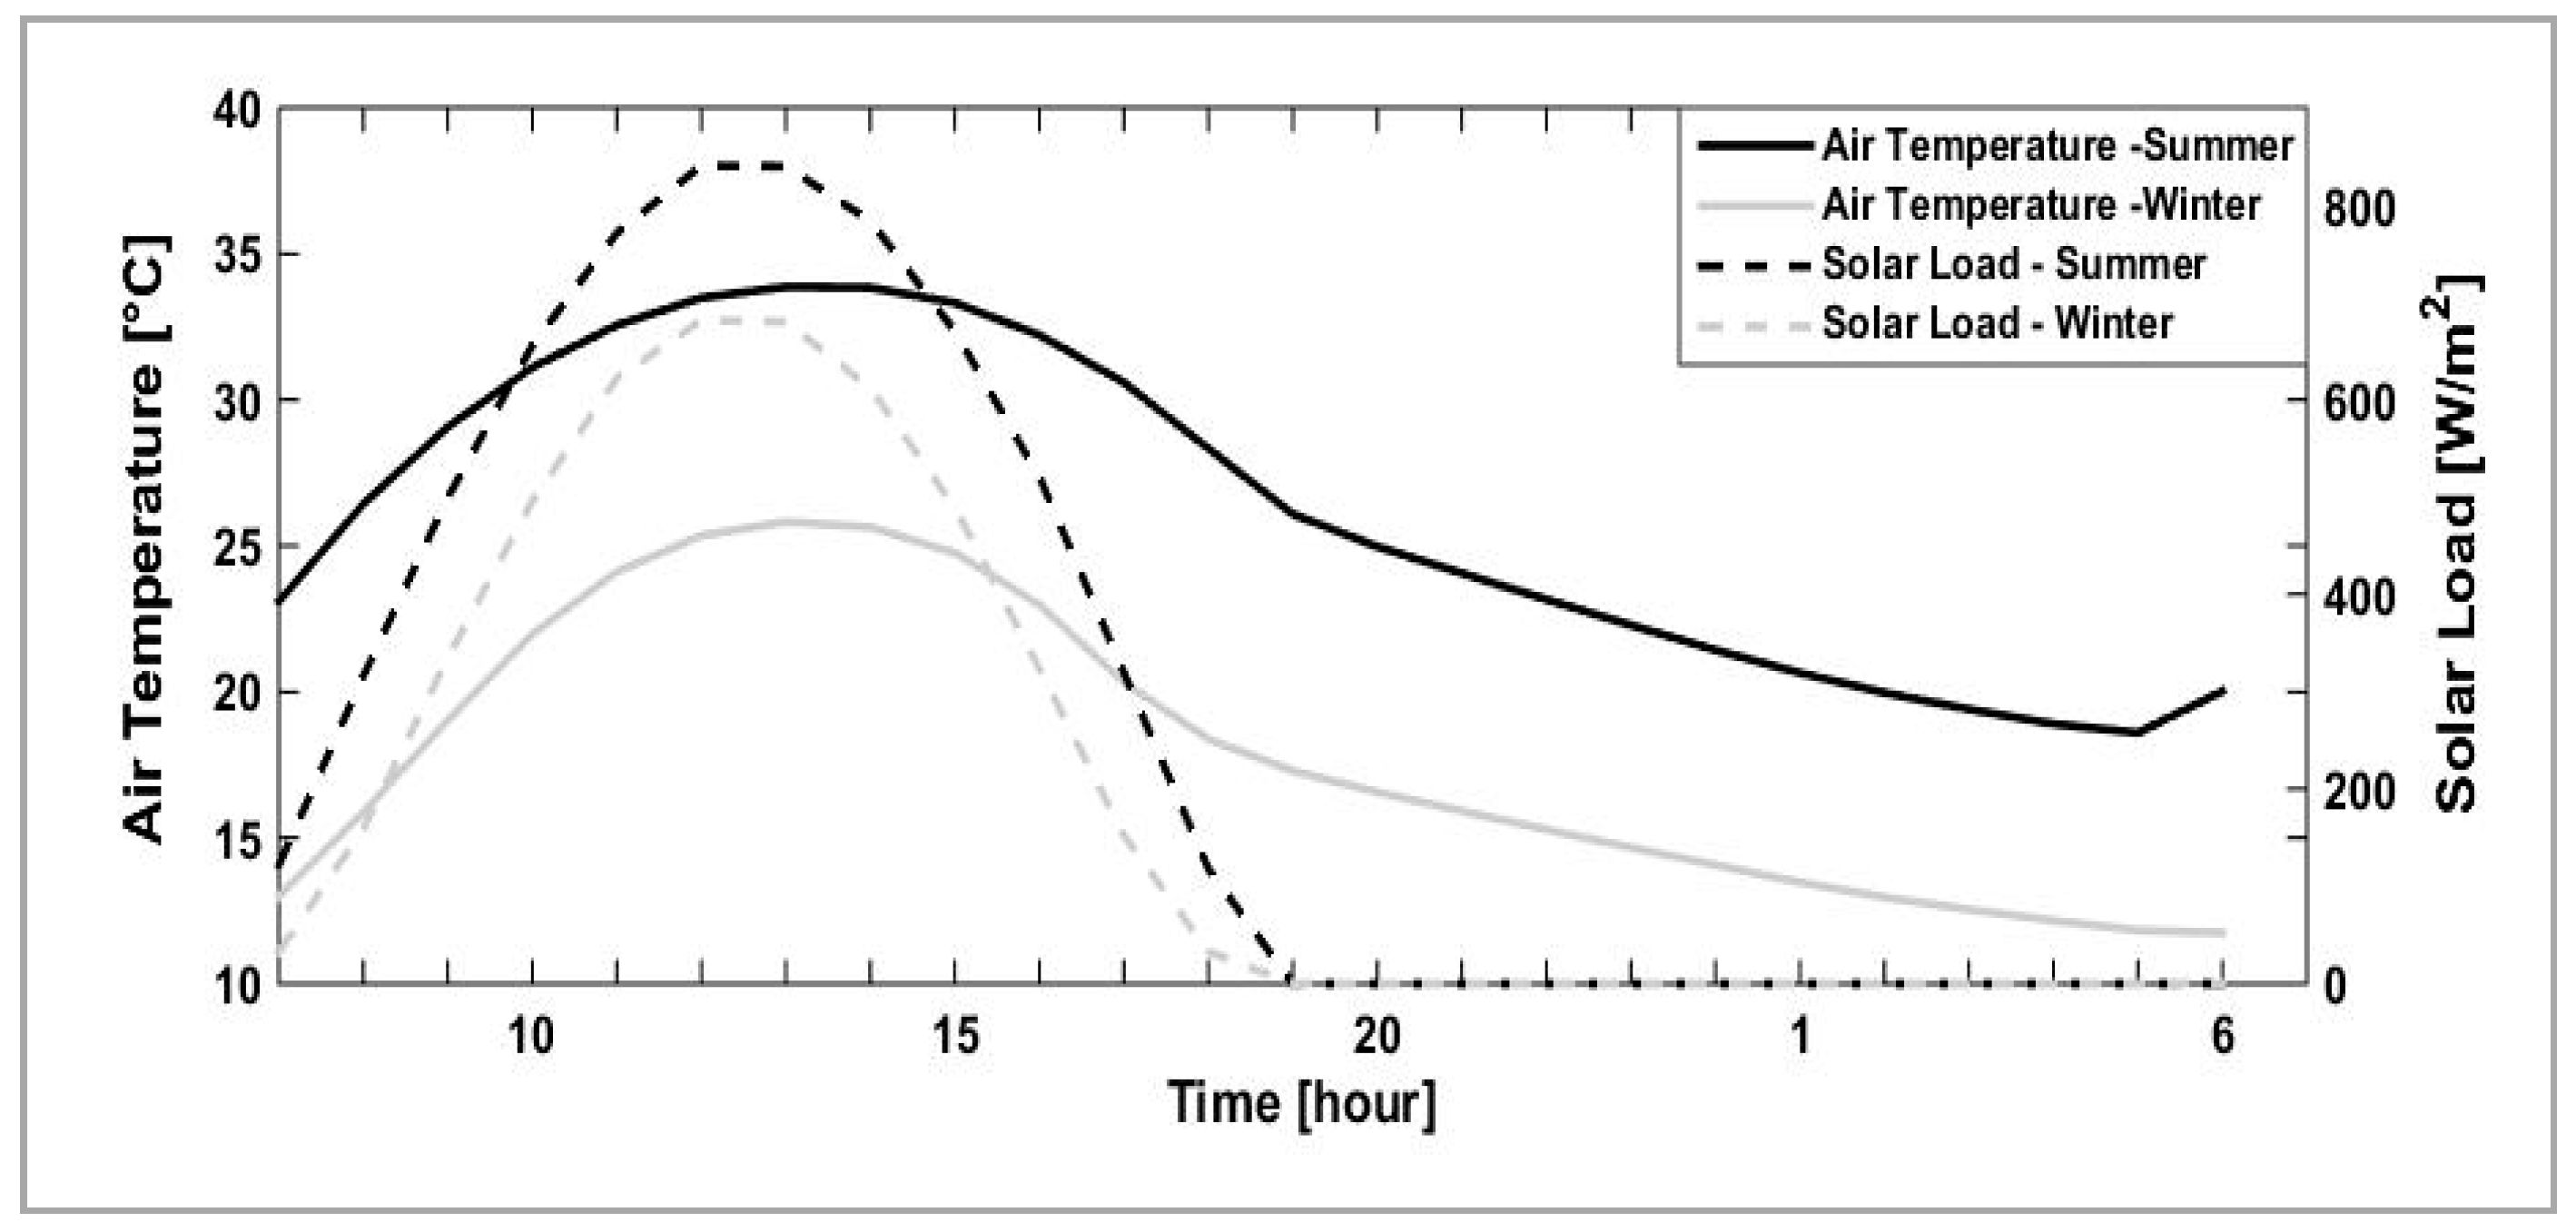
Figure 3.
Vehicle model layout.

Figure 4.
Daily profile of (a) the temperature of the cabin and the battery; and (b) the battery SoC in summer.
Figure 4.
Daily profile of (a) the temperature of the cabin and the battery; and (b) the battery SoC in summer.

Figure 5.
Simulation results: variations in (a) vehicle speed; (b) engine torque; (c) battery SoC and (d) the temperature of the cabin and battery over the trips.
Figure 5.
Simulation results: variations in (a) vehicle speed; (b) engine torque; (c) battery SoC and (d) the temperature of the cabin and battery over the trips.

Figure 6.
Effect of the battery on the thermal conditions of the cabin after hot soak (Trip 2): (a) the absolute cabin; (b) temperature offset.
Figure 6.
Effect of the battery on the thermal conditions of the cabin after hot soak (Trip 2): (a) the absolute cabin; (b) temperature offset.

Figure 7.
Organization of Section 4, Section 5, Section 6 and Section 7 of this paper. The variables highlighted in red are evaluated or defined during the execution of the optimization algorithm. (a) Section 4, baseline scenario; (b) Section 5, key-off cooling for minimizing ; (c) Section 6, key-off cooling in view of complete duty cycle; and (d) Section 7, key-off cooling and partial charging.

Figure 8.
Optimum trajectory of (a) cooling flag; (b) battery temperature; and (c) SoC for key-off cooling in Day Park.
Figure 8.
Optimum trajectory of (a) cooling flag; (b) battery temperature; and (c) SoC for key-off cooling in Day Park.

Figure 9.
Cost terms of Equation (9) mapped onto : (a) fuel consumption in Trip 2; (b) capacity loss in Trip 2; (c) discomfort index in Trip 2; (d) capacity loss in Night Park; The axes of (c) and (d) have been rotated for improved clarity.
Figure 9.
Cost terms of Equation (9) mapped onto : (a) fuel consumption in Trip 2; (b) capacity loss in Trip 2; (c) discomfort index in Trip 2; (d) capacity loss in Night Park; The axes of (c) and (d) have been rotated for improved clarity.

Figure 10.
Result of optimizing key-off cooling of the battery for different weightings of objectives (a-1,a-2) λ = {1, 0, 0}; (b-1,b-2) λ = {0, 1, 0}; (c-1,c-2) ; and (d-1,d-2) . Annotations: left hand side figures (marked ‘1’) show the daily profile of the battery temperature (blue) and the SoC (red). In right-hand side figures (marked “2”), the cabin temperature in Trip 2 is plotted in blue, with solid line for optimized PHEV, with a dashed line for baseline PHEV, and with a dotted line for the conventional vehicle. Also the engine torque in Trip 2 is plotted in red.

Figure 11.
Flow chart of the process used for solving the problem defined by (16).

Figure 12.
Progress of the integrated partial charging and key-off cooling optimisation- figure is relate to . (a) in iterations of the algorithm, (b) function value, (c) phase-by-phase breakdown of cost terms for 6 distinct iterations, and (d) histogram of battery temperature in Day Park.
Figure 12.
Progress of the integrated partial charging and key-off cooling optimisation- figure is relate to . (a) in iterations of the algorithm, (b) function value, (c) phase-by-phase breakdown of cost terms for 6 distinct iterations, and (d) histogram of battery temperature in Day Park.

Figure 13.
Result of integrated optimization of key-off cooling and partial charging. (a) Daily profile of battery temperature and SoC and (b) profiles of engine torque and cabin temperature (conventional, baseline, and optimized cases) in Trip 2.
Figure 13.
Result of integrated optimization of key-off cooling and partial charging. (a) Daily profile of battery temperature and SoC and (b) profiles of engine torque and cabin temperature (conventional, baseline, and optimized cases) in Trip 2.


Table 1.
Duty cycle assumptions.
| Phase | Duration | Plugged In | Indoor | Ambient | ||
| Phase | Trip 1 | 600 s (US06) | -- | -- | Figure 2 | |
| Day Park | 8 h | no | no | |||
| Trip 2 | 600 s (US06) | -- | -- | |||
| Night Park | 15.5 h (approximately) | Yes 13.2 kW charger | Yes | 25 °C (summer) 15 °C (winter) | ||
| Initial Conditions | Parameter | Value | ||||
| Battery SoC | 95% | |||||
| Battery/cabin temperature | 25 °C (summer) 15 °C (winter) | |||||
Table 2.
Specifications of the target vehicle.
| Specification | Value | |
|---|---|---|
| Type | sport utility vehicle | |
| Architecture | All-wheel-drive parallel plug-in hybrid | |
| Test Weight (European Union) | 2270 kg | |
| Engine | 3.0Lv6 diesel, 140 kW | |
| Electric Machine | rated power | 75 kW |
| rated torque | 420 Nm | |
| Traction Battery | energy capacity | 16.8 kWh |
| voltage | 430 V | |
| thermal capacity | 190,000 J/K | |
| cell type | cylindrical NCA | |
Table 3.
Control parameters adopted from the target vehicle specifications.
| Parameter | Value |
|---|---|
| SoC window: charge depleting mode | 95–10% |
| SoC window: charge sustaining mode | 10–13% |
| Lower SoC limit for electric pull-away | 11% |
| setpoint | 22 °C |
| setpoint | 25 °C–30 °C |
| overheat (power cut-off) | 50 °C |
| high temperature threshold (50% power cap) | 45 °C |
Table 4.
Battery capacity loss and lifetime calculations.
| Winter | Summer | |||||||
|---|---|---|---|---|---|---|---|---|
| Trip 1 | Day Park | Trip 2 | Night Park | Trip 1 | Day Park | Trip 2 | Night Park | |
| (%) | 84.4 | 74.7 | 62.6 | 53.4 | 84.5 | 74.6 | 68.8 | 59.0 |
| (°C) | 18.5 | 24.9 | 29.6 | 15.0 | 28.0 | 39.0 | 43.0 | 26.0 |
| Number of cycles | 28.4 | 0.0 | 30.7 | 40.2 | 28.2 | 0.00 | 27.8 | 36.4 |
| Storage per season (%) | 0.00 | 0.64 | 0.00 | 0.86 | 0.00 | 1.07 | 0.00 | 1.17 |
| Cycling per season (%) | 0.16 | 0.00 | 0.16 | 0.23 | 0.15 | 0.00 | 0.16 | 0.17 |
| Total per season (%) | 2.05 | 2.72 | ||||||
| Total per year (%) | 4.76 | |||||||
| Lifetime (years) | 6.3 | |||||||
Table 5.
Performance measures of the PHEV (summer).
| Battery Lifetime | |||
|---|---|---|---|
| 6.3 (years) | 0.23 (L) | 0.37 (L) | 59 |
Table 6.
Effect of applying key-off cooling as shown in Figure 8 on the battery. Data only represent Day Park.
Table 6.
Effect of applying key-off cooling as shown in Figure 8 on the battery. Data only represent Day Park.
| Without Key-Off Cooing | With Key-Off Cooling | |
|---|---|---|
| (%) | 74.6 | 58.8 |
| (°C) | 39.0 | 27.8 |
| Cycle count (n) * | 0 | 26.7 |
| Storage (%) * | 1.07 | 0.40 |
| Cycling (%) * | 0 | 0.14 |
* Per summer season.
Table 7.
Breakdown of cost terms for different solutions of Equation (13). The capacity loss and the fuel consumption figures are quoted per season.
Table 7.
Breakdown of cost terms for different solutions of Equation (13). The capacity loss and the fuel consumption figures are quoted per season.
| Solution | Batt. EoL | |||||
|---|---|---|---|---|---|---|
| (%) | (%) | (%) | (years>) | (L) | (-) | |
| Baseline | 1.07 | 0.16 | 1.364 | 6.3 | 67.5 | 59 |
| Minimization of : | 1.07 | 0.17 | 0.98 | 6.8 | 41.7 | 56 |
| Minimization of : | 0.47 | 0.18 | 0.69 | 8.5 | 121.3 | 21 |
| Minimization of : | 0.87 | 0.16 | 0.90 | 7.3 | 41.7 | 6 |
| Trade-off solution: | 0.62 | 0.17 | 0.77 | 8.0 | 41.7 | 6 |
Table 8.
Breakdown of cost terms for the solution of Problems (13) and (16). Due to imposing a minimum charge of 40%, the impact of charge optimization on the vehicle in Trip 1 is negligible, and the associated cost terms are not quoted in the table.
Table 8.
Breakdown of cost terms for the solution of Problems (13) and (16). Due to imposing a minimum charge of 40%, the impact of charge optimization on the vehicle in Trip 1 is negligible, and the associated cost terms are not quoted in the table.
| Row | Solution | Batt. EoL | ||||||
|---|---|---|---|---|---|---|---|---|
| (%) | (%) | (%) | (%) | (years) | (L) | -- | ||
| 1 | Baseline: without key-off cooling or partial charging | 95 | 1.07 | 0.16 | 1.34 | 6.3 | 67.5 | 59 |
| 2 | optimized key-off cooling (Figure 10d-1,d-2) | 95 | 0.62 | 0.17 | 0.75 | 8.0 | 41.7 | 6 |
| 3 | optimized partial charging +key-off cooling (Figure 13) | 89 | 0.61 | 0.17 | 0.70 | 8.2 | 41.7 | 6 |
| 4 | optimized partial charging +key-off cooling | 68 | 0.47 | 0.18 | 0.61 | 8.7 | 41.7 | 49 |
| 5 | lowest possible charge without key-off cooling | 55 | 0.58 | 0.17 | 0.58 | 8.5 | 67.5 | 59 |
© 2017 by the authors. Licensee MDPI, Basel, Switzerland. This article is an open access article distributed under the terms and conditions of the Creative Commons Attribution (CC BY) license (http://creativecommons.org/licenses/by/4.0/).
Share and Cite
MDPI and ACS Style
Shojaei, S.; McGordon, A.; Robinson, S.; Marco, J. Improving the Performance Attributes of Plug-in Hybrid Electric Vehicles in Hot Climates through Key-Off Battery Cooling. Energies 2017, 10, 2058. https://doi.org/10.3390/en10122058
AMA Style
Shojaei S, McGordon A, Robinson S, Marco J. Improving the Performance Attributes of Plug-in Hybrid Electric Vehicles in Hot Climates through Key-Off Battery Cooling. Energies. 2017; 10(12):2058. https://doi.org/10.3390/en10122058
Chicago/Turabian StyleShojaei, Sina, Andrew McGordon, Simon Robinson, and James Marco. 2017. "Improving the Performance Attributes of Plug-in Hybrid Electric Vehicles in Hot Climates through Key-Off Battery Cooling" Energies 10, no. 12: 2058. https://doi.org/10.3390/en10122058
Note that from the first issue of 2016, this journal uses article numbers instead of page numbers. See further details here.