Article

The General Regression Neural Network Based on the Fruit Fly Optimization Algorithm and the Data Inconsistency Rate for Transmission Line Icing Prediction

School of Economics and Management, North China Electric Power University, Beijing 102206, China
*
Author to whom correspondence should be addressed.
Energies 2017, 10(12), 2066; https://doi.org/10.3390/en10122066
Submission received: 26 October 2017 / Revised: 28 November 2017 / Accepted: 29 November 2017 / Published: 5 December 2017

Abstract

:
Accurate and stable prediction of icing thickness on transmission lines is of great significance for ensuring the safe operation of the power grid. In order to improve the accuracy and stability of icing prediction, an innovative prediction model based on the generalized regression neural network (GRNN) and the fruit fly optimization algorithm (FOA) is proposed. Firstly, a feature selection method based on the data inconsistency rate (IR) is adopted to select the optimal feature, which aims to reduce redundant input vectors. Then, the fruit FOA is utilized for optimization of smoothing factor for the GRNN. Lastly, the icing forecasting method FOA-IR-GRNN is established. Two cases in different locations and different months are selected to validate the proposed model. The results indicate that the new hybrid FOA-IR-GRNN model presents better accuracy, robustness, and generality in icing forecasting.

1. Introduction

The transmission line ice coating can cause many types of accidents, including those related to flashover performance of the ice-covered insulator, breakage of the ground line, and the collapse of the tower [1]. They seriously affect the stability and security of power system operation. Since the recording of icing accidents began, cases of transmission line ice coating causing the fall of high voltage (HV) transmission line towers as well as wire breakages have been reported at home and abroad. Some accidents are serious. In January 1998, a week-long ice disaster occurred in Canada, which caused a blackout for one million users [2]. January 2008 witnessed four successive large-scale rainy and snowy storms in the south of China. The electricity grid was seriously iced and the power line was repeatedly broken, resulting in a direct economic loss of 10.45 billion CNY [3]. Therefore, establishing a prediction model of icing thickness and predicting the icing thickness of transmission lines accurately are of great significance for ensuring the security and stability of the power grid.
Currently, some scholars at home and abroad are researching icing thickness prediction of the transmission line. They have put forward a variety of forecasting models, which mainly include mathematical physics prediction models, statistical prediction models, and intelligent prediction models. The mathematical physics prediction model mostly predicts the icing thickness of the transmission line, based on the fluid motion law and the heat transfer mechanism of the wire icing [4]. The authors of [5], from the view of aerodynamics and thermodynamics, establish an icing forecasting model including the super-cooled water drop and the heat transfer process on ice. The authors of [6] point out that the icing of transmission lines is the result of coupling effect of thermodynamics, hydromechanics, and the electric current and field. On this basis, the physics prediction model of icing thickness is built. In addition, typical mathematical physics prediction methods for icing thickness include the Imai model [7], the Goodwin model [8] and the Lenhard model [9]. However, due to the fact that some of the parameters in the mathematical physics prediction model are difficult to obtain through the measurement in the actual line, such models are more difficult to apply directly to the ice prediction of the actual transmission lines. The statistical prediction model is based on the statistical laws of icing thickness of transmission lines [10], mainly including the extrema prediction model [11], Markov chain prediction model [12], and so on. However, the icing thickness prediction model based on the data statistics method cannot be extended to other transmission lines with different geographical environments, so the desired effect of this model is not satisfactory.
Therefore, under the background of rapid development of artificial intelligence technology, it is more significant to predict the icing thickness of transmission lines by using intelligent prediction methods. Intelligent prediction methods mainly include artificial neural networks (ANNs) [13] and the support vector machine (SVM) [14]. Here, the back-propagation neural network (BPNN) is typical of ANNs. Luo et al. [15] presented an icing forecasting model of BPNN based on Levenberg–Marquardt and obtained a higher prediction accuracy than the statistical forecasting model. However, the BPNN has the problem of many parameters to set, and can easily to fall into over-fitting or local optimum. For avoiding the local optimum problem, some scholars began to adopt the SVM model in the field of icing prediction. Li et al. [16] proposed a model based on the SVM for icing forecasting and its generalization ability is better than the model based on the BPNN. Ma et al. [17] introduced a short-term prediction model of icing thickness based on grey SVM, and it was pointed out that the model can achieve better prediction effect in ice-prone areas. However, it is difficult for the SVM model to deal with large-scale training samples, so it cannot obtain ideal prediction accuracy. The generalized regression neural network (GRNN) is a kind of radial basis function neural network proposed by Specht, which has a strong ability for nonlinear mapping [18]. Compared with the BPNN and the SVM, the GRNN has fewer adjustment parameters, does not easily fall into local minima, and is good at processing large-scale training samples. In addition, the GRNN has an advantage in forecasting volatile data. Therefore, the GRNN has been widely employed in the field of prediction, such as electricity price forecasting [19], energy consumption forecasting [20], and traffic flow forecasting [21]. Zhang et al. [19] introduced a novel hybrid forecasting model using the GRNN combined with wavelet transform for electricity price forecasting, and this model obtained better forecasting performance compared with the BPNN and SVM. Zhao et al. [20] utilized the GRNN model to forecast the annual energy consumption due to its good ability for dealing with the nonlinear problems. Leng et al. [21] established a short-term forecasting model of traffic flow based on the GRNN and it has stronger approximation capability and higher forecasting accuracy than the forecasting models of the radial basis function (RBF) and back-propagation (BP) neural network.
However, it is difficult to determine the smoothing factor in the GRNN model exactly and the selection of this parameter has a significant influence on its forecasting performance. Intelligent optimization algorithms such as the genetic algorithm (GA) [22] and particle swarm optimization (PSO) [23] are usually taken to select parameters for forecasting models. Gao et al. [22] proposed the GA to optimize the initial weights and thresholds of BPNN for housing price prediction, which accelerated the convergence rate of BPNN and improved the prediction accuracy of house prices. Ye [23] presented a kernel extreme learning machine model based on particle swarm optimization (PSO-KELM) to predict the power interval of wind power. PSO algorithm is utilized to optimize the output weights of KELM, and satisfactory prediction results are obtained. The above algorithms effectively improved the forecasting accuracy but also presented the malpractice of easily falling into local optimum. In order to overcome the drawbacks, the fruit fly optimization algorithm (FOA) [24], based on the behaviors of food finding, was proposed by Pan in 2011. This method only needs to set a few parameters and performs at a relatively high speed for optimum searching with wide applications [25]. Sun et al. [26] introduced a new model based on wavelet transform and the least-squares support vector machine (LSSVM) optimized by the FOA for short-term load forecasting and compared the forecasting results between the proposed model and least-squares SVM optimized by PSO, which demonstrated that the FOA performed better than PSO. In addition, Li et al. [27] presented an LSSVM-based annual electric load forecasting model optimized by the FOA, and the proposed model obtained better forecasting effectiveness than the LSSVM optimized by the coupled simulated annealing algorithm (CSA). Hence, the FOA is utilized to adjust the appropriate smoothing factor in the GRNN model.
In addition, many factors can influence the formation of icing on the transmission line. If all the influencing factors are used as input indicators of the forecasting model, there will be a lot of redundant data [28]. Hence, the feature selection is also of great significance. Feature selection is about identifying and selecting the appropriate input vector in the prediction model to reduce redundant data and improve computational efficiency. The inconsistency rate (IR) model refers to dividing the feature set into many feature subsets and calculating the minimum inconsistency under this partition mode, so as to determine the optimal feature subsets and complete the feature selection [29]. Ma et al. [30] employed the IR model to select the input features of the short-term load forecasting model, whose simulation result demonstrated that the IR model gave the input vector of the strong pertinence of the prediction model, and reduced the redundancy of the input information, thus improving the accuracy of load forecasting. Liu et al. [31] also selected the optimal features for forecasting power load by adopting the IR model so as to reduce the redundancy of input vectors, and the IR model obtained an ideal feature selection effect. Using the IR model for feature selection can not only eliminate redundancy features by utilizing the inconsistency of the data set, but also take the correlative characteristics among the features into consideration, which does not ignore the relationship among features so that all the statistical information can be perfectly expressed by the selected optimal feature. Hence, this paper adopts the IR model for feature selection.
According to the above research, a GRNN model-integrated IR with the FOA is proposed. It is the first time these three models are combined for icing thickness forecasting and several comparing methods are utilized to validate the effectiveness of the proposed hybrid model. This paper is organized as follows: Section 2 introduces the implementation process of the IR and GRNN optimized by the FOA. Section 3 presents the evaluation criteria of the results. Section 4 provides a case to validate the proposed model. Section 5 analyzes another case in a different place at another time to prove the generalization of the forecasting method. Section 6 presents the conclusions in this paper.

2. Methodology

2.1. Fruit Fly Optimization Algorithm

The FOA is a new global optimization method based on foraging behaviors. There are two steps for searching food of fruit fly swarm: (1) use the olfactory organ to collect odors floating in the air and fly towards the food location; and (2) adopt a view to find food and other fruit flies’ gathering positions and fly towards that direction. The iterative food searching process of the fruit fly swarm is presented in Figure 1.
The steps of looking for the optimal features are as follows:
(1)
Initialize the population size Sizepop, the iterations Maxgen, and the position coordinates (X0, Y0) of the random fruit fly population.
(2)
Give the individual fruit flies’ random flight direction and step size so that they can find food by using the smell:
Where i = 1 , 2 ,
X i = X 0 + R a n d o m V a l u e
Y i = Y 0 + R a n d o m V a l u e
(3)
Since the fruit flies cannot obtain the food position, the distance Disti between the individual and the origin of the flies is estimated first, and the taste concentration determination value Si is calculated:
D i s t i = X i 2 + Y i 2
S i = 1 / D i s t i
(4)
Put the taste concentration determination value Si into the adaptation function Fitness to determine the taste concentration Smelli of the individual position.
S m e l l i = F i t n e s s ( S i )
(5)
Identify the individual of the highest concentration among the fruit fly populations including the concentration and coordinates:
[ b e s t S m e l l b e s t I n d e x ] = max ( S m e l l i )
(6)
Retain the maximum taste concentration value best Smell and its individual coordinates. The fruit fly population uses vision to fly in that direction:
S m e l l b e s t = b e s t S m e l l
X 0 = X ( b e s t I n d e x )
Y 0 = Y ( b e s t I n d e x )
Then, the stage of iterative refinement is entered; repeat steps (2)~(5), and judge that whether the maximum taste concentration is superior to the previous generation, and whether the current iteration is less than the maximum number of iteration Maxgen, and if so, then execute step (6).

2.2. Data Inconsistency Rate

The aim of feature selection under large amounts of historical data of transmission line icing is to distinguish the data characteristics of the strongest correlation with respect to the icing thickness, so as to ensure that the input vector of the icing prediction model has strong pertinence, reducing the redundancy of input information and consequently improving the accuracy of icing prediction of the transmission lines. The inconsistent rate of the data can accurately describe the discrete characteristics of the input feature. Different feature patterns can be obtained by different division modes and different frequency distributions can be obtained by different partition patterns. The calculation of IR can be used to distinguish the distinguishing ability of the data category. The smaller the data IR is, the stronger the classification ability of the eigenvector is.
It is necessary to know the computing methods of the inconsistent rate if we want to perform feature selection by using the inconsistency method. Therefore, assuming that the collected icing thickness data has g characteristics (such as temperature, humidity, wind speed, etc.), which are respectively expressed as G1, G2, …, Gg, Γ stands for feature set and L stands for the feature subset of Γ . Then, it is stipulated that qualification M has c categories and N data instances according to the degree of severity of the lines’ icing. Zji stands for the eigenvalue which corresponds to the feature Fi, and M stands for the value λi, so the data instances can be expressed as [zj, λi]. Thereinto, Zj = [Zj1, Zj2, Zj3, Ʌ, Zjg]. Therefore, the calculation formula of the data inconsistency rate is:
τ = k = 1 p ( l = 1 c f k l max l { f k l } ) N
In the formula, fkl is the number of data instances in the feature subset of the XK mode in the data set; and Xk means that there are in total P patterns of feature partition range (k = 1, 2, …, p; pN). The steps for using the inconsistent rate to perform the feature selection are as follows:
(1)
Initialize the optimal feature subset as null set Γ = { } .
(2)
Calculate the inconsistent rate of the data sets G1, G2, ..., Gg in the feature subsets which are made up with the remaining feature of each subset.
(3)
Select the feature Gi which corresponds to the minimum inconsistent rate as the optimum feature, and then update the optimum feature subset to Γ = { Γ , G i } .
(4)
Calculate the inconsistent rate statistics table of the feature subsets and arrange them from small to large.
(5)
Select the feature subsets L with the smallest number of features, which can be selected as the optimal feature subsets if they satisfy the condition that τ L τ Γ or τ L / τ L is the minimum of the inconsistent rate of all adjacent feature subsets. L is an adjacent feature subset of L .
Using calculating inconsistent rate can not only eliminate redundancy features by utilizing the inconsistency of the data set, but also take the correlative characteristics among the features into consideration, which does not ignore the relationship among features so that all the statistic information can be perfectly expressed by the selected optimal feature.

2.3. Generalized Regression Neural Network

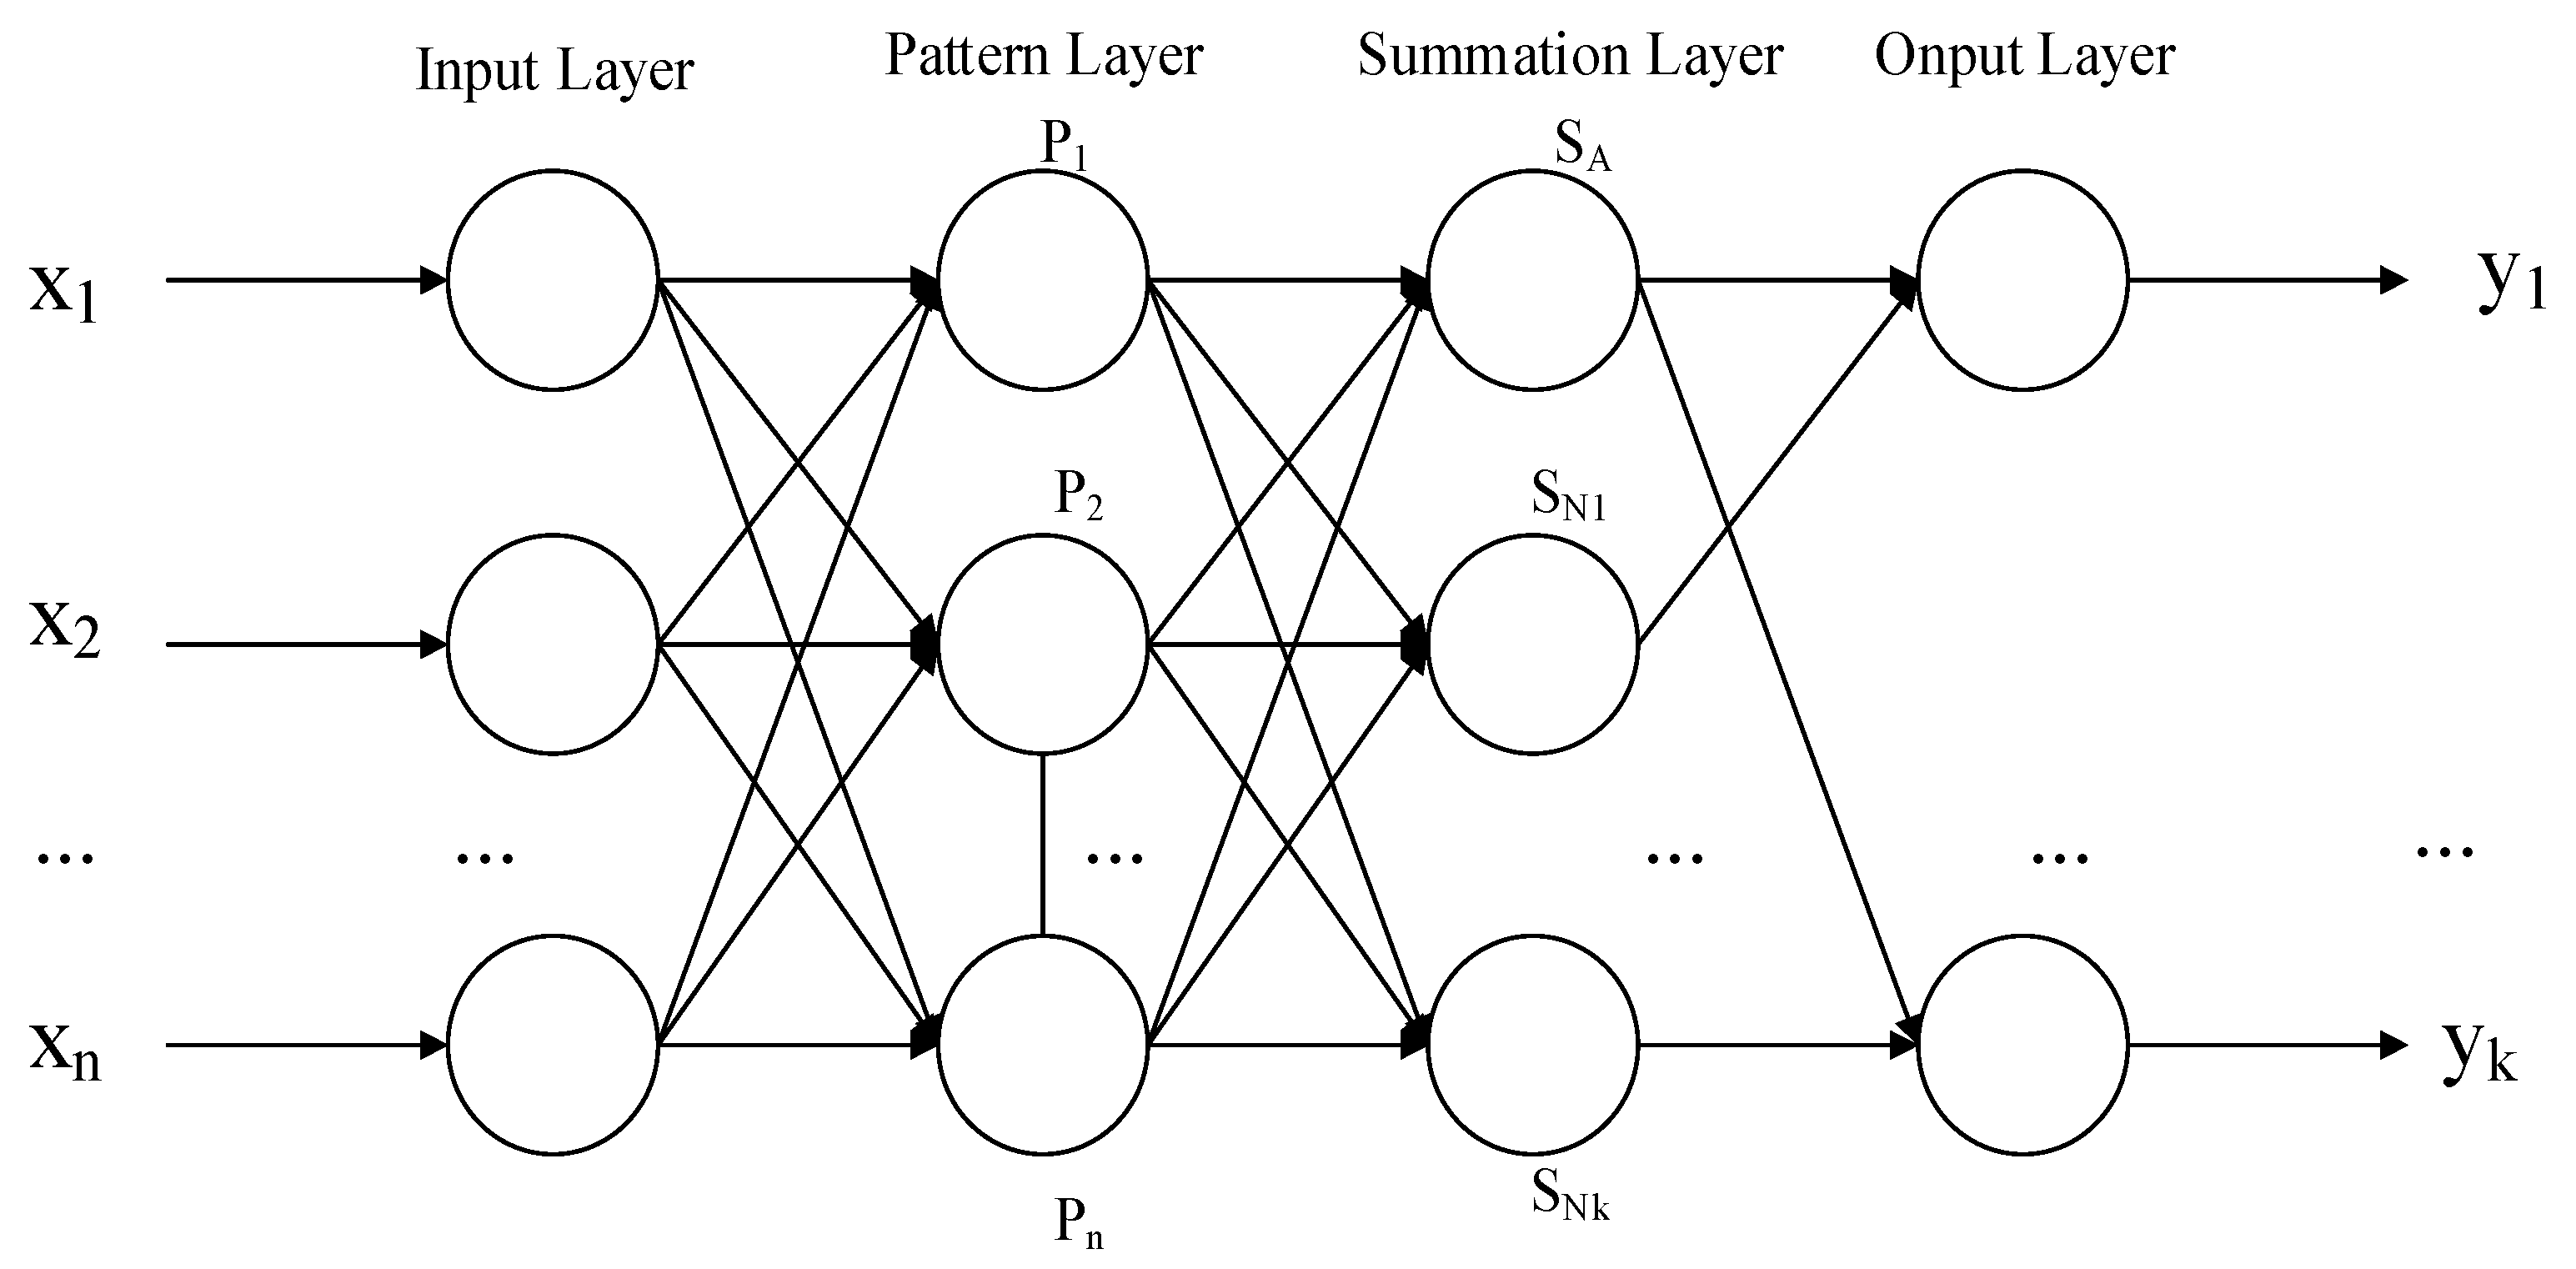
The general regression neural network (GRNN) was proposed by the American scholar Donald F. Specht in 1991, with the theoretical basis of nonlinear regression analysis. As shown in Figure 2, the GRNN constitutes four components:
(1)
The input layer: the original variables enter the network which correspond to the neurons one by one and are submitted to the next layer.
(2)
The pattern layer: nonlinear transformation is applied to the values received from the input layer. The transfer function of the ith neuron in the pattern layer is:
P i = exp [ ( X X i ) T ( X X i ) / 2 σ 2 ] i = 1 , 2 , n ,
where X represents input variable, Xi is the learning sample corresponding to the ith neuron; and σ is the smoothing parameter.
(3)
The summation layer: calculate the sum and weighted sum of the pattern outputs.
The summation layer contains two types of neurons, in which one neuron SA makes arithmetic summation of the output of all pattern layer neurons, and the connection weight of each neuron in the pattern layer to this neuron is 1. Its transfer function is:
S A = i = 1 n P i
The outputs of all neurons in the pattern layer were weighted and summed to gain the other neurons SNj in the summation layer. The transfer function of the other neurons in the summation layer is:
S N j = i = 1 n y i j P i j = 1 , 2 , , k ,
where yij is the connection weight between the ith neuron in the pattern layer and the jth neuron in the summation layer. yij is the jth element in the ith output sample yi.
(4)
The output layer: the forecasting results can be derived. The output of each neuron is:
y j = S N j s A j = 1 , 2 , , k ,
where yj is the output of the jth neuron.

2.4. The Forecasting Model of FOA-IR-GRNN

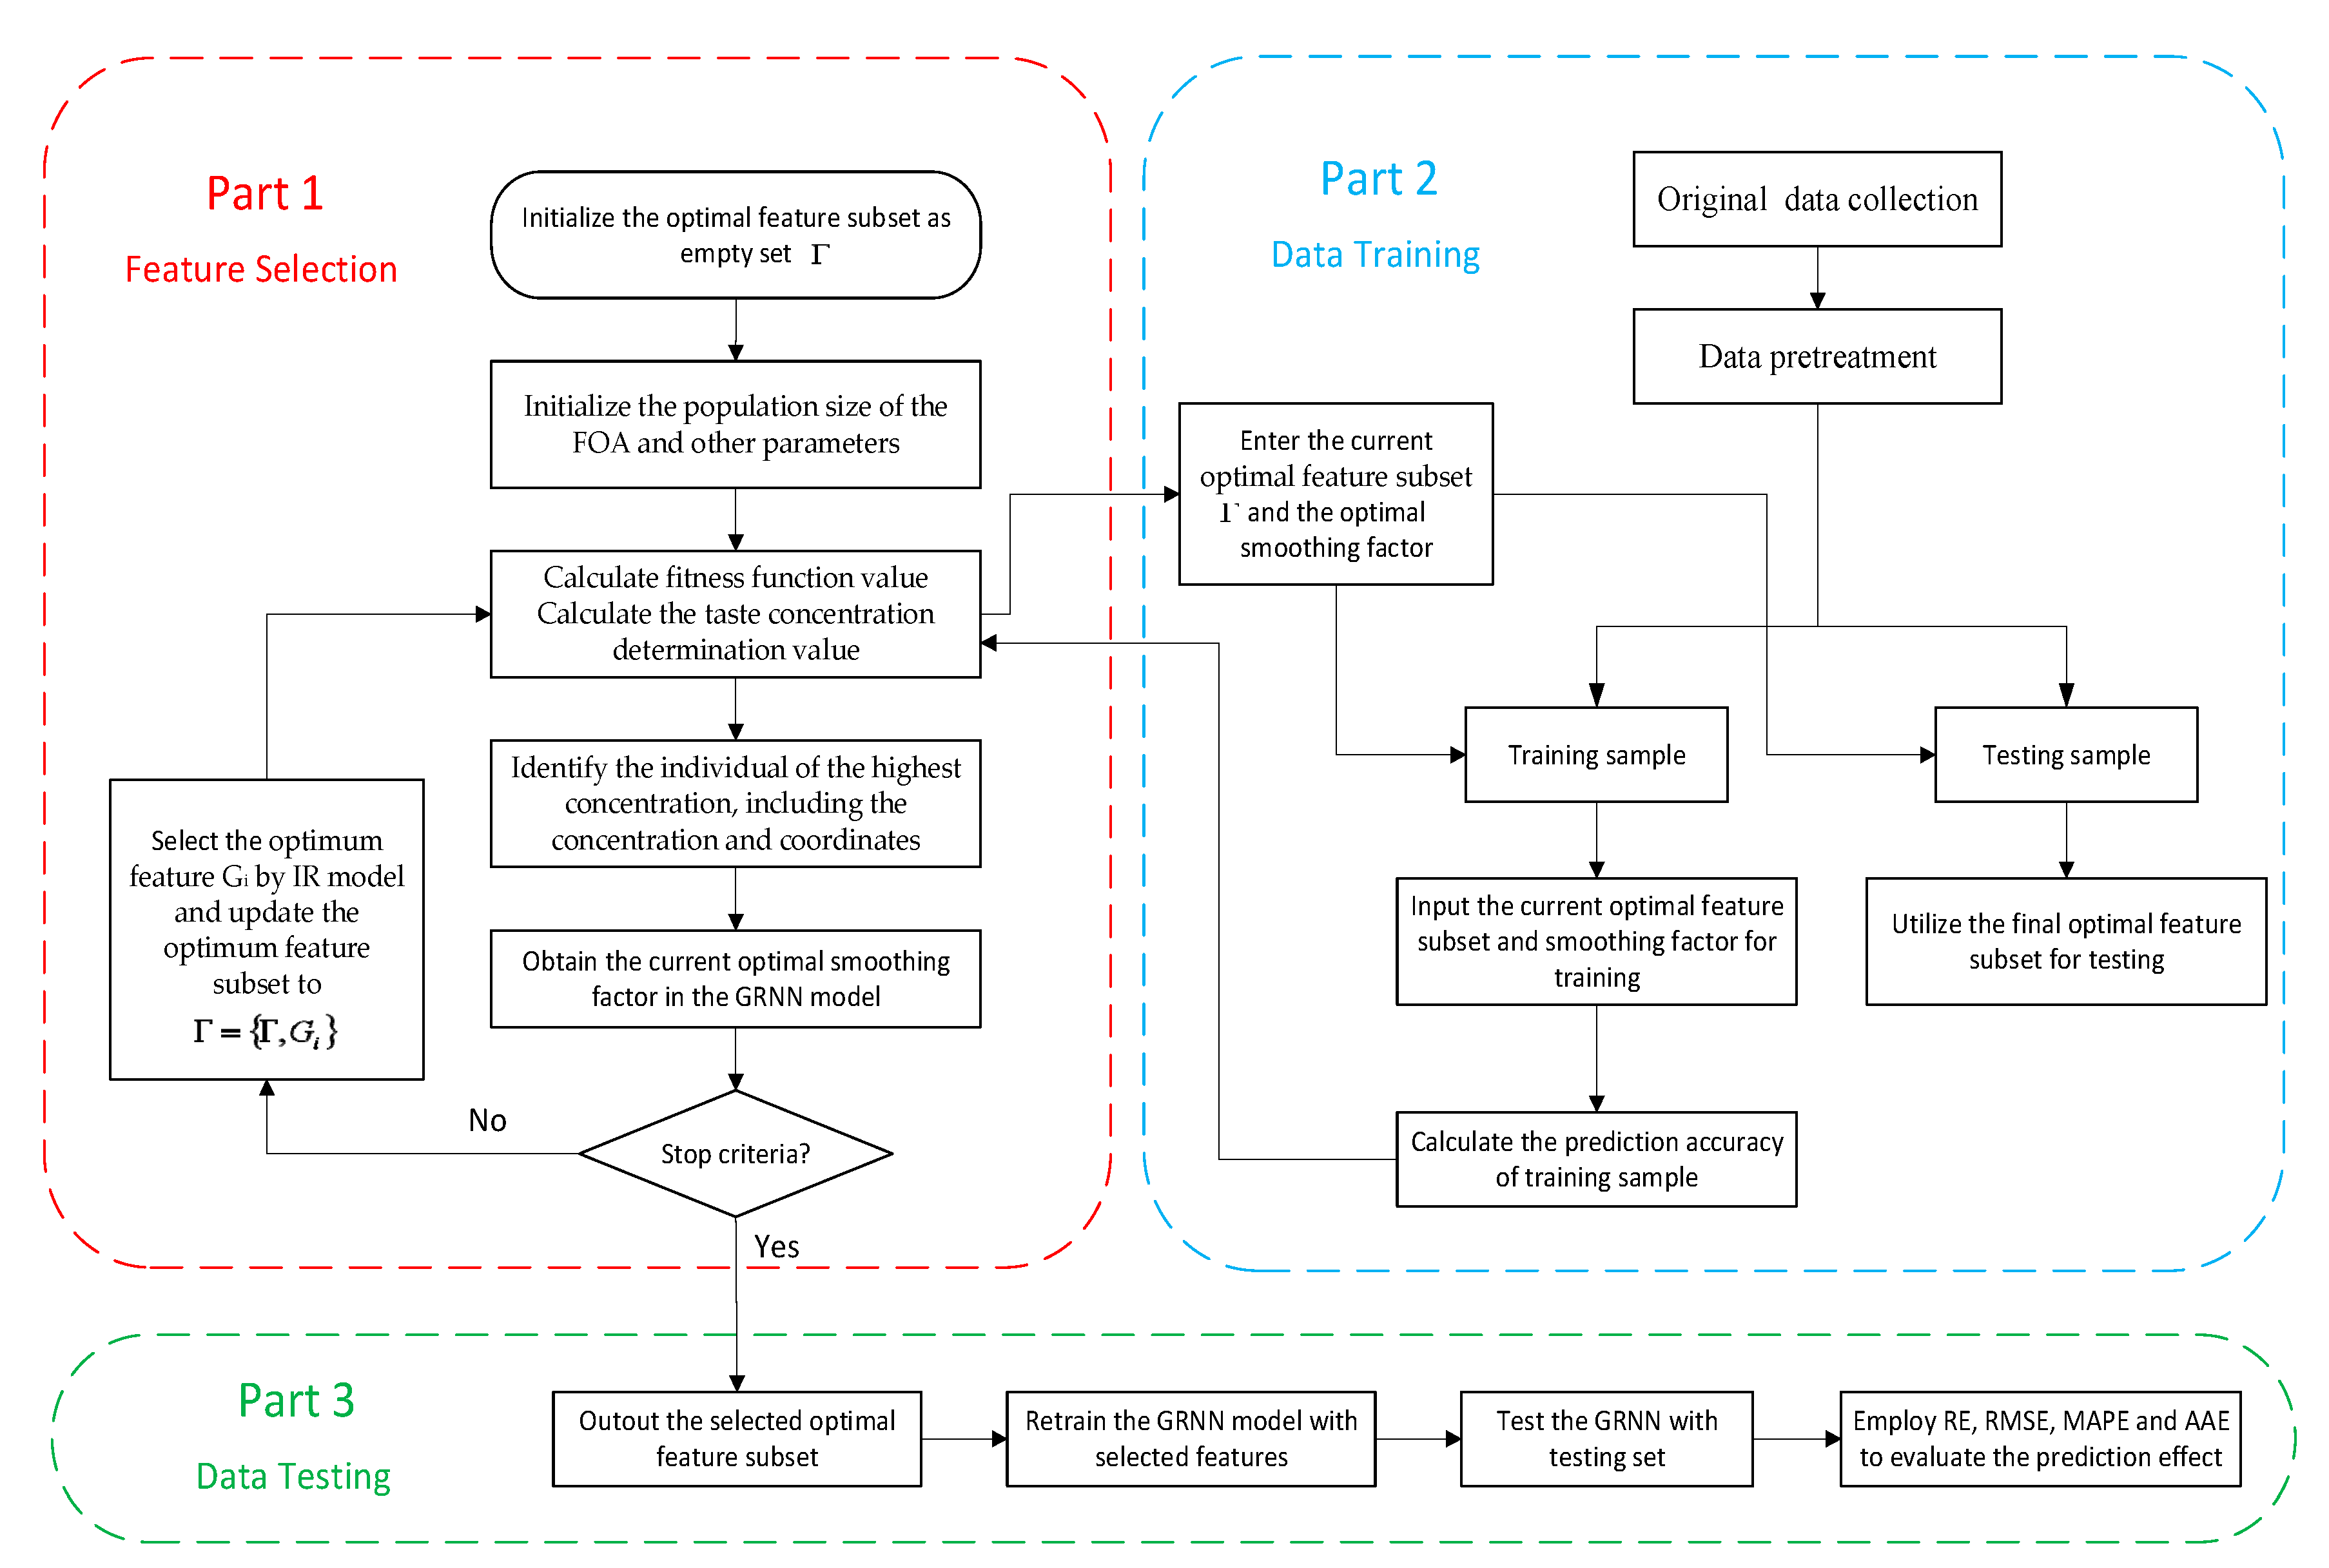
The icing thickness forecasting model combining FOA, IR, and GRNN are constructed as illustrated in Figure 3. It can be seen from the figure that the model of icing prediction proposed in this paper mainly includes three parts: The first part is the feature selection based on the inconsistent rate, the second part is the sample training based on the GRNN model, and the third part is the icing prediction based on the GRNN model. When the established feature subset L cannot satisfy the algorithm stopping criteria, the program will continue to cycle until reaching the expected precision and then output the optimal feature subset. Therefore, in the model of icing prediction proposed in this paper, the purpose of the first part is to find the optimal feature subset and the best value of smoothing factor in the GRNN by iterative calculation. The purpose of the second part is to calculate the prediction accuracy of the training samples in every process of iteration, so that the fitness function can be calculated. In the third part, we will utilize the optimum feature subsets and parameters obtained from the above two parts and perform the final prediction of the icing thickness of the test samples by retraining the GRNN model.
The specific steps for icing thickness prediction are listed as follows:
(1)
Determine the initial candidate feature. In this paper, we choose ambient temperature, relative humidity, wind speed, wind direction, light intensity, atmospheric pressure, altitude, condensation height, conductor direction, the height of conductor suspension, load current, precipitation, and conductor surface temperature, all of which are selected as the candidate features of the factors that influence icing. In addition, when it reaches the point t-i (i = 1, 2, 3, 4), thickness value, temperature, relative humidity and wind speed are also selected as the main influencing factors of line icing. All the initial candidate features are shown in Table 1. In the IR algorithm, the optimal feature subset needs to be initialized as an empty set Γ = { } .
(2)
Initialize the parameters of FOA. Suppose the population size is 20, the maximum iteration number is 200 and the range of random flight distance is set as [−10, 10].
(3)
Calculate the inconsistent rate. After completing steps (1) and (2), put the candidate features into the IR feature selection model gradually. Calculate the inconsistent rate of the data sets G1, G2, …, Gg in the feature subsets which are made up of the remaining features of each subset and then select the feature Gi which corresponds to the minimum inconsistent rate as the optimum feature, and update the optimum feature as Γ = { Γ , G i } .
(4)
Get the optimal feature subset and the best value of smoothing factor in GRNN. Put the current feature subsets into the GRNN model, and calculate the prediction accuracy during the learning process of the circular training samples. Then, the fitness function Fitness(j) can be worked out. We can get the optimum feature subset by comparing the fitness function among each generation and judge whether all iterations have achieved the algorithm stopping conditions. If not, re-initialize a new feature subset and put it into a new circulation until the optimum feature subset which meets all the conditions is obtained. It should be noted that the smoothing factor of the GRNN also needs to be optimized, and the initial value of smoothing factor will be assigned randomly. In this paper, a fitness function is established based on the two factors of prediction accuracy and feature selection:
F i t n e s s ( j ) = ( a + r ( j ) + b × 1 N u m f e a t u r e ( j ) )
In the formula, Numfeature(xi) is the number of optimum feature which is selected by each iteration and both a and b are constants between [0, 1]; r(j) represents the prediction accuracy of ice cover thickness at each iteration. The optimal number of features is proportional to the fitness function for all iterations, and the accuracy of the icing prediction is inversely proportional to the fitness function. Different smoothing factors will result in different forecasting results and lead to different prediction accuracy, indicating that the smoothing factor of the GRNN also influences the value of fitness function Fitness(j). Hence the optimal feature subset and the best value of smoothing factor in the GRNN will be obtained at the same time in this step.
(5)
Stop optimization and start prediction. Circulation ends at the maximum number of iteration. Here, the optimum feature subset and the best value of smoothing factor can be substituted into the GRNN model for icing thickness forecasting.

3. Performance Evaluation Index

The primary issue is to determine which forecasting model outperforms the other models, and the performance of the prediction models is usually assessed by statistical criteria: the relative error (RE), root mean square error (RMSE), mean absolute percentage error (MAPE) and average absolute error (AAE). The smaller the values of these four indicators are, the better the forecasting performance is. Furthermore, the indicators named RMSE, MAPE, and AAE can reflect the overall error of the prediction model and the degree of error dispersion. The smaller the values of these three indicators are, the more concentrated the distribution of errors is. These four error indexes are defined as follows:
R E = y t y t * y t × 100 %
R M S E = 1 N t = 1 N ( y t y t * y t ) 2
M A P E = 1 N t = 1 N | y t y t * y t | × 100 %
A A E = 1 N ( i = 1 N | y t y t * | ) / ( 1 N i = 1 N y t )
where y t and y t * are the actual and forecast icing thickness at the time point t , respectively. N refers to the groups of data.

4. Empirical Analysis

4.1. Data Collection and Pretreatment

In 2008, China was hit by a disaster of frozen rain and snow rarely seen in history. It brought huge losses to life, and seriously affected the national economy. Hunan Province was one of the worst hit provinces in this icing disaster. During the frozen period, the icing accident led to 182 towers with 500-kV power transmission lines falling down, 633 towers with 220-kV power transmission lines falling down, 1427 towers with 110-kV power transmission lines falling down, 1064 towers with 35-kV power transmission lines falling down, and 63,036 towers with 10-kV power transmission lines falling down. As for 10-kV and above, 50,000 wires were broken. Yueyang and Loudi (cities in Hunan Province) as well as other areas had large-area power outages. The Hunan power grid suffered the most serious threat in history, and the direct economic losses were up to more than 1 billion CNY. Therefore, this paper chooses the transmission line of the Hunan Province power grid to carry on the empirical analysis.
In this paper, the power transmission line, named “Kunxia line” in YueYang of Hunan Province is selected as the case to verify the effectiveness of the proposed model. All the data are provided by the Key Laboratory of Disaster Prevention and Mitigation of Power Transmission and Transformation Equipment (Changsha, China).
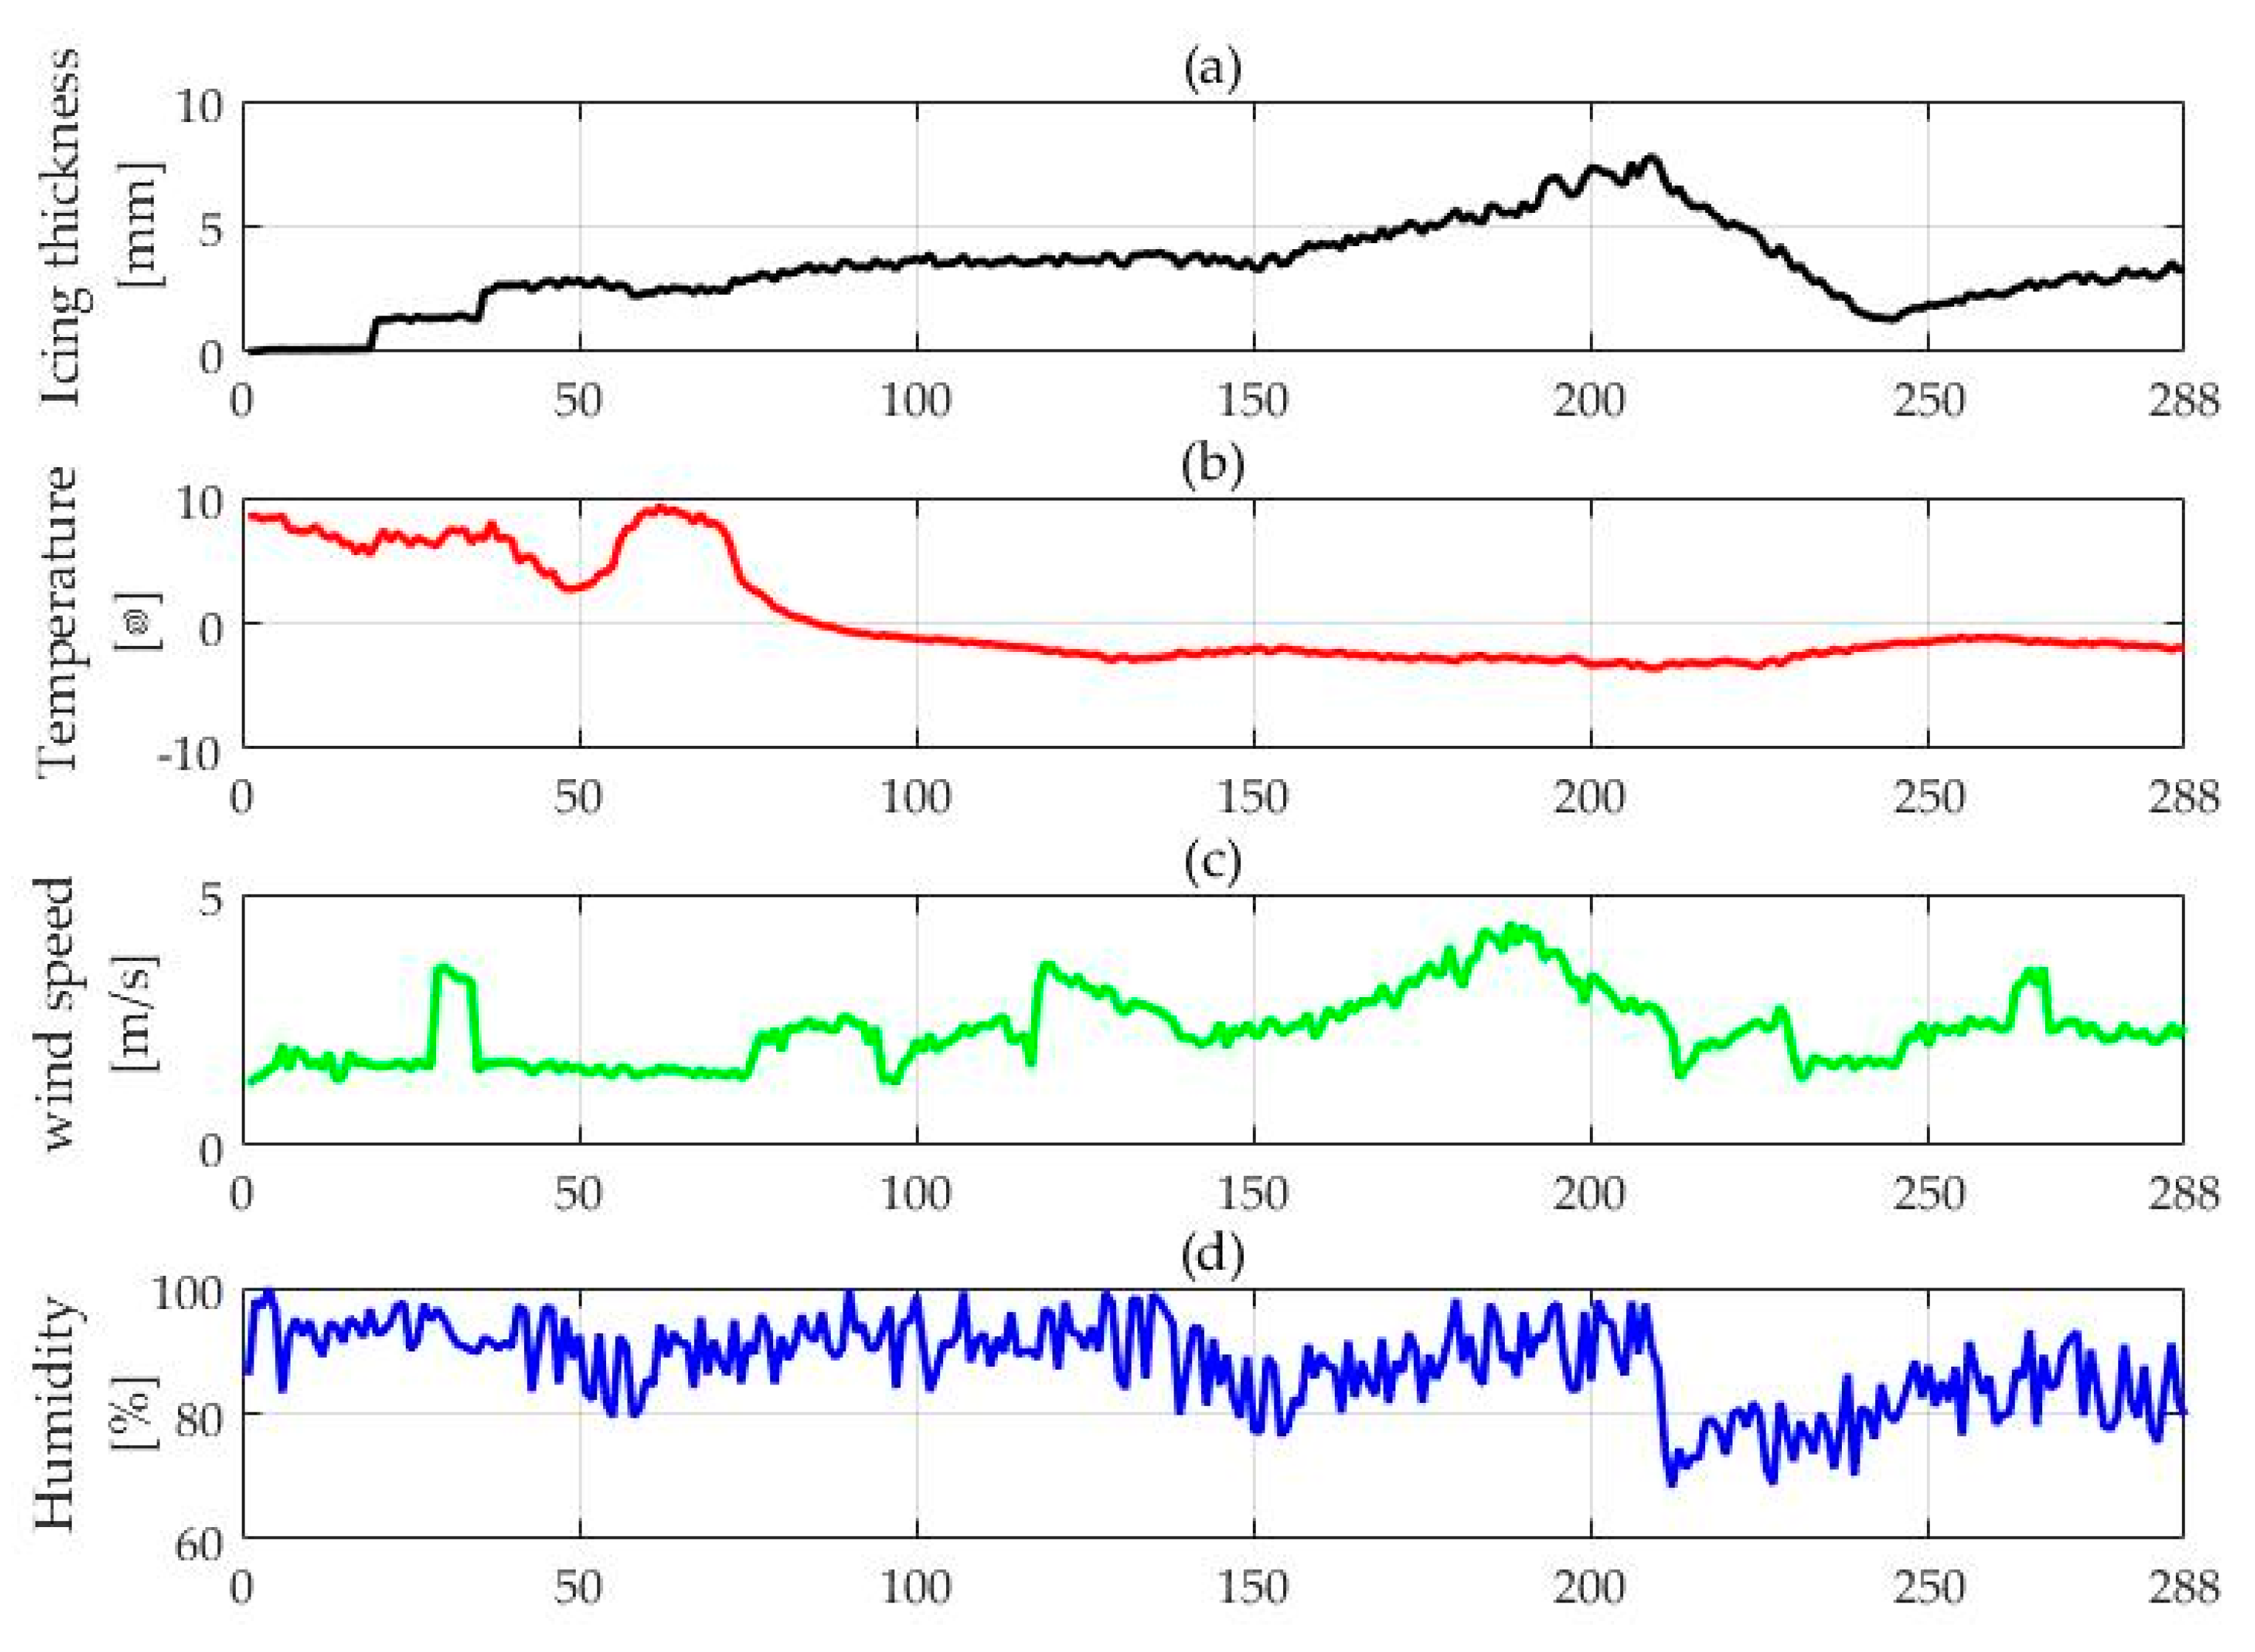
The data from the “Kunxia line” are from 10 January 2008 to 12 January 2008, and include 288 data groups. Here, taking 15 min as the data collection frequency, the first 230 groups are adopted as the training samples and the latter 58 are utilized as the testing samples in Case 1. The main micro-meteorology data, including temperature, wind speed, and humidity are shown in Figure 4.
In order to better train the proposed model and ensure the prediction accuracy, it is of significance to normalize all the original data in the range of [0, 1], and the processing equation is as follows:
Z = { z i } = x i x min x max x min i = 1 , 2 , 3 , , n
where xi is the actual value; xmin and xmax are the minimum and maximum values of the sample data respectively; and zi represents the value of the adjusted ith sample point.

4.2. Feature Selection

Based on the IR model, this section is about the selection of the optimal feature subset, and the determination of the input index of the prediction model. This paper uses Matlab R2014b for programming, and as for the test platform environment, we use the Intel Core i5-6300U, with 4G memory and the Windows 10 Professional Edition system.
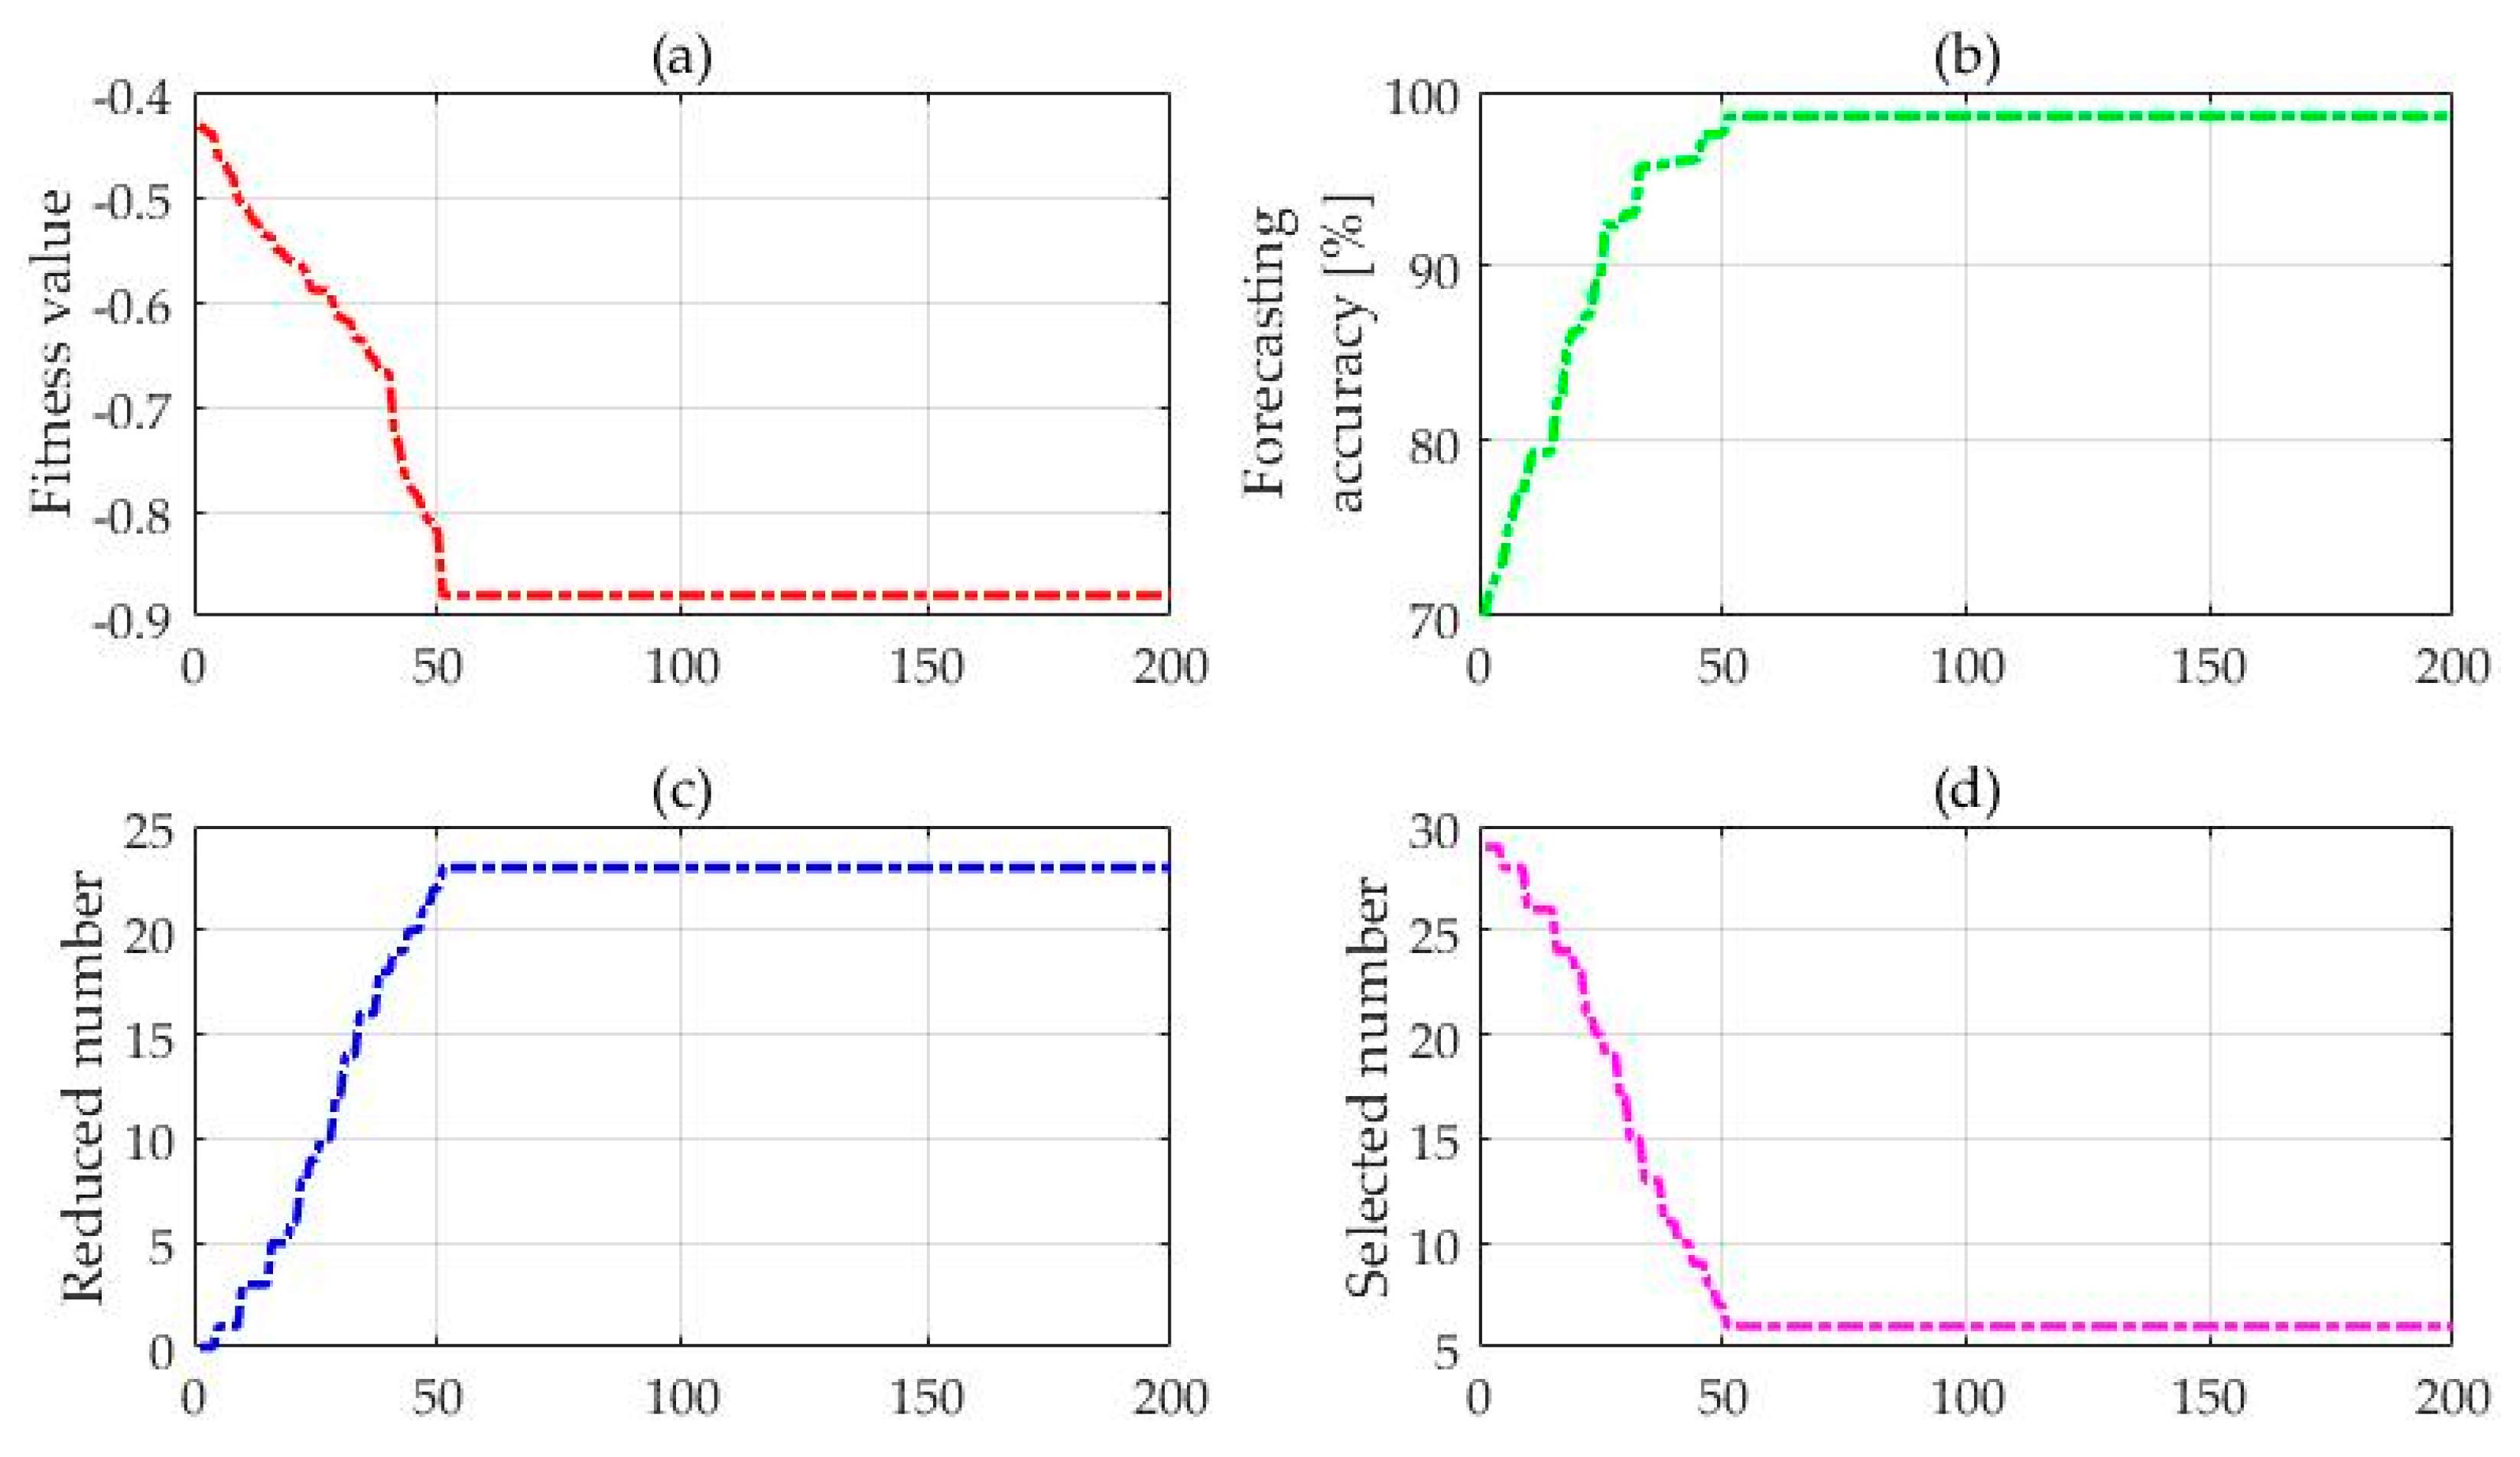
Figure 5 presents the iteration process of the FOA-IR-GRNN model for training sample feature extraction. The accuracy curve shown in the figure describes the prediction accuracy of the training samples which were made by the GRNN in different iterations. The fitness curve describes the fitness function values calculated during the process of iteration. The number of selected features indicates the optimal number of features calculated by the IR model in the convergence process. The number of feature reductions is the number of features that the FOA eliminates during the convergence process.
It can be seen from Figure 5 that the FOA converges when the number of iterations is 51, and the optimal fitness function is −0.88; at this time the prediction accuracy of the training sample is up to 98.6%. This shows that through the learning and training of the algorithm, the fitting ability of the GRNN is strengthened, and the prediction accuracy of training samples is the highest. Moreover, when the FOA runs the 51st time, the number of selected features also tends to be stable. It can be concluded that the algorithm eliminates 23 redundant features from 29 candidate features, and the final input features are the tth time point’s ambient temperature, relative air humidity, wind speed and t − 1th time point’s icing thickness, ambient temperature, relative air humidity.

4.3. The GRNN for Icing Forecasting

After the optimal feature subset is obtained, put the input vector into the model proposed in this paper to train and test. The smoothing factor of the GRNN model is 0.0031, which is calculated by the running program.
A k-fold cross validation (K-CV) test is conducted here, so as to show whether the forecasting results of the proposed model is obtained at local optimal or global optimal location and whether this proposed model can be generalized to other unseen data. The K-CV test method divides the samples into k disjoint subsets randomly, each of which is roughly equal in size. Using k − 1 subsets, a model is established for a given set of parameters, and the RMSE of the remaining last subset is employed to evaluate the performance of the parameters. Repeat the procedure K times, and each subset has the opportunity to be tested. Hence, the 288 sets of data are randomly divided into 12 datasets, each of which has 24 groups of data, and they do not intersect with each other. After 12 operations, each sub data set is tested and the RMSE of the sample is obtained, which can be seen in Table 2.
From Table 2, it can be found that the average RMSE value and the RMSE standard deviation of the proposed model is 0.0122 and 0.0010, respectively. It is indicated that the validation error of the icing prediction model proposed in this paper can obtain its global minimum.
In order to verify the performance of the proposed model, this paper employs the GRNN model which is not optimized by FOA. The mature BP neural network model and SVM model do the contrast experiments, supported by the test sample data in Section 4.1. In addition, the FOA-GRNN model without considering IR model for feature selection is also utilized for icing forecasting so as to demonstrate the effects of the IR and the FOA. The smoothing factor of the single GRNN model is 0.2, while the smoothing factor of the FOA-GRNN model without considering the IR model is 0.1026. The topological structure of the BPNN model is 9-7-1, and the hidden layer transfer function is expressed by the tansig function. The output layer transfer function is expressed as purelin function. The maximum number of trainings is 100 and the minimum error of the training target is 0.0001. The training rate is 0.1. The initial weights and thresholds are obtained by their own training. In the SVM model, the penalty parameter c is 9.236 which is obtained by the training, the kernel function parameter g is 0.0026, and the ε loss function parameter p is 2.3572.
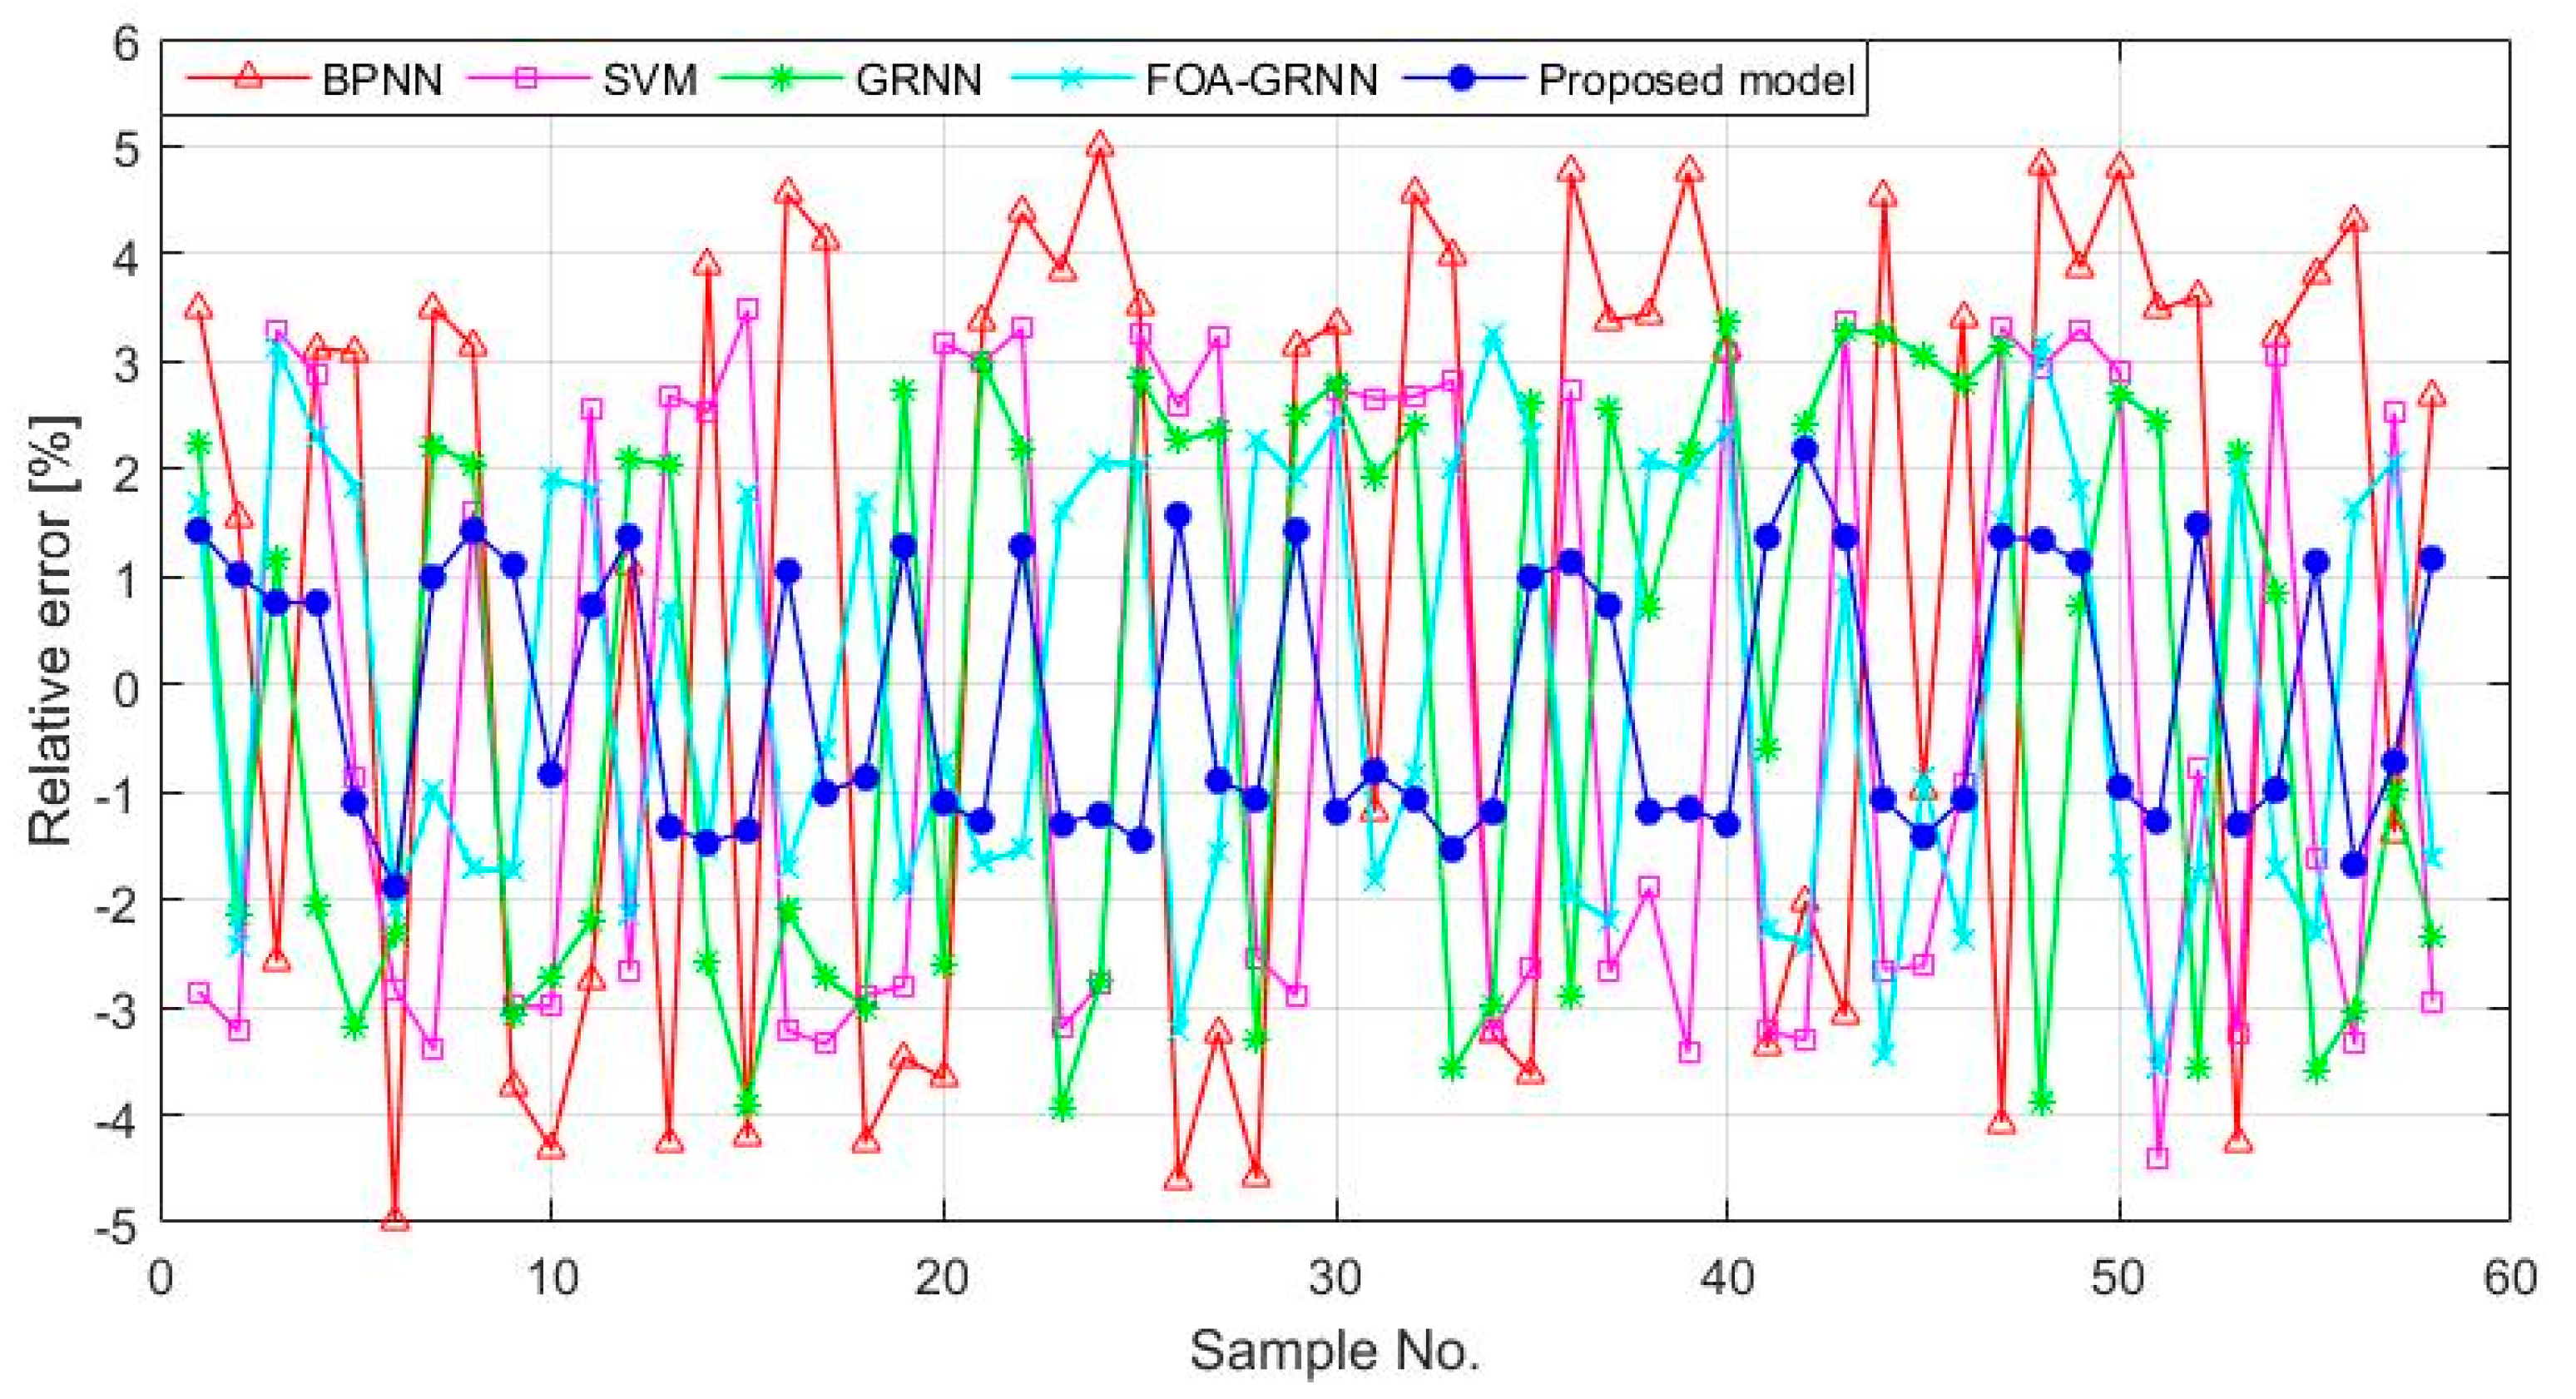
The actual values and forecasting values of the GRNN, BPNN, SVM, FOA-GRNN and the model presented in this paper are presented in Figure 6. The relative error of each model is shown in Figure 7. Figure 8 displays the RMSE, MAPE, and AAE of each prediction model. Table 3 displays part of the predicted values and errors.
Figure 6 and Table 3 describe the forecasting results of the five prediction models and the actual icing thickness. It can be seen from Figure 6 that the relative distance between the predicted and actual values of each prediction model. In general, the overall forecasting trends of the five models are close to the actual values. The forecasting curve of the proposed model is the closest to the actual curve, whereas the other prediction curves have some deviation. The forecasting curve of the FOA-GRNN is closer than that of the GRNN alone, demonstrating that the FOA makes the GRNN forecast better than the GRNN model without the FOA. However, the prediction accuracy of the FOA-GRNN model is not as good as the FOA-IR-GRNN model, indicating that feature selection method named the IR model can further improve the forecasting effectiveness of the GRNN. In addition, it can be found that the forecasting curve of the GRNN model is closer than the BPNN model and SVM model, indicating that the GRNN performs better than the BPNN and SVM for icing forecasting.
Figure 7 reflects the relative error distribution of the four models. From Figure 7, the difference of prediction effect among different models can be seen more clearly. The RE ranges [−3%, 3%] and [−1%, 1%] are popularly regarded as a standard to evaluate the performance of a prediction model [32]. From Figure 7, we can obtain that: (1) there are only nine relative error values of BPNN model in the range of [−3%, 3%] and only one value in the range of [−1%, 1%]; the maximum relative error is 4.99% at the 24th sample point, while the minimum is −4.98% at the sixth sample point; (2) the relative error of the SVM model has 35 forecasting points belonging to the range of [−3%, 3%], and there exist three forecasting points in the range of [−1%, 1%]; the maximum relative error value is 3.48% at the 15th sample point, and the minimum is −4.41% at the 51st point; (3) in the GRNN model, the relative errors of 43 sample points are in the range of [−3%, 3%], and the relative errors of five sample points are in the range of [−1%, 1%]; the maximum value is 3.38% at the 40th predicted point, while the minimum is −3.95% at the 23rd point; (4) there are 52 relative error values of the FOA-GRNN model in the range of [−3%, 3%] and seven values in the range of [−1%, 1%]; the maximum relative error is 3.25% at the 34th sample point, while the minimum is −3.57% at the 51st sample point; and (5) the relative errors of the FOA-IR-GRNN model are all in the range of [−3%, 3%], and there exist 12 relative errors in the range of [−1%, 1%]; the maximum relative error is 2.17% at the 42nd point, while the minimum value is −1.89% at the sixth sample point. We can also find from Figure 7 that the RE curve of the FOA-IR-GRNN model is the most stable and its values are all distributed within [−2%, 2%]. Moreover, the RE curve of the FOA-GRNN model is more stable than the GRNN’s; the RE curve of the GRNN model is more stable than the SVM’s; and the RE curve of the SVM model is more stable than the BPNN’s. Based on the above analysis of relative error data, it can be concluded that the prediction accuracy and stability of the FOA-IR-GRNN model is the best. The input indexes obtained by IR model can help satisfactorily predict when the relative errors of the FOA-GRNN and the FOA-IR-GRNN are compared. It is also demonstrated that the FOA enhances the training and learning process effectively so as to avoid falling into a local optimum and improves the global searching ability of the GRNN by comparing the relative errors of the FOA-GRNN and GRNN. Hence, both the IR model and the FOA are significant for improving the forecasting performance of the GRNN. Additionally, the GRNN presents more satisfactory performance than the SVM and BPNN. This result indicates that the GRNN with only one parameter to be adjusted and fast calculation is more suitable for forecasting nonlinear and non-stationary icing thickness.
The RMSE, MAPE, and AAE of BPNN, SVM, GRNN, FOA-GRNN, and FOA-IR-GRNN are shown in Figure 8. From Figure 8, we can conclude that the RMSE, MAPE, and AAE of the proposed model are 1.2326%, 1.2006%, and 1.2059%, respectively, which are all the smallest among the above four models. In addition, the RMSE, MAPE, and AAE of the FOA-GRNN model are 2.0485%, 1.9462%, and 1.9994% respectively; the RMSE, MAPE, and AAE of the GRNN model are 2.6514%, 2.5375%, and 2.5086% respectively; the RMSE, MAPE, and AAE of the SVM model are 2.8999%, 2.8295%, and 2.8200% respectively; and the RMSE, MAPE, and AAE of the BPNN model are 3.6889%, 3.5612% and 3.5252% respectively. These indicators can reflect the overall error of the prediction model and the degree of error dispersion. Hence it can be further proved that the overall prediction effect of the GRNN model is better than that of the SVM model and the BPNN model, while the overall prediction effect of the SVM model is better than that of the BPNN model. The prediction accuracy of the FOA-GRNN model is better than that of the GRNN model, which demonstrates that adopting the FOA to choose the smoothing parameter in the GRNN model has achieved a satisfactory optimization effect. Meanwhile, the FOA-IR-GRNN model obtains better overall forecasting accuracy than the FOA-GRNN model. This result proves that the IR model not only reduces the redundant data, but also ensures the integrity of the input information, thus obtaining the ideal prediction results.

5. Case Study 2

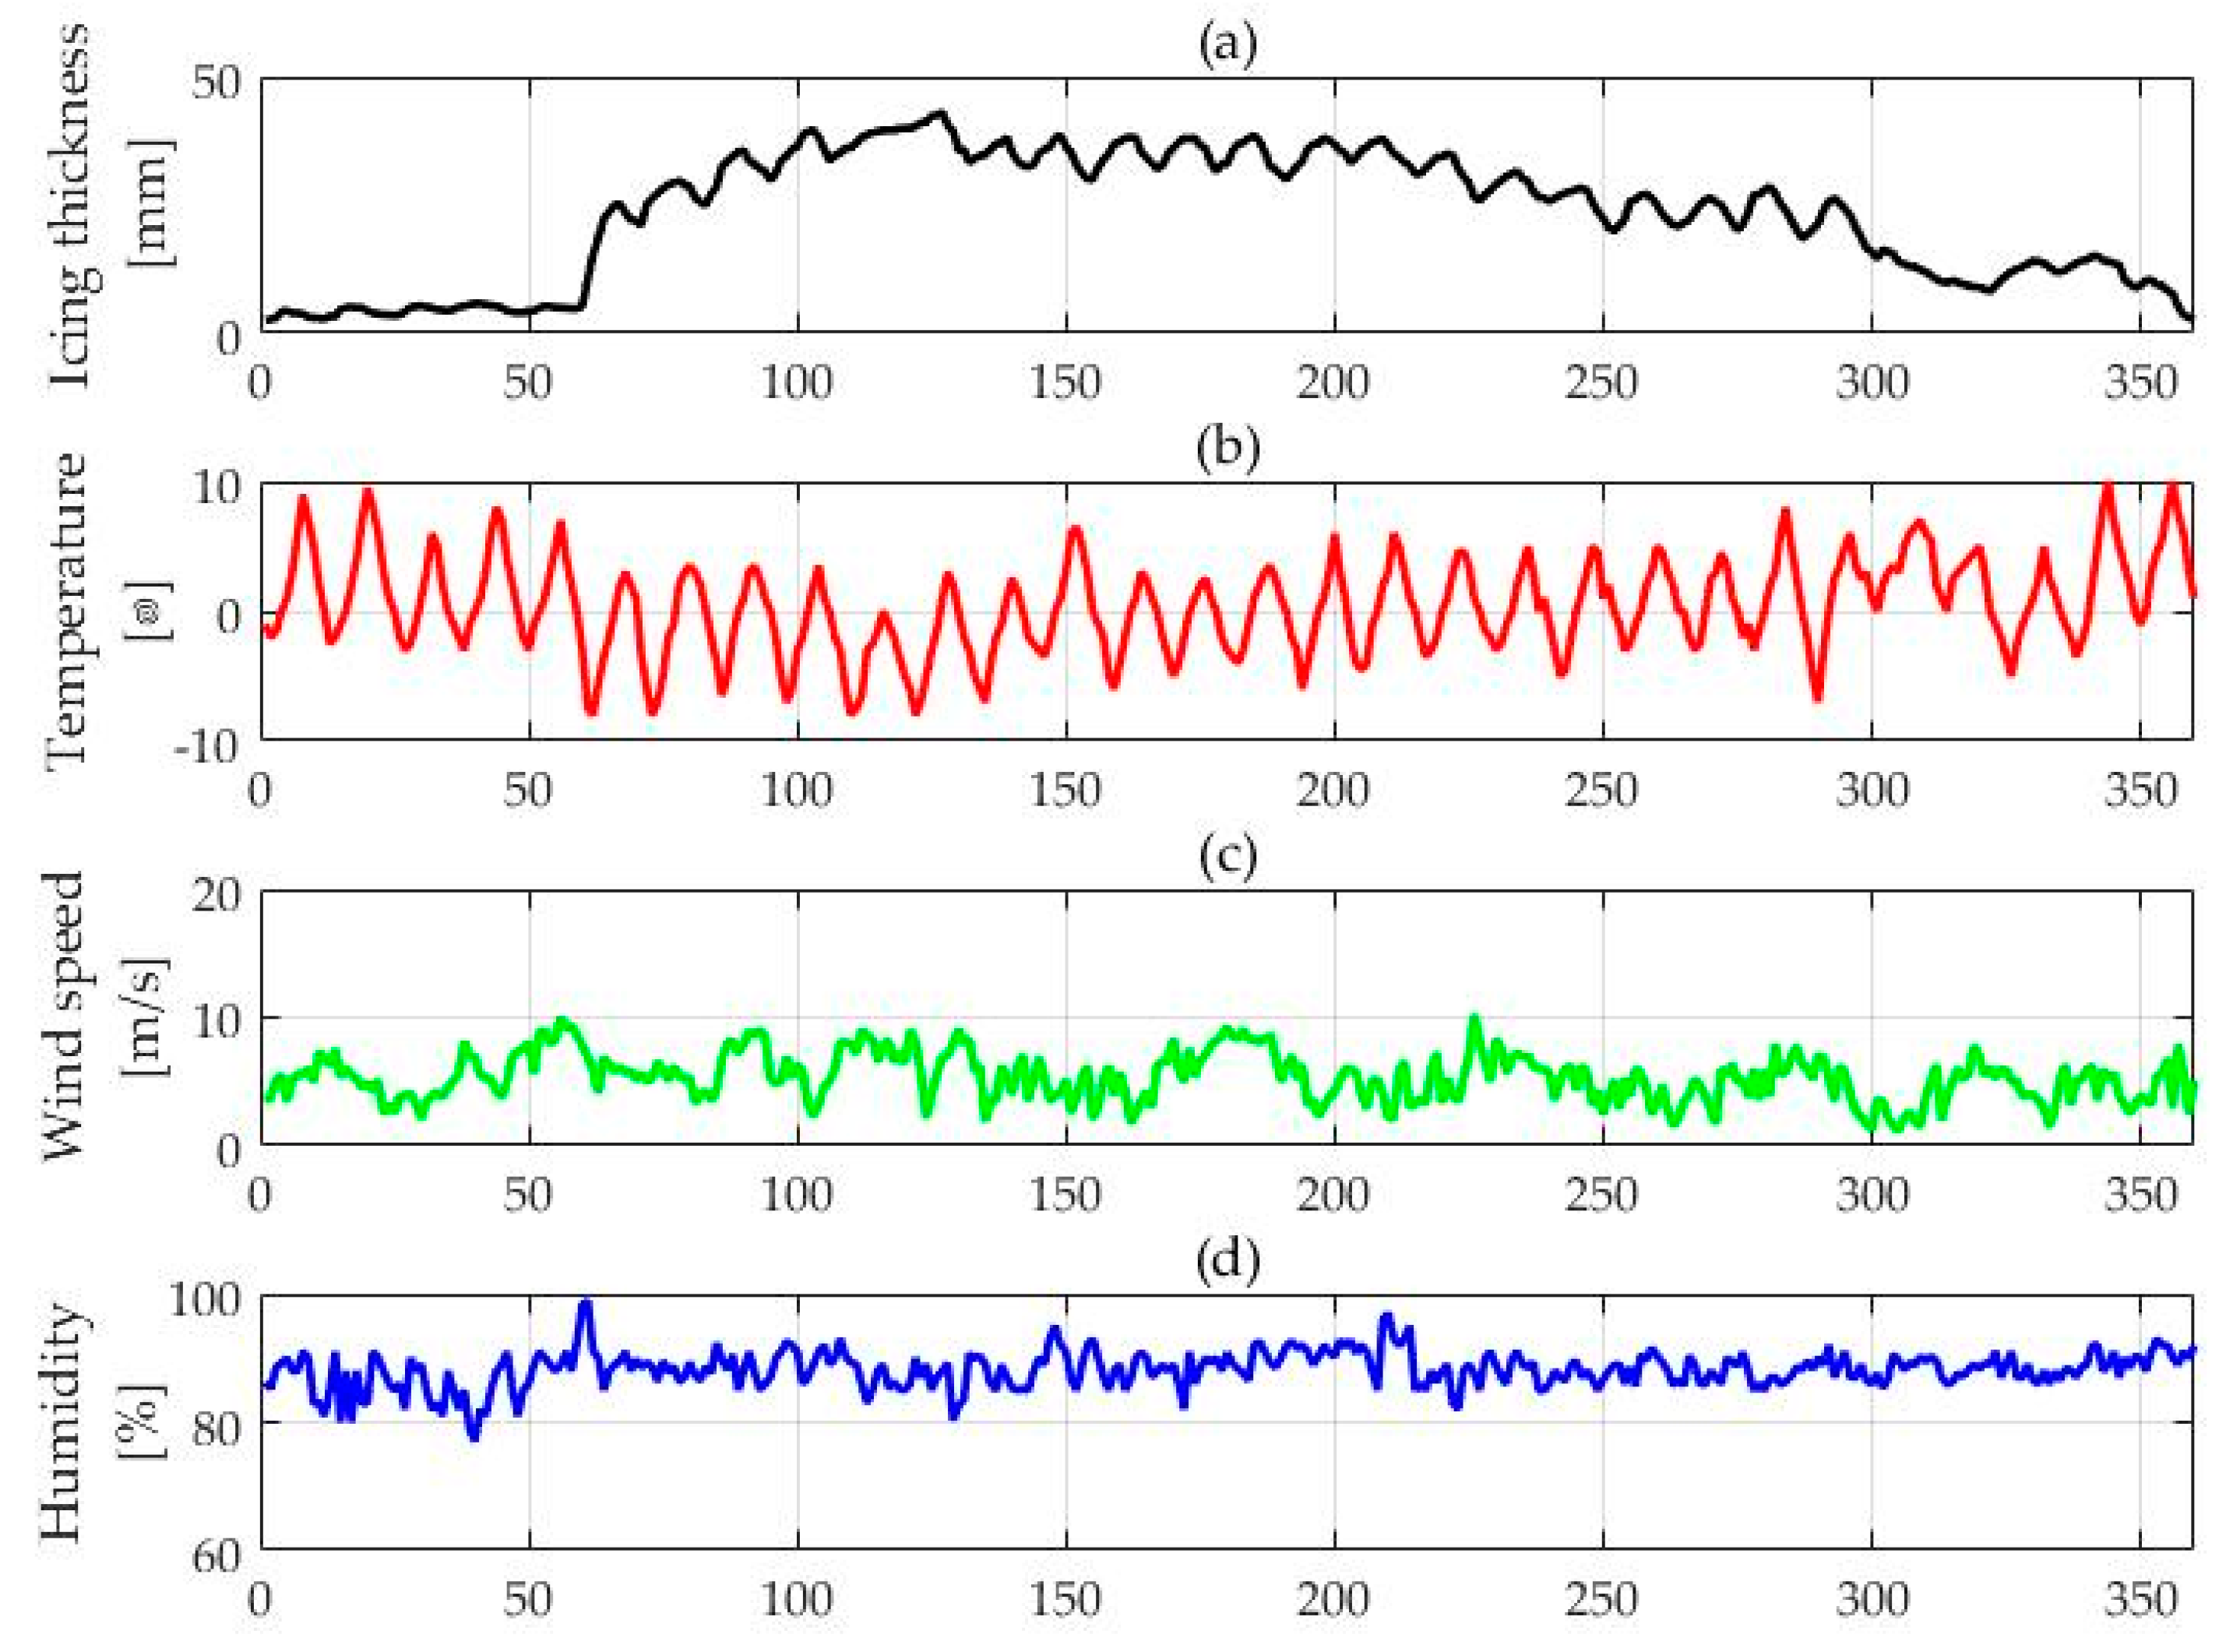
In order to verify the proposed model has good adaptability in different time and places, another case which selects the relevant data of the “Tianshang line” located in Loudi, Hunan Province, is provided in this paper. The study is carried out with data from 17 January 2008 to 10 February 2008 as the training set and data from 11 February 2008 to 15 February 2008 as the testing set. Here, we take 2 h as data collection frequency, and there are 360 data groups in total. The icing thickness data and the main micro-meteorology data are shown in Figure 9.
The iterative process of sample data of “Tianshang line” by employing the FOA-IR-GRNN model is presented in Figure 10. From Figure 10, we can conclude that the optimal fitness function calculated by the IR model is −0.91. When the FOA achieves the optimum in the 47th iteration, the prediction accuracy of the sample reaches 98.3%. It can also be seen that 25 redundant features are eliminated from 29 candidate features, and the final input features include the tth time point’s ambient temperature, relative air humidity, wind speed and the t − 1th time point’s icing thickness. In addition, the smoothing factor of the GRNN was 0.0056, optimized by the FOA.
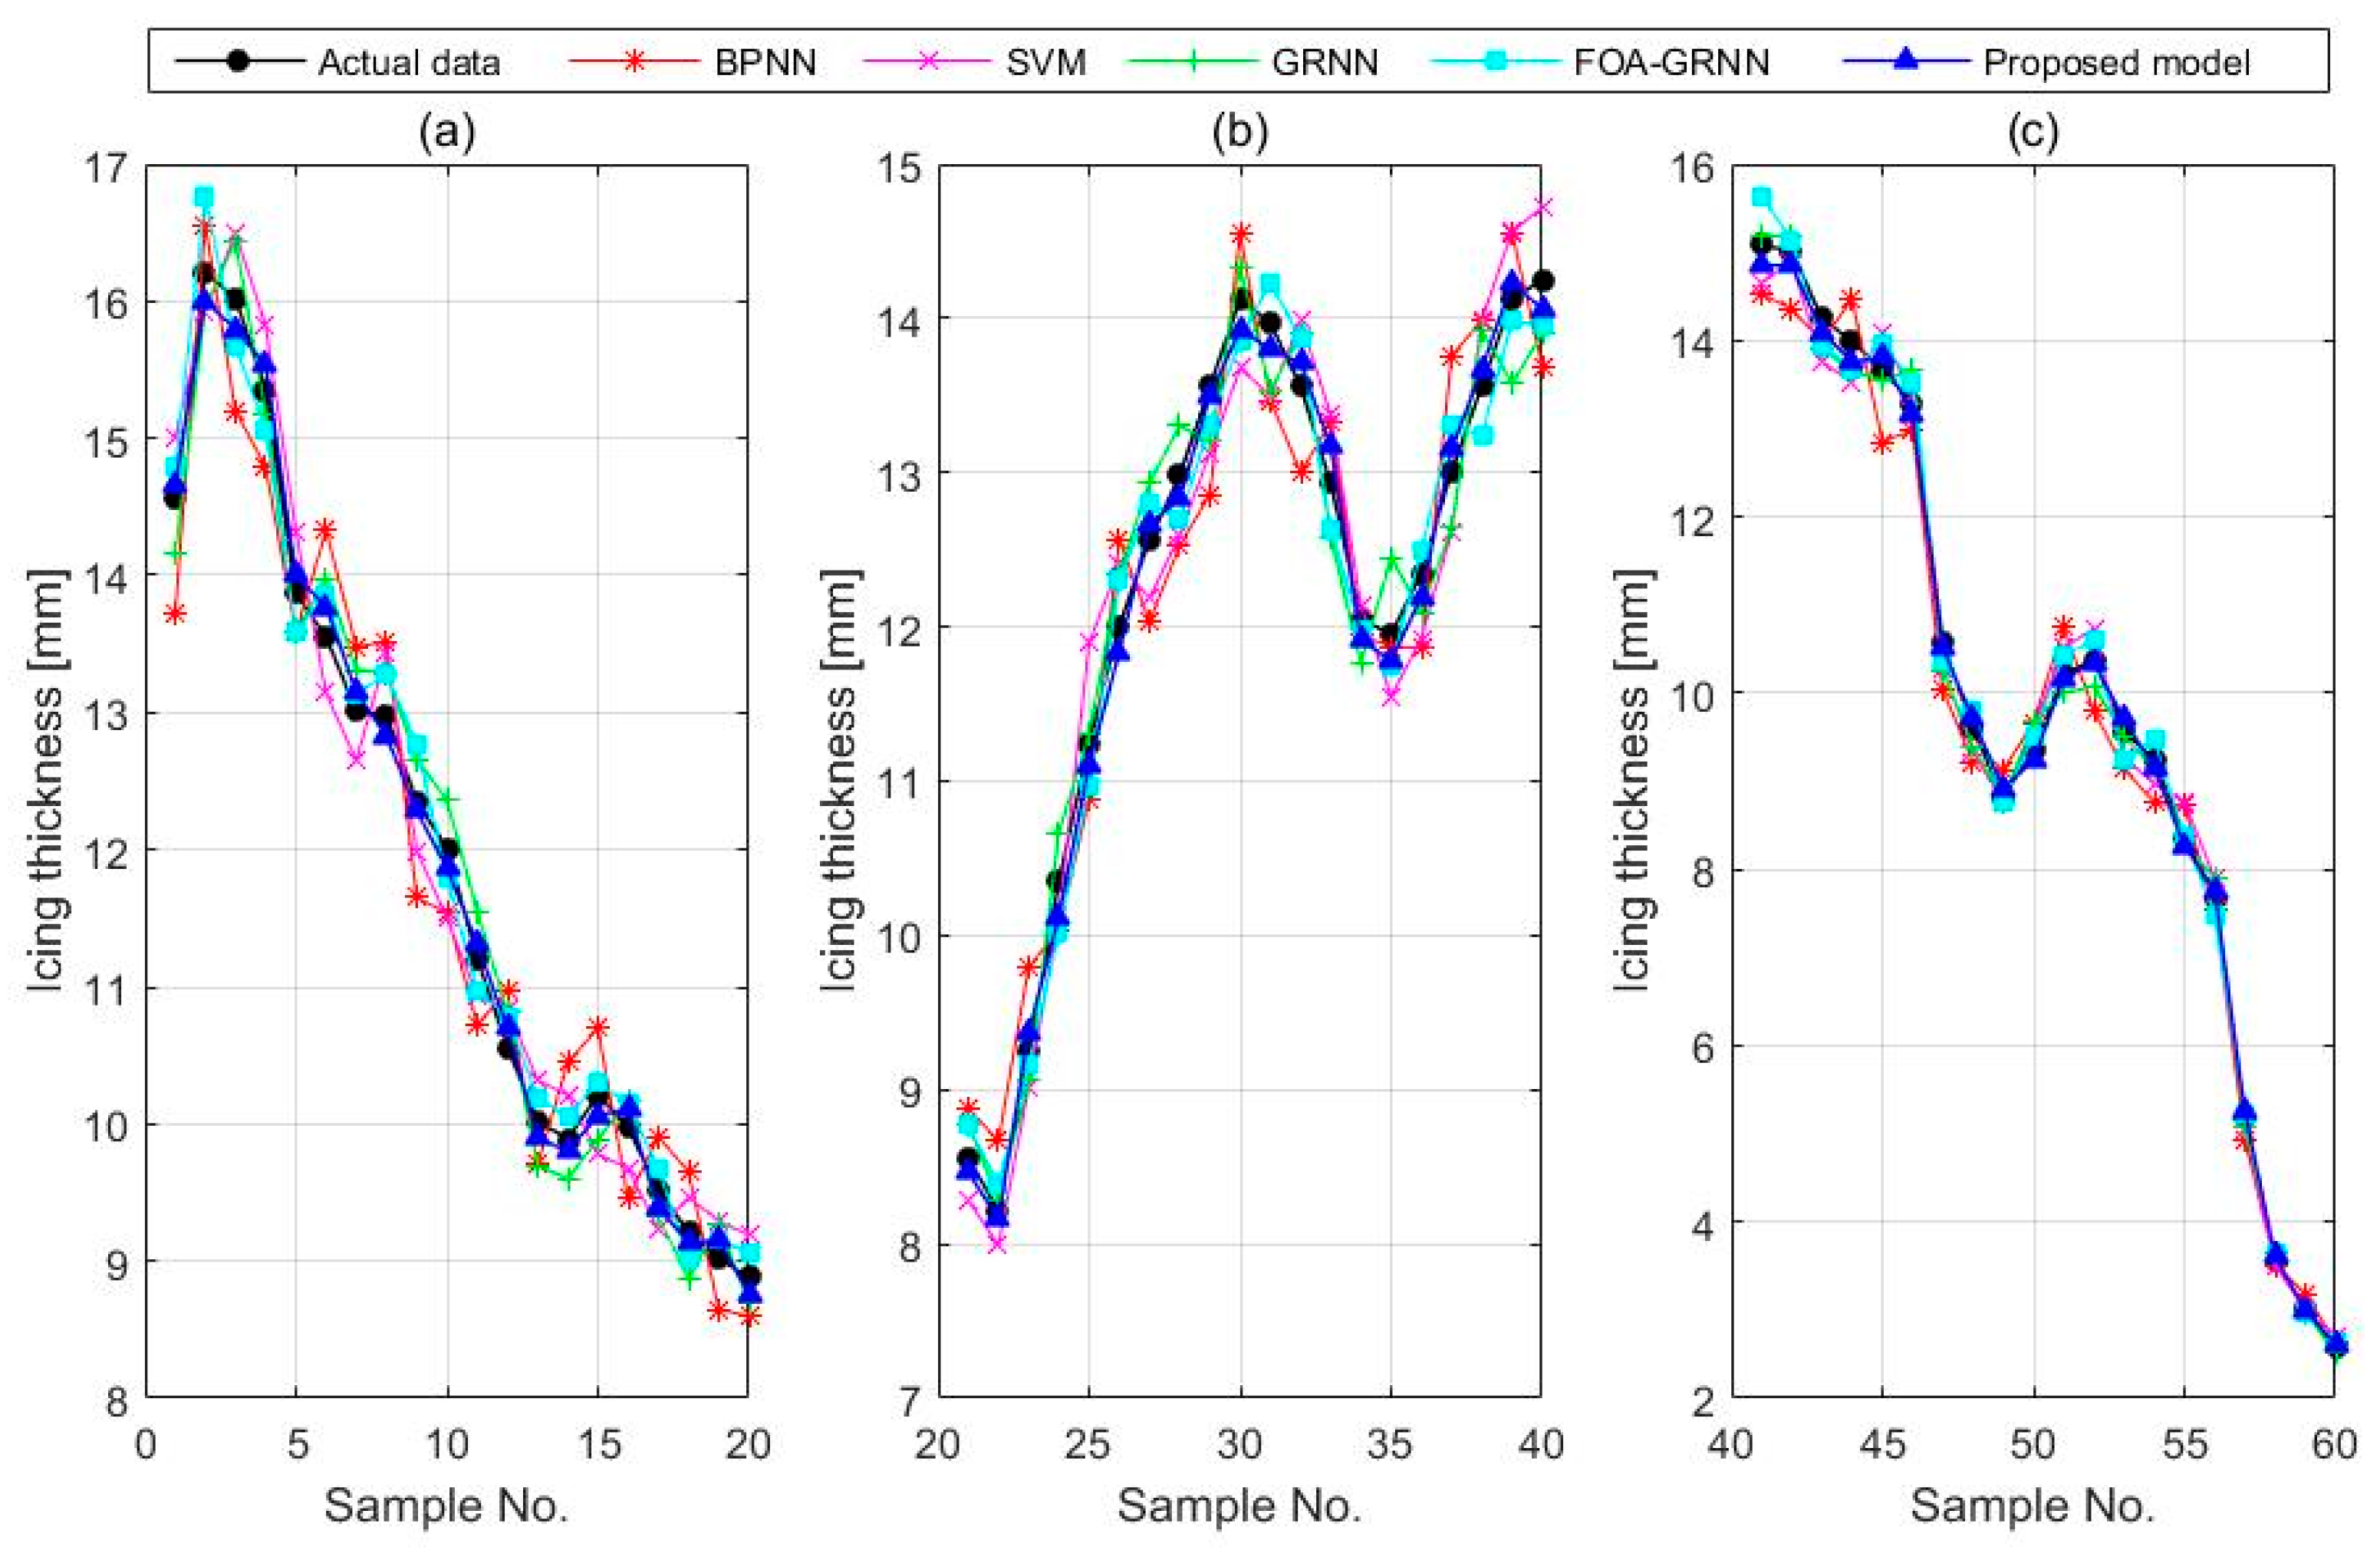
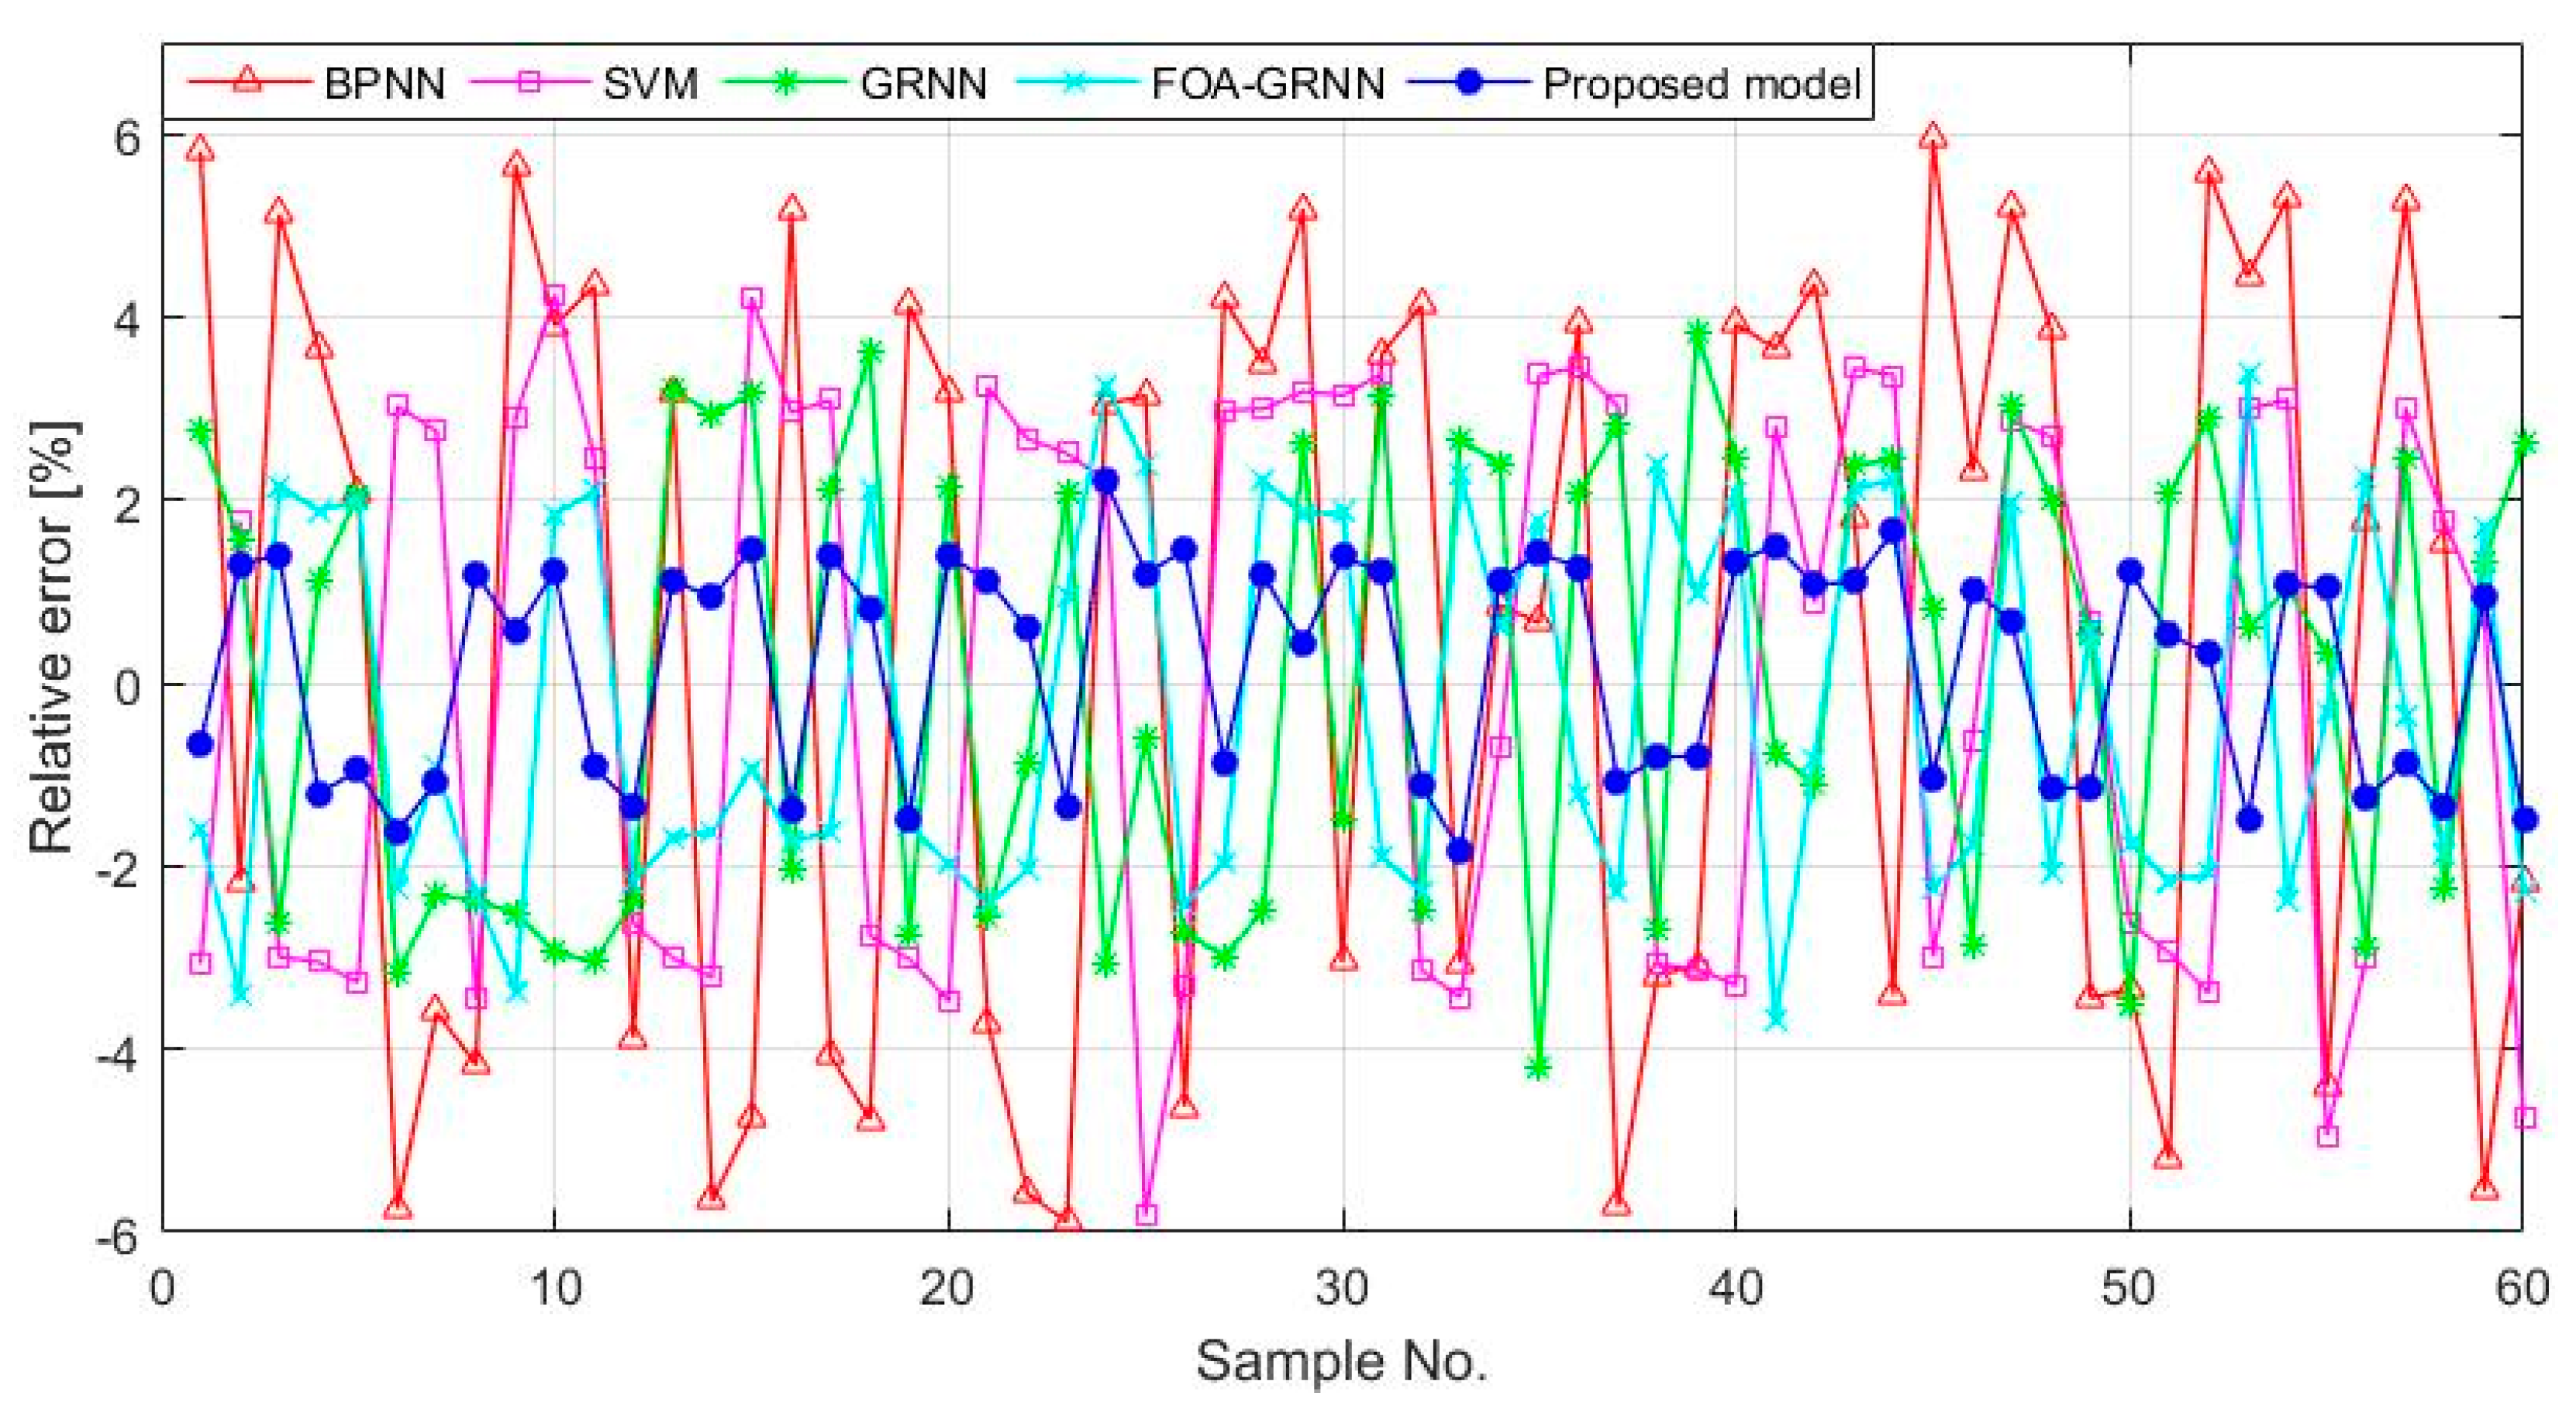
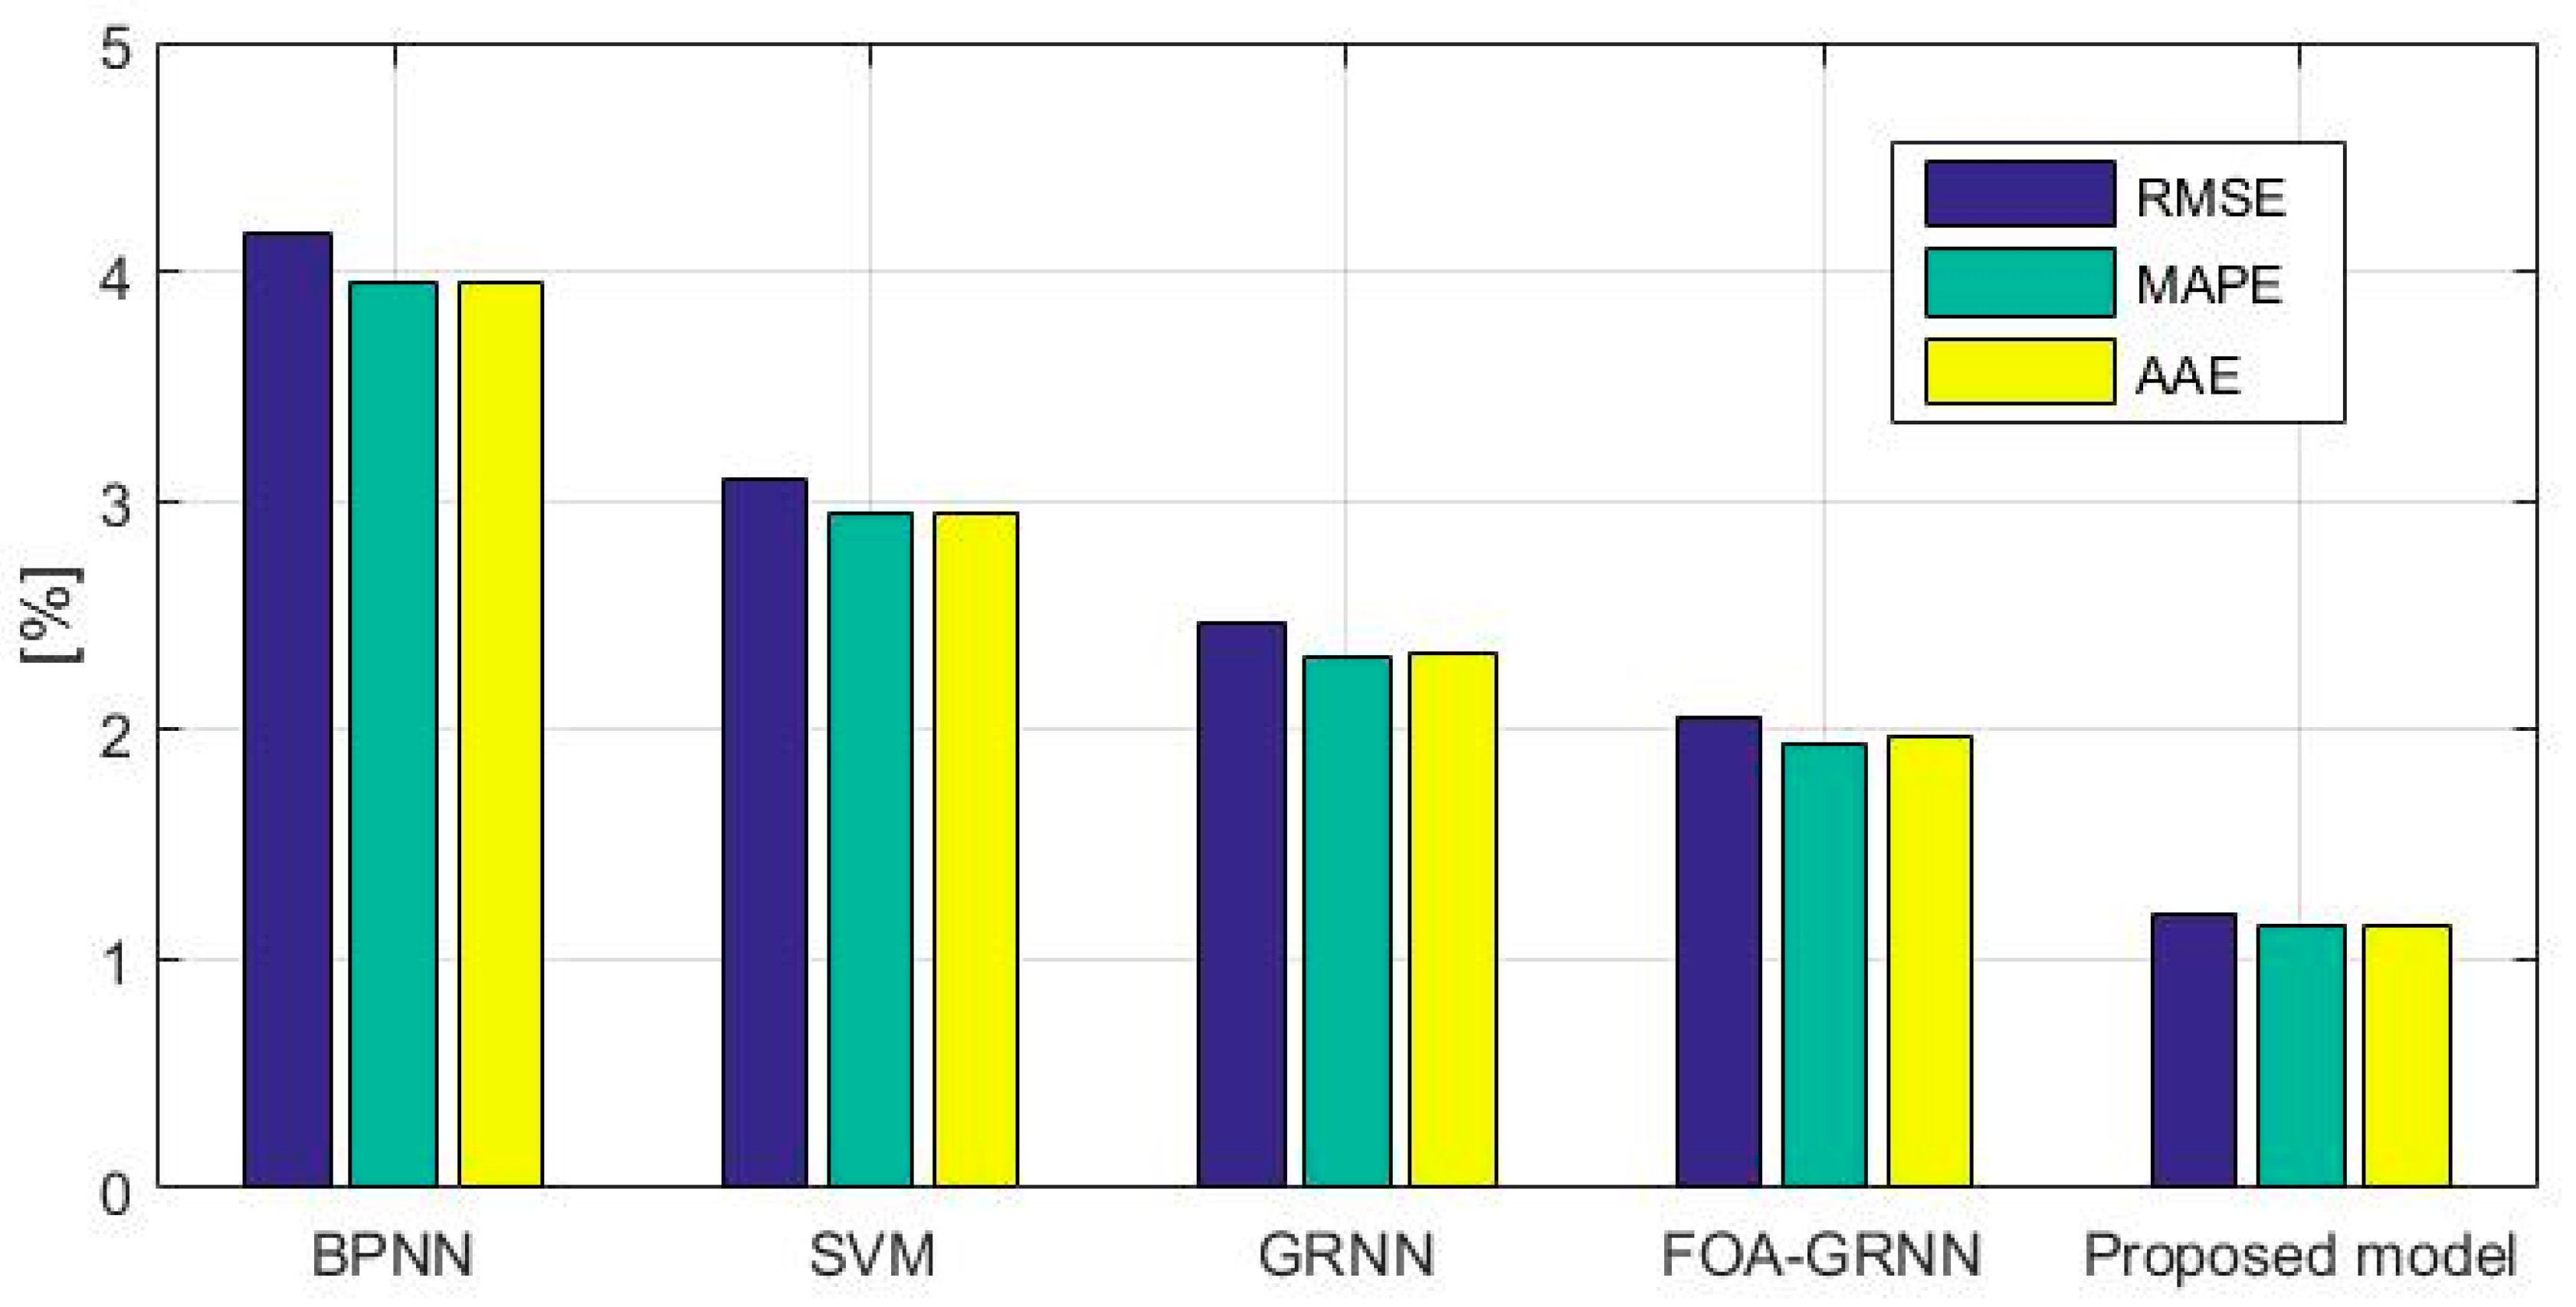
The results of the k-fold cross-validation for the icing prediction model proposed in this paper are described in Table 4. The forecasting results are displayed in Figure 11 and Table 5. The error analyses are presented in Figure 12 and Figure 13.
As is shown in Table 4, the average RMSE value and RMSE standard deviation of the proposed model are 0.0118 and 0.0011, respectively. These data illustrate the fact again that the generalization performance of the icing prediction model proposed in this paper has been improved.
It can be concluded from Figure 11 and Table 5 that the predicted value of the FOA-IR-GRNN model is the closest to the actual value, which demonstrates that the proposed model is not only accurate but also has robustness. When comparing the forecasting curves of the FOA-IR-GRNN model and the FOA-GRNN model, we can conclude that adopting the IR model for feature selection can significantly improve the prediction accuracy, in that this feature selection method can enhance the effectiveness of input information. Furthermore, the forecasting curve of the FOA-GRNN model is closer than that of the GRNN model, indicating that in addition to the IR model, the FOA also makes a significant contribution to the improvement of GRNN prediction accuracy. Compared with SVM and BPNN, the forecasting value of the GRNN model is closer to the actual ice thickness, which demonstrates once again that the approximation and classification ability of the GRNN model is better than that of the SVM model and the BPNN model, and the GRNN emerges with better performance in dealing with unstable data.
Figure 12 presents the relative error of the four models. As the calculation results shown, we can conclude that: (1) the fitting and learning ability of the FOA-IR-GRNN model is the strongest, in that its relative errors are all in the range of [−3%, 3%] and there exist 16 sample points belonging to the range of [−1%, 1%]; the maximum relative error is 2.21% at the 24th point, and the minimum value is −1.85% at the 33rd point; (2) there exist 55 relative error values of the FOA-GRNN model in the range of [−3%, 3%] and nine values in the range of [−1%, 1%]; the maximum relative error is 3.37% at the 33rd sample point, while the minimum is −3.70% at the 41st sample point; (3) the GRNN model emerges with 49 sample points in the range of [−3%, 3%], while seven sample points are in the range of [−1%, 1%]; the maximum value is 3.84% at the 39th point, and the minimum is −4.19% at the 35th point; (4) the SVM model emerges with 27 sample points in the range of [−3%, 3%], and there are five sample points in the scope of [−1%, 1%]; the maximum value is 4.24% at the tenth point, while the minimum is −5.82% at the 25th point; and (5) the BPNN model has nine points belonging to the range of [−3%, 3%], and there are only two points in the scope of [−1%, 1%]; the maximum value is 5.94% at the 45th point, while the minimum is −5.89% at the 23rd point. This further demonstrates that the nonlinear fitting ability of the proposed model is the strongest so that its prediction accuracy and robustness are both the most satisfactory.
The RMSE, MAPE and AAE of the four prediction models are shown in Figure 13. It can be concluded that the RMSE, MAPE, and AAE values of the FOA-IR-GRNN model are still the lowest, which are 1.2016%, 1.1534% and 1.1535%, respectively. It is proved that the proposed model can obtain the highest prediction accuracy and the best stability under different conditions. This model can eliminate the interference of redundant factors through feature selection, so as to ensure the accuracy and stability of prediction. This result is consistent with the results obtained in Section 4.3.
In summary, the proposed model optimizes the GRNN model with the FOA, and obtains the appropriate smoothing parameter in the GRNN model, which can effectively reduce the icing prediction error. The IR model can not only reduce the noise data of the input variables to improve the effectiveness of input information, but also ensure the integrity of the input information, thus improving the accuracy and robustness of icing prediction. The validity of the proposed ice prediction model is proved by the data calculation results.

6. Conclusions

This paper presents a hybrid icing forecasting model that combines IR with GRNN optimized by FOA. First, in order to predict the icing thickness, the IR combined with the FOA is employed to select the input feature. Furthermore, the FOA is adopted to optimize the smoothing factor of the GRNN. Finally, after obtaining the optimized feature subset and the best value of smoothing factor, the proposed model is utilized for icing forecasting. Several conclusions based on the studies can be obtained as follows: (1) by the utilization of IR, the influence of unrelated noises can be reduced and the forecasting performance can be effectively improved; (2) the optimization algorithm FOA adds strong global searching capability to the model, and the GRNN model optimized by FOA shows good performance; (3) based on the error valuation criteria, the FOA-IR-GRNN model is a more promising methodology in icing forecasting as compared with the three classical icing forecasting models (SVM, BPNN, and GRNN); and (4) according to the empirical analysis of two cases, it is found that the model proposed in this paper still has good prediction performance for forecasting the icing thickness of transmission lines at different times and places. Hence, the proposed icing forecasting method of the FOA-IR-GRNN model is effective and feasible, and it may be an effective alternative for icing forecasting in the electric-power industry.

Acknowledgments

This work is supported by the Natural Science Foundation of China (Project No. 71471059) and the Fundamental Research Funds for the Central Universities (Project No. 2017XS103).

Author Contributions

Haichao Wang designed this research and wrote this paper; Dongxiao Niu and Yi Liang provided professional guidance; Hanyu Chen translated and revised this paper.

Conflicts of Interest

The author declares no conflict of interest.

References

  1. Tian, H.; Liang, N.; Zhao, P.; Wang, X.; Zhu, C.; Zhang, S.; Wang, W. Model updating approach for icing forecast of transmission lines by using particle swarm optimization. IOPscience 2017, 207. [Google Scholar] [CrossRef]
  2. Lamraoui, F.; Fortin, G.; Benoit, R.; Perron, J.; Masson, C. Atmospheric icing severity: Quantification and mapping. Atmos. Res. 2013, 128, 57–75. [Google Scholar] [CrossRef]
  3. Zhang, W.L.; Yu, Y.Q.; Su, Z.Y.; Fan, J.B.; Li, P.; Yuan, D.L.; Wu, S.Y.; Song, G.; Deng, Z.F.; Zhao, D.L.; et al. Investigation and analysis of icing and snowing disaster happened in hunan power grid in 2008. Power Syst. Technol. 2008, 32, 1–5. [Google Scholar]
  4. Zhuang, W.; Zhang, H.; Zhao, H.; Wu, S.; Wan, M. Review of the Research for Power line Icing Prediction. Adv. Meteorol. Sci. Technol. 2017, 7, 6–12. [Google Scholar]
  5. Liang, X.; Li, Y.; Zhang, Y.; Liu, Y. Time-dependent simulation model of ice accretion on transmission line. High Volt. Eng. 2014, 40, 336–343. [Google Scholar]
  6. Liu, C.C.; Liu, J. Ice accretion mechanism and glaze loads model on wires of power transmission lines. High Volt. Eng. 2011, 37, 241–248. [Google Scholar]
  7. Imai, I. Studies on ice accretion. Res. Snow Ice 1953, 3, 35–44. [Google Scholar]
  8. Goodwin, E.J.I.; Mozer, J.D.; Digioia, A.M.J.; Power, B.A. Predicting Ice and Snow Loads for Transmission Line Design. Available online: http://www.dtic.mil/docs/citations/ADP001696 (accessed on 11 August 2017).
  9. Lenhand, R.W. An indirect method for estimating the weight of glaze on wires. Bull. Am. Meteorol. Soc. 1995, 36, 1–5. [Google Scholar]
  10. Huang, X.B.; Li, H.B.; Zhu, Y.C.; Wang, Y.X.; Zheng, X.X.; Wang, Y.G. Transmission line icing short-term forecasting based on improved time series analysis by fireworks algorithm. In Proceedings of the International Conference on Condition Monitoring and Diagnosis, Xi’an, China, 25–28 September 2016. [Google Scholar]
  11. Yang, J.L. Impact on the Extreme Value of Ice Thickness of Conductors from Probability Distribution Models. In Proceedings of the International Conference on Mechanical Engineering and Control Systems, Wuhan, China, 23–25 January 2015. [Google Scholar]
  12. Liu, C.; Liu, H.W.; Wang, Y.S.; Lu, J.Z.; Xu, X.J.; Tan, Y.J. Research of icing thickness on transmission lines based on fuzzy Markov chain prediction. In Proceedings of the IEEE International Conference on Applied Superconductivity and Electromagnetic Devices (ASEMD), Beijing, China, 25–27 October 2013. [Google Scholar]
  13. Chen, S.; Dong, D.; Huang, X.; Sun, M. Short-Term Prediction for Transmission Lines Icing Based on BP Neural Network. In Proceedings of the Asia-Pacific Power and Energy Engineering Conference, Shanghai, China, 27–29 March 2012. [Google Scholar]
  14. Ma, T.; Niu, D.; Fu, M. Icing Forecasting for Power Transmission Lines Based on a Wavelet Support Vector Machine Optimized by a Quantum Fireworks Algorithm. Appl. Sci. 2016, 6, 54. [Google Scholar] [CrossRef]
  15. Luo, Y.; Yao, Y.; Ying, L.I.; Wang, K.; Qiu, L. Study on Transmission Line Ice Accretion Mode Based on BP Neural Network. J. Sichuan Univ. Sci. Eng. 2012, 25, 63–66. [Google Scholar]
  16. Li, P.; Li, Q.M.; Ren, W.P.; He, R.; Gong, Y.Y.; Li, Y. SVM-based prediction method for icing process of overhead power lines. Int. J. Model. Identif. Control 2015, 23, 362. [Google Scholar]
  17. Ma, X.M.; Gao, J.; Wu, C.; He, R.; Gong, Y.Y.; Li, Y. A prediction model of ice thickness based on grey support vector machine. In Proceedings of the IEEE International Conference on High Voltage Engineering and Application, Chengdu, China, 19–22 September 2016. [Google Scholar]
  18. Lee, G.E.; Zaknich, A. A mixed-integer programming approach to GRNN parameter estimation. Inf. Sci. 2015, 320, 1–11. [Google Scholar] [CrossRef]
  19. Zhang, J.; Tan, Z.; Li, C. A Novel Hybrid Forecasting Method Using GRNN Combined with Wavelet Transform and a GARCH Model. Energy Sources Part B 2015, 10, 418–426. [Google Scholar] [CrossRef]
  20. Zhao, H.; Guo, S. Annual Energy Consumption Forecasting Based on PSOCA-GRNN Model. Abstr. Appl. Anal. 2014, 2014, 217630. [Google Scholar] [CrossRef]
  21. Leng, Z.; Gao, J.; Qin, Y.; Liu, X.; Yin, J. Short-term forecasting model of traffic flow based on GRNN. In Proceedings of the 25th Chinese Control and Decision Conference (CCDC), Guiyang, China, 25–27 May 2013. [Google Scholar]
  22. Gao, Y.; Zhang, R. Analysis of House Price Prediction Based on Genetic Algorithm and BP Neural Network. Comput. Eng. 2014, 40, 187–191. [Google Scholar]
  23. Yang, X.Y.; Guan, W.Y.; Liu, Y.Q.; Xiao, Y.Q. Prediction Intervals Forecasts of Wind Power based on PSO-KELM. Proc. CSEE 2015, 35, 146–153. [Google Scholar]
  24. Wang, L.; Zheng, X.L.; Wang, S.Y. A novel binary fruit fly optimization algorithm for solving the multidimensional knapsack problem. Knowl.-Based Syst. 2013, 48, 17–23. [Google Scholar] [CrossRef]
  25. Wang, L.; Liu, R.; Liu, S. An effective and efficient fruit fly optimization algorithm with level probability policy and its applications. Knowl.-Based Syst. 2016, 97, 158–174. [Google Scholar] [CrossRef]
  26. Sun, W.; Liang, Y. Least-Squares Support Vector Machine Based on Improved Imperialist Competitive Algorithm in a Short-Term Load Forecasting Model. J. Energy Eng. 2014, 141. [Google Scholar] [CrossRef]
  27. Li, H.; Guo, S.; Zhao, H.; Su, C.; Wang, B. Annual Electric Load Forecasting by a Least Squares Support Vector Machine with a Fruit Fly Optimization Algorithm. Energies 2012, 5, 4430–4445. [Google Scholar] [CrossRef]
  28. Liu, D.; Wang, J.; Wang, H. Short-term wind speed forecasting based on spectral clustering and optimised echo state networks. Renew. Energy 2015, 78, 599–608. [Google Scholar] [CrossRef]
  29. Chen, T.; Ma, J.; Huang, S.H.; Cai, A. Novel and efficient method on feature selection and data classification. J. Comput. Res. Dev. 2012, 49, 735–745. [Google Scholar]
  30. Ma, T.; Niu, D.; Huang, Y.; Du, Z. Short-Term Load Forecasting for Distributed Energy System Based on Spark Platform and Multi-Variable L2-Boosting Regression Model. Power Syst. Technol. 2016, 40, 1642–1649. [Google Scholar]
  31. Liu, J.P.; Li, C.L. The Short-Term Power Load Forecasting Based on Sperm Whale Algorithm and Wavelet Least Square Support Vector Machine with DWT-IR for Feature Selection. Sustainability 2017, 9, 1188. [Google Scholar] [CrossRef]
  32. Jose, V.R.R. Percentage and Relative Error Measures in Forecast Evaluation. Oper. Res. 2017, 65, 200–211. [Google Scholar] [CrossRef]
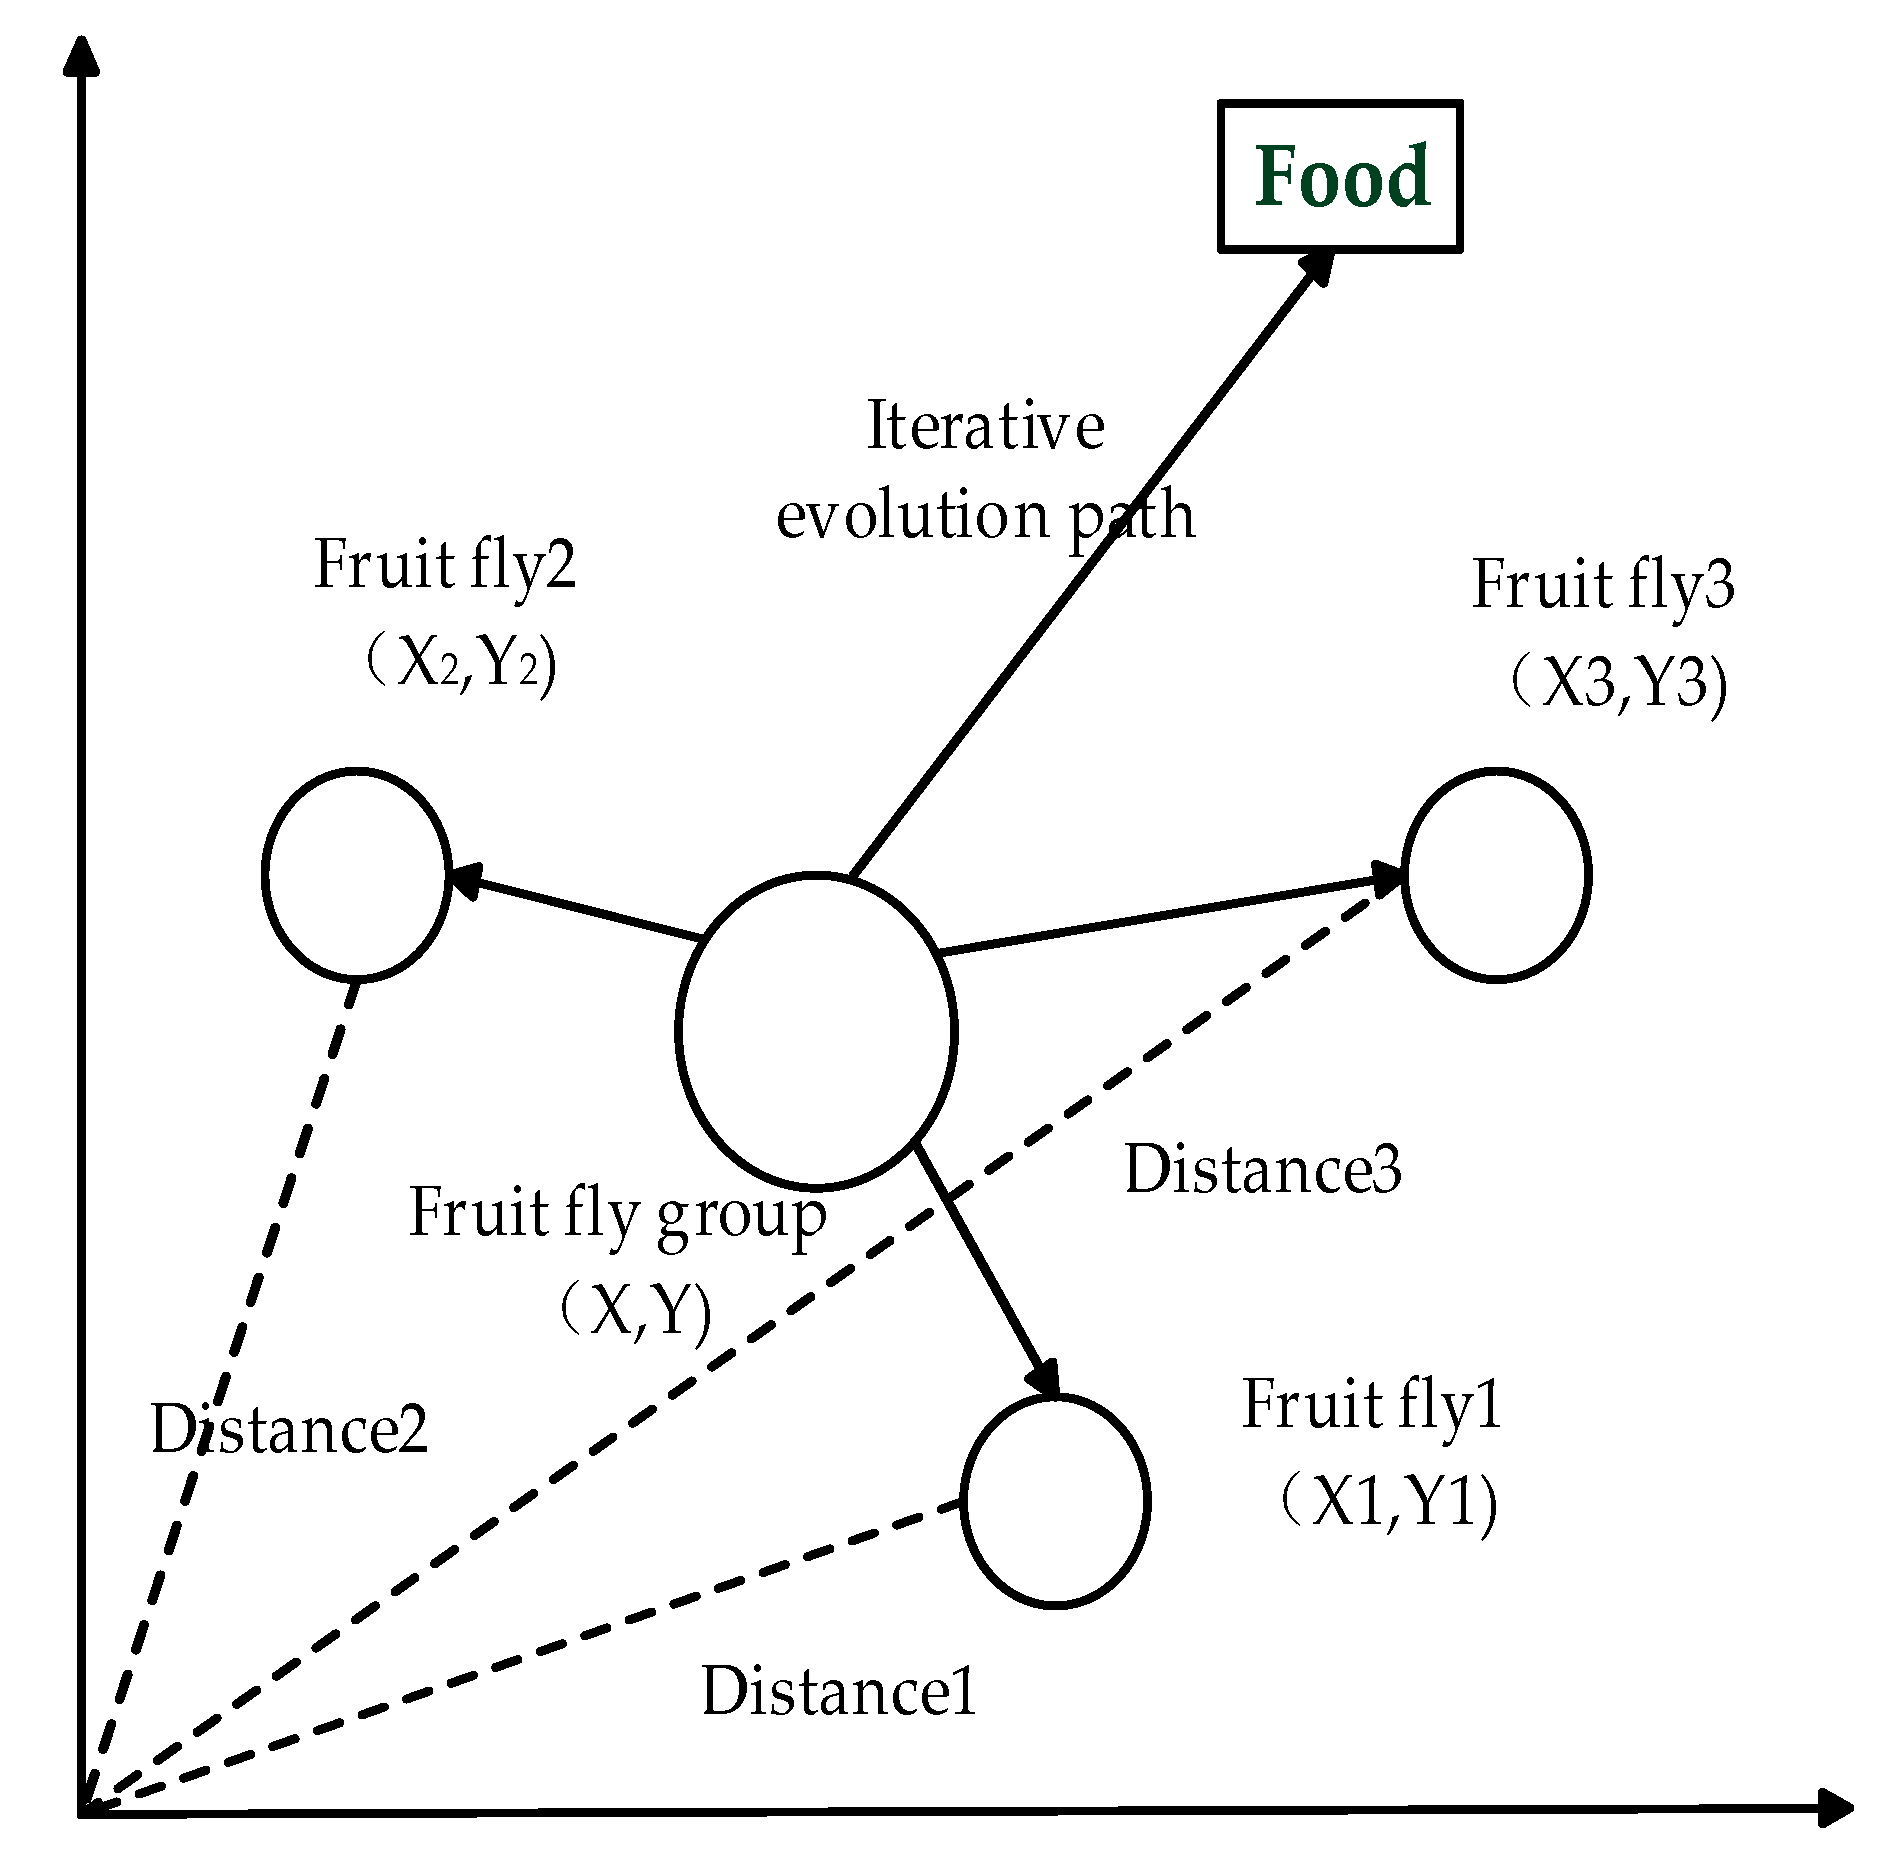
Figure 1. Iterative food searching process of the fruit fly swarm.
Energies 10 02066 g001
Figure 2. The structure of the generalized regression neural network (GRNN).
Energies 10 02066 g002
Figure 3. The flow chart of FOA-IR-GRNN. FOA: fruit fly optimization algorithm; IR: inconsistency rate; RE: relative error; RMSE: root mean square error; MAPE: mean absolute percentage error; AAE: average absolute error.
Energies 10 02066 g003
Figure 4. Original data chart of icing thickness, temperature, wind speed and humidity. Note: (a) represents the original data of icing thickness; (b) represents the original data of temperature; (c) represents the original data of wind speed; and (d) represents the original data of humidity.
Energies 10 02066 g004
Figure 5. The curve of convergence for feature selection. Note: (a) represents the fitness value; (b) represents the forecasting accuracy; (c) represents the reduced number of candidate feature; and (d) represents the selected number of optimization feature.
Energies 10 02066 g005
Figure 6. The forecasting values of the proposed method and the comparison methods. Note: (a) the forecasting value from sample points 1–20; (b) the forecasting value from sample points 20–40; (c) the forecasting values from sample points 41–58. BPNN: back-propagation neural network; SVM: support vector machine.
Energies 10 02066 g006
Figure 7. The relative error curve of each method.
Energies 10 02066 g007
Figure 8. Values of root-mean-square error (RMSE), mean absolute percentage error (MAPE) and average absolute error (AAE).
Energies 10 02066 g008
Figure 9. Original data chart of icing thickness, temperature, wind speed and humidity. Note: (a) represents the original data of icing thickness; (b) represents the original data of temperature; (c) represents the original data of wind speed; and (d) represents the original data of humidity.
Energies 10 02066 g009
Figure 10. The curve of convergence for feature selection. Note: (a) represents the fitness value; (b) represents the forecasting accuracy; (c) represents the reduced number of candidate feature; and (d) represents the selected number of optimization feature.
Energies 10 02066 g010
Figure 11. The forecasting values of the proposed method and the comparison methods. Note: (a) the forecasting value from sample points 1–20; (b) the forecasting value from sample points 21–40; and (c) the forecasting value from sample points 41–60.
Energies 10 02066 g011
Figure 12. The relative error curves of each method.
Energies 10 02066 g012
Figure 13. Values of root-mean-square error (RMSE), mean absolute percentage error (MAPE) and average absolute error (AAE).
Energies 10 02066 g013
Table 1. The full candidate features.
C1, …, C4ITt-i, i = 1, 2, 3, 4 represent the t-ith time point’s icing thickness
C5, …, C9Tt-i, i = 0, 1, 2, 3, 4 represent the t-ith time point’s ambient temperature
C10, …, C14Ht-i, i = 0, 1, 2, 3, 4 represent the t-ith time point’s relative air humidity
C15, …, C19WSt-i, i = 0, 1, 2, 3, 4 represent the t-ith time point’s wind speed
C20WDt represents the tth time point’s wind direction
C21SIt represents the tth time point’s sunlight intensity
C22APt represents the tth time point’s air pressure
C23AL represents the altitude
C24CH represents the condensation height
C25LD represents the transmission line direction
C26LSH represents the transmission line suspension height
C27LC represents the load current
C28R represents the rainfall
C29ST represents the surface temperature on the transmission line
Table 2. Results of the k-fold cross-validation.
Fold Number123456789101112AverageStandard Deviation
RMSE0.01260.01270.01280.01210.01030.01010.01230.01330.01280.01260.0130.01150.01220.0010
Table 3. Part of the forecasting value and relative errors of each model.
Data Point NumberActual Value (mm)BPNNSVMGRNNFOA-GRNNProposed Model
Forecast Value (mm)Error (%)Forecast Value (mm)Error (%)Forecast Value (mm)Error (%)Forecast Value (mm)Error (%)Forecast Value (mm)Error (%)
13.453.333.483.55−2.863.372.233.50−1.34103.401.43
23.063.011.543.16−3.223.12−2.153.15−3.07633.031.01
32.782.86−2.582.693.292.751.162.770.70422.760.75
42.852.763.132.762.872.90−2.052.763.13032.820.77
52.532.453.092.55−0.852.61−3.192.462.87852.56−1.10
62.222.33−4.982.28−2.832.27−2.322.24−0.93582.26−1.89
72.252.173.492.32−3.402.202.212.30−2.46742.220.99
82.132.063.152.101.612.092.052.19−2.74892.101.43
91.681.75−3.731.74−2.991.74−3.081.74−3.02261.671.10
101.571.64−4.321.62−2.991.62−2.711.64−3.95861.59−0.85
111.461.50−2.751.422.571.49−2.191.413.41281.450.72
121.371.361.101.41−2.661.342.091.332.90471.351.38
131.371.43−4.261.332.681.342.051.360.45031.39−1.31
141.331.273.891.292.531.36−2.591.292.37381.34−1.47
151.281.34−4.211.243.481.33−3.911.32−2.91581.30−1.36
Table 4. Results of the k-fold cross-validation.
Fold Number123456789101112AverageStandard Deviation
RMSE0.01150.01280.01170.01250.01330.0110.01290.01020.01050.01320.01030.01220.01180.0011
Table 5. Part of the forecasting value and relative errors of each model.
Data Point NumberActual Value (mm)BPNNSVMGRNNFOA-GRNNProposed Model
Forecast Value (mm)Error (%)Forecast Value (mm)Error (%)Forecast Value (mm)Error (%)Forecast Value (mm)Error (%)Forecast Value (mm)Error (%)
114.5613.715.8115.01−3.0714.162.7514.79−1.5914.66−0.67
216.2116.56−2.1615.921.7715.961.5516.76−3.4016.001.30
316.0215.205.1216.50−2.9916.44−2.6215.672.1615.801.40
415.3514.793.6515.82−3.0515.181.1215.061.8815.54−1.21
513.8713.582.0814.32−3.2713.592.0513.592.0014.00−0.96
613.5514.33−5.7413.143.0213.98−3.1813.86−2.2613.77−1.62
713.0113.48−3.6012.652.7513.31−2.3213.13−0.9213.15−1.07
812.9813.52−4.1713.43−3.4613.29−2.3813.28−2.3112.831.19
912.3511.655.6611.992.8912.66−2.5112.77−3.3612.280.55
1012.0111.543.9111.504.2412.36−2.9311.791.8411.861.22
1111.2110.724.3410.932.4611.55−3.0510.972.1011.31−0.92
1210.5610.97−3.8810.84−2.6310.81−2.3810.79−2.1710.70−1.35
1310.029.703.1710.32−3.009.703.2110.19−1.699.911.13
149.8910.45−5.6610.21−3.229.602.9310.05−1.639.800.93
1510.2110.70−4.769.784.229.893.1610.30−0.9210.061.47