Latching and Declutching Control of the Solo Duck Wave-Energy Converter with Different Load Types


1
School of Mechatronics Engineering, Harbin Institute of Technology, Harbin 150001, Heilongjiang, China
2
Department of Engineering Science, Uppsala University, 75121 Uppsala, Sweden
3
Shenzhen Graduate School, Harbin Institute of Technology, Shenzhen 518055, Guangdong, China
*
Author to whom correspondence should be addressed.
Energies 2017, 10(12), 2070; https://doi.org/10.3390/en10122070
Submission received: 10 November 2017
/
Revised: 22 November 2017
/
Accepted: 26 November 2017
/
Published: 6 December 2017
Abstract
:The solo duck wave-energy converter (WEC) captures power in a point absorber manner, hence it exhibits high power-capture efficiency within only a narrow bandwidth. Passive control is characterized by a unidirectional power flow, and thus its engineering implementation can be simplified. In this paper, two typical passive control strategies, latching and declutching control, are applied to the solo duck WEC to improve its power-capture performance at wave periods larger and smaller than the natural period of the WEC, respectively. Special attention is paid to the peak value of instantaneous WEC performance parameters, including the peak motion excursion, the peak power take-off (PTO) moment, and the peak-to-average power ratio, when the captured power is maximized. Performance differences between the linear and coulomb loads are also investigated. Results show that both latching and declutching control can effectively improve captured power, but also incidentally increase the peak motion excursion and peak-to-average power ratio. When under latching and declutching control, the coulomb load leads to the same maximum relative capture width and peak motion excursion as the linear load, but presents smaller peak PTO moment and peak-to-average power ratio than the linear load, hence making the coulomb load the better choice for the solo duck WEC.
1. Introduction
Environmentally friendly power supply requires clean and renewable energy resources, one of which is the wave energy. Despite the fact that the wave-energy converter (WEC) was first patented as early as 1799 [1], wave-energy conversion technology did not enter spotlight until 1970s, when it was proposed as a promising alternative to traditional fossil energy [2]. The Edinburgh duck WEC was proposed at this time [3] and is renowned for its high efficiency, which is confirmed to exceed 90% in 2D regular wave tests [4]. In addition to the WEC farm topology whereby duck members are closely spaced and working as terminators, the topology whereby duck members are spaced at a distance and working as point absorbers has also received wide attention [5,6,7,8,9,10]. In the latter case, each duck member is called a ‘solo duck’. The high power-capture efficiency of the solo duck WEC was confirmed by the relative capture width exceeding 1.6 and 2, as observed by Skyner [5] and Pizer [6], respectively. An innovative solo duck with a circular cross section but off-centered pitch axis was proposed by Lucas et al. [7] and Cruz et al. [8] to simplify the manufacturing process. The separation distance and layout of the solo duck WECs in an array was optimized by Wu et al. [9].
It is well known that a point absorber exhibits high power-capture efficiency within only a narrow bandwidth [11]. Hence, at wave periods apart from the natural period, the power-capture ability of a point absorber may be significantly reduced. To tackle this challenge, both active control and passive control [12,13] have been proposed, and they are distinguished by whether or not the power take-off (PTO) system should inject power to the primary wave-energy absorber [14]. Since passive control presents a unidirectional power flow, its engineering implementation can be simplified. Among the various passive control strategies that have been proposed, latching and declutching control are most frequently employed and are effective for wave periods larger and smaller than the natural period of the WEC, respectively [15]. Latching control was proposed by Budal and Falnes [16], and is implemented by holding the oscillating body in a fixed position when its velocity vanishes and releasing it after an appropriate time duration so that the velocity is in phase with the excitation force in order to capture the most power. Declutching control, also denoted as ‘unlatching’, was originally proposed by Salter [17] and works as the dual of latching control by alternatively switching the PTO system on and off. In [18,19,20], a significant performance enhancement due to latching control was observed. Babarit [21] applied declutching control to the SEAREV WEC and showed that the declutching control could at least lead to power-capture performance equivalent to that of pseudo-continuous control. Feng [15] revealed that latching and declutching control can be combined to increase power-capture performance by appropriately switching within three modes: power generation, declutching with no power generation, and latching with zero velocity. In addition to improving the power-capture performance of WECs, latching and declutching can also help to control WECs from the engineering operation point of view. For example, when maintenance is required, oscillating bodies can be locked by the latching mechanism to allow for the access of staff. Also, in extreme waves, oscillating bodies may be declutched from the PTO system by the declutching mechanism so that the PTO system is protected, so that then the compliance of oscillating bodies to waves may reduce the hydrodynamic impact forces.
Since the solo duck WEC captures power in a point absorber manner, it should be properly controlled to enhance power-capture performance apart from the natural period. Latching and declutching control seem to be good options due to their engineering simplicity. Therefore, the first question that the paper aims to answer is: to what extent can latching and declutching control benefit the solo duck WEC? The answer may be of significance when estimating if it is cost effective to implement latching and declutching control to a solo duck WEC. Furthermore, nowadays two kinds of PTO system are mainly adopted in WECs: either a full-electrical linear generator system used in the Seabased AB WEC [22], the Archimedes Wave Swing [23], etc.; or the hydraulic system used in the CETO WEC [24], Wavestar [25], etc. Usually, the linear generator system is modeled as the linear load (LL) [26,27], while the hydraulic system is modeled as the coulomb load (CL) [18,26] supposing that the accumulators in the hydraulic circuit are large enough. Obviously, different types of load will result in a different control effect. Hence, the second question that the paper aims to answer is: which type of load is better for the solo duck WEC under latching and declutching control? The answer will guide the selection of load types when considering applying the latching and declutching control to a solo duck WEC. In Section 2, the geometry of the solo duck to be studied is introduced. In Section 3, the equation of motion of the duck WEC is established in a time domain. In Section 4, the control effects that resulted from latching and declutching control and differences between the linear and coulomb loads are presented.
2. Geometry of the Duck
The cross section of the solo duck is shown in Figure 1 [5,9,10]. The dimension of the solo duck prototype studied in this paper is the same as the one studied by Pizer [6,28], and is 100:1 scaled from [5]. Therefore, we set as follows: the radius of the stern part is 5 m; the depth of pitch axis is 5.5 m; the width of the duck is W = 29 m; and the water depth is h = 60 m. According to [9], the power-capture performance of the solo duck WEC is sensitive to the wave direction, which requires that the solo duck WEC should align the pitch axis perpendicular to the wave-propagating direction and it should be located at positions of small wave direction variation. In this paper, to simplify the analysis, it is assumed that the duck is in head seas. Also, the pitch axis of the solo duck can be treated as fixed provided that the pre-tension margin and stiffness of the tension legs of the WEC taut-mooring system, which is shown in [9], are sufficiently large.
3. Governing Equation
In this paper, it is assumed that the fluid is incompressible, inviscid, the flow is irrotational with small wave steepness, and the excursion of the duck is small. Then, the motion of the duck can be described in the time domain by the Cummins’ equation [29] as
where I is the dry moment of inertia of the duck WEC; is the added moment of inertia at infinite frequency; K(t) is the retardation function regarding the radiation moment; C is the hydrostatic restoring spring coefficient; Me is the excitation moment; Mpto is the reacting moment from the PTO system; θ is the angular displacement of the duck; and t and τ are the flow time. According to the experimental setup of Skyner [5], we have I = 6.36 × 10⁷ kg·m2 and C = 1.165 × 10⁸ N·m/rad. In regular waves, the excitation moment can be written as
where Awave is the wave amplitude; is the complex amplitude of the excitation moment per wave amplitude; and w is the angular frequency of the incident wave. Since we confine our study to the linear wave region, only Awave = 1 m is considered in this paper. The retardation function K(t) satisfies the following relation [30]
where B is the radiation-damping coefficient of the solo duck. The Fourier transformation of the retardation function satisfies
where A is the added moment of inertia of the solo duck. The hydrodynamic coefficients are calculated using the ANSYS AQWA (ANSYS, Inc., Canonsburg, PA, USA) [31] software and they are validated in [9,10] by comparison with experimental results measured in [5].
Due to the angular velocity be involved in the convolution term, solving Equation (1) by directly integrating the convolution is time-consuming. In fact, the convolution term is the output of a linear system, whose frequency-response function (FRF) and impulse-response function (IRF) are K(w) and K(t), respectively. According to [32], by replacing the convolution term with the output of an approximated linear system, which is described by a state-space model, Equation (1) will be simplified to a first order ordinary differential equation and will be solved more rapidly. The approximated linear system is defined in the state-space formulation as
where z is the state vector describing the internal state of the linear system; p is the output of the linear system; and A, B, C and D are the corresponding coefficient matrix and vectors that are to be determined by the system identification process so that the FRF and IRF of the approximated linear system approach K(w) and K(t), respectively. By adopting the ‘regression in the frequency domain’ method introduced in [32], we find that the convolution term can be approximated by a 9th order linear system. The coefficients in Equation (5) are presented in Appendix A. Figure 2 shows the comparison of FRF and IRF between the original and approximated linear system. It is found that both the FRF and IRF of the approximated linear system agree well with that of the original linear system, indicating that the linear system described by the state-space model is very close to that described by the convolution. Small deviation is detected around the wave frequency of 3.9 rad/s for the FRF as a result of the low order of the approximated linear system. The deviation of the IRF at a very low time range is also seen, resulting from the ‘regression in the frequency domain’ method used in the system identification process. This deviation is also observed in [32], and is found to make no difference to the solution of Equation (1).
Based on the approximated linear system described by the state-space model as shown in Equation (5), Equation (1) can be re-arranged as a first order ordinary differential equation
where
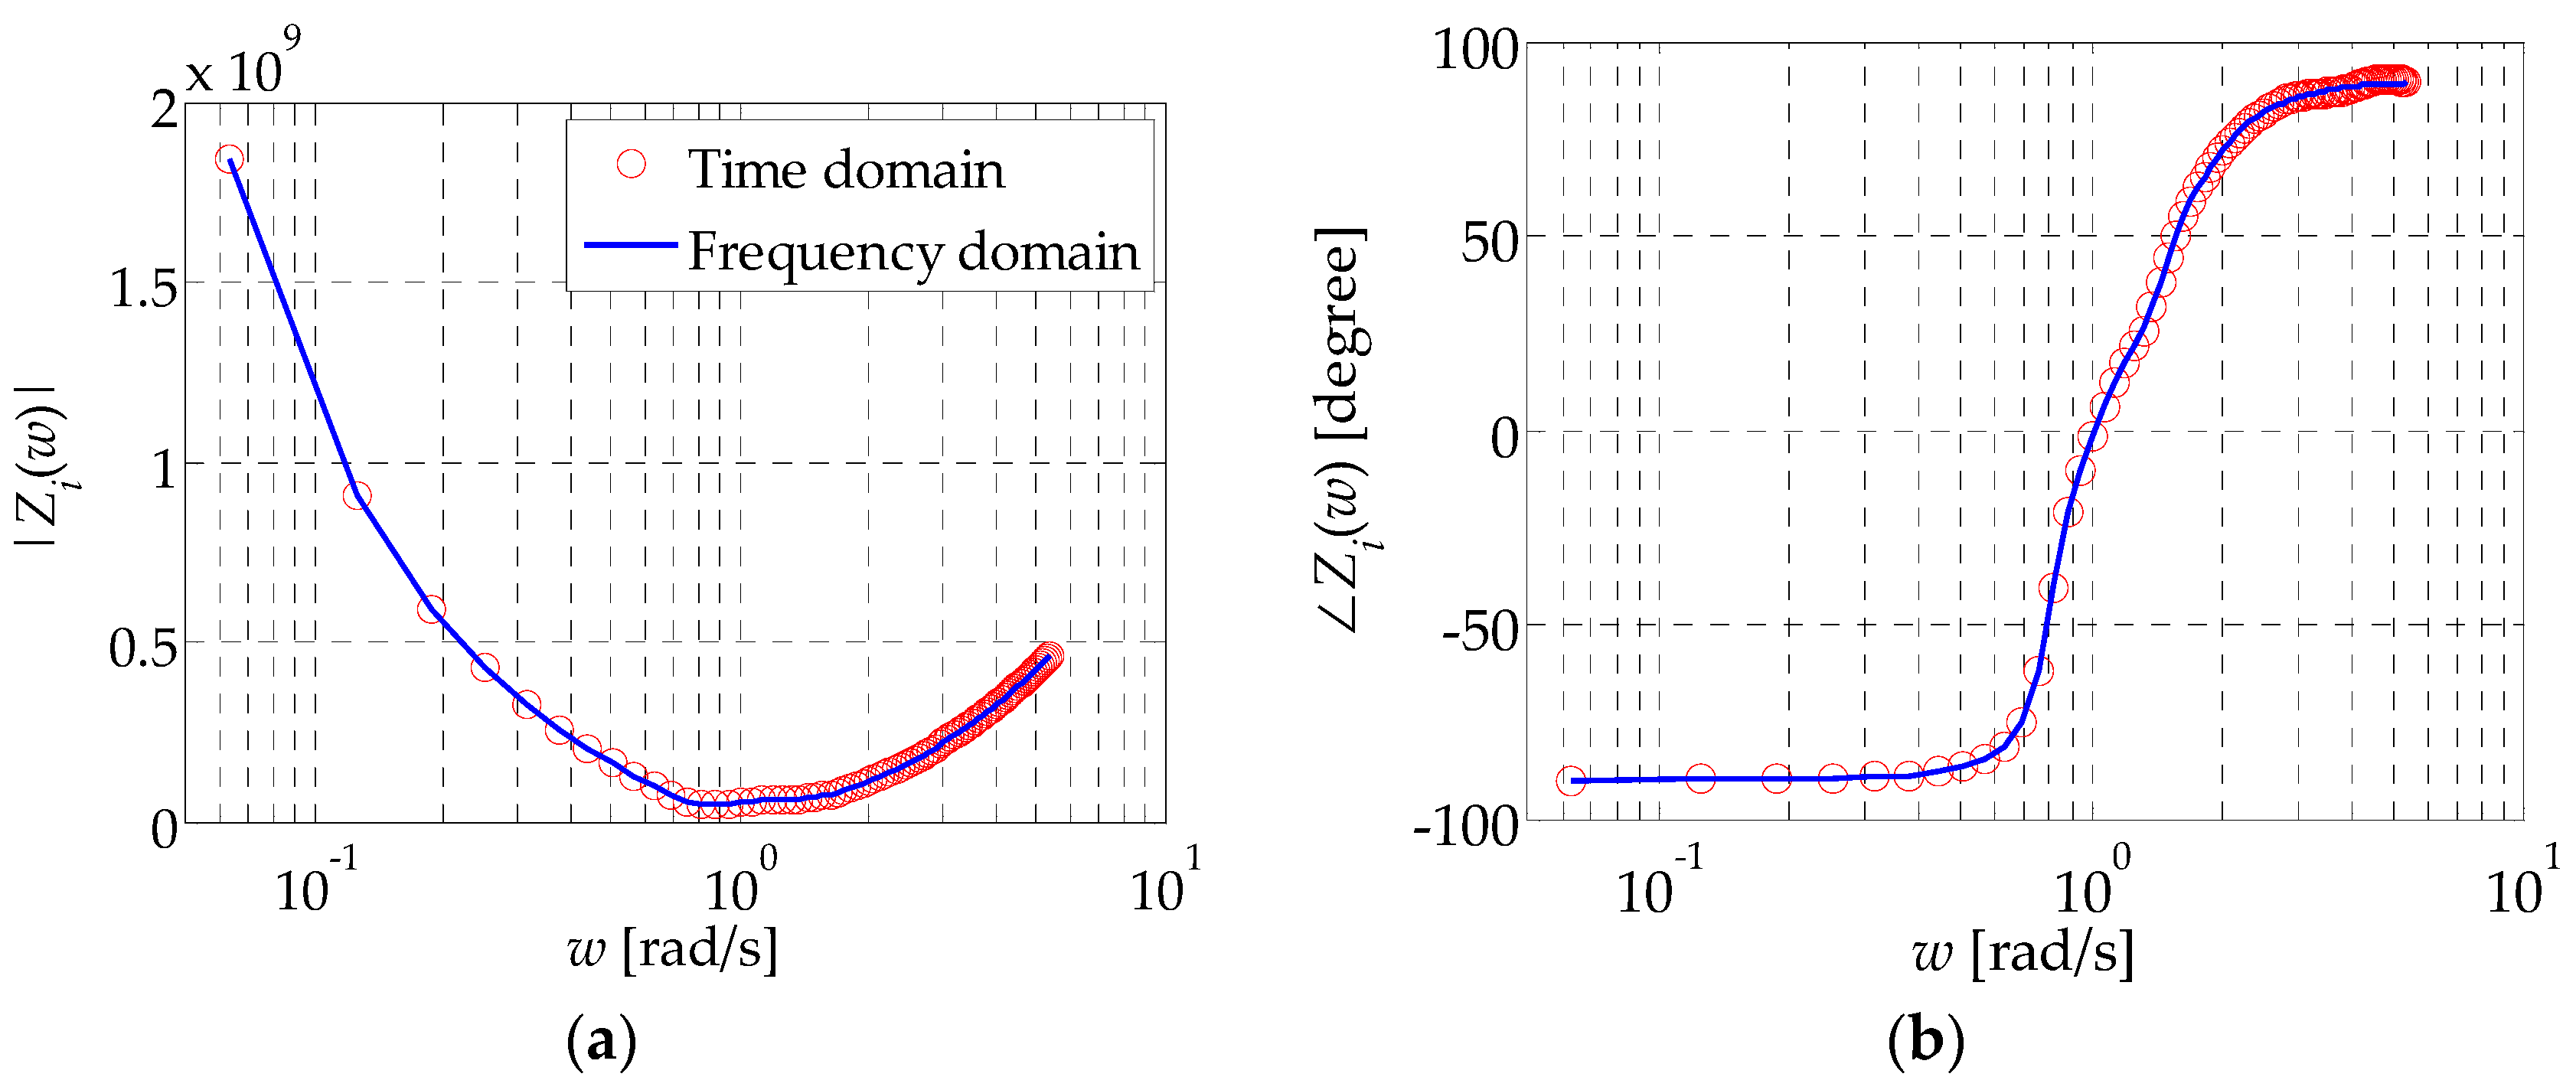
Equation (6) can be solved by the 4th order Runge-Kutta method with a fixed time step. In this paper, the time-step convergence tests are performed for each PTO moment Mpto setup and wave frequency w. The larger the PTO moment and the wave frequency are set, the smaller the time step is tuned. Finally, the time step ranges from 0.0002 s to 0.02 s to keep the simulation result independent of the time-step size. To estimate the accuracy of the solution of Equation (1), we show in Figure 3 the duck WEC’s intrinsic mechanical impedance, calculated in both the frequency and time domain. In the frequency domain, the intrinsic mechanical impedance is calculated according to [33] as
In the time domain, the intrinsic mechanical impedance can be calculated in regular waves by removing Mpto from Equation (1) as
where is the complex amplitude of the WEC angular velocity when it evolves to the steady state in the time domain. It can be seen that the intrinsic mechanical impedance predicted in the time domain agrees well with that directly calculated in the frequency domain. Deviations of the FRF around wave frequency of 3.9 rad/s and the IRF at very low time range cause little influence on the simulation result, which agrees with the observation in [32]. The above analysis confirms that when the convolution term in Equation (1) is replaced by the output of a state-space model of an approximated linear system, the dynamic of the solo duck WEC can be accurately predicted in the time domain.
4. Results and Discussion
In this section, performance of the solo duck WEC without latching and declutching control is first studied as a reference to measure the control effect due to latching and declutching control in subsequent sections.
4.1. Performance without Latching and Declutching Control
When no latching and declutching control is applied, the power-capture ability of the duck WEC can be maximized by simply tuning the PTO moment setup to an appropriate extent, and this is called ‘resistive control’ in this paper. For the linear load, the PTO moment is defined as
where Bp is the damping coefficient of the PTO system and is called the ‘PTO damping coefficient’ in this paper. Then, the frequency-domain complex amplitude of the duck angular velocity is obtained as
According to [33], the average captured power of the duck WEC follows
where * represents the complex conjugate. To simplify the expressions, we replace the imaginary part of the denominator of Equation (11) by
Inserting Equation (11) to Equation (12) gives the averaged captured power of the duck WEC
which will be maximized to be
when Bp satisfies
The power-capture efficiency of the duck WEC can be measured by the Relative Capture Width (RCW), which is defined as
where Pin is the incident wave power of the unit wave crest. In regular waves, it is [34]
where ρ is the water density; g is the gravity acceleration; and k is the wave number.
For the coulomb load, the PTO moment is defined as
where Mp is the moment caused by the hydraulic cylinder in the PTO hydraulic circuit and is called the ‘PTO cylinder moment’ in this paper. To start moving the duck WEC from a still position, the resultant hydrodynamic moment, including the excitation moment, radiation moment and hydrostatic restoring moment, should overcome the PTO cylinder moment Mp. The averaged captured power of the duck WEC can be calculated as
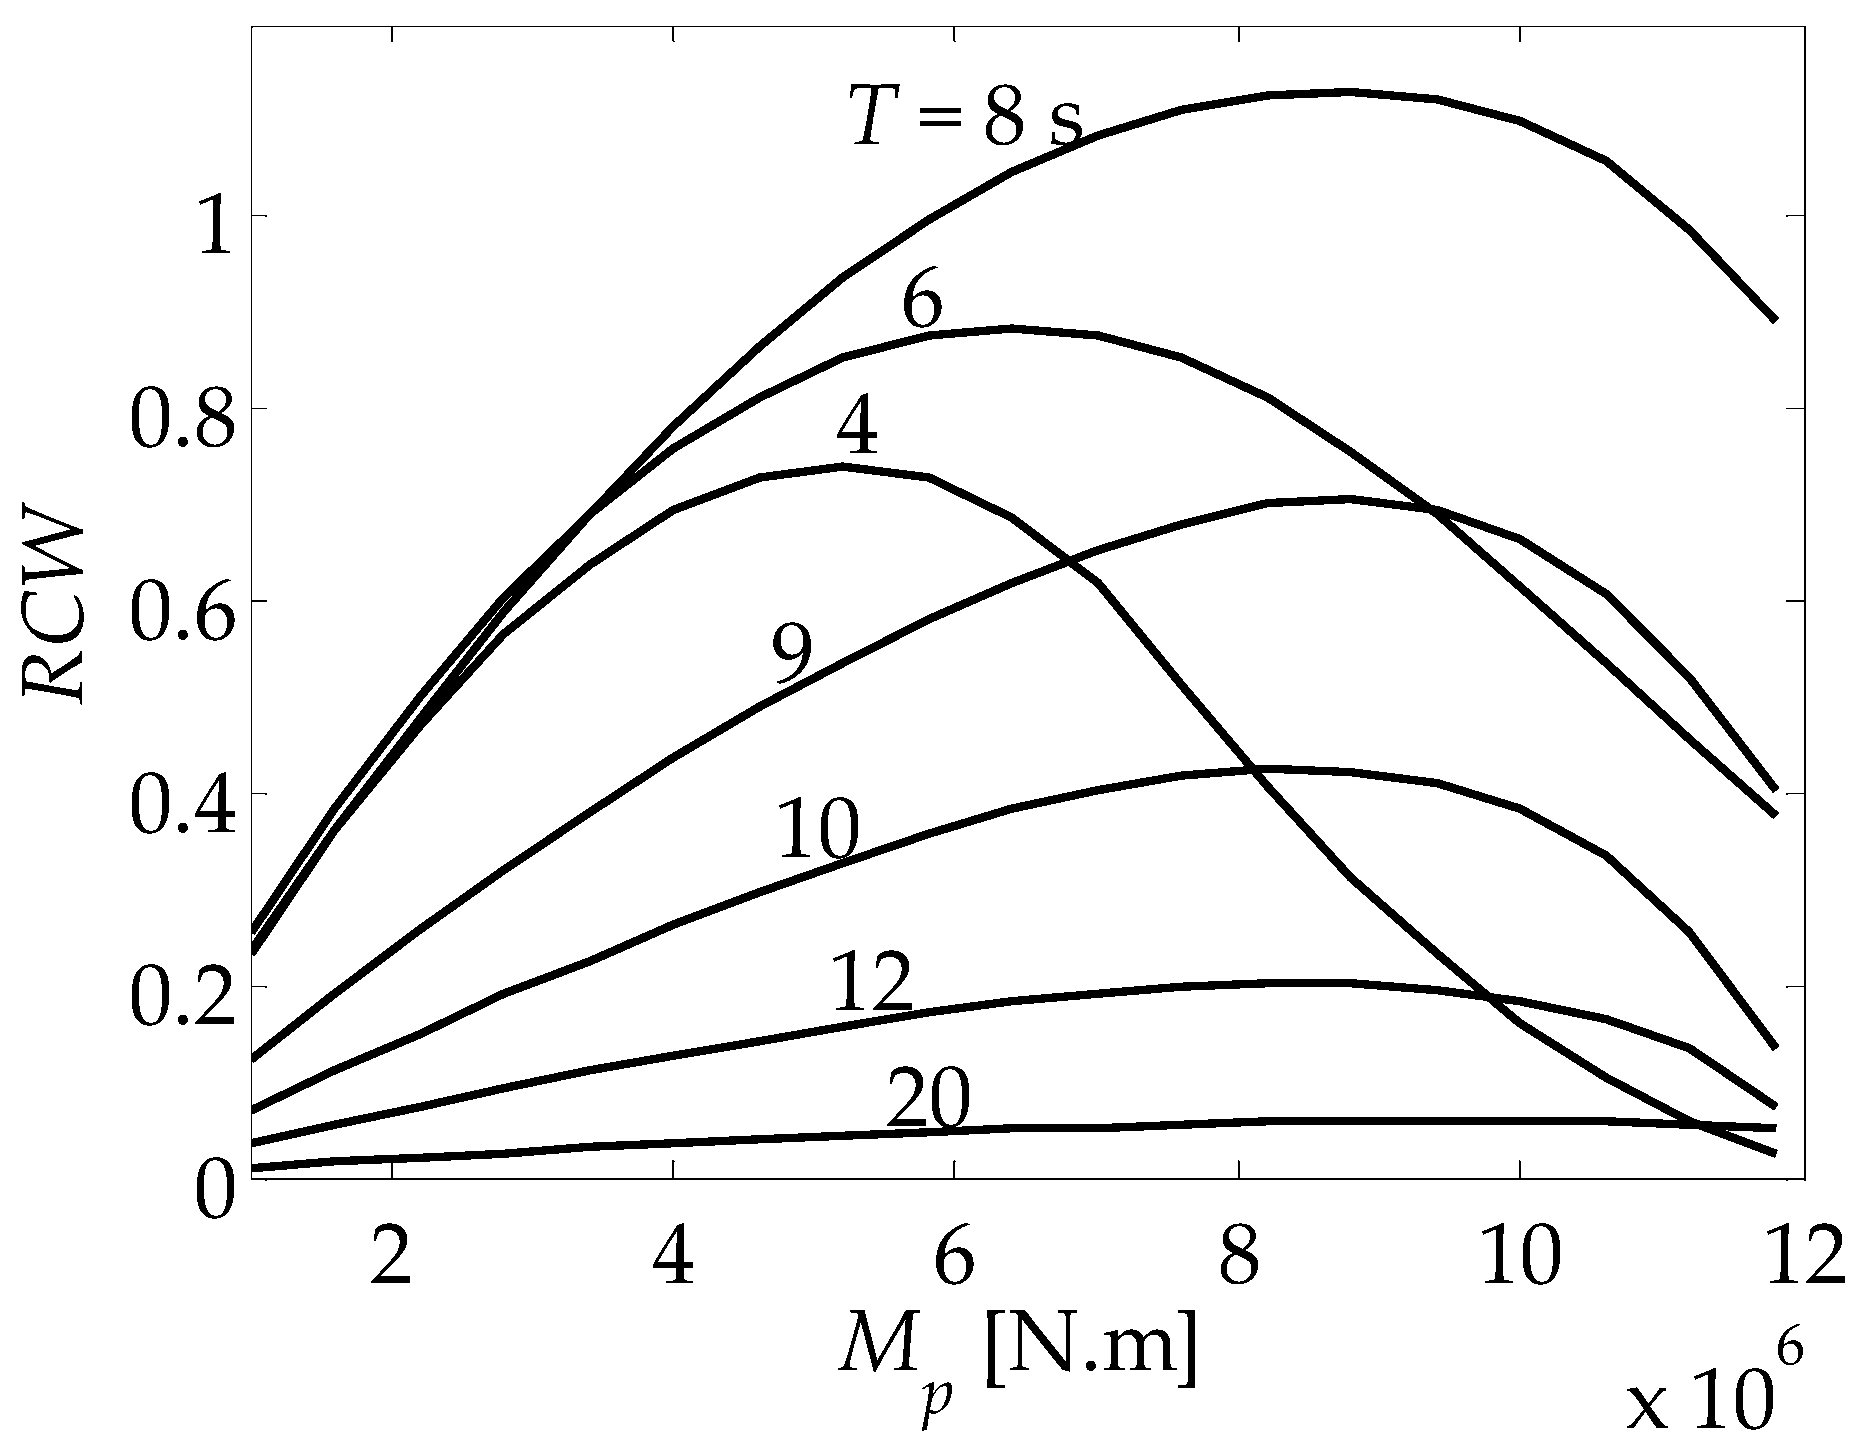
where T denotes the wave period. Because of the non-linear behavior of the PTO moment for the coulomb load, the average captured power could not be solved analytically as for the linear load. Here, we numerically find the relative capture width of the duck WEC as a function of the PTO cylinder moment at several typical wave periods, as shown in Figure 4. It is found that, for a given wave period, the relative capture width is a unimodal function of the PTO cylinder moment. Therefore, the simple derivative-free golden-section search algorithm [35] is used to find the maximum relative capture width at different wave periods.
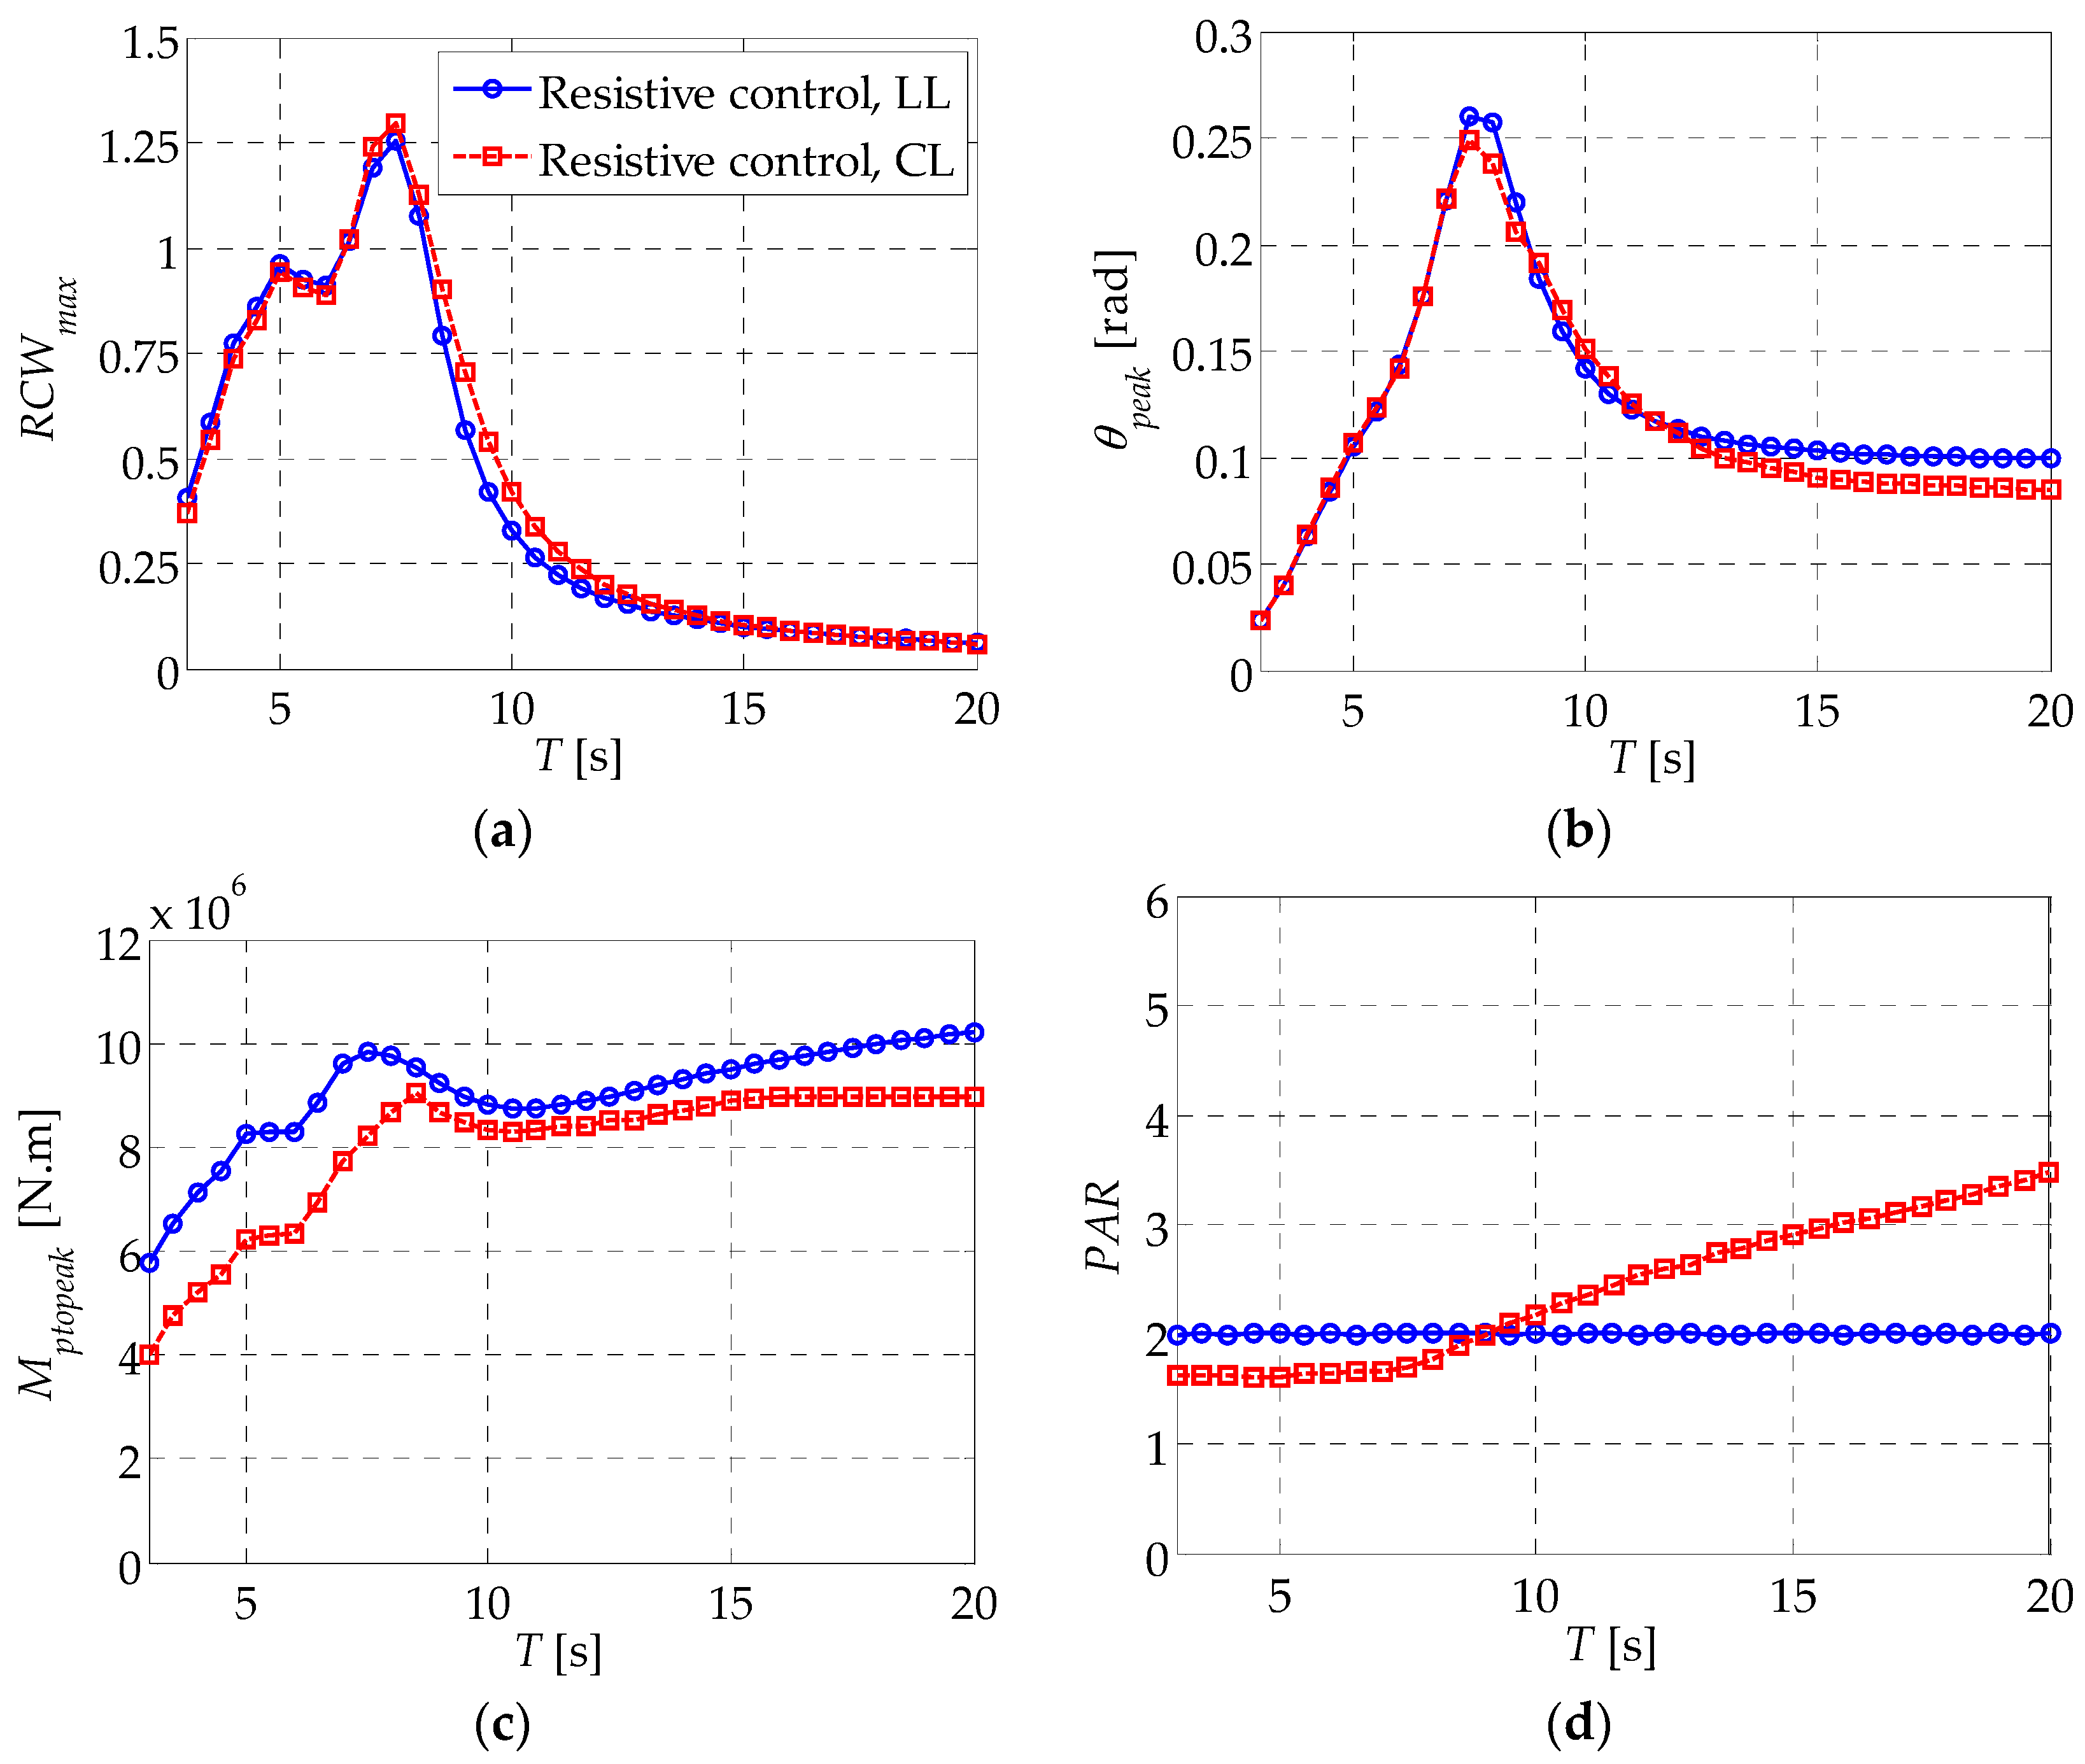
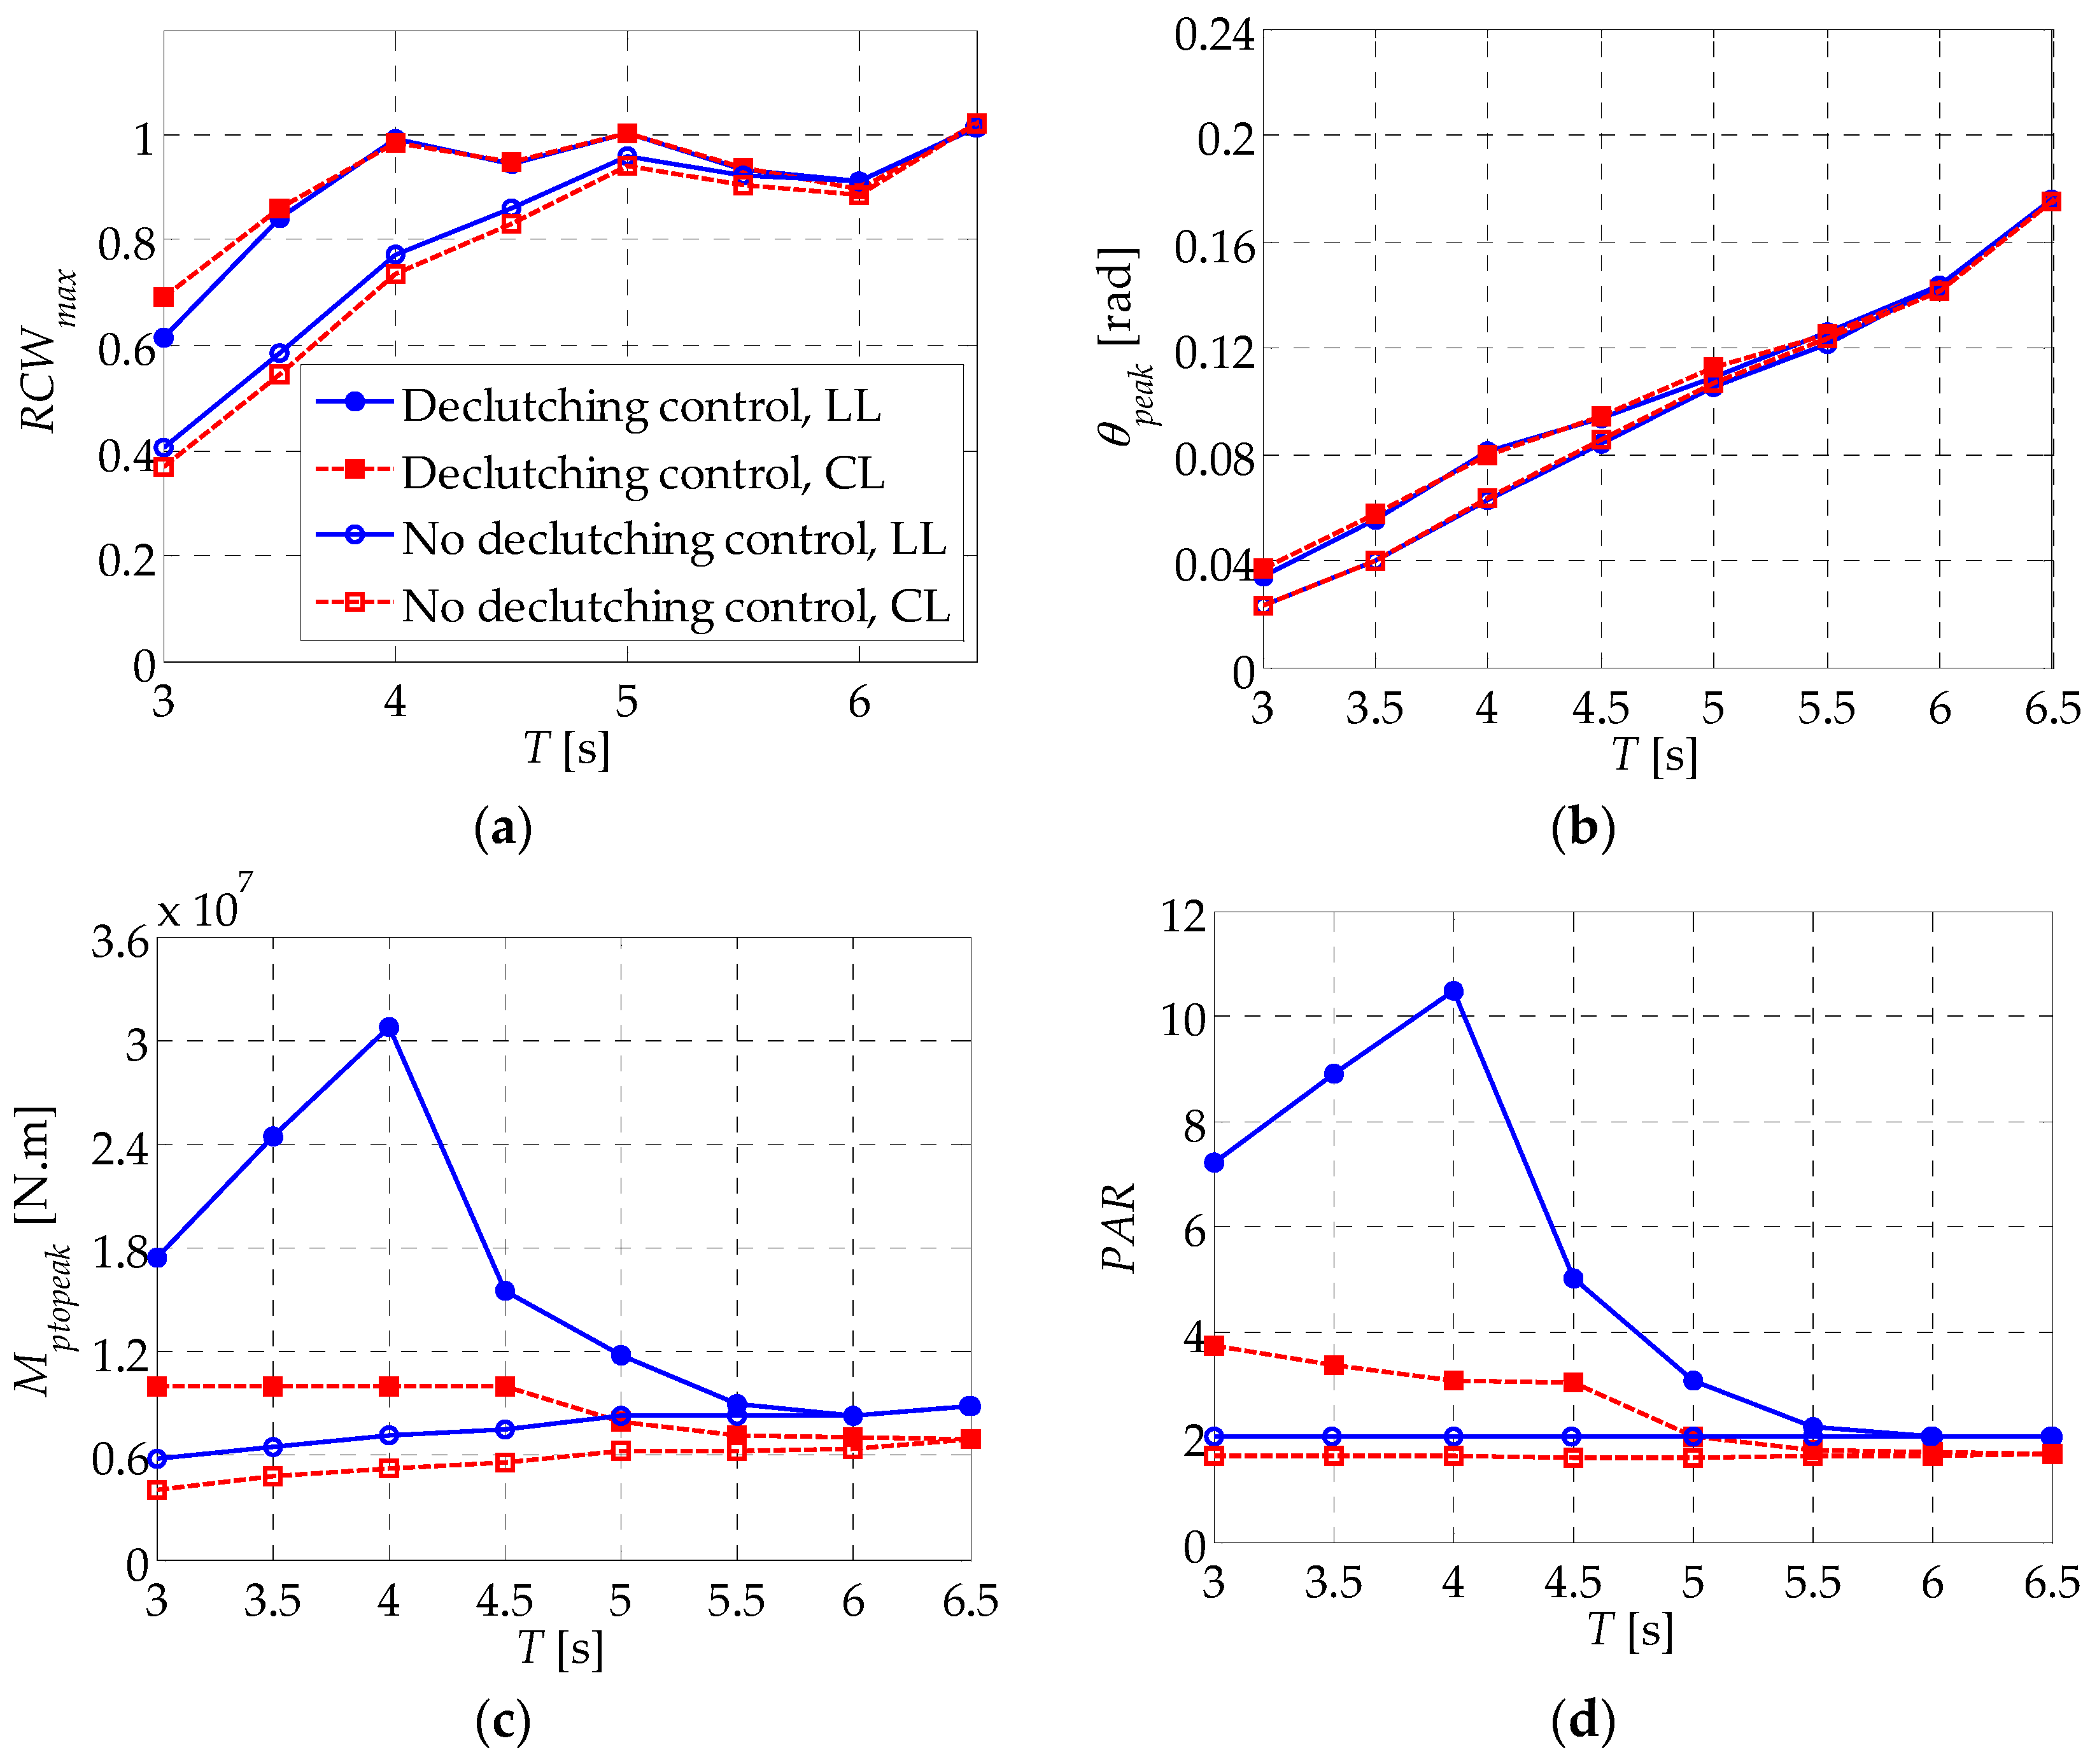
In addition to the maximum relative capture width, the peak value of instantaneous performance parameters are paid special attention to in this paper. The peak motion excursion is of significance when motion constraints are considered, as studied in [36,37]. The peak PTO moment is a key factor for determining the physical size of the PTO structure so that the peak moment can be effectively resisted. The peak-to-average power ratio defines the volume of the energy-storage system that delivers smoothed power to the grid [38,39]. Also, a large peak-to-average power ratio may result in the peak power capacity of the devices greatly exceeding the time-averaged capacity, thus causing low efficiency of the system. Figure 5 shows the performance of the solo duck WEC as a function of the wave period for different load types when the relative captured width is maximized under resistive control, where RCWmax is the maximum relative capture width, θpeak is the peak motion excursion, Mptopeak is the peak PTO moment, and PAR is the Peak-to-Average power Ratio. By equating X in Equation (13) to zero, we find that the natural period of the solo duck WEC T0 in pitch degree-of-freedom is 6.3 s. This explains the large maximum relative capture width and peak motion excursion within the wave periods from 4 s to 8 s. For wave periods other than from the natural period, the power-capture performance reduces significantly. The maximum relative capture width larger than one confirms the point absorber effect of the solo duck WEC. Hence, the accompanied narrow bandwidth for high power-capture performance is as expected [11]. One interesting finding is that, despite different load types, the maximum relative capture width and peak motion excursion is quite similar, except at wave periods from 8 s to 11 s for the maximum relative capture width and larger than 12 s for the peak motion excursion, where small deviations are observed. On the other hand, the peak PTO moment and peak-to-average power ratio show relatively large differences. The peak PTO moment for the coulomb load is smaller than that for the linear load, especially at small wave periods. While the peak-to-average power ratio for the coulomb load increases monotonously with the wave period, it keeps at 2 for the linear load as a result of the sinusoidal variation characteristic of the pitch angular velocity.
4.2. Latching Control at T > T0
In this section, latching control is applied to the solo duck WEC for both linear and coulomb loads at wave periods larger than the natural period. Figure 6 shows the relative capture width as a function of the PTO moment setup, and latching duration for different load types at T = 10 s, where tl is the latching duration, during which the WEC is held fixed. Here, ‘PTO moment setup’ is a generic term denoting the PTO damping coefficient for the linear load and the PTO cylinder moment for the coulomb load. Although latching duration can range from zero to half a wave period, i.e., 5 s for T = 10 s, only 0–4 s is presented here since higher latching duration causes irregular behavior of the pitch angular velocity and low captured power, thus is meaningless in the following investigation. For both the linear and coulomb loads, we find that the relative capture width is a unimodal function near the optimal combination of the PTO moment setup and latching duration that maximizes the relative capture width. Therefore, the maximum relative capture width can be found simply by gradually contracting the variable ranges that contain the solution. Actually, this method uses the same principle as the golden-section search algorithm employed above, but is extended to two dimensions. From Figure 6, we find that high relative capture width is achieved at a quite narrow range of latching duration of around 2 s, while at a wide range of the PTO moment setup. That means the latching duration should be assigned more accurately than the PTO moment setup to benefit from latching control. Another obvious finding is that, for the coulomb load, when the latching duration is small it almost causes no change of the relative capture width for a given PTO cylinder moment. Actually, this is due to the latching duration being so small that the resultant hydrodynamic moment has not yet been developed to the level that can drive the WEC from still to motion. The duck keeps fixed even after the latching duration until the resultant hydrodynamic moment is sufficiently large, thus variation of the latching duration does not influence the captured power.
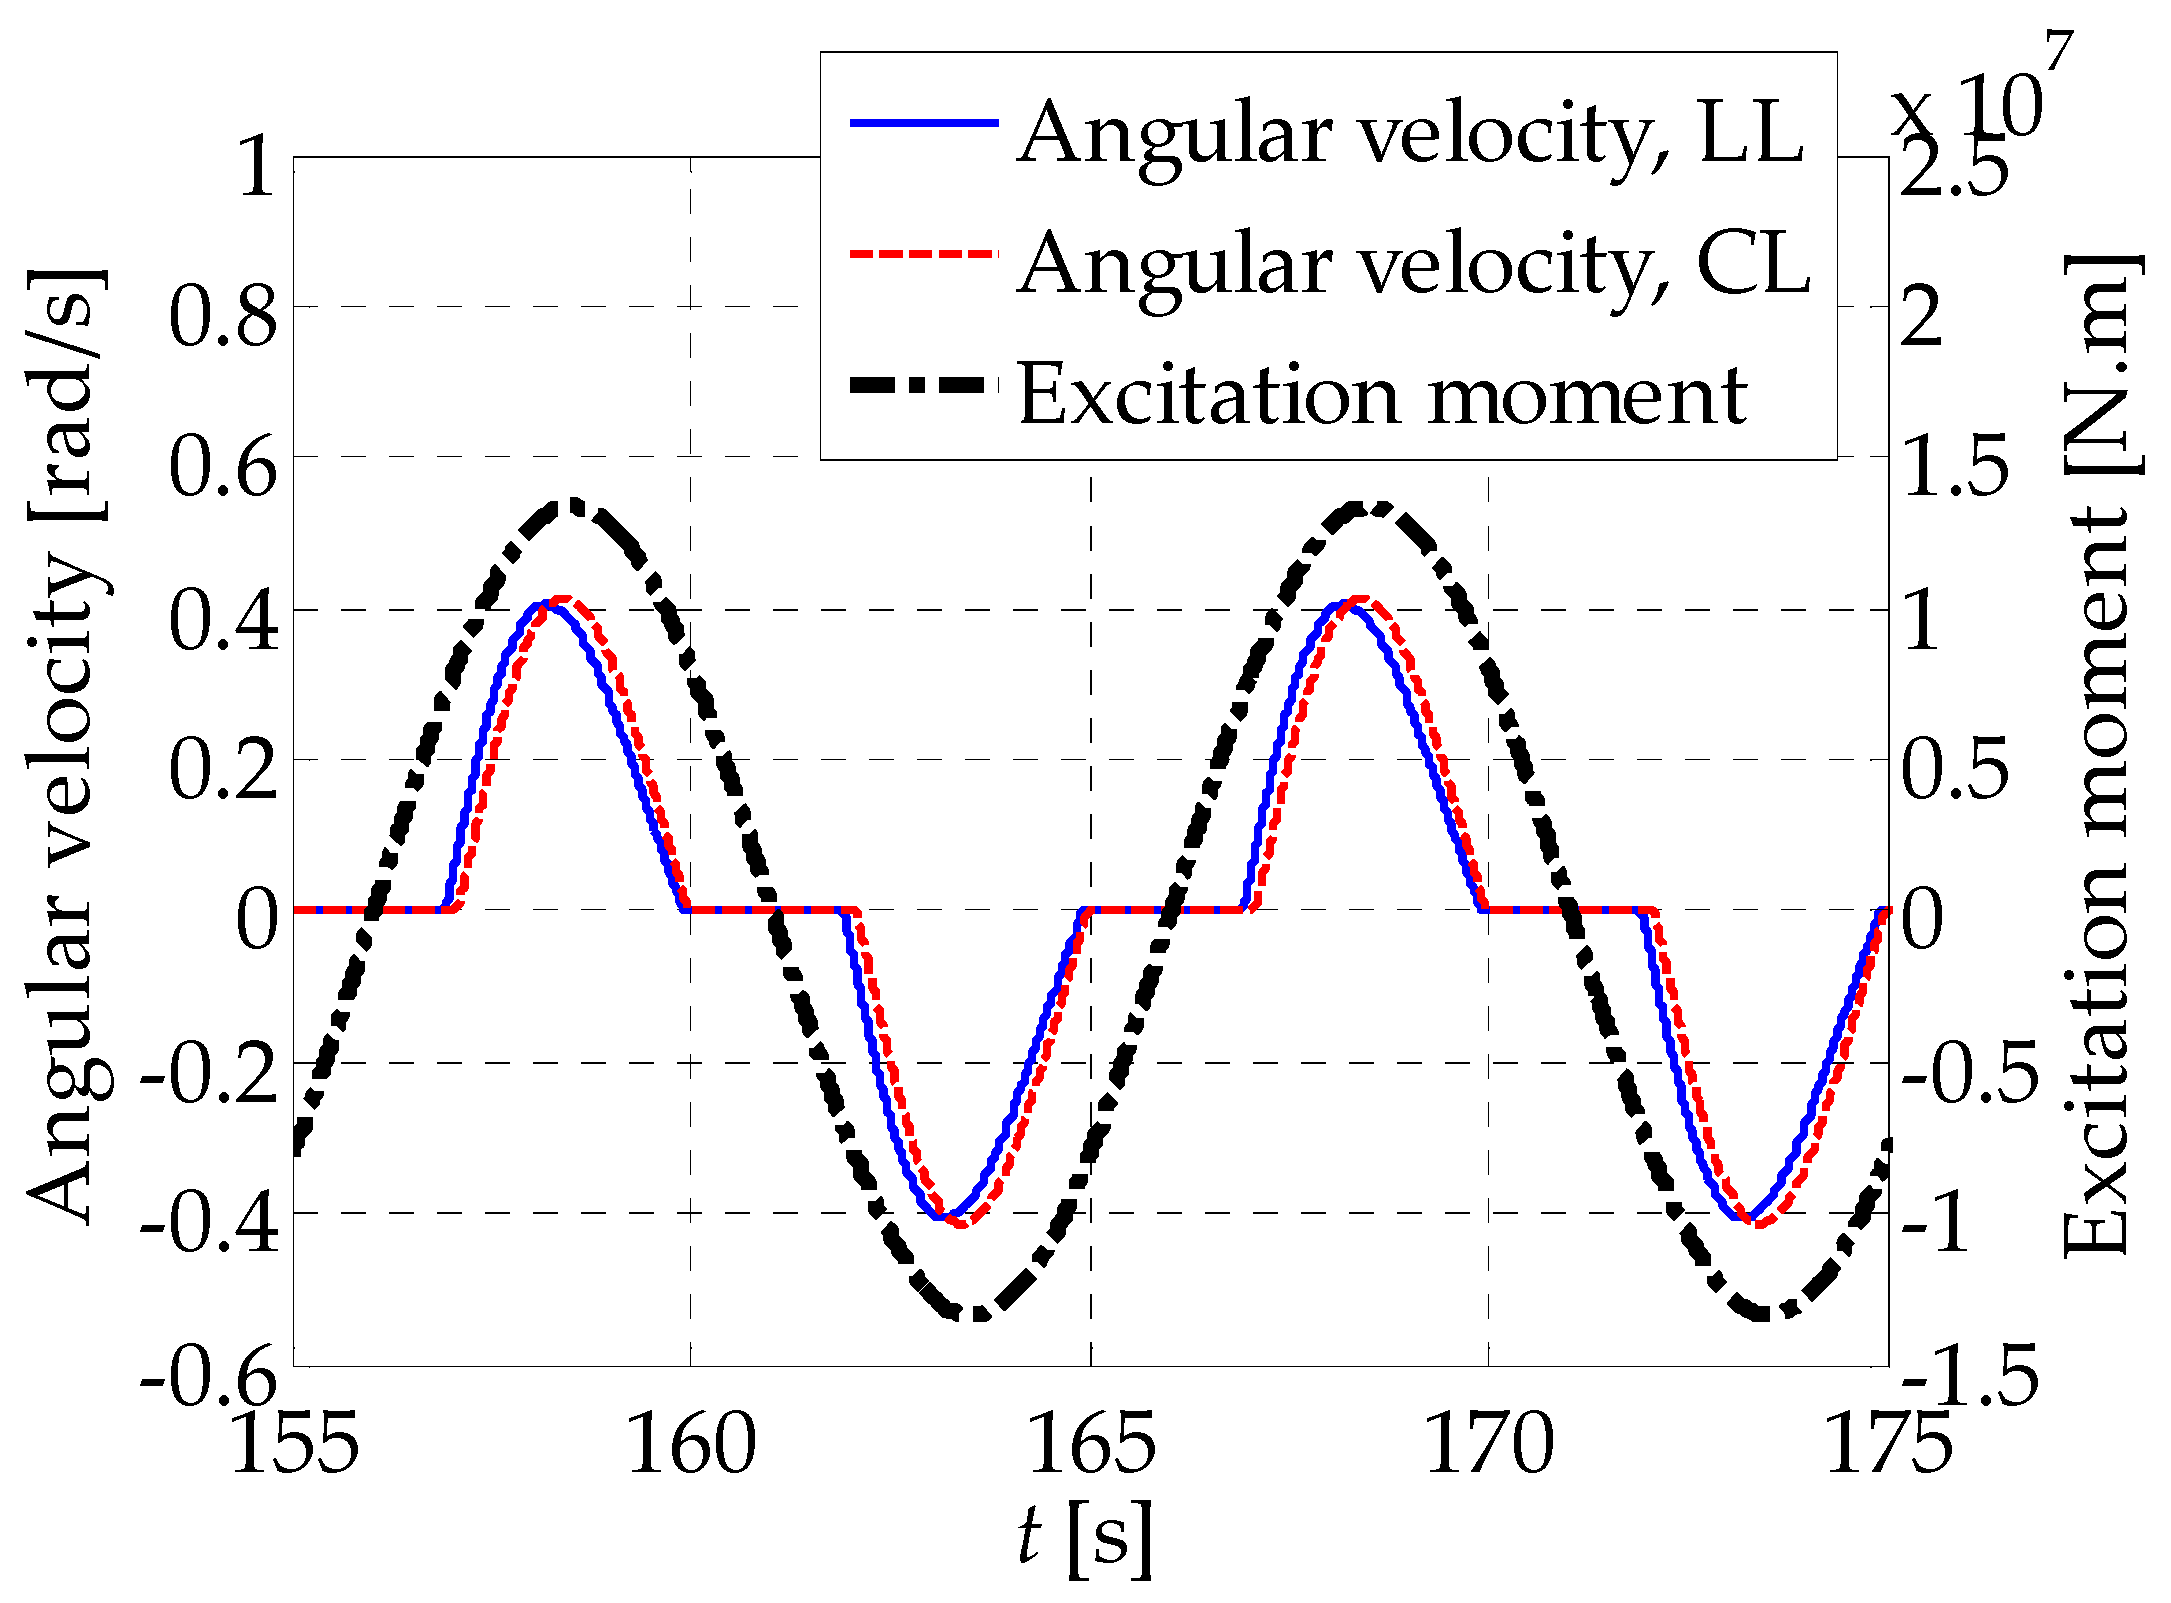
Using the method introduced in the above paragraph, we find that the maximum relative capture width is achieved at tl = 2.02 s, Bp = 2.08 × 10⁷ N·m·s/rad for the linear load and at tl = 2.10 s, Mp = 6.22 × 10⁶ N·m for the coulomb load when T = 10 s. The time history of angular velocity along with the excitation moment when the maximum relative capture width is achieved for both the linear load and coulomb loads is shown in Figure 7. It can be seen that the duck is locked for some time after the angular velocity crosses the zero point. One interesting finding is that the angular velocity profiles for the two load types are quite close to each other, and they are both in good phase with the excitation moment. Common sense when it comes to the latching control field suggests the best unlatching instance should advance the time when the excitation force peaks around T0/4 [18], so that peaks of the WEC velocity and the excitation force coincide with each other to capture the maximum power. From Figure 7, we find that the two peaks are closely, but not exactly, matched. This may be explained by the asymmetrical shape of the angular velocity profile with respect to the time when the angular velocity peaks as a result of the asymmetrical total moment applied to the duck in the half-motion period. Since the profile of the excitation moment is symmetrical while that of the angular velocity is asymmetrical, it makes sense that time difference exists between the two peaks so that the maximum power can be captured.
Figure 8 shows the optimal latching duration tl and optimal unlatching lead time Δtl, which is defined as the time difference between when the WEC is unlatched and when the excitation moment peaks, as functions of the wave period for different load types. It can be seen that the optimal unlatching lead time is well distributed around T0/4, which is plotted as the horizontal black solid line. This again confirms the finding in previous literature [18] that the unlatching instance should advance the time when the excitation peaks at around T0/4 in order to capture the maximum power. Although we find from Figure 7 that the angular velocity profile is asymmetrical, it only skews a little from the sinus curve. This characteristic provides a rough way to estimate the optimal latching duration as T/2–T0/2, which is also plotted in Figure 8 as the black dash line. We find that the optimal latching duration fits this asymptotical line very well. When comparing the difference between the linear and coulomb loads, we find that optimal latching duration and optimal unlatching lead time for the linear load approach the ideal value slightly closer than the coulomb load.
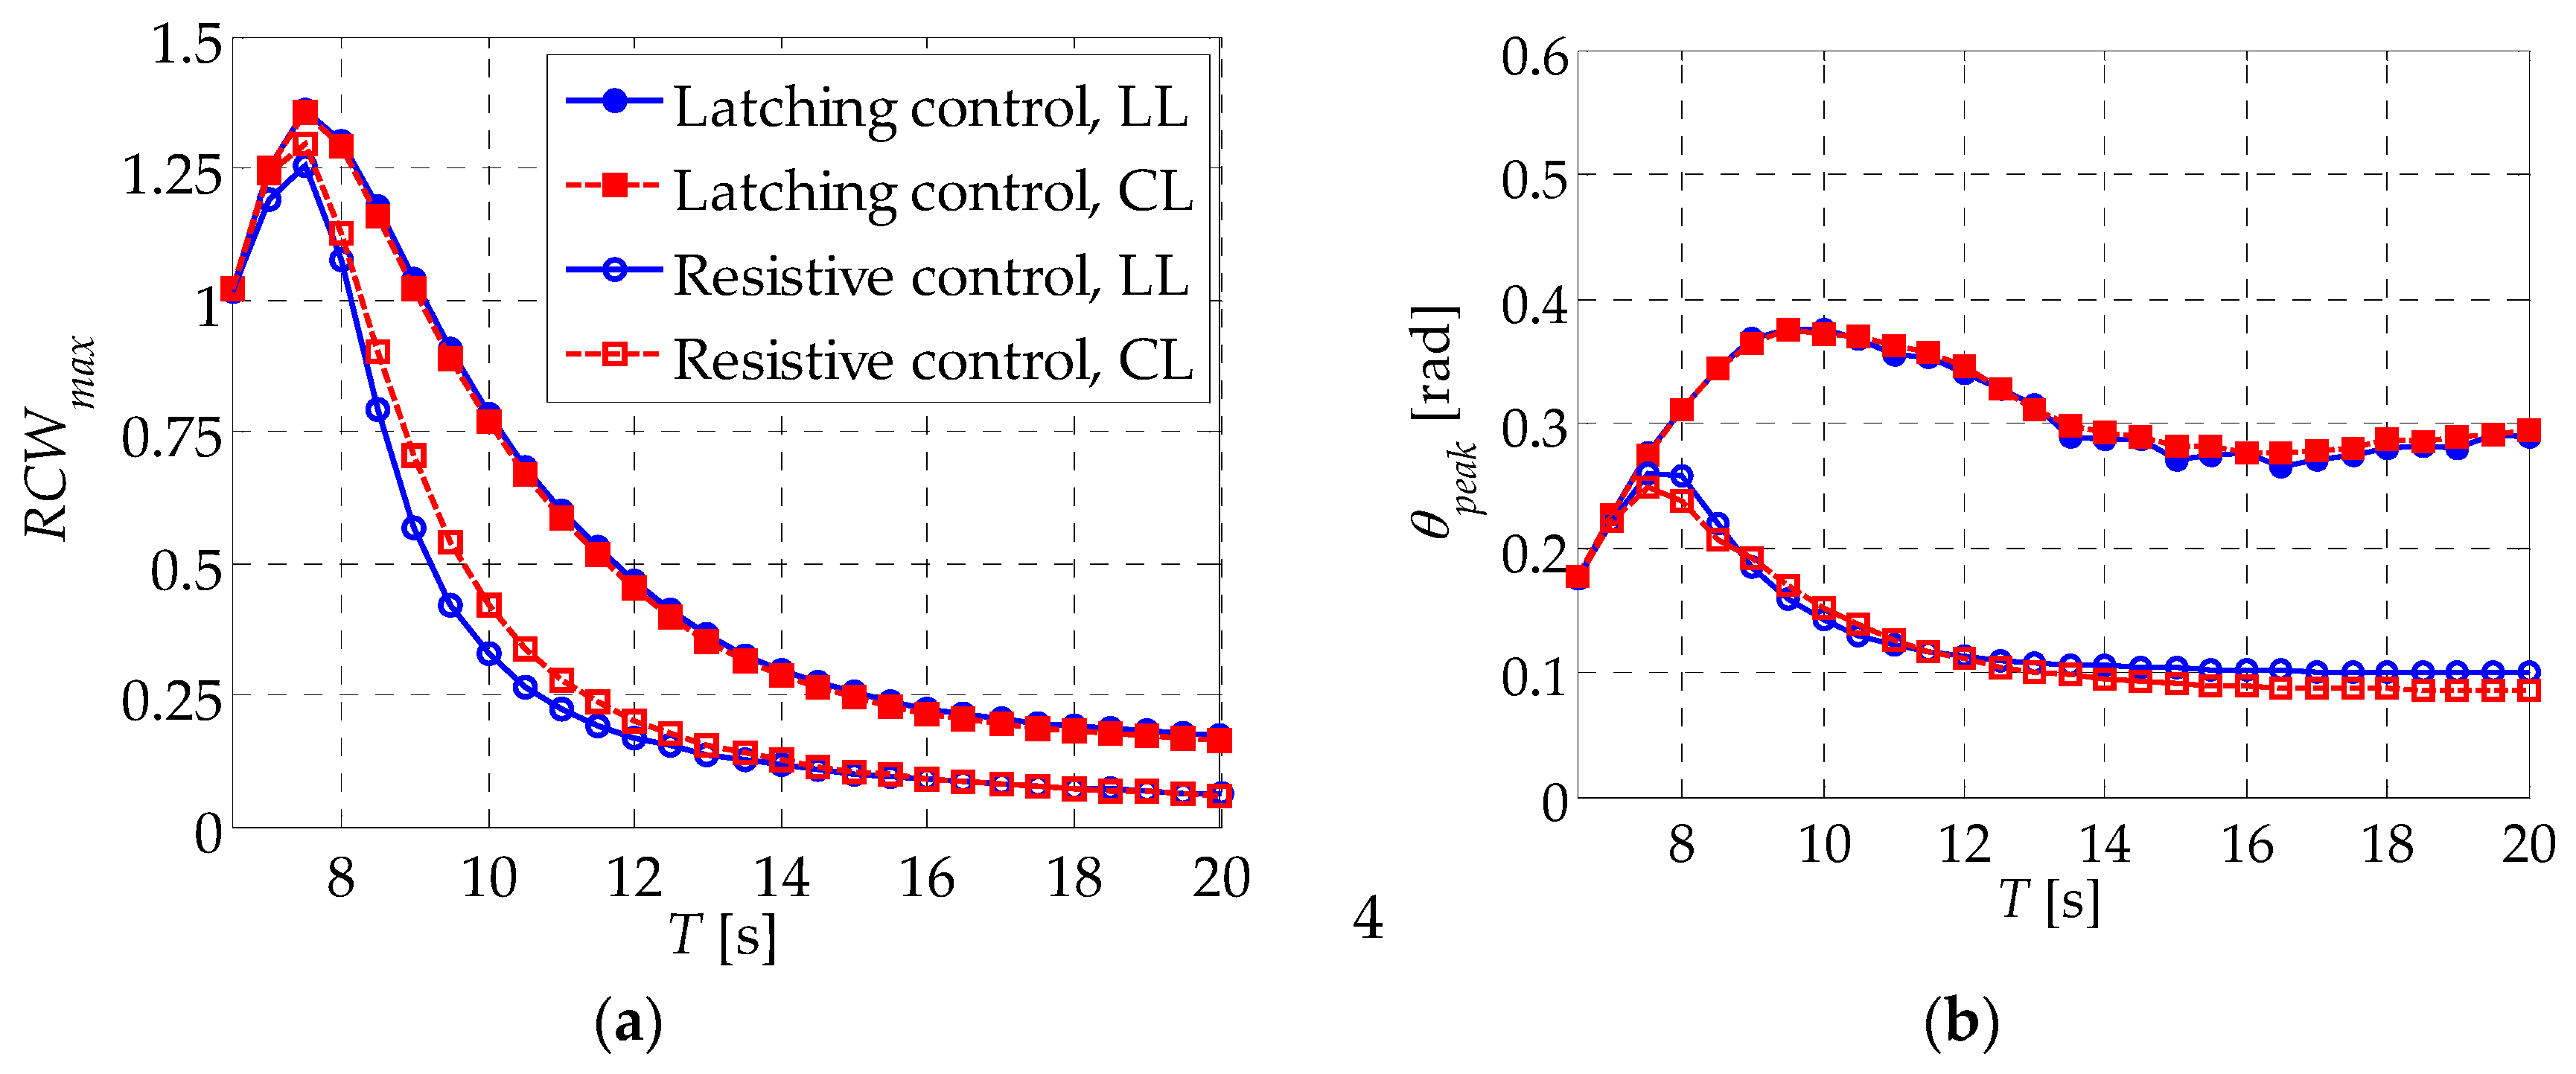
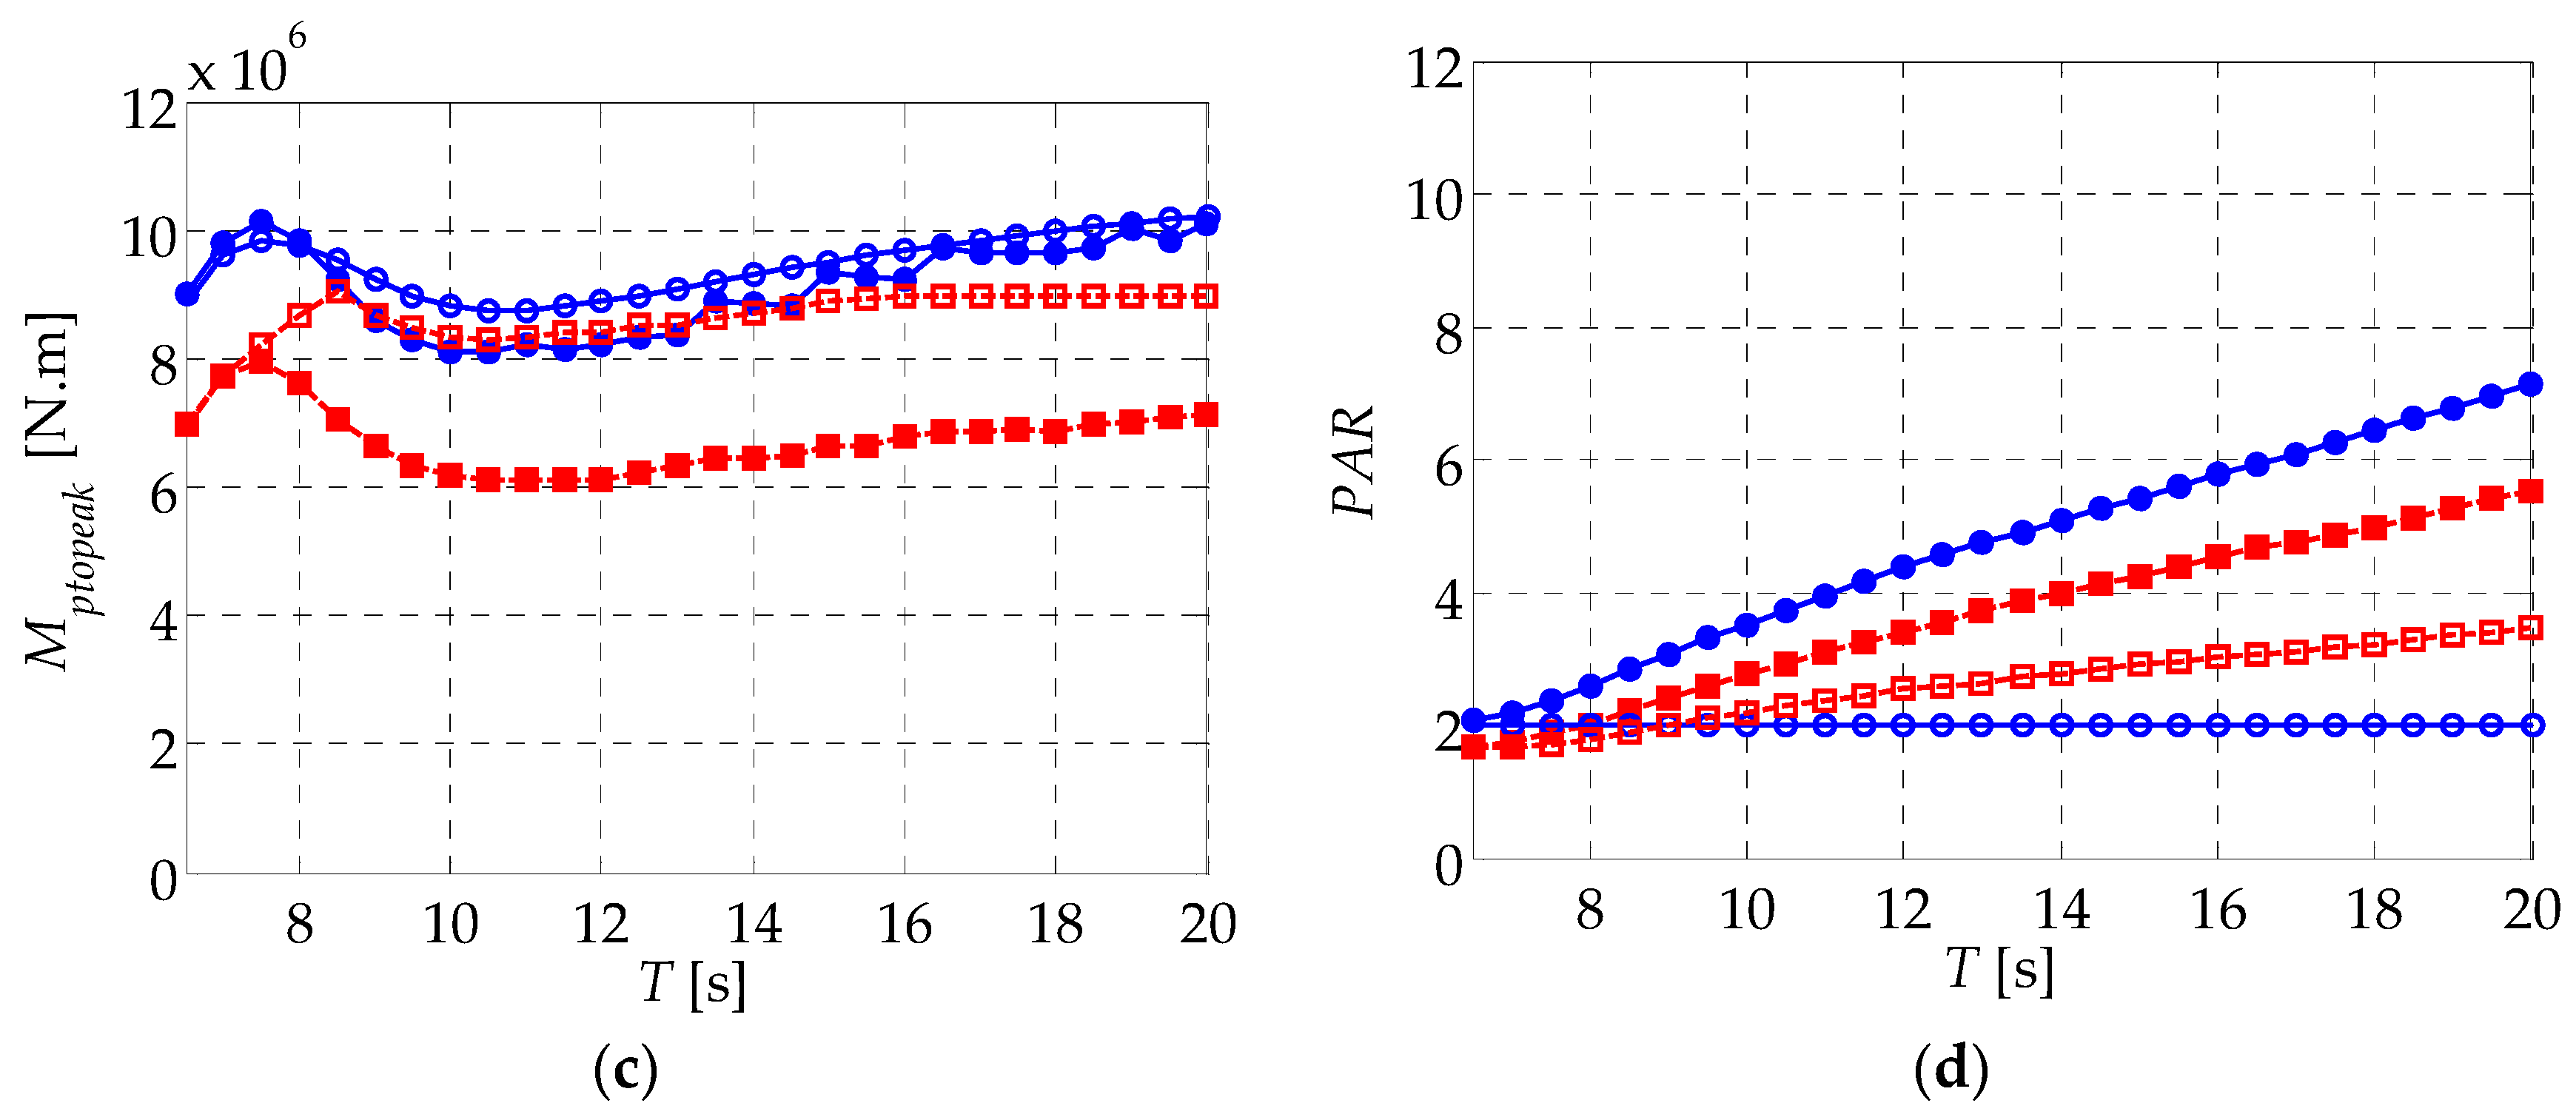
Figure 9 shows the duck WEC performance comparison between latching and resistive control when relative capture width is maximized for different load types. It can be clearly seen that latching control can effectively increase the power-capture ability of the duck WEC at wave periods larger than the natural period. Table 1 lists the magnification factor of the WEC performance parameters under latching control compared to that under resistive control averaged over the wave period set Twl = {8, 8.5, 9, ..., 20}, in which the performance change due to latching control is obvious. The captured power under latching control is averaged to be 2.47 and 2.19 times that under resistive control for the linear and coulomb loads, respectively. The peak motion excursion also increases due to latching control, showing an averaged magnification factor of 2.64 and 2.90 for the linear and coulomb loads, respectively. This agrees with the observation in [19] that increased power capture by latching control is accompanied by magnification of the motion amplitude. Although it is found in Section 4.1 that small deviations of the maximum relative capture width and peak motion excursion exist between different load types under resistive control, these deviations almost disappear when latching control is applied. This indicates that latching control leads to the same power-capture ability of the solo duck WEC for both load types. Also, when motion constraints are considered, the two load types show no advantage over each other. From Figure 9c, we find that latching control can lower the peak PTO moment for most of the wave periods, and it is especially prominent for the coulomb load. This may be intuitively explained by the fact that, since the duck finishes one pitch stroke only in a half-natural period, the WEC works at a pseudo-resonant state, resulting in X being small and even equal to zero. From Equation (16), we find that the optimal Bp will be reduced. Because the peak angular velocity increases due to latching control, the decrease of peak PTO moment for the linear load, which is the multiplication of Bp and peak angular velocity, may not be as remarkable as that for the coulomb load. When latching control is employed, the peak PTO moment for the coulomb load is only 0.74 times that for the linear load when averaged over Twl. This suggests that the physical size of the PTO structure for the coulomb load may be designed smaller in order to resist smaller peak moment. From Figure 9d, it is found that latching control causes an increase of the peak-to-average power ratio, which agrees with the finding in [40]. This is due to the fact that the power-capture process is focused within a time interval that is smaller than that when resistive control is applied. To keep the same averaged captured power, the peak instantaneous captured power should be increased within this short time interval, hence the peak-to-average power ratio is increased. When latching control is employed, the peak-to-average power ratio for the coulomb load is only 0.78 times that for the linear load, indicating that the volume of the energy storage system for the coulomb load can be designed smaller than that for the linear load. To summarize from the above analysis, we find that, under latching control, the coulomb load may be the better choice since it reduced the peak PTO moment and peak-to-average power ratio, but in the meantime shows the same captured power and peak motion excursion as the linear load.
4.3. Declutching Control at T < T0
When the wave period is smaller than the natural period of the duck WEC, declutching control could be employed to improve its power-capture performance. In [21], the PTO is switched off when the angular velocity vanishes, while it is switched on at an appropriate moment. However, in the calculation in this paper, we find that this control strategy is not optimal for the solo duck WEC to capture the maximum power since the optimal declutching instance does not always coincide with the angular velocity zero-crossing point. In fact, the declutching control process can be explicitly defined by two parameters: the time that the PTO is reconnected to the duck, which we call the ’clutching start time’; and the time duration that the PTO is being connected to the duck, which we call the ’clutching duration’. Since the time history of the excitation moment is provided in advance in regular waves, the clutching start time is set with respect to the zero-crossing point of the excitation moment. In the calculation in this section, we find that, under declutching control, the power capture characteristic of the duck WEC for the linear load is more or less the same as that for the coulomb load, which was also observed for latching control. Hence, only the behavior for the coulomb load is described in detail in the first part of this section to avoid repetition. Figure 10 shows the relative capture width as a function of the clutching start time and clutching duration for the coulomb load at Mp = 7 × 10⁶ N·m and T = 3 s. We find that near the optimal combination of the clutching start time and clutching duration that maximize the relative capture width, the relative capture width is a unimodal function. Thus, the maximum relative capture width and corresponding optimal clutching start time and clutching duration can be found by the method introduced in Section 4.2.
We find from Figure 10 that the optimal clutching start time and clutching duration is 0.86 s and 0.84 s, respectively. Figure 11 shows the time history of the pitch angular velocity, PTO moment and excitation moment for the coulomb load at Mp = 7 × 10⁶ N·m and T = 3.0 s when the maximum relative capture width is achieved under declutching and resistive control, respectively. When under declutching control, it can be clearly seen that, before the clutching start time, the duck is declutched from the PTO and speeds up rapidly. Then, within the clutching duration, the PTO is reconnected to the duck and works at a high-pitch angular velocity. The significant increase of the pitch angular velocity at the same PTO cylinder moment reveals that declutching control is quite effective at enhancing the solo duck WEC’s performance.
Figure 12a shows the optimal clutching start time and clutching duration that maximize the relative capture width as functions of the PTO cylinder moment for the coulomb load at T = 3 s. When the PTO cylinder moment increases, the optimal clutching start time increases while the optimal clutching duration decreases. At small PTO cylinder moments, the optimal clutching duration approaches half the wave period, which is equivalent to the case under resistive control, indicating that performance improvement due to declutching control is not significant. This is confirmed in the low PTO cylinder moment range in Figure 12b, which shows the maximum relative capture width as a function of the PTO cylinder moment for the coulomb load. At large PTO cylinder moments, declutching control leads to a significant captured power increment. The maximum relative capture width grows continuously with the PTO cylinder moment, and keeps at almost a fixed value when exceeding the critical PTO cylinder moment, and this is clearly shown for T = 5 s in Figure 12b. The critical PTO cylinder moment varies widely with the wave period, e.g., it is around 8 × 10⁷ N·m at T = 3 s while is around 7 × 10⁶ N·m at T = 5 s. Under declutching control, the maximum relative capture width at a given wave period can be found at the critical PTO cylinder moment. However, it should be noted that, in reality, the critical PTO cylinder moment at small wave periods is so large that the investment may not bring equivalent payback if the maximum relative capture width is required. Take T = 3 s for example, the maximum relative capture width at Mp = 8 × 10⁷ N·m is only 1.24 times that at Mp = 1 × 10⁷ N·m but with an 8 times larger PTO cylinder moment. This makes it unreasonable to apply a PTO cylinder moment of the critical level so that the maximum power is captured. Therefore, in this paper we limit the PTO moment setup within 1 × 10⁷ N·m for Mp and 2 × 10⁸ N·m·s/rad for Bp so that the PTO system is kept cost effective.
Figure 13 shows the duck WEC performance comparison between declutching and resistive and control when the relative capture width is maximized for different load types. Table 2 lists the magnification factor of the duck WEC performance under declutching control compared to that under resistive control, averaged over the wave period set Twd = {3, 3.5, 4, 4.5}, in which the performance change due to declutching control is obvious. Here, we should remind the reader that the maximum relative capture width at a given wave period is the maximum of the maximum relative capture width at different PTO moment setups. We find that declutching control leads to more or less the same control effect as latching control. Both the maximum relative capture width and peak motion excursion are effectively increased when declutching control is applied, and their deviations between different load types disappear except at T = 3 s and 3.5 s, where the WEC performance improvement is limited by constraints on the maximum PTO moment setup. As for latching control, the peak-to-average power ratio is also increased, due to declutching control, and it is especially prominent for the linear load. As a result, when declutching control is applied, the average peak-to-average power ratio for the coulomb load is only 0.45 times that for the linear load. Among the four performance parameters listed in Table 2, the peak PTO moment is the only one that differs in variation tendency between declutching and latching control. By contrast with the decreased peak PTO moment caused by latching control, declutching control leads to an increment of the peak PTO moment and is especially prominent for the linear load. When declutching control is applied, the averaged peak PTO moment for the coulomb load is only 0.49 times that for the linear load. To summarize from above analysis, we find that, in declutching control, the coulomb load may also be the better choice since it reduced the peak PTO moment and peak-to-average power ratio, but in the meantime shows the same captured power and peak motion excursion as the linear load.
5. Conclusions
In this paper, two typical passive control strategies, latching and declutching control, are applied to the solo duck WEC to improve its power-capture performance at wave periods larger and smaller than the natural period of the WEC, respectively. Special attention is paid to the peak value of instantaneous WEC performance parameters, including the peak motion excursion, peak PTO moment and peak-to-average power ratio, when the captured power is maximized. Performance differences between the linear and coulomb loads are also investigated.
Compared to resistive control, the maximum relative capture width, which is averaged over the wave periods where performance change is prominent, is increased to 2.47 and 2.19 times larger owing to latching control for the linear and coulomb loads, respectively, and to 1.33 and 1.49 times larger owing to declutching control. Incidentally, both the peak motion excursion and peak-to-average power ratio increase as a result of latching and declutching control. While latching control causes a decrease of the peak PTO moment, declutching control causes an increase of the peak PTO moment.
When under latching and declutching control, both the linear and coulomb loads present almost the same maximum relative capture width and peak motion amplitude. This indicates that latching and declutching control lead to the same power-capture ability of the duck WEC for both the linear and coulomb loads. Also, when motion constraints are considered, the two load types show no advantage over each other. The coulomb load shows smaller peak PTO moment and peak-to-average power ratio than the linear load. This suggests that the physical size of the PTO structure for the coulomb load may be designed smaller in order to resist smaller PTO moment, and the volume of the energy-storage system for the coulomb load may also be smaller since fluctuation of the input instantaneous power is smaller. Therefore, to summarize, we conclude that the coulomb load may be the better choice for the solo duck WEC under latching and declutching control.
Acknowledgments
The research was supported by the Shenzhen Science and Technology Innovation Committee Grant 20160221, the Chinese Scholarship Council (CSC) Grant 201506120143, and the Swedish Research Council (VR) Grant 2015-04657.
Author Contributions
Jinming Wu performed the numerical simulation and prepared the manuscript. Yingxue Yao and Malin Göteman supervised the wave power project, and commented on the manuscript. Liang Zhou commented on the manuscript.
Conflicts of Interest
The authors declare no conflict of interest.
Appendix A
The coefficient of the state-space model in Equation (5) is obtained by the ‘regression in the frequency domain’ method as
References
- Clément, A.; McCullen, P.; Falcão, A.; Fiorentino, A.; Gardner, F.; Hammarlund, K.; Lemonis, G.; Lewis, T.; Nielsen, K.; Thorpe, T.; et al. Wave energy in Europe: Current status and perspectives. Renew. Sustain. Energy Rev. 2002, 6, 405–431. [Google Scholar] [CrossRef]
- Zhang, H.C.; Xu, D.L.; Liu, C.R.; Wu, Y.S. A Floating Platform with Embedded Wave energy harvesting arrays in regular and irregular seas. Energies 2017, 10, 1348. [Google Scholar] [CrossRef]
- Salter, S.H. Wave power. Nature 1974, 249, 720–724. [Google Scholar] [CrossRef]
- Cruz, J. Ocean Wave Energy Current Status and Future Perspectives; Springer: Berlin, Germany, 2008. [Google Scholar]
- Skyner, D. Solo Duck Linear Analysis; University of Edinburgh: Edinburgh, UK, 1987. [Google Scholar]
- Pizer, D. Numerical Modeling of Wave Energy Absorbers; University of Edinburgh: Edinburgh, UK, 1994. [Google Scholar]
- Lucas, J.; Salter, S.H.; Cruz, J.; Taylor, J.R.M.; Bryden, I. Performance Optimization of a Modified Duck Through Optimal Mass Distribution. In Proceedings of the 8th European Wave and Tidal Energy Conference, Uppsala, Sweden, 7–9 September 2009. [Google Scholar]
- Cruz, J.; Salter, S.H. Numerical and experimental modelling of a modified version of the Edinburgh Duck wave energy device. Proc. Inst. Mech. Eng. Part M J. Eng. Marit. Environ. 2006, 220, 129–147. [Google Scholar] [CrossRef]
- Wu, J.; Yao, Y.; Zhou, L.; Chen, N.; Yu, H.; Li, W.; Göteman, M. Performance analysis of solo Duck wave energy converter arrays under motion constraints. Energy 2017, 139, 155–169. [Google Scholar] [CrossRef]
- Wu, J.; Yao, Y.; Li, W.; Zhou, L.; Göteman, M. Optimizing the performance of solo Duck wave energy converter in tide. Energies 2017, 10, 289. [Google Scholar] [CrossRef]
- Falnes, J. A review of wave-energy extraction. Mar. Struct. 2007, 20, 185–201. [Google Scholar] [CrossRef]
- Ferri, F.; Ambühl, S.; Fischer, B.; Kofoed, J.P. Balancing power output and structural fatigue of wave energy converters by means of control strategies. Energies 2014, 7, 2246–2273. [Google Scholar] [CrossRef]
- Sergiienko, N.Y.; Cazzolato, B.S.; Ding, B.; Hardy, P.; Arjomandi, M. Performance comparison of the floating and fully submerged quasi-point absorber wave energy converters. Renew. Energy 2017, 108, 425–437. [Google Scholar] [CrossRef]
- Abraham, E.; Kerrigan, E.C. Optimal Active Control and Optimization of a Wave Energy Converter. IEEE Trans. Sustain. Energy 2013, 4, 324–332. [Google Scholar] [CrossRef] [Green Version]
- Feng, Z.; Kerrigan, E.C. Latching declutching control of wave energy converters using derivative-free optimization. IEEE Trans. Sustain. Energy 2015, 6, 773–780. [Google Scholar] [CrossRef]
- Budal, K.; Falnes, J. Interacting point absorbers with controlled motion. In Power from Sea Waves; Count, B., Ed.; Academic Press: London, UK, 1980; pp. 381–399. [Google Scholar]
- Salter, S.H.; Taylor, J.R.M.; Caldwell, N.J. Power conversion mechanisms for wave energy. Proc. Inst. Mech. Eng. Part M J. Eng. Marit. Environ. 2002, 216, 1–27. [Google Scholar] [CrossRef]
- Falcão, A.F. Phase control through load control of oscillating-body wave energy converters with hydraulic PTO system. Ocean Eng. 2008, 35, 358–366. [Google Scholar] [CrossRef]
- Babarit, A.; Duclos, G.; Clément, A.H. Comparison of latching control strategies for a heaving wave energy device in random sea. Appl. Ocean Res. 2004, 26, 227–238. [Google Scholar] [CrossRef]
- Eidsmoen, H. Simulation of a tight-moored amplitude-limited heaving-buoy wave-energy converter with phase control. Appl. Ocean Res. 1996, 20, 157–161. [Google Scholar] [CrossRef]
- Babarit, A.; Guglielmi, M.; Clément, A.H. Declutching control of a wave energy converter. Ocean Eng. 2009, 36, 1015–1024. [Google Scholar] [CrossRef]
- Kurupath, V.; Ekström, R.; Leijon, M. Optimal constant DC link voltage operation of a wave energy converter. Energies 2013, 6, 1993–2006. [Google Scholar] [CrossRef]
- Valério, D.; Beirão, P.; Sá da Costa, J. Optimisation of wave energy extraction with the Archimedes Wave Swing. Ocean Eng. 2007, 34, 2330–2344. [Google Scholar] [CrossRef]
- Mann, L.D. Application of ocean observations & analysis: The CETO wave energy project. In Operational Oceanography in the 21st Century; Springer: Berlin, Germany, 2011; pp. 721–729. [Google Scholar]
- Hansen, R. Discrete displacement hydraulic power take-off system for the Wavestar wave energy converter. Energies 2013, 6, 4001–4044. [Google Scholar] [CrossRef]
- Babarit, A.; Hals, J.; Muliawan, M.J.; Kurniawan, A.; Moan, T.; Krokstad, J. Numerical benchmarking study of a selection of wave energy converters. Renew. Energy 2012, 41, 44–63. [Google Scholar] [CrossRef]
- Göteman, M.; Engström, J.; Eriksson, M.; Isberg, J. Optimizing wave energy parks with over 1000 interacting point-absorbers using an approximate analytical method. Int. J. Mar. Energy 2015, 10, 113–126. [Google Scholar] [CrossRef]
- Pizer, D.J. Maximum wave-power capture of point absorbers under motion constraints. Appl. Ocean Res. 1993, 15, 227–234. [Google Scholar] [CrossRef]
- Cummins, W.E. The impulse response function and ship motions. Schiffstechnik 1962, 9, 101–109. [Google Scholar]
- Ogilvie, T. Recent Progress towards the Understanding and Prediction of Ship Motions. In Proceedings of the 5th Symposium on Naval Hydrodynamics, Bergen, Norway, 10–12 September 1964; pp. 3–80. [Google Scholar]
- Ansys, Inc. AQWA Reference Manual, version 16.0; Ansys, Inc.: Canonsburg, PA, USA, 2015. [Google Scholar]
- Taghipour, R.; Perez, T.; Moan, T. Hybrid frequency–time domain models for dynamic response analysis of marine structures. Ocean Eng. 2008, 35, 685–705. [Google Scholar] [CrossRef]
- Falnes, J. Ocean Waves and Oscillating Systems: Linear Interaction Including Wave-Energy Extraction; Cambridge University Press: Cambridge, UK, 2002. [Google Scholar]
- Elhanafi, A.; Macfarlane, G.; Fleming, A.; Leong, Z. Experimental and numerical investigations on the hydrodynamic performance of a floating–moored oscillating water column wave energy converter. Appl. Energy 2017, 205, 369–390. [Google Scholar] [CrossRef]
- Press, W.H.; Teukolsky, S.A.; Vetterling, W.T.; Flannery, B.P. The Art of Scientific Computing, 3rd ed.; Cambridge University Press: New York, NY, USA, 2007. [Google Scholar]
- Hals, J.; Falnes, J.; Moan, T. Constrained optimal control of a heaving buoy wave-energy converter. J. Offshore Mech. Arct. Eng. 2010, 133, 011401. [Google Scholar] [CrossRef] [Green Version]
- Eidsmoen, H. Optimum control of a floating wave-energy converter with restricted amplitude. J. Offshore Mech. Arct. Eng. 1996, 118, 96–102. [Google Scholar] [CrossRef]
- Henriques, J.C.C.; Gato, L.M.C.; Lemos, J.M.; Gomes, R.P.F.; Falcão, A.F.O. Peak-power control of a grid-integrated oscillating water column wave energy converter. Energy 2016, 109, 378–390. [Google Scholar] [CrossRef]
- Aubry, J.; Bydlowski, P.; Multon, B.; Ahmed, H.B.; Borgarino, B. Energy Storage System Sizing for Smoothing Power Generation of Direct Wave Energy Converters. In Proceedings of the Third International Ocean Energy Conference, Bibao, Spain, 6–8 October 2010. [Google Scholar]
- Molinas, M.; Skjervheim, O.; Andreasen, P.; Undeland, T.; Hals, J.; Moan, T.; Sorby, B. Power electronics as grid interface for actively controlled wave energy converters. In Proceedings of the International Conference on Clean Electrical Power, Capri, Italy, 21–23 May 2007. [Google Scholar]
Figure 1.
A plain view of the duck cross section.
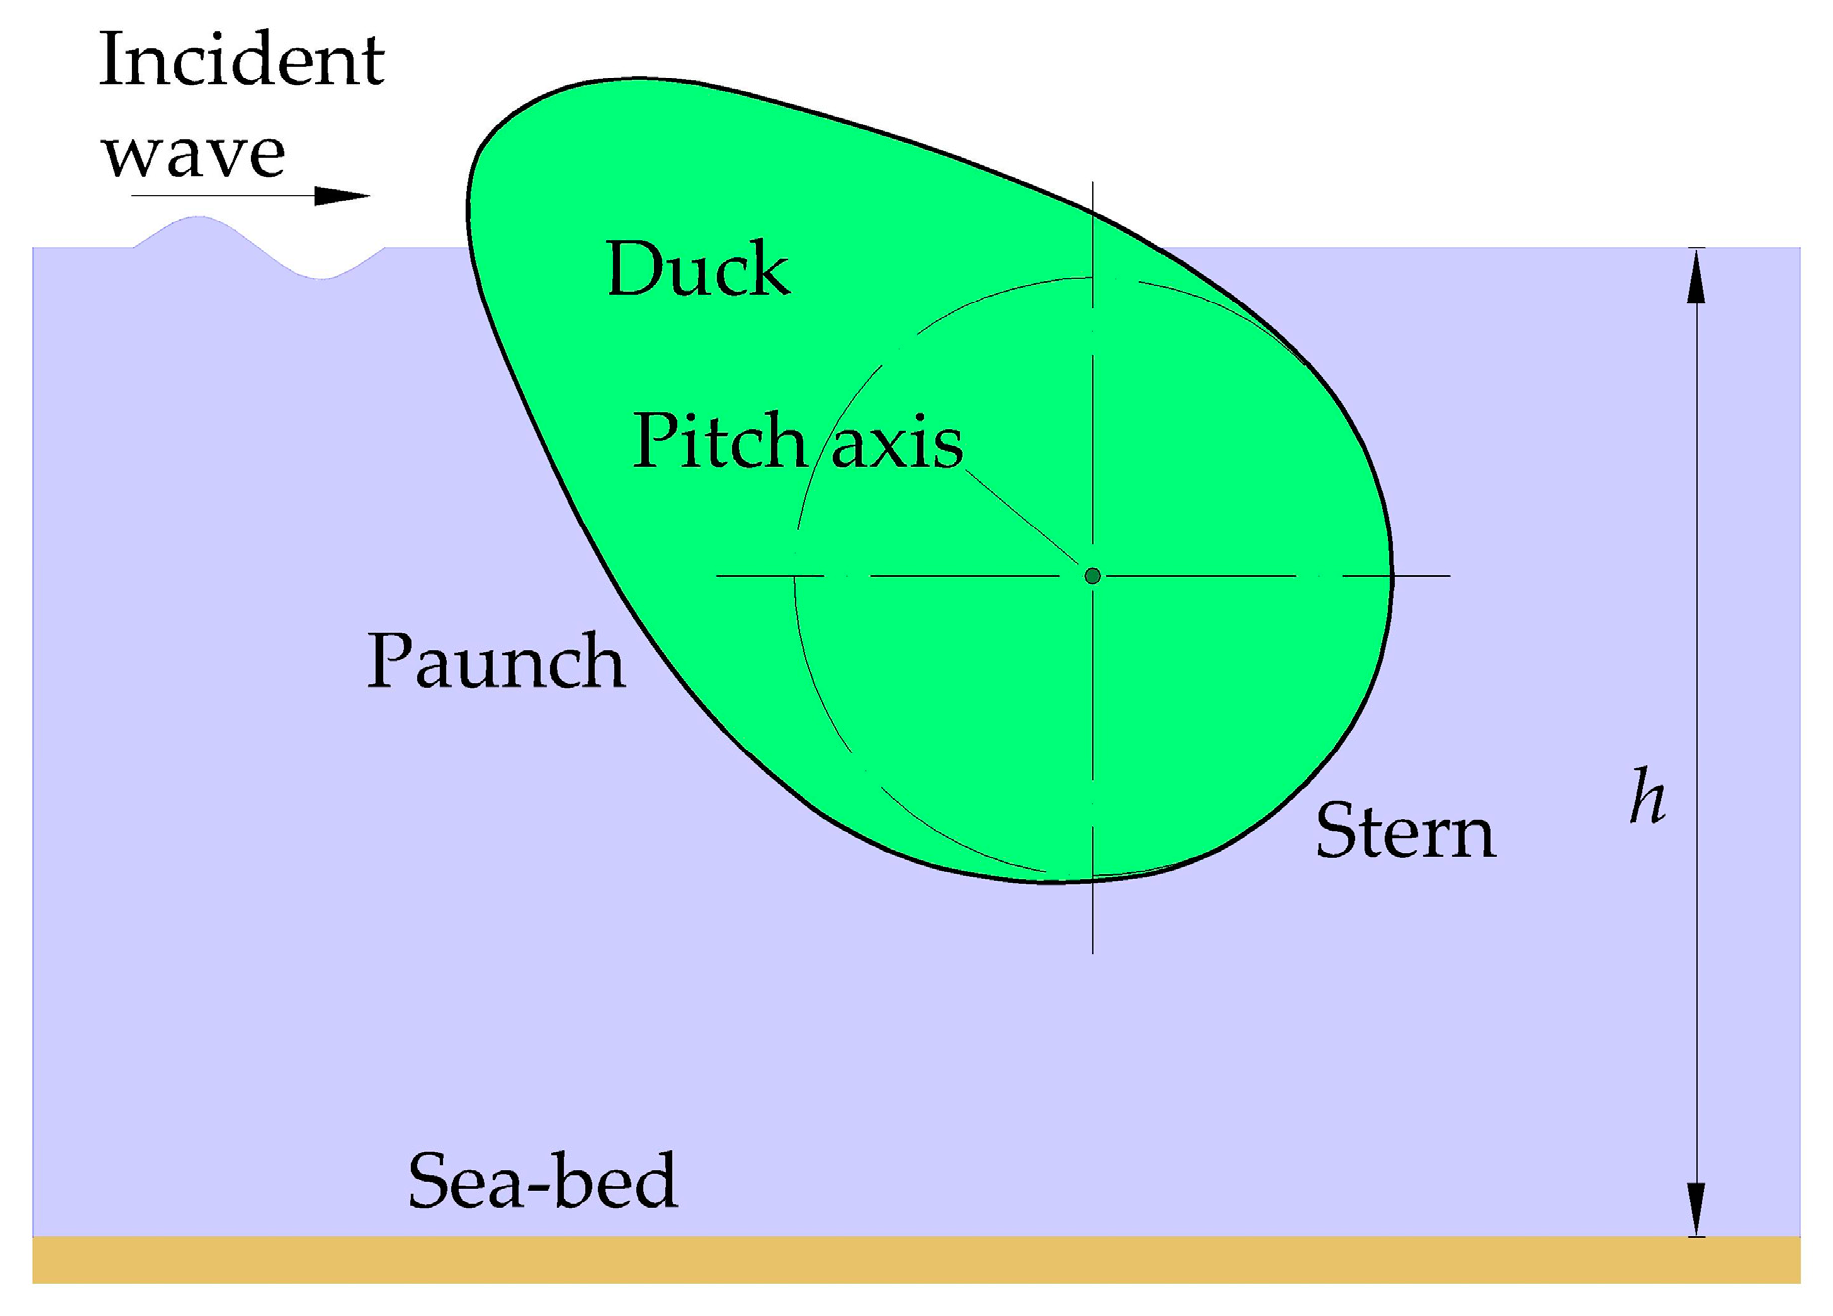
Figure 2.
Comparison of the frequency-response function (FRF) and impulse-response function (IRF) between the original and approximated linear system: (a) magnitude of K(w); (b) phase angle of K(w); (c) K(t).
Figure 2.
Comparison of the frequency-response function (FRF) and impulse-response function (IRF) between the original and approximated linear system: (a) magnitude of K(w); (b) phase angle of K(w); (c) K(t).
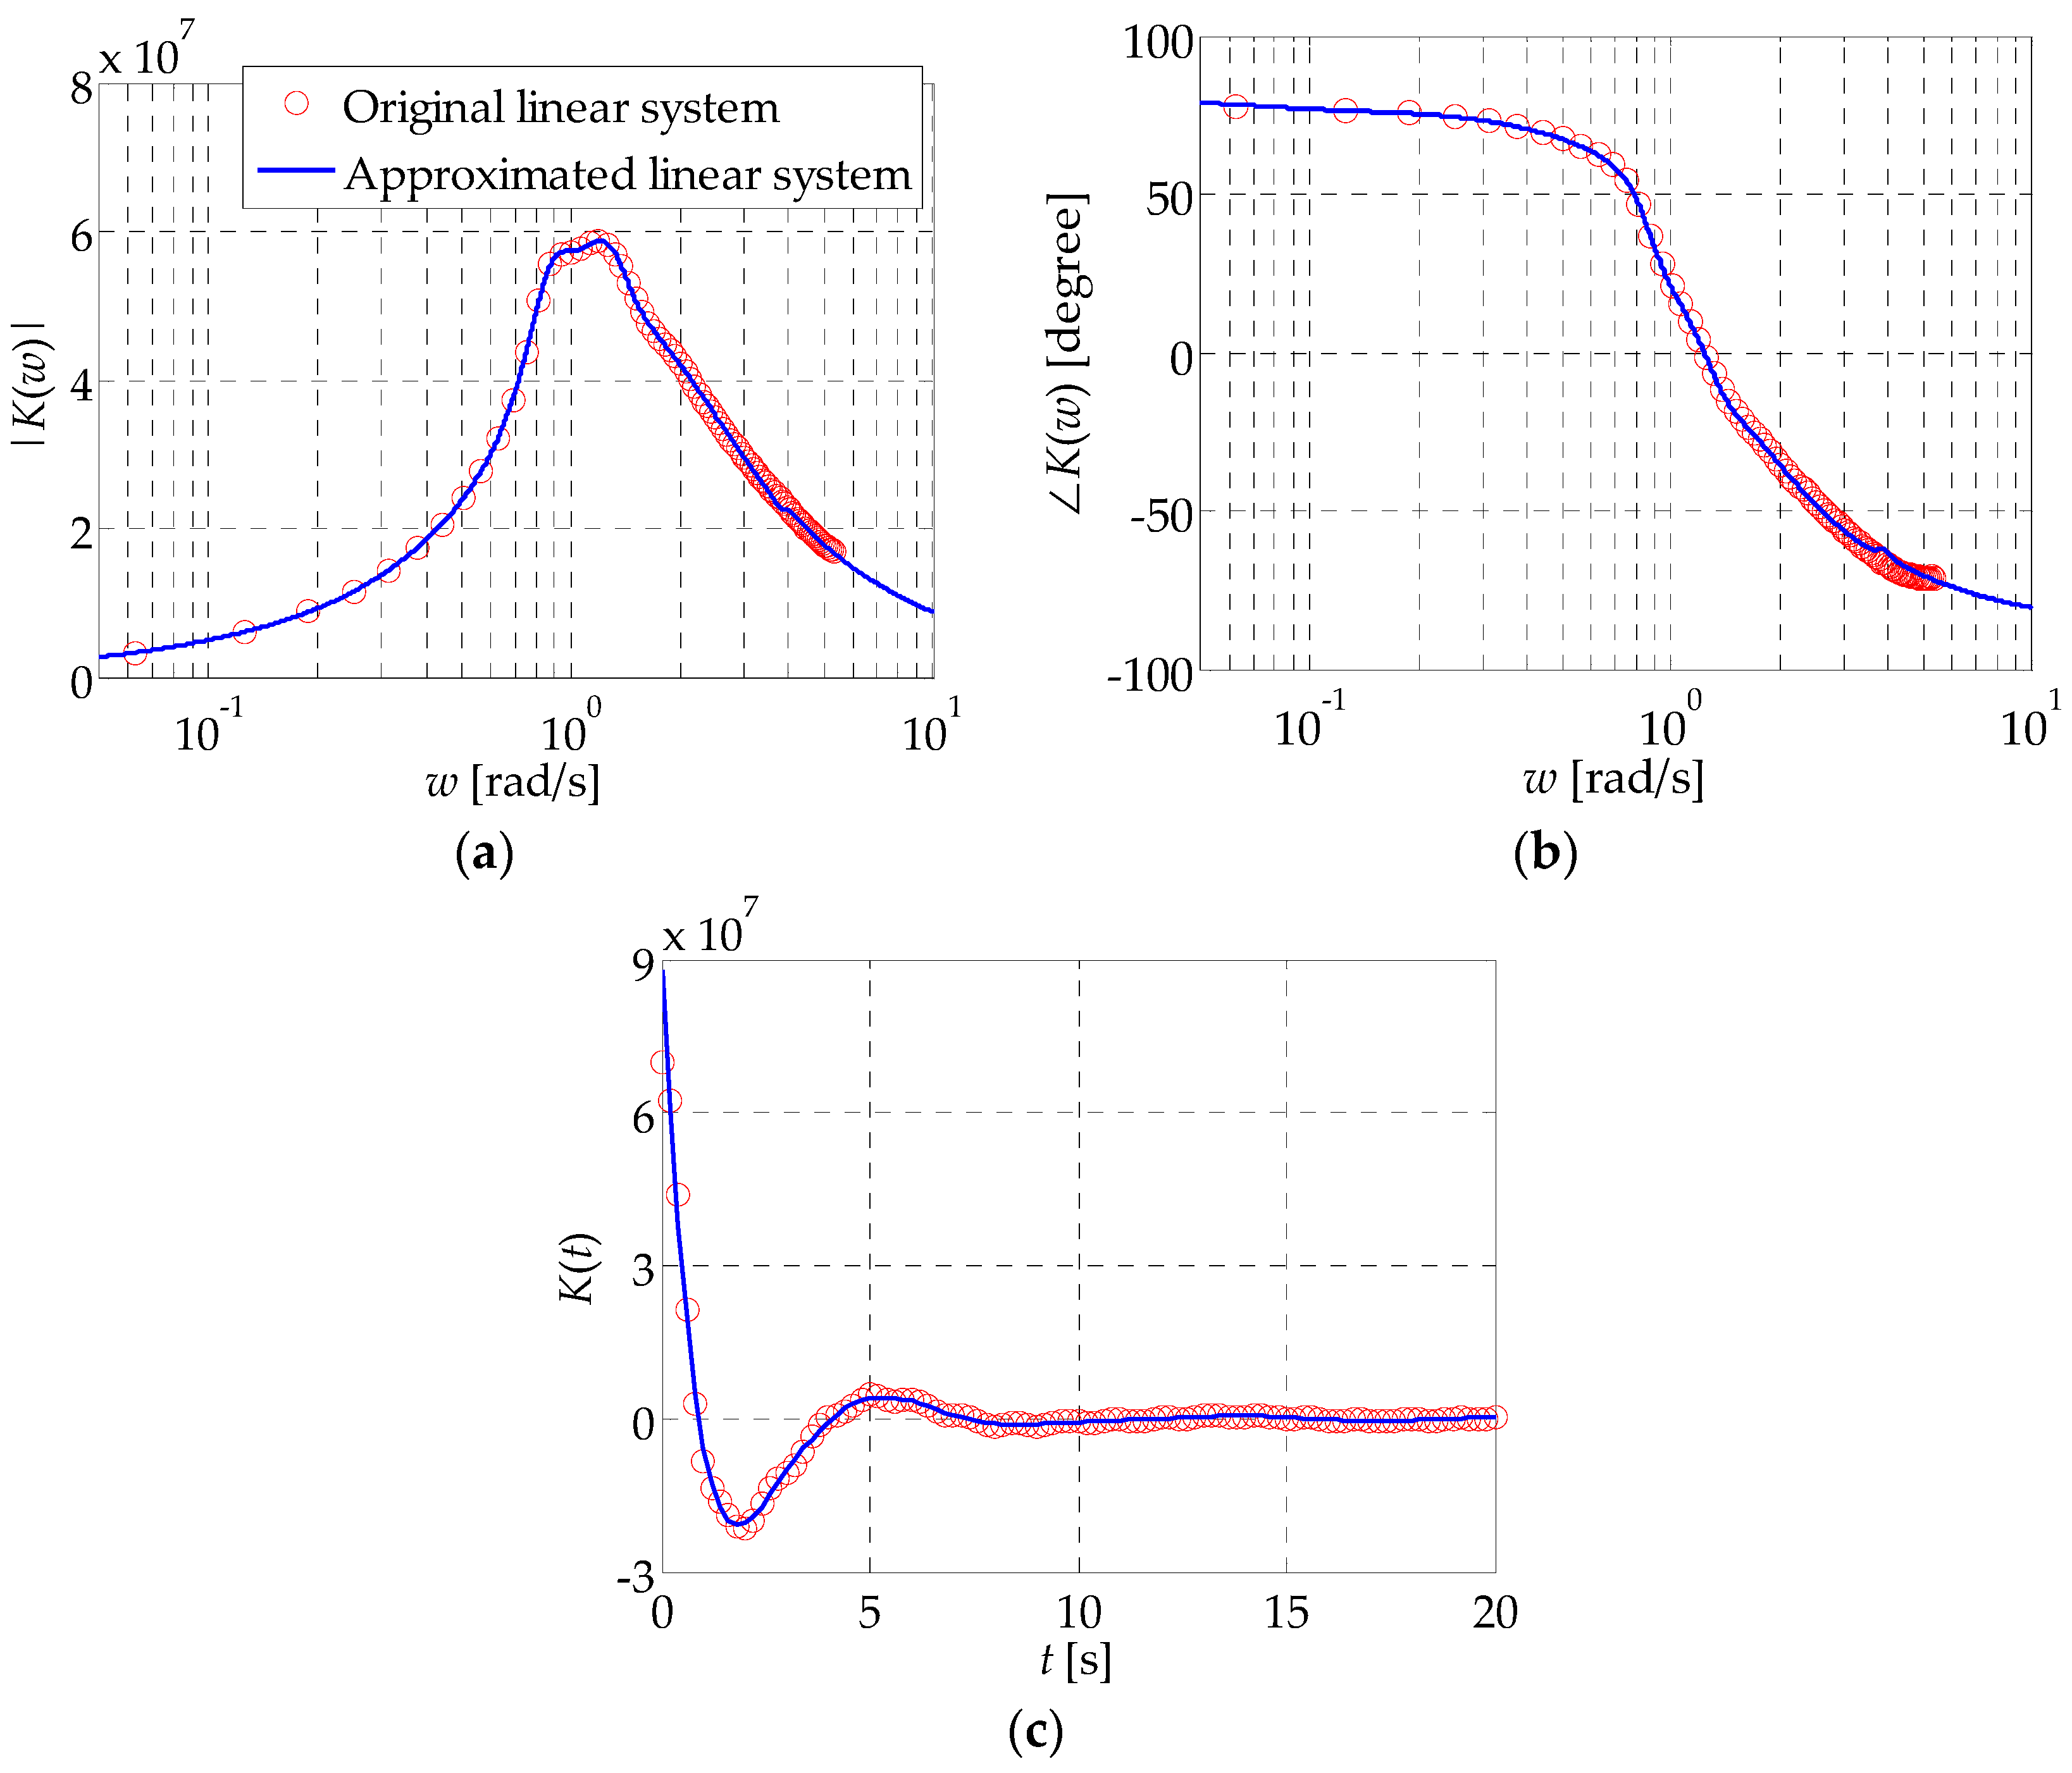
Figure 3.
The duck wave-energy converter (WEC) intrinsic mechanical impedance calculated in both the frequency and time domain: (a) magnitude of Zi; (b) phase angle of Zi.
Figure 3.
The duck wave-energy converter (WEC) intrinsic mechanical impedance calculated in both the frequency and time domain: (a) magnitude of Zi; (b) phase angle of Zi.

Figure 4.
Relative capture width of the duck WEC as a function of the PTO cylinder moment at several typical wave periods for the coulomb load.
Figure 4.
Relative capture width of the duck WEC as a function of the PTO cylinder moment at several typical wave periods for the coulomb load.

Figure 5.
Performance of the solo duck WEC as a function of the wave period for different load types when relative capture width is maximized under resistive control: (a) maximum relative capture width; (b) peak motion excursion; (c) peak power take-off (PTO) moment; (d) peak-to-average power ratio.

Figure 6.
Relative capture width as a function of the PTO moment setup and latching duration at T = 10 s: (a) for the linear load; (b) for the coulomb load.
Figure 6.
Relative capture width as a function of the PTO moment setup and latching duration at T = 10 s: (a) for the linear load; (b) for the coulomb load.
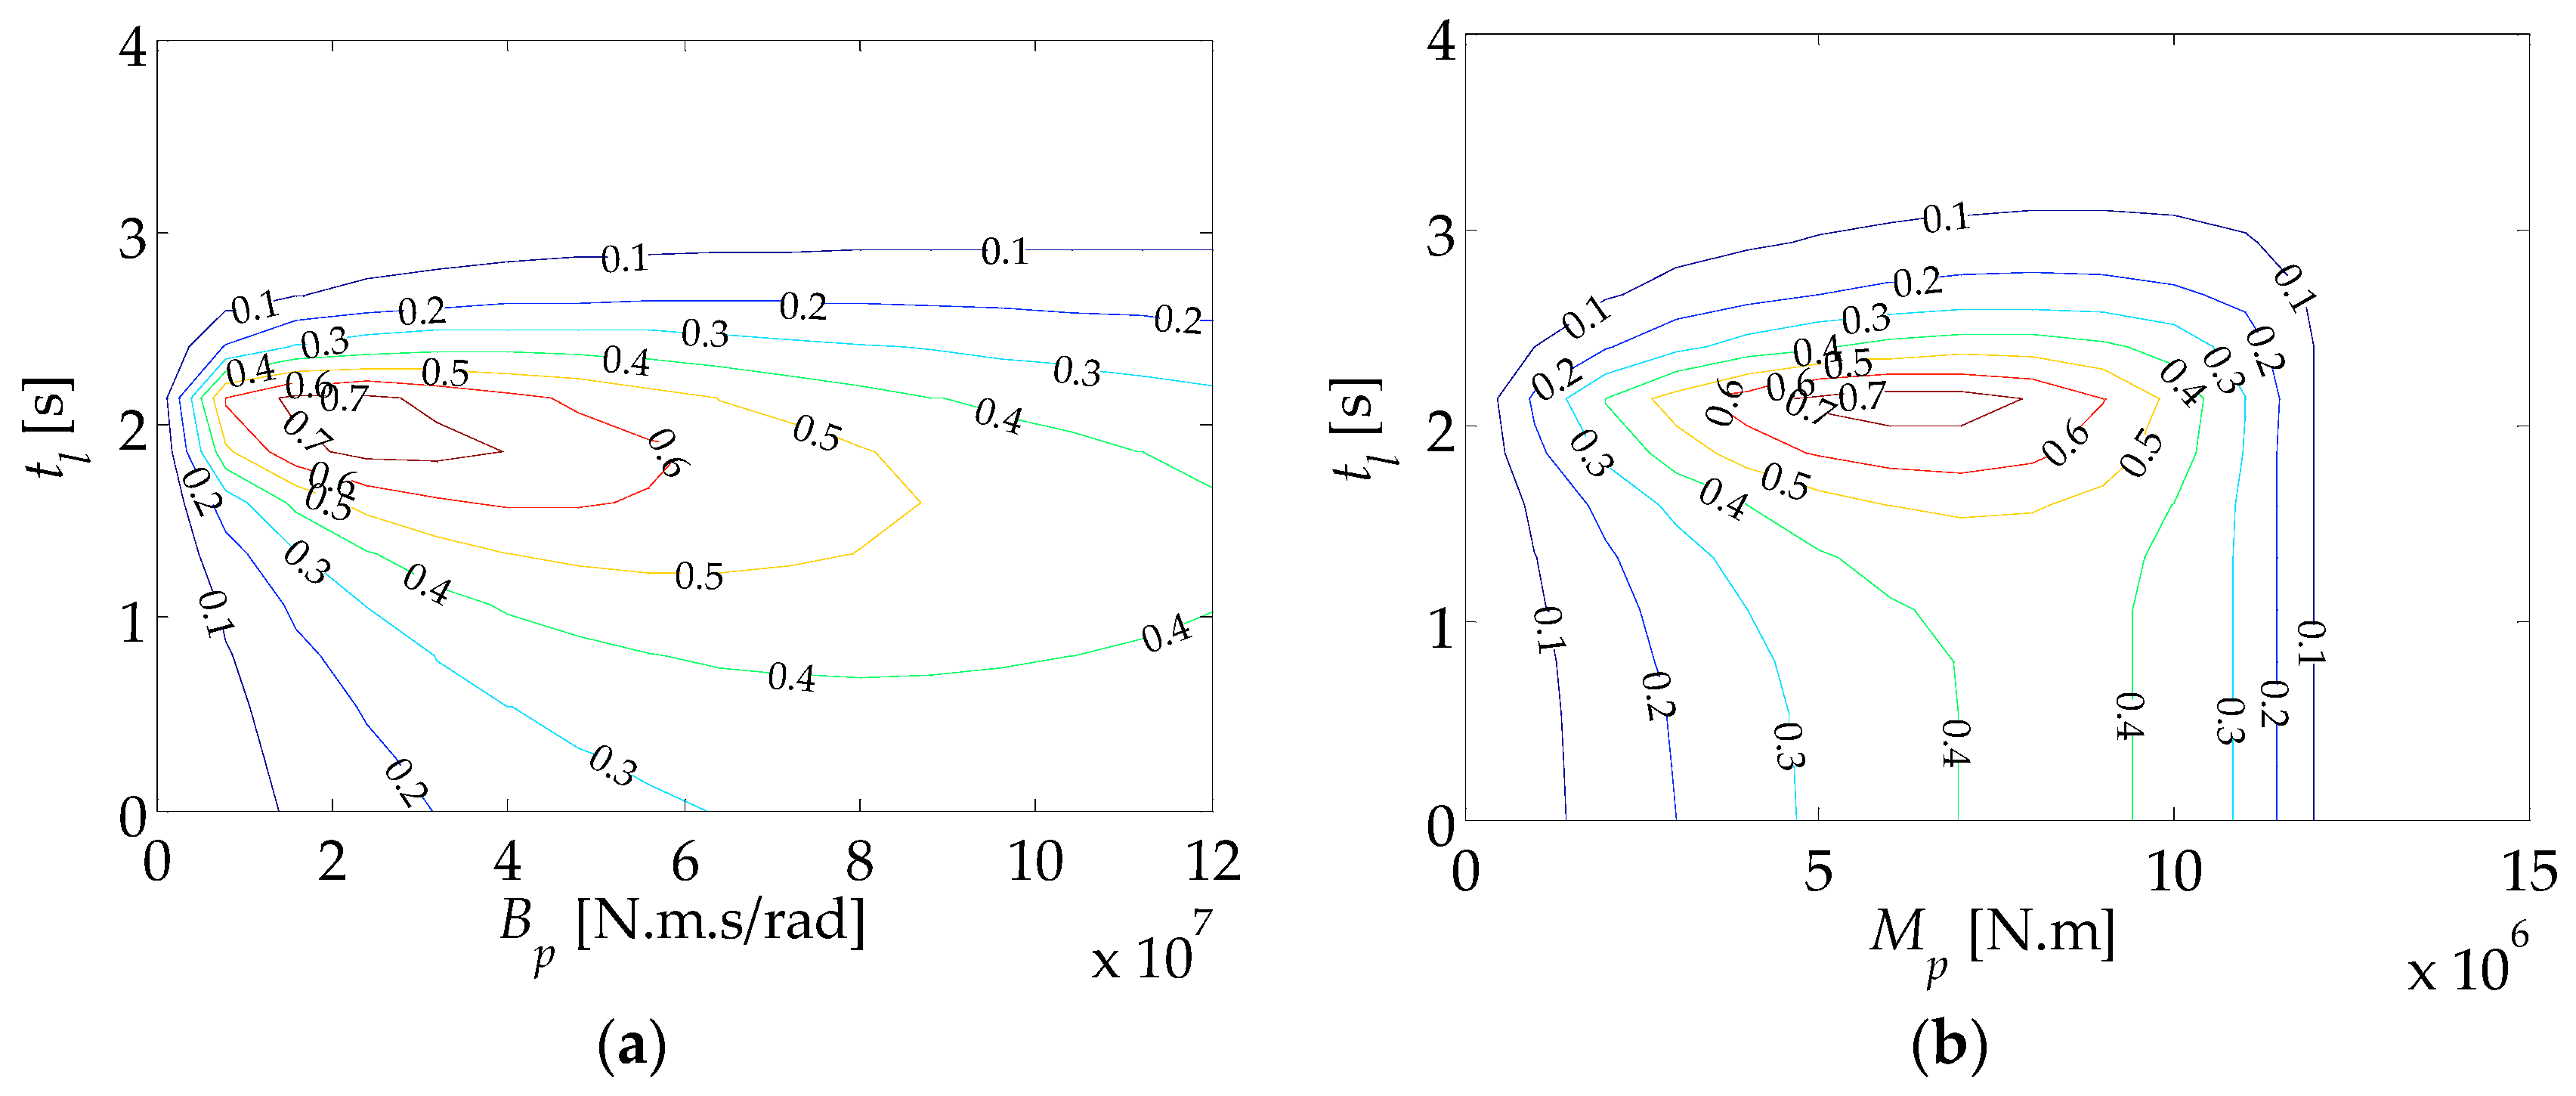
Figure 7.
Time history of the angular velocity and excitation moment when the maximum relative capture width is achieved for both the linear load and coulomb loads at T = 10 s.
Figure 7.
Time history of the angular velocity and excitation moment when the maximum relative capture width is achieved for both the linear load and coulomb loads at T = 10 s.

Figure 8.
Optimal latching duration tl and optimal unlatching lead time Δtl as functions of the wave period for different load types. The black solid and dash lines are the asymptotical lines of tl and Δtl, respectively.
Figure 8.
Optimal latching duration tl and optimal unlatching lead time Δtl as functions of the wave period for different load types. The black solid and dash lines are the asymptotical lines of tl and Δtl, respectively.
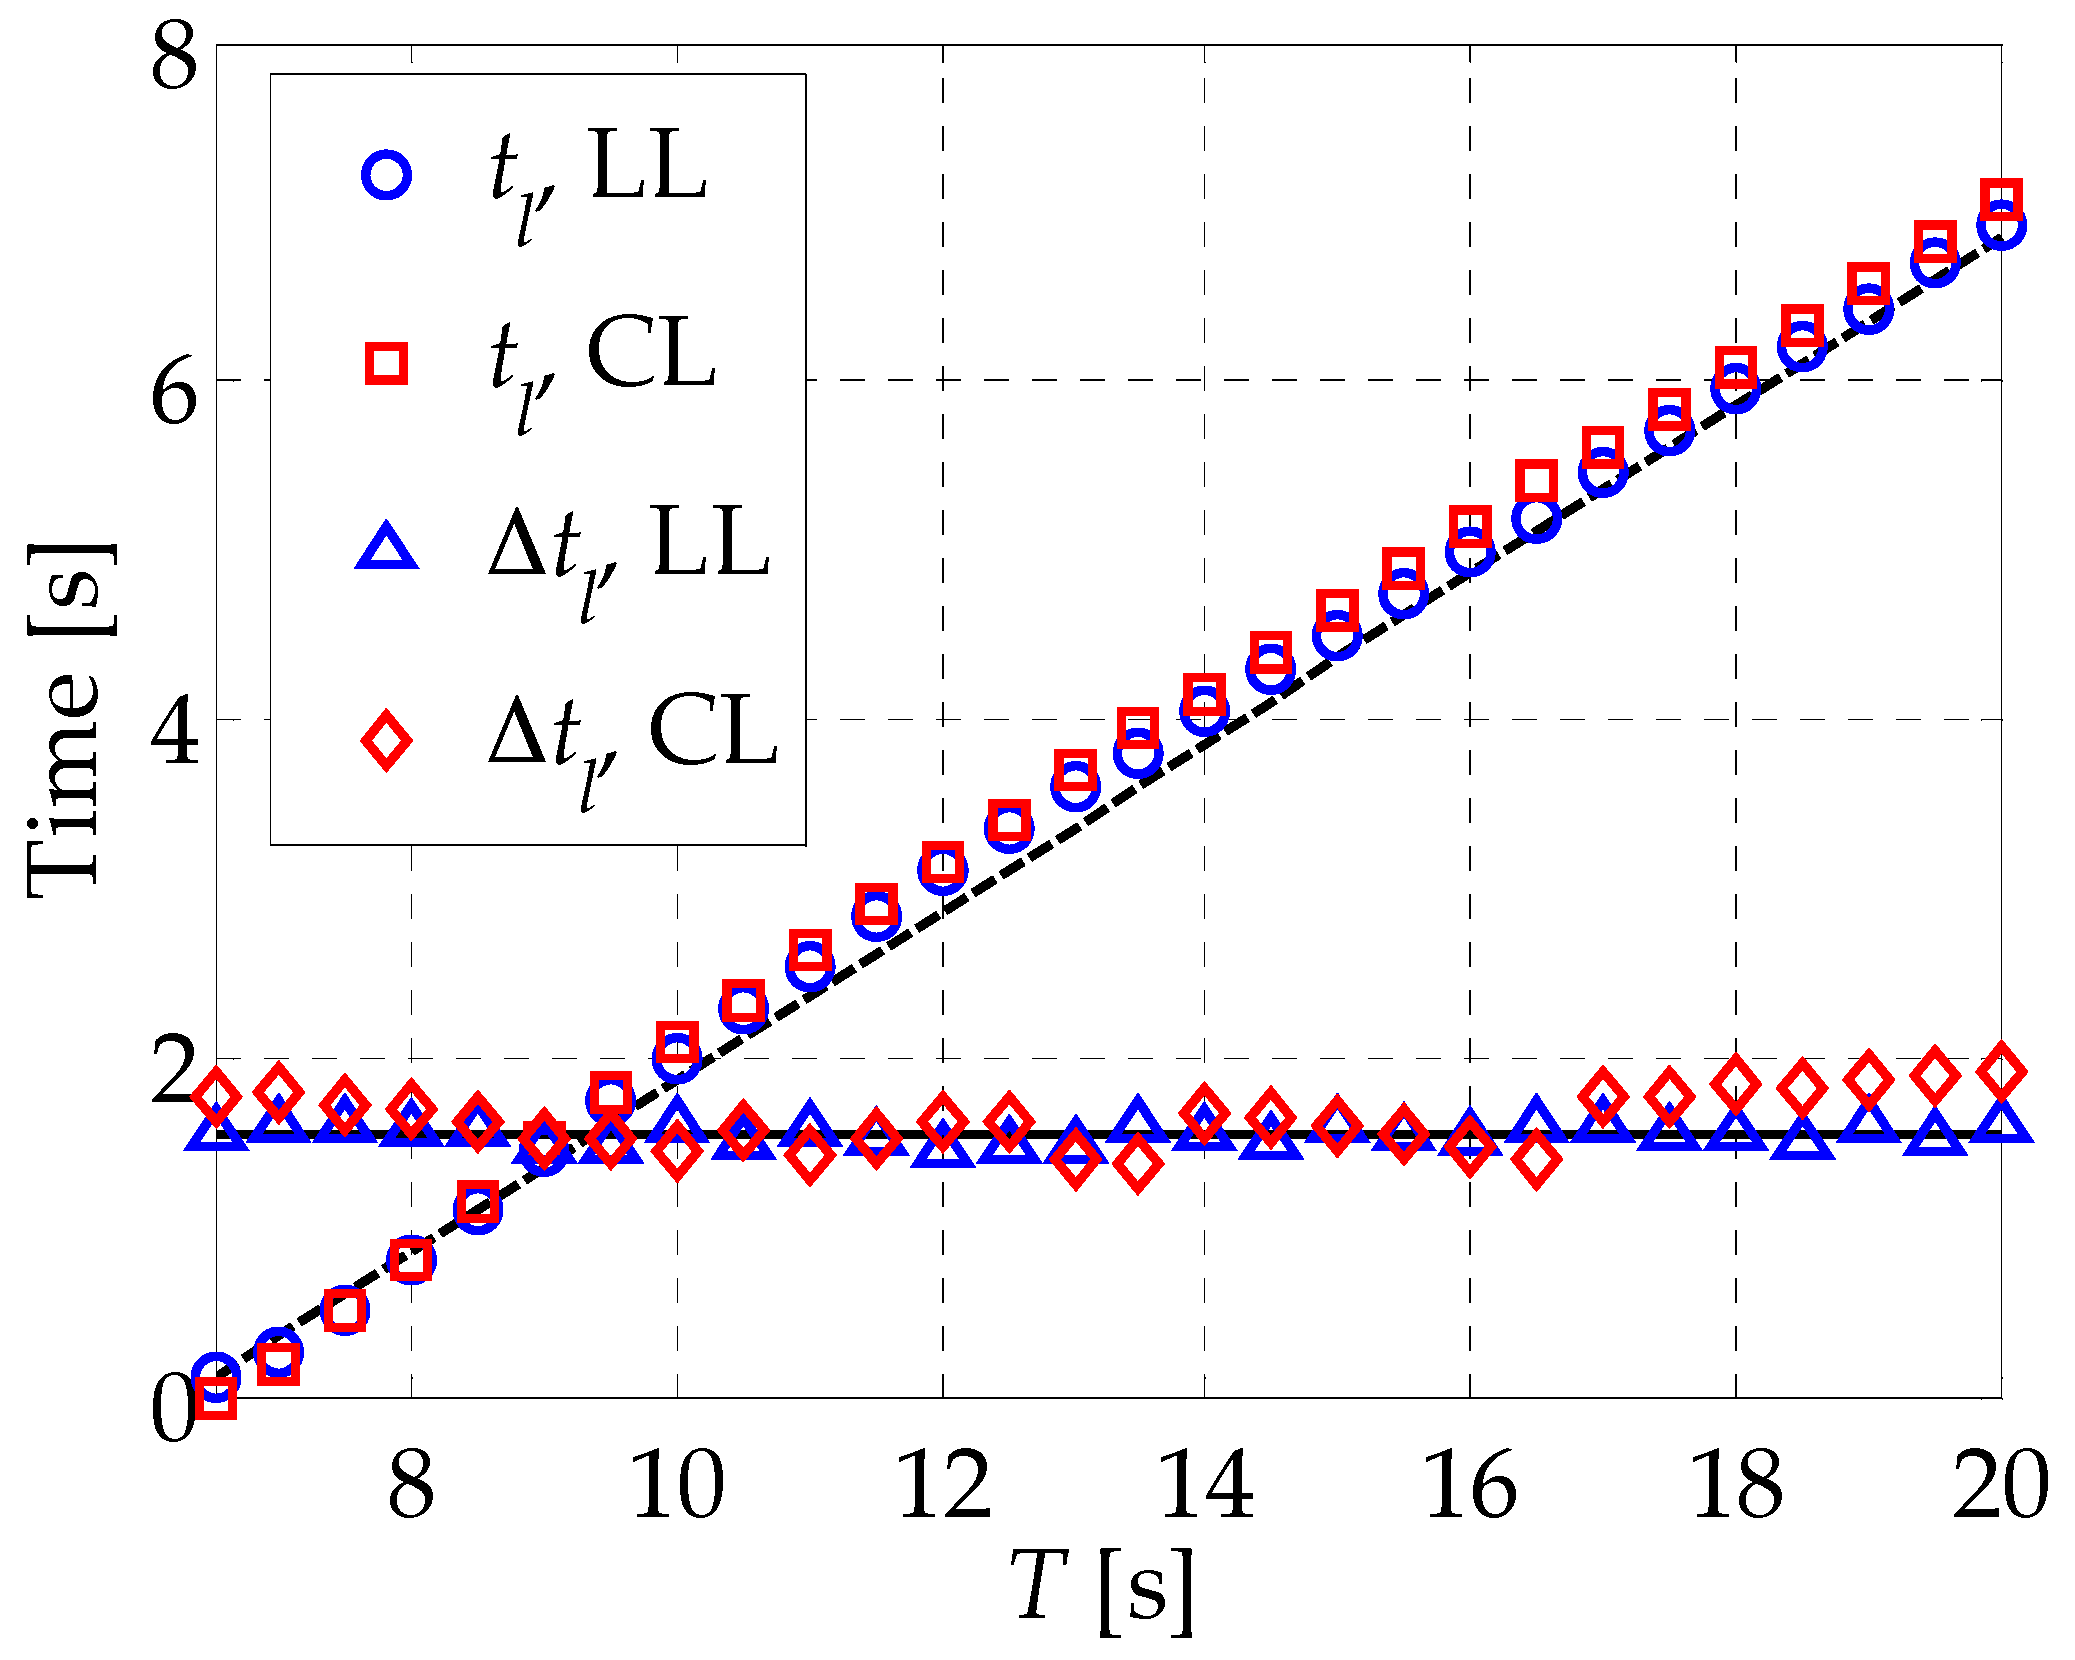
Figure 9.
Duck WEC performance comparison between latching and resistive control when relative capture width is maximized for different load types: (a) maximum relative capture width; (b) peak motion excursion; (c) peak PTO moment; (d) peak-to-average power ratio.
Figure 9.
Duck WEC performance comparison between latching and resistive control when relative capture width is maximized for different load types: (a) maximum relative capture width; (b) peak motion excursion; (c) peak PTO moment; (d) peak-to-average power ratio.


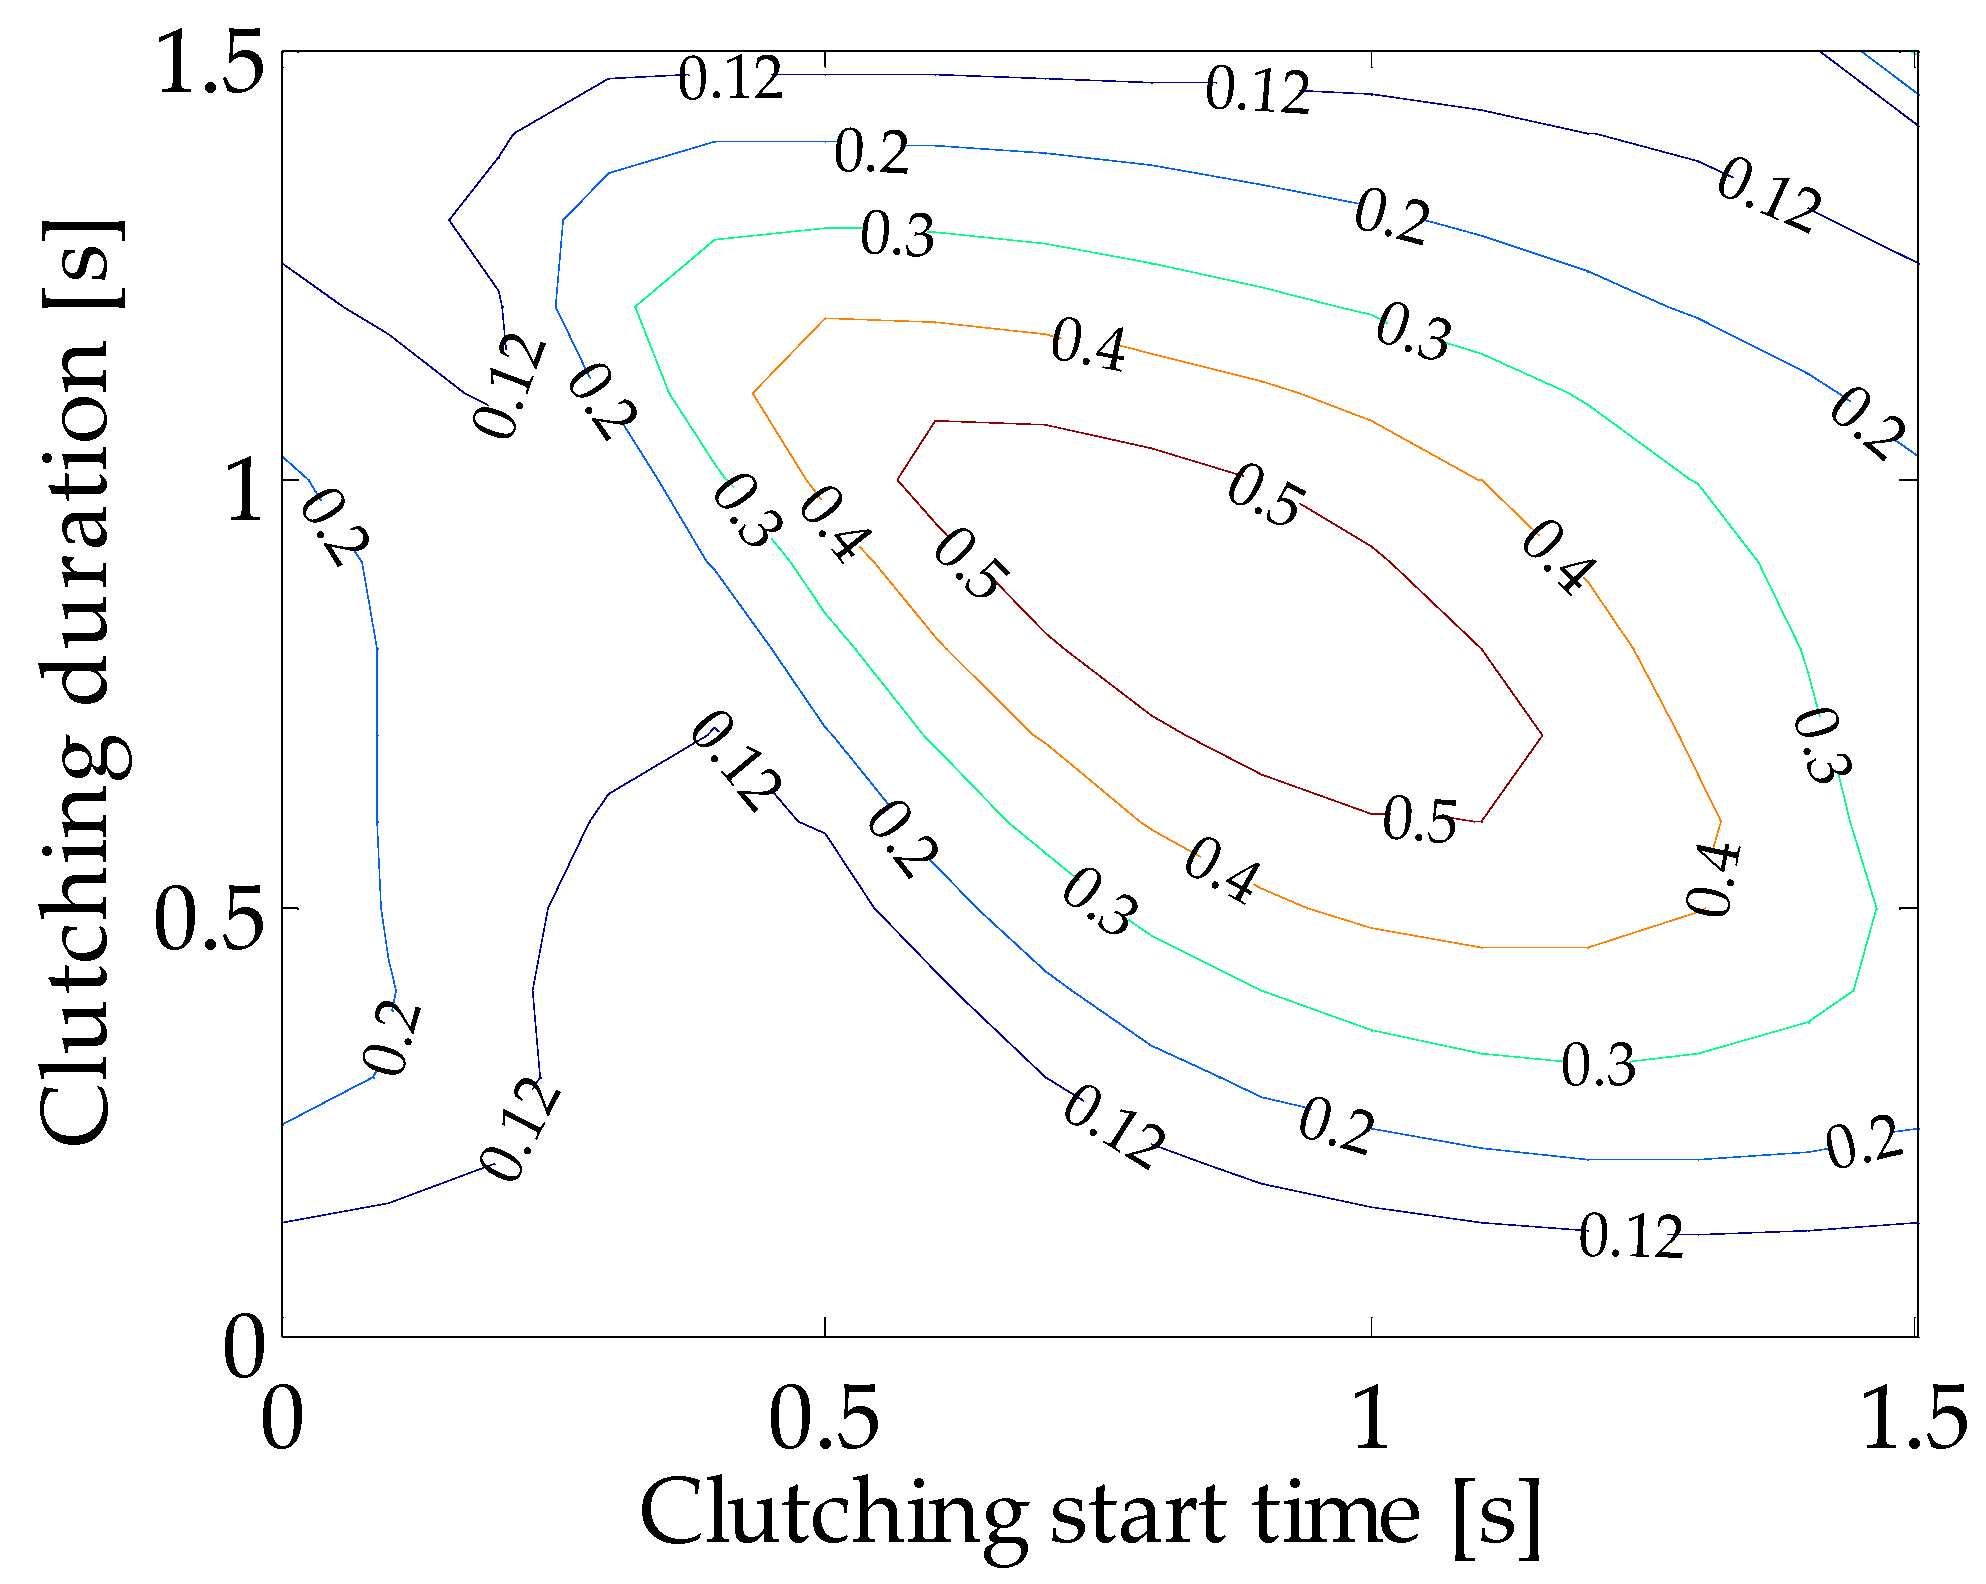
Figure 10.
Relative capture width as a function of the clutching start time and clutching duration for the coulomb load at Mp = 7 × 10⁶ N·m and T = 3.0 s.
Figure 10.
Relative capture width as a function of the clutching start time and clutching duration for the coulomb load at Mp = 7 × 10⁶ N·m and T = 3.0 s.

Figure 11.
Time history of the pitch angular velocity, PTO moment and excitation moment for the coulomb load at Mp = 7 × 10⁶ N·m and T = 3.0 s when maximum relative capture width is achieved: (a) under declutching control; (b) under resistive control.
Figure 11.
Time history of the pitch angular velocity, PTO moment and excitation moment for the coulomb load at Mp = 7 × 10⁶ N·m and T = 3.0 s when maximum relative capture width is achieved: (a) under declutching control; (b) under resistive control.
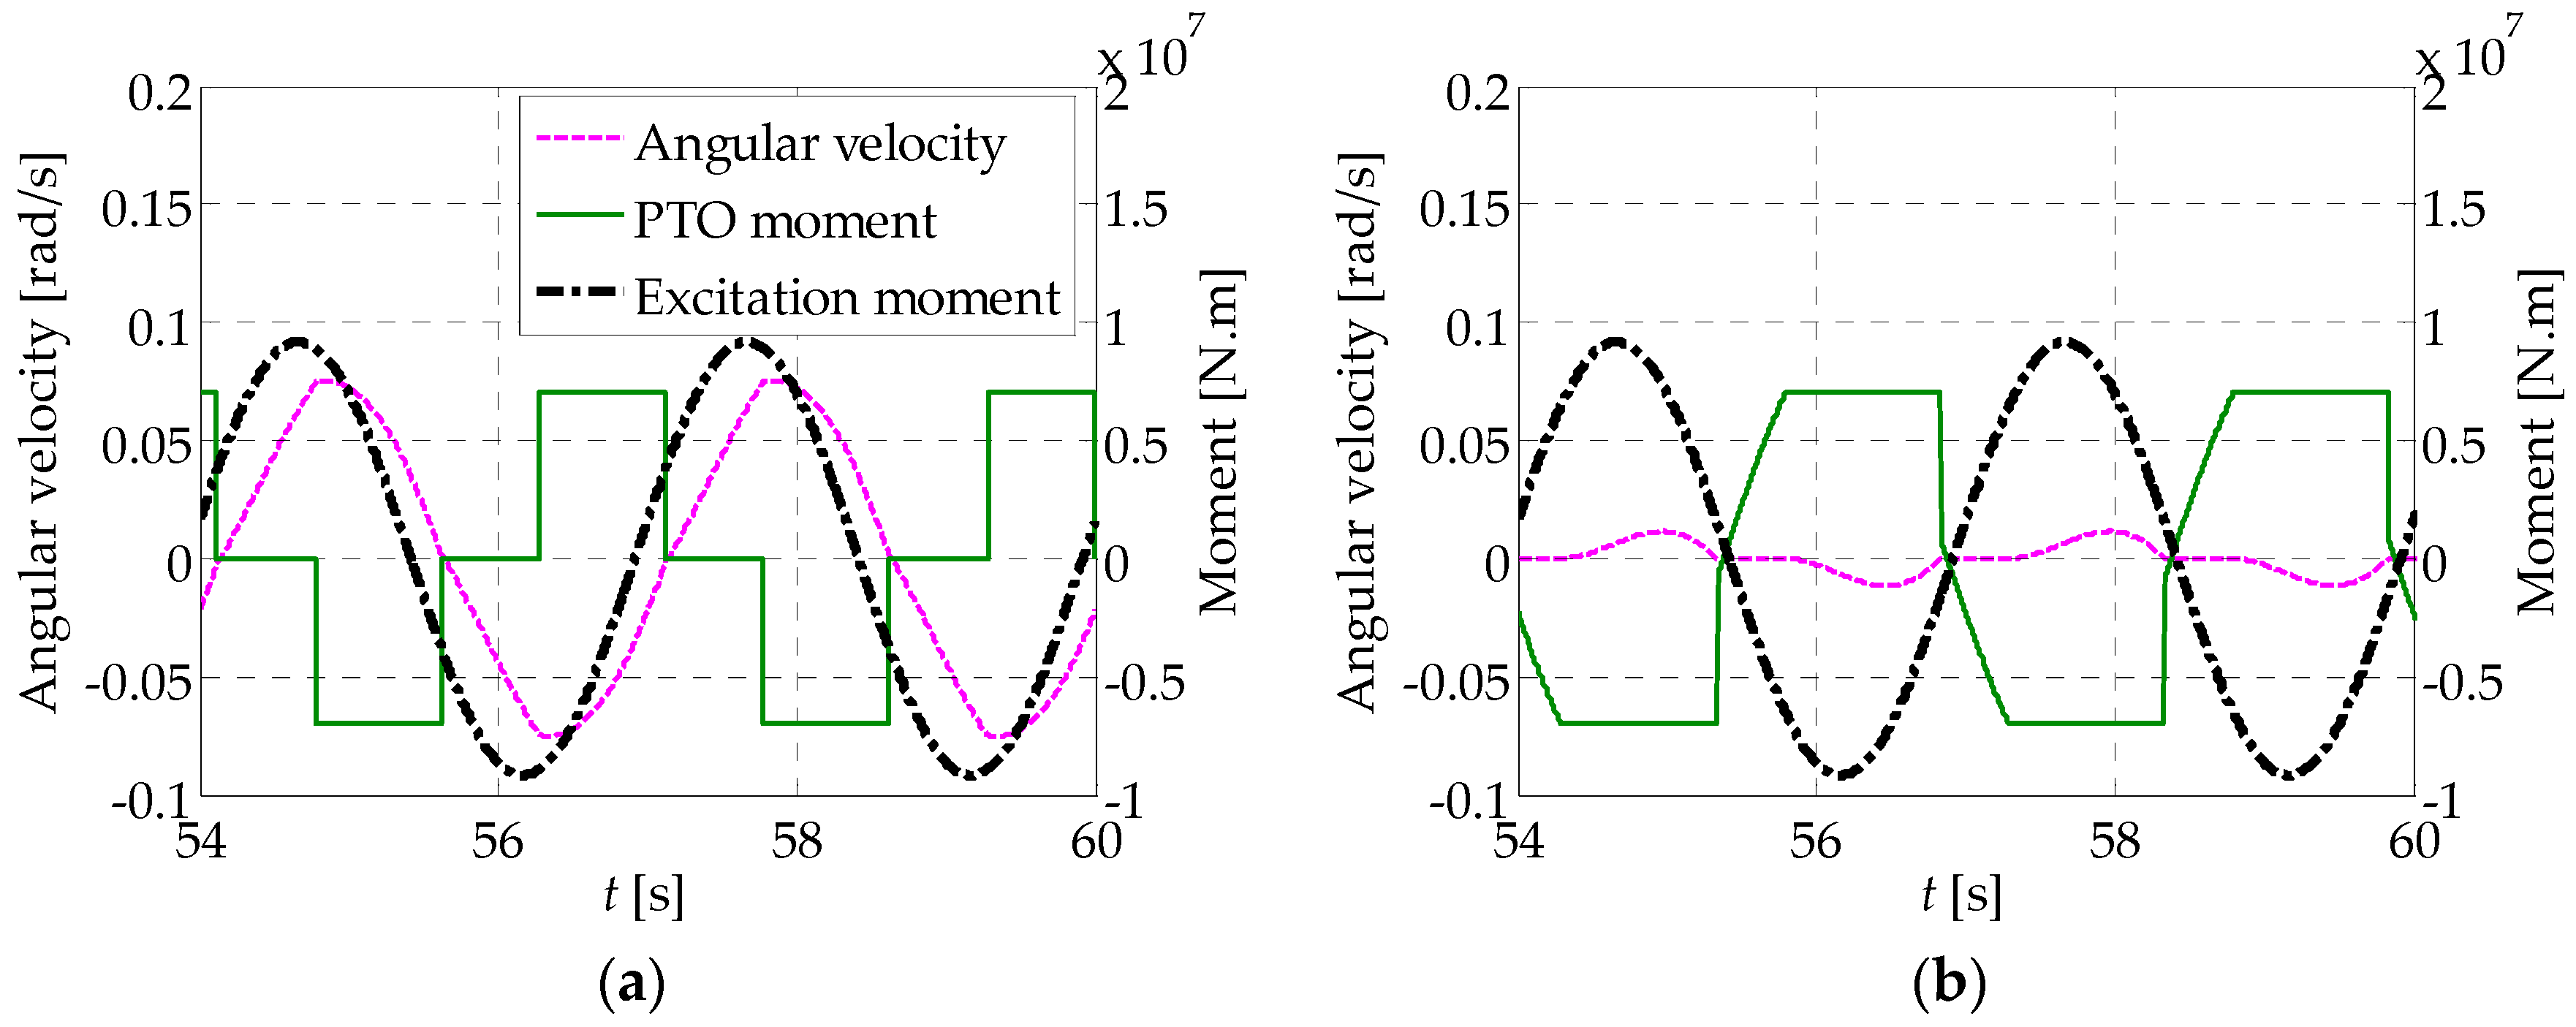
Figure 12.
(a) Optimal clutching start time and clutching duration that maximize the relative capture width as functions of the PTO cylinder moment for the coulomb load at T = 3 s; (b) the maximum relative capture width as a function of the PTO cylinder moment for the coulomb load under different control methods.
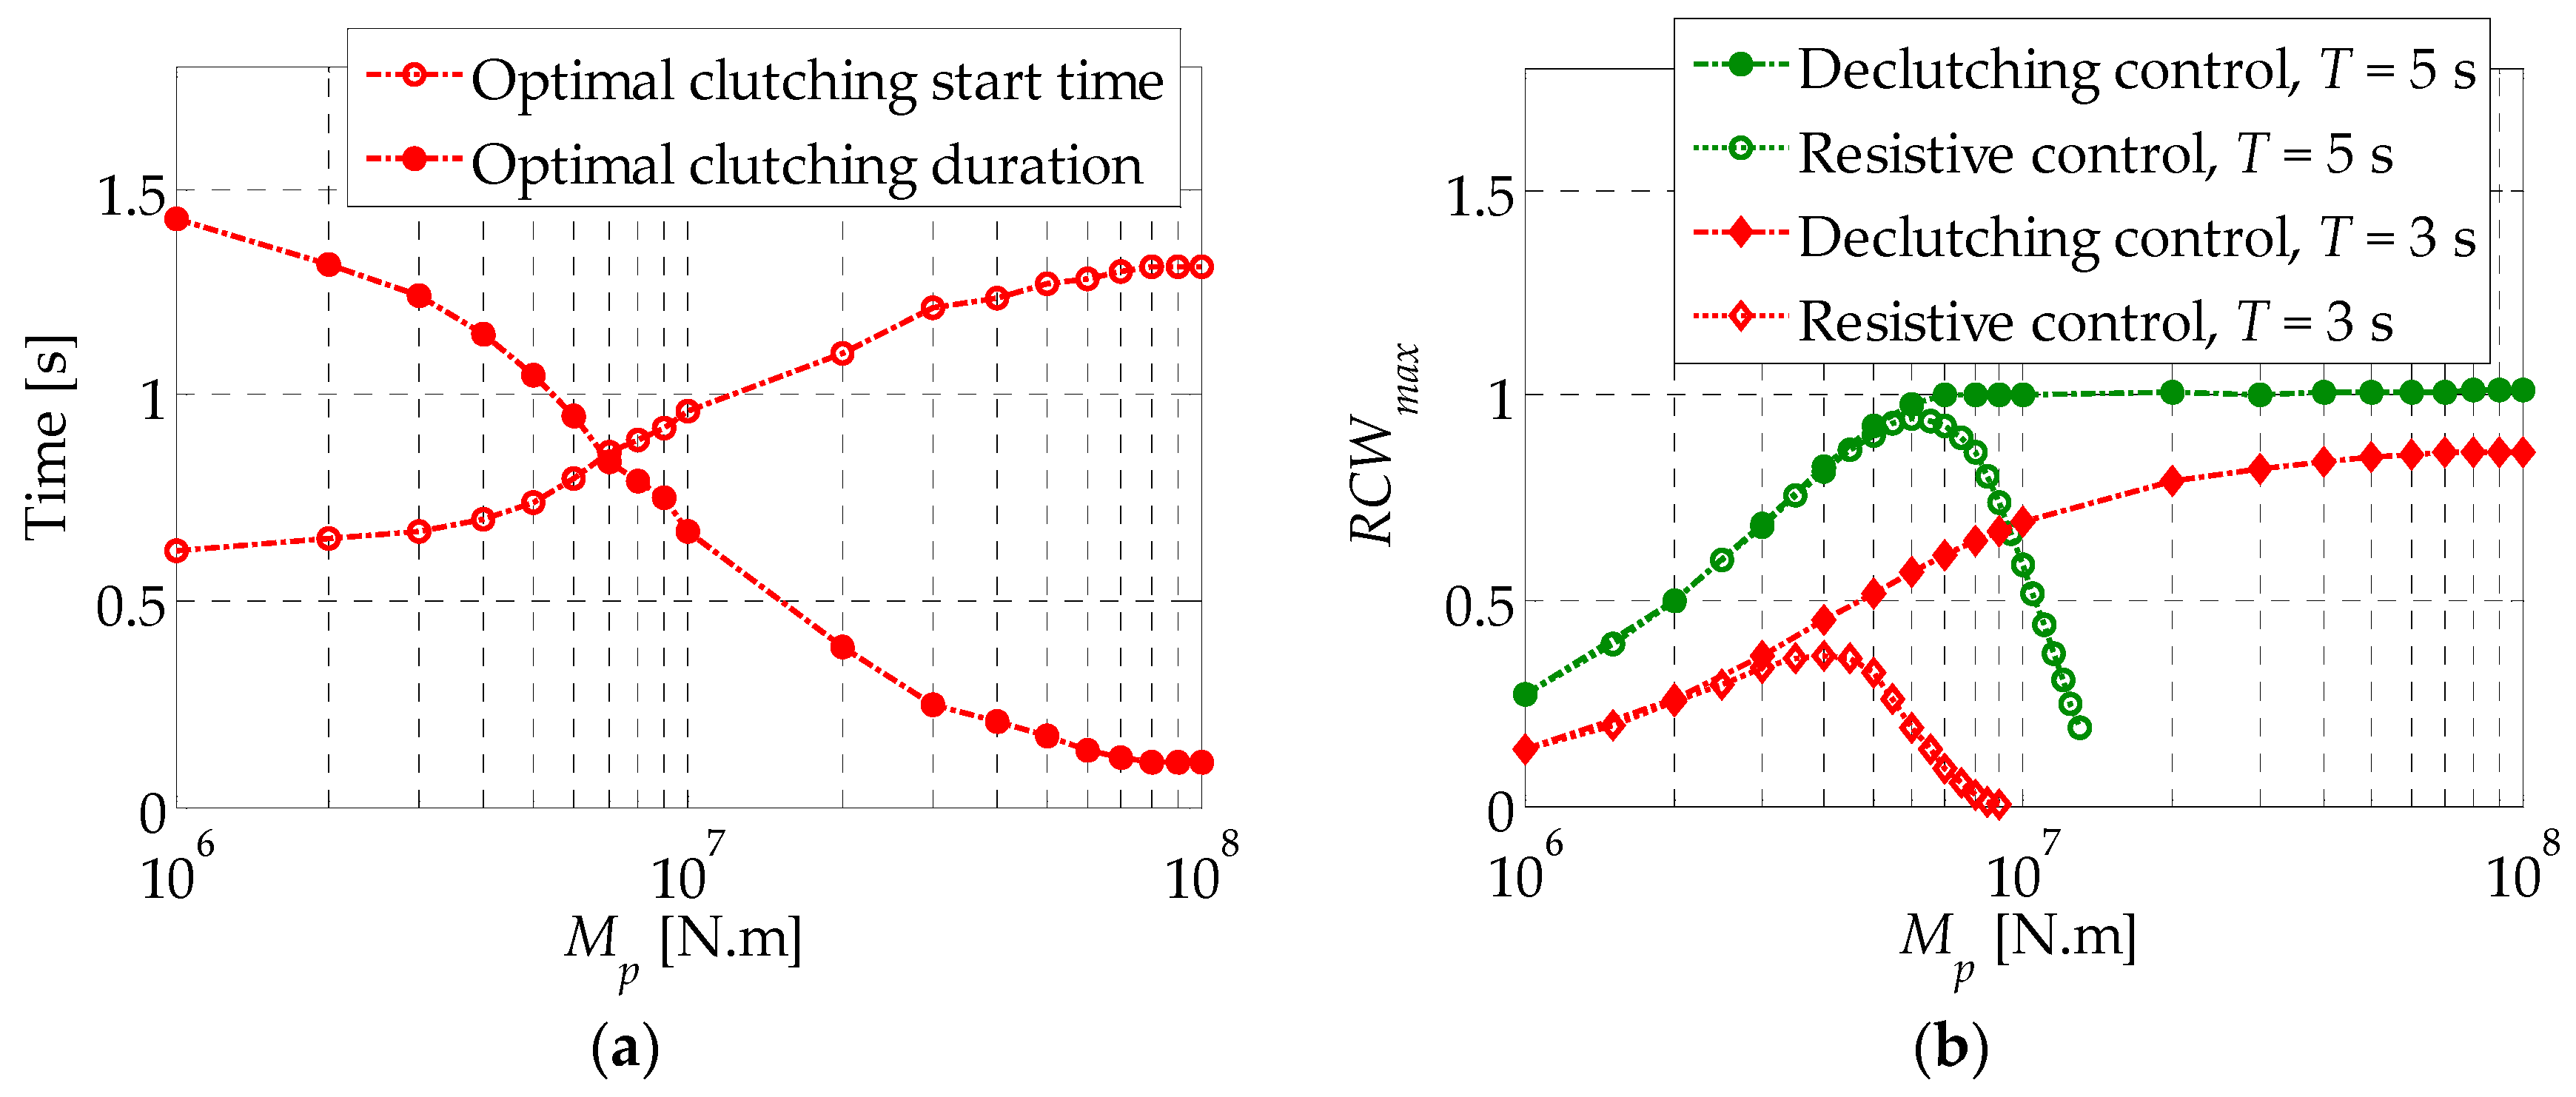
Figure 13.
Duck WEC performance comparison between declutching and resistive control when relative capture width is maximized for different load types: (a) maximum relative capture width; (b) peak motion excursion; (c) peak PTO moment; (d) peak-to-average power ratio.
Figure 13.
Duck WEC performance comparison between declutching and resistive control when relative capture width is maximized for different load types: (a) maximum relative capture width; (b) peak motion excursion; (c) peak PTO moment; (d) peak-to-average power ratio.


Table 1.
Magnification factor of the WEC performance under latching control compared to that under resistive control, averaged over the wave period set Twl = {8, 8.5, 9, …, 20}.
Table 1.
Magnification factor of the WEC performance under latching control compared to that under resistive control, averaged over the wave period set Twl = {8, 8.5, 9, …, 20}.
| WEC Performance Parameters | Linear Load | Coulomb Load |
|---|---|---|
| 2.47 | 2.19 | |
| 2.64 | 2.90 | |
| 0.96 | 0.75 | |
| 2.50 | 1.41 |
Table 2.
Magnification factor of the WEC performance under declutching control compared to that under resistive control, averaged over the wave period set Twd = {3, 3.5, 4, 4.5}.
Table 2.
Magnification factor of the WEC performance under declutching control compared to that under resistive control, averaged over the wave period set Twd = {3, 3.5, 4, 4.5}.
| WEC Performance Parameters | Linear Load | Coulomb Load |
|---|---|---|
| 1.33 | 1.49 | |
| 1.32 | 1.34 | |
| 3.29 | 2.08 | |
| 3.95 | 2.04 |
© 2017 by the authors. Licensee MDPI, Basel, Switzerland. This article is an open access article distributed under the terms and conditions of the Creative Commons Attribution (CC BY) license (http://creativecommons.org/licenses/by/4.0/).
Share and Cite
MDPI and ACS Style
Wu, J.; Yao, Y.; Zhou, L.; Göteman, M. Latching and Declutching Control of the Solo Duck Wave-Energy Converter with Different Load Types. Energies 2017, 10, 2070. https://doi.org/10.3390/en10122070
AMA Style
Wu J, Yao Y, Zhou L, Göteman M. Latching and Declutching Control of the Solo Duck Wave-Energy Converter with Different Load Types. Energies. 2017; 10(12):2070. https://doi.org/10.3390/en10122070
Chicago/Turabian StyleWu, Jinming, Yingxue Yao, Liang Zhou, and Malin Göteman. 2017. "Latching and Declutching Control of the Solo Duck Wave-Energy Converter with Different Load Types" Energies 10, no. 12: 2070. https://doi.org/10.3390/en10122070
Note that from the first issue of 2016, this journal uses article numbers instead of page numbers. See further details here.