Article

Comparison of Lithium-Ion Anode Materials Using an Experimentally Verified Physics-Based Electrochemical Model

1
Independent Researcher, Novi, MI 48377, USA
2
Department of Electrical and Computer Engineering, Kettering University, Flint, MI 48504, USA
3
School of Mechanical Engineering, Shanghai Jiao Tong University, 800 Dongchuan Rd., Shanghai 200240, China
4
National Engineering Laboratory for Electric Vehicles and Collaborative Innovation Center of Electric Vehicles in Beijing, Beijing Institute of Technology, Beijing 100081, China
*
Author to whom correspondence should be addressed.
Energies 2017, 10(12), 2174; https://doi.org/10.3390/en10122174
Submission received: 17 November 2017 / Revised: 5 December 2017 / Accepted: 12 December 2017 / Published: 19 December 2017
(This article belongs to the Section D: Energy Storage and Application)

Abstract

:
Researchers are in search of parameters inside Li-ion batteries that can be utilized to control their external behavior. Physics-based electrochemical model could bridge the gap between Li+ transportation and distribution inside battery and battery performance outside. In this paper, two commercially available Li-ion anode materials: graphite and Lithium titanate (Li4Ti5O12 or LTO) were selected and a physics-based electrochemical model was developed based on half-cell assembly and testing. It is found that LTO has a smaller diffusion coefficient (Ds) than graphite, which causes a larger overpotential, leading to a smaller capacity utilization and, correspondingly, a shorter duration of constant current charge or discharge. However, in large current applications, LTO performs better than graphite because its effective particle radius decreases with increasing current, leading to enhanced diffusion. In addition, LTO has a higher activation overpotential in its side reactions; its degradation rate is expected to be much smaller than graphite, indicating a longer life span.

1. Introduction

Scientists around the world have been making extensive efforts to develop clean and efficient energy storage systems to enable renewable energy technologies to deal with critical contemporary energy issues such as diminishing fossil fuel reserves, increasing energy demand, and pollution of the environment. Lithium has been selected as one of the most important battery materials in history because it is the lightest metal (6.94 g/mol) and has the most negative reduction potential (−3.04 V versus SHE, standard hydrogen electrode) compared to other alkaline metals [1]. The use of lithium metal as the anode material in lithium primary batteries, the discovery of the so-called “rocking-chair” mechanism, and, later, the invention of Li-ion batteries (LIB), were all important to the development of lithium as a practical battery material [1]. LIBs, since first commercialized by Sony in 1991, have quickly come to dominate the battery market for portable electronics including smartphones, laptops, digital cameras, etc., and are also currently being developed and utilized for new emerging markets such as electrified vehicles (EV) and large-scale grid energy storage [1,2]. In most of these applications, a battery management system (BMS) consisting of both hardware and software is necessary. A BMS must be sophisticated when applied to EVs, because it is responsible for not only operating the battery within a safe voltage window and balancing each cell during charging, but also for estimating the behavior of the battery, often including the current state of charge (SOC), state of power (SOP), and state of health (SOH) [3,4]. To accomplish these functions, a BMS requires a model that can predict the behavior inside the battery. In contrast to a traditional experimental or equivalent circuit model [5,6,7,8,9], a physics-based electrochemical model estimates the internal parameters of the battery. An advanced BMS based on a physics-justified electrochemical model is able to more precisely estimate the internal state of the battery and immeasurable parameters such as Li+ concentration and solid state diffusivity to better control and utilize the battery [10].
The electrochemistry-based battery model, first introduced by Newman in 1975, incorporated chemical/electrochemical kinetics and mass/charge transportation and conservation in both the solid and liquid phases within the battery [11,12,13]. In this model, the electrode is treated as a porous thin film coating consisting of spherical particles of active material immersed in an electrolyte solution. This model is generally considered to be a pseudo-two-dimensional model because it allows for variation in Li+ concentration and electric potential throughout the thickness of the battery, as well as radially through the spherical particles of active material. Since its introduction, electrochemical modeling has experienced tremendous development and extensive literature is now available on the subject. By direct coupling the physics equations governing battery phenomena and utilizing various discretization methods, Wang et al. established electrochemical models for lead acid [14,15], nickel metal hydride [16,17] and LIBs [18,19,20]. Through efficient simulation techniques and the reformulation of LIB models, Subramanian et al. investigated the real-time application of the electrochemical model in a microcontroller environment for electric vehicles and compared the computational costing and accuracy of different models [21,22]. To incorporate the effects of electrical potential non-uniformity and temperature imbalances, a multi-scale multi-dimensional model was developed in the National Renewable Energy Laboratory (NREL) by addressing the interplay of Li-ion battery physics at various length scales [23]. The degradation and thermal runaway phenomena of Li-ion batteries were simulated by White et al. by adding consideration for effects of side reactions and mechanical stress generation during the charge and discharge process [24,25,26,27].
A battery is a complex electrochemical device. It consists of several components: principally an anode, cathode, separator, electrolyte, and current collectors. The transportation of Li+ inside of the battery is governed by a few mechanisms. To better simulate battery performance, it is necessary to involve more than 30 parameters when establishing an electrochemical model compared to equivalent circuit model. More parameters are needed when thermal effects, mechanical stress, or solid electrolyte interphase (SEI) growth are considered. Thus, accurately measuring these parameters becomes critical to the success of the battery model. Most of the electrochemical models available in the literature are based on commercial cells. In full cell testing, it is difficult to isolate the effects of a single electrode from the effects of the other. For example, Li+ intercalation and deintercalation inside of the active particles are the slowest transportation processes in the battery and, as a result, the corresponding parameter governing these processes, solid state diffusivity (Ds), dominates the electrochemical dynamics in most cases. However, it is difficult to distinguish the individual effects of Ds in the anode and cathode when a full cell is utilized for testing.
In this paper, a physics-based electrochemical model was developed based on half-cell assembly and testing to simulate the performance of two common Li-ion battery anode materials. Material characterization techniques such as scanning electron microscopy (SEM) were utilized to extract simulating parameters. Electrical characterization experiments including constant current cycling and open circuit voltage (OCV) tests were conducted and the developed electrochemical model was validated against experimental data. This physics-based electrochemical half-cell model can quantify the ion diffusion in the solid phase and electrolyte as well as the degradation caused by side reactions. Because most of battery material development is done through half-cell testing, the enormous amount of data already obtained by material scientists in the literature can be simulated with this half-cell model. This establishes a bridge between battery development and battery applications.

2. Results

2.1. Parameter Identification

2.1.1. Battery Manufacturing and Physical Property Characterization

Unlike the traditional equivalent circuit model, there are more than 30 parameters involved when setting up an electrochemistry-based model. Thus, for such an electrochemistry-based model to be accurate, these parameters have to be accurately measured experimentally. To find these parameters for graphite and LTO, half-cells were made and tested with each of these materials. Electrodes were prepared by mixing the active material (80% by wt) with carbon black (10% by wt, Alfa Aesar, 100% compressed 99.9+%) and polyvinylidene fluoride (10% by wt, Alfa Aesar, Haverhill, MA, USA) and then suspended in N-methyl-2-pyrrolidone (NMP, Alfa Aesar) to form a slurry. Next, the slurry was coated onto disks of copper foil which were then dried at 80 °C in a forced air convection oven for ~10 h. Half-cells were assembled with the prepared electrodes and lithium metal electrodes inside a glove box containing an inert argon atmosphere. The electrolyte used was 1.0 M LiPF6 dissolved in a 1:1 mixture of ethylene carbonate (EC) (Alfa Aesar, Tewksbury, MA, USA) and dimethyl carbonate (DMC) (Alfa Aesar, Tewksbury, MA, USA). The separator used was prepared from Celgard 2500 microporous membrane (Celgard, Charlotte, NC, USA). All the half-cells were assembled into 20 mm diameter CR2025 coin cells and then crimped. The fresh cells were initially cycled at 0.5 C for at least 5 cycles to ensure the full formation of a stable SEI before being tested. The electrochemical characterizations were carried out using a BioLogic SP-300 potentiostat (Willow Hill, PA, USA), LANHE CT2001A testing machines, and a Neware Testing System. Graphite and LTO powders were purchased from Alfa Aesar and a private source, respectively. The morphologies of these powders were analyzed using a Quanta 200s Environmental Scanning Electron Microscope (ESEM) (Thermo Fisher Scientific, Hillsboro, OR, USA). These results are provided and discussed in Appendix A.

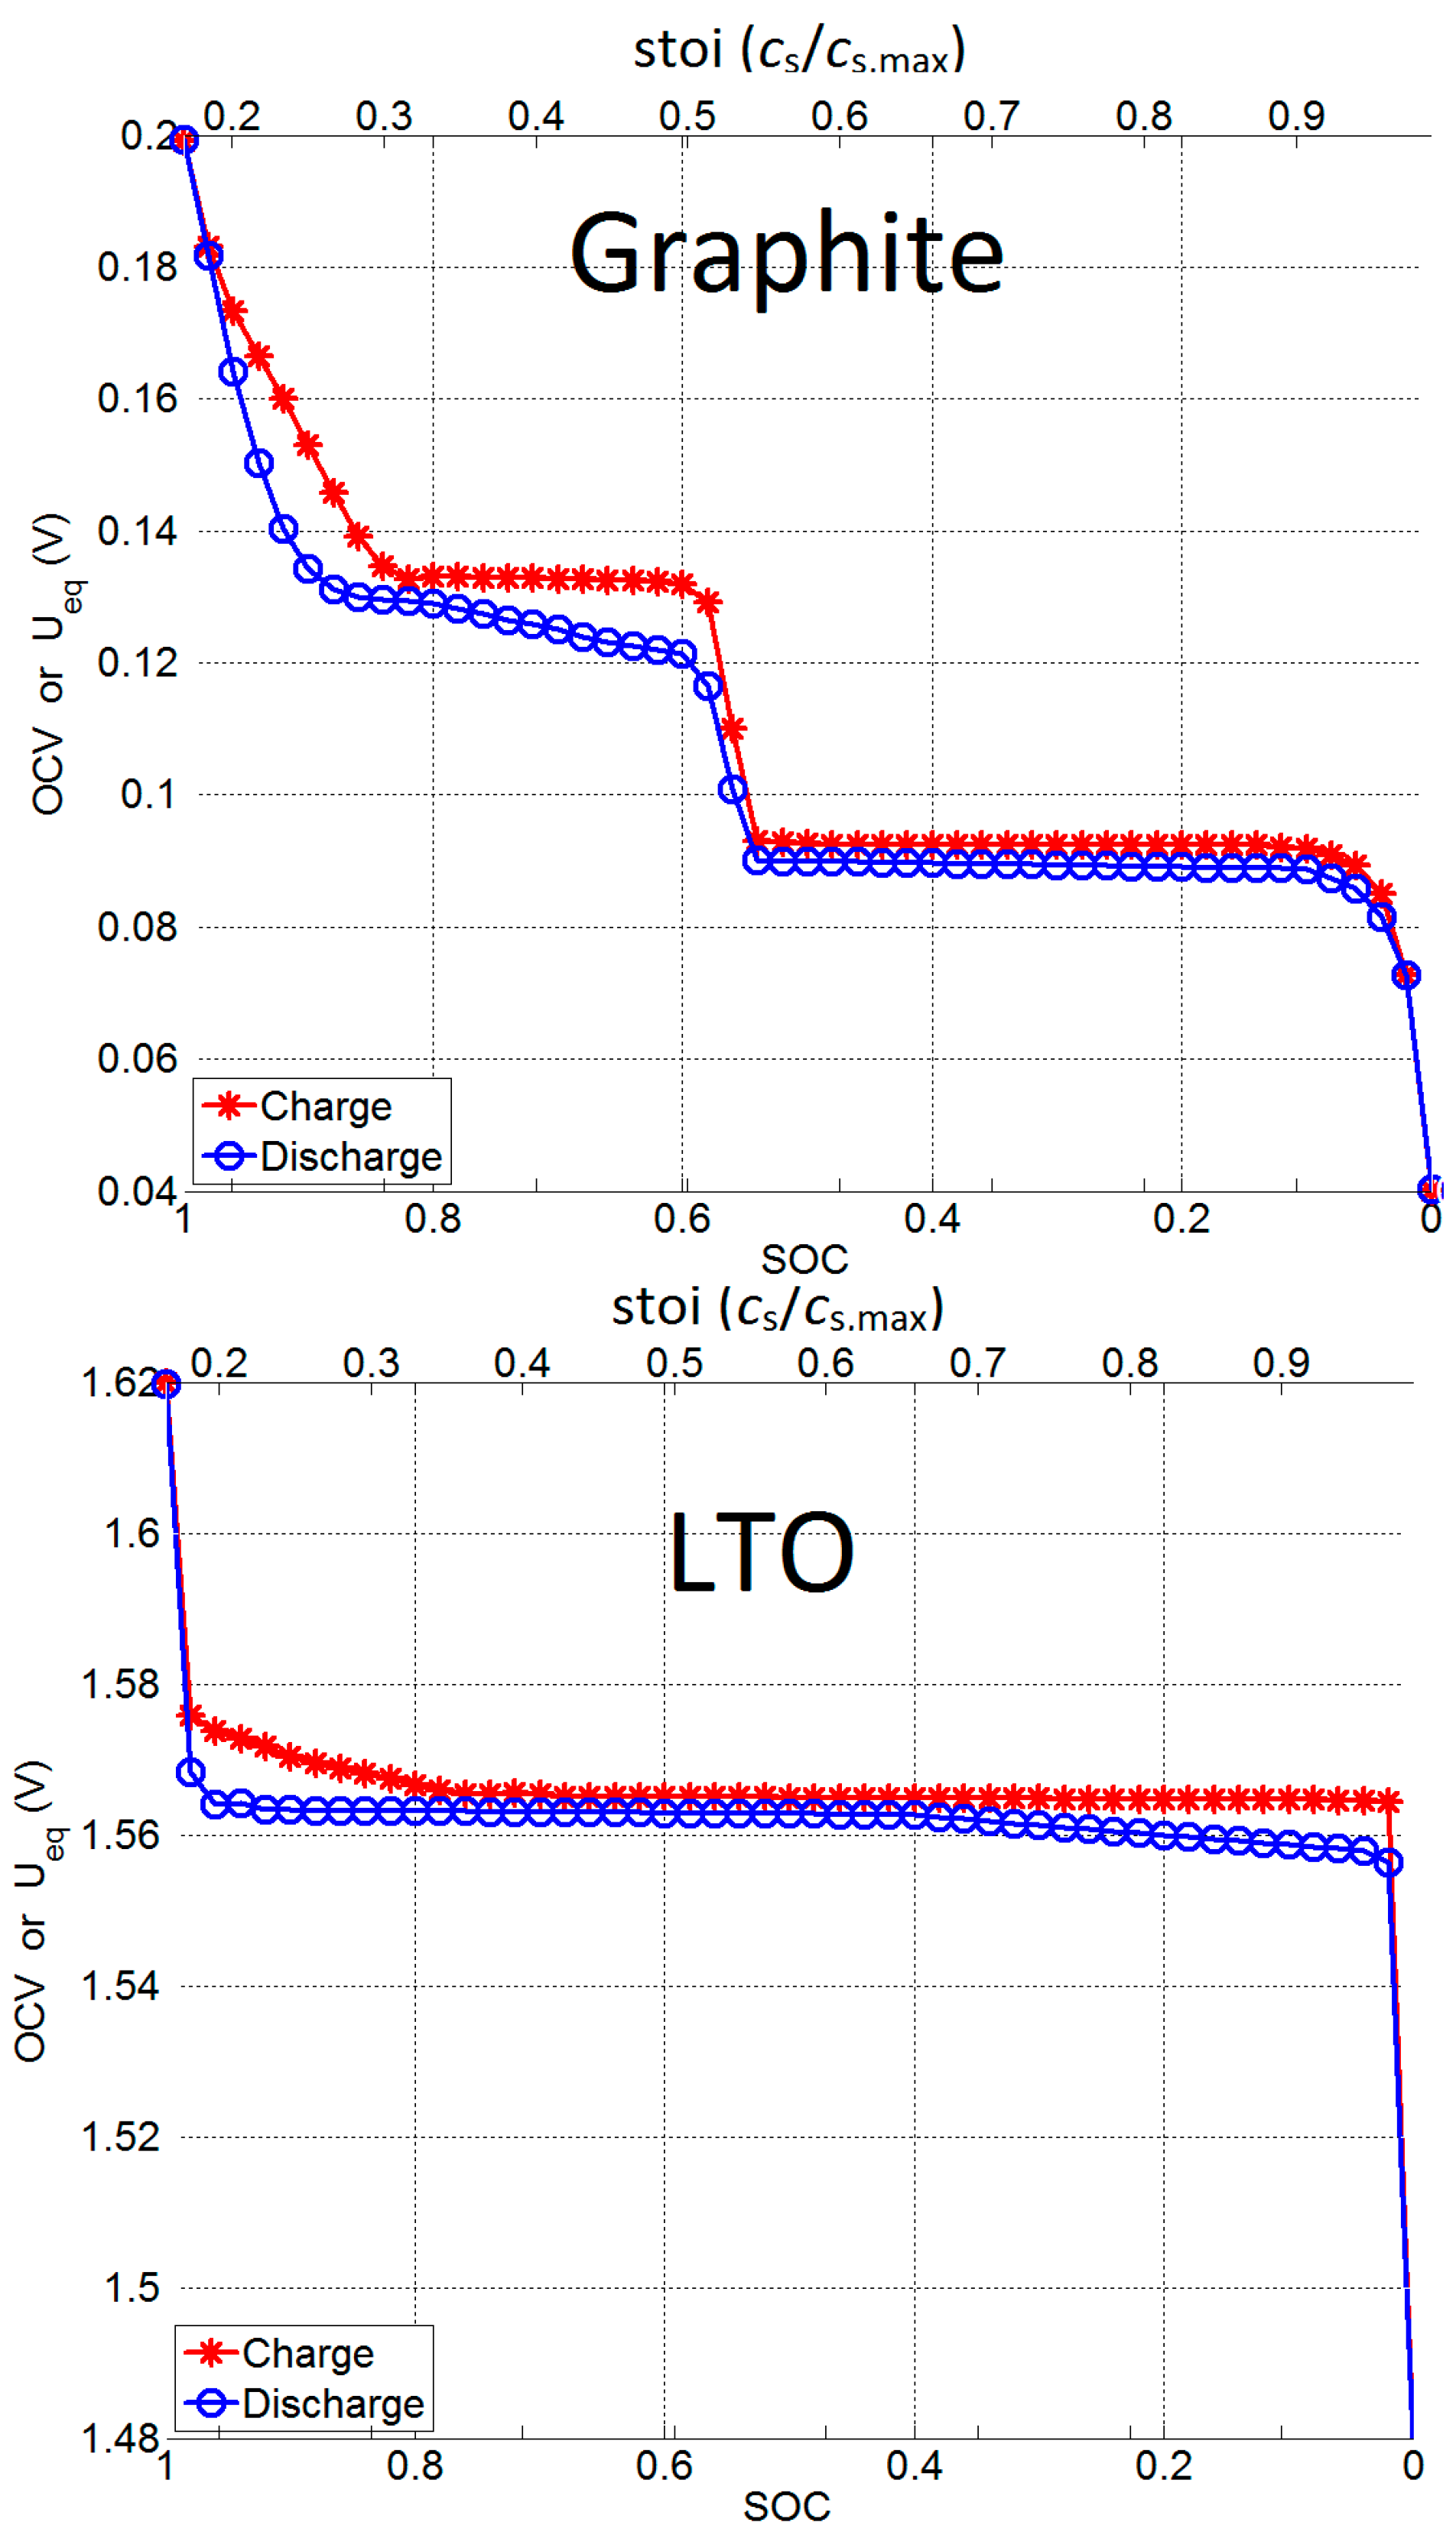
2.1.2. Open Circuit Voltage (OCV) Measurement

The OCV of a battery is defined as the difference of standard electrode potential between the cathode and anode, which is determined by the free energy of the electrochemical reaction inside the battery. The OCV of a particular cell has a strong nonlinear one-to-one relationship with the state of charge (SOC). Therefore, OCV can be used as a direct measurement of the remaining capacity of the battery. OCV can only be measured after the cell has been subject to an adequate resting time, ending only when the cell has reached a state of internal equilibrium.
A detailed relation between OCV and SOC for a given material can be obtained by conducting an OCV test on a half-cell containing that material. The first step is to fully charge the battery to OCVmax, which is done by charging and then holding the terminal voltage at OCVmax until the current into the cell drops to a negligible value (less than 0.001 C). A cell with an OCV equal to OCVmax is defined to have a SOC of 100%. Next, the cell is discharged with a constant current discharge pulse by approximately 2% SOC and subsequently allowed to rest for 10 h. The voltage, OCVdis, is recorded at the end of this resting period. After repeating this process about 50 times, the terminal voltage will eventually drop to OCVmin. When this happens, the terminal voltage is held at OCVmin until the current drops to a negligible value (less than 0.001 C). A cell with an OCV equal to OCVmin is defined to have a SOC of 0%. After this full discharge, the battery is charged with about 2% SOC constant current charge pulses, each followed with a resting period of 10 h. The voltage at the end of each of these resting periods, OCVch, is recorded. After about 50 charge pulses, the SOC will return to 100% and the OCV will equal OCVmax again. The values of OCVmax and OCVmin are defined for each electrode material in the table below. The curves of OCVdis and OCVch are plotted versus SOC in Figure 1.
In general, OCV increases with increasing SOC, but it should be noted that OCVch measured in the charge process is always higher than OCVdis measured in the discharge process because of the hysteresis effect [28,29]. In the next section, the constant current discharge simulations use OCVdis and the constant current charge simulations use OCVch.
For half-cells which have lithium metal as the negative electrode, the cell OCV is same as the equilibrium potential of the positive electrode (graphite or LTO) because the potential of lithium metal is always 0 V vs. Li/Li+. Therefore, the OCV versus SOC curves plotted in Figure 1 can be used to represent the relation between Ueq and stoichiometric number (stoi), which is part of the electrochemical model, as shown in Equation (9). The model will take the input of stoi (or SOC) and calculates the corresponding Ueq based on their relation in Figure 1. The maximum and minimum values of OCV and stoi are summarized in Table 1.
We have also used an alternative method to obtain OCV curves, which is introduced and discussed in Appendix B.

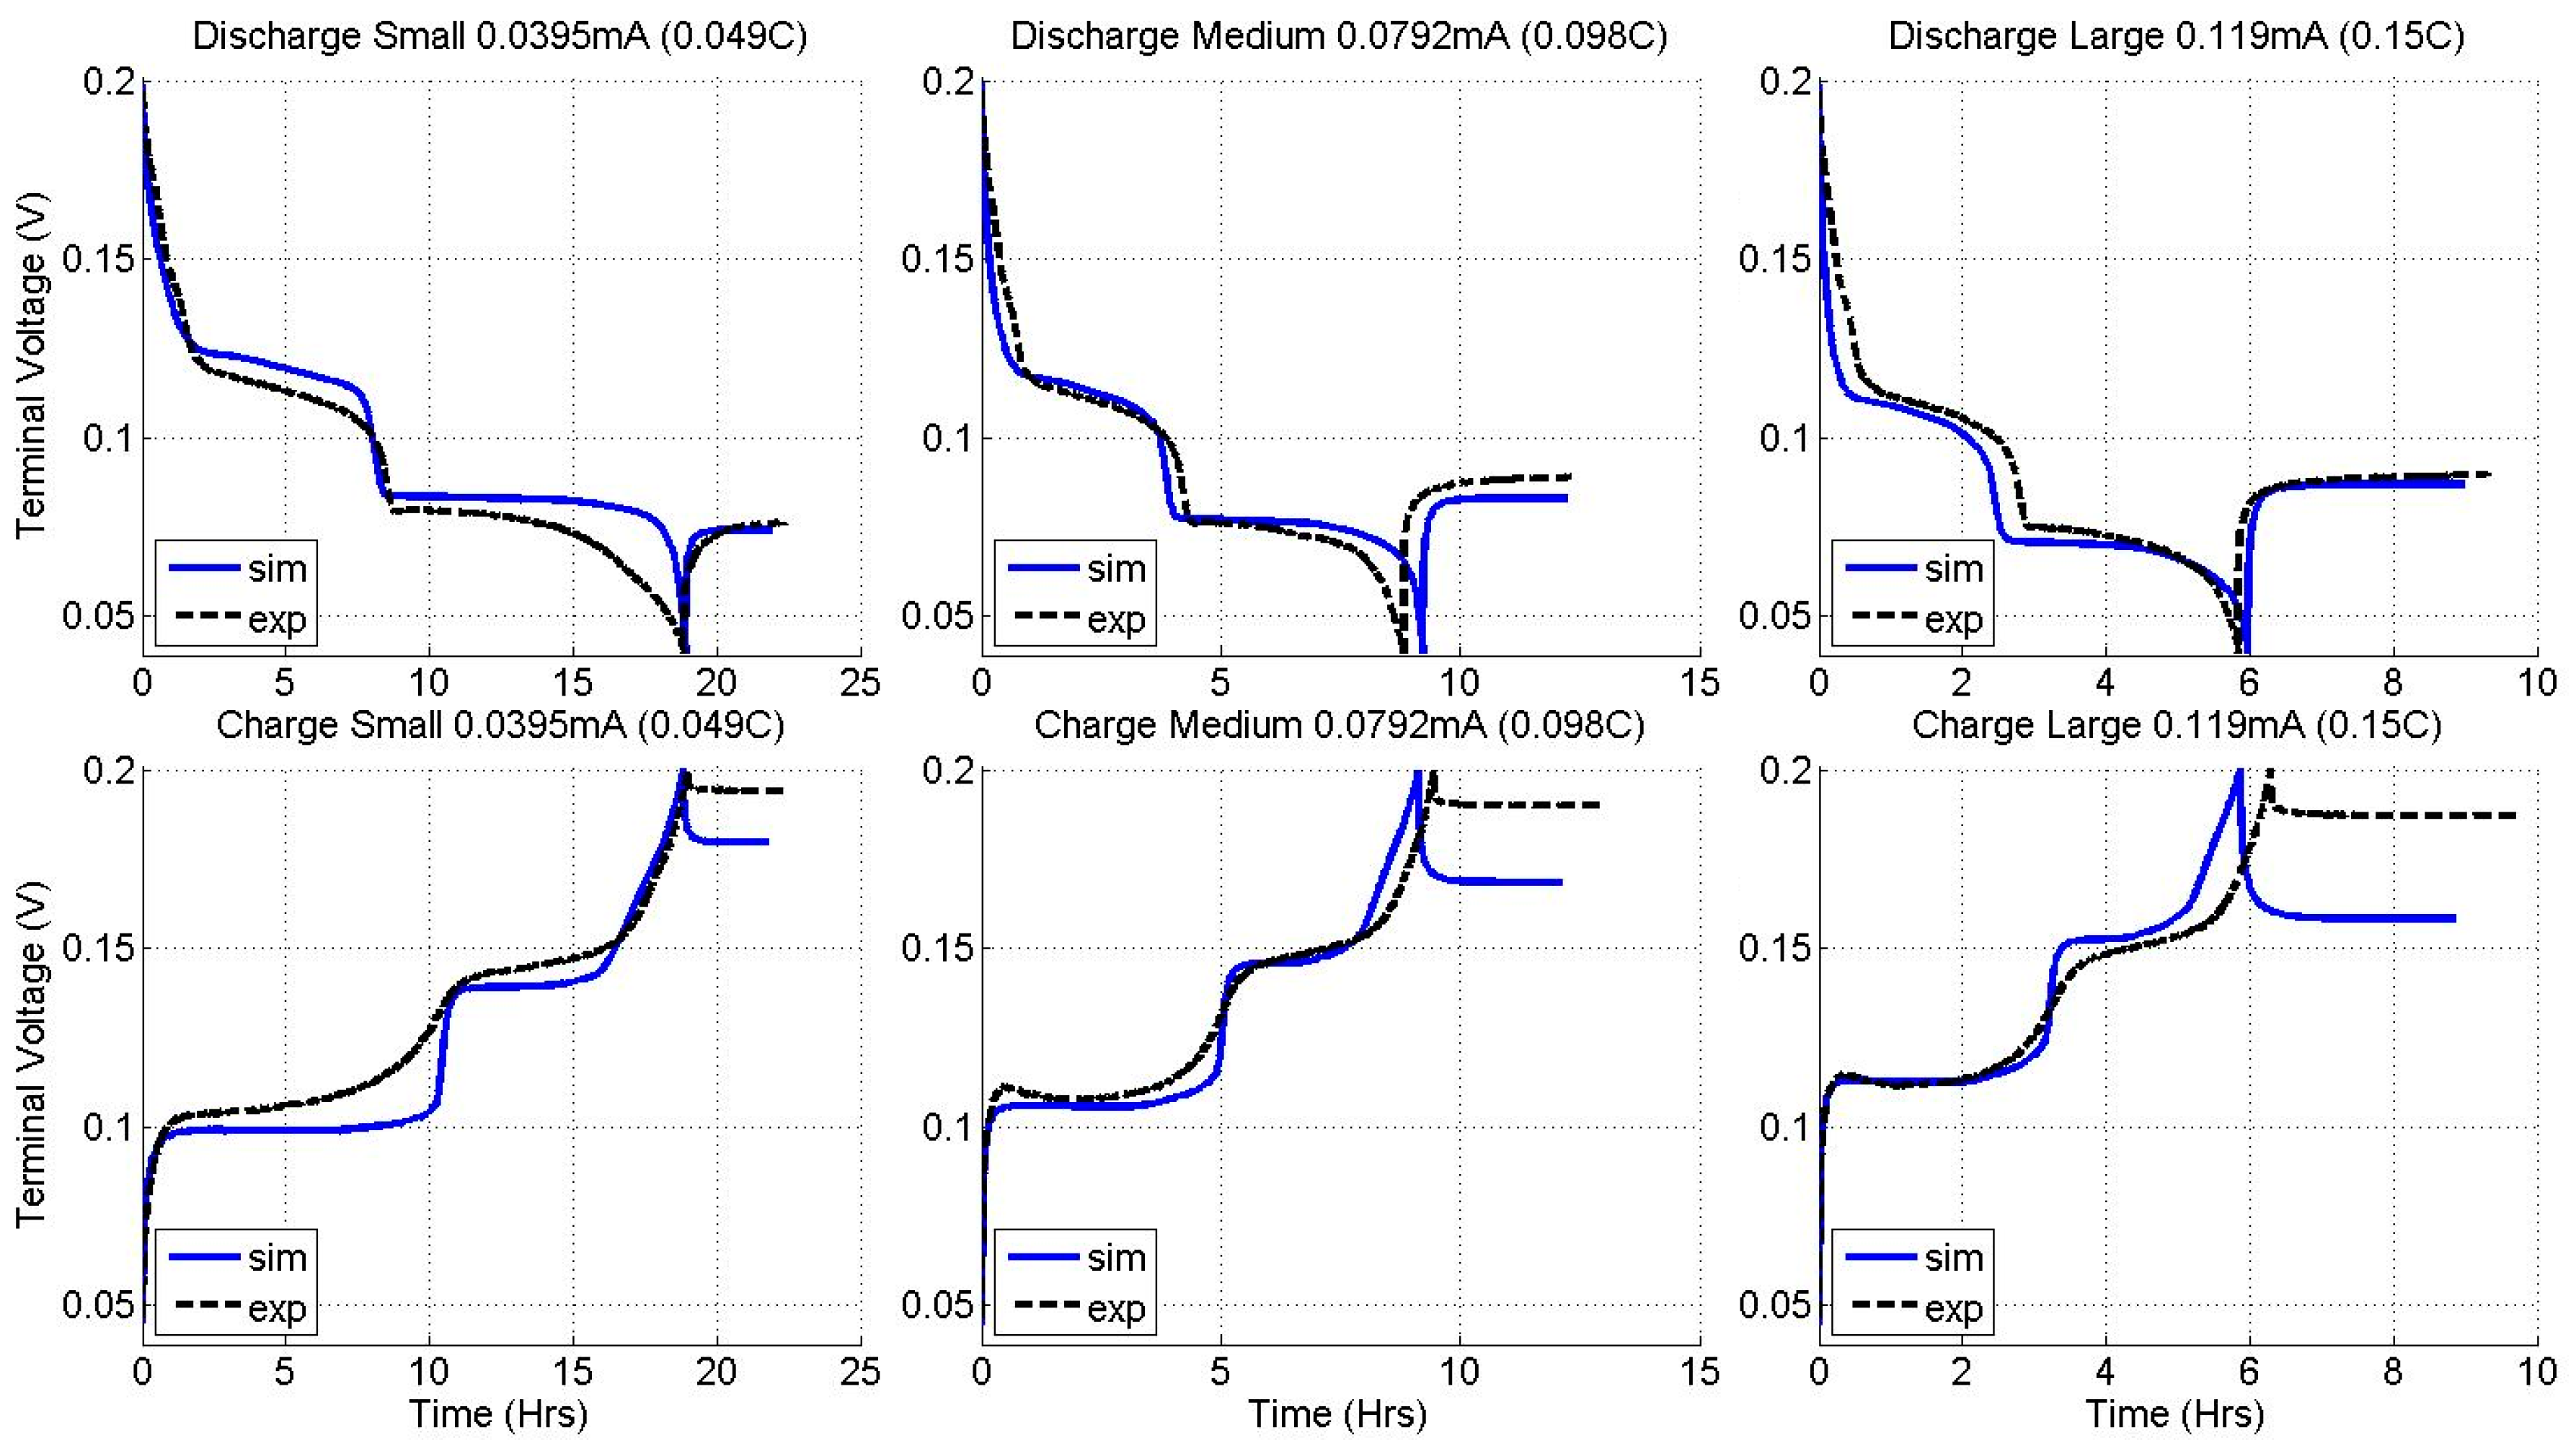
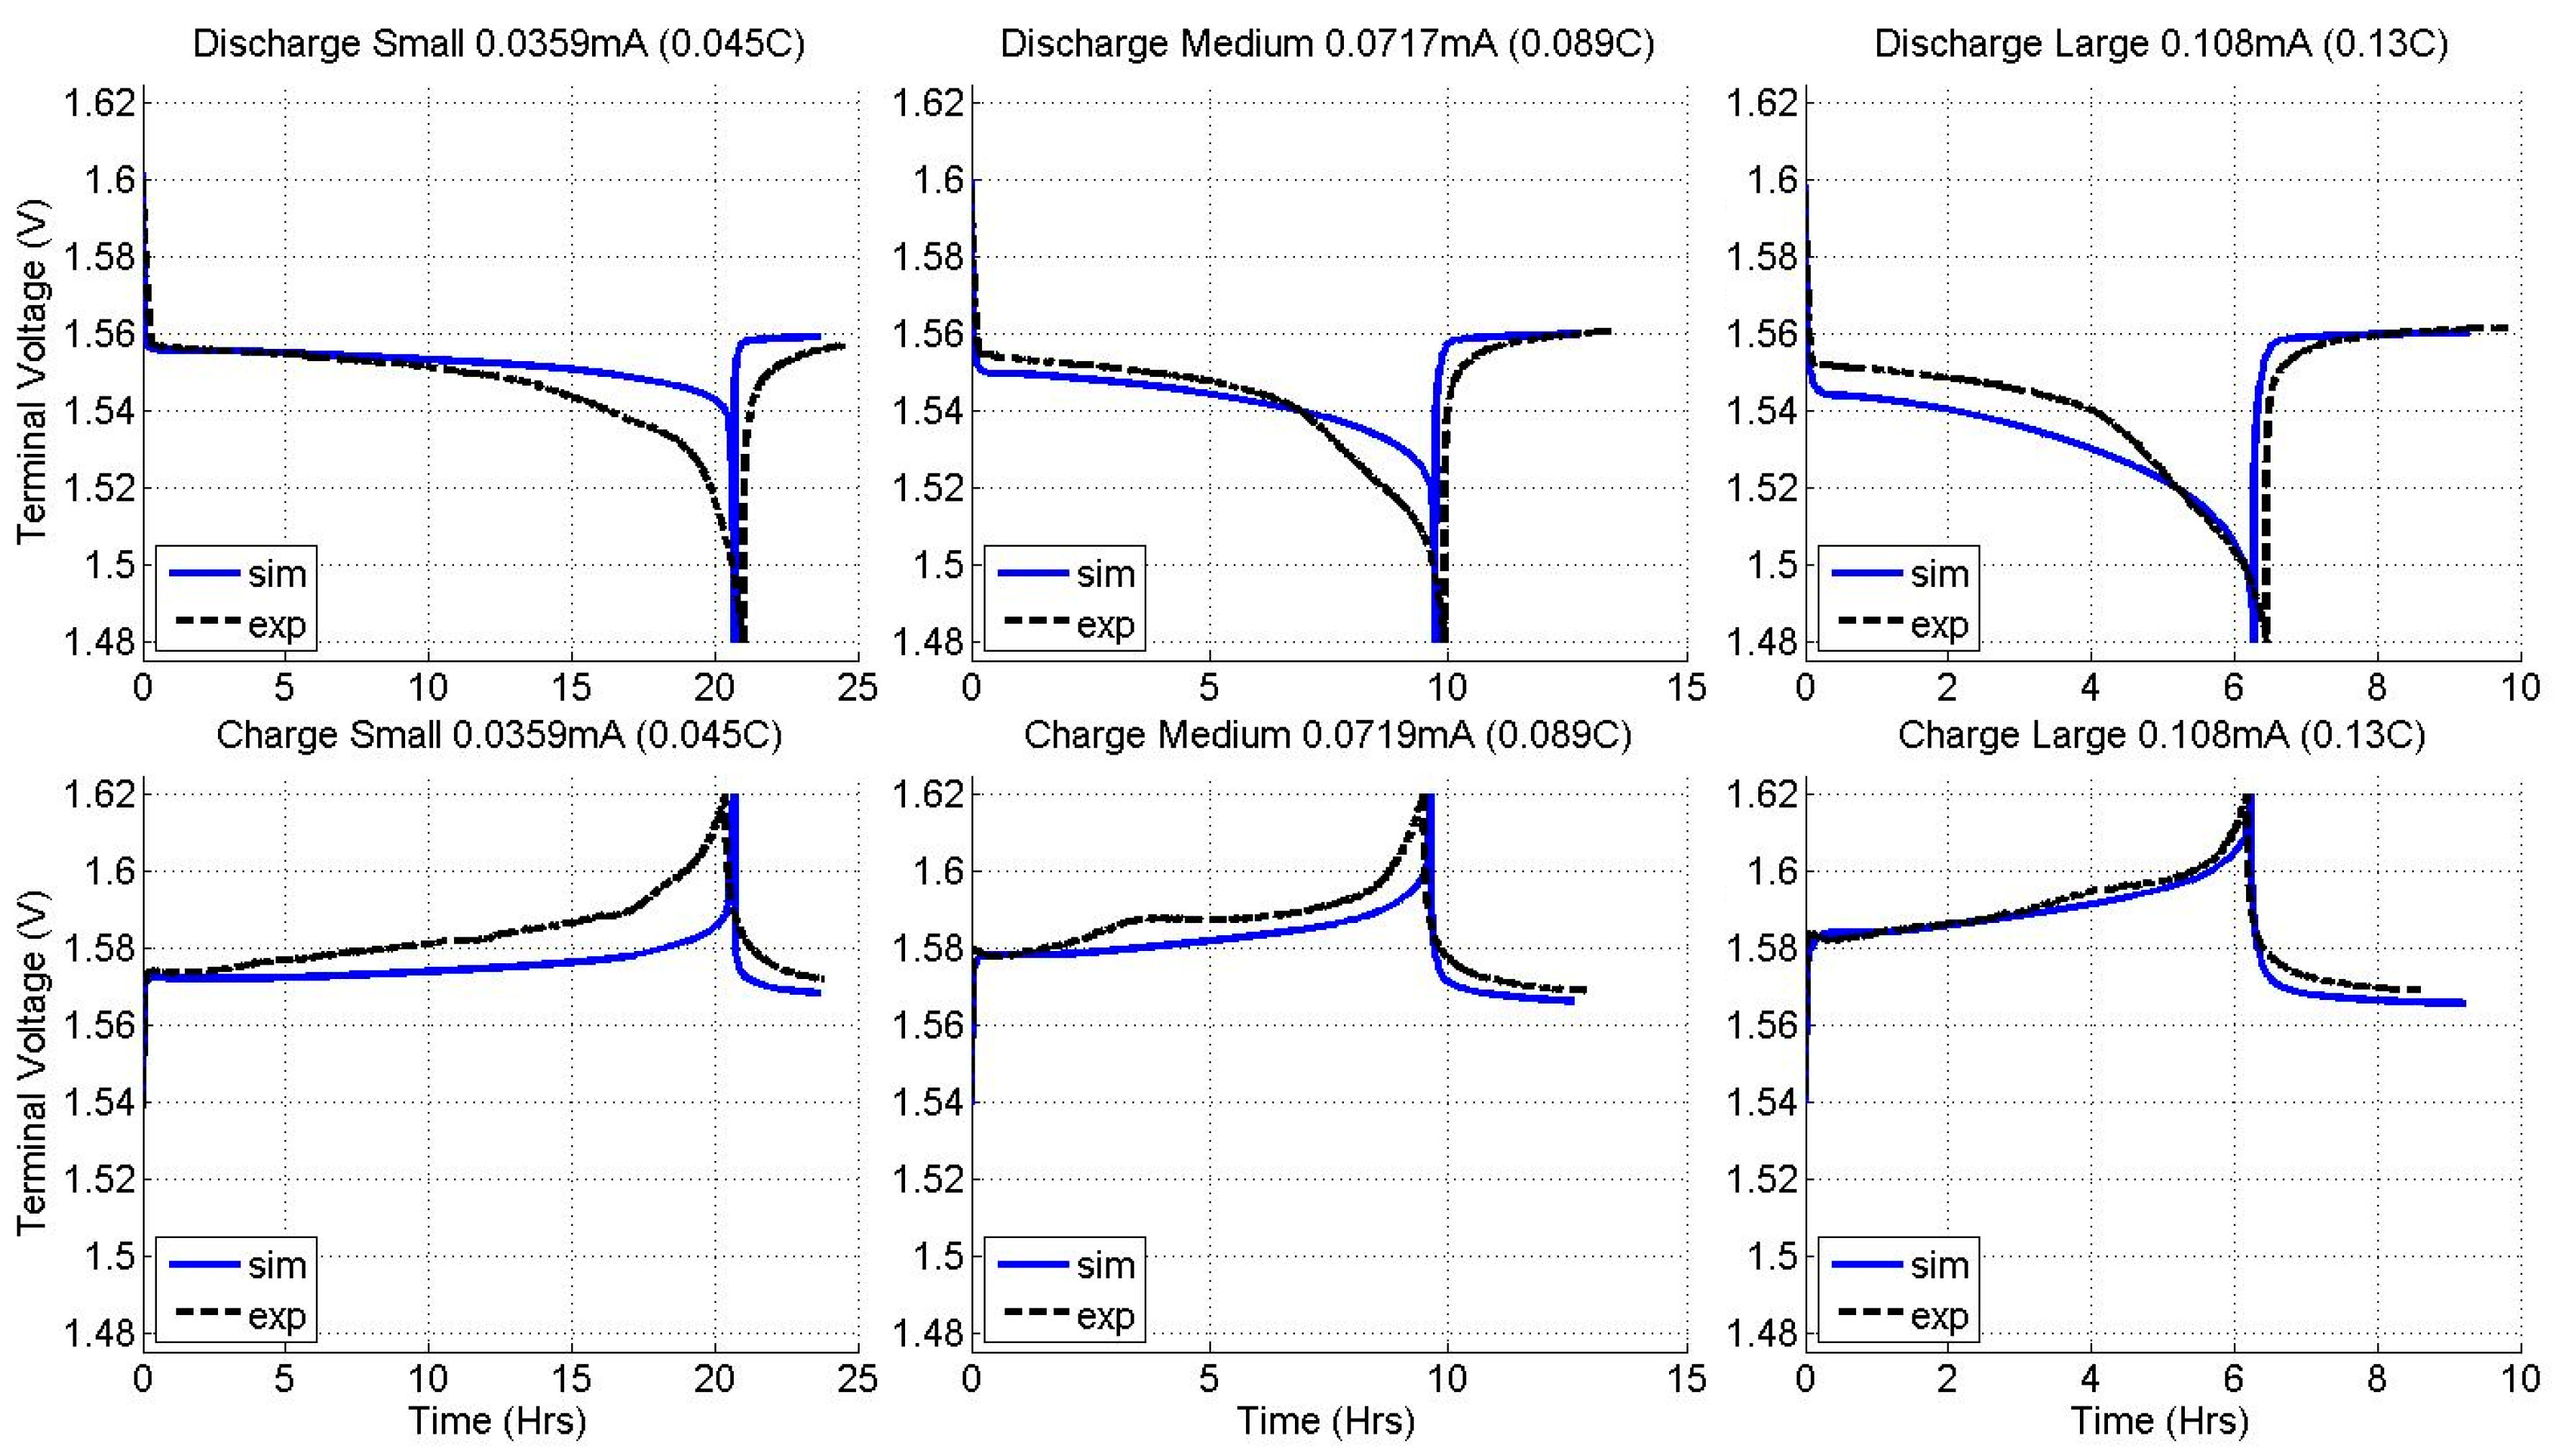
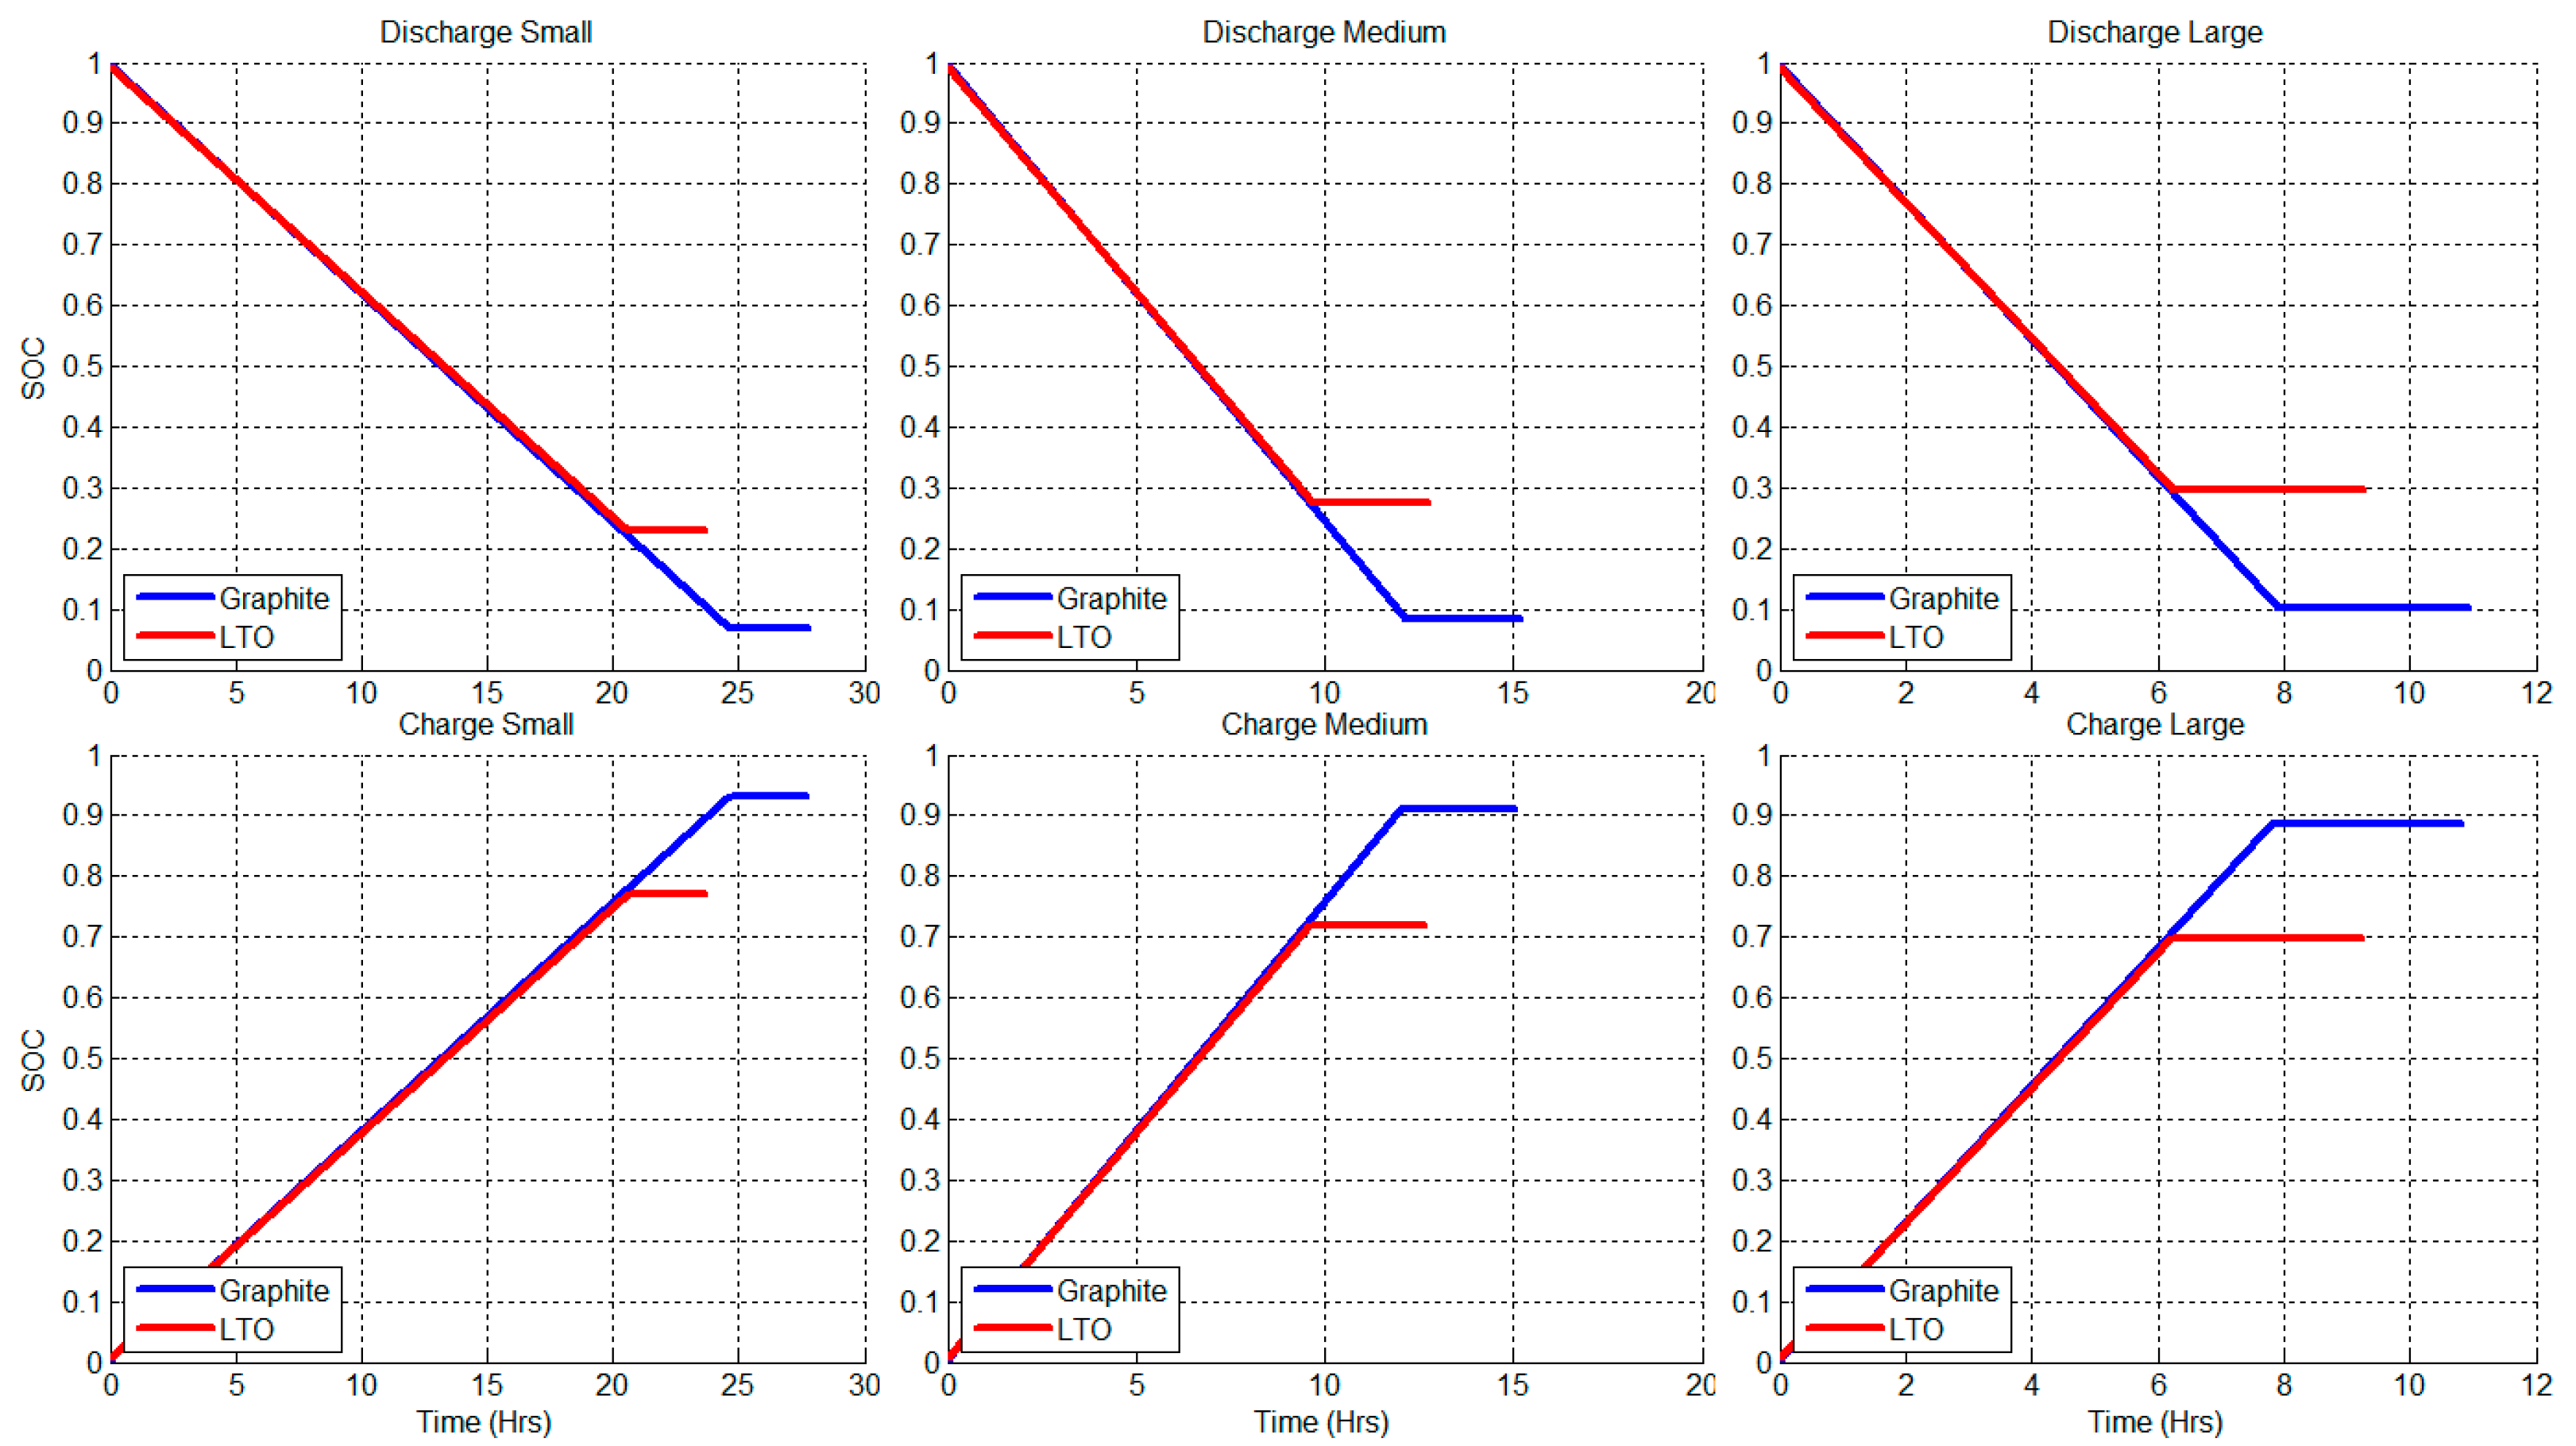
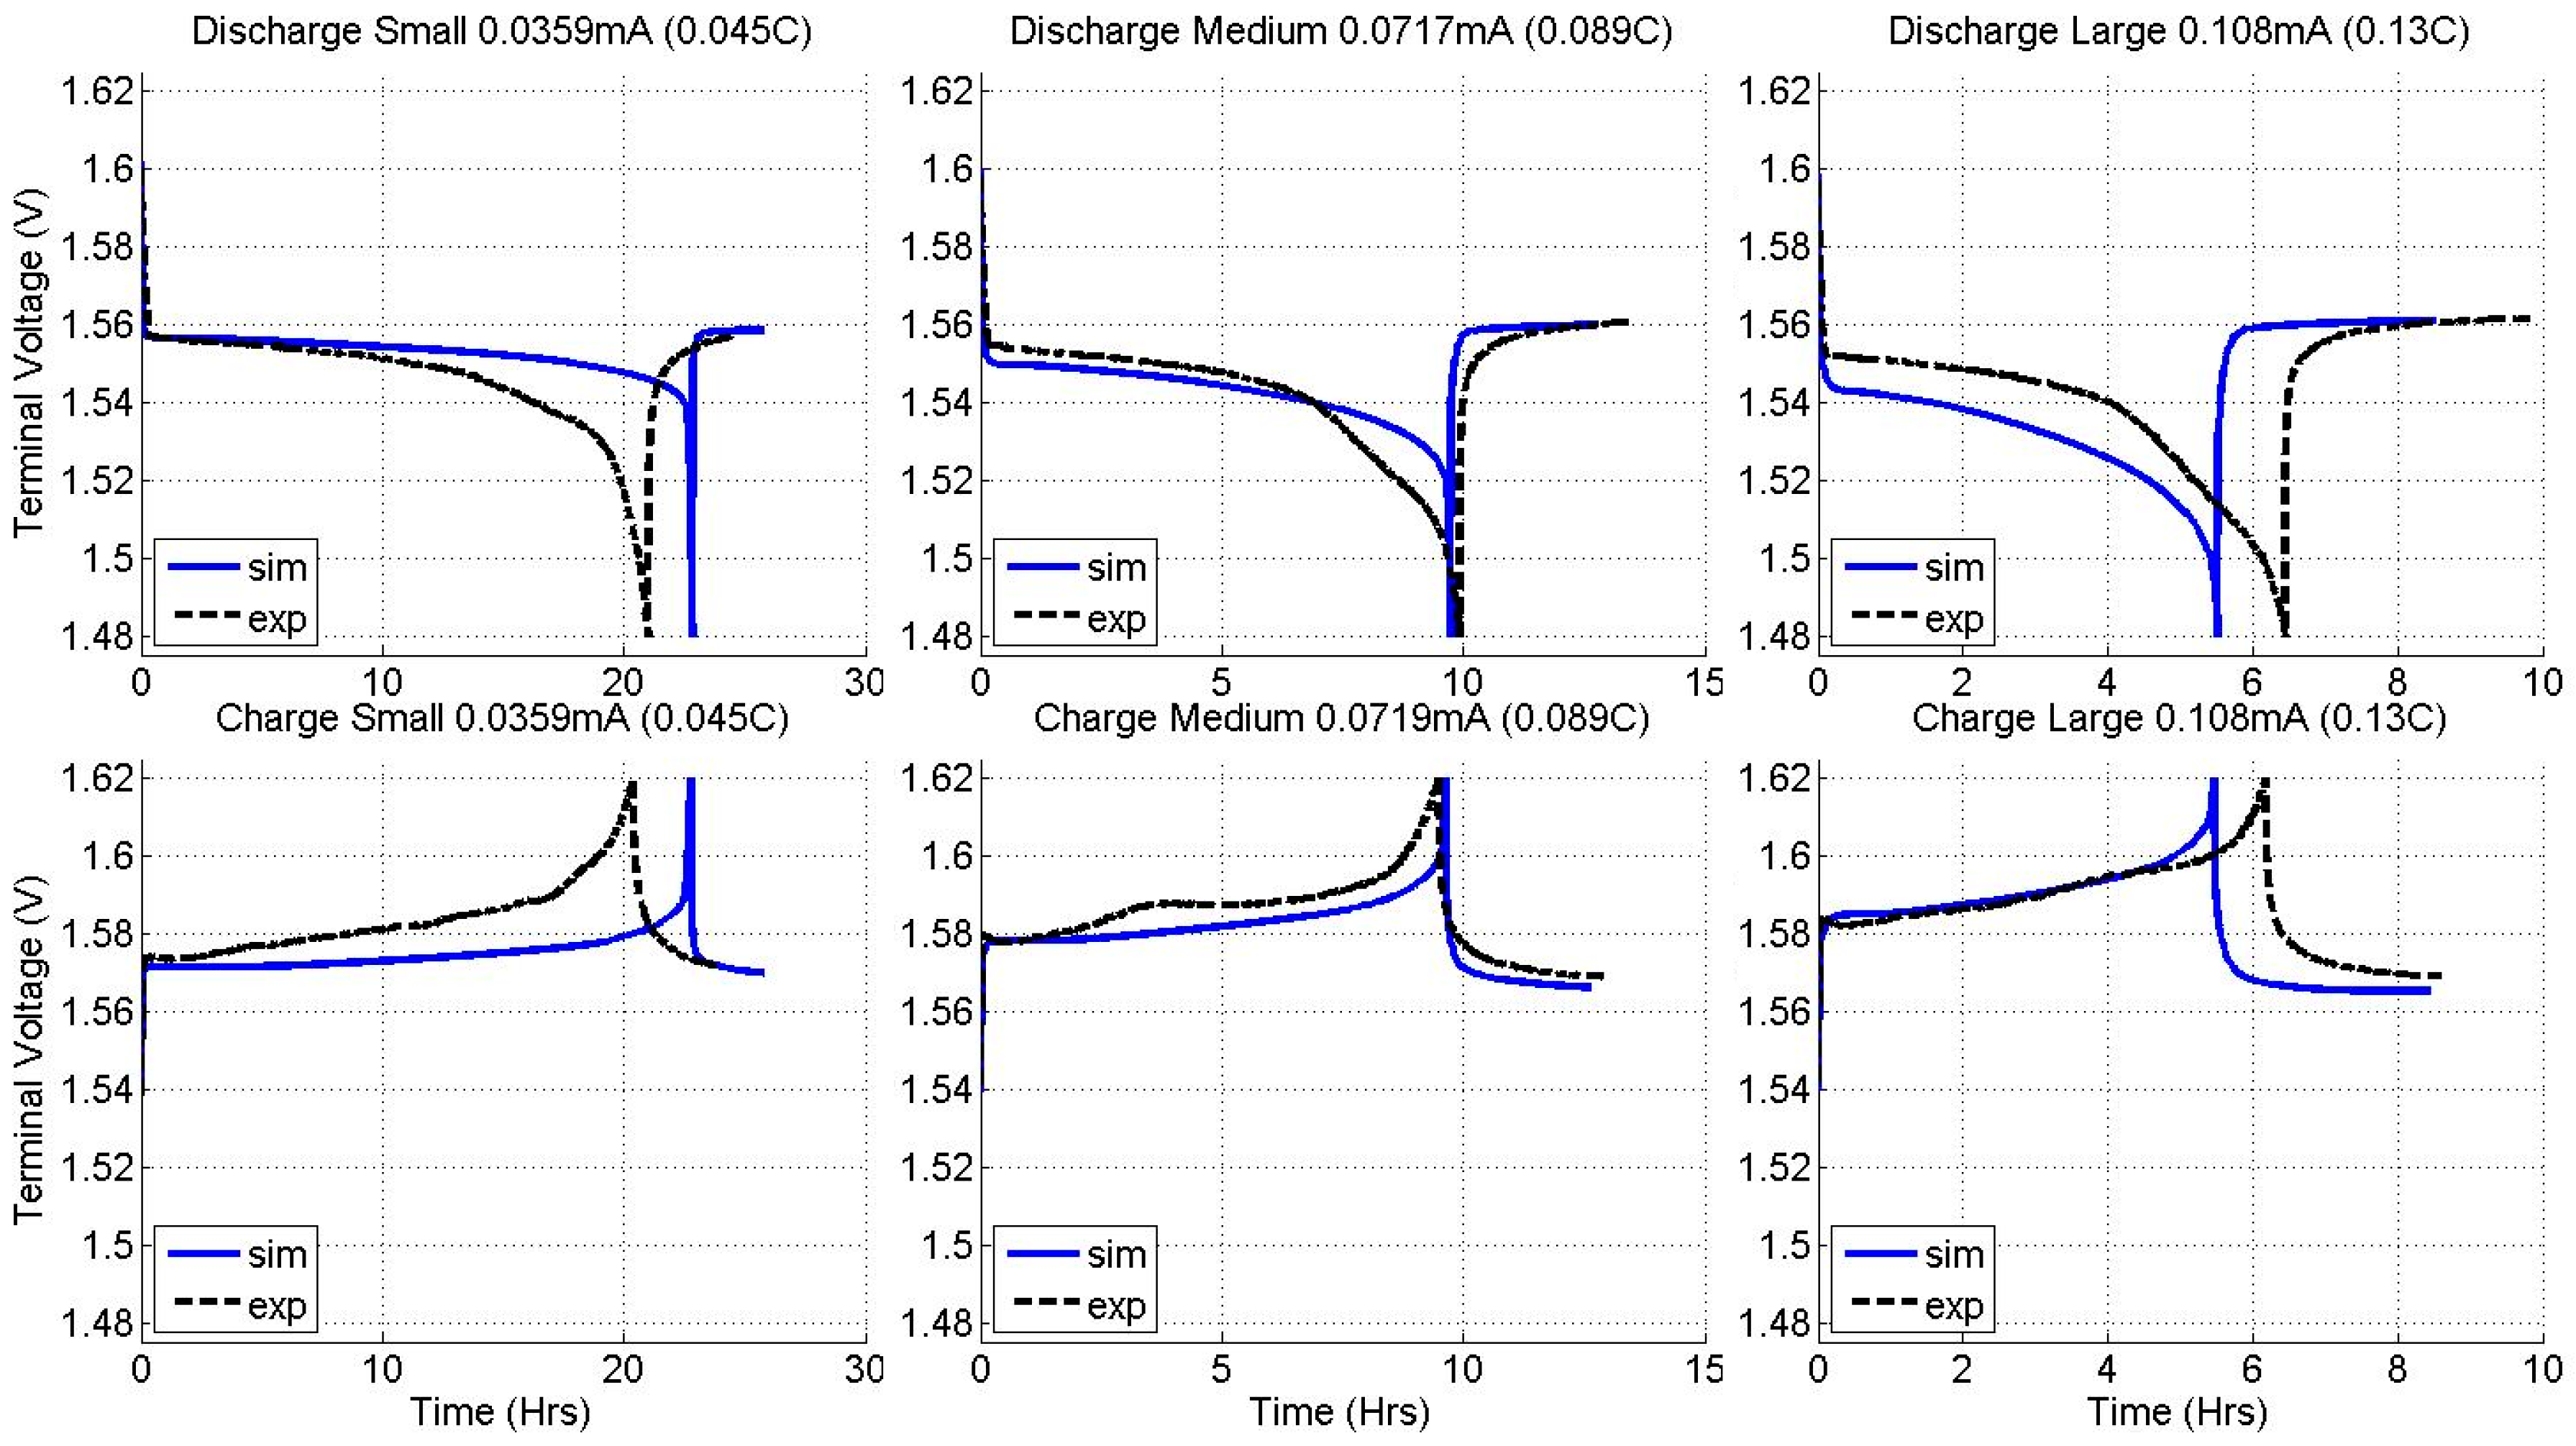
2.2. Constant Current Charge/Discharge and Model Validation

Table 2 below lists all of the model parameters obtained for our graphite and LTO half-cells. The benefit of modeling half-cells fabricated in-house is that many of the needed parameters are known from the fabrication process and can be directly used. Such parameters include the current collector surface area, thickness of the anode material and separator, mass of composite anode, averaged ion concentration in the electrolyte, etc. In addition, the ohmic resistance of the lithium metal, copper anode current collector, and stainless steel coin cell casing pieces can be calculated based on their dimensions and electrical conductivities. The cell capacity is identified in the OCV test procedure by integrating the current from 100 to 0% SOC.
Unfortunately, there are still several parameters that cannot be easily calculated or measured. Some of these parameters may be borrowed from relevant literature or based on reasonable assumptions, while others may have distinctive values since the cells were fabricated in-house. These latter parameters may be found by correlating the simulation results to experimental test data.
To fully identify these distinctive parameters for our cells, several constant current charge and discharge curves were obtained from the model as well as from experimental testing on our cells. These curves were obtained for three different current rates: a small current rate around 0.05 C, a medium current rate around 0.1 C, and a large current rate around 0.15 C. These discharges started from 100% SOC and ended when the cell terminal voltage dropped to OCVmin. Similarly, the charges started from 0% SOC and ended when the cell terminal voltage rose to OCVmax.
Figure 2 compares the charge and discharge curves from the experimental tests (in black) and the model (in blue) of the graphite half-cells after the distinctive parameters in the model were given satisfactory values. During discharge and charge, the change of terminal voltage follows the trends of the graphite OCV, as shown in Figure 1. The duration of the discharge or charge is dependent on the current rate used. This amounts to about 19 h at 0.049 C, 9 h at 0.098 C and 6 h at 0.15 C. After a complete discharge or charge, the plots also include a 3-h resting period where the voltage tends back to the OCV. The recovered voltage after discharge is higher than OCVmin (0.04 V) and the recovered voltage after charge is lower than OCVmax (0.20 V). This indicates that the capacity of the cell was not fully utilized due to the overpotentials, which will be analyzed in detail in the following section.
The values of four model parameters have been tuned to correlate the model with the graphite half-cell test data. These parameters are the volume fractions of active and inactive materials in the composite anode (εs,an and εin,an) and the lithium ion diffusion coefficients in the solid phase and electrolyte (Ds and De). The final values for these parameters are included in Table 2. A comparison of the curves in Figure 2 shows a fair match in voltage and discharge/charge duration, but some discrepancies are observed. For example, after the cell is fully charged, the simulated voltage consistently relaxes to a lower level than the test data. This might be caused by inaccurate OCV data at high SOC.
Figure 3 compares the charge and discharge curves from the experimental tests (in black) and the model (in blue) of the LTO half-cells after the distinctive parameters in the model were given satisfactory values. The change of terminal voltage during the discharge and charge follows the trend of the LTO OCV curve in Figure 1. Unlike graphite, the voltage of LTO changes sharply at the beginning and end of the discharge or charge, but is relatively flat in the middle. The duration of the discharge or charge is about 20 h at 0.045 C, 10 h at 0.089 C, and 6 h at 0.13 C. After each discharge or charge, the cell voltage recovers back to the OCV during the subsequent 3-h-rest. The recovered voltage after discharge is much higher than OCVmax and the recovered voltage after charge is much lower than OCVmin. This implies that the overpotential of LTO at the end of discharge or charge is very large, which will be analyzed in the next section as well.
Tuning the four LTO model parameters (εs,an, εin,an, Ds and De) did not fully correlate the model with the test data at all three different current rates. Although the model had a good match at the medium current rate, as shown in Figure A3 in Appendix C, it overestimates the utilization at the small current rate and underestimates the utilization at the large current rate. Interestingly, this finding is very similar to what was reported by Srinivasan [38], implying that the LTO cell has an enhanced solid phase diffusion at large current. As current increases, it is believed that small LTO particles undergo large changes in concentration faster than large particles, since the large particles have a lower diffusion rate inside the particle due to the formation of a lithium rich shell. Therefore, the effective average size of the utilizable LTO particles tends to decrease at increasing current [38,39,40]. In our work, the parameter of particle radius had to be regarded as current dependent and the necessary adjustments are provided in Table 3. After these adjustments were made, the simulation could correlate well with the test data for all three discharge and charge current rates. This included good matches in both the discharge or charge durations and the relaxation voltage profiles. The simulation also predicts reasonable voltages during the discharge or charge, but there are some discrepancies especially for the low current rate charge and high current rate discharge, which are probably due to the limitations of the model or difficulties in the cell fabrication process. The established pseudo 2D model is not a thorough model which does not cover all possible parameter variations such as particle size distribution, coating thickness inconsistency and material mixture non-uniformity. These variations are unavoidable especially for half-cell assembled in-house compared to the commercial battery manufacturing process.

3. Discussion

This section discusses an analysis of the internal variables of our graphite and LTO half-cells during discharge and charge processes using the electrochemical model. As may be noticed in the previous section, the electrode thickness of the graphite cell is not the same as that of the LTO cell (Table 2), which was caused by a lack of precise control over this parameter in the cell fabrication process. To compare the performance of graphite with that of LTO as fairly as possible, the electrode thickness of the simulated graphite cell was adjusted to match that of the simulated LTO cell. The resultant changes in cell parameters are summarized in Table 4 below.
The simulated voltage of both graphite and LTO cells are plotted in Figure 4. Both cells are discharged and charged at the same C rates, which are 0.045 C, 0.089 C and 0.13 C.

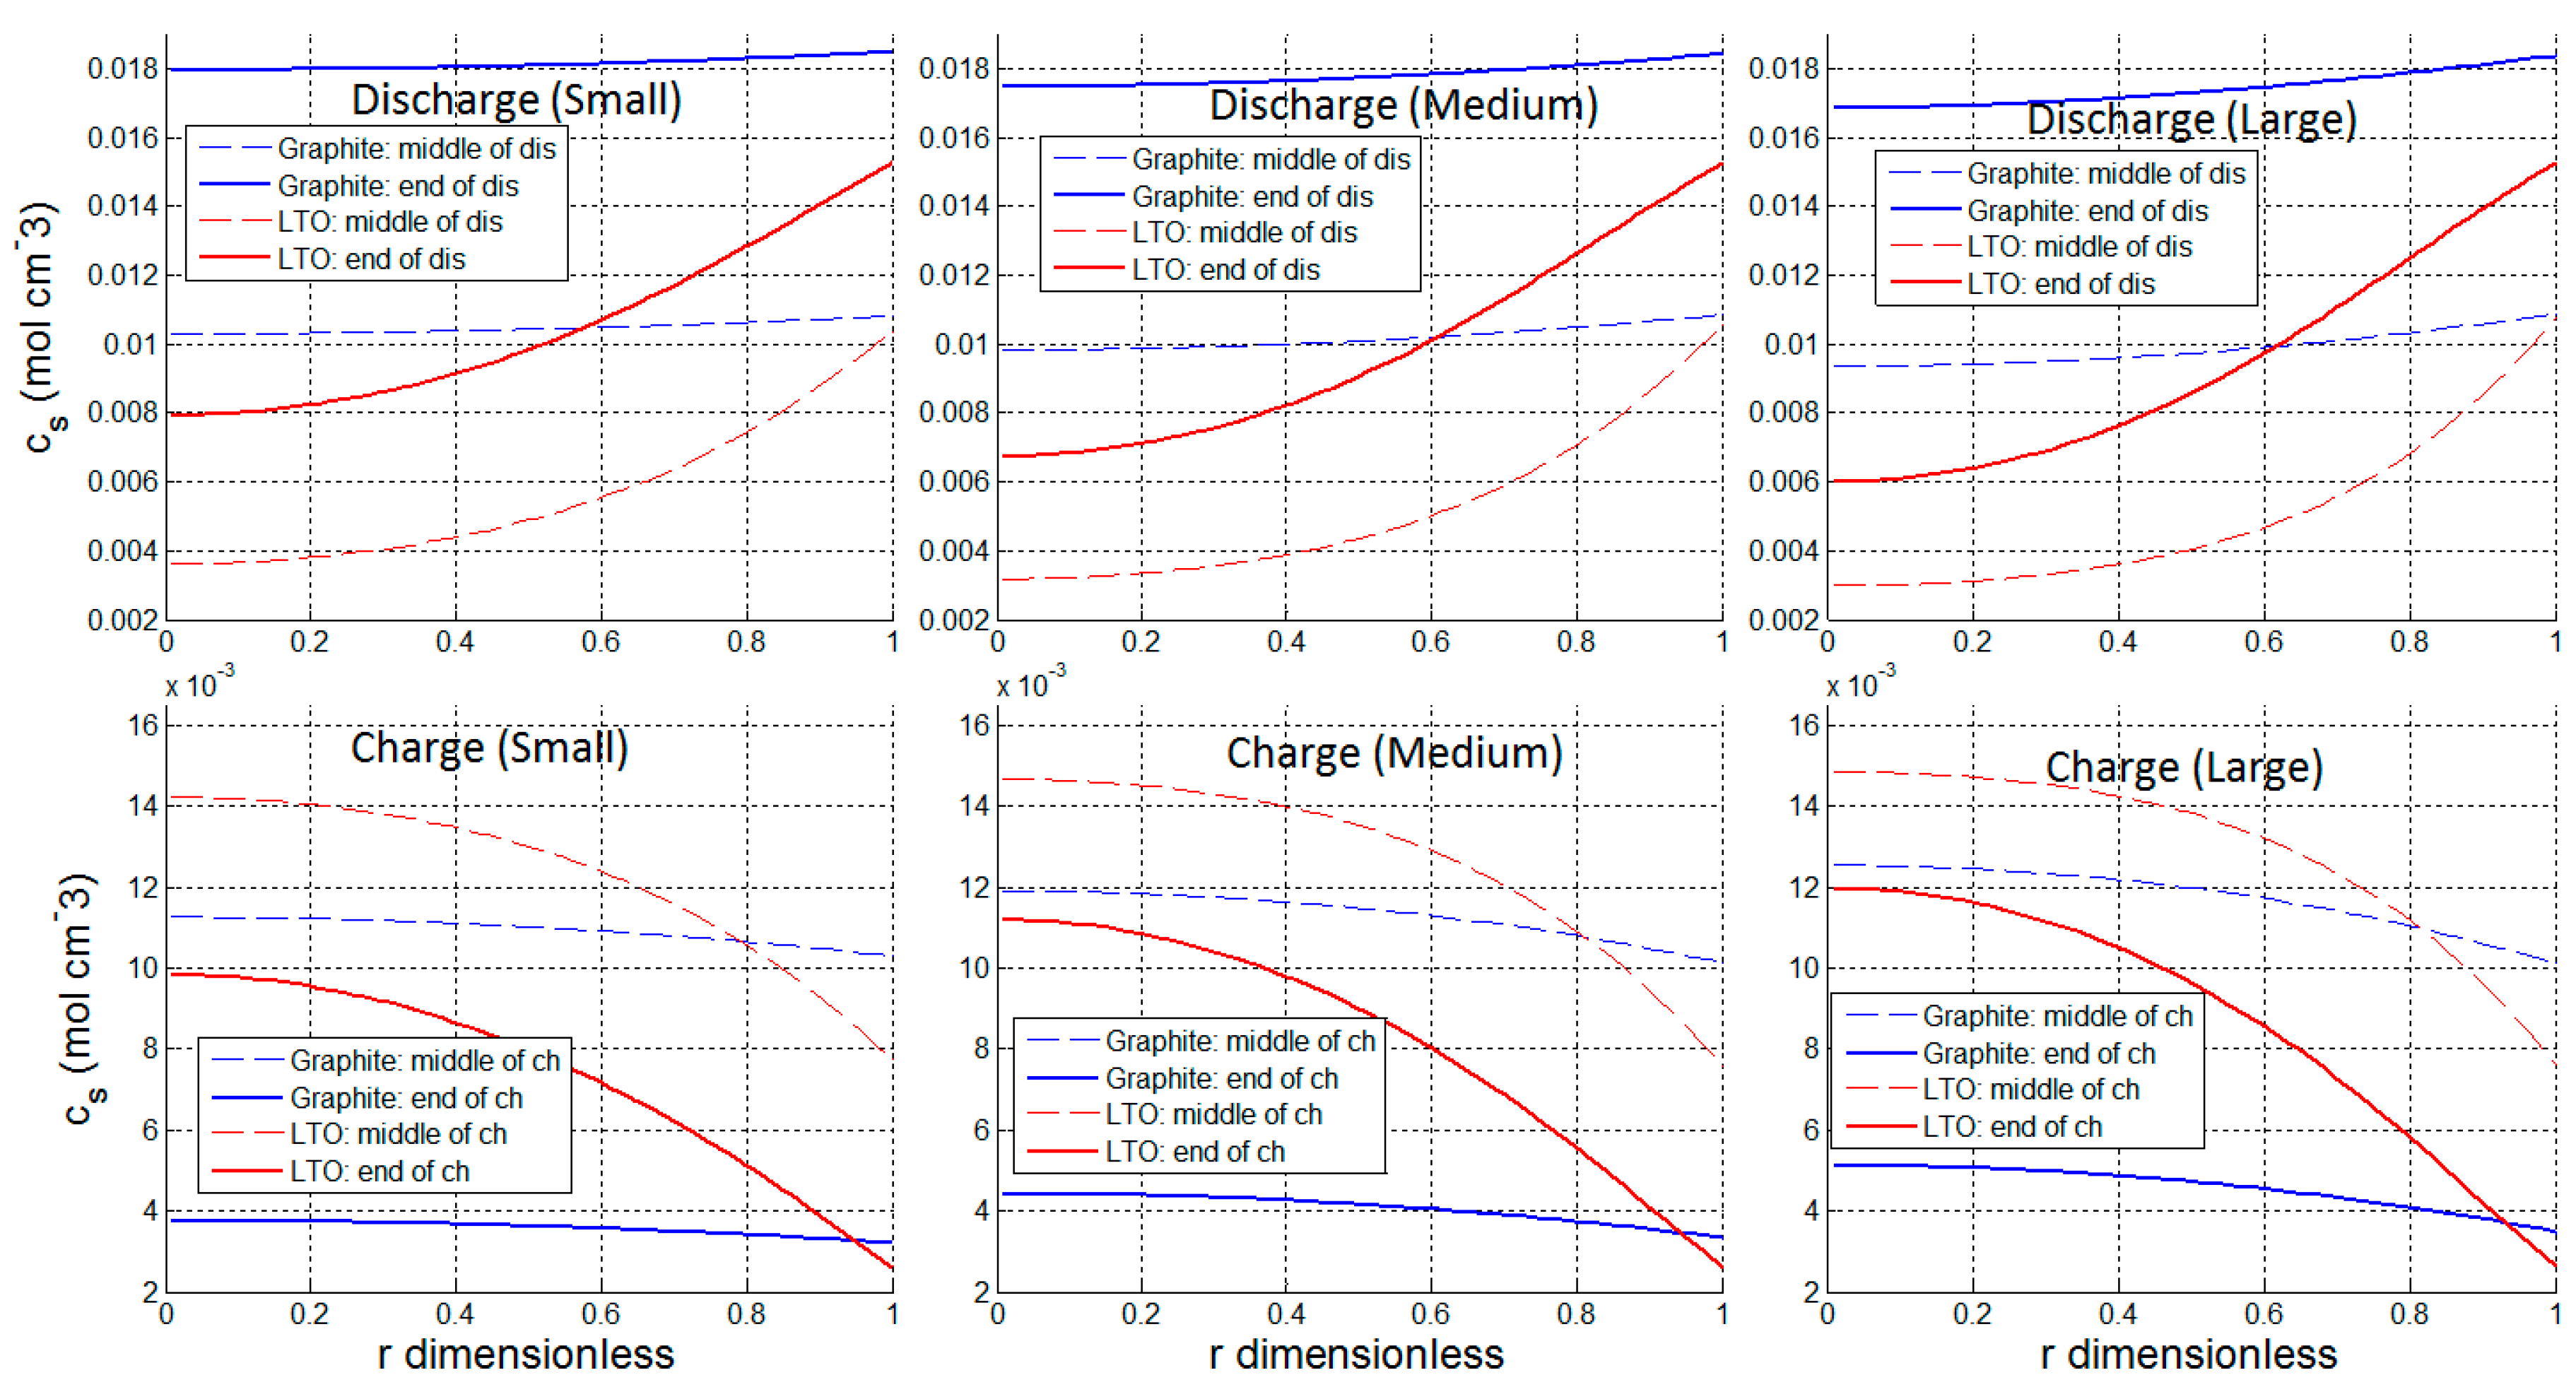
3.1. Utilization and Ion Diffusion in Solid Phase

In Figure 4, the solid curves indicate the terminal voltage of the cell. It shows that the LTO cell always has shorter discharge and charge durations, even though its cell capacity is slightly higher than that of the graphite cell (Table 4). This implies that the utilization of the LTO cell is lower than the utilization of the graphite cell. The relatively low utilization of the LTO cell is further supported by the simulated SOC, as shown in Figure 5. At the end of a discharge, the graphite cell has a SOC around 7–10% while the LTO cell has a SOC around 20–30%, indicating that the LTO cell has more energy that has not yet been utilized. A similar finding applies to the charge processes as well.
In Figure 4, OCV is also plotted with dashed lines for comparison to the terminal voltages. During the entire discharge or charge process, graphite’s OCV changes a lot but LTO’s OCV remains nearly constant, even at the end of the discharge or charge. The voltage difference between the solid and dashed lines indicates the overpotential. At the end of the discharge or charge, the overpotentials of both graphite and LTO reach maximum values, but LTO’s overpotential is the larger of the two.
To explain these phenomena, the ion concentrations in the electrode particles, cs, are plotted in Figure 6. The figure includes two curves for each material, which are the cs versus dimensionless particle radius in the middle and the end of discharge/charge, respectively. During discharge, the ions are transported from the lithium metal to the graphite or LTO electrode and diffuse from the surface of electrode particles toward the center. Therefore, the cs near the surface of the particle is higher than that at the center and the overall cs tends to increase over the course of the discharge. When charging, ions diffuse from center of the electrode particles to the surface and then are transported back to the lithium metal electrode. Therefore, the cs near the surface of the particle is lower than that near the center and the overall cs tends to decrease with charging.
Since LTO has a lower diffusion coefficient for ions in the solid phase (Ds), as shown in Table 2, it has a larger gradient for cs versus particle radius than graphite. The averaged value of cs inside the all of the particles of the electrode determines the SOC of the half-cell, while the cs at the particle surface controls the terminal voltage because it determines the equilibrium potential, Ueq, as shown in Equation (9). For LTO, although the OCV is 1.56 V at the end of a discharge (Figure 4), the cs at the surface of LTO particle has increased to 0.015 mol cm−3 (Figure 6), which is a high value corresponding to a Ueq of 1.50 V (Figure 1). As a result, the gradient of cs caused 0.06 V overpotential in the LTO cell at the end of the discharge. In contrast, for the graphite cell, the gradient of cs only caused a 0.03 V overpotential (Figure 1 and Figure 6). Therefore, the smaller Ds of LTO is what led to its smaller capacity utilization when compared to graphite.

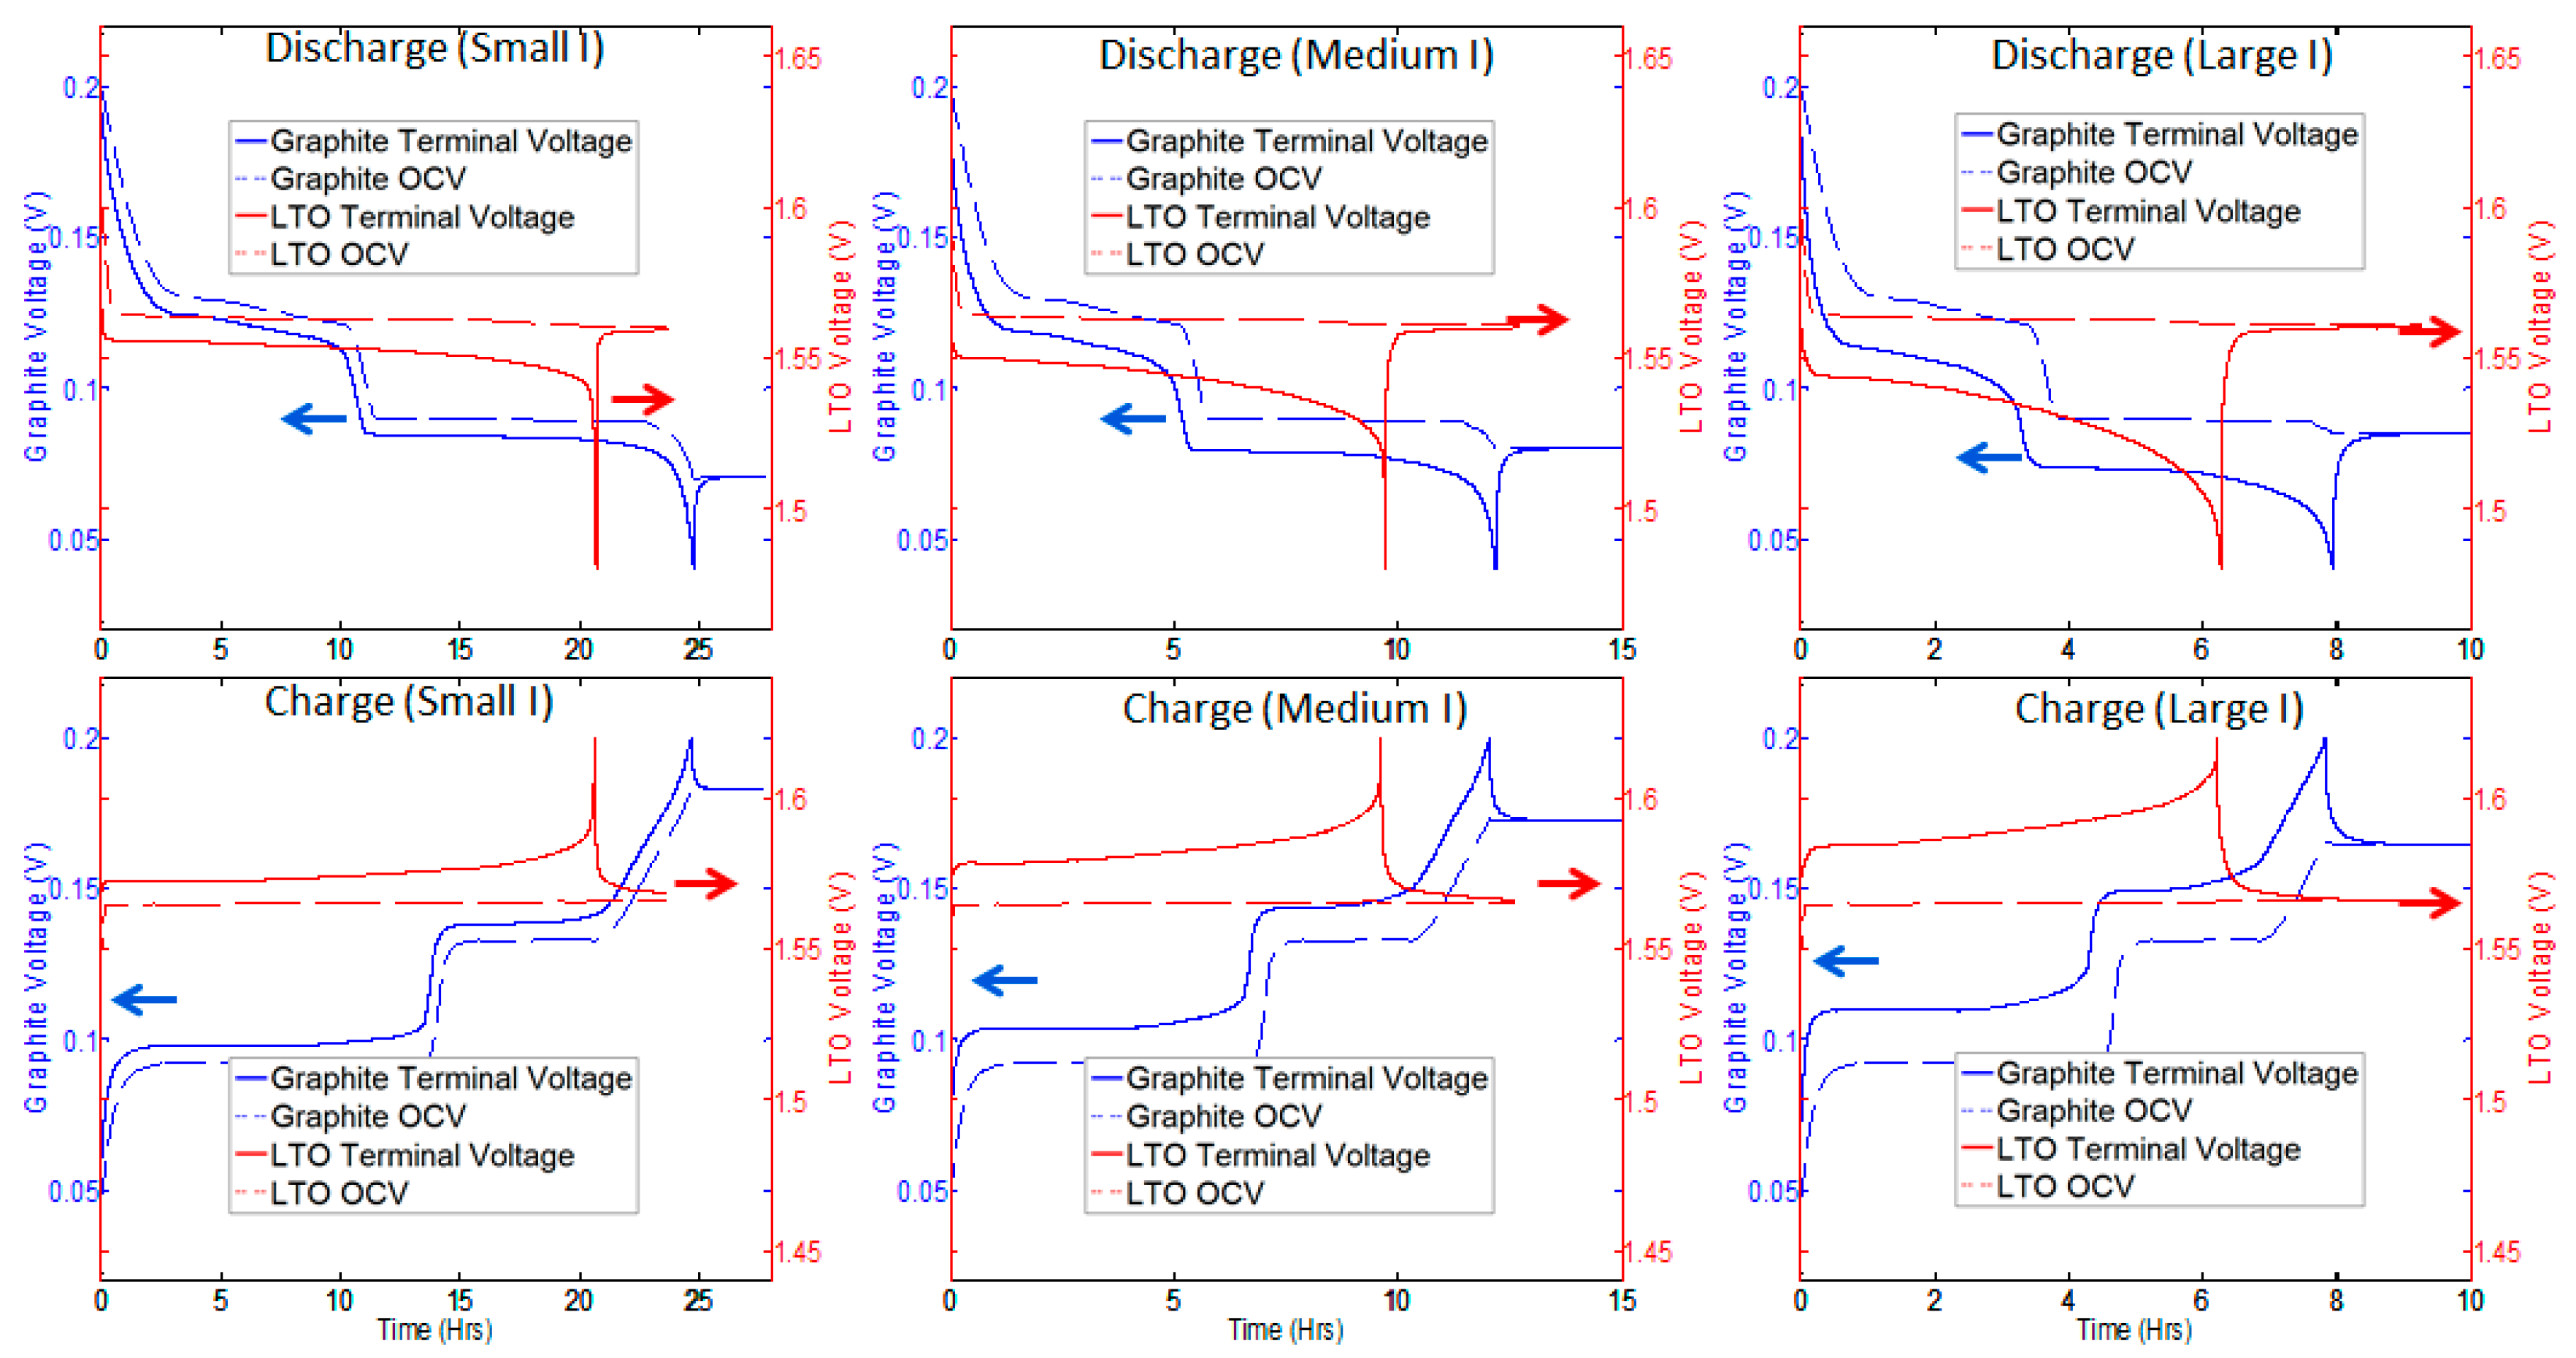
3.2. Current Dependence and Large Current Applications

For the large current charge or discharge, however, LTO performs better than graphite due to its decrease in effective particle radius with increasing current, as described in Table 3. The smaller particle radius shortens the path of ion diffusion in the solid phase, reducing the gradient of cs and decreasing the corresponding overpotential. This finding is further supported by the simulation of cs in Figure 6. For better analysis, we define Δcs as the cs difference between the center and the surface of the electrode particle
Δ c s = | c s , r = r s c s , r = 0 |
The following discussion focuses on Δcs in the middle of a charge or discharge. According to the simulated results in Figure 6, Δcs was 0.955 × 10⁻³ mol cm−3 at the small discharge current rate in the graphite cell. At the large discharge current rate, Δcs became 2.41 × 10⁻³ mol cm−3, representing an increase of 152%. For the LTO cell, however, the Δcs was 6.48 × 10⁻³ mol cm−3 at the small discharge current rate and 7.26 × 10⁻³ mol cm−3 at the large discharge current rate. The corresponding increase of Δcs in LTO was only 12%. Similar statistics are summarized in Table 5. As may be seen, the increase of Δcs in LTO cells is much smaller than that of the graphite cells when the current rate is increased from 0.045 C to 0.13 C. This is because the LTO particles have a smaller effective radius at increased current rates while the effective radius of graphite particles does not change with current. Therefore, LTO is more suitable than graphite for large current applications.

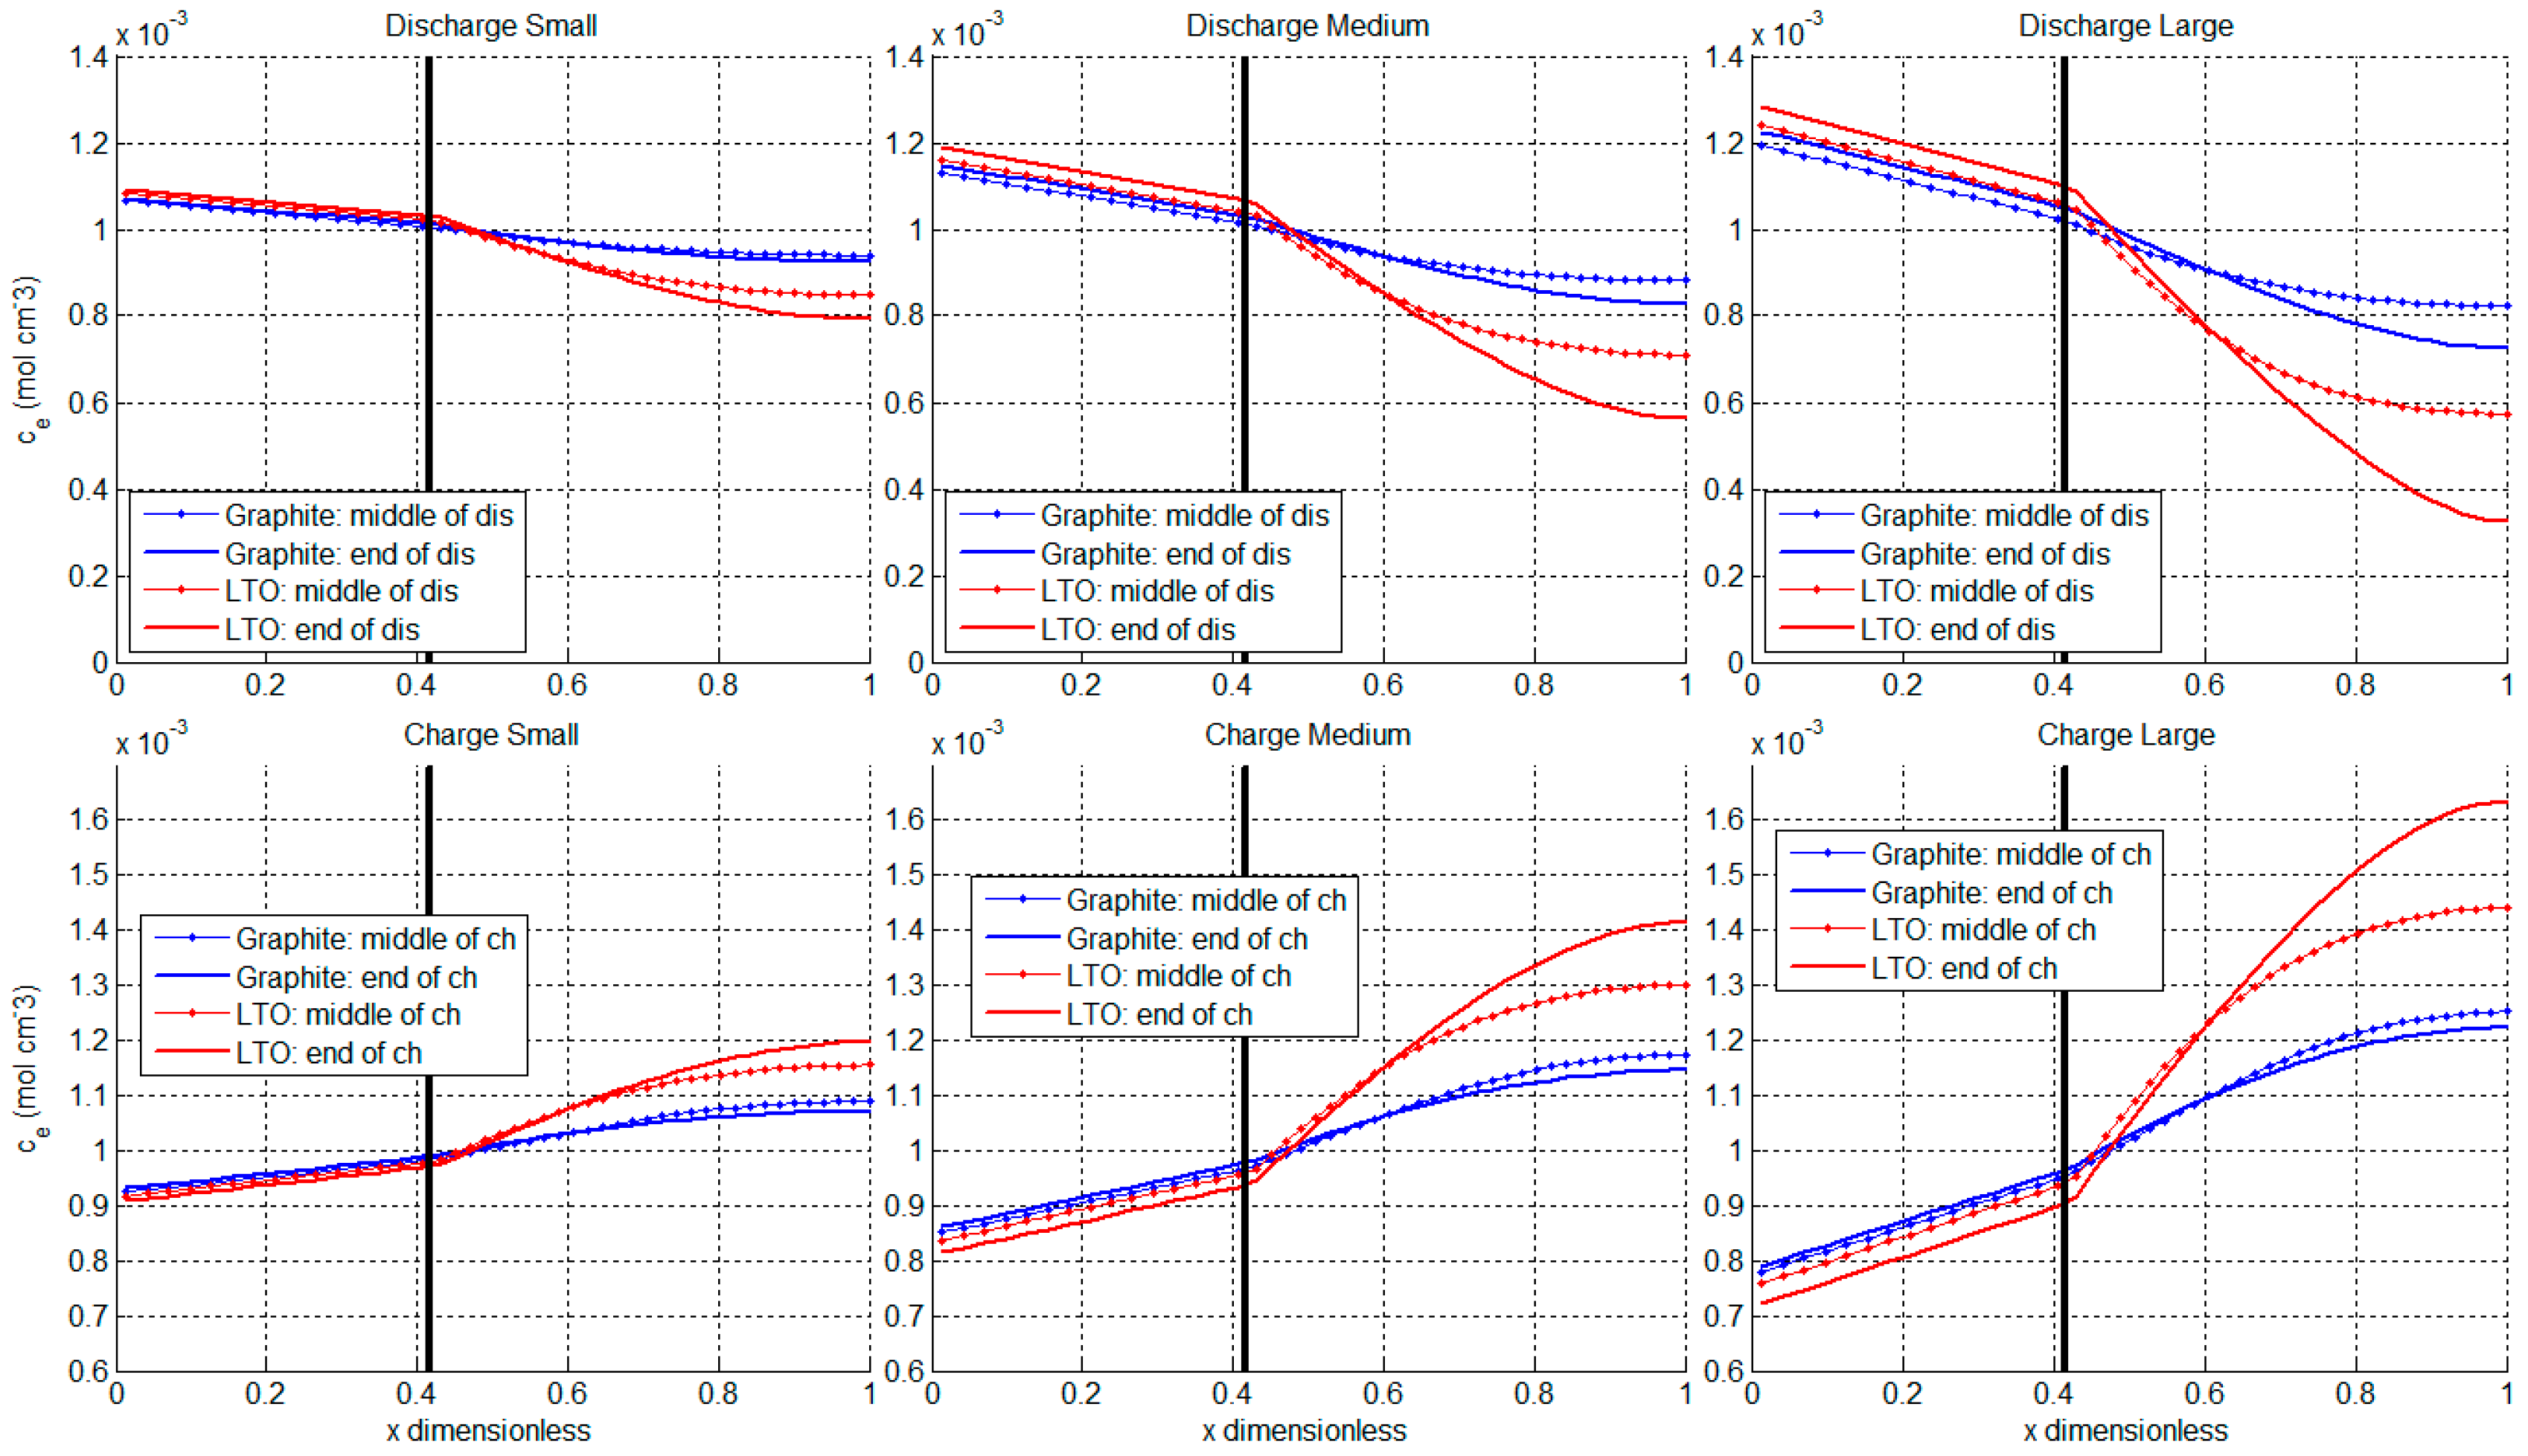
3.3. Ion Diffusion in Electrolyte

The ion diffusion in the electrolyte also contributes to the overall overpotential during a discharge or charge process. Figure 7 presents the ion concentrations in the electrolyte, ce, for both graphite and LTO cells. The x-axis is dimensionless cell thickness, which corresponds to the schematic diagram in Figure 8. The black vertical line indicates the interface between the separator and the composite electrode, with the separator on its left and the composite electrode on its right. The interface between the separator and lithium metal electrode is located where x = 0. During discharge, ions diffuse from the lithium metal to the composite electrode through the separator, so ce in the separator must be higher than that in the composite electrode, according to Fick’s first law of diffusion (Equation (15)). An opposite trend applies to the electrolyte when the cell is charging.
These simulations show that higher currents lead to a larger gradient of ce, indicating that a component of the overpotential is caused by the process of ion diffusion in electrolyte. The simulations also show a larger gradient of ce at the end of the discharge or charge than in the middle.
Both the graphite and LTO cells have the same gradient of ce in the separator region because they share the same electrolyte diffusion coefficient (De) and volume fraction of electrolyte in the separator (εe,sep). However, in the composite electrode, LTO has a higher gradient of ce than graphite. As indicated in Table 2, the volume fraction of electrolyte in the composite anode (εe,an) is 0.33 for graphite, but only 0.19 for LTO. A smaller εe,an indicates a lower porosity as well as a higher resistance to ion diffusion in the electrolyte, leading to a higher overpotential. Therefore, if εe,an or porosity can be increased during the fabrication process of an LTO cell, the gradient of ce and the corresponding overpotential can be decreased, leading to an improved discharge and charge performance for LTO. However, if holding the size of the cell constant, the penalty of increasing porosity is that a decrease of the amount of active material, εs, is necessary, resulting in a smaller energy density.

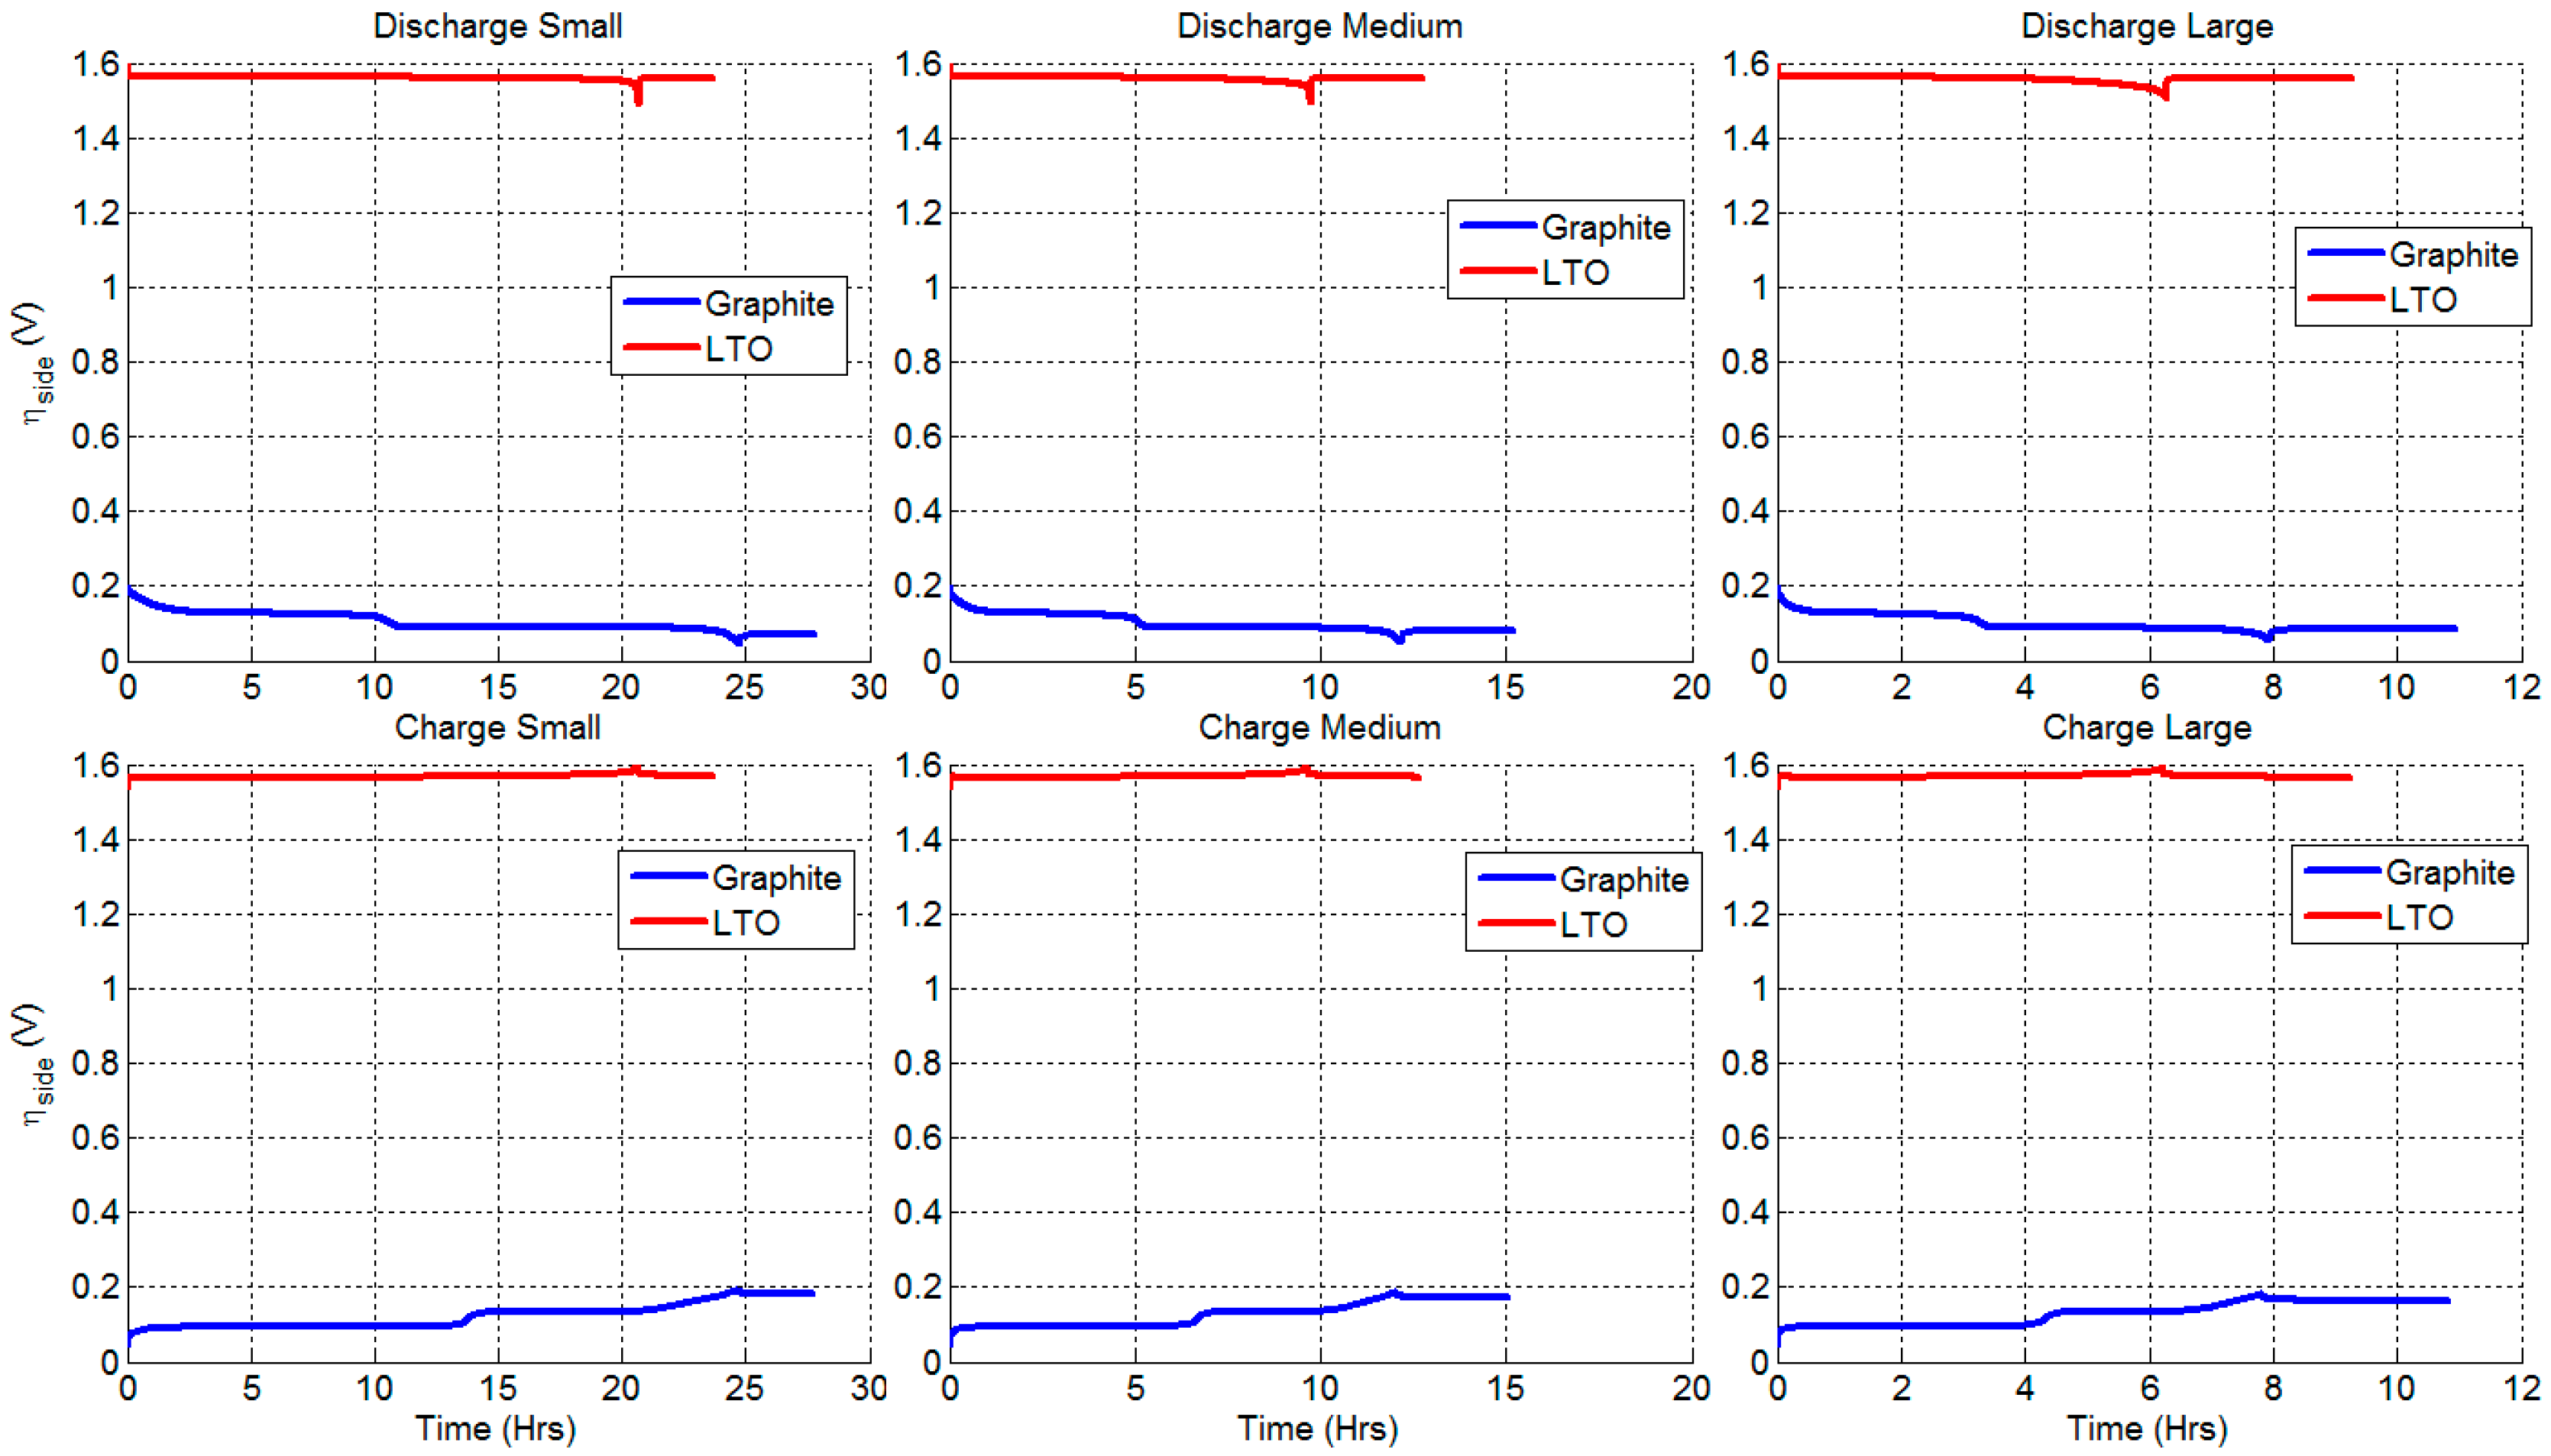
3.4. Degradation Caused by Side Reactions

Researchers have identified side reactions within the cell as the major cause of cell performance degradation [30,31,40,41,42,43,44,45,46]. These side reactions consist of reduction processes of the electrolyte solvents at the surface of the anode particles. These reactions consume lithium ions and produce the SEI, leading to capacity and power fade as the cell ages. The side reactions can be described using the Tafel equation [30]
j s i d e L i = i 0 , s i d e exp ( α c , s i d e n s i d e F R T η s i d e )
where j s i d e L i is the reaction rate of the side reactions, i 0 , s i d e is the exchange current density of the side reactions, n s i d e is the number of ions involved in the side reactions and η s i d e is the activation overpotential, which can be calculated as
η s i d e = φ s φ e U e q , s i d e R S E I a s j L i
where U e q , s i d e is the equilibrium potential of the side reactions and can be regarded as a constant. By assuming U e q , s i d e = 0, the η s i d e of graphite and LTO during the discharge and charge processes can be calculated and are shown in Figure 9. These plots show that the η s i d e of LTO is significantly higher than that of graphite, which is mainly caused by the difference between their equilibrium potentials (Figure 1). By considering Equations (2) and (3), one can find that a higher η s i d e leads to a smaller magnitude of side reactions, | j s i d e L i |, implying a slower rate of degradation. Therefore, the result implies that LTO should have a significantly longer cycle life than graphite, considering that the side reactions with SEI formation are the major degradation mechanism for anode materials. Other degradation mechanisms, such as lithium plating for graphite and titanium reduction for LTO, are not considered in the present work and will be studied in the future.

4. Materials and Methods

4.1. Anode Material Selection

An ideal anode material for LIBs should have a low atomic weight, low cost, and low standard potential as well as high ionic and electrical conductivities. Research on anode materials for LIBs started in the 1970s alongside research on cathode materials. Since then, three categories of materials classified by reaction mechanism have been explored: (1) intercalation/deintercalation materials such as carbonaceous materials (graphite, graphene, etc.) and Li4Ti5O12; (2) alloy/de-alloy materials such as Si, Sn, Al, Mg, etc.; and (3) conversion reaction materials such as metal oxides (Fe3O4, Co3O4, Fe2O3, etc.) and sulfides (MoS2, WS2, ZrS2, etc.) [47]. Among these materials, graphite has been used as the standard anode material for electronics applications since the early 1990s and, more recently, for electrified vehicle applications. Lithium may intercalate between the graphene layers of graphite until a composition of LiC6 is reached, as shown in Equation (4), resulting in a theoretical specific capacity of 372 mAh g−1. Graphite has a low potential of around 0.1 V vs. Li/Li+ for most lithium concentrations. It reacts with organic electrolyte to form an SEI on its surface in the initial few charge and discharge cycles.
This SEI allows for the free transfer of Li ions and protects graphite particles from further reactions with electrolyte [48]. Lithium titanate (Li4Ti5O12 or LTO) has recently attracted considerable attention as an alternative to carbonaceous material, especially in high power applications [49]. It exhibits a flat charge/discharge voltage plateau around 1.55 V vs. Li/Li+ because of its two-phase lithium insertion/extraction mechanism which avoids the reduction of electrolyte and minimizes the formation of an SEI layer. LTO also exhibits a very small volume change (~0.36%) during the lithium insertion and extraction processes, which makes it a “zero-strain” insertion material. In addition, LTO has highly stable, both structurally and thermodynamically. These features have provided LTO with a high rate capability, cycling stability, and safety among anode materials. The electrochemical reaction corresponding to LTO is described by Equation (5). A commercially available LTO battery made by XALT Energy has demonstrated a high power capability (5 C/10 C), a wide operating temperature range (−40–55 °C), and a long cycle life (>16,000+ cycles at 100% depth of discharge). Based on these considerations, we selected graphite and LTO as anode materials for our experiments and simulations.
C6 + xLi+ + xe → LixC6
Li4Ti5O12 + 3Li+ + 3e → Li7Ti5O12

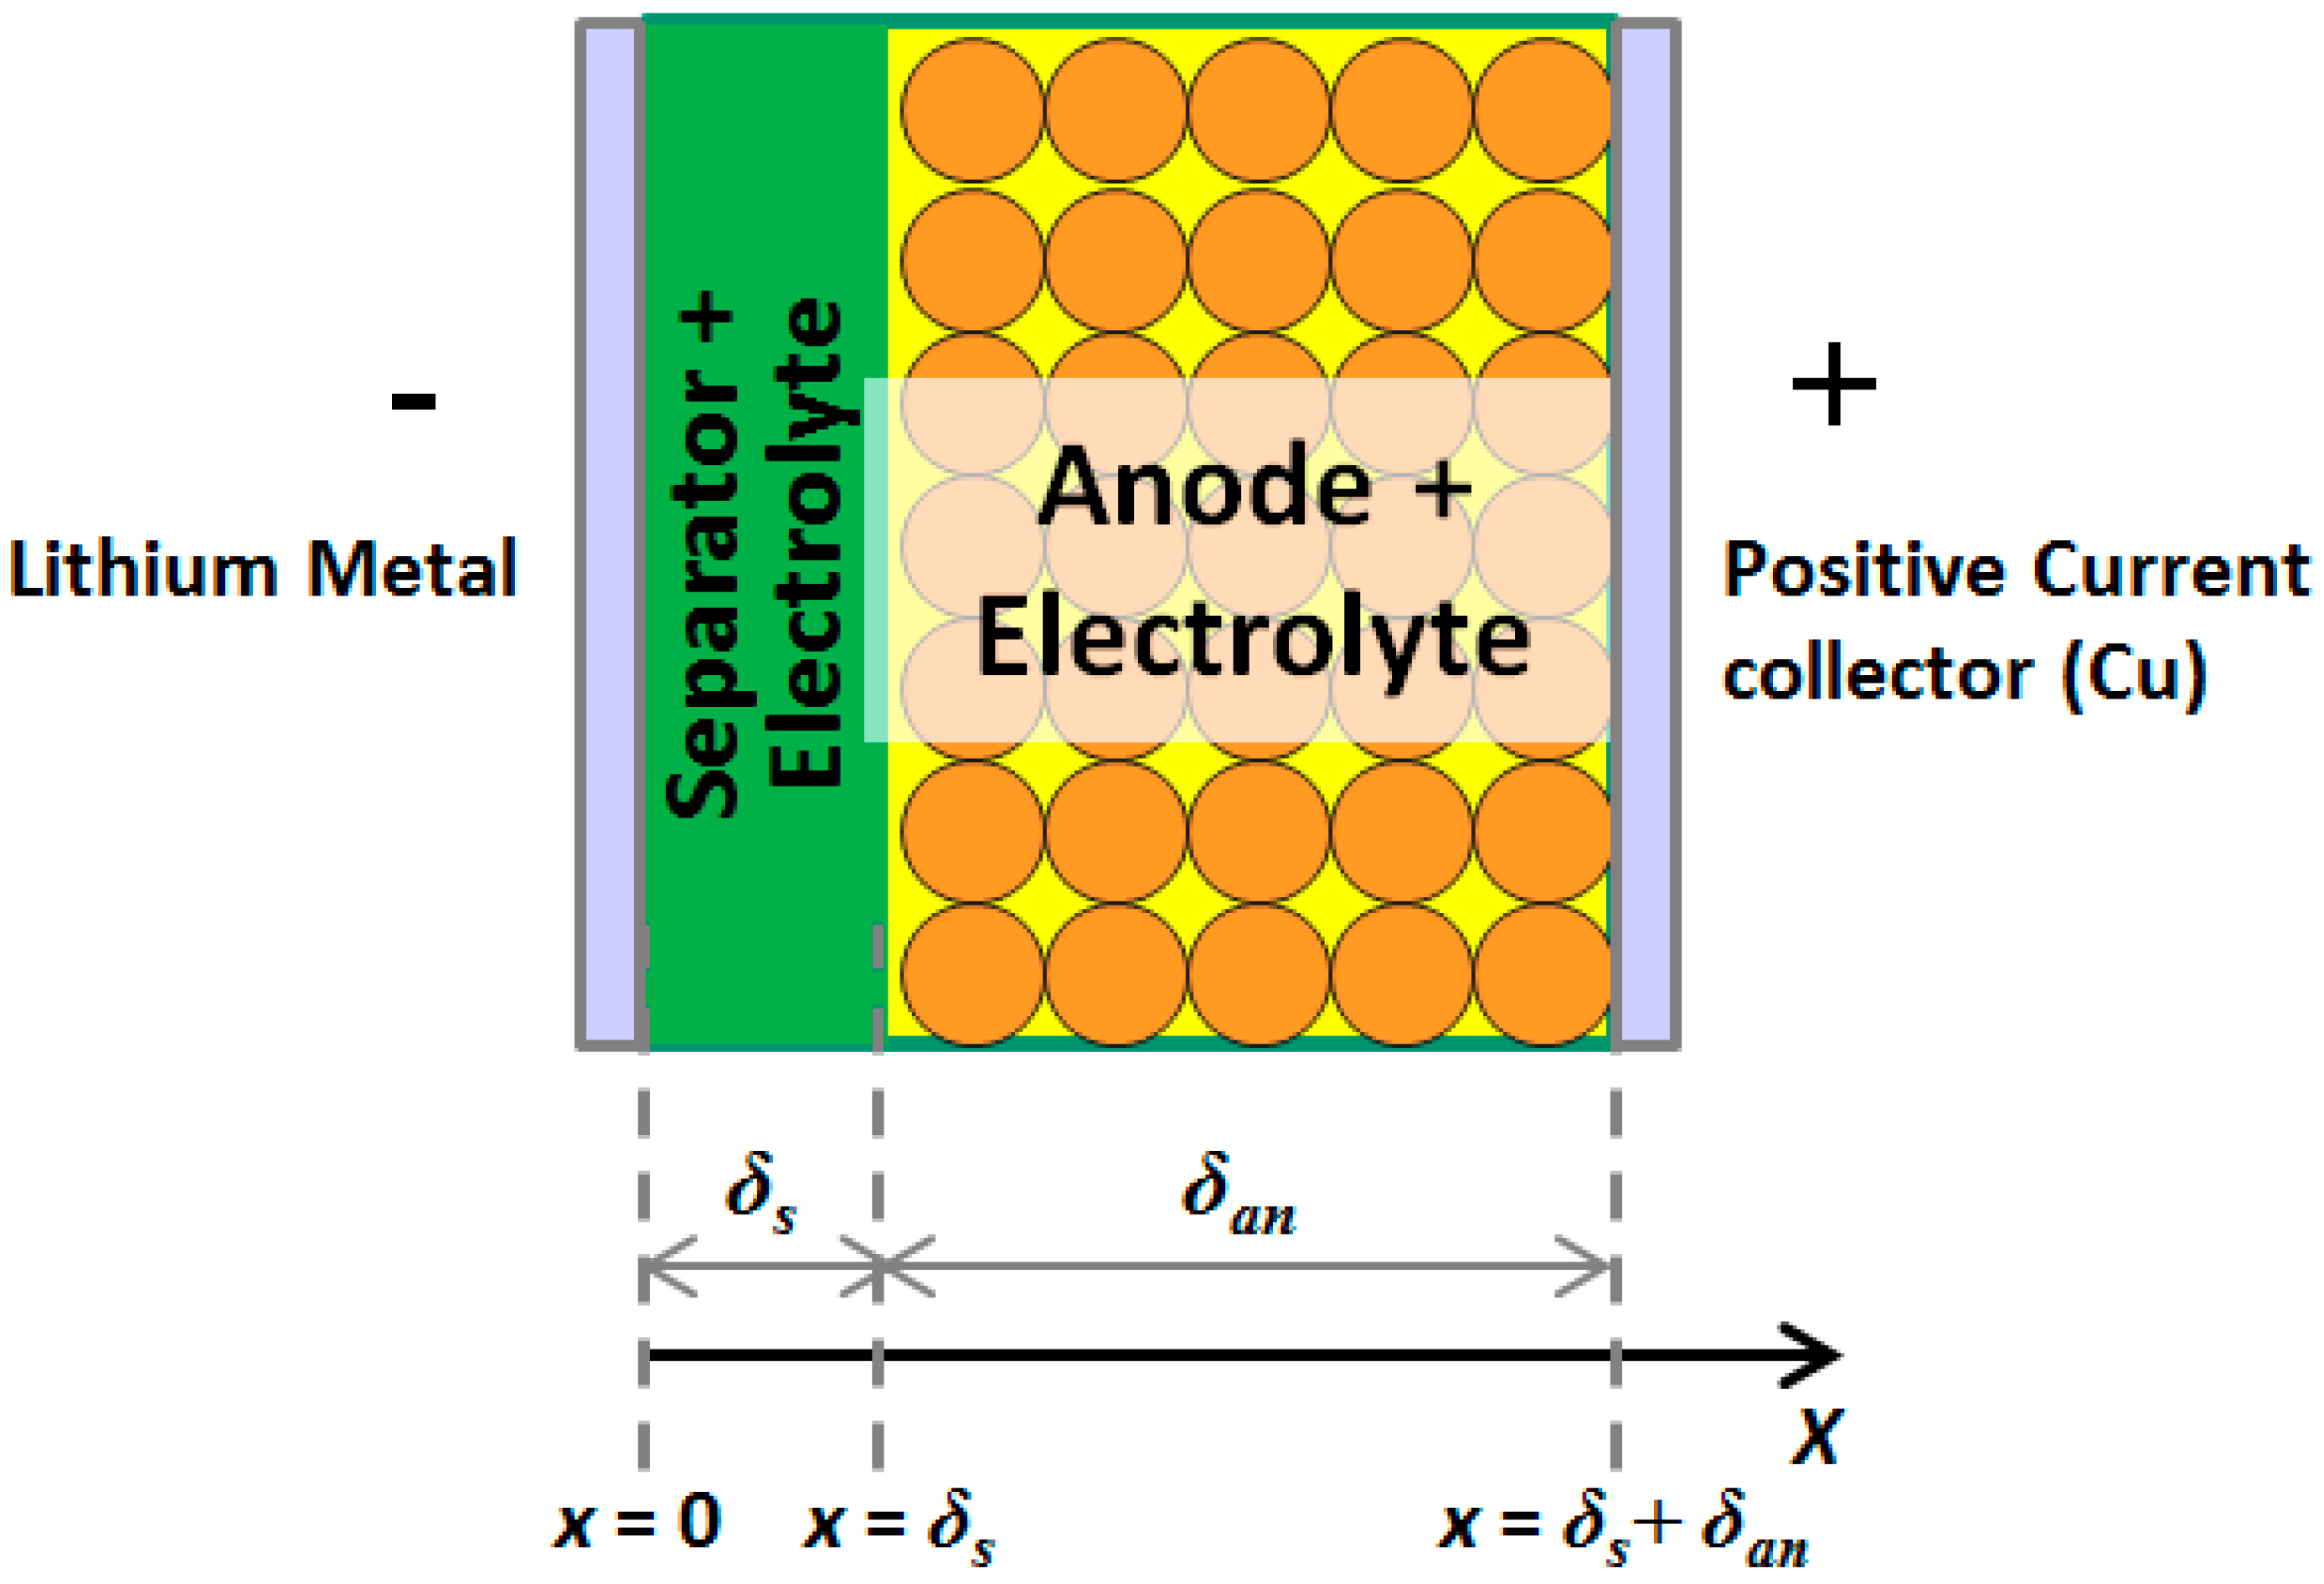
4.2. Model Development

The half-cell is mathematically described by a one-dimensional sandwich model composed of a lithium metal anode, a separator, and a porous composite cathode made up of a traditional anode material (graphite or Li4Ti5O12) mixed with electrolyte. Hereafter we will refer to the composite cathode as the anode material. A schematic diagram of this sandwich is shown in Figure 8.
When the cell is charged or discharged, electrons travel through an external circuit while lithium ions are transported through the electrode and electrolyte. Chemical reactions take place at the surfaces of the electrode particles in contact with the electrolyte and then the ions diffuse out of or into the electrode particles. The electric current produced by the chemical reactions is a function of overpotential and is governed by the Butler–Volmer equation, which may be simplified to the linear equation given in Equation (6).
j L i = a s i 0 ( α a + α c ) F R T η
Here, the exchange current density is
i 0 = k ( c s , max c s ) α a c s α c c e α c
In Equation (6), a s is the surface area of current collector, α a is the anodic charge transfer coefficient, α c is the cathodic charge transfer coefficient, R is the ideal gas constant, F is the Faraday constant, T is the temperature, and η is the activation overpotential, or the potential difference between electrode and electrolyte and the equilibrium potential.
η = φ s φ e U e q R S E I a s j L i
Here, φ s and φ e are the electric potentials of the electrode particle and electrolyte, respectively. R S E I is the resistance of the SEI present on this electrode. U e q is the equilibrium potential of intercalation, which is a function of stoichiometric number
U e q = f ( s t o i )
where stoichiometric number for our materials is defined as the ratio of the solid phase ion concentration at the particle’s surface to its maximum value
s t o i = c s | r = r s c s , max
Equation (9) shows that U e q is a function of stoi, which is same as the relation between OCV and SOC as obtained in Section 2.1.2 and plotted in Figure 1. The number of electrons produced in the oxidation process should be equal to those consumed in the reduction process. This relationship is described using Kirchoff’s current law and expressed as a function of currents and potential gradients. Ion transport in the electrolyte is governed by the Nernst-Planck equation as shown in Equation (11).
x ( κ e e f f x φ e ) + x ( κ D e f f x ( ln c e ) ) + j L i = 0
Here, φ e is the electrolyte potential, κ e e f f is the effective electrolyte conductivity, and κ D e f f is the concentration-driven diffusion conductivity. At the boundaries of the electrolyte, the gradient of potential is equal to zero.
φ e x | x = 0 = φ e x | x = δ s + δ a n = 0
The charge transport in the solid phase of the electrode has no diffusion terms and is solely governed by Ohm’s law
x ( σ e f f x φ s ) = j L i
where σ e f f is the electrical conductivity of the solid phase. At the interfaces between the electrodes and the separator, there is no election current. On the contrary, the electric current density at the interface between the electrode and the positive current collector is equal to the external current divided by area of the coin cell. Therefore, the boundary conditions are
σ e f f φ s x | x = δ s = 0 σ e f f φ s x | x = δ s + δ a n = I A
The Li+ concentration distribution in the electrolyte is affected by the gradient of ion concentrations. When the electrodes have pores filled with electrolyte, the Li+ concentration after considering the porosity of the material can be described as
( ε e c e ) t = x ( D e e f f x c e ) + 1 t + 0 F j L i = 0
where c e is the concentration of lithium ions in the electrolyte, F is the Faraday constant, t + 0 is the initial transference number, ε e is the porosity, and j L i is the current density. There is no ion flow at the boundaries of electrolyte.
c e x | x = 0 = c e x | x = δ s + δ a n = 0
The flux of ion species inside electrode particles is driven by concentration and the change of ion concentration in a differential volume is equal to the gradient of species flux
c s t = D s ( 2 c s r 2 + 2 r c s r )
It is assumed that ion concentration is spherically symmetric inside an electrode particle. At the surface of the particles, the ion flux is determined by the reaction rate.
r 2 c s r | r = 0 = 0 D s c s r | r = r s = j L i a s F
In this model, the thicknesses of the separator and composite anode regions were discretized to 15 and 30 segments, respectively. The electrode particles were discretized to 30 segments in the radial direction.

5. Conclusions

In this work, half-cells were fabricated with two commercially available Li-ion anode materials: graphite and LTO. The selection of graphite and LTO was not only motivated by their common use in commercial Li-ion batteries, but also because of their distinctive electrochemical behaviors.
Physics-based electrochemical models were successfully developed for graphite and LTO half-cells, although the two materials showed distinctive electrochemical behavior. Charge and discharge simulations were carried out at three different currents. By correlating the voltage curves from the simulations to experimental data, the values of four unknown parameters were successfully identified. It was also found that LTO’s effective particle radius tends to decrease with increasing current, while graphite particles do not appear to have this property.
Since LTO has a smaller Ds than graphite, as identified by the model, the solid phase diffusion causes a larger overpotential in LTO, leading to a smaller capacity utilization and, correspondingly, a shorter duration of constant current charge or discharge. However, in large current applications, LTO performs better than graphite because its effective particle radius decreases with increasing current, leading to enhanced diffusion. Such a statement is also supported by analyzing the simulated gradient of cs at small and large current rates.
The volume fraction of electrolyte in the composite anode (εe,an) is 0.33 for graphite and 0.19 for LTO, which is a result of our fabrication process. The lower εe,an of LTO leads to a higher gradient of ce and larger overpotential. Lastly, the model was briefly used to investigate the degradation of graphite and LTO. Since LTO has a higher activation overpotential in its side reactions, its degradation rate is expected to be much smaller than graphite, indicating a longer life span.
This analysis has demonstrated that this model may be utilized as a useful tool for comparing the pros and cons of LTO and graphite as anode materials in Li-ion batteries. LTO was found to have good performance at large current applications. Its high equilibrium potential, or OCV, leads to a better life span, but it also leads to lower energy density when it is used as an anode in a full cell. In addition, the low Ds of LTO would prevent it from fully utilizing its capacity.

Acknowledgments

This work was supported by the 2017 Kettering University Provost Research Matching Fund and the Adamczyk Clean Energy Scholarship Fund.

Author Contributions

Rujian Fu and Xuan Zhou conceived and designed the experiments; Rujian Fu, Hengbin Fan and Douglas Blaisdell performed the experiments; Xi Zhang, Rui Xiong and Ajay Jagadale contributed in idea generation, and interpreting and analyzing the data; Rujian Fu and Xuan Zhou wrote the paper; and Xuan Zhou supervised the research.

Conflicts of Interest

The authors declare no conflict of interest.

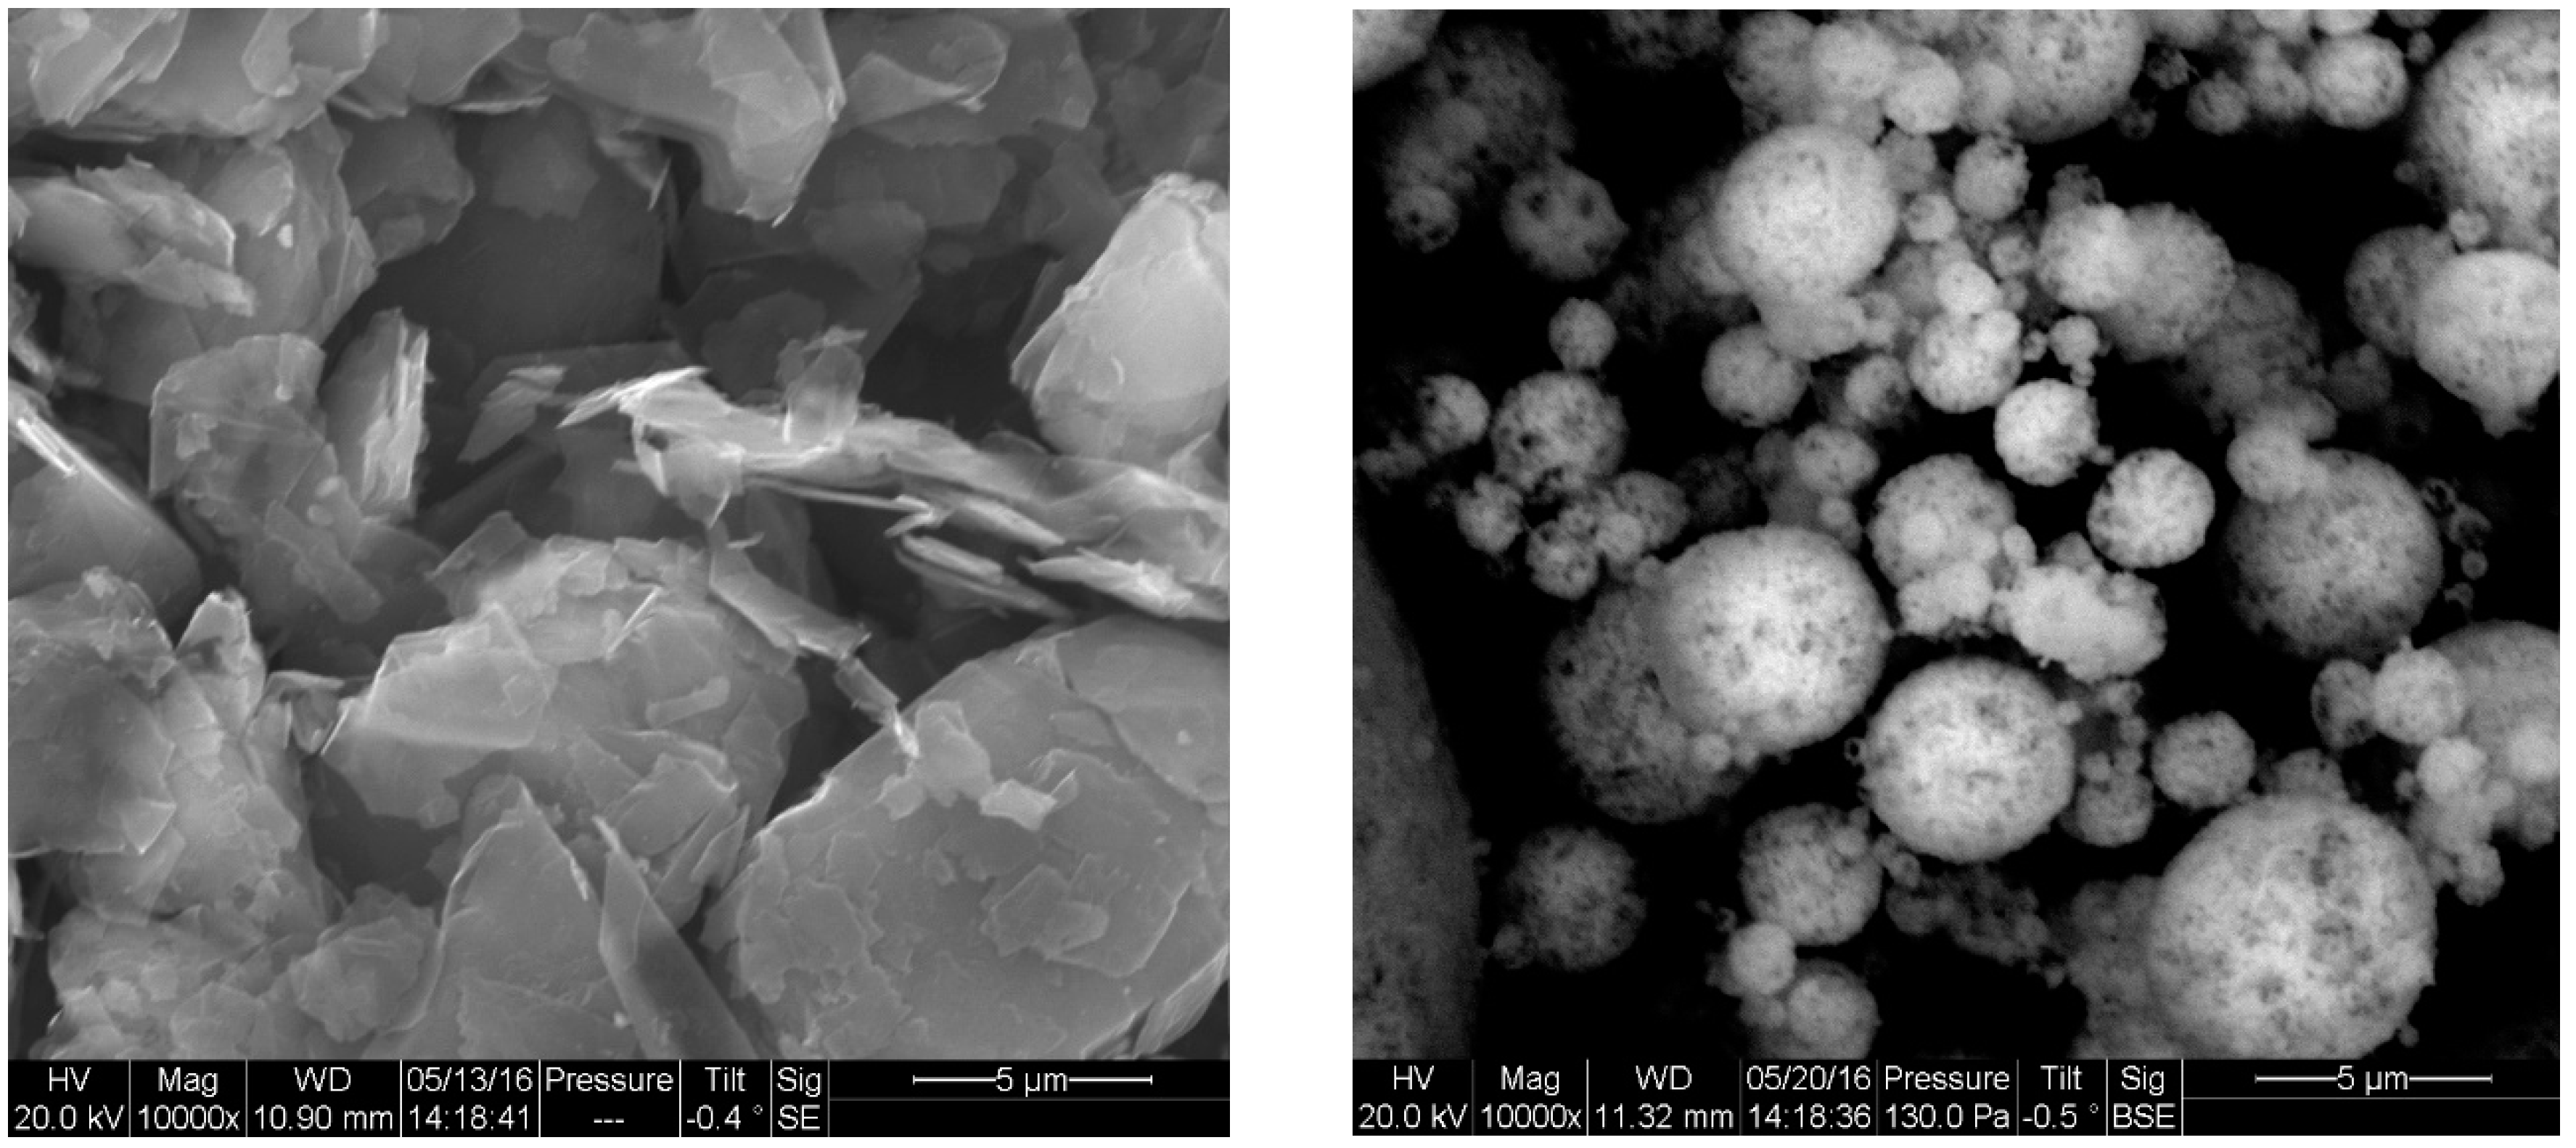
Appendix A. SEM of Anode Materials

Figure A1. SEM images of: graphite particles (left); and LTO particles (right).
Energies 10 02174 g0a1
The morphology and particle size of both graphite and LTO were measured by ESEM. Images of these particles are presented in Figure A1. The graphite particles consist of flake-like structures with diameters larger than 5 µm. The LTO particles display a spherical morphology with a variety of particle sizes. As a simplification of the model, the particles of both materials were assumed to be spherical with uniform particle radii corresponding to the average radius of the particles measured.

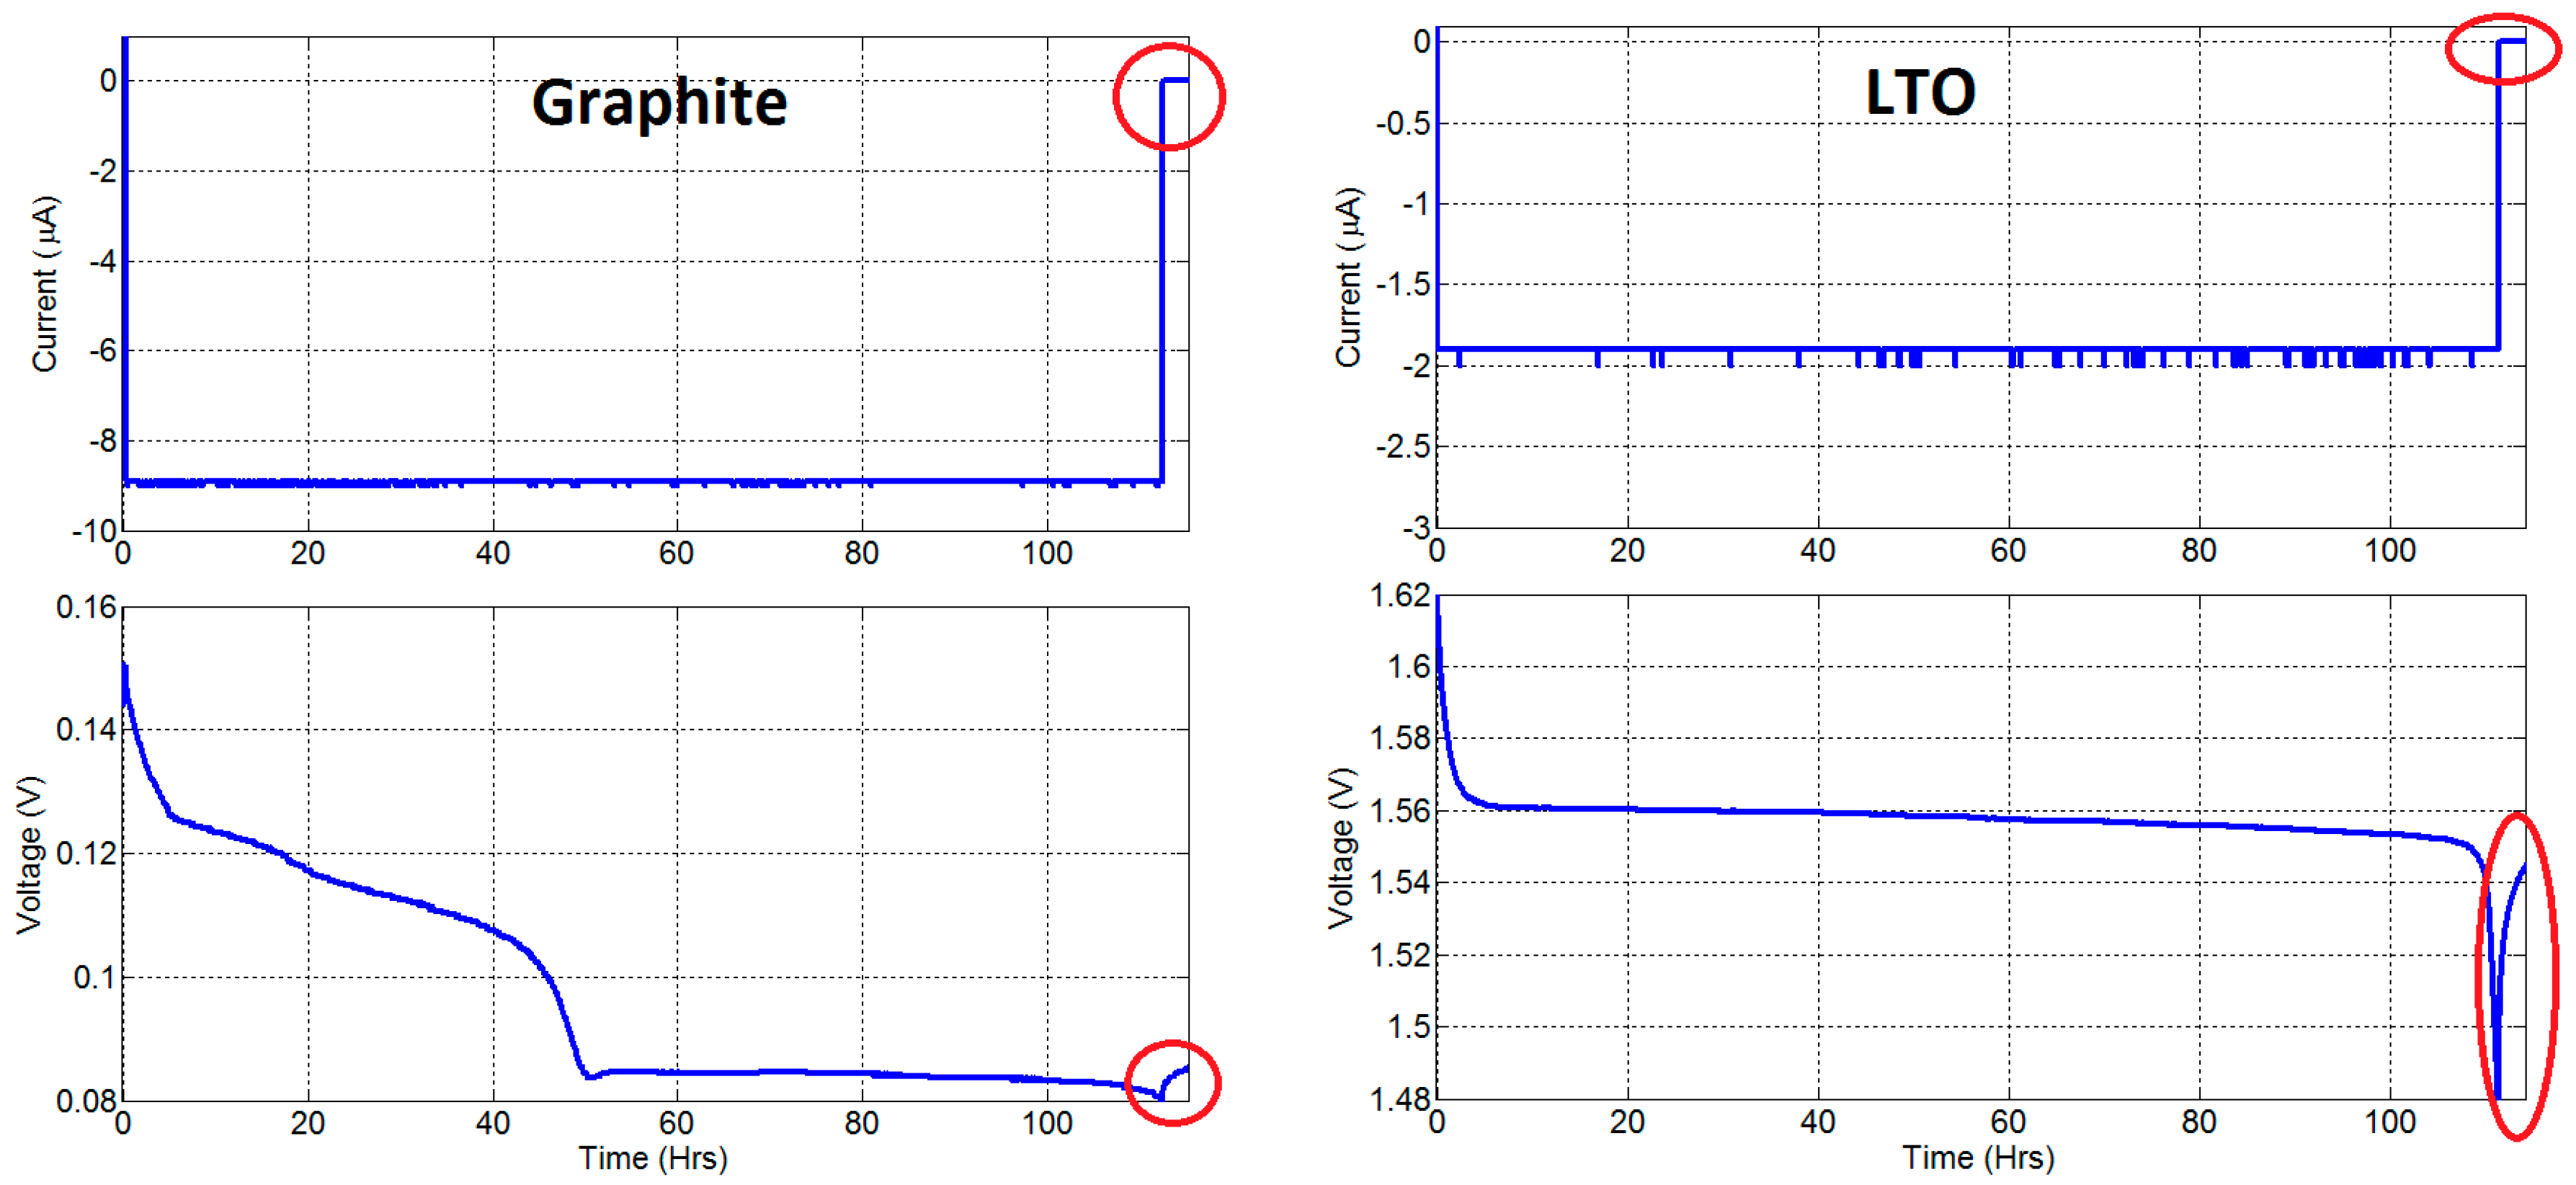
Appendix B. An Alternative OCV Test Method

As shown in Section 2.1.2, OCV curves used by the model were obtained with a standard OCV test procedure that consisted of multiple discharge or charge pulses, each followed by a resting period. One drawback of this method is that there may not be enough OCV data points where the OCV changes dramatically. Examples of such regions include the graphite OCV near 58% and 0% SOC as well as the LTO OCV near 100% and 0% SOC, as shown in Figure 1.
To avoid this problem, an alternative method to capture OCV was also tried. This consisted of a discharge or charge using a continuous, but extremely small, current. For example, to obtain OCVdis, the cell was discharged with a very small current from 100% SOC until the cell voltage reached its minimum. Since the discharge current was very small, it was believed that the voltage drop caused by internal resistance and overpotentials would be negligible. In other words, the terminal voltage at the small discharge current would be regarded as OCVdis.
The method was tested on a half-cell with a 4.06 mg graphite electrode and a half-cell with a 1.39 mg LTO electrode. The currents applied were 9 µA for the graphite cell and 1.9 µA for the LTO cell. As can be seen in Figure A2, the whole discharge process took more than 110 h, meaning that the C-rates used were smaller than 0.009 C. To validate whether the discharge current was small enough, a resting period was added at the end of the discharge. Ideally, the voltage change during relaxation in the resting period would be barely visible since the terminal voltage was expected to be very close to the OCV. However, the resting data showed that the terminal voltages had risen by at least 6 mV for graphite and 70 mV for LTO, meaning that the terminal voltage was still larger than OCV by an unacceptably large amount, especially for LTO. Therefore, a discharge or charge at 0.009 C is not suitable for approximating the OCV for these materials. This method may work using an even smaller current (such as 9 × 10⁻⁴ C), but such a test would be extremely time-consuming (>1000 h). In comparison, the original OCV test method used in Section 2.1.2 is more efficient.
Figure A2. Terminal voltage curves of discharges at a very small current rate.
Energies 10 02174 g0a2

Appendix C

Figure A3. Experimental validation of terminal voltage of LTO half-cell without considering the current dependency of Ds.
Energies 10 02174 g0a3

References

  1. Tarascon, J.; Armand, M. Issues and challenges facing rechargeable lithium batteries. Nature 2001, 414, 359–367. [Google Scholar] [CrossRef] [PubMed]
  2. Goodenough, J.B.; Park, K. The Li-Ion Rechargeable Battery: A perspective. J. Am. Chem. Soc. 2013, 135, 1167–1176. [Google Scholar] [CrossRef] [PubMed]
  3. Wang, B.; Xu, J.; Cao, B.; Zhou, X. A novel multimode hybrid energy storage system and its energy management strategy for electric vehicles. J. Power Source 2015, 281, 432–443. [Google Scholar]
  4. Chaturvedi, N.A.; Klein, R.; Christensen, J.; Ahmed, J.; Kojic, A. Algorithms for Advanced Battery-Management Systems. IEEE Control Syst. Mag. 2010, 30, 49–68. [Google Scholar]
  5. Zhang, X.; Lu, J.; Yuan, S.; Zhou, X. A novel method for identification of Lithium-ion battery equivalent circuit model parameters considering electrochemical properties. J. Power Sources 2017, 345, 21–29. [Google Scholar] [CrossRef]
  6. Xiong, R.; Yu, Q.; Wang, L.Y.; Li, C. A novel method to obtain the open circuit voltage for the state of charge of lithium ion batteries in electric vehicles by using H infinity filter. Appl. Energy 2017, 207, 341–348. [Google Scholar] [CrossRef]
  7. Xiong, R.; Sun, F.; Gong, X.; Gao, C. A data-driven based adaptive state of charge estimator of lithium-ion polymer battery used in electric vehicles. Appl. Energy 2014, 113, 1421–1433. [Google Scholar] [CrossRef]
  8. Xiong, R.; Tian, J.P.; Mu, H.; Wang, C. A systematic model-based degradation behavior recognition and health monitor method of lithium-ion batteries. Appl. Energy 2017, 207, 367–378. [Google Scholar]
  9. Xiong, R.; Zhang, Y.; He, H.; Zhou, X.; Pecht, M. A double-scale, particle-filtering, energy state prediction algorithm for lithium-ion batteries. IEEE Trans. Ind. Electron. 2018, 65, 1526–1538. [Google Scholar]
  10. Sung, W.; Shin, C.B. Electrochemical model of a lithium-ion battery implemented into an automotive battery management system. Comput. Chem. Eng. 2015, 76, 87–97. [Google Scholar] [CrossRef]
  11. Doyle, M.; Fuller, T.F.; Newman, J. Modeling of Galvanostatic Charge and Discharge of the Lithium/Polymer/Insertion Cell. J. Electrochem. Soc. 1993, 140, 1526–1533. [Google Scholar] [CrossRef]
  12. Pals, C.R.; Newman, J. Thermal Modeling of the Lithium/Polymer Battery. J. Electrochem. Soc. 1995, 142, 3282–3288. [Google Scholar] [CrossRef]
  13. Doyle, M.; Newman, J. Comparison of Modeling Predictions with Experimental Data from Plastic Lithium Ion Cells. J. Electrochem. Soc. 1996, 143, 1890–1903. [Google Scholar] [CrossRef]
  14. Gu, W.B.; Wang, C.Y.; Liaw, B.Y. Numerical Modeling of Coupled Electrochemical and Transport Processes in Lead-Acid Batteries. J. Electrochem. Soc. 1997, 144, 2053–2061. [Google Scholar] [CrossRef]
  15. Srinivasan, V.; Wang, G.Q.; Wang, C.Y. Mathematical Modeling of Current-Interrupt and Pulse Operation of Valve-Regulated Lead Acid Cells. J. Electrochem. Soc. 2003, 150, A316–A325. [Google Scholar] [CrossRef]
  16. Gu, W.B.; Wang, C.Y.; Liaw, B.Y. Micro-Macroscopic Coupled Modeling of Batteries and Fuel Cells. J. Electrochem. Soc. 1998, 145, 3418–3427. [Google Scholar] [CrossRef]
  17. Gu, W.B.; Wang, C.Y.; Li, S.M.; Geng, M.M.; Liaw, B.Y. Modeling discharge and charge characteristics of nickel-metal hydride batteries. Electrochim. Acta 1999, 44, 4525–4541. [Google Scholar] [CrossRef]
  18. Smith, K.A.; Rahn, C.D.; Wang, C.Y. Control oriented 1D electrochemical model of lithium ion battery. Energy Convers. Manag. 2007, 48, 2565–2578. [Google Scholar] [CrossRef]
  19. Smith, K.A.; Rahn, C.D.; Wang, C.Y. Model-Based Electrochemical Estimation and Constraint Management for Pulse Operation of Lithium Ion batteries. IEEE Trans. Control Syst. Technol. 2010, 18, 654–663. [Google Scholar] [CrossRef]
  20. Tanim, T.R.; Rahn, C.D.; Wang, C.Y. A Temperature Dependent Single Particle, Lithium Ion Cell Model Including Electrolyte Diffusion. J. Dyn. Syst. Meas. Control 2015, 137, 011005. [Google Scholar] [CrossRef]
  21. Subramanian, V.R.; Boovaragavan, V.; Diwakar, V.D. Toward Real-Time Simulation of Physics Based Lithium-Ion Battery Models. Electrochem. Solid-State Lett. 2007, 10, A255–A260. [Google Scholar] [CrossRef]
  22. Boovaragavan, V.; Harinipriya, S.; Subramanian, V.R. Toward real-time (milliseconds) parameters estimation of Lithium-Ion Batteries using reformulated physics-based models. J. Power Sources 2008, 183, 361–365. [Google Scholar] [CrossRef]
  23. Kim, G.; Smith, K.; Lee, K.; Santhanagopalan, S.; Pesaran, A. Multi-Domain Modeling of Lithium-Ion Batteries Encompassing Multi-Physics in Varied Length Scales. J. Electrochem. Soc. 2011, 158, A955–A969. [Google Scholar] [CrossRef]
  24. Zhang, Q.; White, R.E. Capacity fade analysis of a lithium ion cell. J. Power Sources 2008, 179, 793–798. [Google Scholar] [CrossRef]
  25. Ramasamy, R.P.; White, R.E.; Popov, B.N. Calendar life performance of pouch lithium-ion cells. J. Power Sources 2005, 141, 298–306. [Google Scholar] [CrossRef]
  26. Arora, P.; White, R.E.; Doyle, M. Capacity Fade Mechanisms and Side Reactions in Lithium-Ion Batteries. J. Electrochem. Soc. 1998, 145, 3647–3667. [Google Scholar] [CrossRef]
  27. Coman, P.; Rayman, S.; White, R.E. A lumped model of venting during thermal runaway in a cylindrical lithium cobalt oxide lithium-ion cell. J. Power Sources 2016, 307, 56–62. [Google Scholar] [CrossRef]
  28. Marongiu, A.; Nubbaum, F.; Waag, W.; Garmendia, M.; Sauer, D. Comprehensive study of the influence of aging on the hysteresis behavior of a lithium iron phosphate. Appl. Energy 2016, 171, 629–645. [Google Scholar] [CrossRef]
  29. Dreyer, W.; Jamnik, J.; Guhlke, C.; Huth, R.; Moskon, J.; Gaberscek, M. The thermodynamic origin of hysteresis in insertion batteries. Nat. Mater. 2010, 9, 448–453. [Google Scholar] [CrossRef] [PubMed]
  30. Fu, R.; Choe, S.Y.; Agubra, V.; Fergus, J. Development of a physics-based degradation model for lithium ion polymer batteries considering side reactions. J. Power Sources 2015, 278, 506–521. [Google Scholar] [CrossRef]
  31. Fu, R.; Choe, S.Y.; Agubra, V.; Fergus, J. Modeling of degradation effects considering side reactions for a pouch type Li-ion polymer battery with carbon anode. J. Power Sources 2014, 261, 120–135. [Google Scholar] [CrossRef]
  32. Smith, K.; Wang, C. Solid-state diffusion limitations on pulse operation of a lithium ion cell for hybrid electric vehicles. J. Power Sources 2006, 161, 628–639. [Google Scholar] [CrossRef]
  33. Smith, K.; Wang, C. Power and thermal characterization of a lithium-ion battery pack for hybrid-electric vehicles. J. Power Sources 2006, 160, 662–673. [Google Scholar] [CrossRef]
  34. Xiao, M.; Choe, S.Y. Dynamic modeling and analysis of a pouch type LiMn2O4/Carbon high power Li-polymer battery based on electrochemical-thermal principles. J. Power Sources 2012, 218, 357–367. [Google Scholar] [CrossRef]
  35. Arora, P.; Doyle, M.; White, R. Mathematical modeling of the lithium deposition overcharge reaction in lithium−ion batteries using carbon−based negative electrodes. J. Electrochem. Soc. 1999, 146, 3543–3553. [Google Scholar] [CrossRef]
  36. Christensen, J.; Srinivasan, V.; Newman, J. Optimization of lithium titanate electrodes for high-power cells. J. Electrochem. Soc. 2006, 153, A560–A565. [Google Scholar] [CrossRef]
  37. Stewart, S.; Srinivasan, V.; Newman, J. Modeling the performance of lithium-ion batteries and capacitors during hybrid-electric-vehicle operation. J. Electrochem. Soc. 2008, 155, A664–A671. [Google Scholar] [CrossRef]
  38. Srinivasan, V.; Newman, J. Discharge Model for the Lithium Iron-Phosphate Electrode. J. Electrochem. Chem. 2004, 151, A1517–A1529. [Google Scholar] [CrossRef]
  39. Delacourt, C.; Safari, M. Analysis of lithium deinsertion/insertion in LiyFePO4 with a simple mathematical model. Electrochim. Acta 2011, 56, 5222–5229. [Google Scholar] [CrossRef]
  40. Maheshwari, A.; Dumitrescu, M.A.; Destro, M.; Santarelli, M. Inverse parameter determination in the development of an optimized lithium iron phosphate e Graphite battery discharge model. J. Power Sources 2016, 307, 160–172. [Google Scholar] [CrossRef]
  41. Ramadass, P.; Haran, B.; Gomadam, P.; White, R.; Popov, B. Development of First Principles Capacity Fade Model for Li-Ion Cells. J. Electrochem. Soc. 2004, 151, A196–A203. [Google Scholar] [CrossRef]
  42. Santhanagopalan, S.; Zhang, Q.; Kumaresan, K.; White, R. Parameter Estimation and Life Modeling of Lithium-Ion Cells. J. Electrochem. Soc. 2008, 155, A345–A353. [Google Scholar] [CrossRef]
  43. Sikha, G.; Popov, B.; White, R. Effect of Porosity on the Capacity Fade of a Lithium-Ion Battery: Theory. J. Electrochem. Soc. 2004, 151, A1104–A1114. [Google Scholar] [CrossRef]
  44. Ploehn, H.; Ramadass, P.; White, R. Solvent Diffusion Model for Aging of Lithium-Ion Battery Cells. J. Electrochem. Soc. 2004, 151, A456–A462. [Google Scholar] [CrossRef]
  45. Aurbach, D.; Levi, M.; Levi, E.; Schechter, A. Failure and Stabilization Mechanisms of Graphite Electrodes. J. Phys. Chem. B 1997, 101, 2195–2206. [Google Scholar] [CrossRef]
  46. Verma, P.; Maire, P.; Novak, P. A review of the features and analyses of the solid electrolyte interphase in Li-ion batteries. Electrochim. Acta 2010, 55, 6332–6341. [Google Scholar] [CrossRef]
  47. Goriparti, S.; Miele, E.; Angelis, F.D.; Fabrizo, E.D.; Zaccaria, R.P.; Capiglia, C. Review on recent progress of nanostructured anode materials for Li-ion batteries. J. Power Sources 2014, 257, 421–443. [Google Scholar] [CrossRef]
  48. Zaghib, K.; Simoneau, M.; Armand, M.; Gauthier, M. Electrochemical study of Li4Ti5O12 as negative electrode for Li-ion polymer rechargeable batteries. J. Power Sources 1999, 81–82, 300–305. [Google Scholar] [CrossRef]
  49. Sun, X.; Radovanovic, P.V.; Cui, B. Advances in spinel Li4Ti5O12 anode materials for lithium-ion batteries. New J. Chem. 2015, 39, 38–63. [Google Scholar] [CrossRef]
Figure 1. OCV or U e q measurement vs. state of charge (SOC) for graphite and Li4Ti5O12 anode.
Energies 10 02174 g001
Figure 2. Experimental validation of the terminal voltage of a graphite half-cell at 0.05 C, 0.1 C and 0.15 C cycles.
Energies 10 02174 g002
Figure 3. Experimental validation of terminal voltage of an LTO half-cell at 0.05 C, 0.1 C and 0.15 C cycles.
Energies 10 02174 g003
Figure 4. Terminal voltage comparison of simulated graphite and LTO half-cells cycled with constant current at 0.045 C, 0.089 C and 0.13 C.
Energies 10 02174 g004
Figure 5. State of charge (SOC) comparison of graphite and LTO half-cell simulations of 0.045 C, 0.089 C, and 0.13 C cycles.
Energies 10 02174 g005
Figure 6. Ion concentrations in solid particles of graphite and LTO half-cells during 0.045 C, 0.089 C, and 0.13 C cycles.
Energies 10 02174 g006
Figure 7. Ion concentrations in the electrolyte of graphite and LTO half-cells while cycling at 0.045 C, 0.089 C, and 0.13 C.
Energies 10 02174 g007
Figure 8. Geometry setup for a half-cell model with a graphite or LTO anode (single particle schematics).
Energies 10 02174 g008
Figure 9. Activation overpotential of side reactions in graphite and LTO half-cells cycled at 0.045 C, 0.089 C, and 0.13 C.
Energies 10 02174 g009
Table 1. Max. and min. values of open circuit voltage (OCV) and stoichiometric numbers.
Graphite Half-CellLTO Half-Cell
100% SOCOCV (OCVmax)0.2 V1.62 V
Stoichiometric number (stoimin)0.1680.165
0% SOCOCV (OCVmin)0.04 V1.48 V
Stoichiometric number (stoimax)0.9890.987
Table 2. Model parameters of graphite and Lithium titanate (LTO) half cells.
ParameterHalf-Cell with GraphiteHalf-Cell with LTOUnitSource
Thickness of composite anode, δan31.9 × 10−435.0 × 10⁻⁴cmMeasured
Thickness of separator, δs25 × 10−425 × 10−4mgMeasured
Mass of composite anode2.114.23mgMeasured
Stoichiometry at 0% SOC (anode lithiated): xmax0.9890.987 Assumed
Stoichiometry at 100% SOC (anode de-lithiated): xmin0.1680.165 Assumed
Capacity from xmax to xmin0.800.97mAhIdentified from OCV tests
Area of composite anode1.271.27cm2Measured
Volume fraction of active material in composite anode, εs,an0.500.64 Identified from charge/discharge tests
Volume fraction of inactive material in composite anode, εin,an0.170.17 Identified from charge/discharge tests
Volume fraction of electrolyte in composite anode, εe,an0.330.19 Calculated by 1 − εs,anεin,an
Volume fraction of electrolyte in separator region, εe,sep0.50.5 Literature [30,31,32,33,34]
Volume fraction of inactive material in separator region, εin,sep0.50.5 Literature [30,31,32,33,34]
Anode particle radius, rs10 × 10−4Refer to Table 3cm Rough estimate from SEM and Identified from charge/discharge tests
Averaged ion concentration in electrolyte, ce,01.0 × 10−31.0 × 10⁻³mol cm−3Controlled in cell fabrication
Exchange current density coefficient, ki011A cm−2Literature [32]
Charge-transfer coefficient, αa, αc0.5, 0.50.5, 0.5 Literature [32,34]
Li+ diffusion coefficient in solid phase, Ds50 × 10−125 × 10−12cm2 s−1Identified from charge/discharge tests
Solid phase conductivity, σ11S cm−1Literature [32,33,35,36,37]
Li+ diffusion coefficient in electrolyte, De2.08 × 10−82.08 × 10⁻⁸cm2 s−1Identified from charge/discharge tests
Bruggeman’s porosity exponent, p1.51.5 Literature [30,31,32,33,34]
Electrolyte phase ionic conductivity, κ15.8ce15.8ceS cm−1Literature [30,31,32,33]
exp(−13,472ce1.4)exp(−13,472ce1.4)
SEI resistance (multiplied by reaction area)300300Ω cm2Assumed (similar to [35])
Li+ transference number, t+00.3630.363 Literature [30,31,32,33,34]
Ohmic resistance (multiplied by cell area, including lithium metal, current collector and coin cell casing)8.08 × 10−68.08 × 10−6Ω cm2Calculated from cell dimensions
Table 3. Adjusted particle size for LTO anode at different C rates.
Current (LTO)0.045 C0.089 C0.13 C
Equivalent Rs (LTO)13 × 10−4 cm10 × 10−4 cm8.6 × 10−4 cm
Table 4. Adjusted thickness of the simulated graphite composite anode for the purpose of comparing the simulated performance of graphite and LTO half-cells.
ParameterHalf-Cell with GraphiteHalf-Cell with LTOUnit
Thickness of composite anode, δan35.0 × 10−435.0 × 10⁻⁴cm
Mass of composite anode2.324.23mg
Capacity from xmax to xmin0.870.97mAh
Table 5. Comparison of the difference in cs between the center and the surface of a solid particle in graphite and LTO half-cells at small and large current rates.
Δcs at Small Current (0.045 C)Δcs at Large Current (0.13 C)Increase of Δcs from Small Current to Charge Current
GraphiteDischarge0.955 × 10−3 mol cm−32.41 × 10⁻³ mol cm−3152%
Charge0.513 × 10−3 mol cm−31.52 × 10⁻³ mol cm−3196%
LTODischarge6.48 × 10−3 mol cm−37.26 × 10⁻³ mol cm−312%
Charge6.74 × 10−3 mol cm−37.77 × 10⁻³ mol cm−315%

