Extension of Operating Range in Pump-Turbines. Influence of Head and Load
by
 , and
, and
Carme Valero
*, 
Mònica Egusquiza
,
Eduard Egusquiza
,
Alexandre Presas
,
David Valentin
and
Matias Bossio
Center for Industrial Diagnostics and Fluid Dynamics (CDIF), Polytechnic University of Catalonia (UPC), Av. Diagonal, 647, ETSEIB, 08028 Barcelona, Spain
*
Author to whom correspondence should be addressed.
Energies 2017, 10(12), 2178; https://doi.org/10.3390/en10122178
Submission received: 31 October 2017
/
Revised: 13 December 2017
/
Accepted: 15 December 2017
/
Published: 19 December 2017
(This article belongs to the Special Issue Hydropower 2017)
Abstract
:Due to the increasing share of new renewable energies like wind and solar in the generation of electricity the need for power regulation and energy storage is becoming of paramount importance. One of the systems to store huge amounts of energy is pumped storage using reversible hydropower units. The machines used in these power plants are pump-turbines, which can operate as a pump and as a turbine. The surplus of electrical energy during low consumption hours can be converted into potential hydraulic energy by pumping water to a higher level. The stored energy can be converted into electricity again by operating the runner as a turbine. Due to new regulation requirements machines have to extend the operating range in order to match energy generation with consumption for the grid stability. In this paper the consequences of extending the operating range in existing pump-turbines have been studied. For that purpose, the data obtained after two years of condition monitoring were analyzed. Vibrations and pressure fluctuations of two pump-turbines of 85 MW each have been studied during pump and turbine operation. For turbine operation the effects of extending the operating range from the standard range of 45–85 MW to and increased range of 20–85 MW were analyzed. The change in vibration levels and signatures at very low load are presented with the identification of the phenomena that occur under these conditions. The influence of head in the vibration behavior is also presented. The appearance of fluid instabilities generated at part load that may produce power swing is also presented. Finally, the effect of head on the vibration levels for pump operation is shown and analyzed.
1. Introduction
At present, the share of new renewable energies (NRE) in the generation of electricity is quite important in some European countries. Because the energy generated by NRE is of random nature instabilities in the electrical grid, where generation has to match demand at any time, can be produced. A continuous balance between generation and consumption requires flexibility in the system. Pumped storage plants are able to start and stop in a short time, generate different levels of power, and store energy. Because of that, they are becoming key players in the stability of the electrical grid.
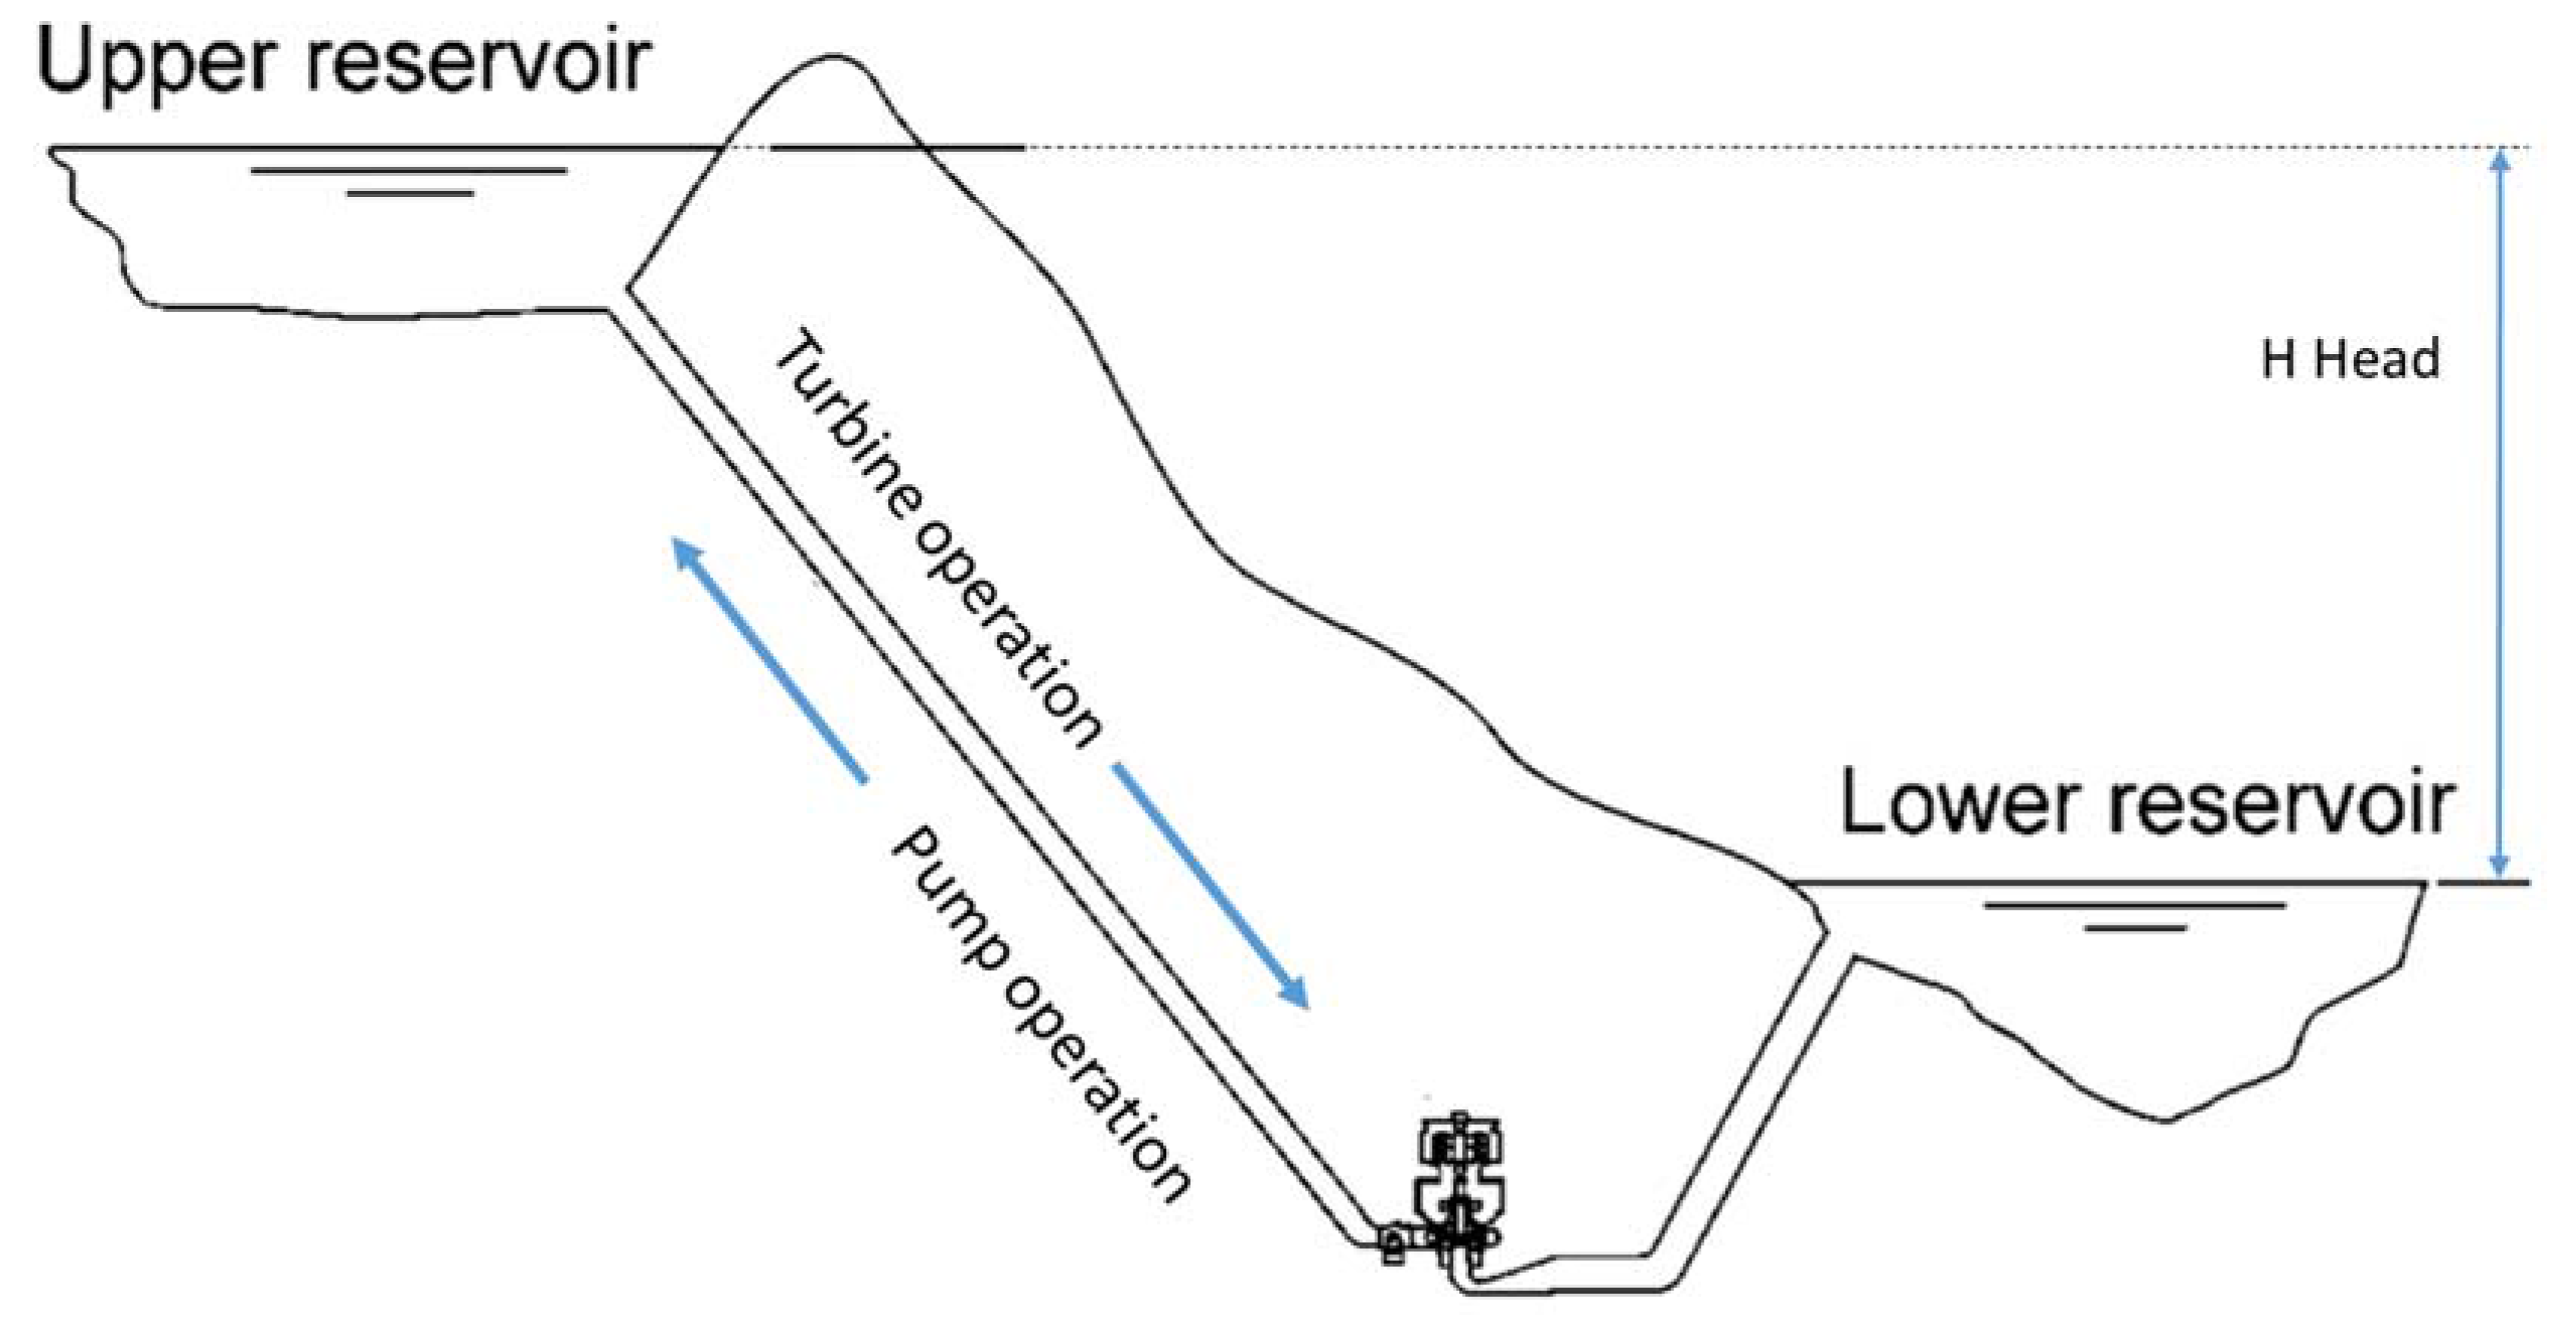
Pump-turbines are reversible machines used in pumped storage systems. They are high performance machines that can change their operation from pump to turbine mode only by reversing the direction of rotation of the runner. In Figure 1, a sketch of a pumped storage system has been represented. Pump-turbines convert hydraulic energy into electrical energy (turbine mode) or vice versa (pump mode). The surplus of energy during low consumption hours at night is used to pump the water from the lower reservoir to the upper reservoir, thus converting electrical energy into potential hydraulic energy. When electricity demand increases, the runner operates as a turbine in order to convert the stored energy back into electricity. The power depends on the head H (difference in levels between reservoirs) and on the discharge Q (mass of water per time unit). For turbine operation, the power supplied can be regulated by varying the opening degree of the guide vanes located at the entrance of the machine.
Pump-turbine sets consist of an electrical machine (motor-generator) and a hydraulic machine (pump-turbine). Because of this reversible behavior they have higher rotating speeds and higher pressures than conventional hydro turbines.
The operating range of pump-turbines, like all other hydraulic turbines, is limited. When these machines operate outside their best efficiency point vibrations and pressure fluctuations increase considerably, what can affect the operation of the machine and reduce their useful life. Therefore, the operating range (from minimum to maximum power) is limited by the manufacturers in order to avoid damage. Years ago, turbines used to operate around the best efficiency point but nowadays power plant operators are very interested in increasing the regulation capacity, because this is translated into a large increase in revenues [1] even though the lifetime of the machine is reduced.
When increasing the regulation capacity, turbines have to work at extreme off-design conditions and many problems may appear [2]. Strong pressure pulsations, instabilities in the draft tube and excessive turbulence can generate excessive vibration levels and stresses that can damage the machine [3,4,5,6]. Flow instabilities are basically caused by the interaction of the vortex rope produced in the draft tube with the overall system [7,8,9]. It is also known that flow instabilities at part load and overload can produce power fluctuations on the electrical grid (power swing). Cavitation erosion and excessive vibrations can increase the maintenance costs.
Although some of the fluid dynamic phenomena that may occur at part load on a Francis turbine have been much studied [10,11,12], the effects of deep part load have not been as much analyzed, especially in pump-turbines. Moreover, the studies are related to the fluid flow and carried out in a laboratory [13,14,15,16,17,18,19]. The only way to determine the effects of extreme off-design operation in an actual turbine is by measuring it in existing machines because the dynamics of the whole system (fluid and structure) cannot be reproduced in a laboratory. Only a few publications deal with this topic, some for pump turbines [20,21,22] and some for Francis turbines [23,24,25].
In this paper, the effects of increasing the operating range of an existing pumped storage hydropower plant are presented and discussed. For that purpose, vibrations and pressure pulsations were measured and collected over two years from the installed pump turbines by a monitoring system. The data obtained was then processed and analyzed in order to determine the feasibility of increasing the operating range of the machines. In case these pump turbines show a low risk of damage when working in extreme off-design conditions, the power plant operators would be given the possibility of increasing the flexibility of the system. With a better adjustment of the power outcome during peak hours, grid stability issues would be overcome and revenues would be increased.
2. Hydropower Plant and System Description
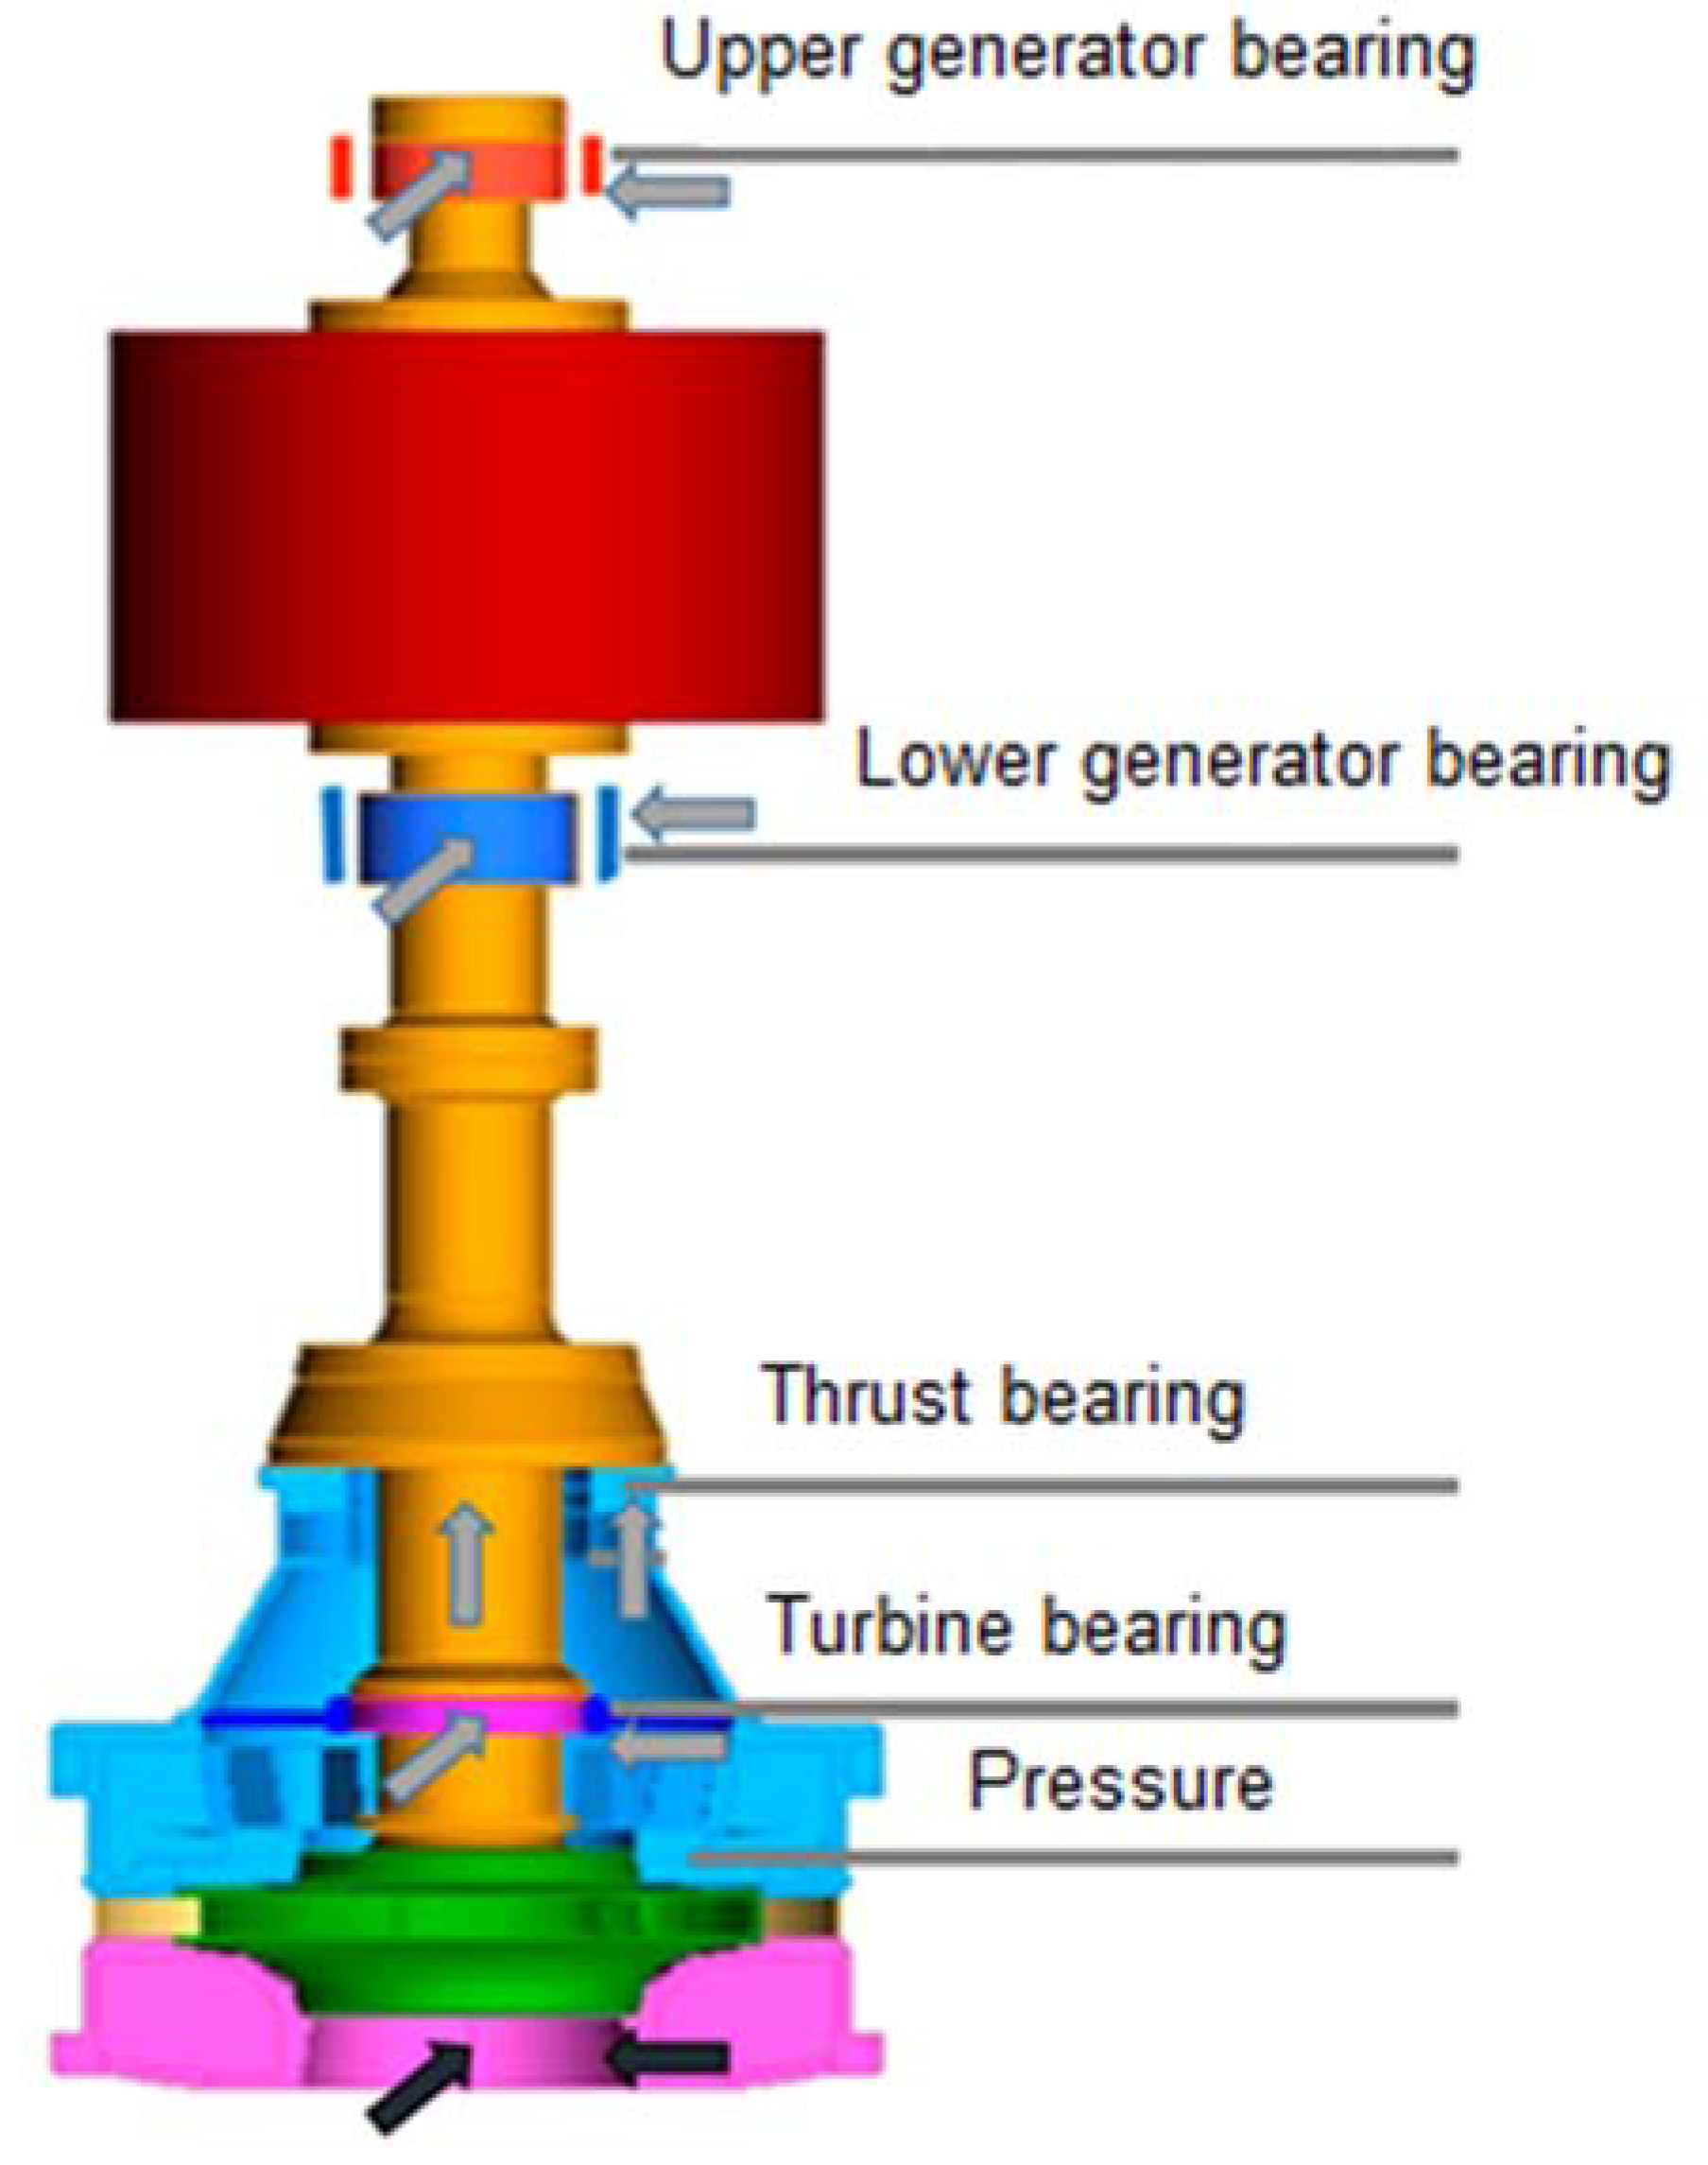
Two reversible pump-turbines operate at the power plant studied. Each unit has a maximum power of 85 MW. They are vertical shaft machines with three radial bearings (upper and lower generator and turbine) and one axial bearing (see Figure 2). The runner has 7 blades and the distributor 16 vanes. The rotational speed is of 500 rpm.
Two accelerometers separated 90° in the radial direction were installed on the upper and the lower generator bearing as well as on the turbine bearing. In addition, two accelerometers were located on the axial bearing. Pressure transducers were installed in the draft tube. All sensors are represented on Figure 2. The sensitivity of the accelerometers is of 100 mV/mms−1 and of 3092 V/bar for the pressure transducers. The operating conditions of the machine (head and guide vane opening degree) were acquired from the power plant control system (Scada).
A OneProd MVX monitoring system was installed in each unit. This system enables acquiring the signals from all the installed sensors in real time. The time domain signals were stored in the data base, as well as the overall vibration levels, the spectral bands and the spectra, which had to be previously processed. Because vibrations depend on the operating conditions of the machine (head and guide vane opening), several data bases were built-up according to these. The trending of these parameters was used to see the evolution of the condition of the machine. In Figure 3, a sketch of the monitoring system is shown. The acquisition system is located near the machine and connected via Ethernet cable to a computer with the monitoring software installed. Remote monitoring and diagnosis from outside the power plant is also possible using a remote access.
During operation, the water levels in the reservoirs are changing continually. The head H (see Figure 1) increases when pumping because the upper reservoir increases its level of water and the lower reservoir decreases it; likewise, the head decreases in turbine operation. In the case under study, the head was varying between 300 m and 330 m. In Figure 4, the change in the head with time can be observed (in blue for pumping mode and in red for turbine mode). It can be seen that the head level has increased by about 25 m in a short time (three days) because the machine has worked longer in pumping mode.
Another thing to be considered is that these machines are in regulation mode, which means they are changing their load continually in order to match the demand of electricity. Because generated vibrations depend on the operating conditions, the monitoring is complex. For this reason, the influence on the vibration levels of both parameters, head and load, has to be analyzed too.
Historically, in this power plant, the power generated during turbine operation was regulated between 45 MW and 85 MW. To determine the feasibility of increasing the operating range, the minimum operating load was reduced from 45 MW to 20 MW. Regular inspections of the unit were carried out to detect possible damage produced by this extension. To determine the effect of this reduction, data acquired during two years were analyzed.
For each machine, an investigation is made on the following parameters:
- The variation of global vibration levels (overall levels) depending on whether the unit is working as a turbine or as a pump.
- For turbine operation, the influence of head and load is analyzed. Operation at very low load (loads less than 30 MW) is especially taken into account.
- For pump operation only the influence of the head is analyzed because only one guide-vane opening degree is used in this case.
- The characteristics of the vibratory signatures and their variation with head and load conditions. The main phenomena that generate vibrations are identified in low and high frequency range.
3. Turbine Operation
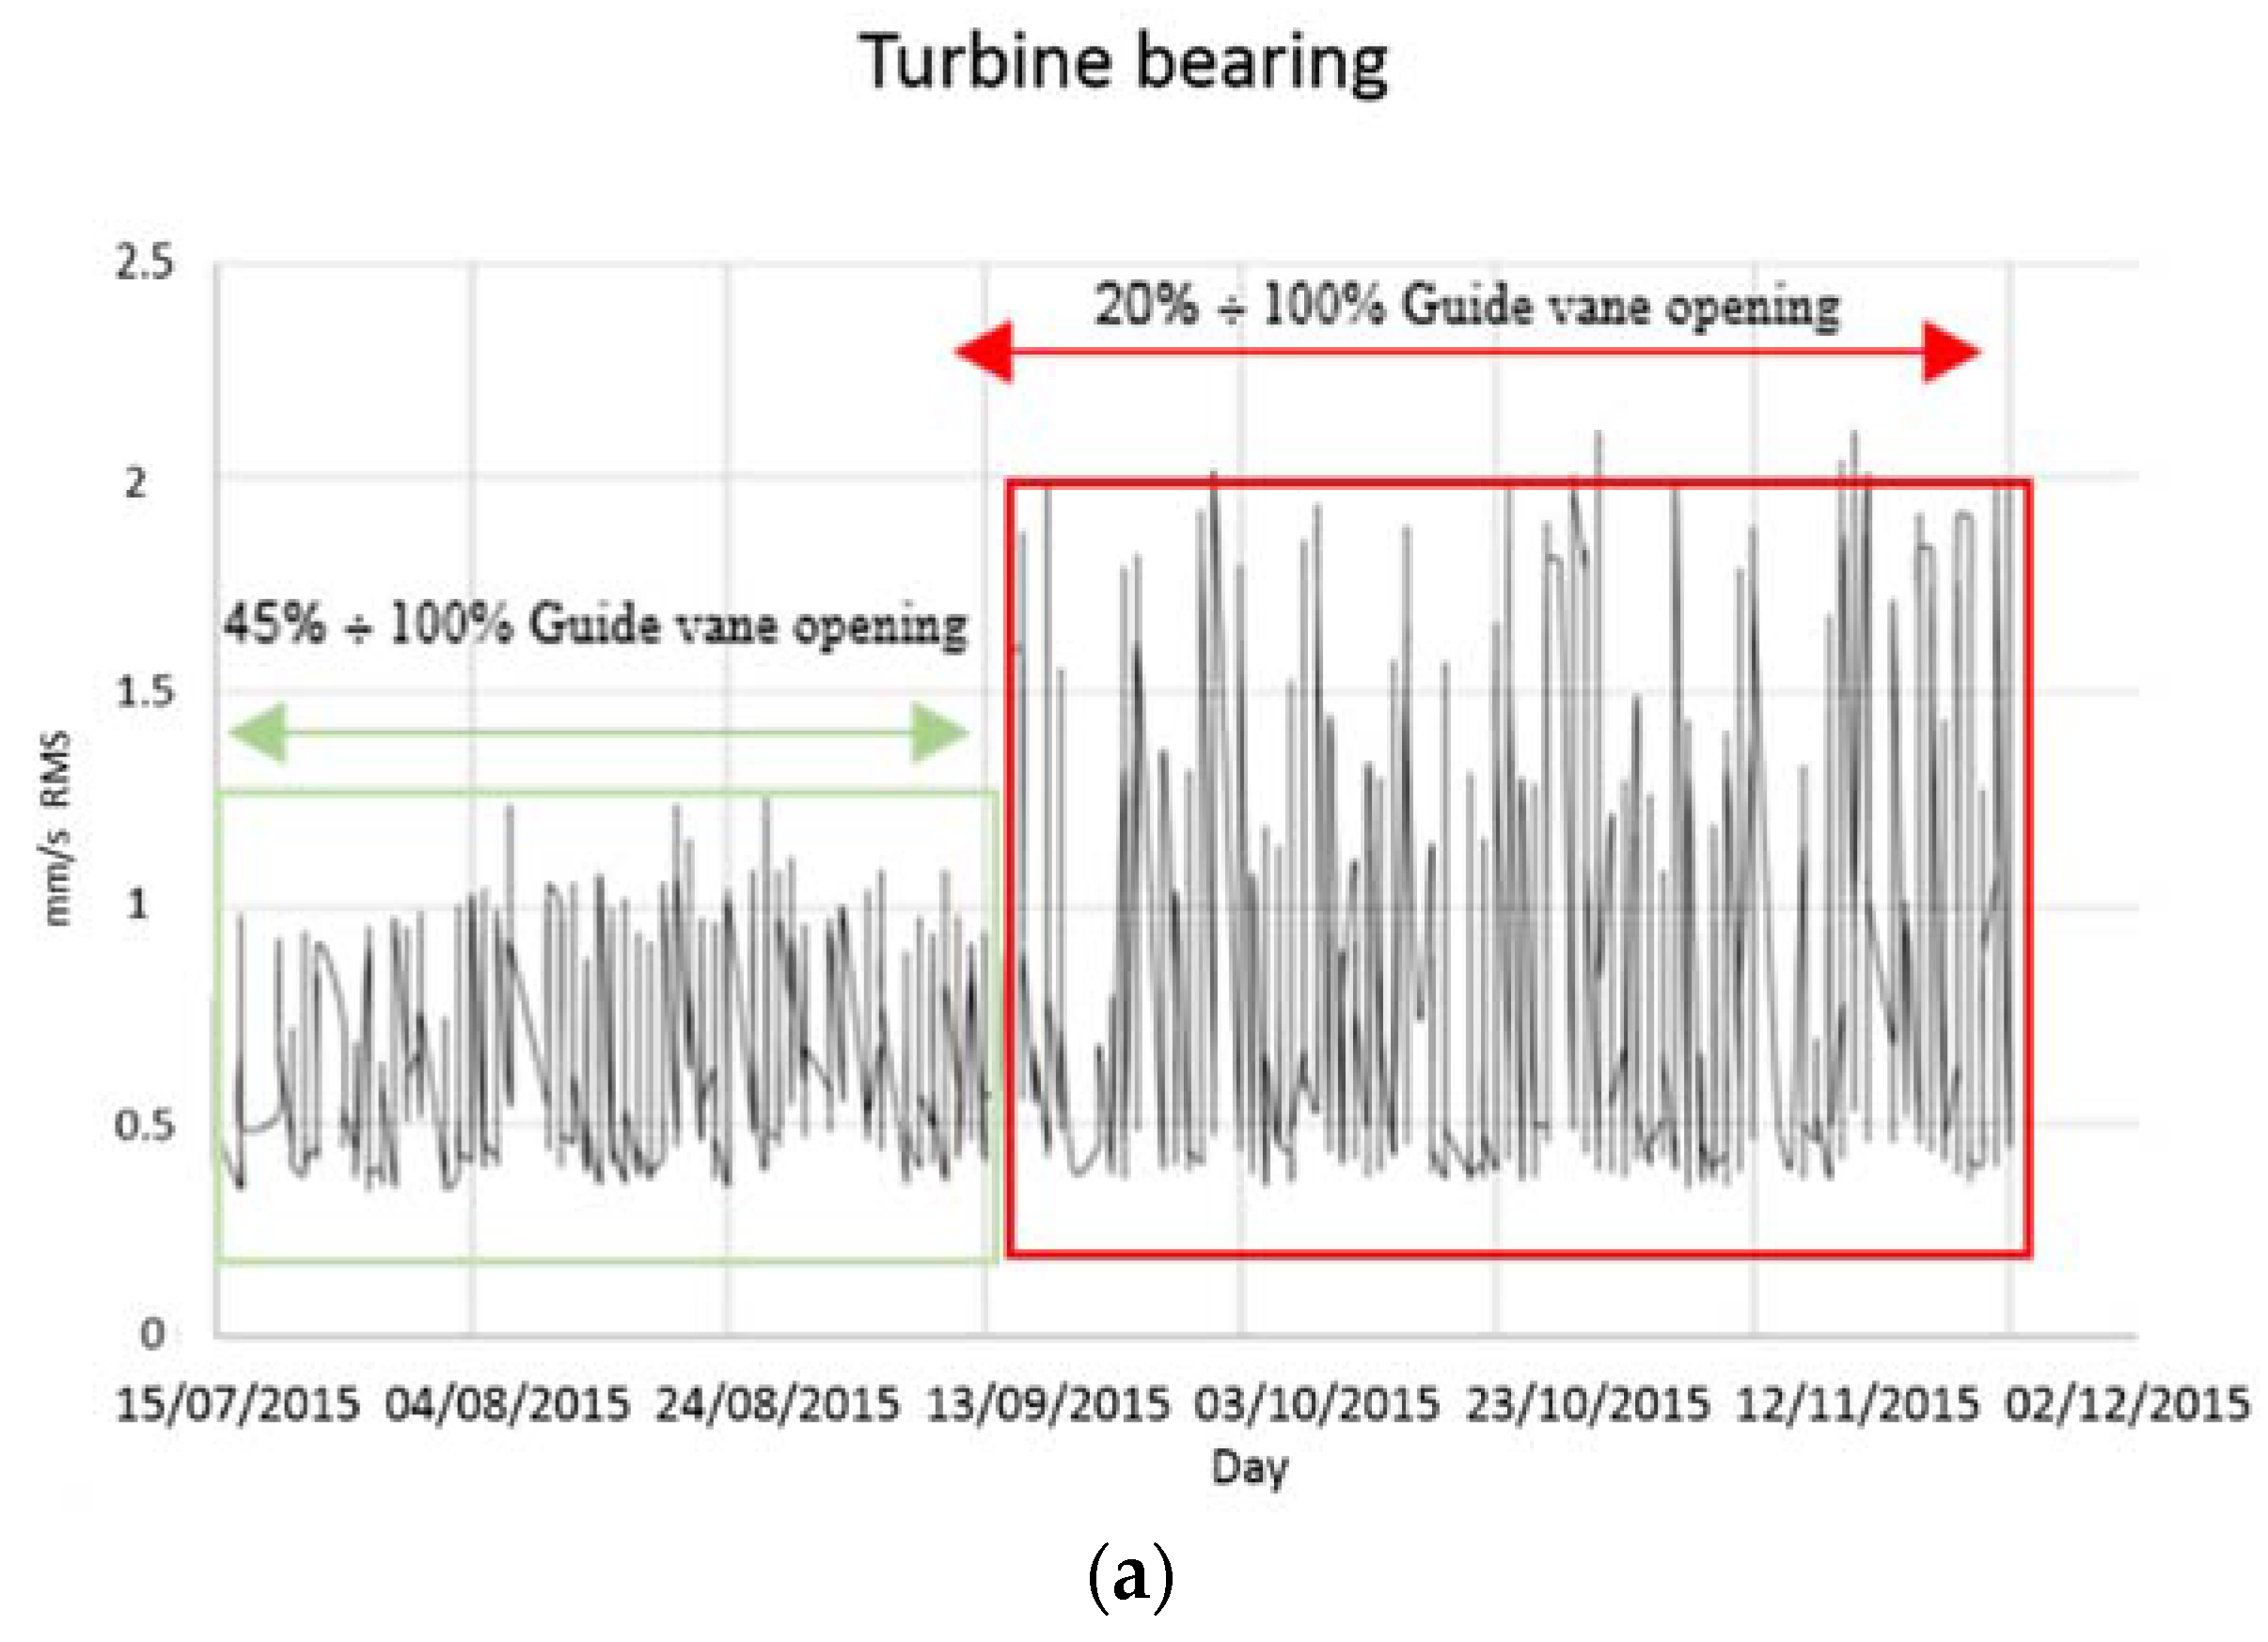
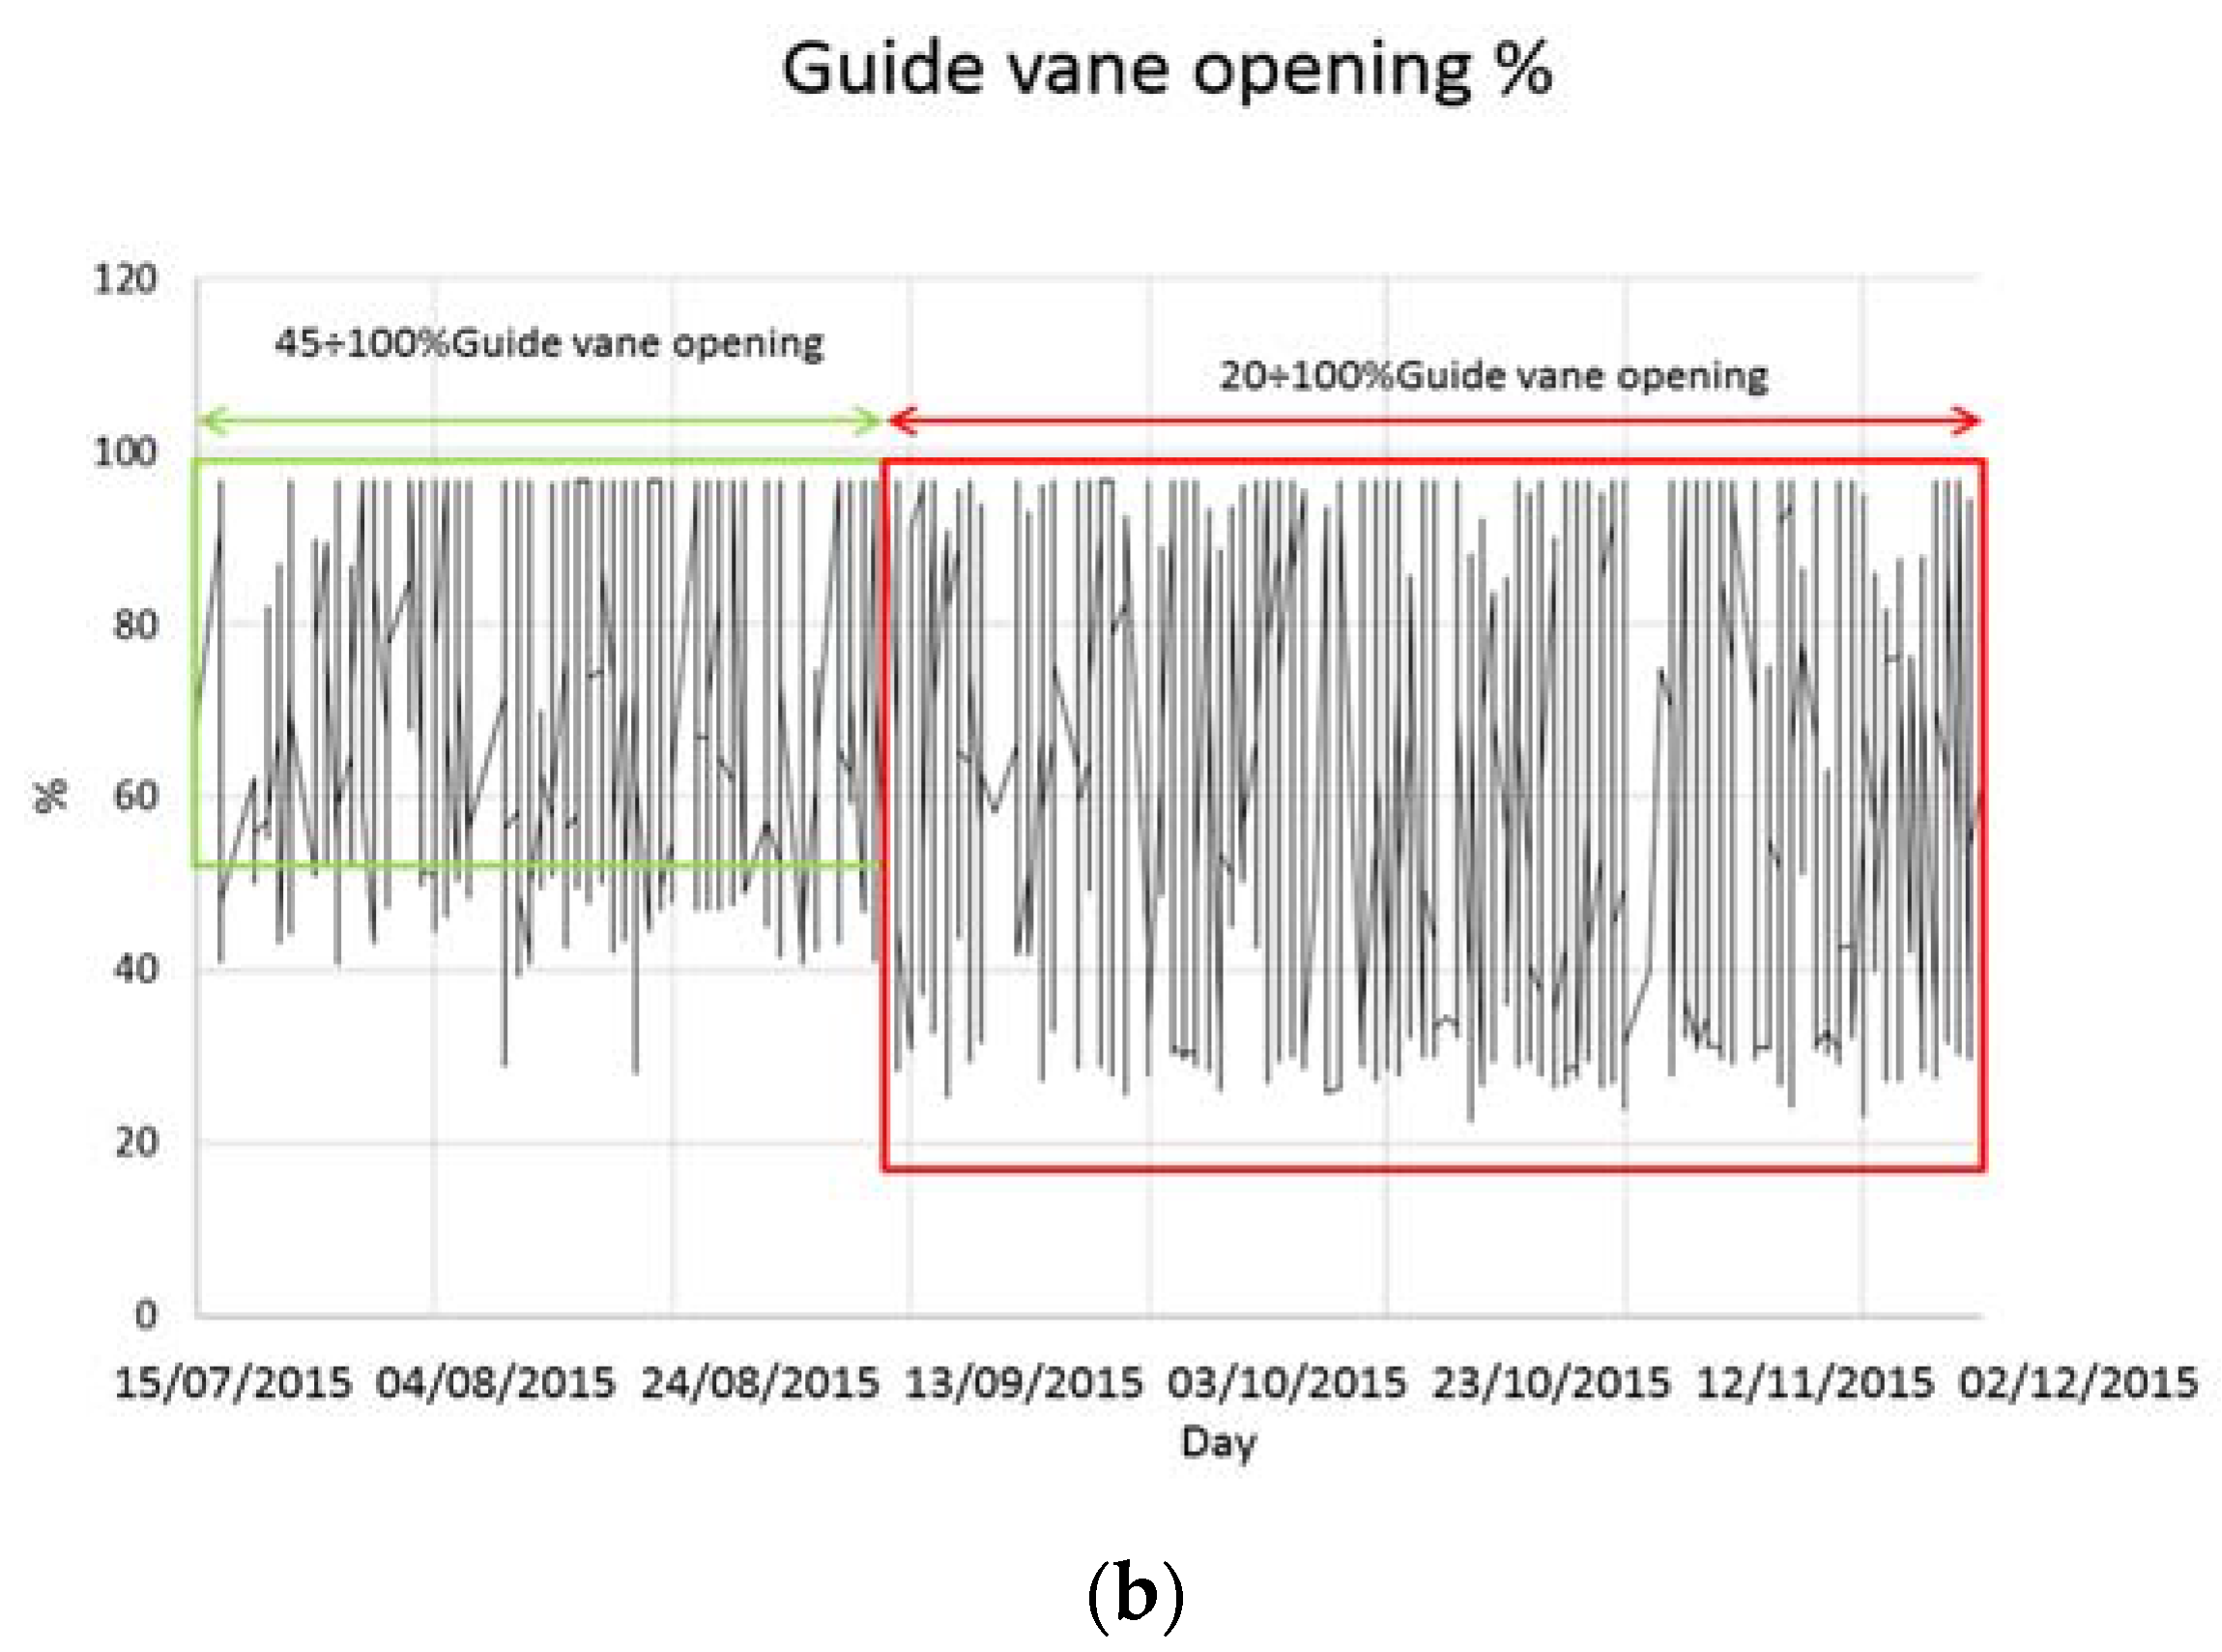
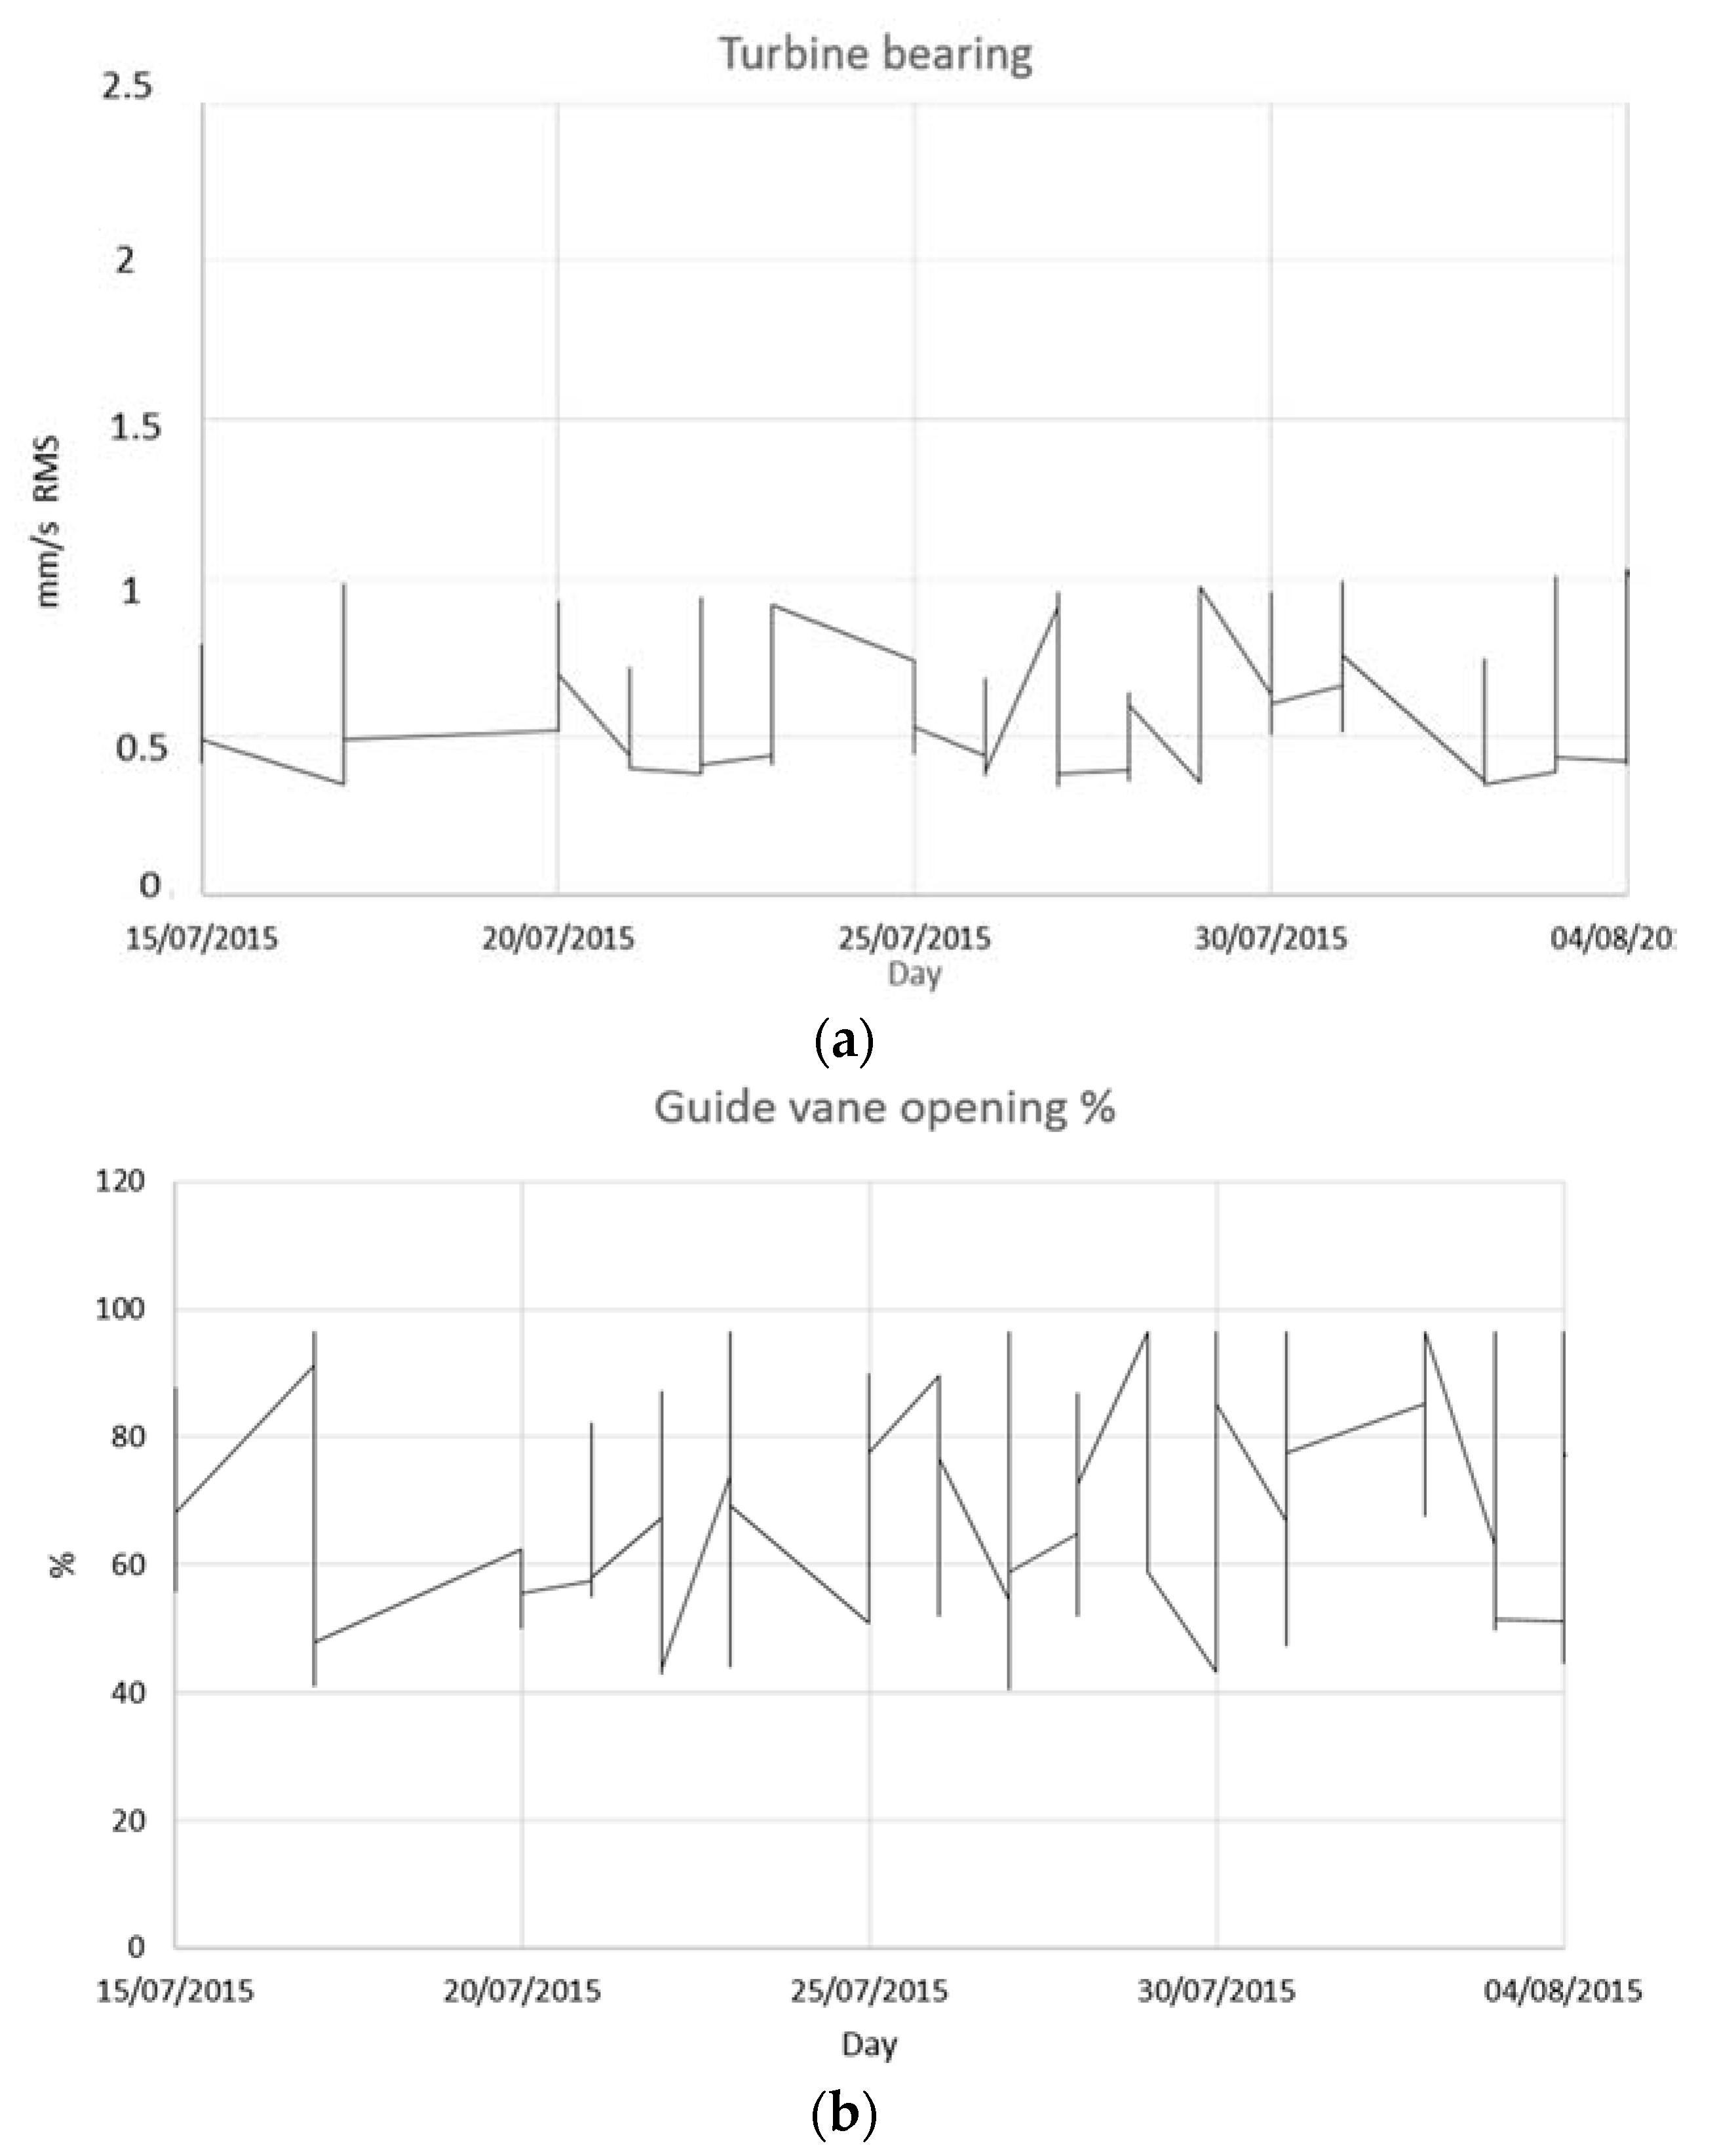
First, the evolution of vibrations at different loads is presented. In Figure 5a, the evolution of the overall vibration levels measured in the turbine bearing in mm/s for a period of about five months is shown. The overall vibration levels in mm/s rms give an indicator of the kinetic energy of the vibration and therefore of its severity. In Figure 5b, the changes in the guide vane opening degree (%) for the same period can be observed. At first sight, it can be seen that the vibration levels have important fluctuations and two zones can be clearly identified: the first corresponding to a normal operating range between 45% and 100% of guide vane opening degree (green frame in Figure 5) and the second with the extended operating range from 20 to 100% (red frame in Figure 5). In the normal operation zone, the overall levels change from 0.5 mm/s to 1 mm/s rms and with the extended operating range, the levels change from 0.5 mm/s to 2 mm/s rms. It can be seen that operation at deep part load (20%) substantially increases the vibration levels.
In Figure 6 a zoom is made to better observe the variations of vibrations with the operating conditions. In this figure, it can be seen that overall values depend much on changes in load but there is no clear relationship between both parameters. The influence of the other parameter, the head, will be analyzed below.
3.1. Analysis of Overall Levels
3.1.1. Effect of the Position
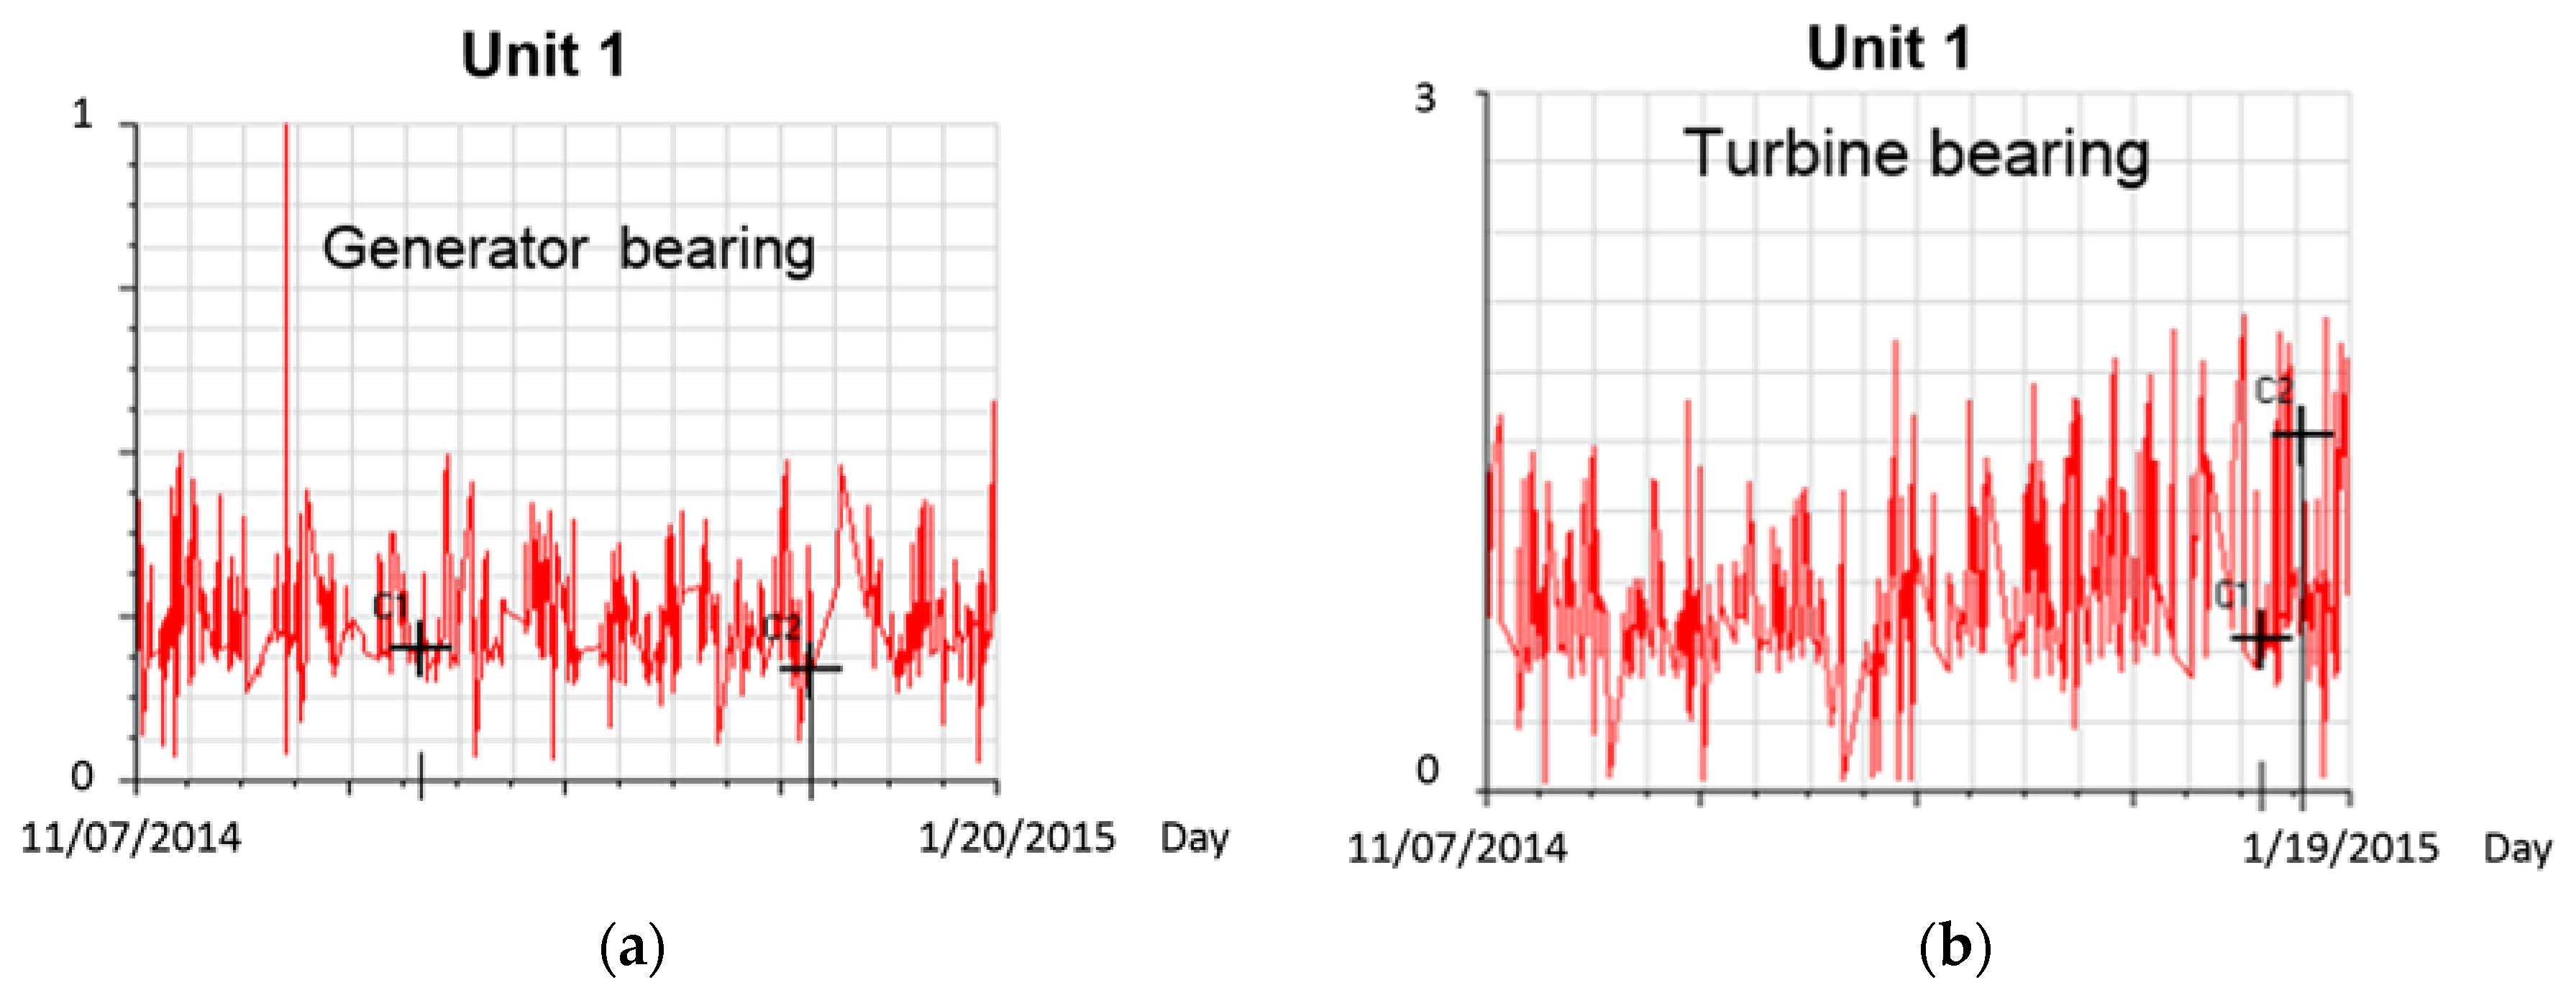
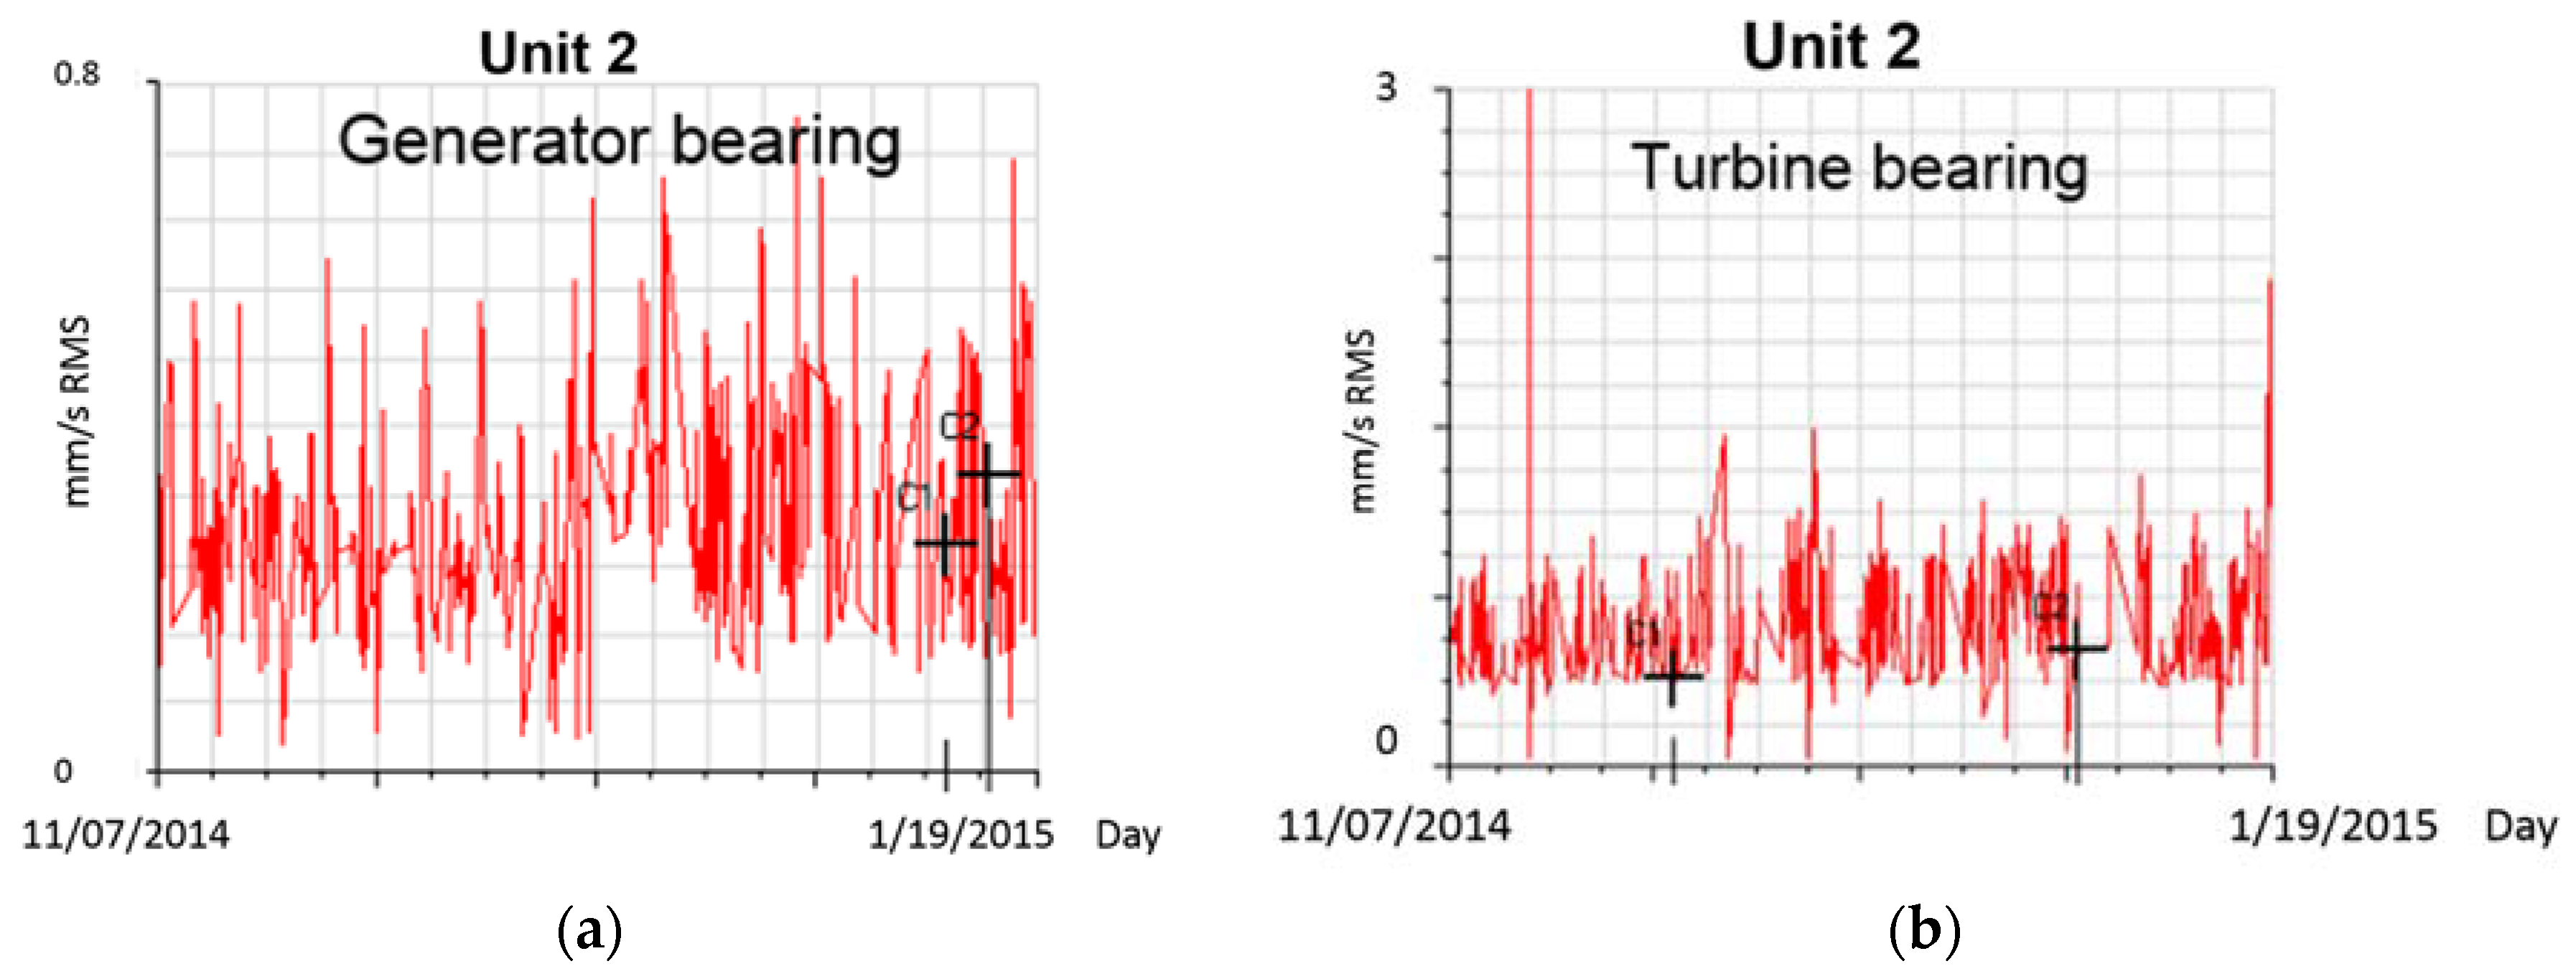
In Figure 7 the overall vibration levels for different values of head and for different guide vane openings are represented for Unit 1. X-axis represents time (in days and hours) and Y–axis represents the overall level (mm/s). Comparing vibrations measured with the accelerometers at different locations (turbine and generator bearings) it can be seen that vibration levels in the turbine bearing are higher than in the generator bearing. The values fluctuate considerably because both change with the operating point (head and guide vane opening). This indicates that the main excitation forces are of hydraulic origin. The other machine of the power plant (Unit 2), has a similar behavior. In Figure 8 the change in vibration levels (mm/s RMS) in Unit 2 during regulation can be observed.
3.1.2. Effect of the Load
Because both head and guide vane opening affect the vibration characteristics, in order to separate the influence of each parameter, the effect of guide vanes opening for a constant head, is discussed in this section.
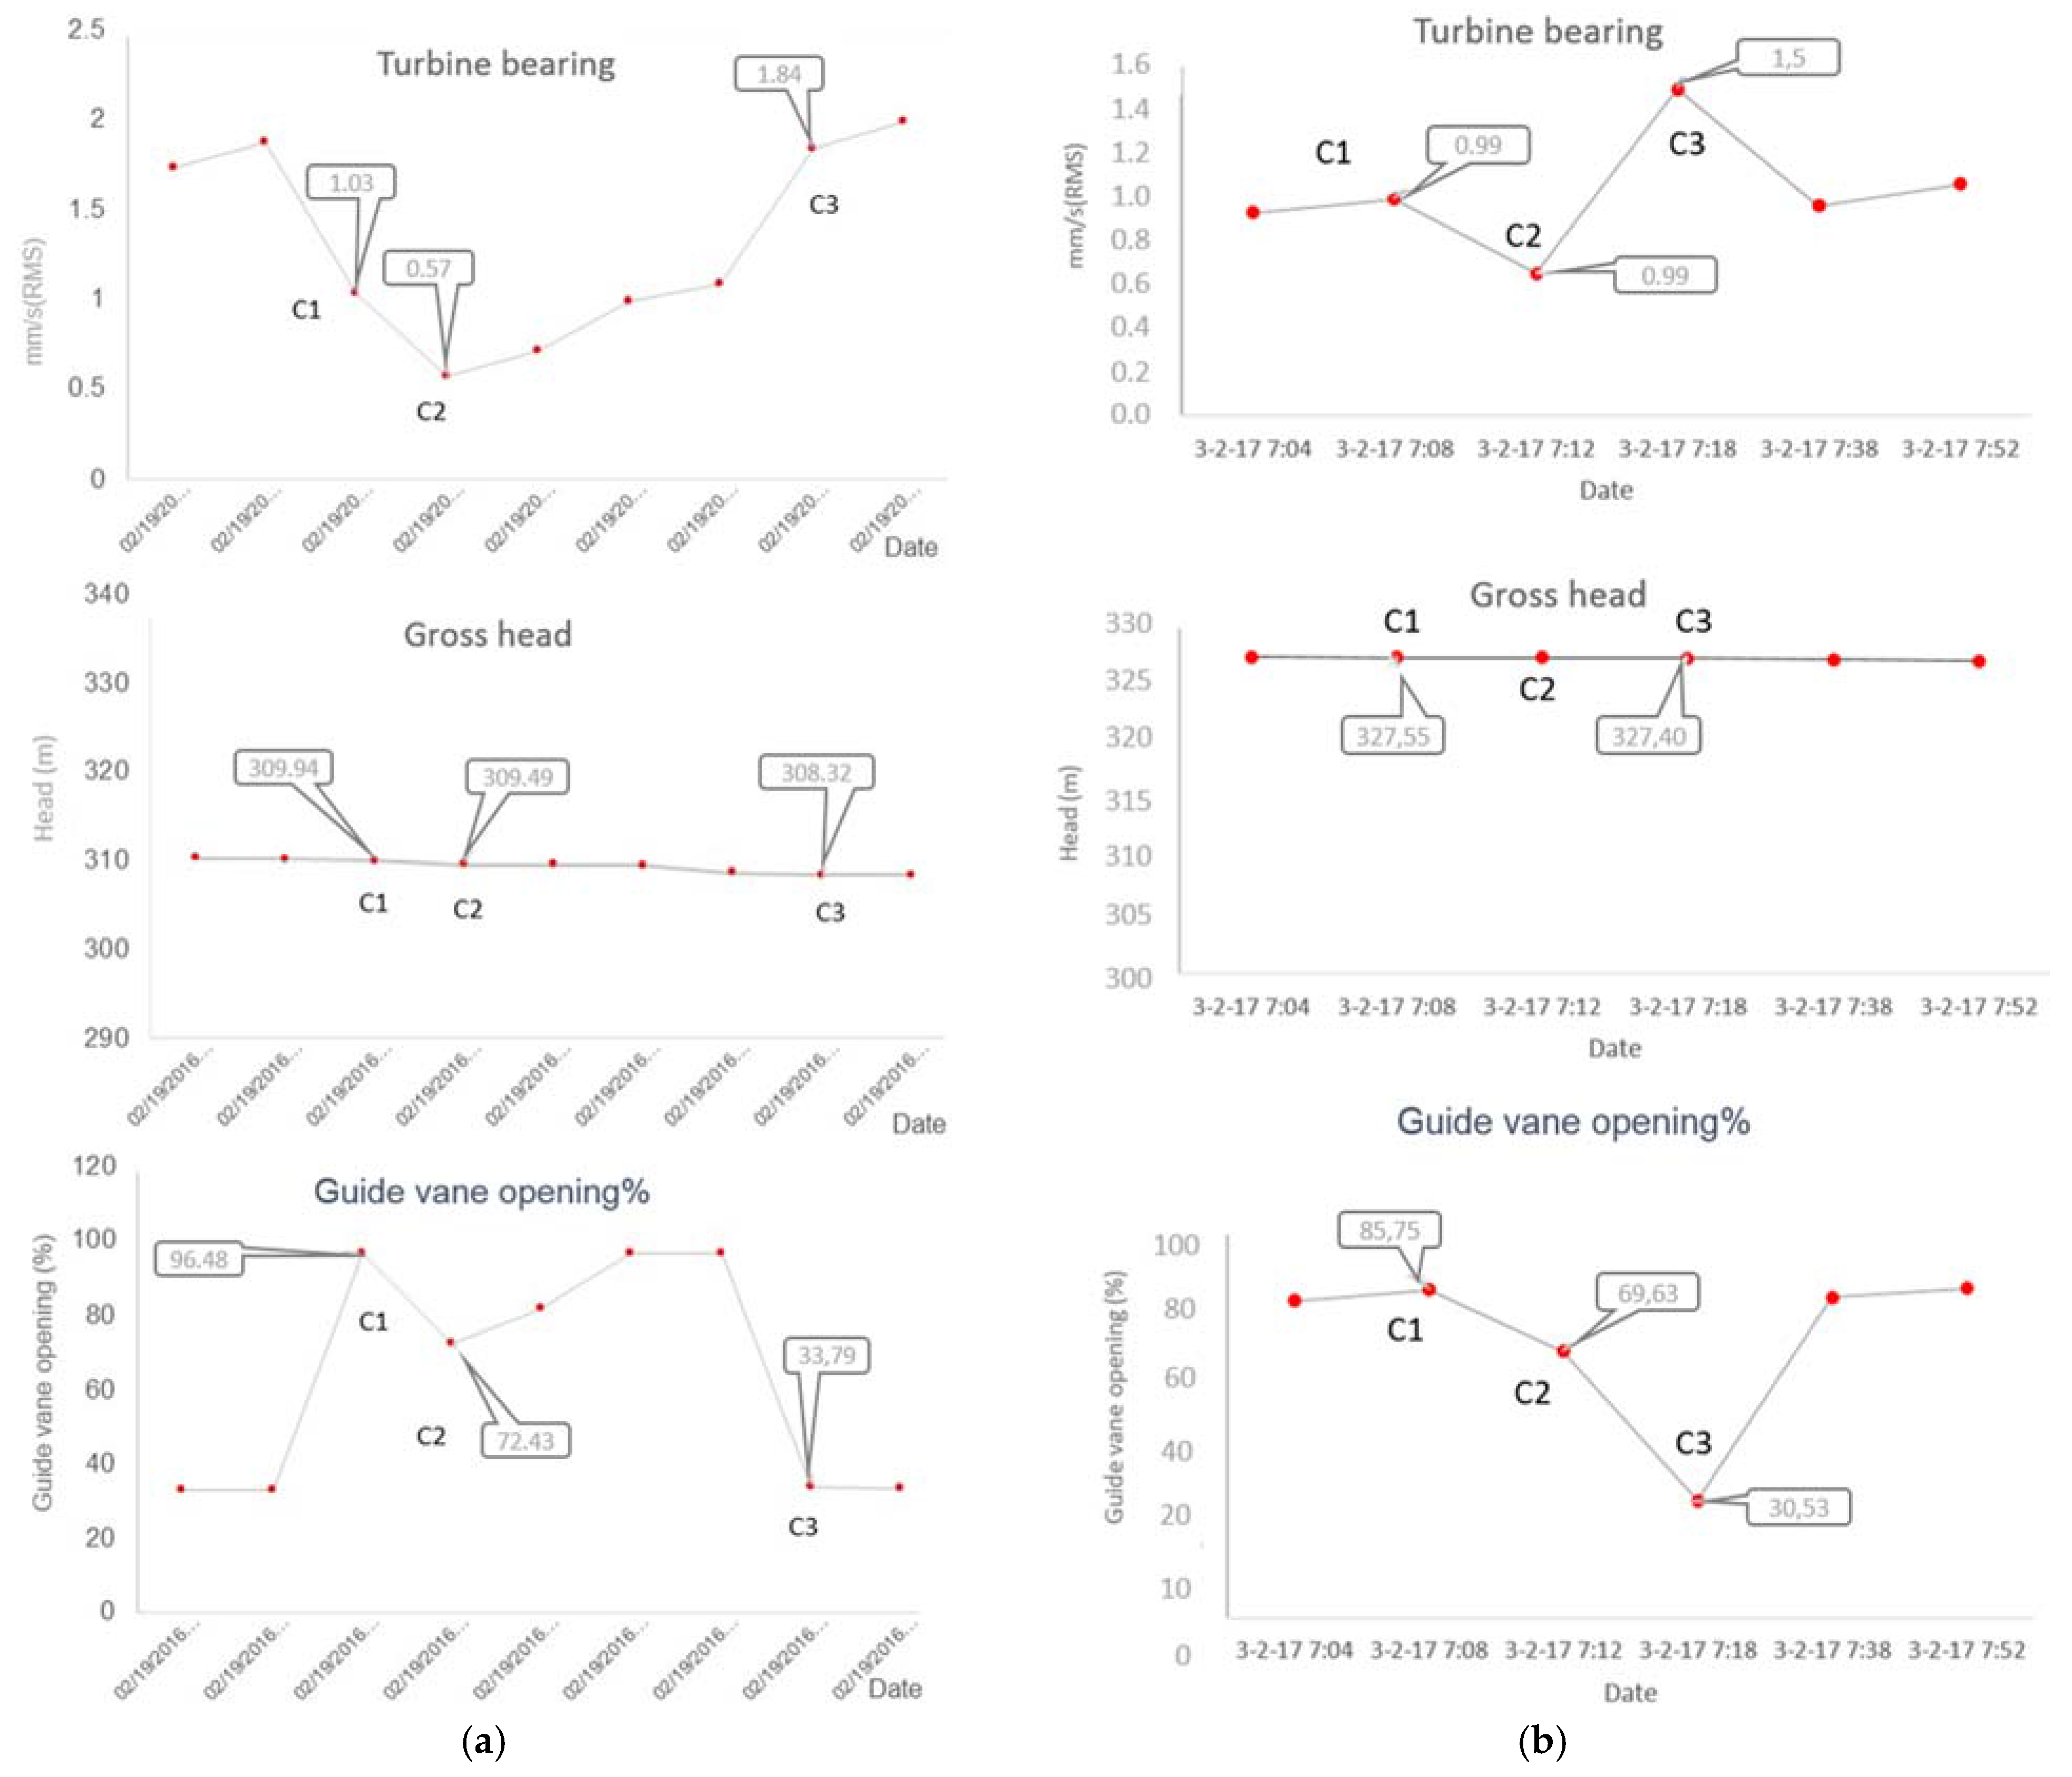
In Figure 9a the change of different measured magnitudes versus time (different hours for the same day) for the Unit 1 can be seen:
- In the upper section, the change in the overall vibration levels in mm/s has been represented. It can be seen that levels change between 0.5 mm/s and 2 mm/s in a few hours.
- In the middle section, the variation in head (water levels in the reservoirs) is shown. In this case, there is almost no change in head during the period studied (constant value around 309 m).
- In the lower section, the different positions of the guide vane can also be seen. The lower the position of guide vanes, the lower the load and vice versa.
When the machine passes from maximum load (guide vane opening of 96% (position C1)) to the minimum load (guide vane opening of 33.78% (position C3)) (see Figure 9a at the bottom) vibration levels suffer a change first decreasing and then increasing (see Figure 9a at the top). The minimum levels occur when the machine operates around the nominal load of 70% (position C2 in Figure 9a bottom). Vibration levels are higher at maximum load (guide vane opening of 95.5% (position C1), see Figure 9 at the top) and especially at part load (C3) when the opening is of 33.78%. In general, high vibrations are related to low loads and low vibrations are related to loads between 60% and 80% of guide vane opening. Similar behavior occurs in Unit 2 (Figure 9b) where the changes in vibration levels with opening degree for a constant head of 327 m are shown.
3.1.3. Effect of the Head
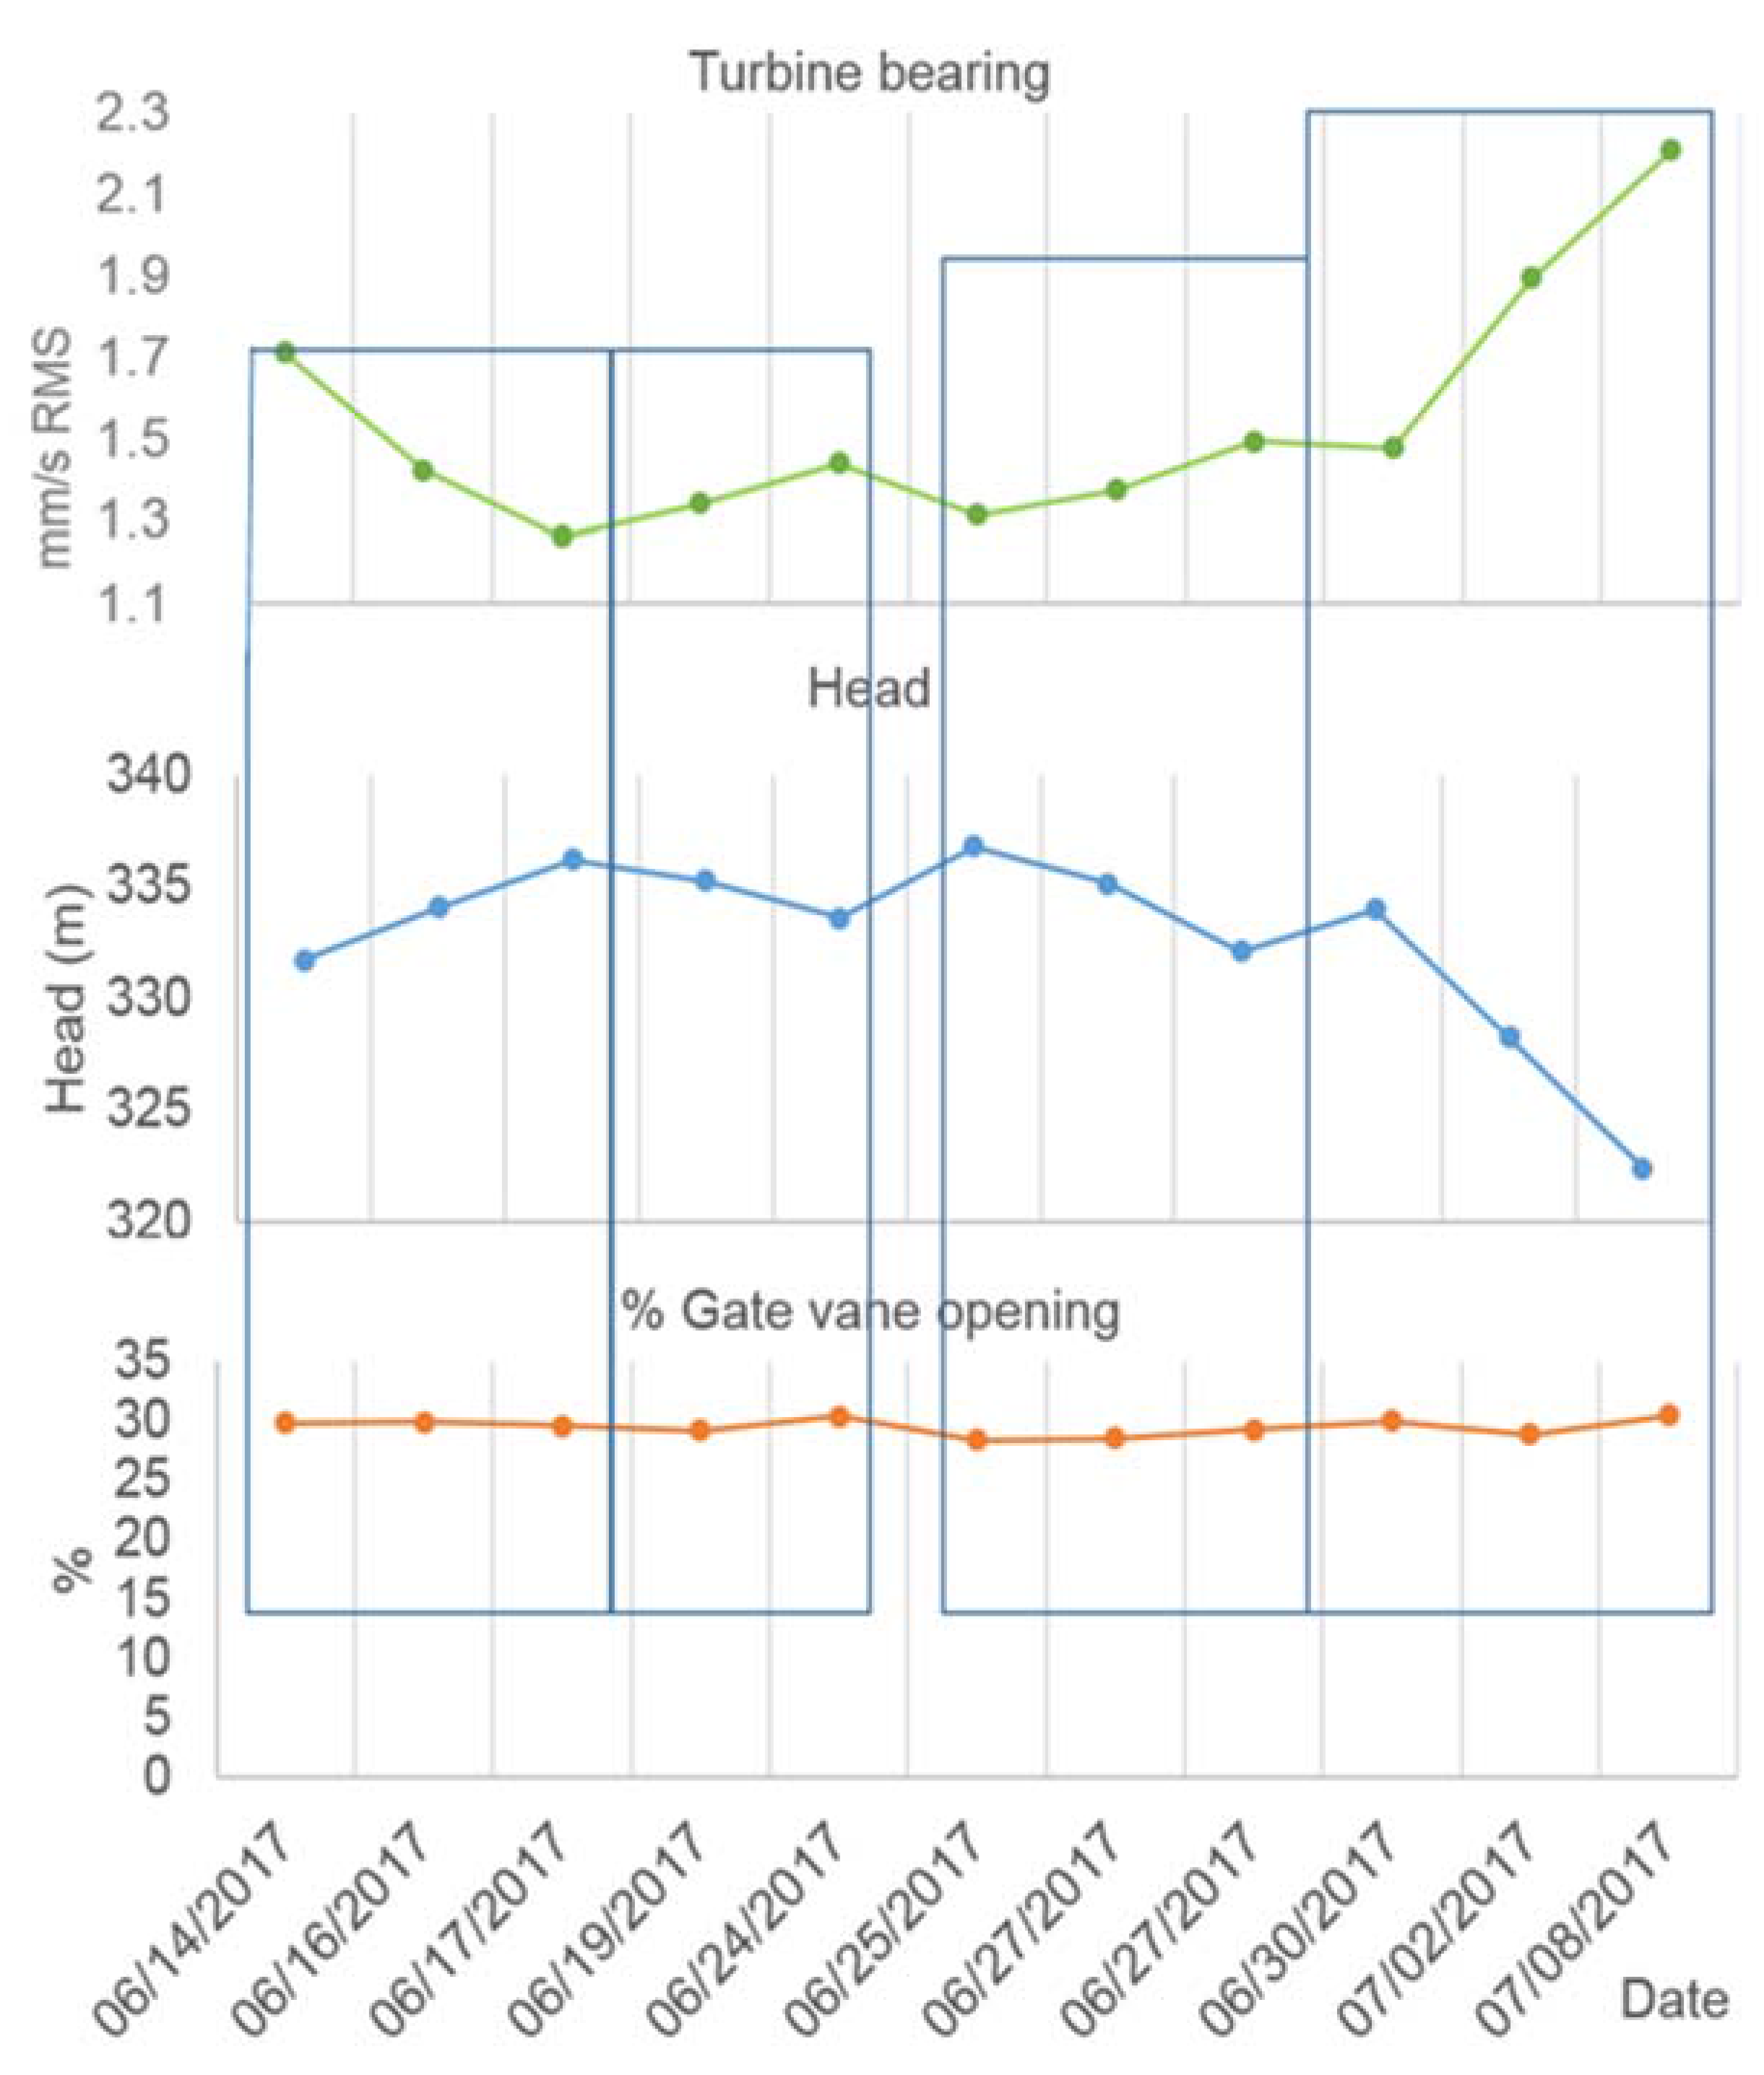
Another significant parameter affecting the vibration levels is the head. In Figure 10, the change in vibration levels with head for a constant guide vane opening (around 30%) when the machine is operating at minimum load can be seen. The decrease in head produces a significant increase in the vibration levels because there is more turbulence due to the off-design operation. Vibration levels are at maximum when head is the lowest.
Consequently, the worst situation is produced when the machine operates at minimum load with minimum head. The reason for this variation is discussed in the next section.
3.2. Analysis of Vibration Signatures
To identify the causes of the change in the overall vibrations levels and the effects of operating the machine at deep part load, the vibration signatures for different loads and heads were analyzed.
It is known that the main excitations generating vibrations are of:
- Hydraulic origin;
- Mechanical origin;
- Electromagnetic origin.
Excitations of mechanical origin are generated by the forces appearing in any system with masses in rotation around an axis (for example, unbalances). Excitations of electromagnetic origin are produced by the electromagnetic fields coming from motors or generators.
Several fluid dynamic mechanisms can generate hydraulic excitations, being the most important one in hydraulic machines the interaction between the rotating runner blades and the stationary guide vanes, what is known as rotor stator interaction (RSI) [26]. The RSI generates periodic pressure pulsations and vibrations with frequencies of:
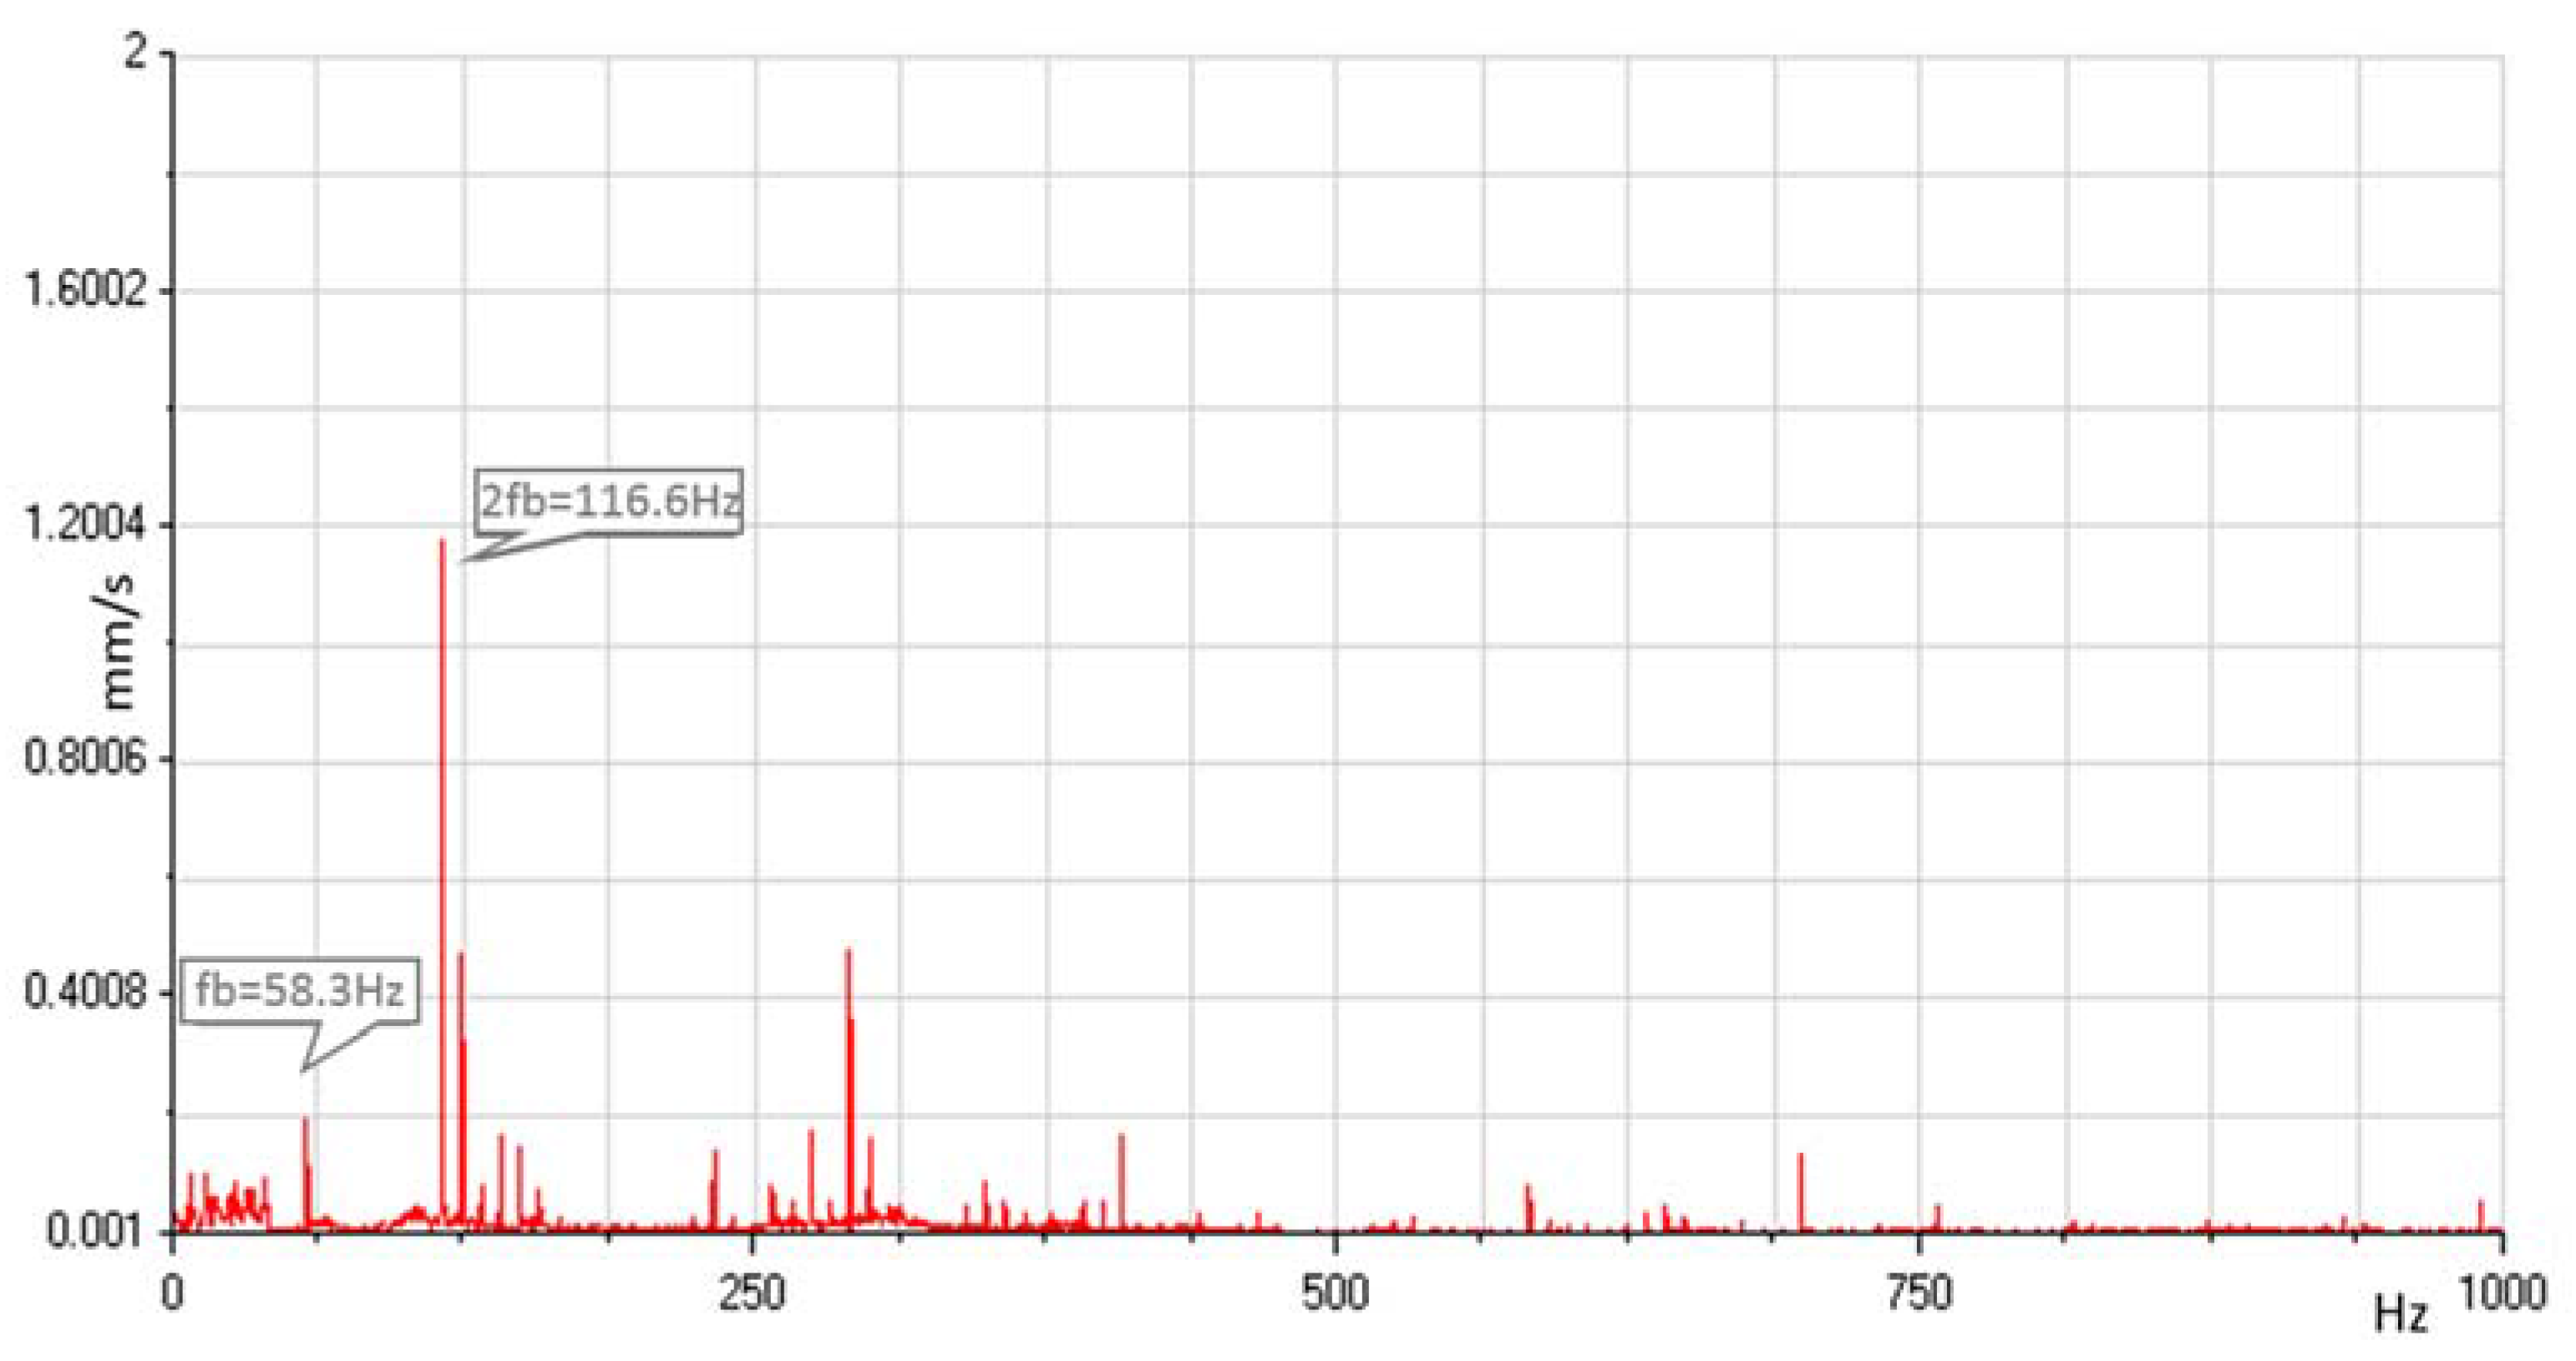
where fb is the blade passing frequency, ff (500 rpm/60 = 8.3 Hz) is the rotating frequency of the runner in Hz, Zb the number of rotating blades (7 blades in our case) and n the order of harmonic. In pump-turbines this is one of the most important excitations generated that can lead to fatigue damage in the runner. In this machine, pressure pulsations and vibrations are generated at the blade passing frequency and harmonics (fb = n·78.33 = n·58.31 Hz). For a combination of 7/16 blades the predominant frequency is twice the blade passing frequency (116.62 Hz). In Figure 11 the spectra of turbine vibrations are shown. The peaks of rotor-stator interaction can be seen. The amplitude of this excitation depends on several parameters being the most important ones the combination of runner blades and guide vanes, the radial gap between runner blades/guide vanes, the blade load, and the hydraulic system response.
fb = n ∙ Zb ∙ ff
The dynamic response of the runner is affected by the added mass and by the radial and axial gaps size [26,27,28,29,30,31]. Vibrations generated depend on the excitation forces and on the dynamic response of the runner, thus they are much affected by these gaps. In the pump-turbine under study the radial gaps do not change significantly with operating hours (only some wear occurs in the labyrinth seals). This change is not detectable in the vibration behavior signatures during the time of the study, compared to the effect of other parameters.
In Figure 12 the spectral signatures of the vibration for different operating conditions have been represented. The frequency range in this case is 0–1000 Hz and the resolution is 0.3125 Hz. Figure 12 top shows the change in the signatures with head for part load operation and Figure 12 bottom shows the same but for high load operation. A predominant peak at 2 fb = 116.62 Hz can be identified in all spectra, whose amplitude increases with head and with load. This is normal because the blade load depends on these parameters and when load increases blade load increases too. Moreover, the gap between the impeller and the distributor decreases.
Another characteristic of the vibrations represented is that when load decreases there is an increase in the random excitation because when the machine operates at off-design the flow is more turbulent [32]. One more phenomena that can occur when extending the operating range is the appearance of hydraulic instabilities produced by cavitation (cavitation vortex rope). The consequences of this cavitation could lead to serious problems on the stability of the electrical grid.
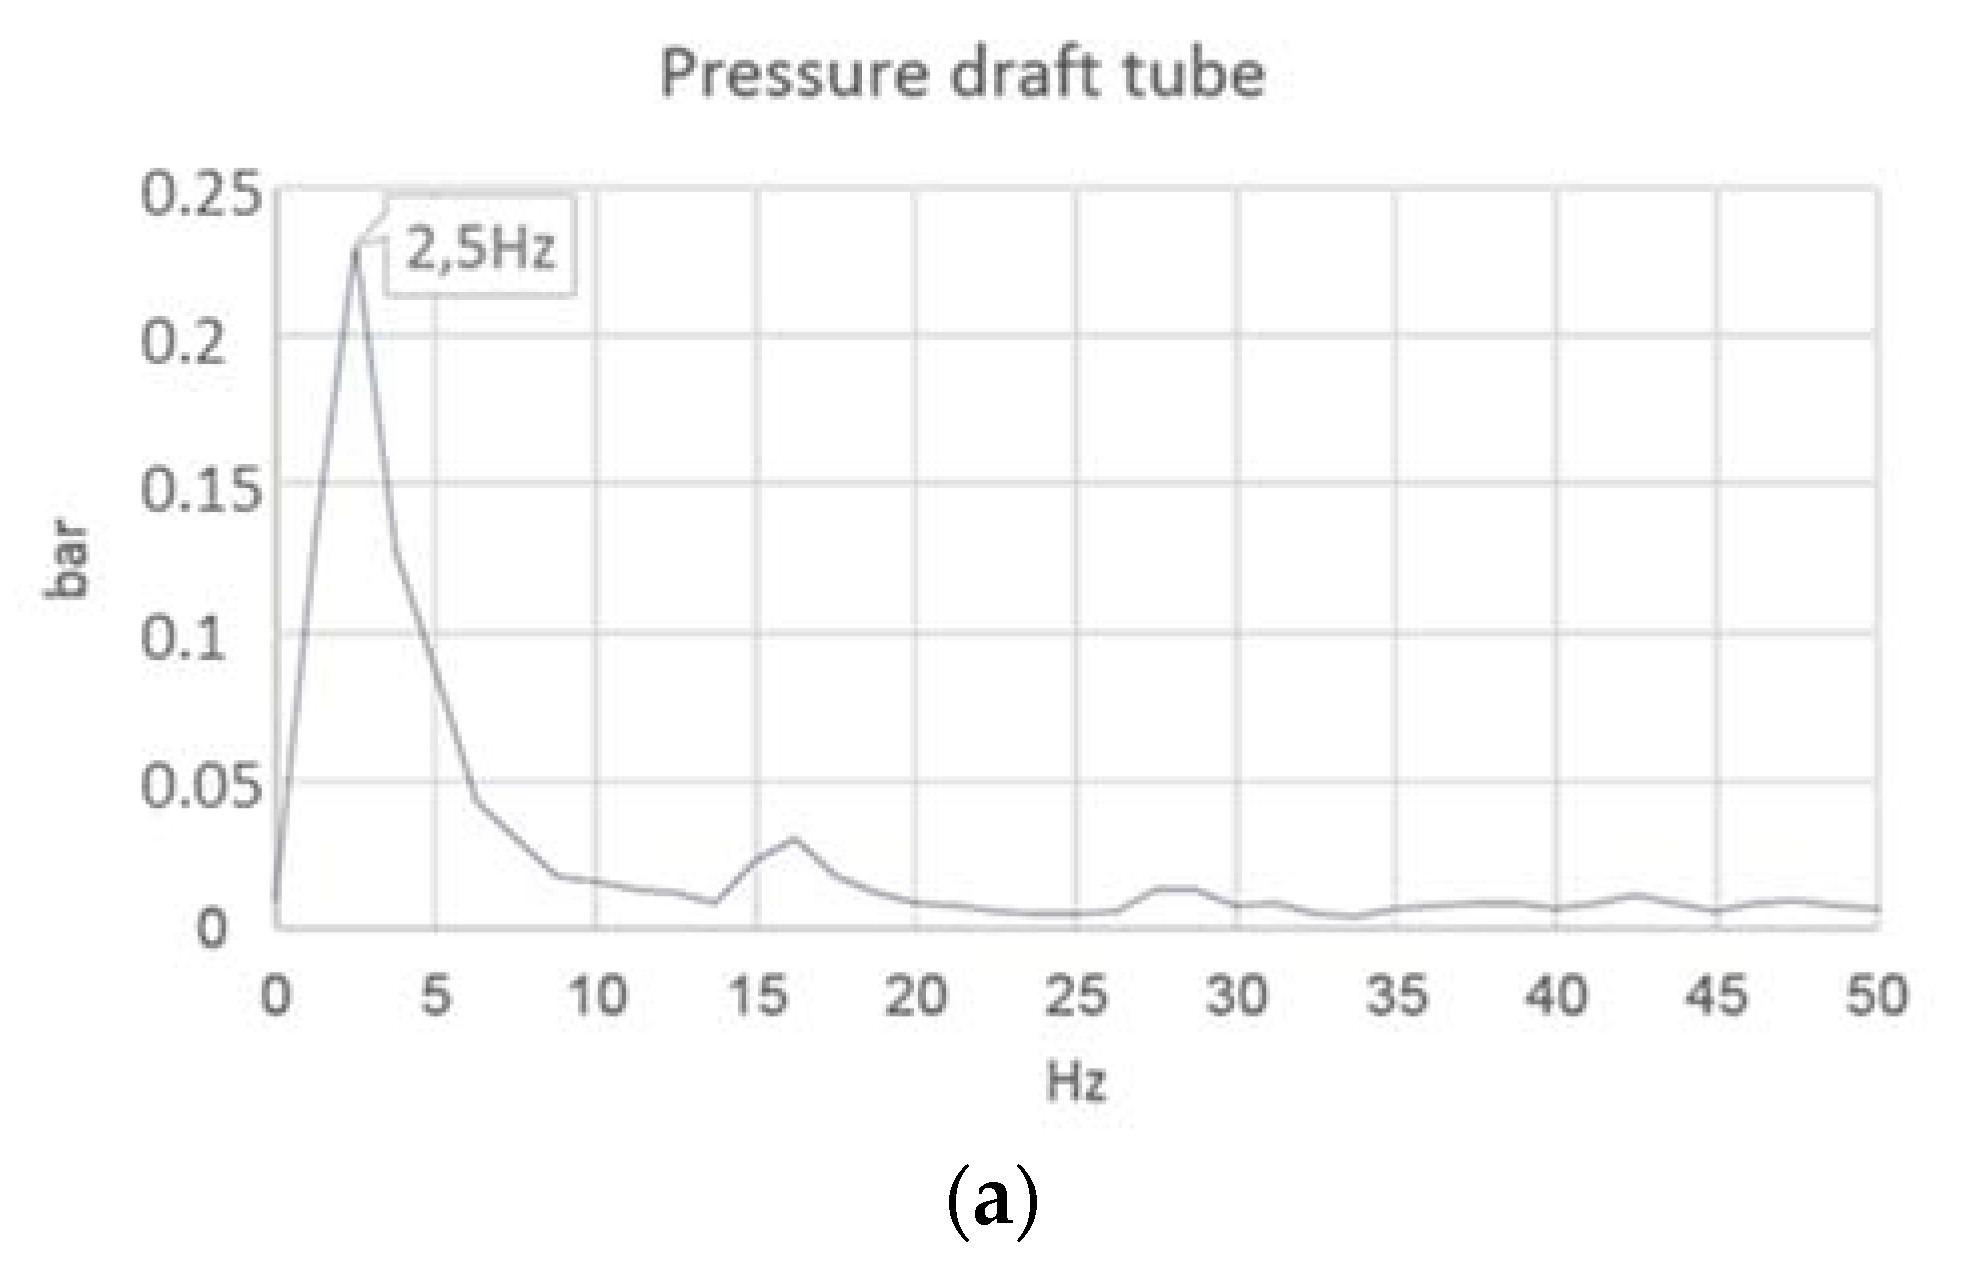
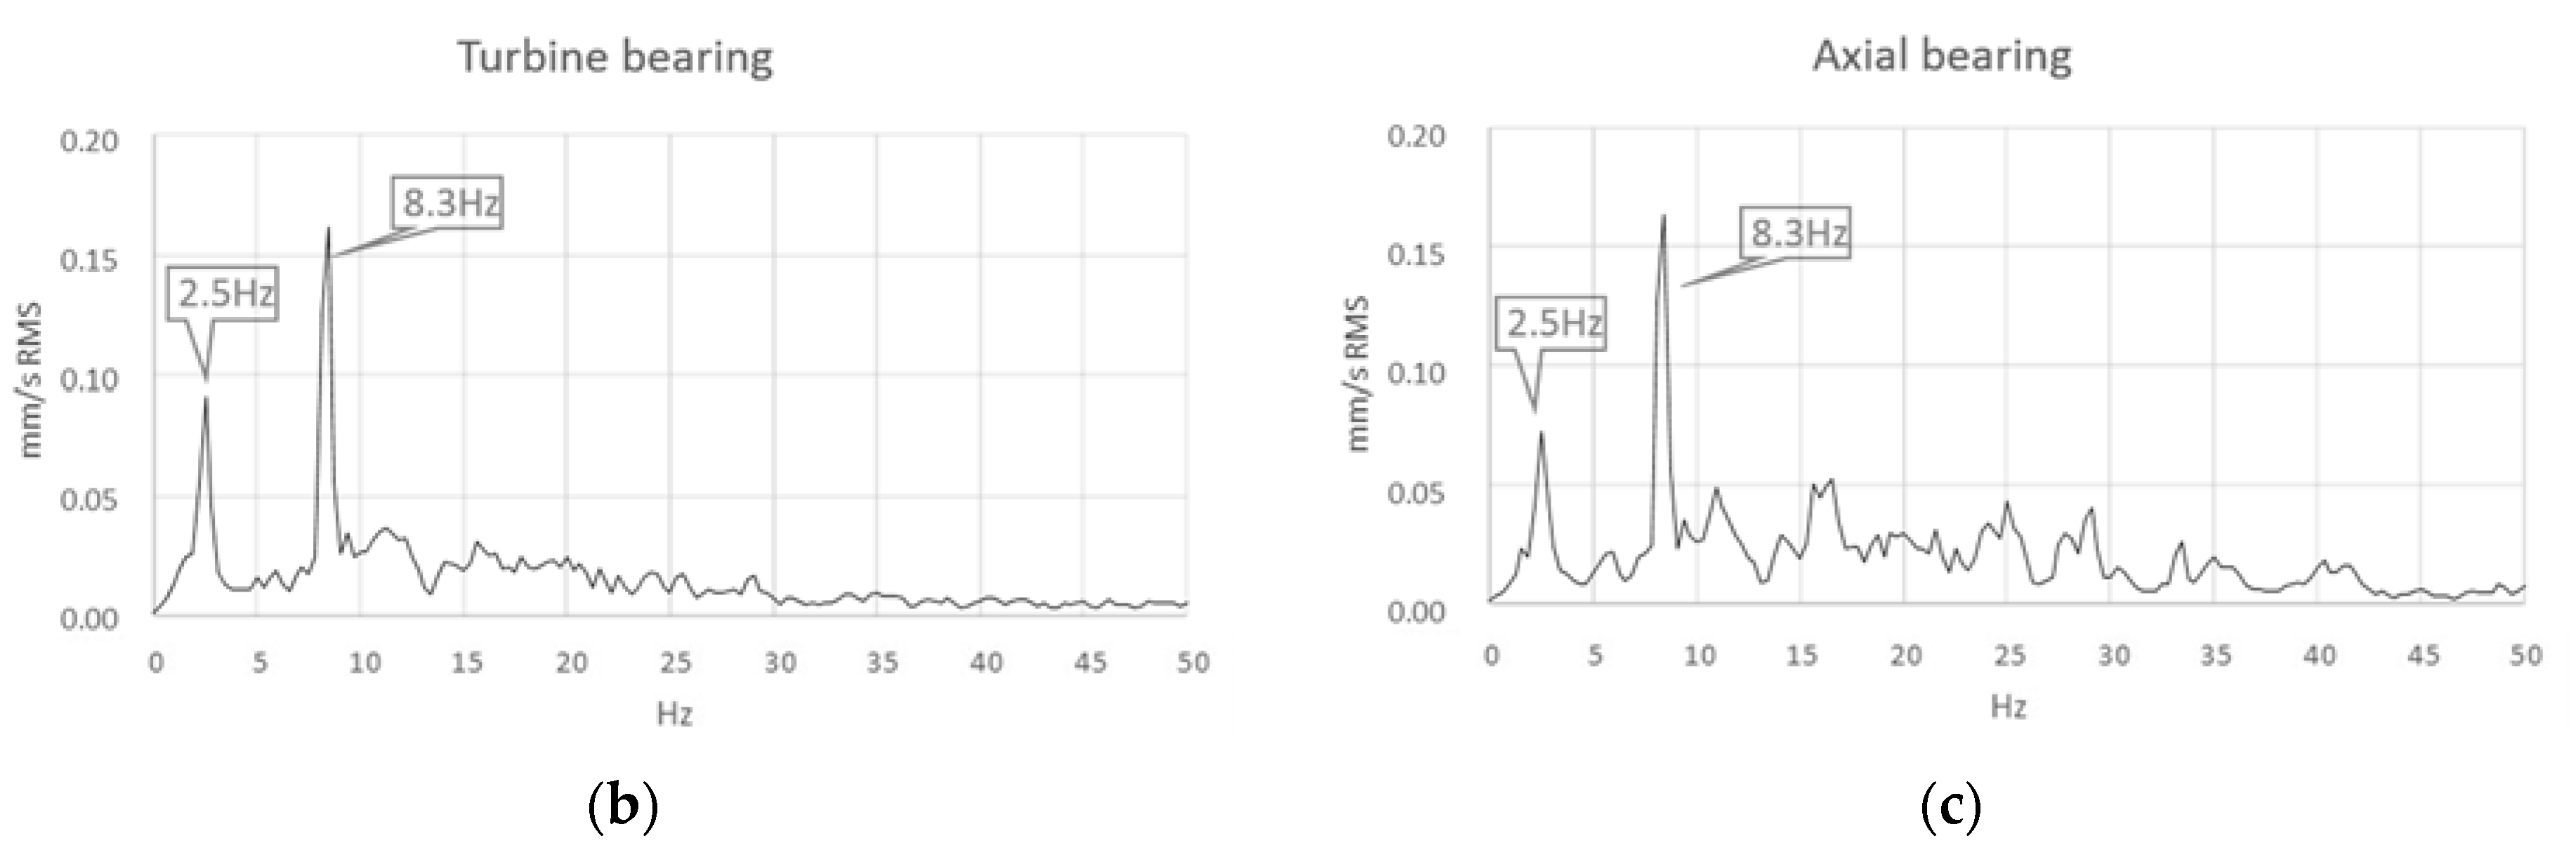
The precession of the vortex rope generates low frequency pressure fluctuations at about 30% of the rotating speed [4,5]. In Figure 13 top, the spectral pressure signal at a load of 45% has been represented. In this case, a pressure fluctuation can be detected at 2.5 Hz (30% of ff). This phenomenon can be also identified in the accelerometers located at the turbine bearing and at the axial bearing (Figure 13 bottom). The pressure fluctuation is not too high in this case. So, instability problems on the electrical grid are not expected in this machine.
4. Pump Operation
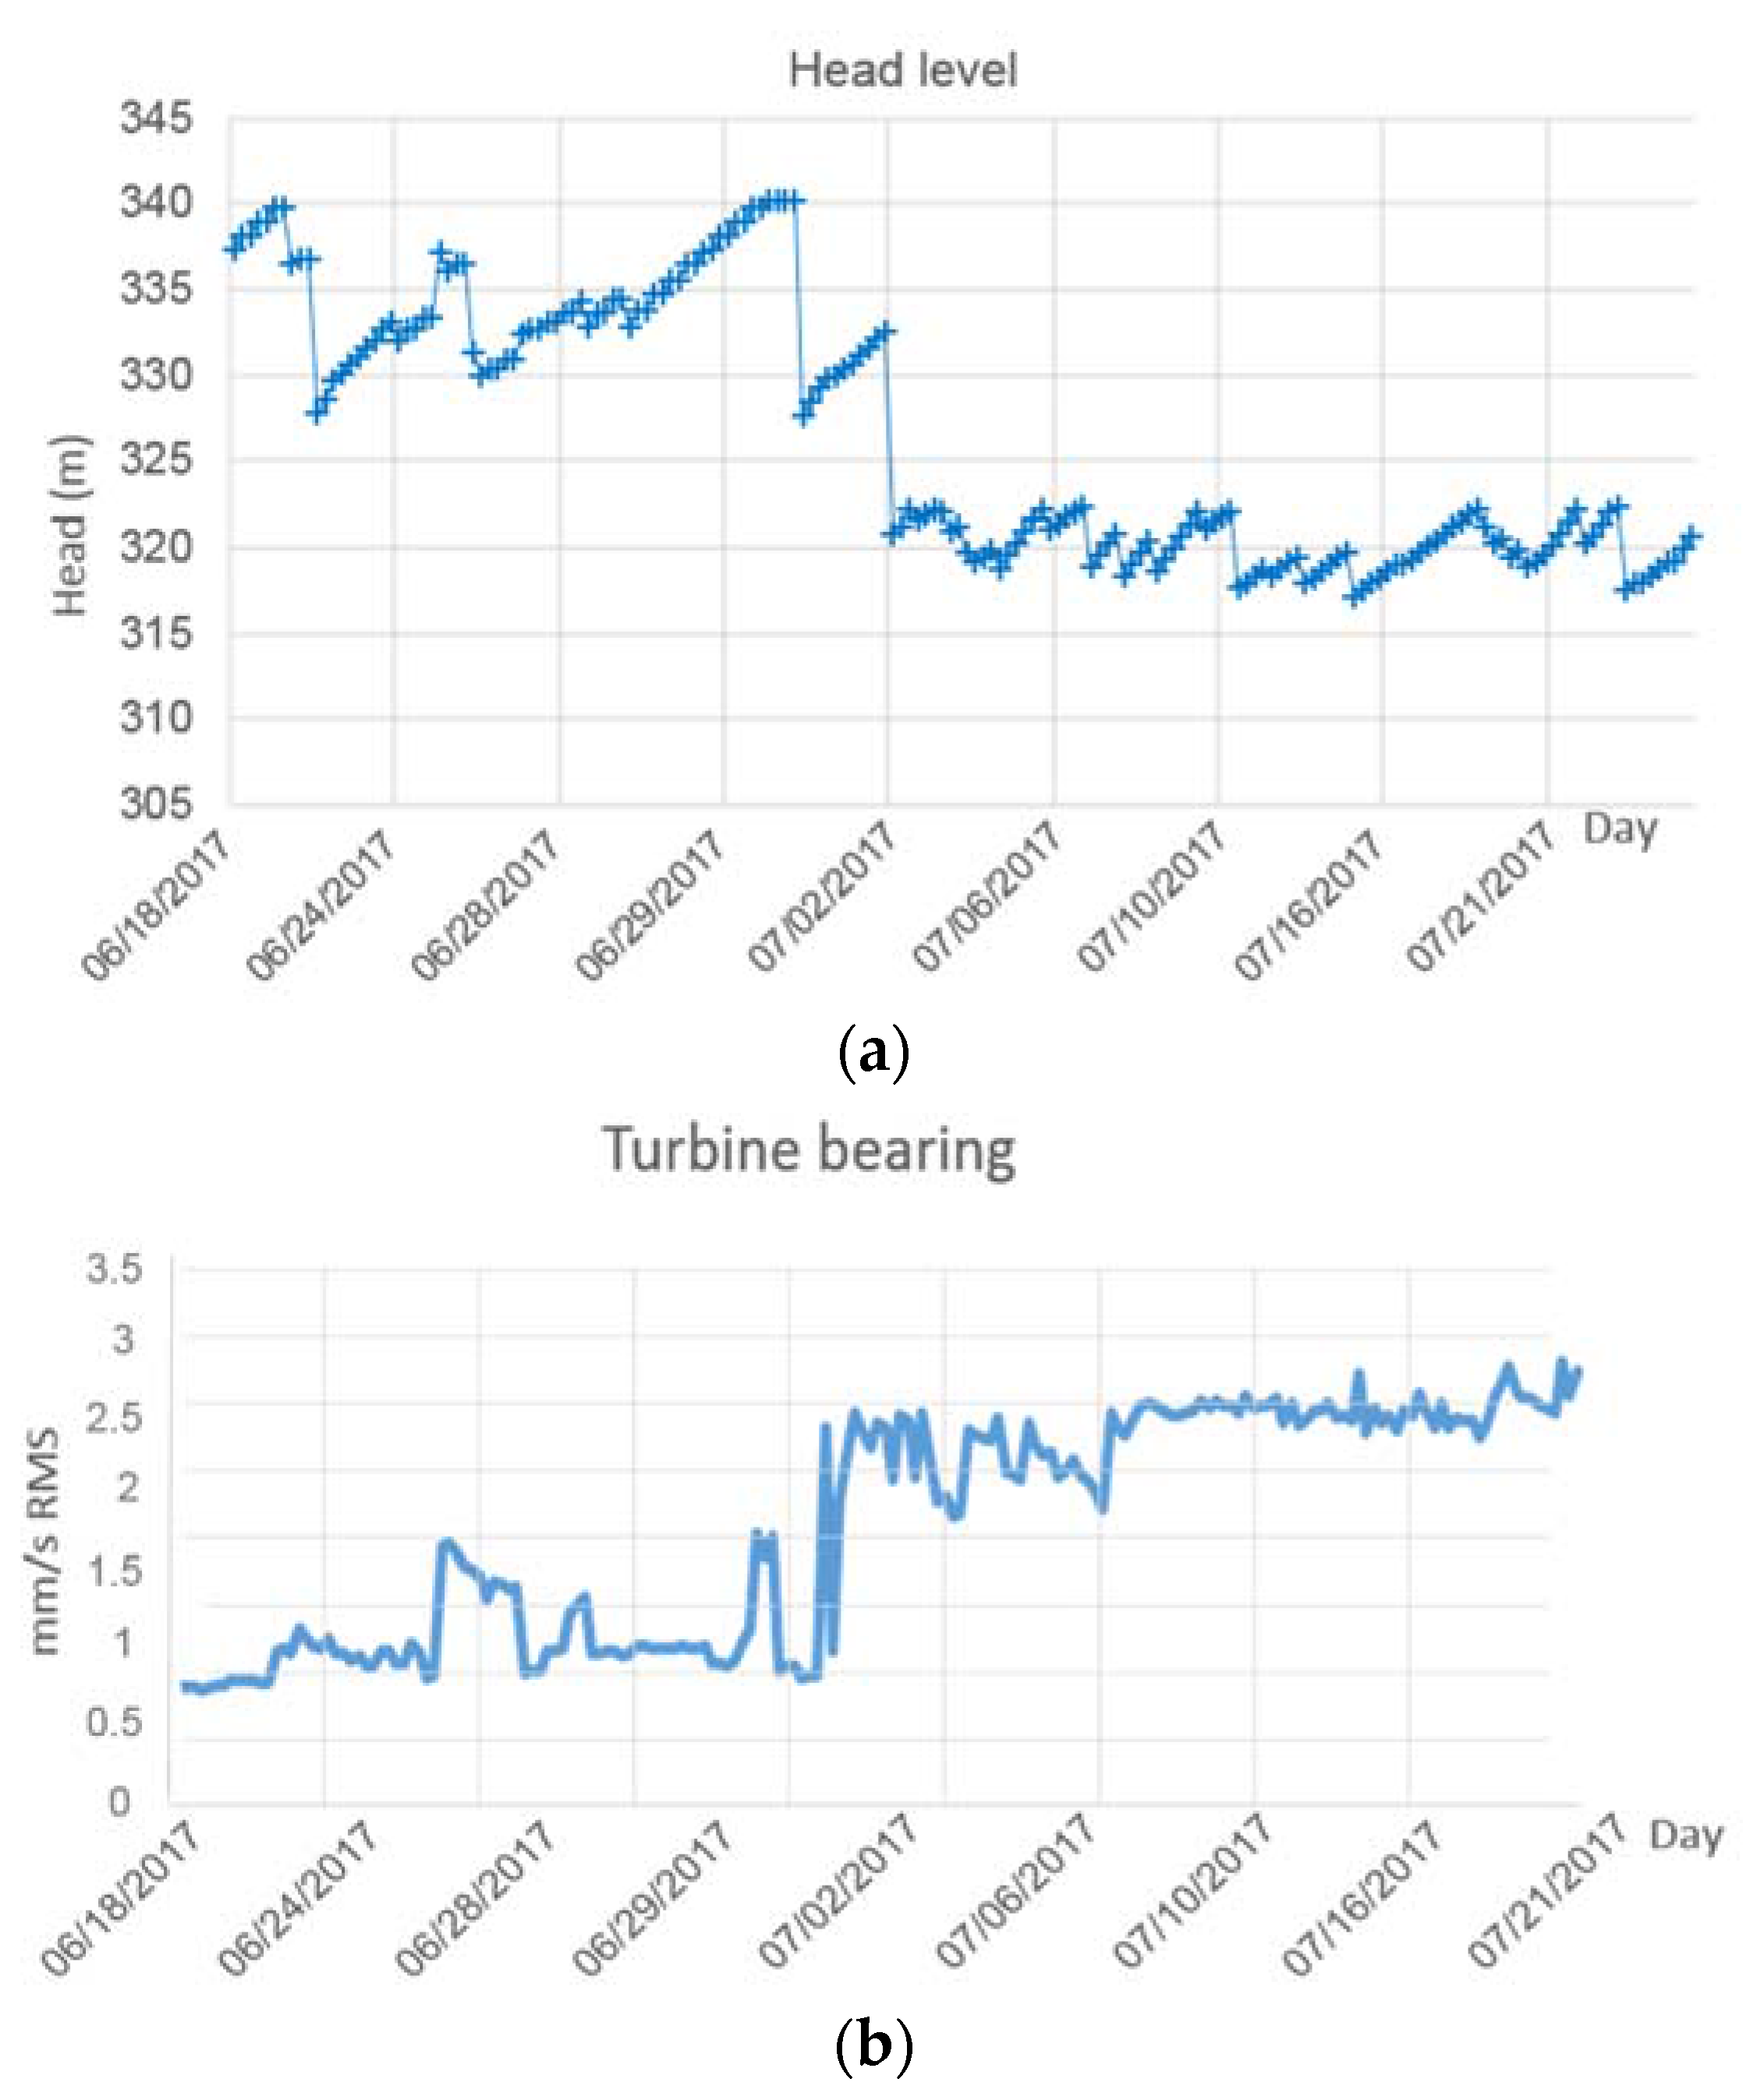
In pump operation, the machine operates with a rather constant power (same guide vane opening). So, in this case the only parameter affecting the vibration behavior is the head. As it can be observed in Figure 14 the vibration levels are much influenced by the head. When the head decreases (from 340 m to 315 m), the overall vibration levels increase considerably (from 1 mm/s to 3 mm/s).
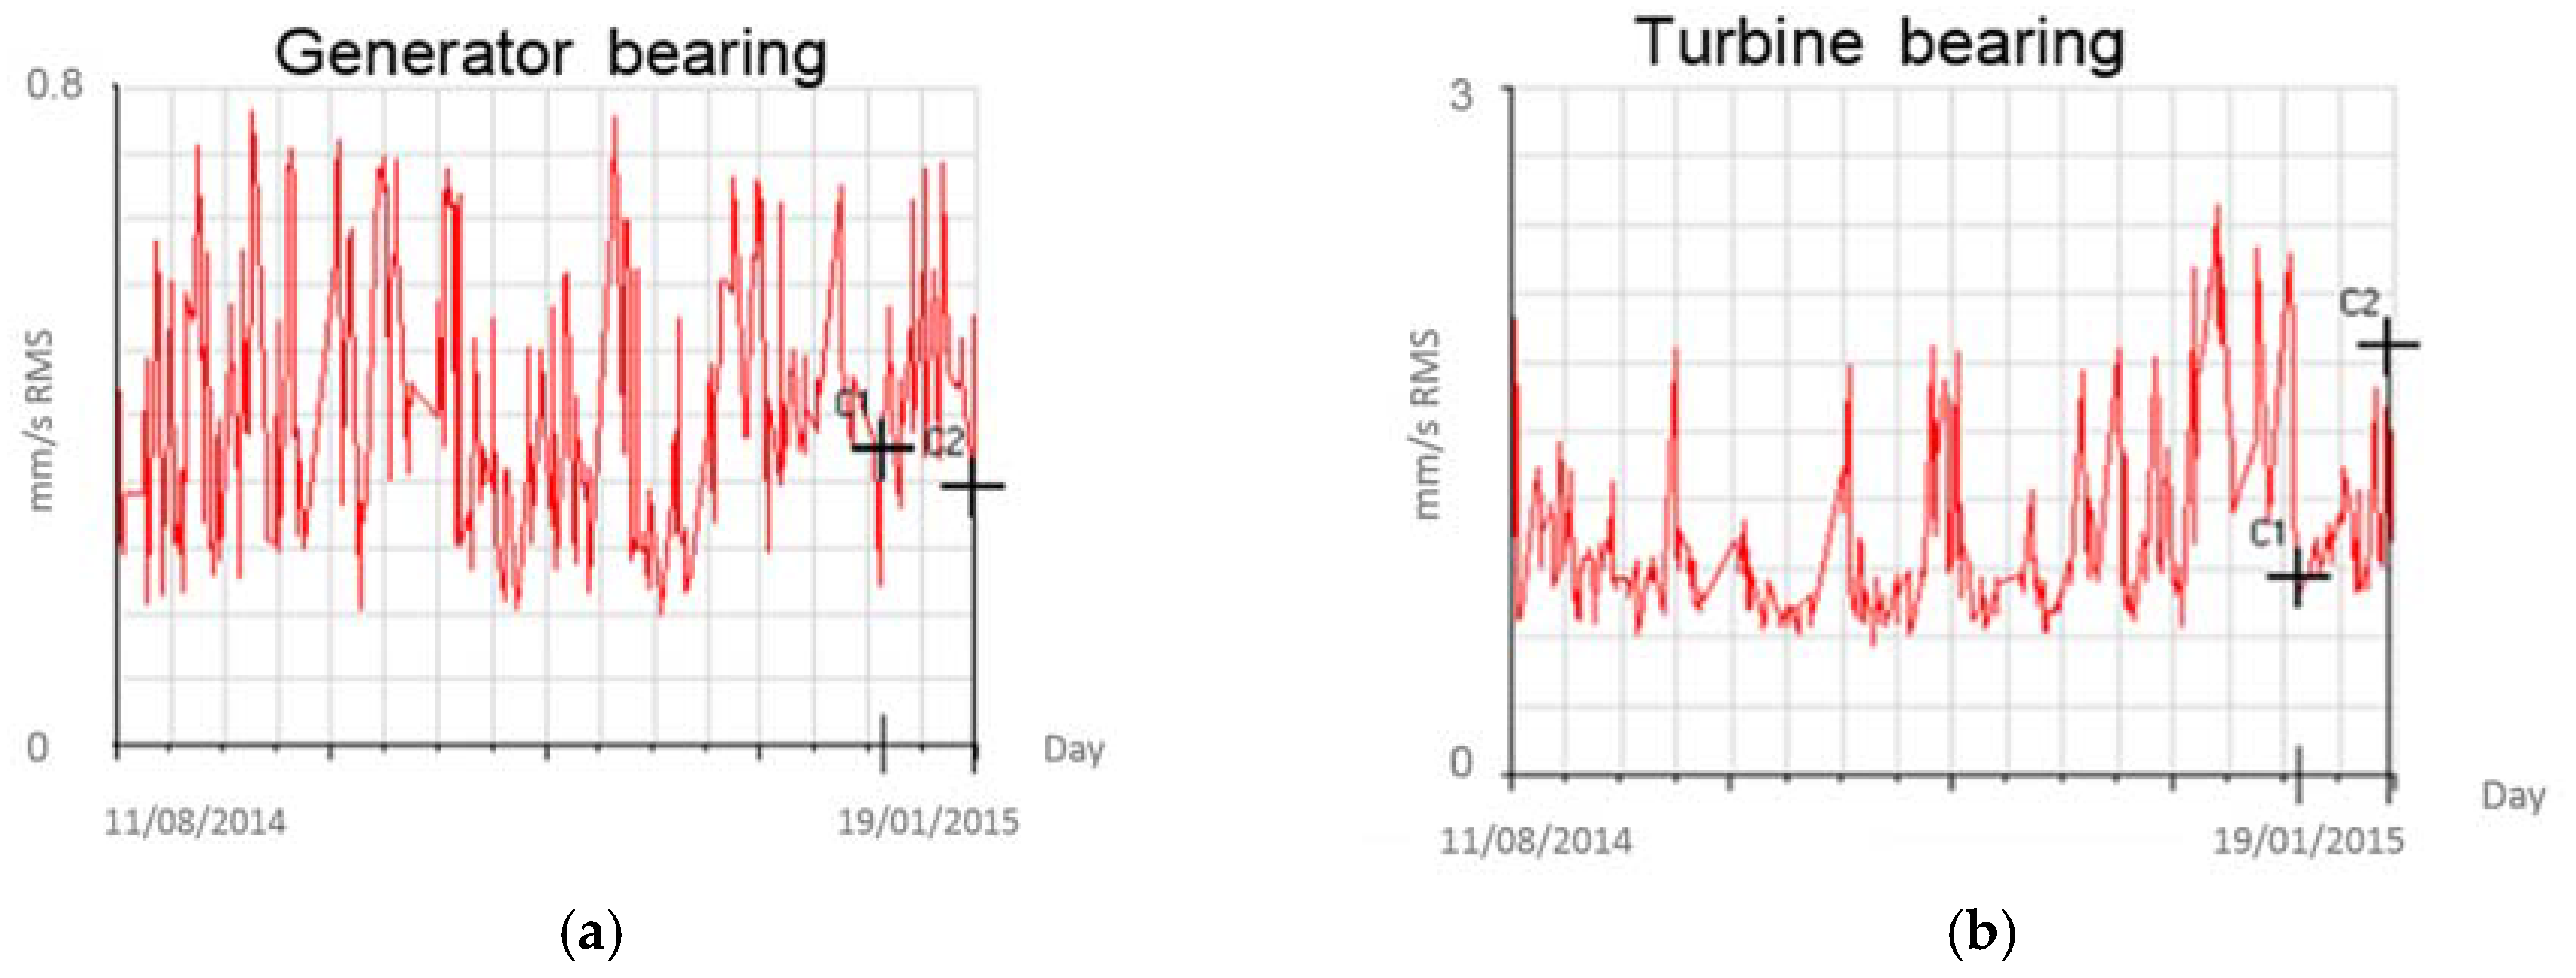
Like in turbine operation, the turbine bearing is the location with the higher level of vibrations (see Figure 15). In this figure, the overall levels of the machine for different head levels for a period of around two months can be seen. Vibration levels change from 0.24 to 0.72 m/s in generator bearing and from 0.6 to 2.4 mm/s in turbine bearing for Unit 1.
To determine the cause of this change, an analysis of the vibration signal at medium (0–1000 Hz) and at high frequency (0–20,000 Hz) for high and low head has been made. Both spectra have a number of lines of 3200.
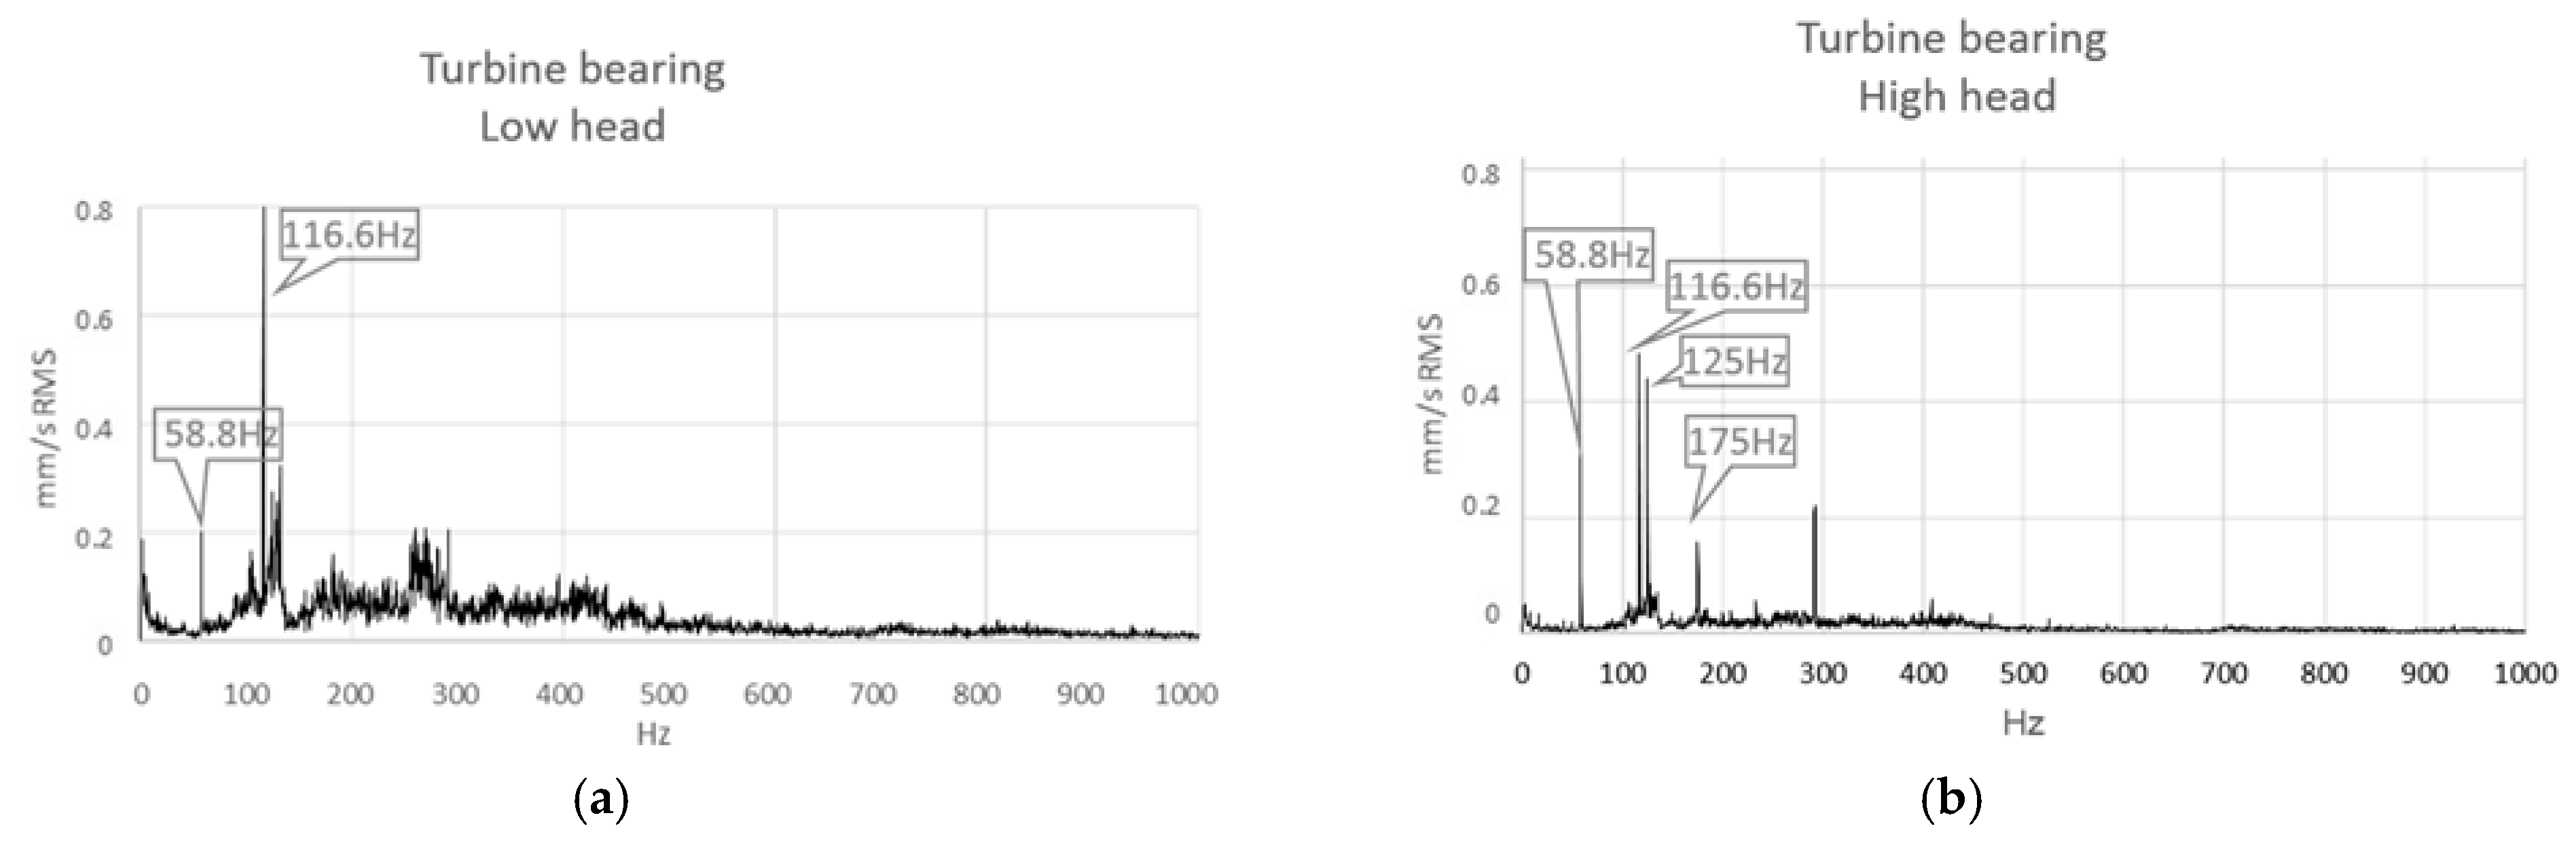
In Figure 16, the spectral signatures of the vibration for different operating conditions have been represented; this figure shows the different behavior of the vibration when the head is changing.
Both spectra show a peak at 58.4 Hz corresponding to the blade passing frequency. This peak has more amplitude for the highest head because when the head increases pressure, pulsation increases too. In addition, a peak at 116 Hz (twice the blade passing frequency) is observed in both spectra. In this case, the amplitude for the lowest head is higher due to the influence of the turbulence generated.
For low heads, turbulence is the predominant phenomenon, especially between 116.6 Hz and 500 Hz.
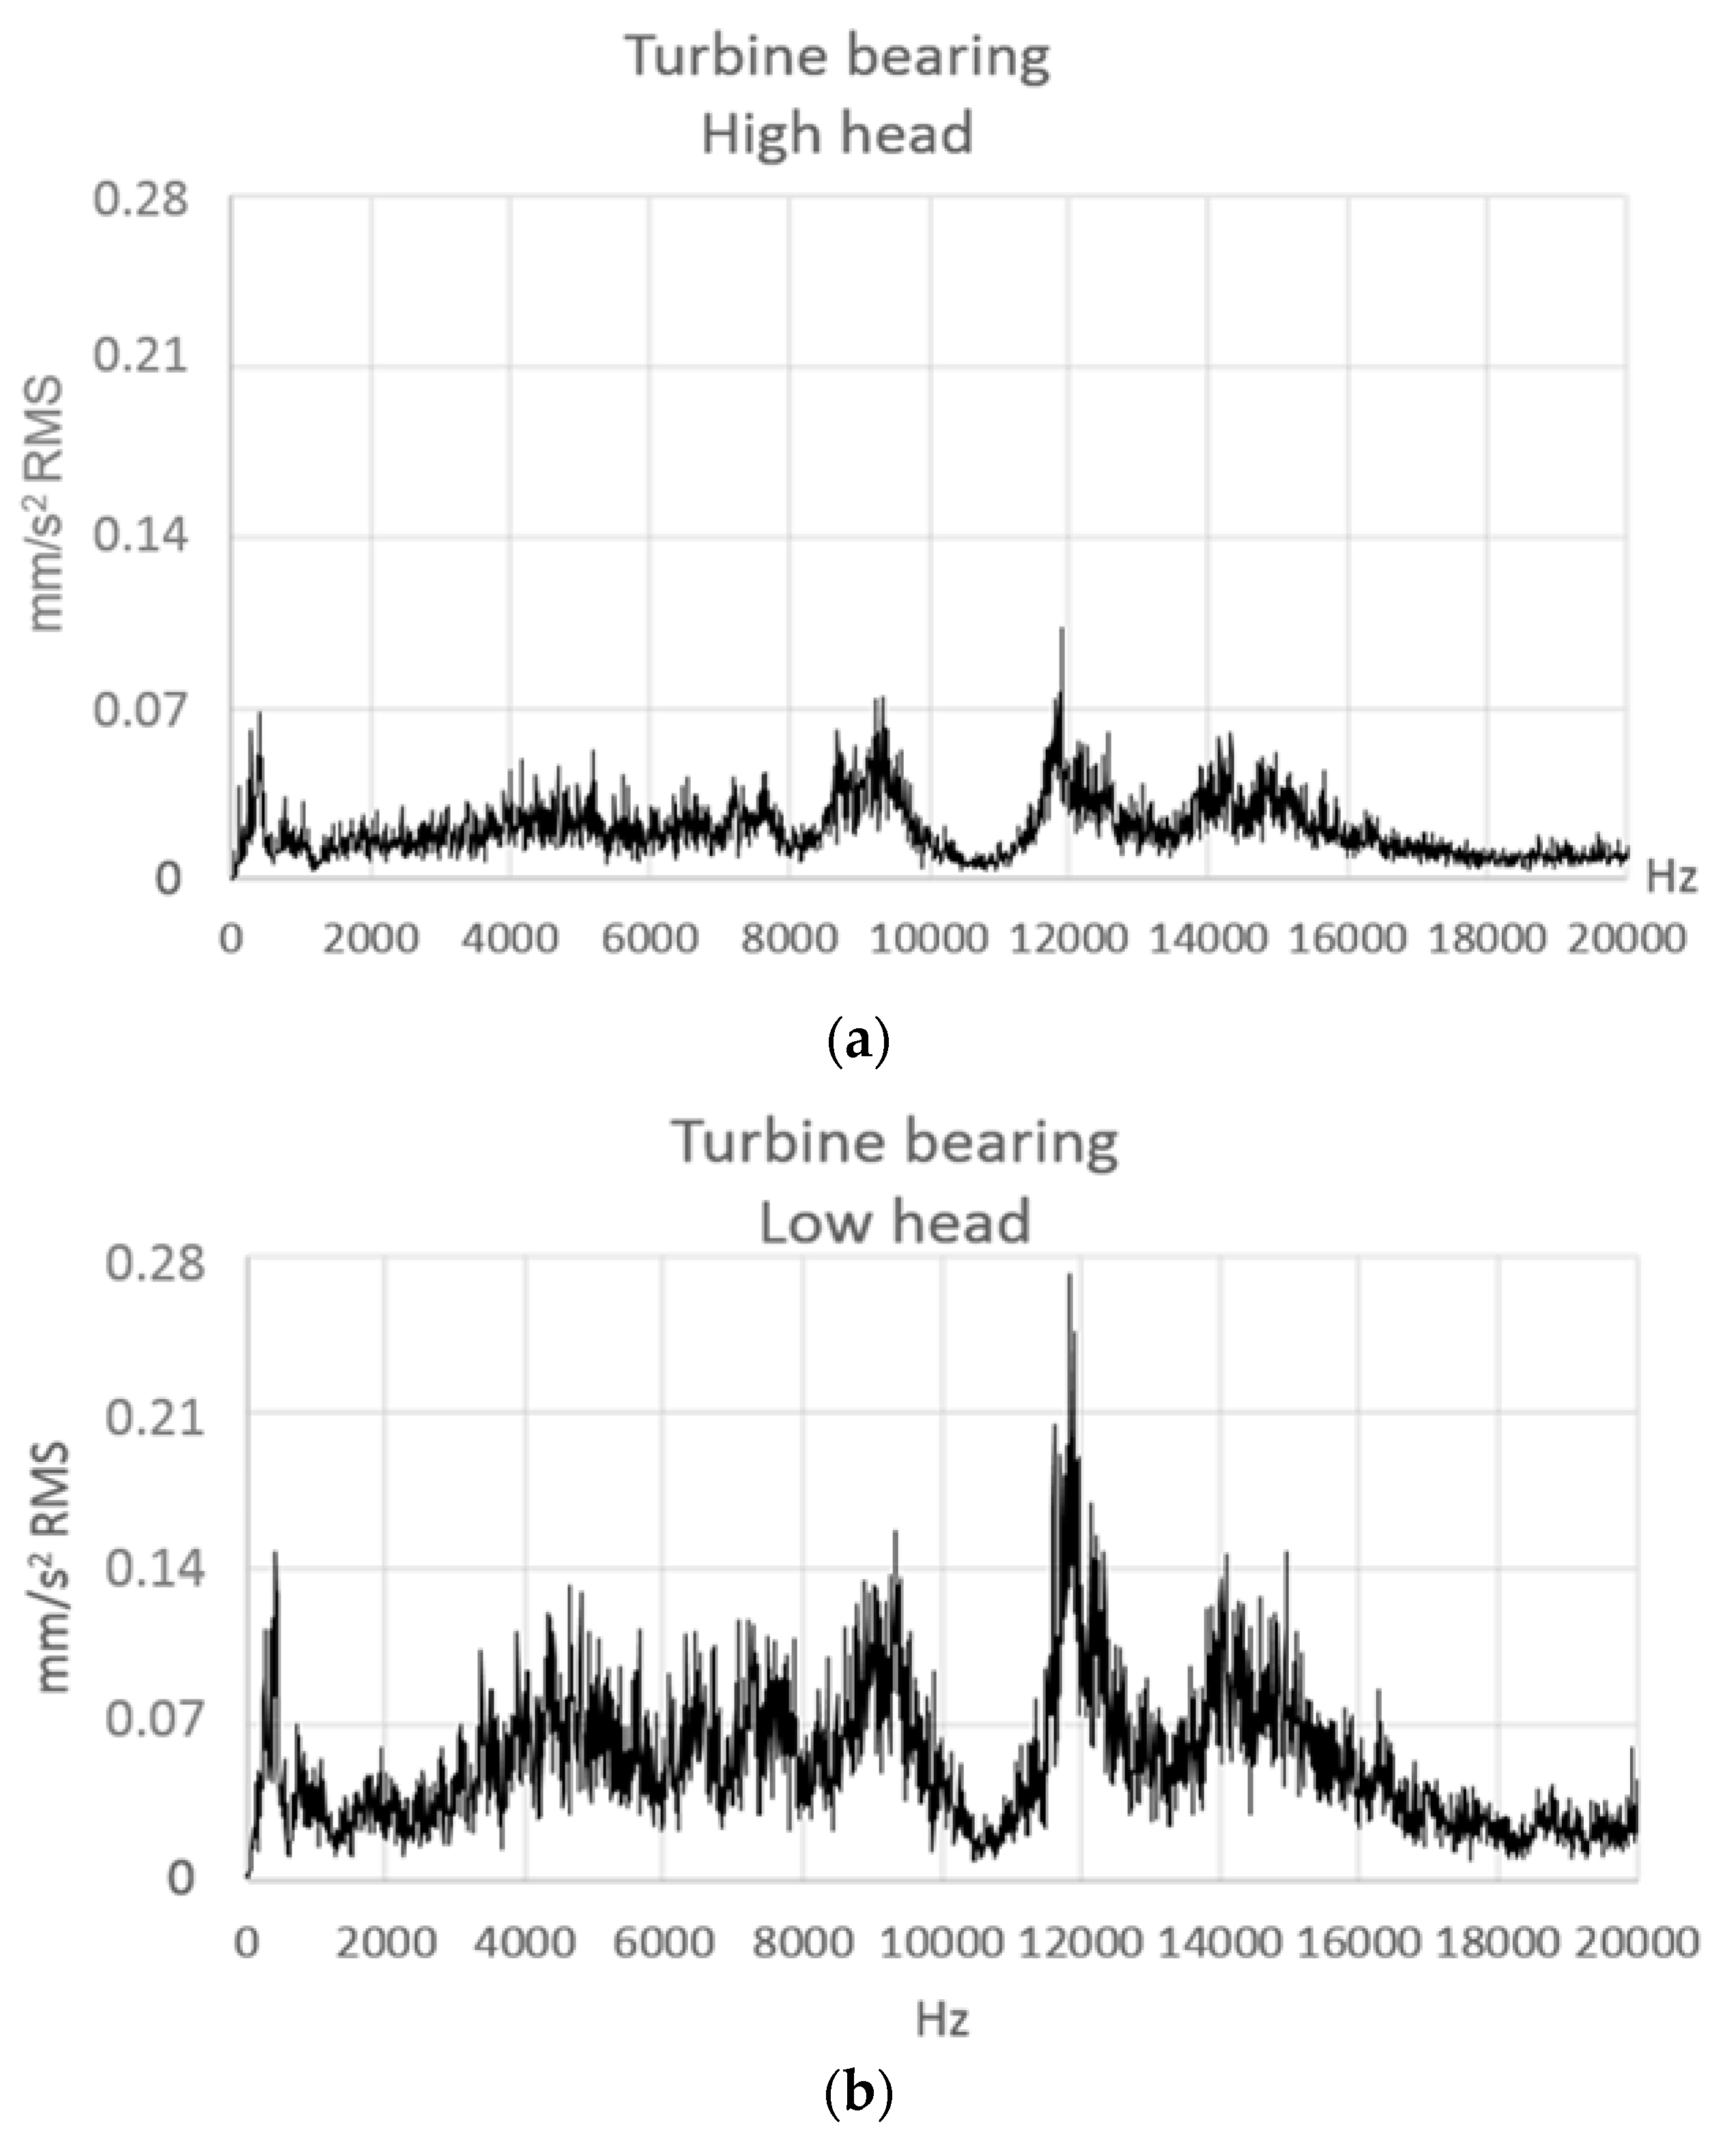
In Figure 17 the spectral signatures of the vibration for different operating conditions at high frequency have been represented (units in mm/s2). A dramatic difference between them is showed. It can be seen that high frequency vibration is generated when the pump operates at the lowest head, which is a symptom of cavitation [32]. So, the increase of vibrations showed in Figure 14 is basically due to cavitation phenomenon.
5. Conclusions
In this paper, the extension of the operating range in a pumped storage power plant has been studied. To determine the effects of this extension on the machine and on the electrical grid, the analysis of vibration and pressure fluctuation data obtained after two years of monitoring have been carried out.
The machines analyzed are two pump turbines with a maximum power of 85 MW each. The machines are reversible and can operate as a turbine and as a pump. The study was carried out first in turbine mode and then in pumping mode.
For turbine operation, the machine extended the range from 45–85 MW to 20–85 MW. Because vibration levels depend on head and load, the influence of both parameters has been studied separately.
- -
- At constant head, the vibration levels have been analyzed at part load, full load, and medium load.
At part load, levels are at maximum and, especially, at very low load a significant increase of vibrations occurs, what leads to the overall vibration levels being doubled. Levels reach a minimum around the best efficiency point (medium load) and increase again at full load (maximum guide vane opening).
To fully understand the reasons for these variations, the origin of the vibrations has been studied in all conditions. It has been seen that the main mechanisms are of hydraulic origin produced by rotor stator interaction, turbulence, and cavitation.
At very low load, the increase in vibration amplitudes is due to an increase in turbulence and cavitation even though the rotor stator interaction (twice the blade passing frequency) is low. In this case, values of overall levels are more than 2 mm/s RMS in the turbine bearing. At high load, the increase in vibration amplitudes is due to the high amplitude of rotor stator interaction.
- -
- At constant load (constant guide vane degree) the vibration levels have been analyzed at maximum, medium, and minimum head. It has been seen that the head has also an important influence.
In this case, vibrations increase when head is reduced because turbulence and cavitation appears. This happens because the machine is operating far from its best efficiency point. Hence the worst condition occurs when both load and head are at minimum.
Regarding a possible power fluctuation that could affect the electrical grid, the possibility of draft tube instabilities has been explored. A vortex core has been detected at part load (45%) generating a low frequency pressure fluctuation. Anyway, the amplitude of the pressure fluctuation generated by the vortex core both in axial and radial direction is not important. Therefore, power swing is negligible.
Considering the effects of the head and load in turbine operation, the operating range could be extended if operation at minimum heads is avoided. Under these conditions, an increase in maintenance should be expected.
For pump operation, only the head can affect the behavior of the machine because it works with the same guide vanes opening. Likewise, a study for maximum, medium, and minimum head has been carried out.
Turbulence, and most especially cavitation, are detected when pump operates at the lowest head. Vibration levels are also high (more than 2 mm/s).
For pumping mode, operating the machine in this condition could reduce lifetime and increase maintenance.
In summary, for turbine operation the regulation range could be increased if operation at the minimum loads is avoided when the head is at the minimum values. Anyway, some increase in cavitation erosion is possible. For pump operation, there is no possibility of regulation but the lifespan of the runner and the intervals between periodic maintenance works could be increased if pumping at the lowest heads is avoided. This is an estimation based on the vibration levels and signatures, For better conclusions, the dynamics of the machine and fatigue analysis of the runner should be performed.
Author Contributions
Eduard Egusquiza and Carme Valero designed the experiments. Alex Presas , David Valentin and Mònica Egusquiza performed the experiments. Matias Bossio and Mònica Egusquiza performed the signal analysis and Eduard Egusquiza reviewed the manuscript. The paper was written by Carme Valero.
Conflicts of Interest
The authors declare no conflict of interest.
Nomenclature
| bep | Best efficiency point |
| ff | Rotating frequency |
| NRE | New renewable energies |
| RSI | Rotor Stator Interaction |
| Zb | Number of blades |
References
- Söder, L.; Abildgaard, H.; Estanqueiro, A.; Hamon, C.; Holttinen, H.; Lannoye, E.; Gómez-Lázaro, E.; O’Malley, M.; Zimmermann, U. Experience and challenges with short-term balancing in European systems with large share of wind power. IEEE Trans. Sustain. Energy 2012, 3, 853–861. [Google Scholar] [CrossRef]
- Lowys, P.; Andre, F.; Ferreira da Silva, A.; Duarte, F.; Payre, J.P. Hydro plant operating range extension transverse. In Proceedings of the Hydrovision 2014, Nashville, TN, USA, 22–25 July 2014. [Google Scholar]
- Doerfler, P.; Sick, M.; André, C. Flow-Induced Pulsation and Vibration in Hydroelectric Machinery; Springer: London, UK, 2013. [Google Scholar]
- Nishi, M.; Matsunaga, M.; Okamoto, M.; Takashu, K. Wall Pressure Measurements as a Diagnosis of Draft Tube Surge. In Proceedings of the 15th IAHR Symposium on Hydraulic Machinery and Cavitation, Belgrade, Yugoslavia, 11–14 September 1990. [Google Scholar]
- Avellan, F. Flow Investigation in a Francis Draft Tube: The Flindt Project. In Proceedings of the 20th IAHR Symposium on Hydraulic Machinery and Systems, Charlotte, NC, USA, 6–9 August 2000. [Google Scholar]
- Manderla, M.; Weber, W.; Koutnik, J. Model measurement based identication of Francis turbine vortex rope parameters for prototype part load pressure and power pulsation prediction. In Proceedings of the 28th IAHR Symposium on Hydraulic Machinery and Systems, Grenoble, France, 4–8 July 2016. [Google Scholar]
- Arzola, F.; Azuaje, Z.; Zambrano, P.; Gulbrandsen, G. Undesired power oscillations at high load in large Francis Turbines. Experimental study and solution. In Proceedings of the 23rd Symposium IAHR Section Hydraulic Machinery, Equipment, and Cavitation, Yokohama, Japan, 17–21 October 2006. [Google Scholar]
- Favrel, A.; Gomes, J.; Landry, C.; Müller, A.; Nicolet, C.; Avellan, F. New insight in Francis turbine cavitation vortex rope: Role of the runner outlet flowswirl number. J. Hydraul. Res. 2017. [Google Scholar] [CrossRef]
- Müller, A.; Bullani, A.; Dreyer, M.; Roth, S.; Favrel, A.; Landry, C.; Avellan, F. Interaction of a pulsating vortex rope with the local velocity field in a Francis turbine draft tube. IOP Conf. Ser. Earth Environ. Sci. 2012, 15. [Google Scholar] [CrossRef]
- Escaler, X.; Egusquiza, E.; Farhat, M.; Avellan, F.; Coussirat, M. Detection of cavitation in hydraulic turbines. Mech. Syst. Signal Process. 2006, 20, 983–1007. [Google Scholar] [CrossRef]
- Favrel, A.; Landry, C.; Müller, A.; Yamamoto, K.; Avellan, F. Hydro-acoustic resonance behavior in presence of a precessing vortex rope: Observation of a lock-in phenomenon at part load Francis turbine operation. IOP J. Phys. Conf. Ser. 2017. [Google Scholar] [CrossRef]
- Baya, A.; Muntean, S.; Câmpian, V.C.; Cuzmoş, A.; Diaconescu, M.; Bălan, G.H. Experimental investigations of the unsteady flow in a Francis turbine draft tube. IOP Conf. Ser. Earth Environ. Sci. 2010. [Google Scholar] [CrossRef]
- Alligné, S.; Maruzewski, P.; Dinh, T.; Wang, B.; Fedorov, A.; Iosfin, J.; Avellan, F. Prediction of a Francis turbine prototype full load instability from investigations on the reduced scale model. IOP Conf. Ser. Earth Environ. Sci. 2010. [Google Scholar] [CrossRef]
- Alligné, S.; Nicolet, C.; Tsujimoto, Y.; Avellan, F. Cavitation surge modelling in Francis turbine draft tube. J. Hydraul. Res. 2014, 52, 399–411. [Google Scholar] [CrossRef]
- Nicolet, C.; Arpe, J.; Avellan, F. Identification and modelling of pressure fluctuations of a Francis turbine scale model at part load operation. In Proceedings of the 22nd IAHR Symposium on Hydraulic Machinery and Systems, Stockholm, Sweden, 29 June–2 July 2004. No. LMH-CONF-2004-003. [Google Scholar]
- Bosioc, A.; Tanasa, C.; Muntean, S.; Susan-Resiga, R. Unsteady pressure measurements and numerical investigation of the jet control method in a conical diffuser with swirling flow. IOP Conf. Ser. Earth Environ. Sci. 2010. [Google Scholar] [CrossRef]
- Tanasa, C.; Muntean, S.; Bosioc, A.I.; Susan-Resiga, R. 3D numerical simulation versus experimental assessment of pressure pulsations using a passive method for swirling flow control in conical diffusers of hydraulic turbines. In Proceedings of the 28th IAHR Symposium on Hydraulic Machinery and Systems, Grenoble, France, 4–8 July 2014. [Google Scholar]
- Ciocan, G.; Kueny, J.L. Experimental Analysis of Rotor Stator Interaction in a Pump-Turbine. In Proceedings of the XXIII IAHR Symposium on Hydraulic Machinery and Systems, Yokohama, Japan, 17–21 October 2006. [Google Scholar]
- Yamamoto, K.; Müller, A.; Favrel, A.; Landry, C.; Avellan, F. Pressure measurements and high speed visualizations of the cavitation phenomena at deep part load condition in a Francis turbine. IOP Conf. Ser. Earth Environ. Sci. 2014. [Google Scholar] [CrossRef]
- Eichhorn, M.; Taruffi, A.; Bauer, C. Expected load spectra of prototype Francis turbines in low-load operation using numerical simulations and site measurements. IOP Conf. Ser. J. Phys. 2017. [Google Scholar] [CrossRef]
- Monette, C.; Monette, C.; Marmont, H.; Chamberland-Lauzon, J.; Skagerstrand, A.; Coutu, A.; Jens, C. Cost of enlarged operating zone for an existing Francis runner. IOP Conf. Ser. Earth Environ. Sci. 2016. [Google Scholar] [CrossRef]
- Coutu, A.; Marier, S.; Chamberland-Lauzon, J.; Monette, C. Designing Francis runners for 0–100 per cent operation. In Proceedings of the HYDRO 2015, Bordeaux, France, 26–28 October 2015. [Google Scholar]
- Egusquiza, E.; Valero, C.; Valentin, D.; Presas, A.; Rodriguez, C.G. Condition monitoring of pump-turbines. New challenges. Measurement 2015, 67, 151–163. [Google Scholar] [CrossRef] [Green Version]
- Egusquiza, E.; Valero, C.; Presas, A.; Huang, X.; Guardo, A.; Seidel, U. Analysis of the dynamic response of pump-turbine impellers. Influence of the rotor. Mech. Syst. Signal Process. 2016, 68–69, 330–334. [Google Scholar] [CrossRef]
- Egusquiza, E.; Valero, C.; Huang, X.; Jou, E.; Guardo, A.; Rodriguez, C.G. Failure investigation of a large pump-turbine runner. Eng. Failure Anal. 2012, 23, 27–34. [Google Scholar] [CrossRef] [Green Version]
- Presas, A.; Valentin, D.; Egusquiza, E.; Valero, C.; Seidel, U. Dynamic response of a rotating disk submerged and confined. Influence of the axial gap. J. Fluids Struct. 2016, 62, 332–349. [Google Scholar] [CrossRef]
- Presas, A.; Valentin, D.; Egusquiza, E.; Valero, C.; Seidel, U. Influence of the rotation on the natural frequencies of a submerged-confined disk in water. J. Sound Vib. 2015, 337, 161–180. [Google Scholar] [CrossRef]
- Presas, A.; Valentin, D.; Egusquiza, E.; Valero, C.; Seidel, U. On the detection of natural frequencies and mode shapes of submerged rotating disk-like structures from the casing. Mech. Syst. Signal Process. 2015, 60–61, 547–570. [Google Scholar] [CrossRef] [Green Version]
- Bossio, M.; Valentín, D.; Presas, A.; Ramos, D.; Egusquiza, E.; Valero, C.; Egusquiza, M. Numerical study on the influence of acoustic natural frequencies on the dynamic behaviour of submerged and confined disk-like structures. J. Fluids Struct. 2017, 73, 53–69. [Google Scholar] [CrossRef]
- Valentin, D.; Presas, A.; Egusquiza, E.; Valero, C. Experimental study on the added mass and damping of a disk submerged in a partially fluid-filled tank with small radial confinement. J. Fluids Struct. 2014, 50, 1–17. [Google Scholar] [CrossRef]
- Presas, A.; Egusquiza, E.; Valero, C.; Valentin, D.; Seidel, U. Feasibility to use PZT Actuators to study the dynamic behavior of a rotating disk due to Rotor-Stator Interaction. Sensors 2014, 14, 11914–11942. [Google Scholar] [CrossRef] [PubMed] [Green Version]
- Tanaka, H. Vibration Behaviour and Dynamic Stress of Runners of Very High Head Reversible Pump-Turbines. In Proceedings of the 15th IAHR Symposium, Belgrade, Yugoslavia, 11–14 September 1990. [Google Scholar]
Figure 1.
Sketch of a hydroelectric reversible power plant.

Figure 2.
Sensors installed in the pump turbine. Accelerometers are displayed in grey and pressure transducers in black.
Figure 2.
Sensors installed in the pump turbine. Accelerometers are displayed in grey and pressure transducers in black.

Figure 3.
Monitoring system installed in the pump turbine.

Figure 4.
Variation of head level in pumping operation (blue marker) and in turbine operation (red marker).
Figure 4.
Variation of head level in pumping operation (blue marker) and in turbine operation (red marker).

Figure 5.
Vibration levels of turbine bearing (a); guide vane opening (b).


Figure 6.
Zoom of vibration levels of turbine bearing (a) and guide vane opening (b).

Figure 7.
(a)Vibration levels of generator and (b) turbine bearing in mm/s RMS. Different heads and loads. Unit 1.
Figure 7.
(a)Vibration levels of generator and (b) turbine bearing in mm/s RMS. Different heads and loads. Unit 1.

Figure 8.
(a)Vibration levels of generator and (b) turbine bearing in mm/s RMS. Different heads and loads. Unit 2.
Figure 8.
(a)Vibration levels of generator and (b) turbine bearing in mm/s RMS. Different heads and loads. Unit 2.

Figure 9.
Variation levels related with operation (similar head, different load) (a) Unit 1; (b): Unit 2. The possible reasons for these changes are explained in Section 3.2.
Figure 9.
Variation levels related with operation (similar head, different load) (a) Unit 1; (b): Unit 2. The possible reasons for these changes are explained in Section 3.2.

Figure 10.
Variation in vibration levels related with head (similar load).

Figure 11.
Spectral signatures of the accelerometer located at turbine bearing.

Figure 12.
Spectral signatures for maximum load (bottom) and minimum load (top) at high (green) and low head (red).
Figure 12.
Spectral signatures for maximum load (bottom) and minimum load (top) at high (green) and low head (red).

Figure 13.
(a) Spectral pressure signature in draft tube and (b) spectral vibration signature in turbine bearing and (c) axial bearing at part load.
Figure 13.
(a) Spectral pressure signature in draft tube and (b) spectral vibration signature in turbine bearing and (c) axial bearing at part load.


Figure 14.
(a) Variation of gross head versus time; (b) variation of overall vibration versus time.

Figure 15.
(a) Vibration levels of generator bearing; (b) Vibration levels of turbine bearing. Both in pumping mode. Unit 1.
Figure 15.
(a) Vibration levels of generator bearing; (b) Vibration levels of turbine bearing. Both in pumping mode. Unit 1.

Figure 16.
Spectral vibration signature in turbine bearing at low (a) and high head (b) both in pump operation.
Figure 16.
Spectral vibration signature in turbine bearing at low (a) and high head (b) both in pump operation.

Figure 17.
Spectral vibration signature in turbine bearing operating (a) at high head and (b) at low head during pump operation.
Figure 17.
Spectral vibration signature in turbine bearing operating (a) at high head and (b) at low head during pump operation.

© 2017 by the authors. Licensee MDPI, Basel, Switzerland. This article is an open access article distributed under the terms and conditions of the Creative Commons Attribution (CC BY) license (http://creativecommons.org/licenses/by/4.0/).
Share and Cite
MDPI and ACS Style
Valero, C.; Egusquiza, M.; Egusquiza, E.; Presas, A.; Valentin, D.; Bossio, M. Extension of Operating Range in Pump-Turbines. Influence of Head and Load. Energies 2017, 10, 2178. https://doi.org/10.3390/en10122178
AMA Style
Valero C, Egusquiza M, Egusquiza E, Presas A, Valentin D, Bossio M. Extension of Operating Range in Pump-Turbines. Influence of Head and Load. Energies. 2017; 10(12):2178. https://doi.org/10.3390/en10122178
Chicago/Turabian StyleValero, Carme, Mònica Egusquiza, Eduard Egusquiza, Alexandre Presas, David Valentin, and Matias Bossio. 2017. "Extension of Operating Range in Pump-Turbines. Influence of Head and Load" Energies 10, no. 12: 2178. https://doi.org/10.3390/en10122178
Note that from the first issue of 2016, this journal uses article numbers instead of page numbers. See further details here.