Article

Application of Meta-Heuristic Techniques for Optimal Load Shedding in Islanded Distribution Network with High Penetration of Solar PV Generation

1
Department of Electrical Engineering, University of Malaya, Kuala Lumpur 50603, Malaysia
2
Power Electronics and Renewable Energy Research Laboratory (PEARL), Department of Electrical Engineering, University of Malaya, Kuala Lumpur 50603, Malaysia
*
Author to whom correspondence should be addressed.
Energies 2017, 10(2), 150; https://doi.org/10.3390/en10020150
Submission received: 27 September 2016 / Revised: 5 December 2016 / Accepted: 17 January 2017 / Published: 24 January 2017

Abstract

:
Recently, several environmental problems are beginning to affect all aspects of life. For this reason, many governments and international agencies have expressed great interest in using more renewable energy sources (RESs). However, integrating more RESs with distribution networks resulted in several critical problems vis-à-vis the frequency stability, which might lead to a complete blackout if not properly treated. Therefore, this paper proposed a new Under Frequency Load Shedding (UFLS) scheme for islanding distribution network. This scheme uses three meta-heuristics techniques, binary evolutionary programming (BEP), Binary genetic algorithm (BGA), and Binary particle swarm optimization (BPSO), to determine the optimal combination of loads that needs to be shed from the islanded distribution network. Compared with existing UFLS schemes using fixed priority loads, the proposed scheme has the ability to restore the network frequency without any overshooting. Furthermore, in terms of execution time, the simulation results show that the BEP technique is fast enough to shed the optimal combination of loads compared with BGA and BPSO techniques.

1. Introduction

The fast paced economic and industrial growth resulted in an increase in global energy demands. This increase also goes hand in hand with air pollution from fossil fuel operated power plants. This encouraged the use of clean energy resources. Germany and Sweden expects to draw 38.6% and 50% of their energy needs from renewable energy sources, respectively [1]. The necessity of providing clean energy necessitates the use of distribution networks based on renewable energy sources (RESs). Utilizing distribution generators based on RES (DG-RES) reduces the transmission cost and improves the system’s reliability. Currently, based on the IEEE std. 1547-2003, when the distribution network is islanded from the grid, all DGs must be disconnected from the network within 2 s [2]. This guarantees the safety of the power system workers and avoids faults, which could occur due to re-closure activation. Research on islanding operation of the distribution system with DG-RES is progressing to the level that allows islanded network to operate autonomously when disconnected from grid [3,4,5].
One of the challenges of islanding operation is the insufficient DG capacity for load demand when disconnected from the grid. Imbalance between generation and load subsequently decrease the frequency of the system. This can be mitigated by shedding some of the loads, which balances the system. An example of a technique that can do this is the Under-Frequency Load Shedding (UFLS). Several UFLS schemes have been proposed: conventional, adaptive, and intelligent. The conventional UFLS is the most applicable in this case [6,7,8]. In this technique, the system’s frequency is compared to certain threshold values, and, based on those values, a pre-determined load will be shed to prevent a frequency drop. Although this technique is inexpensive and simple, it is unable to shed optimal amounts of loads. The adaptive UFLS technique uses the swing equation to estimate the imbalance of power. Anderson and Jung et al. [9,10] proved that the adaptive UFLS technique proposed for islanding distribution network sheds lesser amounts of load compared to its conventional counterparts. However, it still suffers from overshoot frequency, which means that the amount of load being shed load is not optimal. This limitation prompted the use of intelligent and meta-heuristic techniques to determine the optimal amount of load that needs to be shed. A new fuzzy UFLS scheme was proposed for the islanded micro-grid [11,12]. This scheme is dynamic, robust, and is capable of regulating frequencies. Mokhlis et al. [13] proposed a new fuzzy logic based UFLS technique for the islanded distribution network to restore frequency as quickly as possible. The proposed technique utilizes frequency, the rate of change of frequency, and prioritizing loads. Other intelligent UFLS schemes in [14,15,16] also show that the number of loads being shed are not optimal in certain cases. Rad and Al-Hasawi et al. [17,18] proposed a GA to solve the under-voltage load shedding (UVLS), taking into account the load being shed at each bus. The fitness function minimizes the difference between the connected load and supplied powers. Chen et al. [19] proposed the application of GA to shed loads. It is applied on a real one-year load demand to determine the optimal setting of the UFLS. From simulation and comparison to other conventional techniques, it is evident that GA is capable of minimizing the loads being shed [20]. GA was tested on islanding distribution network that is made up of wind and diesel generators to shed the minimum amount of load. Luan et al. [21] proposed the GA technique to determine the value of the imbalance of power in emergencies. Other researchers used the PSO application to shed loads. Amraee and Mozafari et al. [22,23] implemented a PSO technique in the UVLS scheme to determine the maximum loading point and reduce interruption costs. A particle swarm-based-simulated annealing hybrid algorithm has also been proposed to deal with the under-voltage load shedding problem [24]. El-Zonokoly et al. [25] also proposed another comprehensive learning particle swarm optimization (CLPSO) to optimally partition the distribution system in cases of grid loss. Power balance is achieved by shedding the load from each island. Researchers also applied the Artificial Neural Network (ANN) for the load shedding problem. Hsu et al. [26] proposed an ANN-based load shedding technique, where it considers the total generation, total load demand, and frequency drop rate as inputs, and the minimum amount of load shedding as an output. A comparative study was conducted, and showed that the proposed load shedding technique is faster compared to its conventional counterparts. Other applications of the ANN technique to shed the optimal load in isolated power system are presented in [27,28,29]. This technique proposed an ANN-based load shedding technique to protect the DG-based distribution network from severe faults and disturbances.
From reviewing different load shedding techniques, there are two main issues associated with the existing UFLS schemes that need to be addressed. The first issue is related to fixed load shedding priority, which prevents these techniques from shedding optimal amounts of power. Fixed load shedding priority is linked to the loads that are separated from the network sequentially up based on look table made up of critical and non-critical loads. Accordingly, shedding unsuitable amounts of power could result in a complete blackout. For this reason, Laghari et al. [30] proposed a UFLS scheme to help shed the optimal amount of power. The loads are classified as critical and non-critical loads. For the former, the shedding priority is fixed, while for the latter, the shedding priority is random. In spite of the ability of the UFLS technique proposed in [30] to shed an optimal amount of power, it takes quite a while, since it goes through all of the possible combination of loads. Another issue is that the existing UFLS techniques are expected to be more suitable for the distribution network with low penetration level of DG-RESs. However, in the near future, the penetration level of RESs will rapidly increase. Thus, the distribution network will be exposed to several frequency stability problems that must be accounted for when designing new UFLS techniques. The increasing penetration of PV also made stabilizing the system frequency difficult during load shedding. This is due to the PV generation having a non-existent inertial response, which reduced the total network inertia constant [31,32]. In this situation, in the event of some disturbance, the system frequency drops quite quickly. Therefore, the UFLS scheme work in this environment must be fast enough to stop the frequency declination before the system experiences a total blackout.
In this paper, a new UFLS scheme is proposed to address two issues; first, the optimal amount of load being shed needs to be realized via meta-heuristic techniques and the combination of random priority loads, and second, the issue of high penetration PV that causes frequency to drop quickly can be mitigated by quick optimal load shedding scheme. This can be achieved by identifying a suitable meta-heuristic technique that can determine the amount of optimal load in a short amount of time. In this work, three techniques were used; BGA, BEP and BPSO. It can be seen from the results that the UFLS scheme using BEP was able to determine the optimal load faster compared to BGA and BPSO.

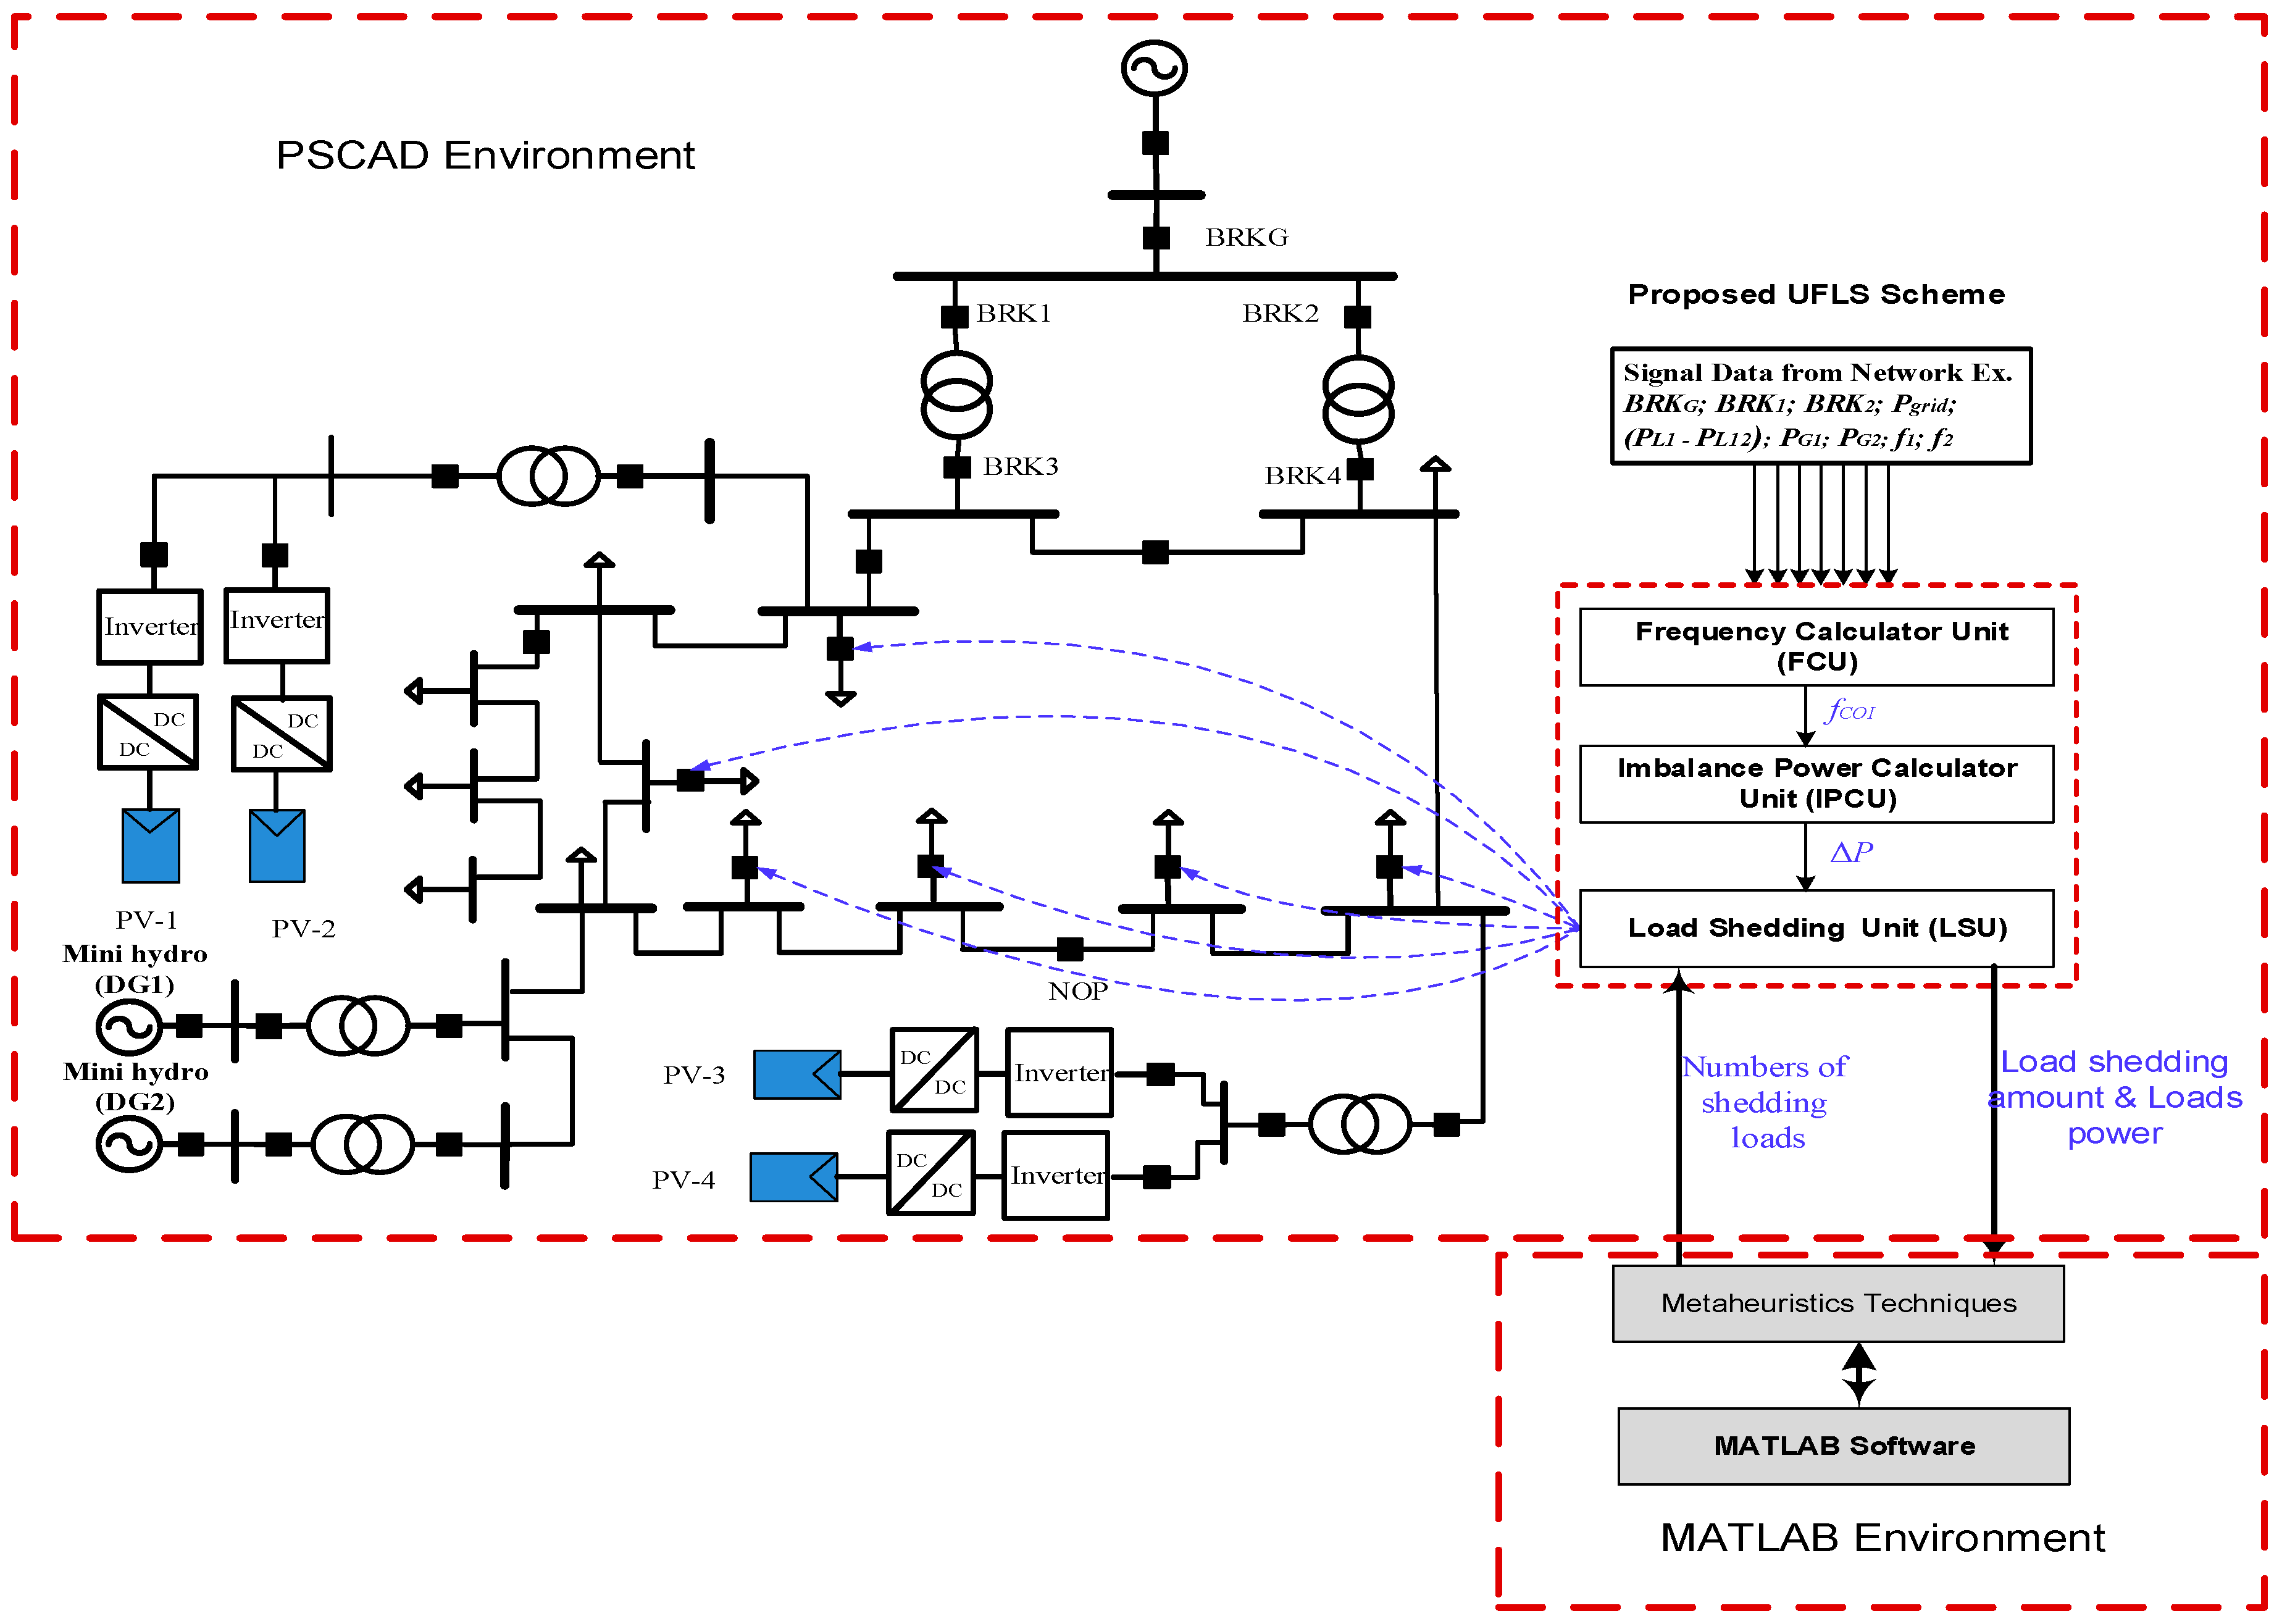
2. Methodology of Proposed UFLS Technique

This UFLS scheme is proposed for islanded distribution networks that have high penetration of solar PV generation. In this scheme, the application of meta-heuristic techniques is used to select the optimal combination of loads that needs to be shed from ten-random priority loads and two-fixed priority loads. Whereas the term “fixed priority” is related to the loads separated from the network sequentially based on look up table, the term “random priority” is related to the loads that can be shed randomly without any sequence. Figure 1 shows the main units of the proposed UFLS technique: (1) Frequency Calculator Unit (FCU); (2) Imbalance Power Calculator Unit (IPCU); and (3) Load Shedding Unit (LSU).
The UFLS technique proposed in this research is simulated by PSCAD/EMTDC and MATLAB software. The distribution network and load shedding scheme are running under PSCAD Software, when the UFLS technique is initiated due to islanding or imbalance events, a meta-heuristic technique is called from MATLAB software. The PSCAD send the required data for optimization operation to MATLAB software. After MATLAB finish the optimization operation, it returns the optimal shedding load to PSCAD to complete the shedding process.

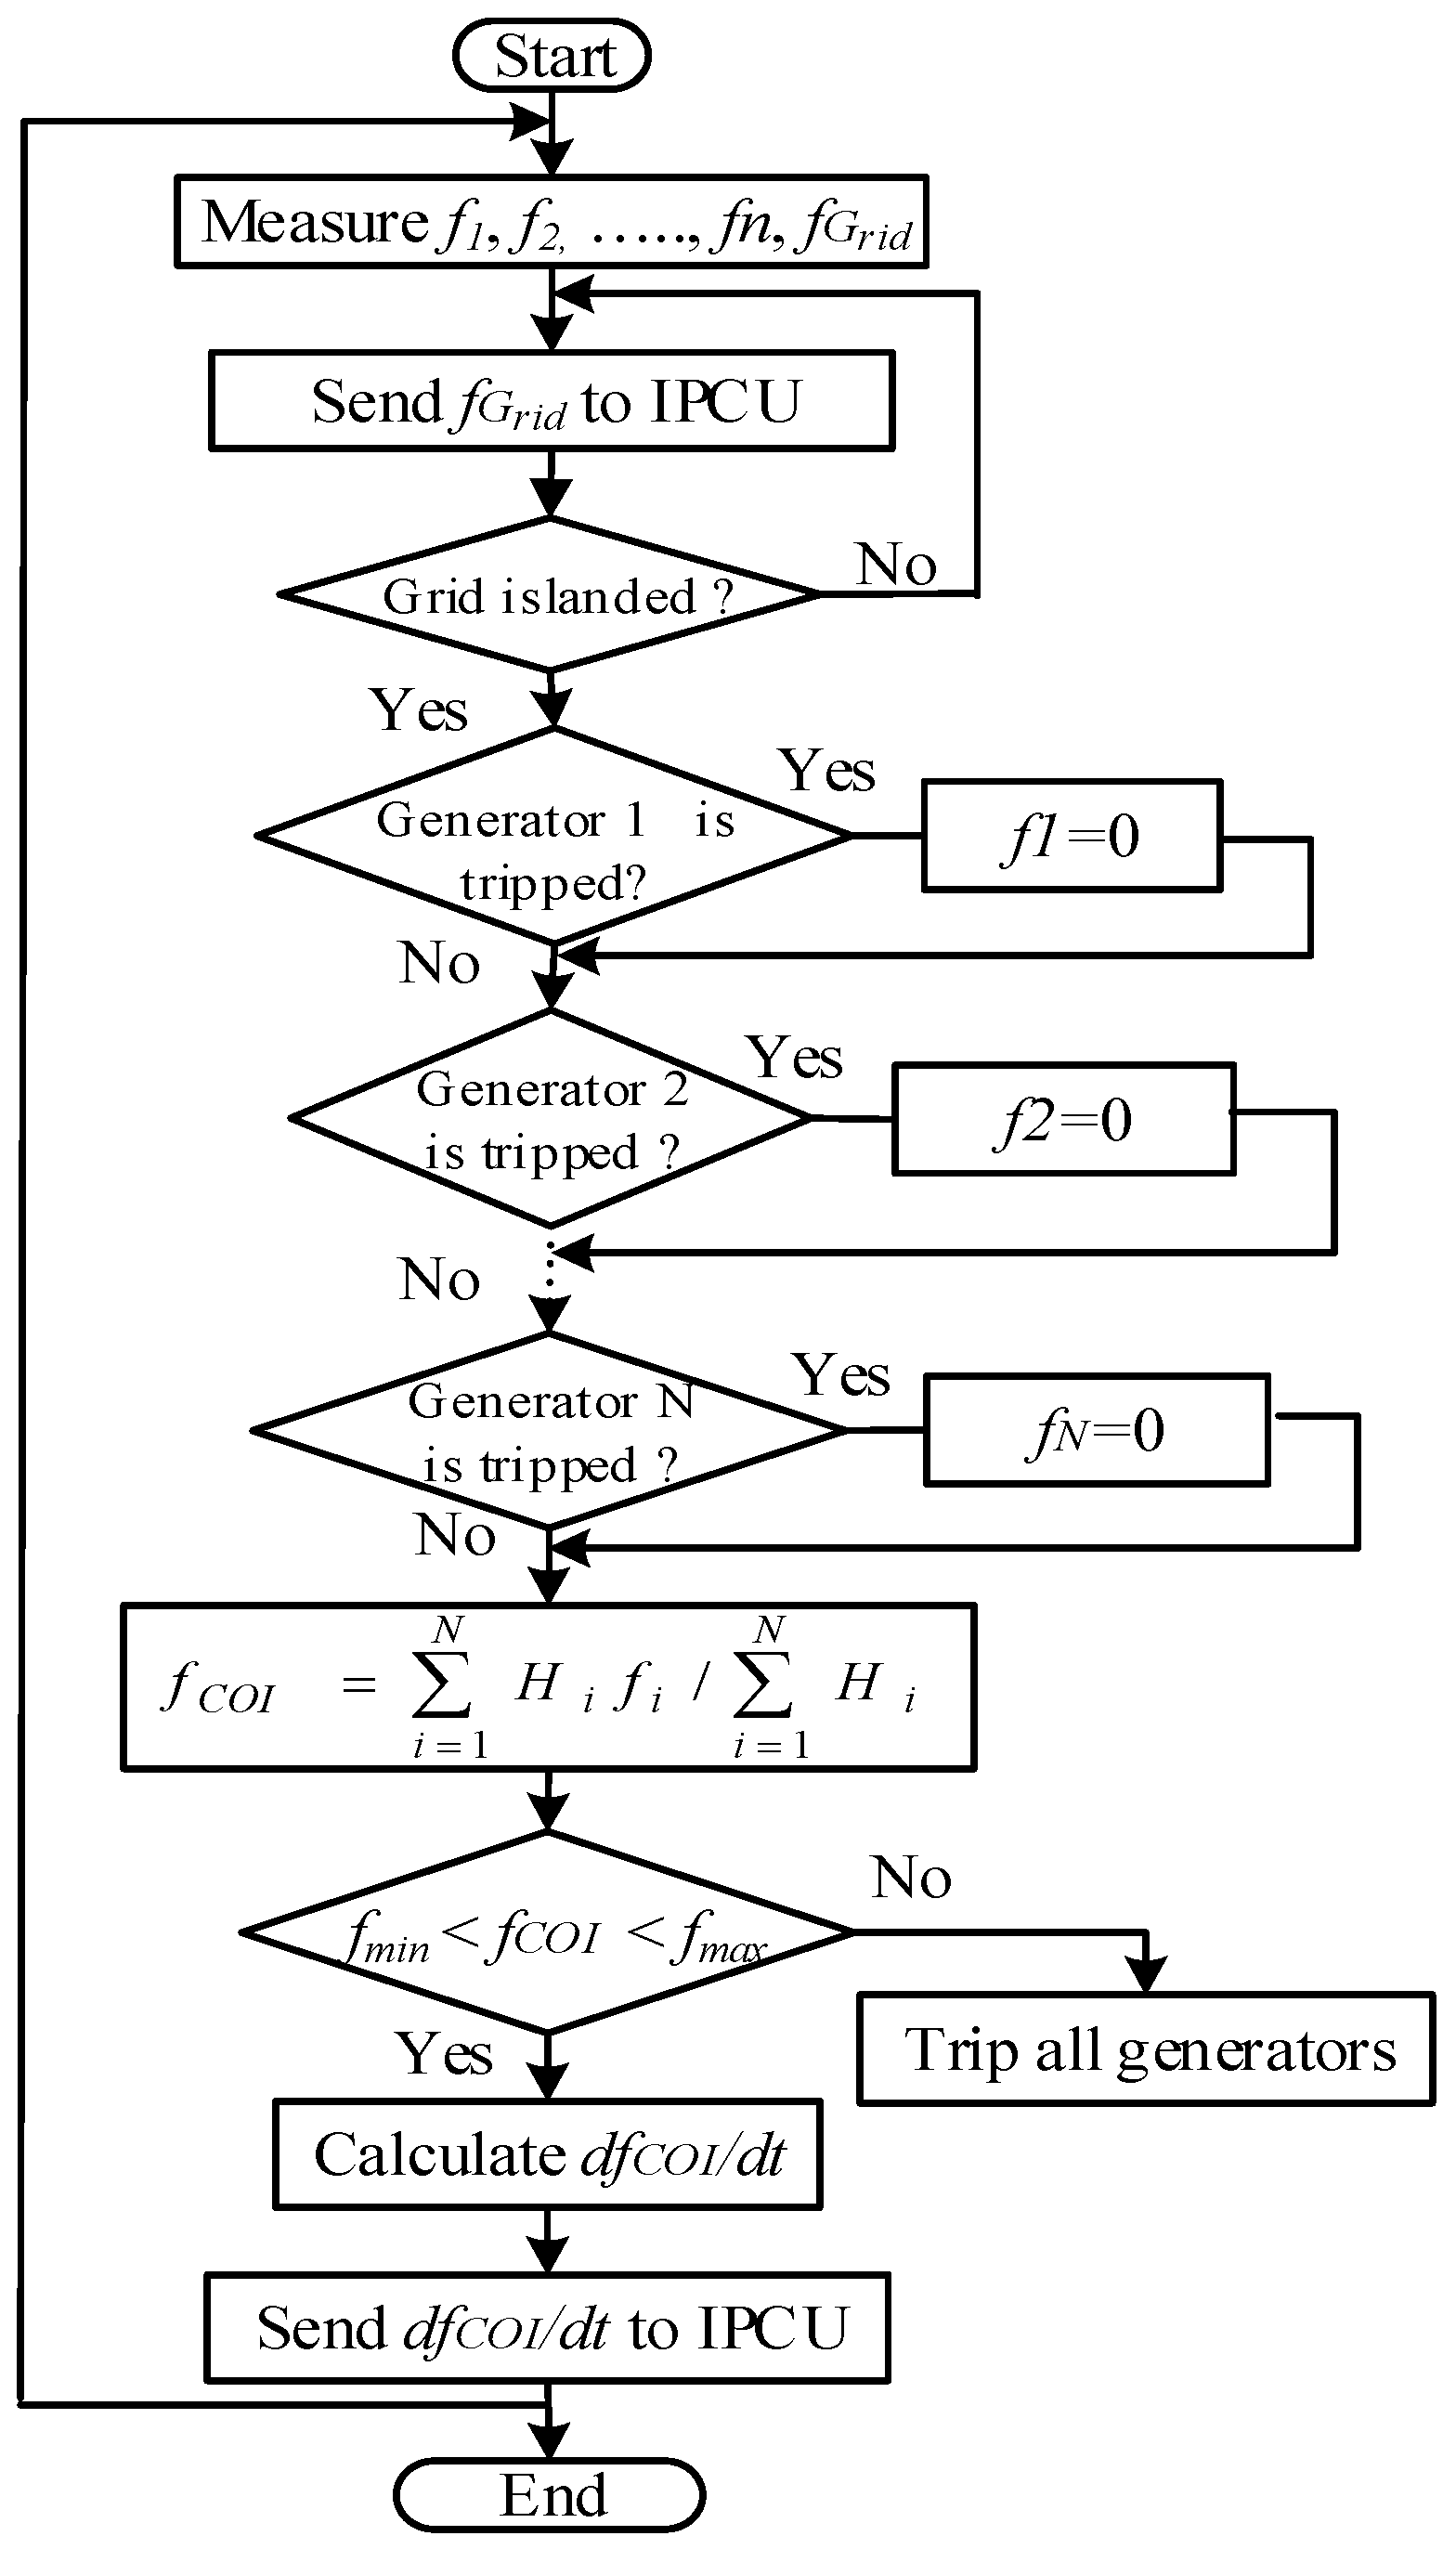
2.1. Frequency Calculator Unit (FCU)

The operation of FCU is shown in Figure 2. For the grid connected mode, the FCU use the grid frequency and send it to IPCU, while for the islanded mode, the FCU calculate the value of fCOI based on Equation (1) [33] and send it to IPCU. Furthermore, at every moment of time, the FCU check the connection state of each generator. If any disconnection occurs, a new equivalent value of fCOI will be calculated.
f C O I = i = 1 N H i f i i = 1 N H i
where fCOI is center of inertia frequency (Hz); Hi is inertia constant of each generator (seconds); fi is the frequency of each generator (Hz); and N is the number of DGs.
Besides the frequency calculation operation, the FCU provides a kind of frequency protection for connected generators. It will check the value of fCOI, whether or not it lies within the frequency protection range. If the value of fCOI lies beyond the range, the protection relays will directly disconnect the generators from the network. Generally, the frequency protection range for each generator is based on the distribution network and generator types. According to the Malaysian distribution code, the protection frequency range is (47.5 Hz–52.5 Hz).

2.2. Imbalance Power Calculator Unit (IPCU)

Depending on the value of rate of change of frequency (df/dt) received from FCU and breaker state of grid and DGs, the IPCU has two different strategies in determining the imbalance power.

2.2.1. Event Based

In this paper, the IPCU algorithm is designed to follow the event base in three cases: (1) intentional islanding; (2) DG tripping; and (3) irradiance change. For the islanding event, the imbalance power will be equal the grid power, which is supplied to the distribution network. For DG tripping event, the power imbalance will be equal the value of tripped DG power. While for irradiance variation, the imbalance power will be calculated based on Equation (2).
Δ P = P V 0 P V
where Pv0 is the total PV power at the radiation change event; and Pv is the total PV power at 0.01 ms after radiation changing event.

2.2.2. Response Based

Response based occurs due to the sudden increment of load demand in the islanded distribution network. In this case, the load shedding amount is based on disturbance value that can be estimated by the swing equation [34,35].
Δ P = ( ( 2 × i = 1 N H i f n ) × d f C O I d t )
where ΔP is pu imbalance power relative to system base power of 1 MW; Hi is the inertia constant of each generator (s); dfCOI/dt is rate of change of center of inertia frequency (Hz/s); N is the number of rotating based DG; and fn is the nominal frequency (Hz).
In order to determine the amount of load to be shed for event or response based strategies, the same equation will be followed, which is expressed as:
Load   shed   amount = Δ P T R
where TR is the total reserve power, and can be calculated by Equation (5).
T R = i = 1 N P G i .   m a x i = 1 N P G i
where PGi,max is the maximum generator power of ith DG; PGi is the generator power of ith DG; and N is the number of DGs.
Finally, the IPCU send the load-shed amount to the LSU via communication link to shed the optimal combination of loads

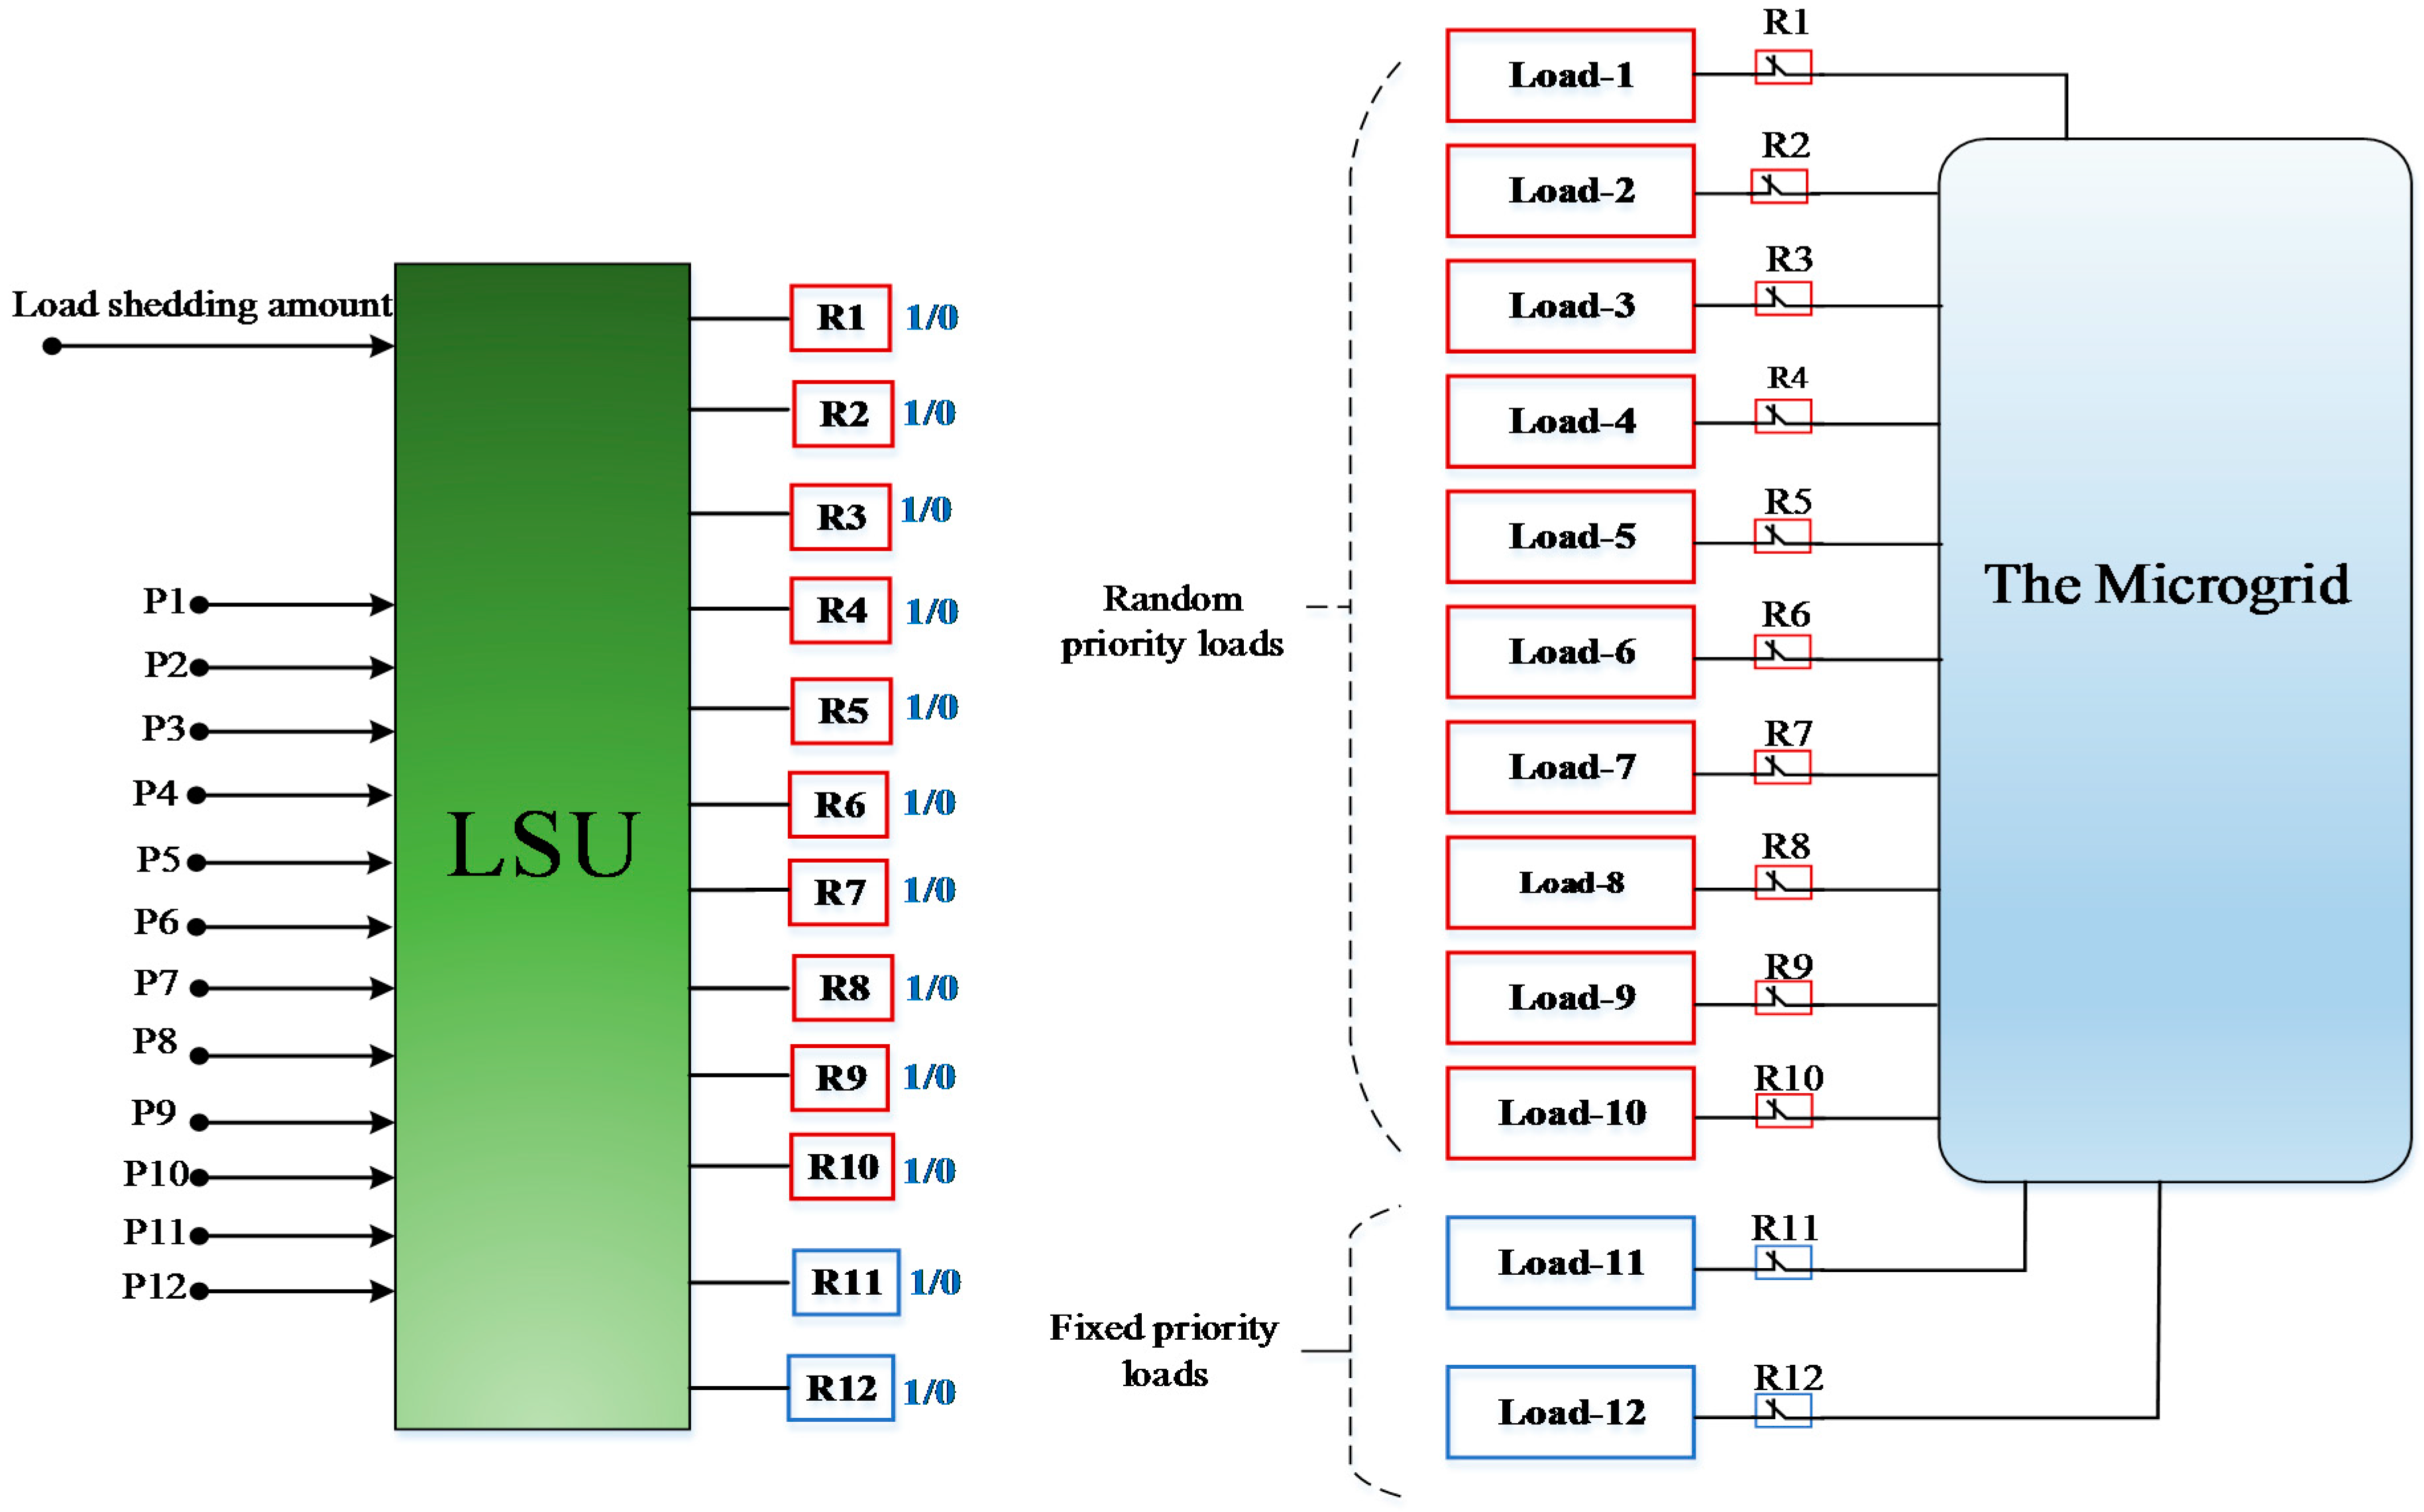
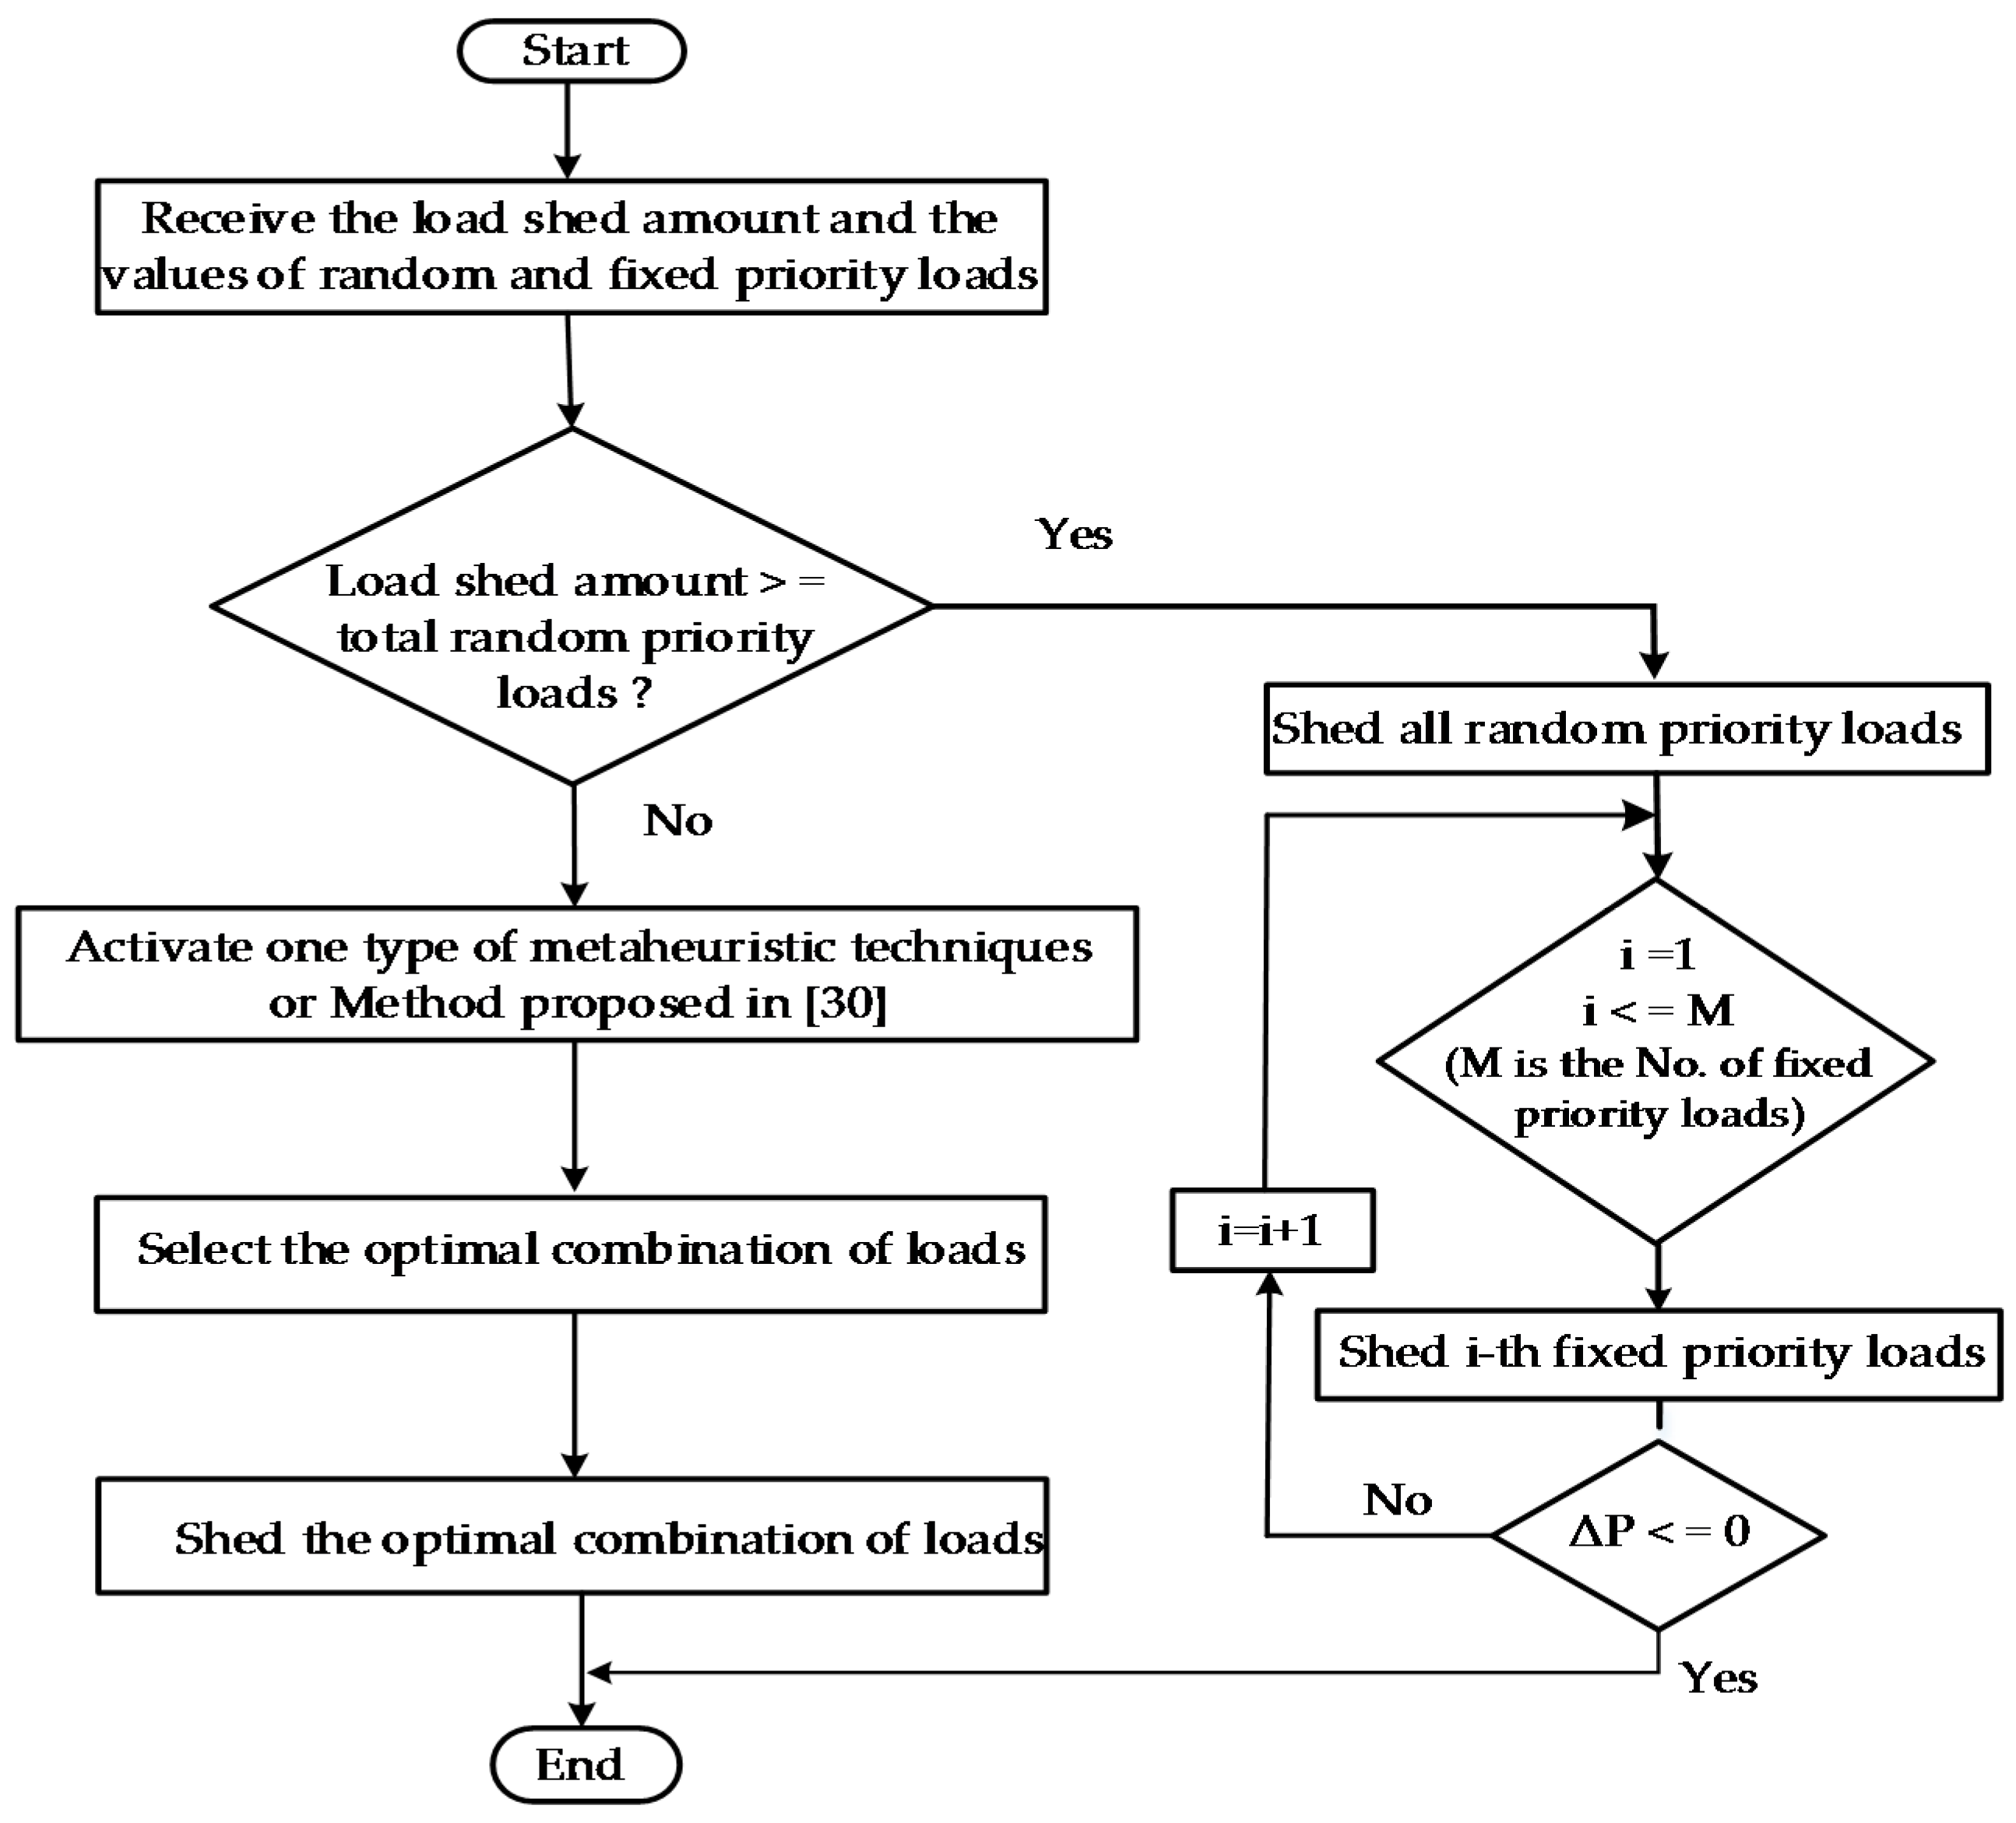
2.3. Load Shedding Unit (LSU)

The LSU is the most important part of the proposed UFLS scheme. This part reports the preference of the proposed scheme over existing schemes. As shown in Figure 3, when the load shedding value is larger than the total random priority loads, the LSU directly shed all random priority loads and start shedding from fixed priority loads. Otherwise, one meta-heuristic technique is initialized to shed the optimal combination of loads. Since the PSCAD//EMTDC software does not provide a toolbox for meta-heuristic techniques, the proposed UFLS is modeled in MATLAB and integrated with PSCAD.

3. Problem Formulation

As discussed in the introduction, due to fixed load shedding priority, the existing UFLS unable to shed the optimum loads from islanding distribution networks. Therefore, this problem can be formulated as an optimization problem with suitable objective function and constraints. The objective function of the load shedding problem is to minimize the load shedding amount during islanding or imbalance conditions. It can be expressed mathematically as:
f i = M i n ( E i ) = | Load   shed   amount P i - c o m b i n a t i o n |
where ∑Pi-combination is the summation of loads power for all buses.
• Constraints
The equality constraints of optimization technique proposed for existing load shedding scheme is normally expressed by flow equations for each bus, while, in this research, the imbalance power is calculated as one value expressed by swing equation. Therefore, this will reduce the complexity of optimization problem, and the objective function of the optimization problem is reached in less convergence time. For inequality constraints, real and reactive power of generators and loads are considered. The real power generation inequality constraint is considered for base case condition as well as the change of generator value for loading condition. Similarly, the reactive power generation inequality constraint is considered under base case condition as well as the change of reactive power of generator value for loading condition.
0.8 × P G i P G i 1.2 × P G i
0.8 × Q G i Q G i 1.2 × Q G i
0 Δ P D i P D i
where ΔPDi is change of power load demand; PGi is active generation power for each bus; QGi is reactive generation power for each bus; PDi is the maximum demand load at each bus. To prevent the voltage instability of the system, the bus voltage at each bus i must be maintained around its normal value expressed in terms of the inequality function as
V i m i n V i V i m a x
Practically, this deviation can reach up to 10% of the nominal voltage value [36,37].

3.1. Application of Meta-Heuristics Techniques for UFLS Technique

The problem in UFLS is involving selection of loads at specific buses to be shed. Therefore, it is involving optimization of discrete number. Due to this condition, the selected optimization techniques for UFLS should be able to deal with discrete number. Therefore, in this work, three discrete optimization techniques are selected: Binary Evolutionary Programming (BEP), Binary Genetic Algorithm (BGA); and Binary Particle Swarm Optimization (BPOS). These techniques have been applied in other works [38,39,40,41], but not to determine optimal load to be shed.

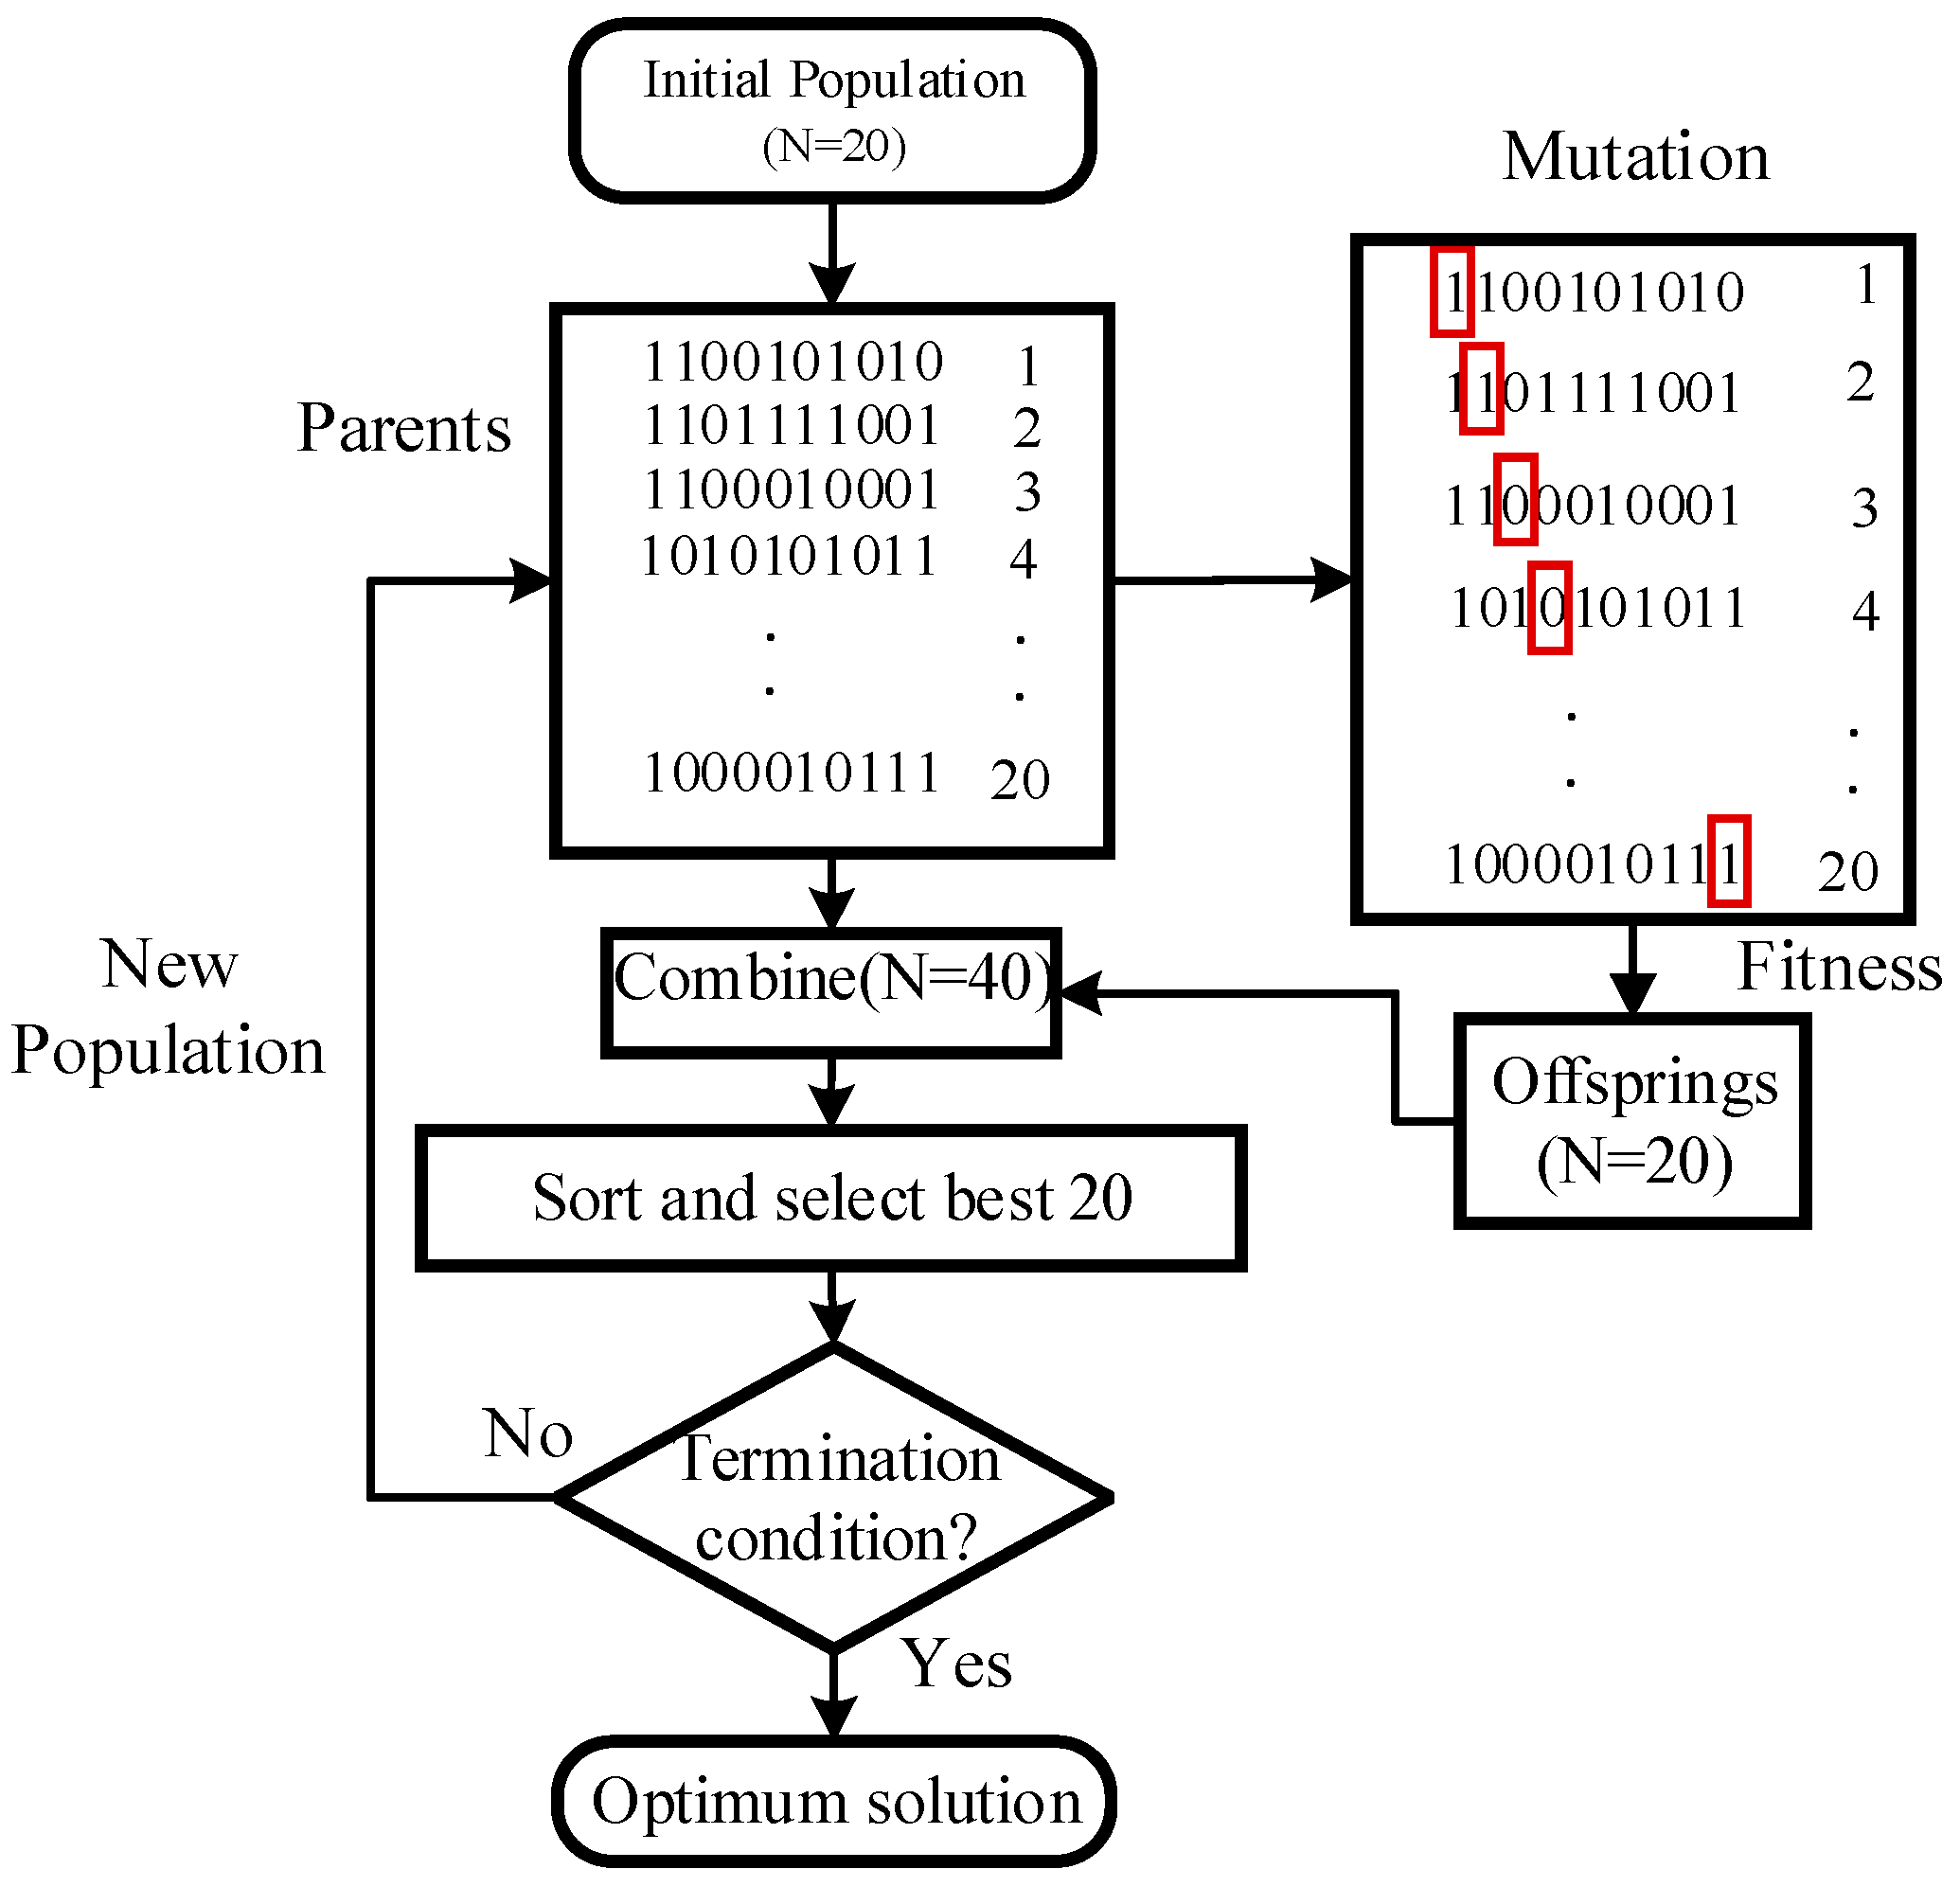
3.1.1. Implementation of Binary Evolutionary Programming (BEP)

In this paper, BEP technique is proposed to determine the optimal combination of loads that needs to be shed. The flow chart of binary evolutionary programming is shown in Figure 4. Like other evolutionary techniques, the BEP has five phases; initialization, fitness, mutation, recombination, and selection.

Initialization and Fitness

In this phase, an initial population of (Xi) chromosomes will be generated randomly, where each chromosome represents the connection status of random priority loads. Then, the fitness values for each chromosome is calculated using the fitness function shown in Equation (6). To illustrate the fitness function, an example of 1 MW imbalance power is considered in Table 1.

Mutation

The mutation is an operator used to avoid the local optima by preventing the generations from becoming similar to one another. In this phase, one bit in each chromosome is checked for possible mutation [41]. This is done by generating a random number in range of (0–1), and if this number is less than or equal to the mutation probability L, then the bit state will be changed. The probability of a mutation for each bit is 1/L, where L is the number of bit in each chromosome.

Combined and Selection

In this phase, the offspring produced from the mutation phase and parents are combined in the same competition pool. After that, the survivals are ranked in an ascending order based on fitness value. Then, the first half is selected to be the parents of the next generation. This operation continues until the convergence condition is achieved, as shown in the following equation:
f i t n e s s m a x f i t n e s s m i n 0.005
Finally, the BEP technique selects the optimal load combination that has a minimum fitness value. After that, the LSU sends the signal to the breakers to shed the optimal combination of loads. The delay time that includes the EP calculation, communication, and CB operation time is assumed to be 190 ms, based on practical considerations [42].

3.1.2. Implementation of Binary Genetic Algorithm (BGA)

The binary genetic algorithm is one of the heuristic search technique based on the evolutionary ideas of natural selection and genetics [43]. Different from the evolutionary programming, the genetic algorithm is mainly based on crossover operator in finding the optimal solution. The genetic algorithm is very similar to the evolutionary programming. However, in genetic algorithm, an initial population of 20 chromosomes is randomly generated, and then these chromosomes will be ranked depending on the fitness value. Afterwards, a crossover is performed between each consecutive pair of the parent’s chromosomes. Generally, the crossover is made up of many types, such as single-point crossover, two-point crossover, and uniform crossover [44]. In this work, a single point crossover is used.

3.1.3. Implementation of Binary Particle Swarm Optimization (BPSO)

The particle swarm optimization (PSO) is a parallel intelligent technique that imitates the behavior of flying birds or bees while searching for food. These birds are represented by particles, which fly in a multidimensional space to find the optimal solution. The flying position and velocity of each particle are adjusted according to its own experience and other particles experience, where this process is expressed by Equations (12) and (13) [45].
V i n + 1 = w × V i n + c 1 × r 1 ( P i n X i n ) + c 2 × r 2 ( P g n X i n )
X i n + 1 = X i n + V i n + 1
where i is the number of particles; n and w are the generation number and the inertia weight, respectively; X i n , V i n , and P i n are the position, velocity and particle best position; P g n represents the global best position; c1 and c2 are the cognitive and social components, respectively; and r1 and r2 are uniform random numbers between 0 and 1.
In the BPSO, the global and previous best positions are mutated in a manner similar to the PSO technique. The main difference between BPSO and PSO is the component of each particle is represented by a binary value of 0 or 1, where this value is updated according to Equation (14).
{ X i d n + 1 = 1   if   rand < S ( V i d n + 1 ) X i d n + 1 = 0   if   rand   > S ( V i d n + 1 ) }
where the sigmoid limiting transformation is expressed by:
S ( V i d n + 1 ) = 1 1 + e V i d n + 1
where Xidn+1 and Vidn+1 represent the dth component of Xin+1 and Vin+1, respectively; and rand represent random numbers uniformly distributed between 0 and 1.

3.2. Using UFLS Technique Based on Fixed and Random Proiority of Loads (UFLS-FRPL)

In the UFLS-FRPL proposed in [30], when the imbalance power is received by LCU, all possible combinations of random priority loads are generated. In this paper, ten loads are selected as random priority loads and two loads are considered as a fixed priority loads as shown in Figure 5.
According to random priority loads number, the load combinations will be 1023, based on Equation (16). After that, the fitness value for each combination will be calculated. A combination of loads having lesser fitness values will be selected to be shed from the microgrid. Table 2 shows the possible combinations of 10 loads and the fitness values for each combination when the load shedding amount is 0.15 MW.
Number   of   combination = 2 n 1
where n is the number of loads.

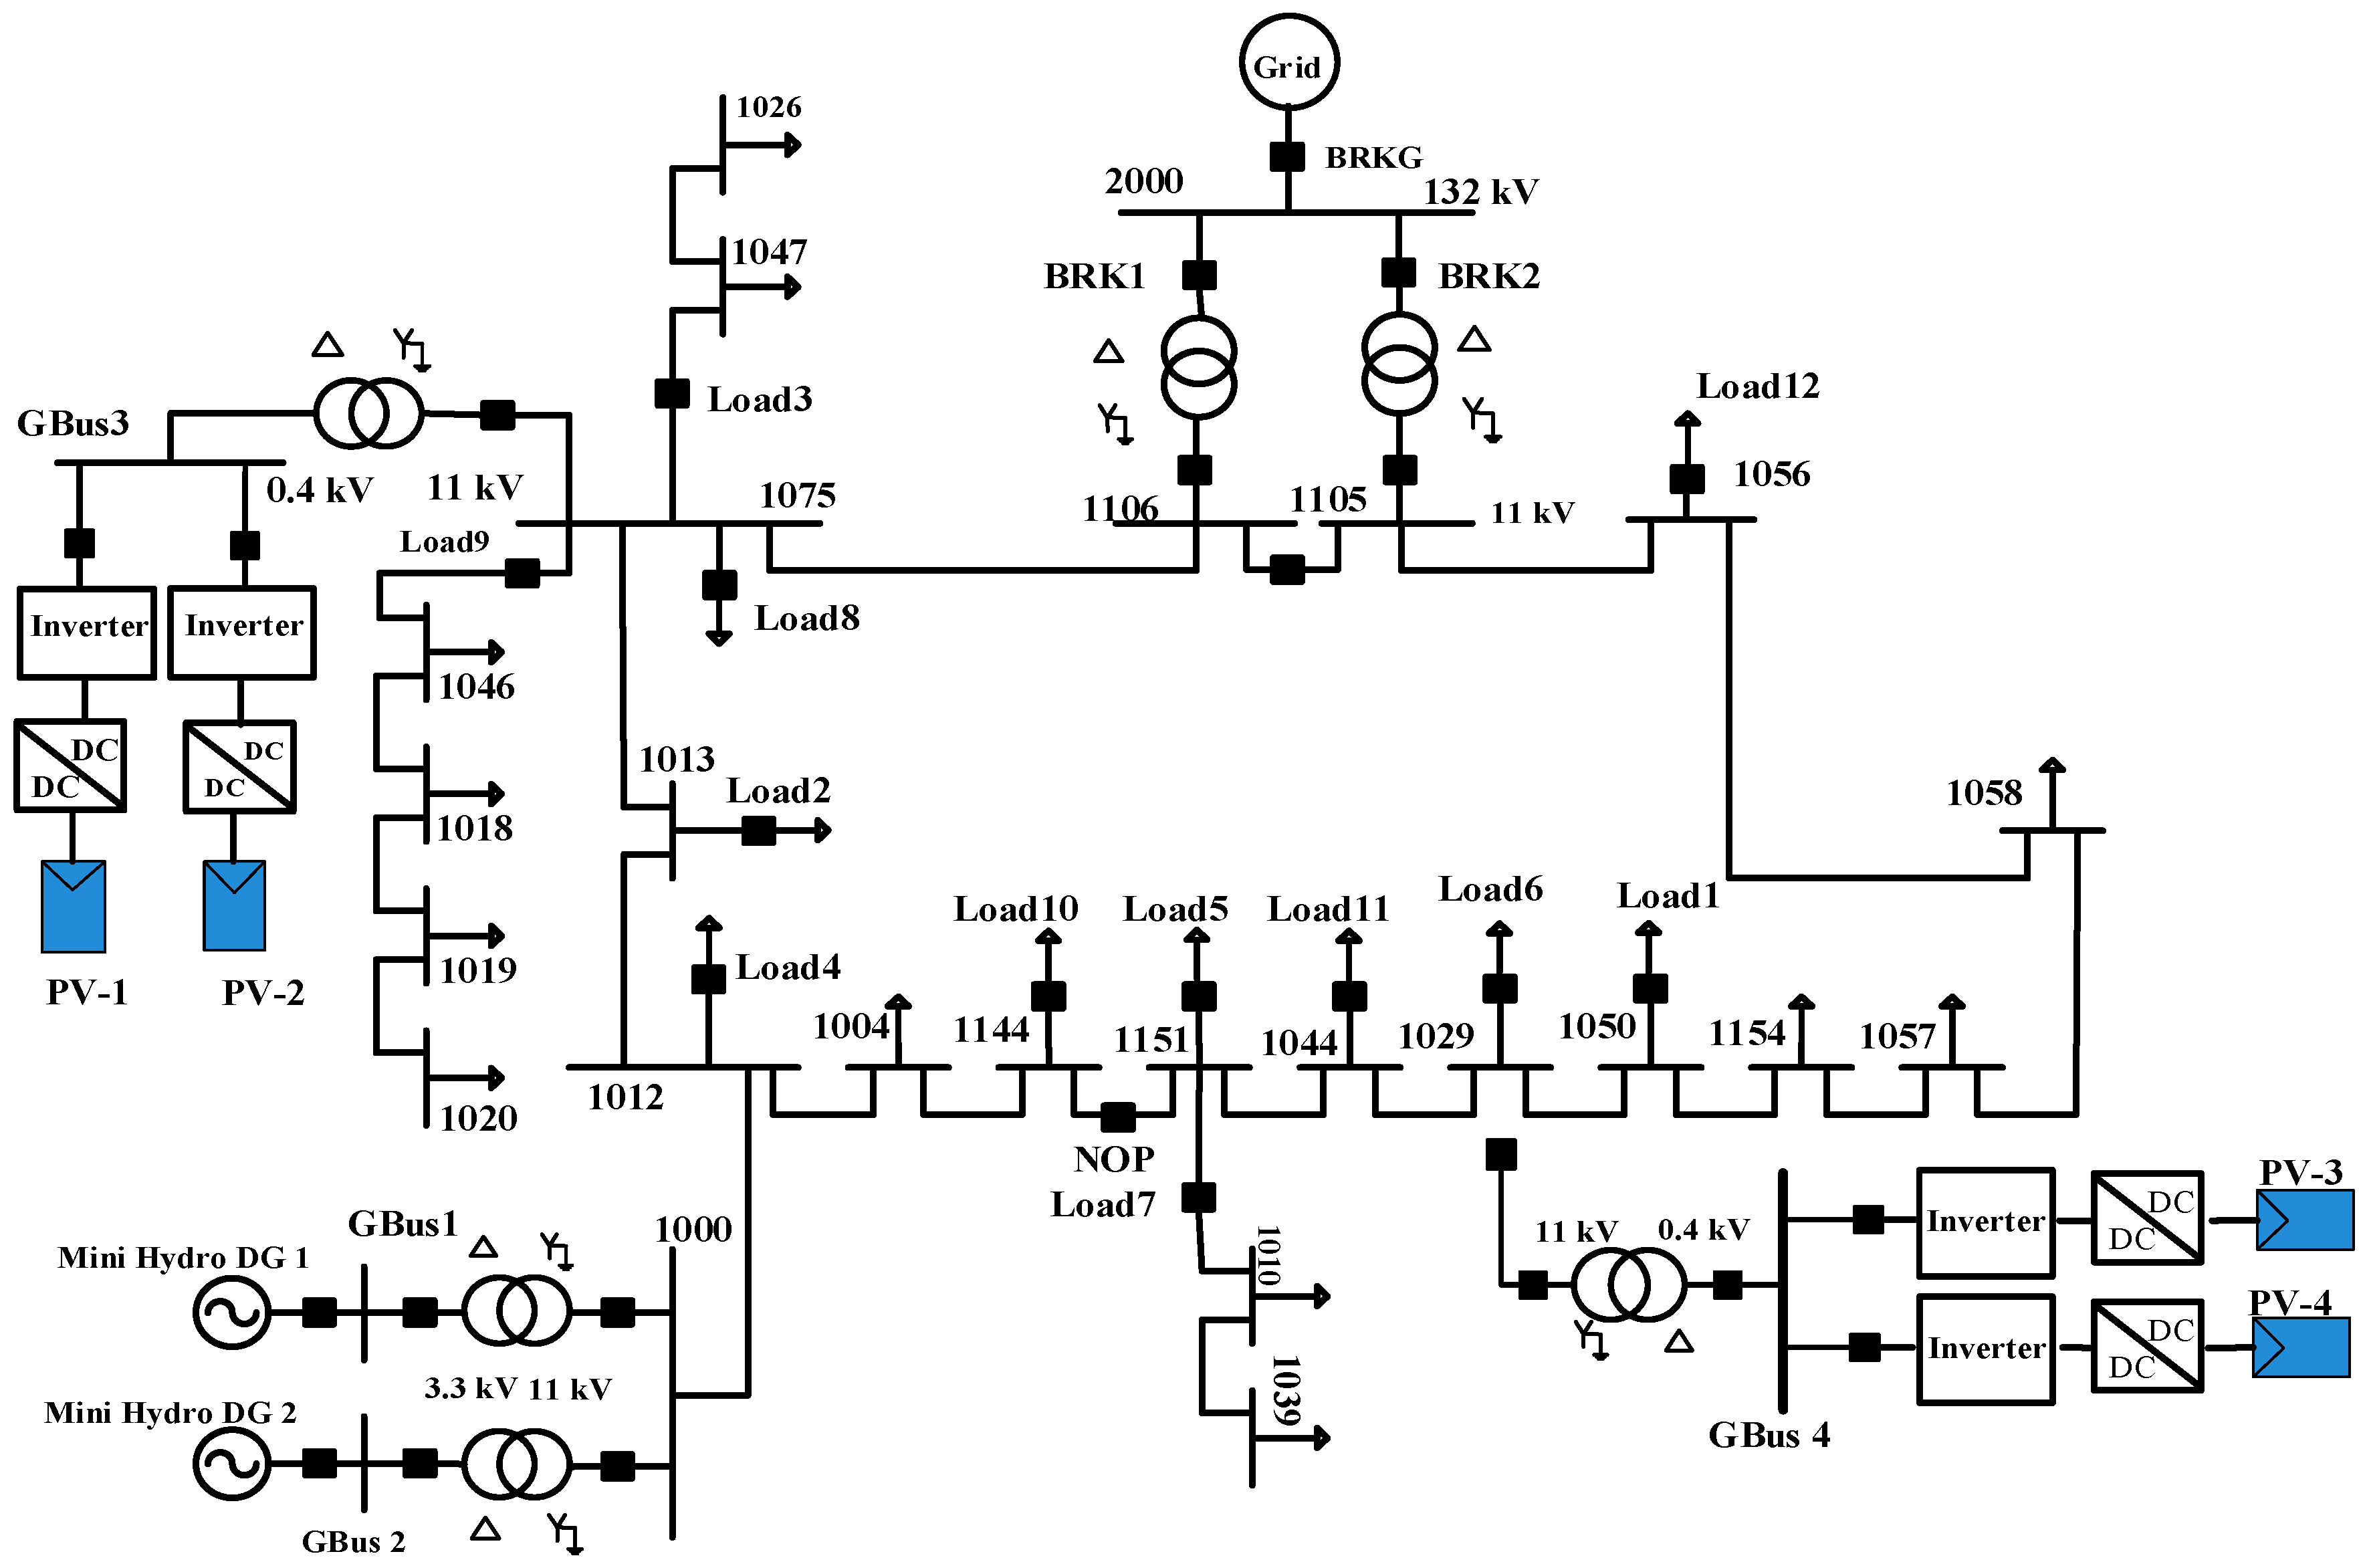
4. Distribution Network Modeling

To validate the operation of UFLS control proposed in this paper, part of the Malaysian distribution network was modeled using PSCAD/EMTDC software, as shown in Figure 6. The network under test consists of two mini-hydro units based on synchronous generators, each rated 2 MVA, with a maximum dispatch of 1.8 MW. Two units of 2 MVA step up transformer were connected to the DGs to increase the voltage level from 3.3 KV to 11 KV. The distribution network is connected with transmission grid via two feeders, with each feeder using 30 MVA step down transformer (132 KV/11 KV). In this paper, standard models of PSCAD were used for governor, exciter, and hydraulic turbines. The turbine chosen for mini-hydro units is the hydraulic turbine with a non-elastic water column without a surge tank model. For excitation and governor systems, the IEEE type AC1A model and PID governor with pilot and servo dynamics were selected [30]. The total load demand of the distribution network is 6 MW, 2 VAr. This load demand is covered by 5.4 MW generated from mini-hydro and PV generation, and 0.6 MW is covered by the main grid. To study the effect of integrating large-scale grid connected solar PV on the frequency stability of islanded distribution network, four solar PV units are used, and each unit is rated 0.55 MW. The penetration level is 35%, which is expressed from Equation (17) [46].
P L e v e l ( % ) = T o t a l   P e a k   P V   P o w e r T o t a l   P e a k   l o a d   a p p e r e n t   p o w e r × 100 % = 2.2   M W ( 6   M W ) 2 + ( 2   V A r ) 2 × 100 % 35 %

4.1. Modeling of Distribution Network Loads

The distribution network being tested consists of 29 buses and 21 lumped loads. In real power systems, the load characteristics always depend on the voltage and frequency, thus the static model is used to represent the distribution network loads, as [41].
P = P 0 × ( V V 0 ) a × ( 1 + ( K p f × d f ) )
Q = Q 0 × ( V V 0 ) b × ( 1 + ( K q f × d f ) )
where P and Q are active and reactive power for corresponding voltage and frequency; P0 and Q0 are active and reactive power at base voltage and frequency; Kpf and Kqf are the coefficient of active and reactive load dependency on frequency; a and b are the load model parameters determining if this model represents constant power, constant current, or constant impedance characteristics; and df is the frequency deviation.
In this work, the values for Kpf, Kqf, a, and b are set to 1.0, −1.0, 1.0, and 2.0, respectively [41]. To apply the proposed load shedding technique, 11 loads from the distribution network have been determined. Generally, loads are divided into commercial, industrial, and residential types. Since industrial and commercial loads are more important than residential loads, commercial loads (Load 11 and Load 12) take the fixed priority, while residential loads (Load 1–Load 10) take the random priority as shown in in Table 3.

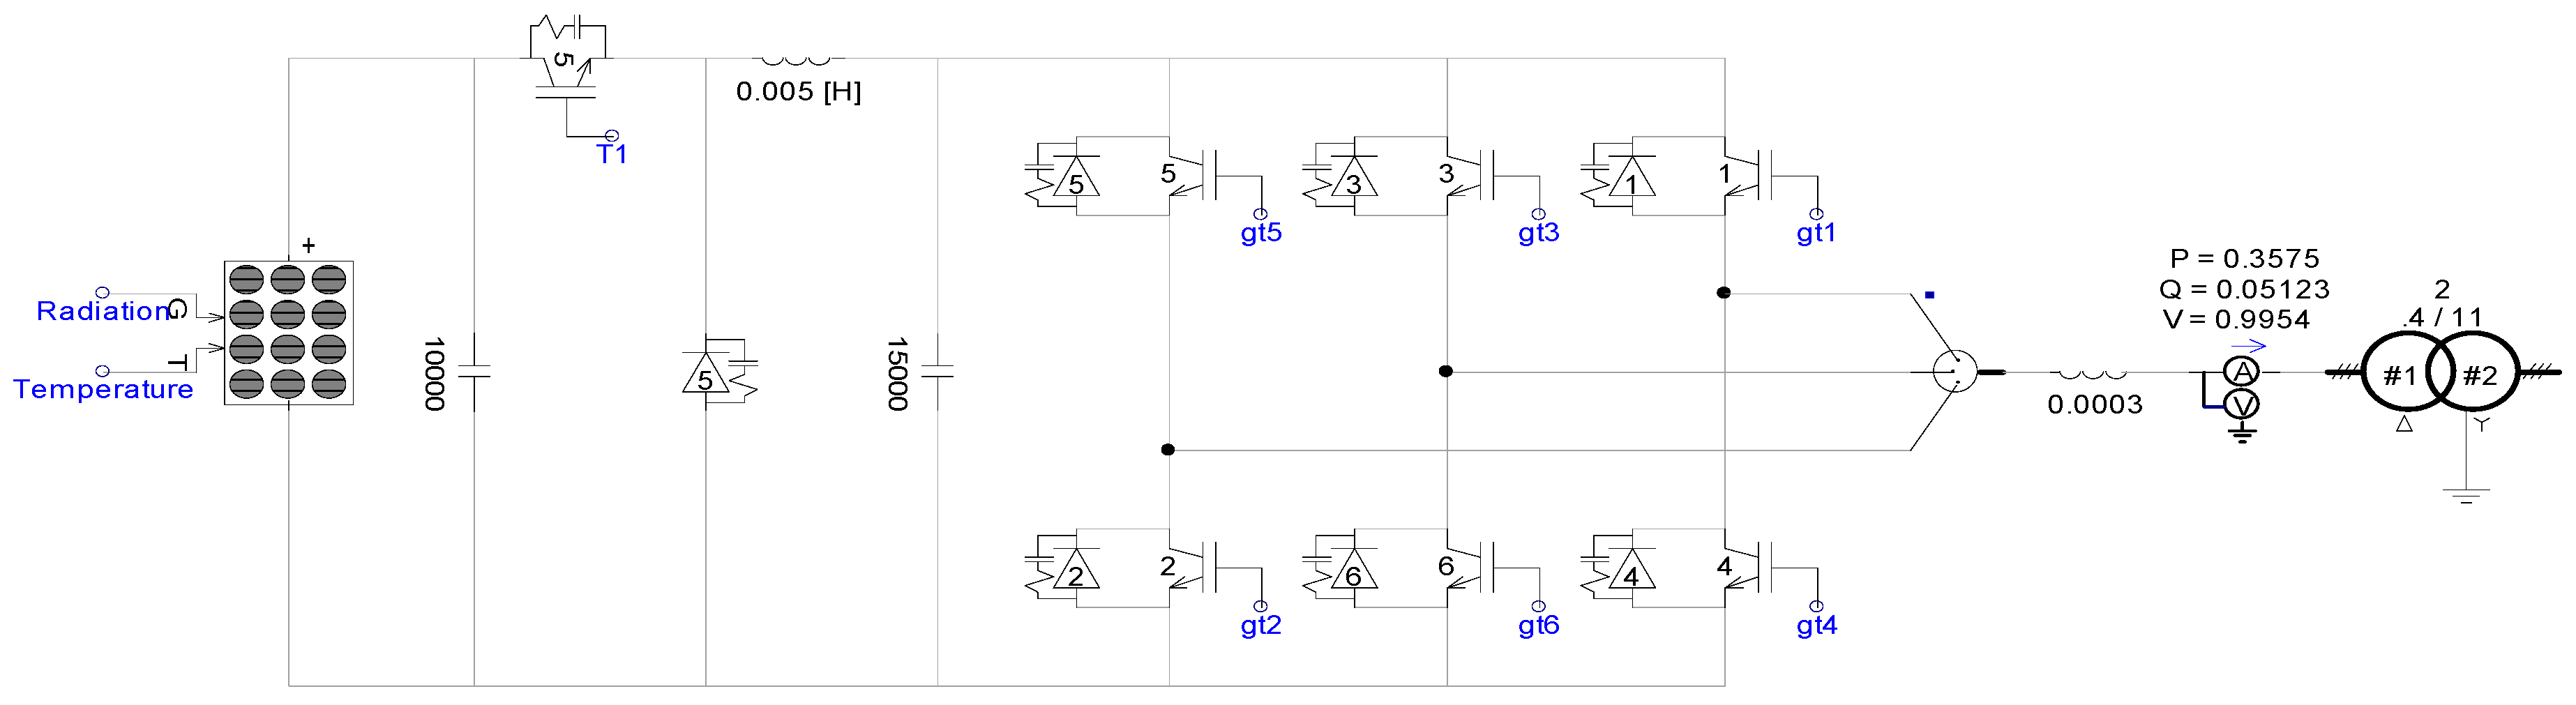
4.2. Model of Solar Photovoltaic Generation

The PSCAD model used in this research is shown in Figure 7; it mainly consists of PV array model, DC-DC converter, DC link capacitor, three-phase inverter, AC filter, and transformer. The following sections describe the details on these devices.

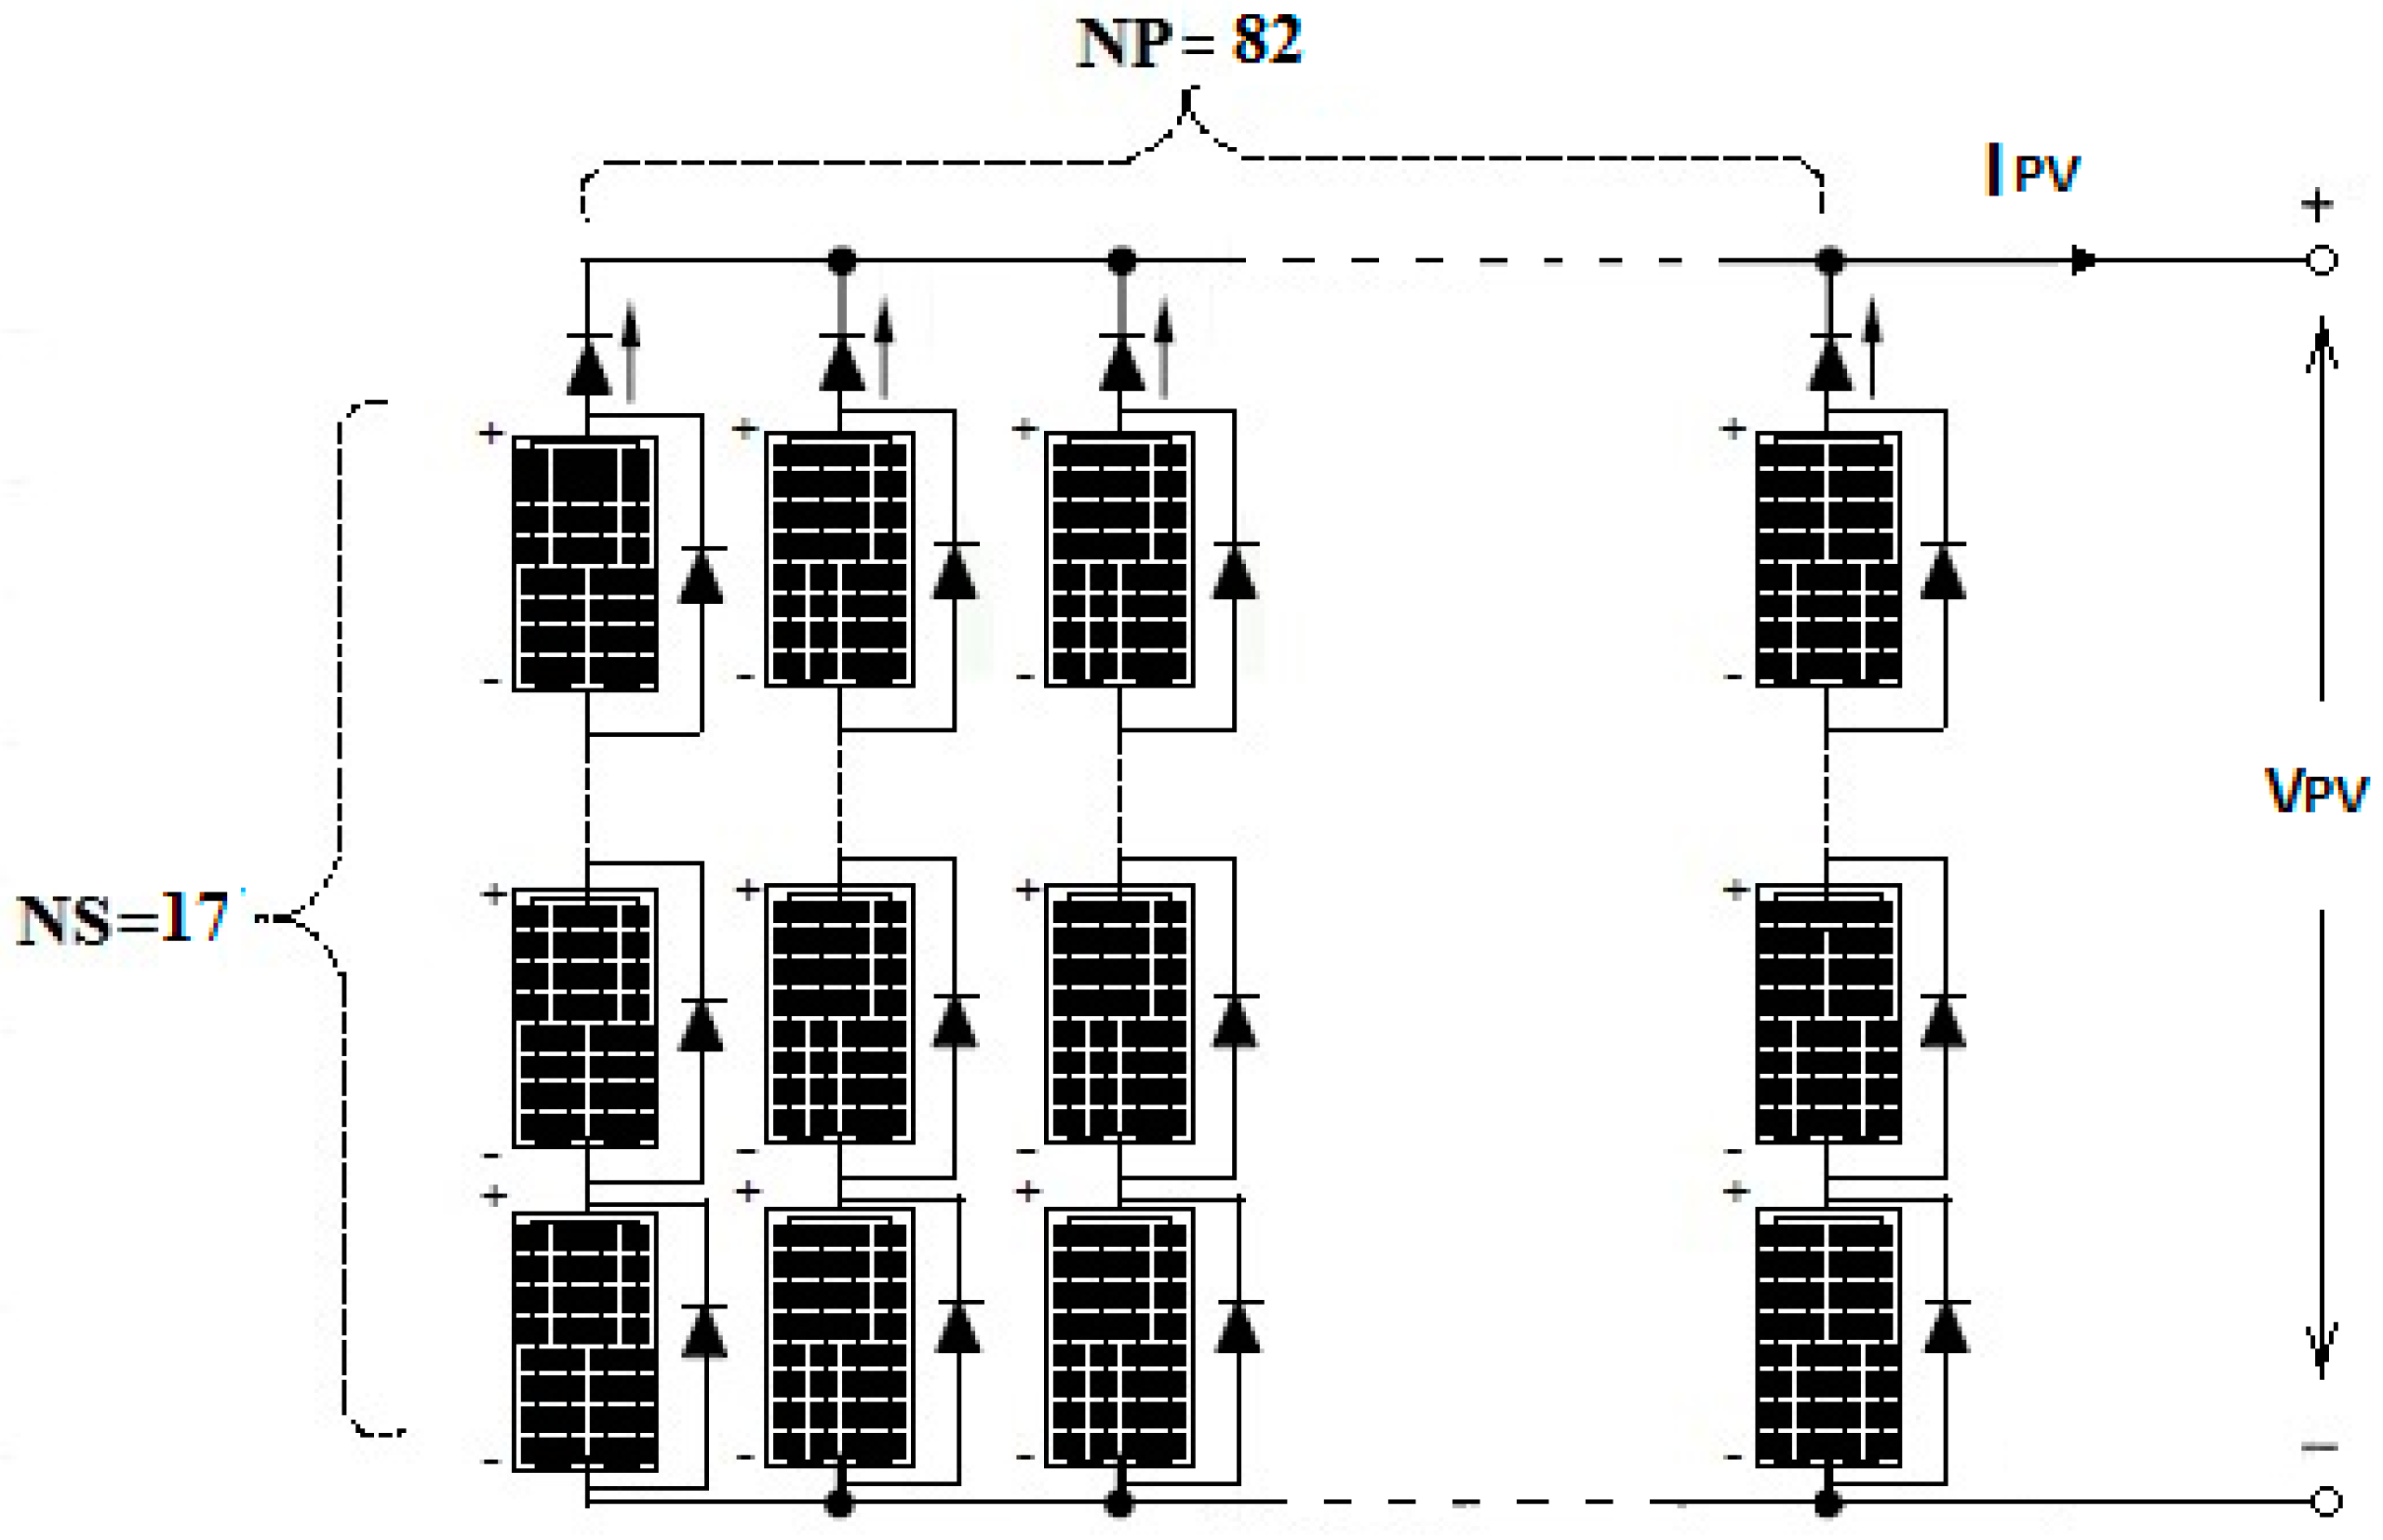
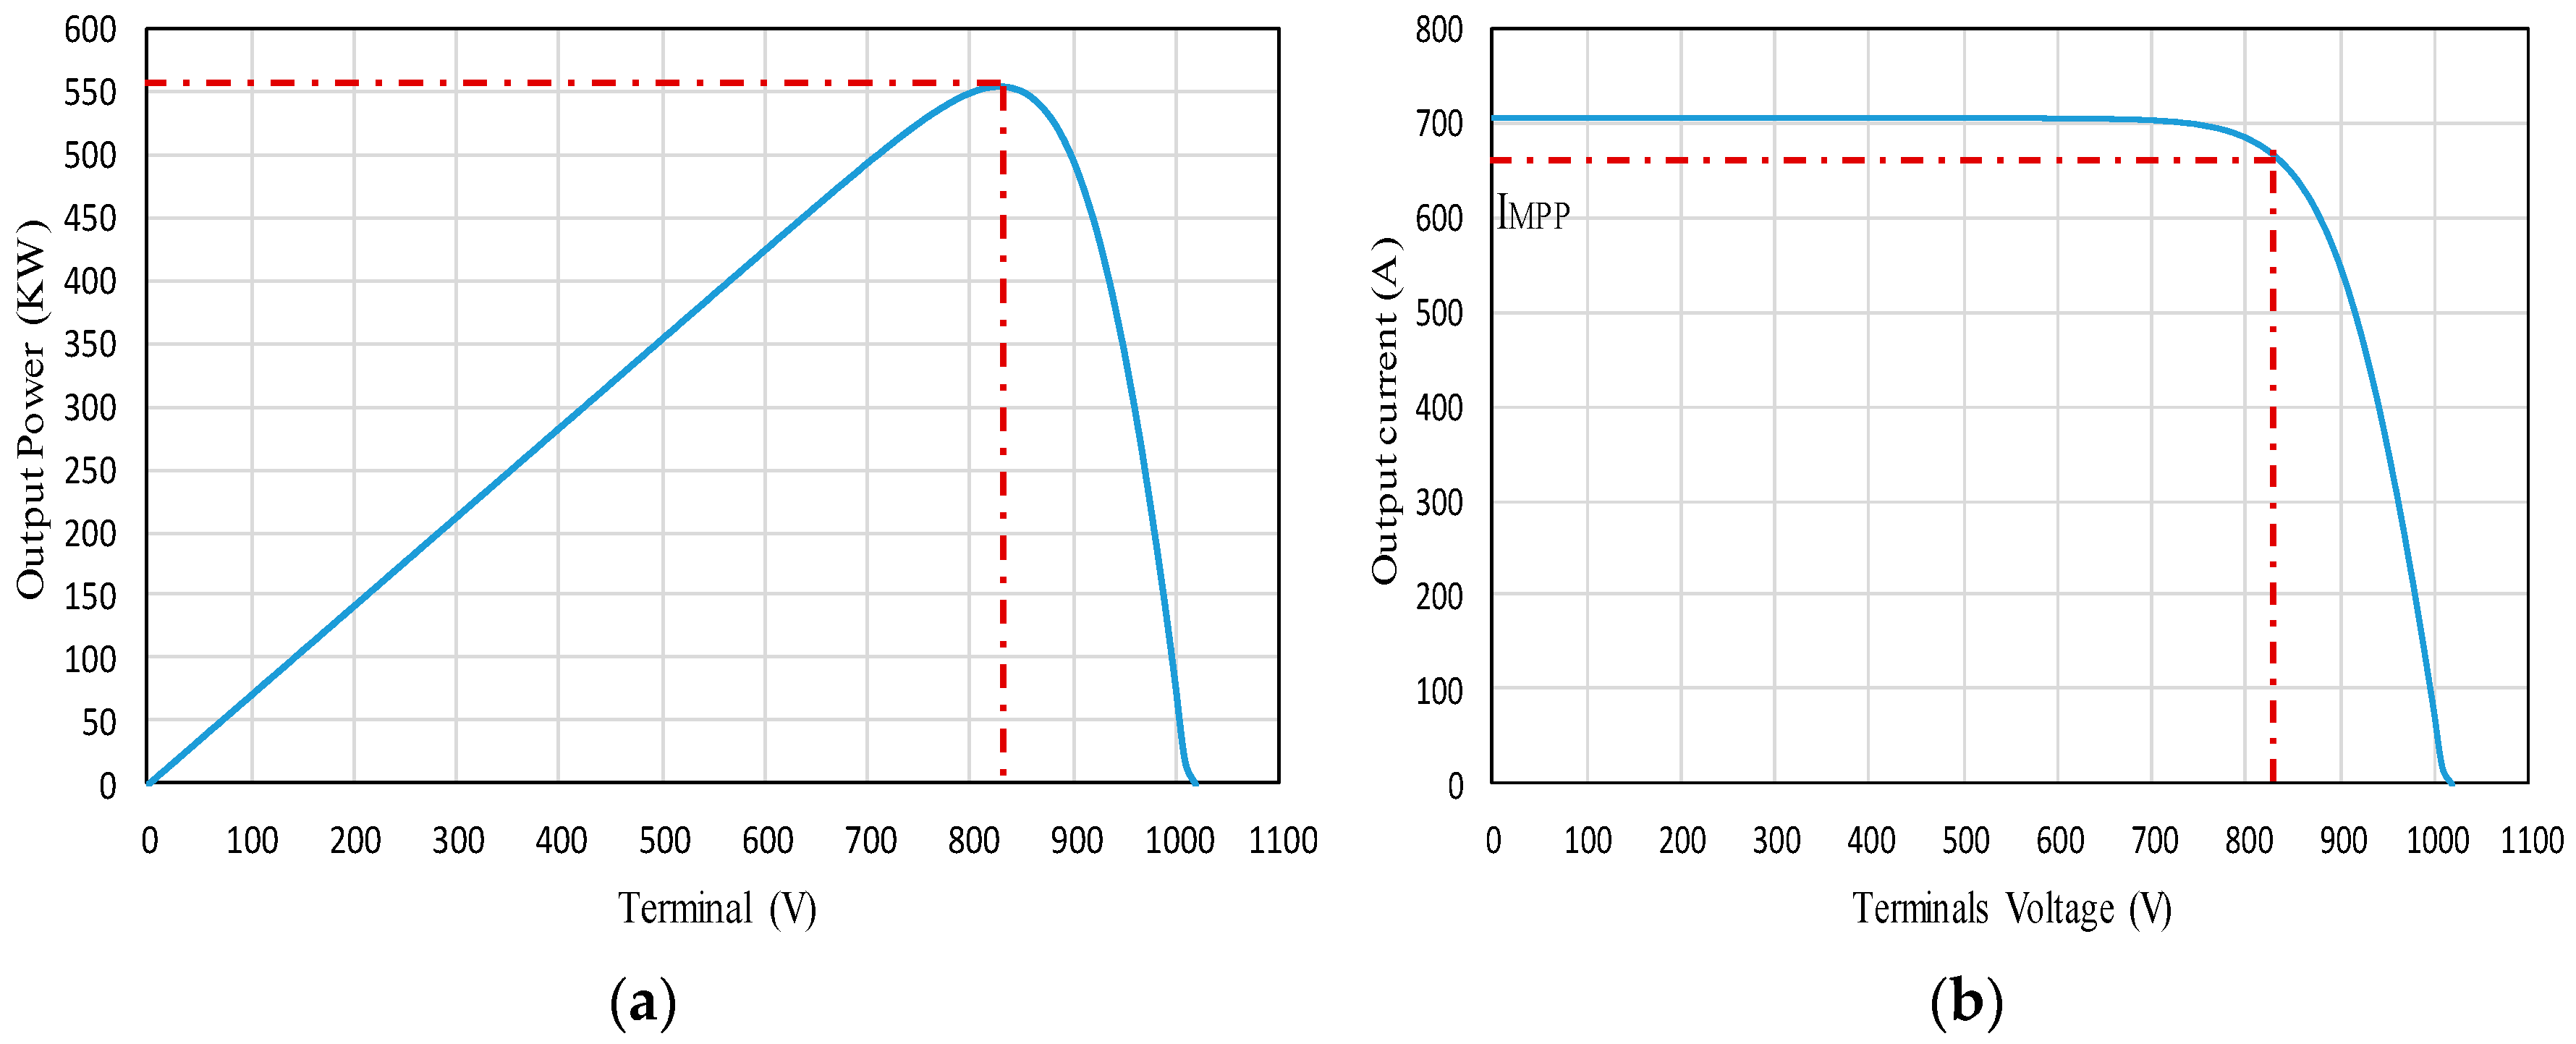
4.2.1. Solar PV Array

Solar PV is used to convert the sunlight into electricity using the photoelectric effect. The dynamic PV model from PSCAD/EMTDC software is used to develop four solar PV units integrated with distribution network. By using the default values shown in Table 4, the final output power of the single module is 380 watts and 548 KW for the total 1440 modules as shown in Figure 8.
For describing the typical I-V and P-V characteristics of the PV unit at standard test condition (E = 1000 W/m2, T = 25 °C), it is important to define three main parameters points: (1) maximum power point; (2) open circuit voltage; and (3) short circuit current (Figure 9a,b). The MPP is the maximum power point at which the photovoltaic system delivers the maximum power for a particular irradiance and temperature from which the voltage at MPP and VMPP and the current at the MPP and IMPP. Short circuit measurement with zero voltage can give short circuit current, Isc, and the open circuit voltage measurement with disconnected load can provide open circuit voltage, Voc.

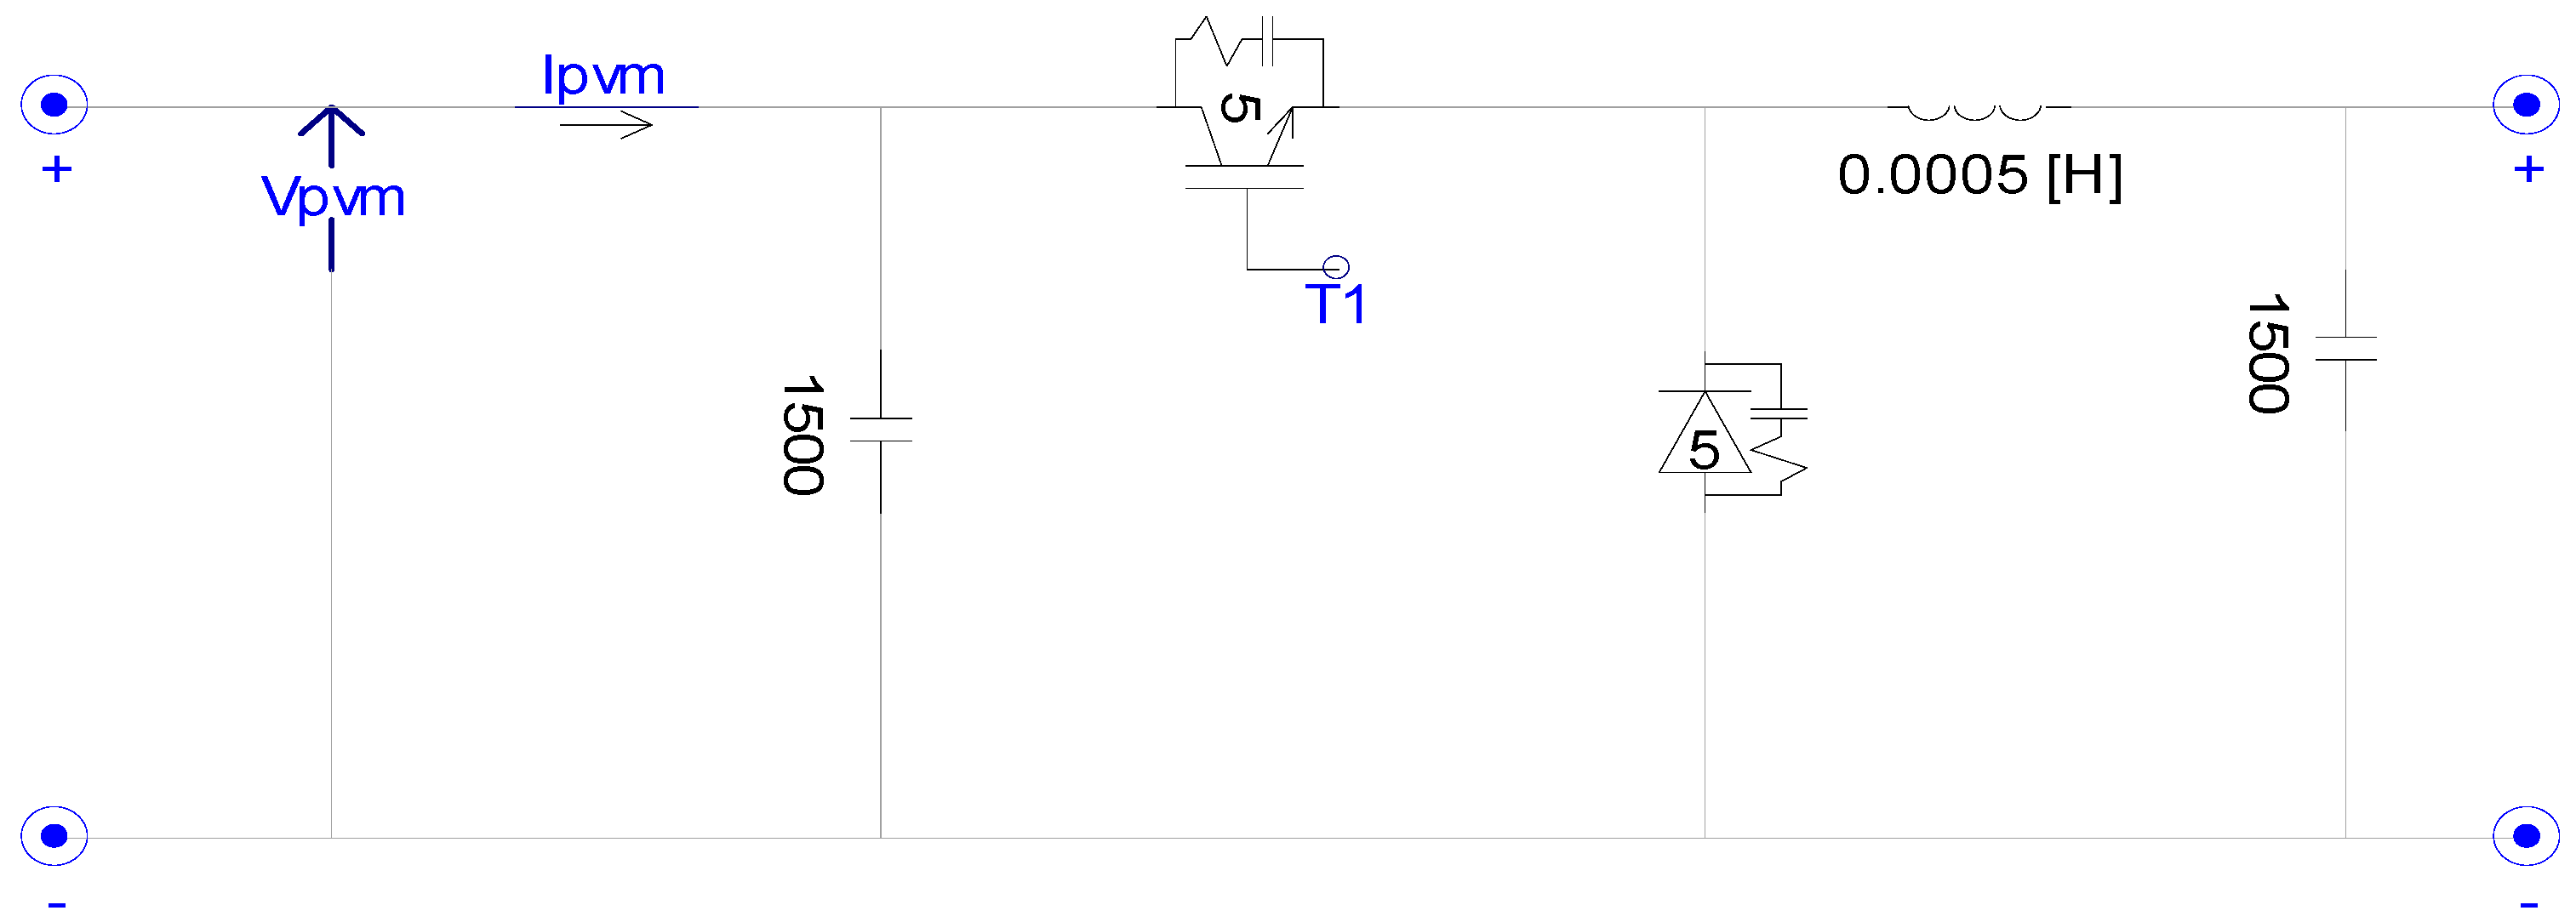
4.2.2. DC-DC Converter

DC-DC converter is an electronic circuit that is used either to step down the input voltage (buck converter) or to step up the input voltage (boost converter). The buck converter consists of Insulated Gate Bipolar Transistor (IGBT) switch, inductor, capacitor and free-wheel diode as shown in Figure 10.
The parameters of buck converter are shown in Table 5. The input voltage comes from the renewable source of the hybrid system and the output voltage of the boost controller is fixed 700 V DC.

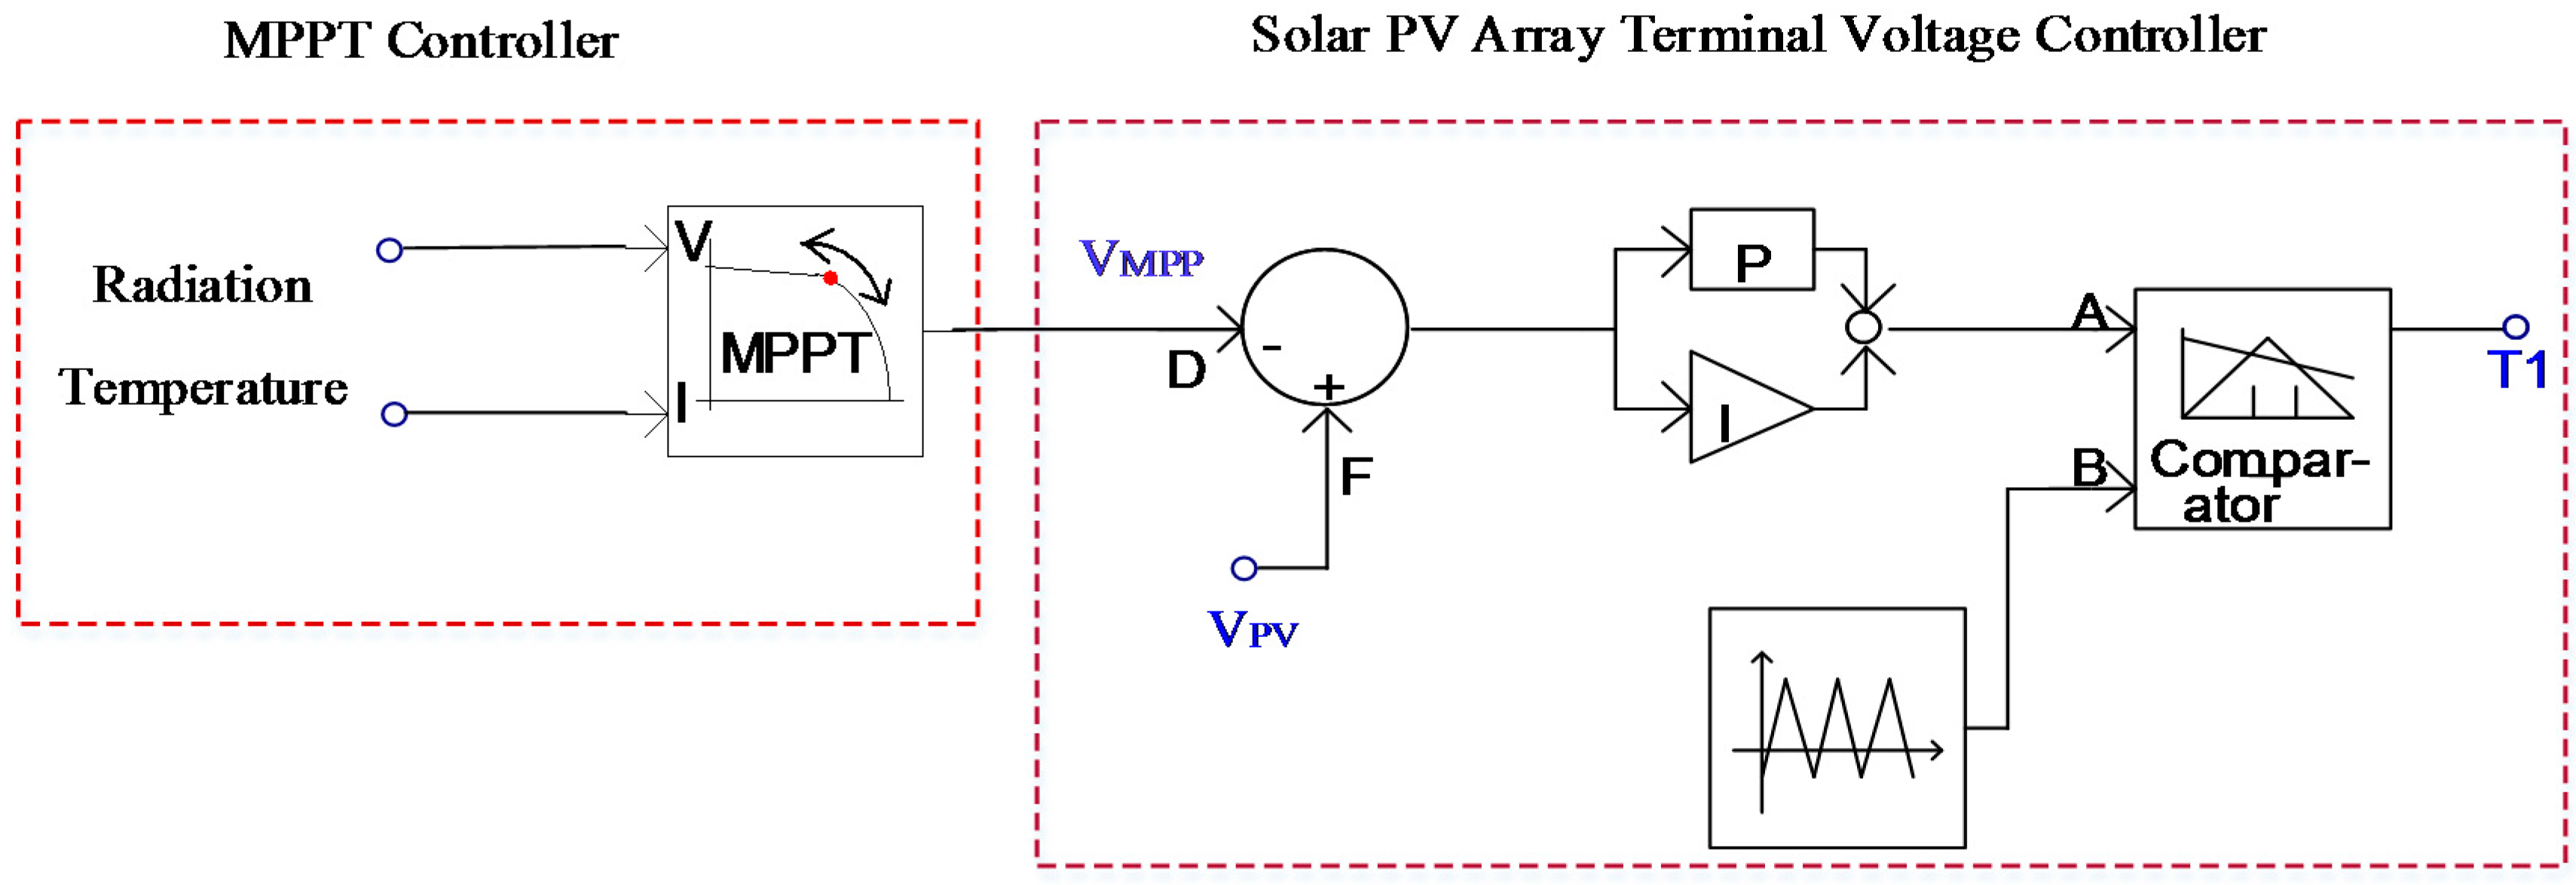
4.2.3. MPPT Controller of Solar PV

In this PSCAD model, control of buck converter has two operational functions. First, it is used to reduce the terminal voltage of PV array in order to match the inverter input voltage. Second, it is used for Maximum Power Point Tracking (MPPT) by controlling the voltage across the PV array. The difference between the solar panel output voltage (VPV) and the reference maximum power (VMPP) is used as an input to the Proportional-Integral (PI) controller, as shown in Figure 11.
In general, when PV module is directly connected with load demand, the impedance value of that load determines the operating condition of the PV module. In other words, the output power delivered from solar PV module depends on load value which normally less than the maximum power. For this reason, the PV array is usually oversized to compensate for a low power yield during winter months. This mismatching between a PV module and a load requires further over-sizing of the PV array and thus increases the overall system cost. To mitigate this problem, a maximum power point tracker (MPPT) can be used to maintain the PV module’s operating point at the MPP. The PSCAD model of buck converter control uses Perturb and Observe (P&O) method to find the maximum power voltage VMPP.

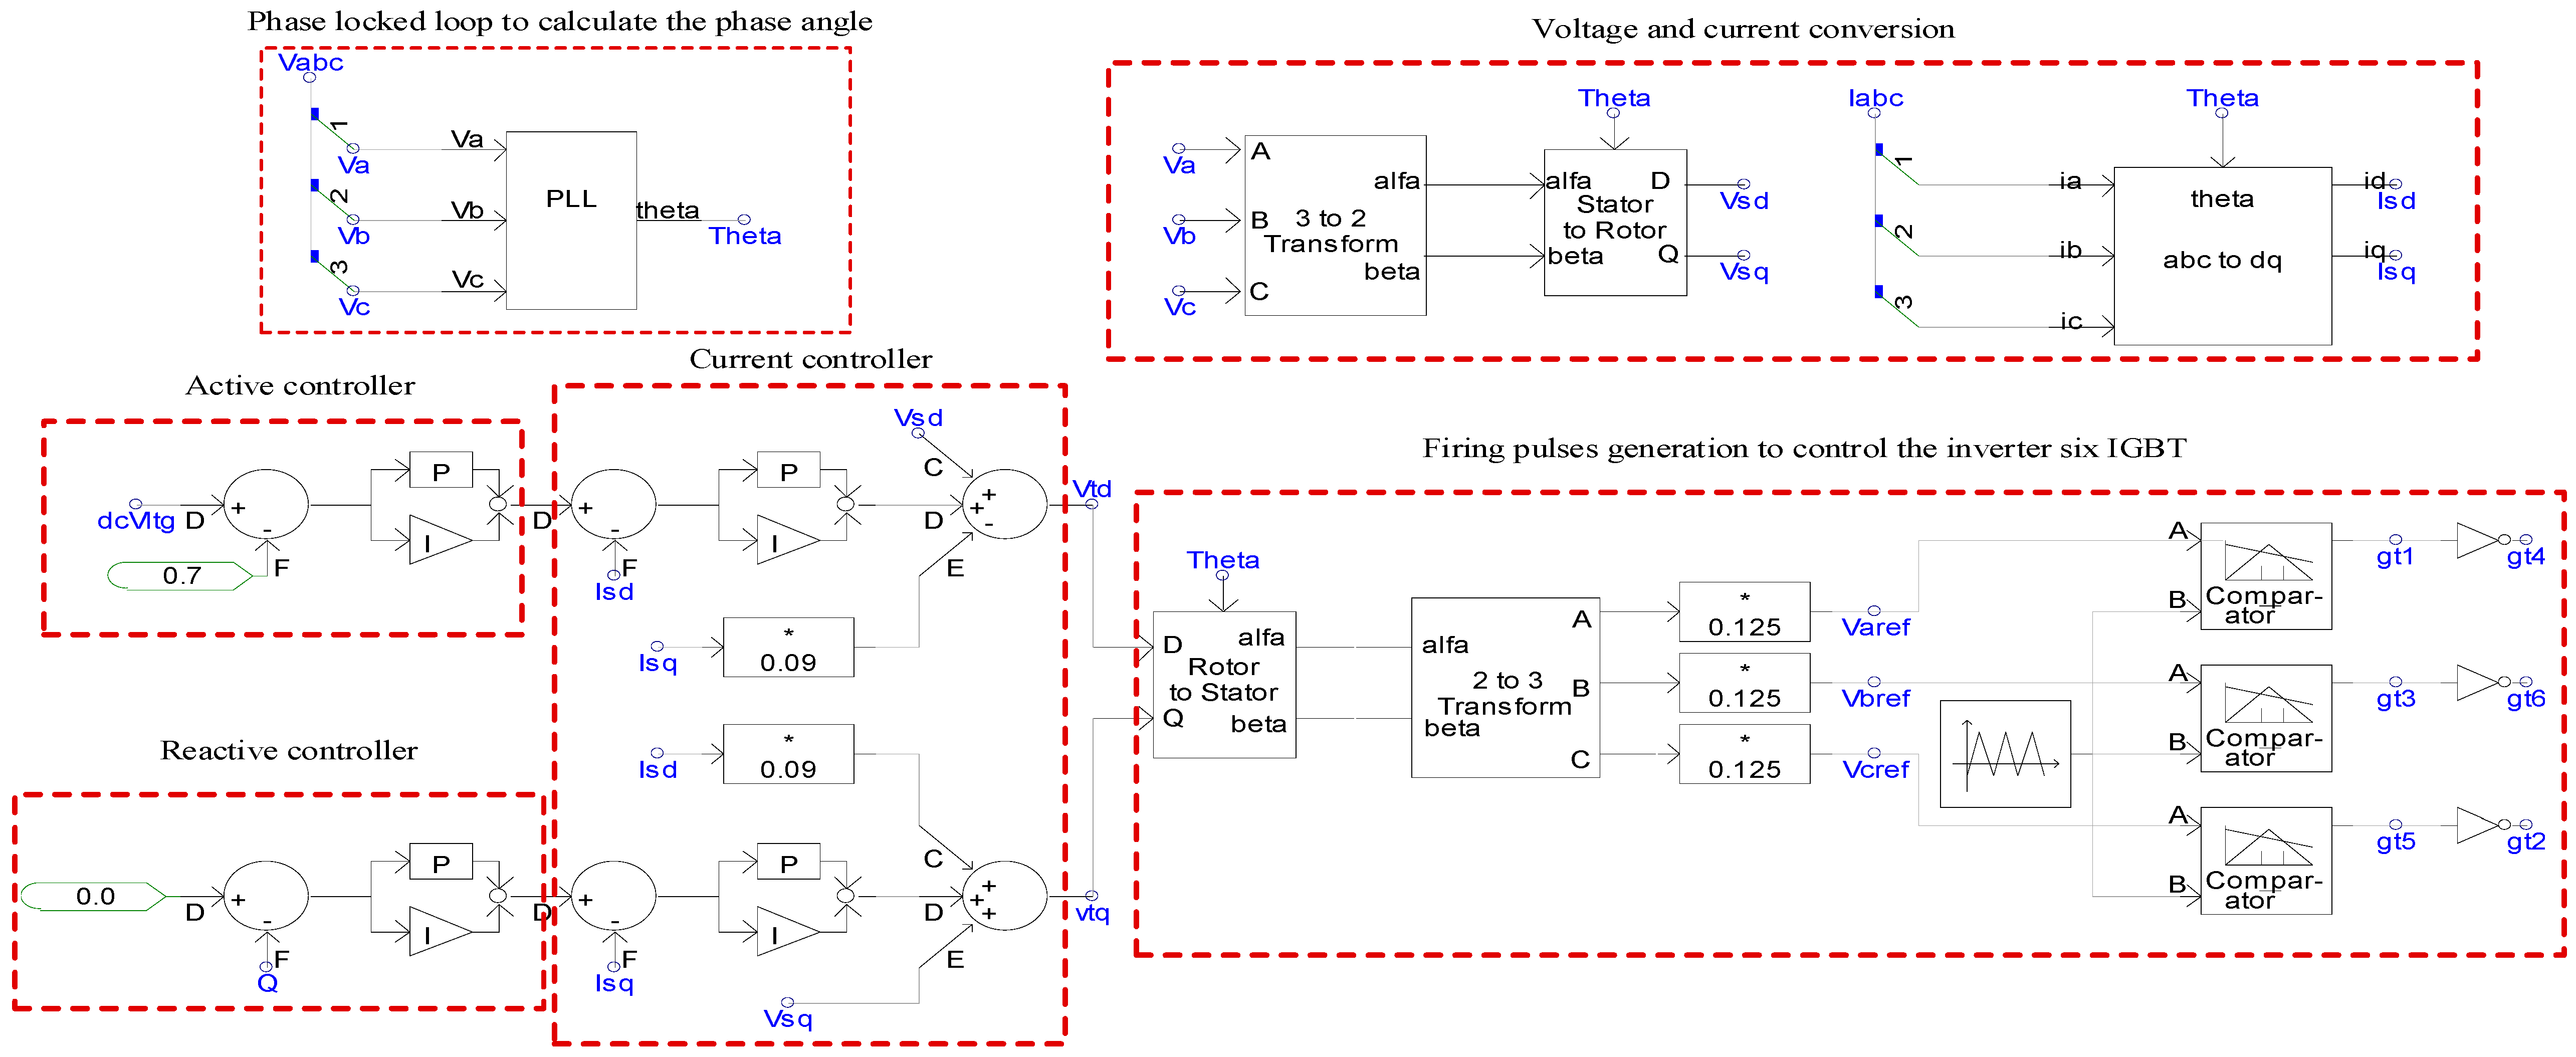
4.2.4. Three Phase Inverter

Inverter is an electronic circuit that converts the DC output power from solar PV generation into three phase AC power (0.4 KV/50 Hz) suitable for utility connection. The control system used for the PV generation is based on active and reactive power controller (P-Q), where these controllers are working during grid connected and islanding modes, because the mini-hydro generators are responsible on voltage and frequency regulations after islanding.
Active power controller is used to establish a constant DC bus voltage (dcvag) at 0.7 kV between the DC-DC converter and the inverter. The output of the controller will be used as an input to the current controller. The reactive controller sets the reactive power (Q) of the grid to zero which forces the inverter to operate at unity power factor. The PSCAD control system of solar PV inverter is shown in Figure 12.

5. Simulation Results

The simulation results included in this paper are divided into four case studies:
  • The first case study represents the effect of increasing of PV penetration in distribution network.
  • The second case represents the comparative study between UFLS scheme and adaptive UFLS controller to show the importance of assuming some flexibility in load shedding priority.
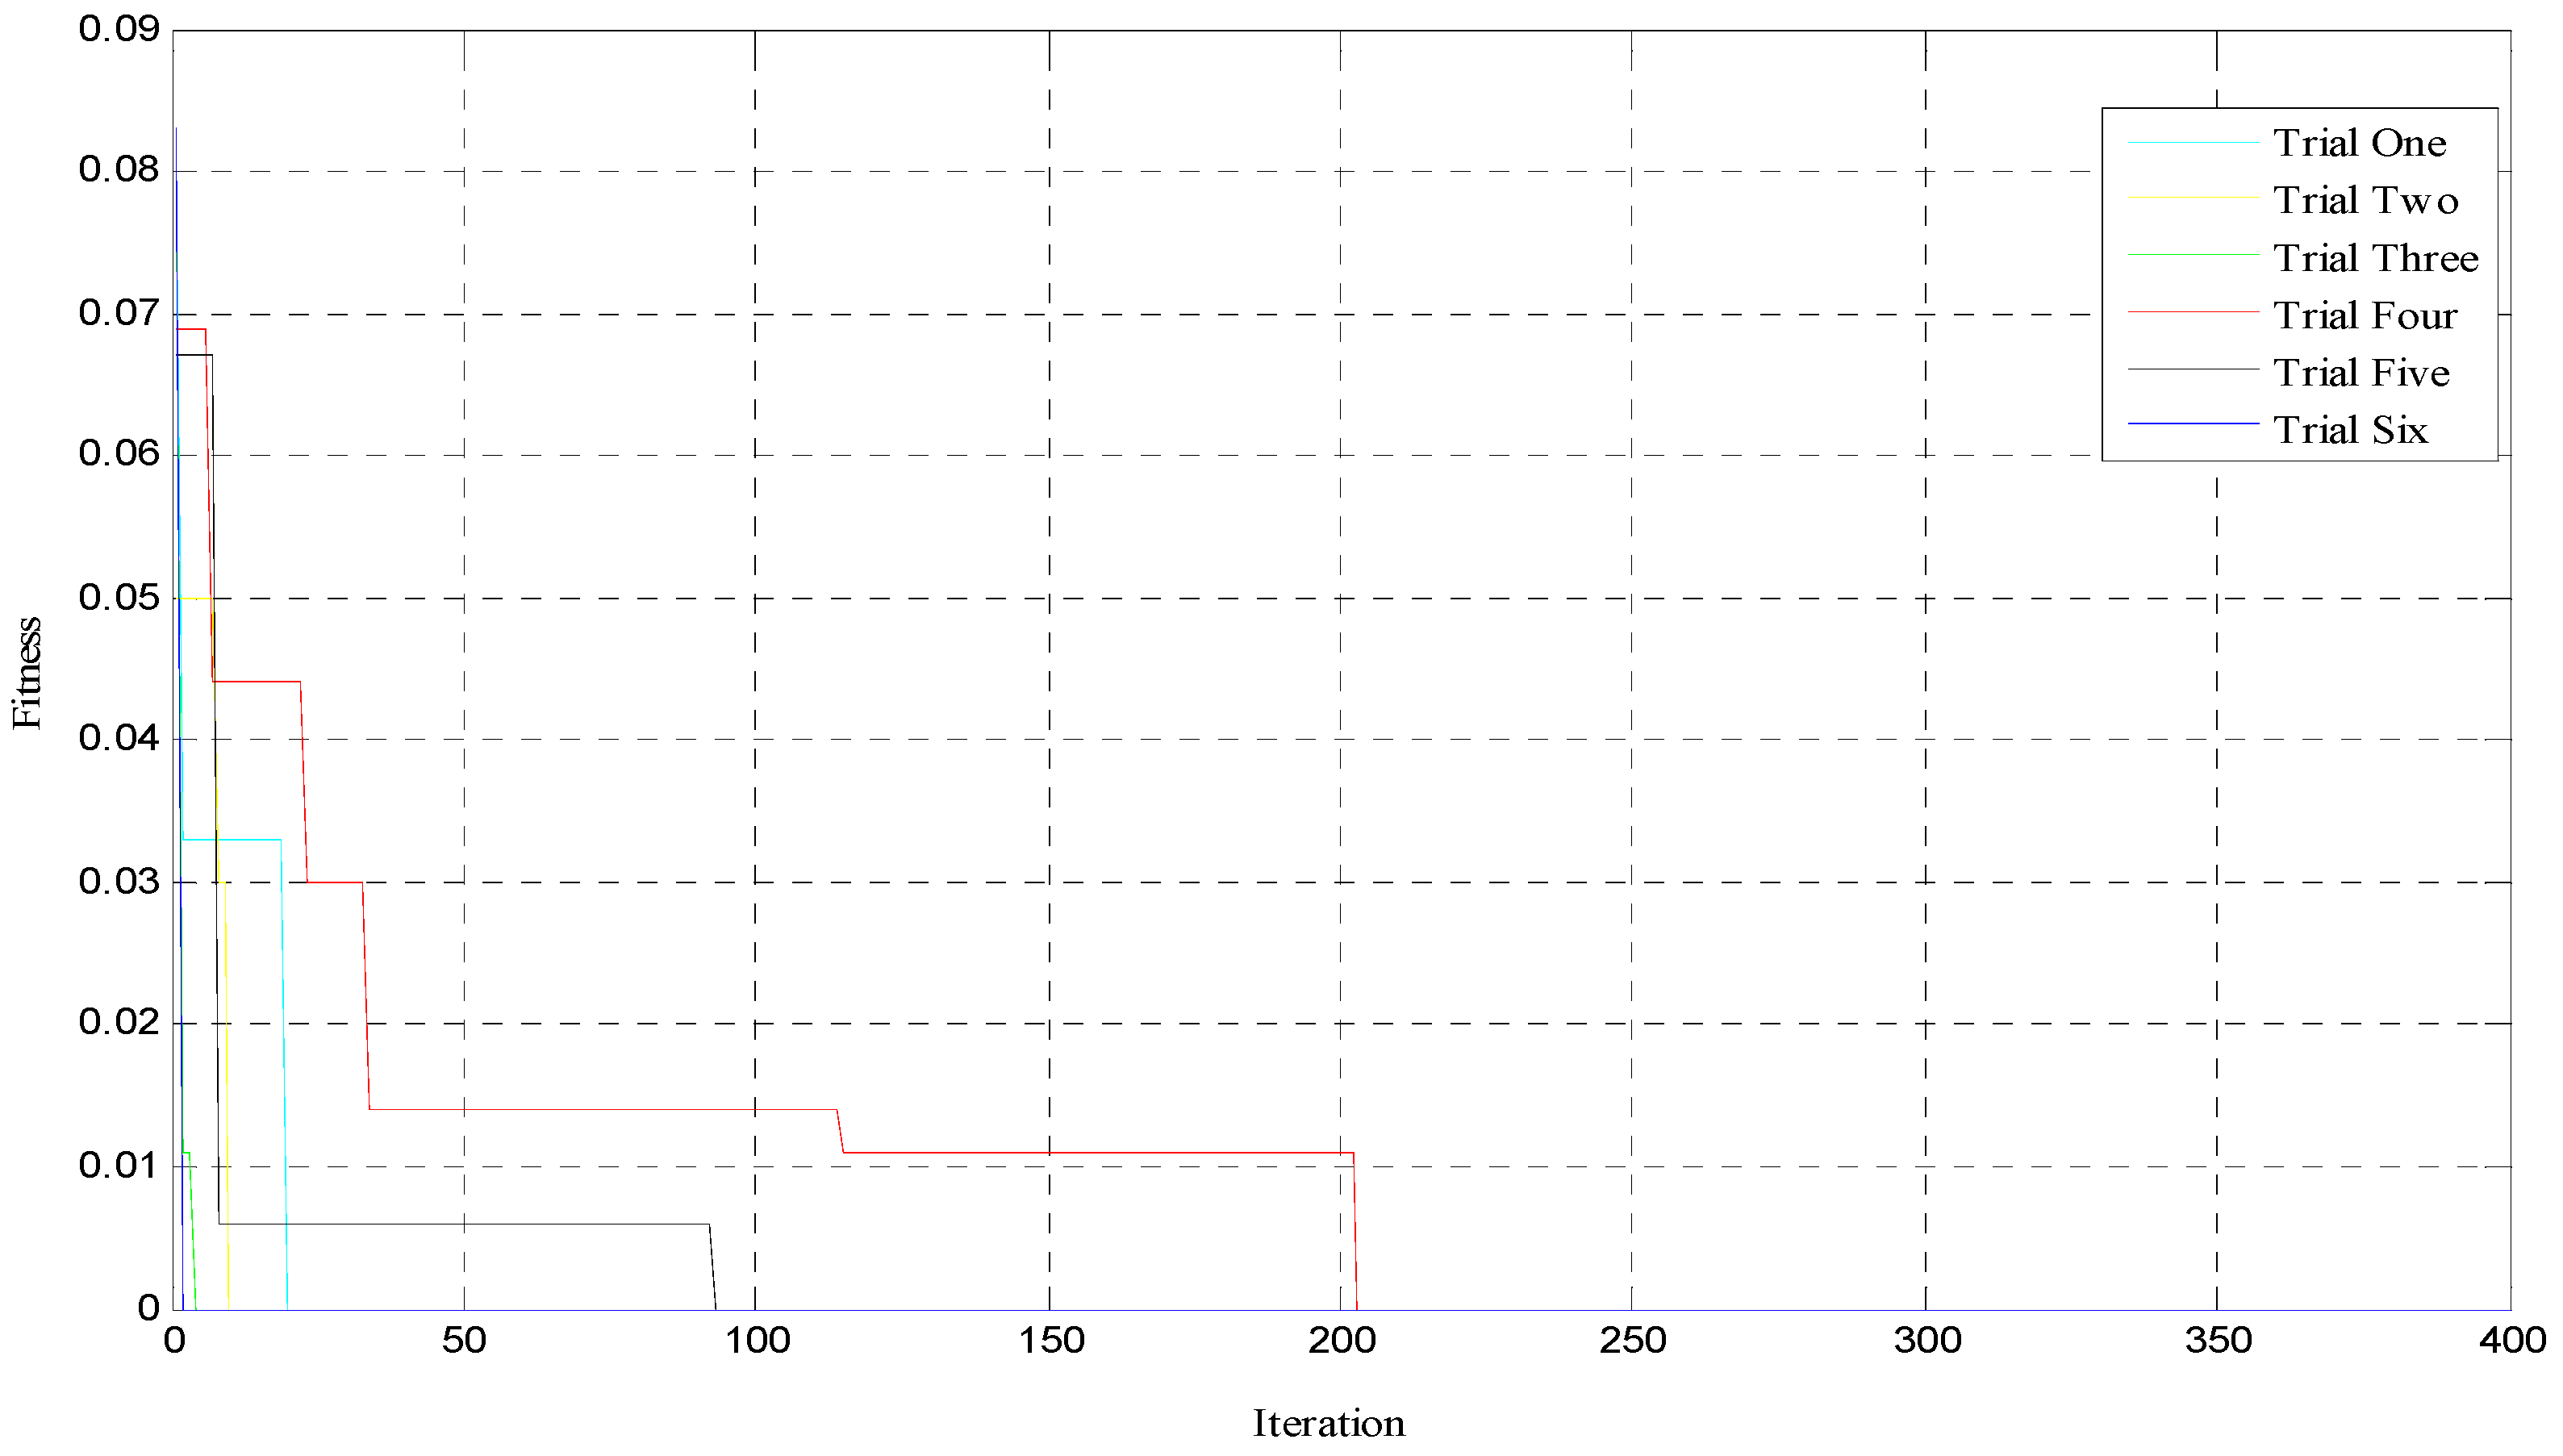
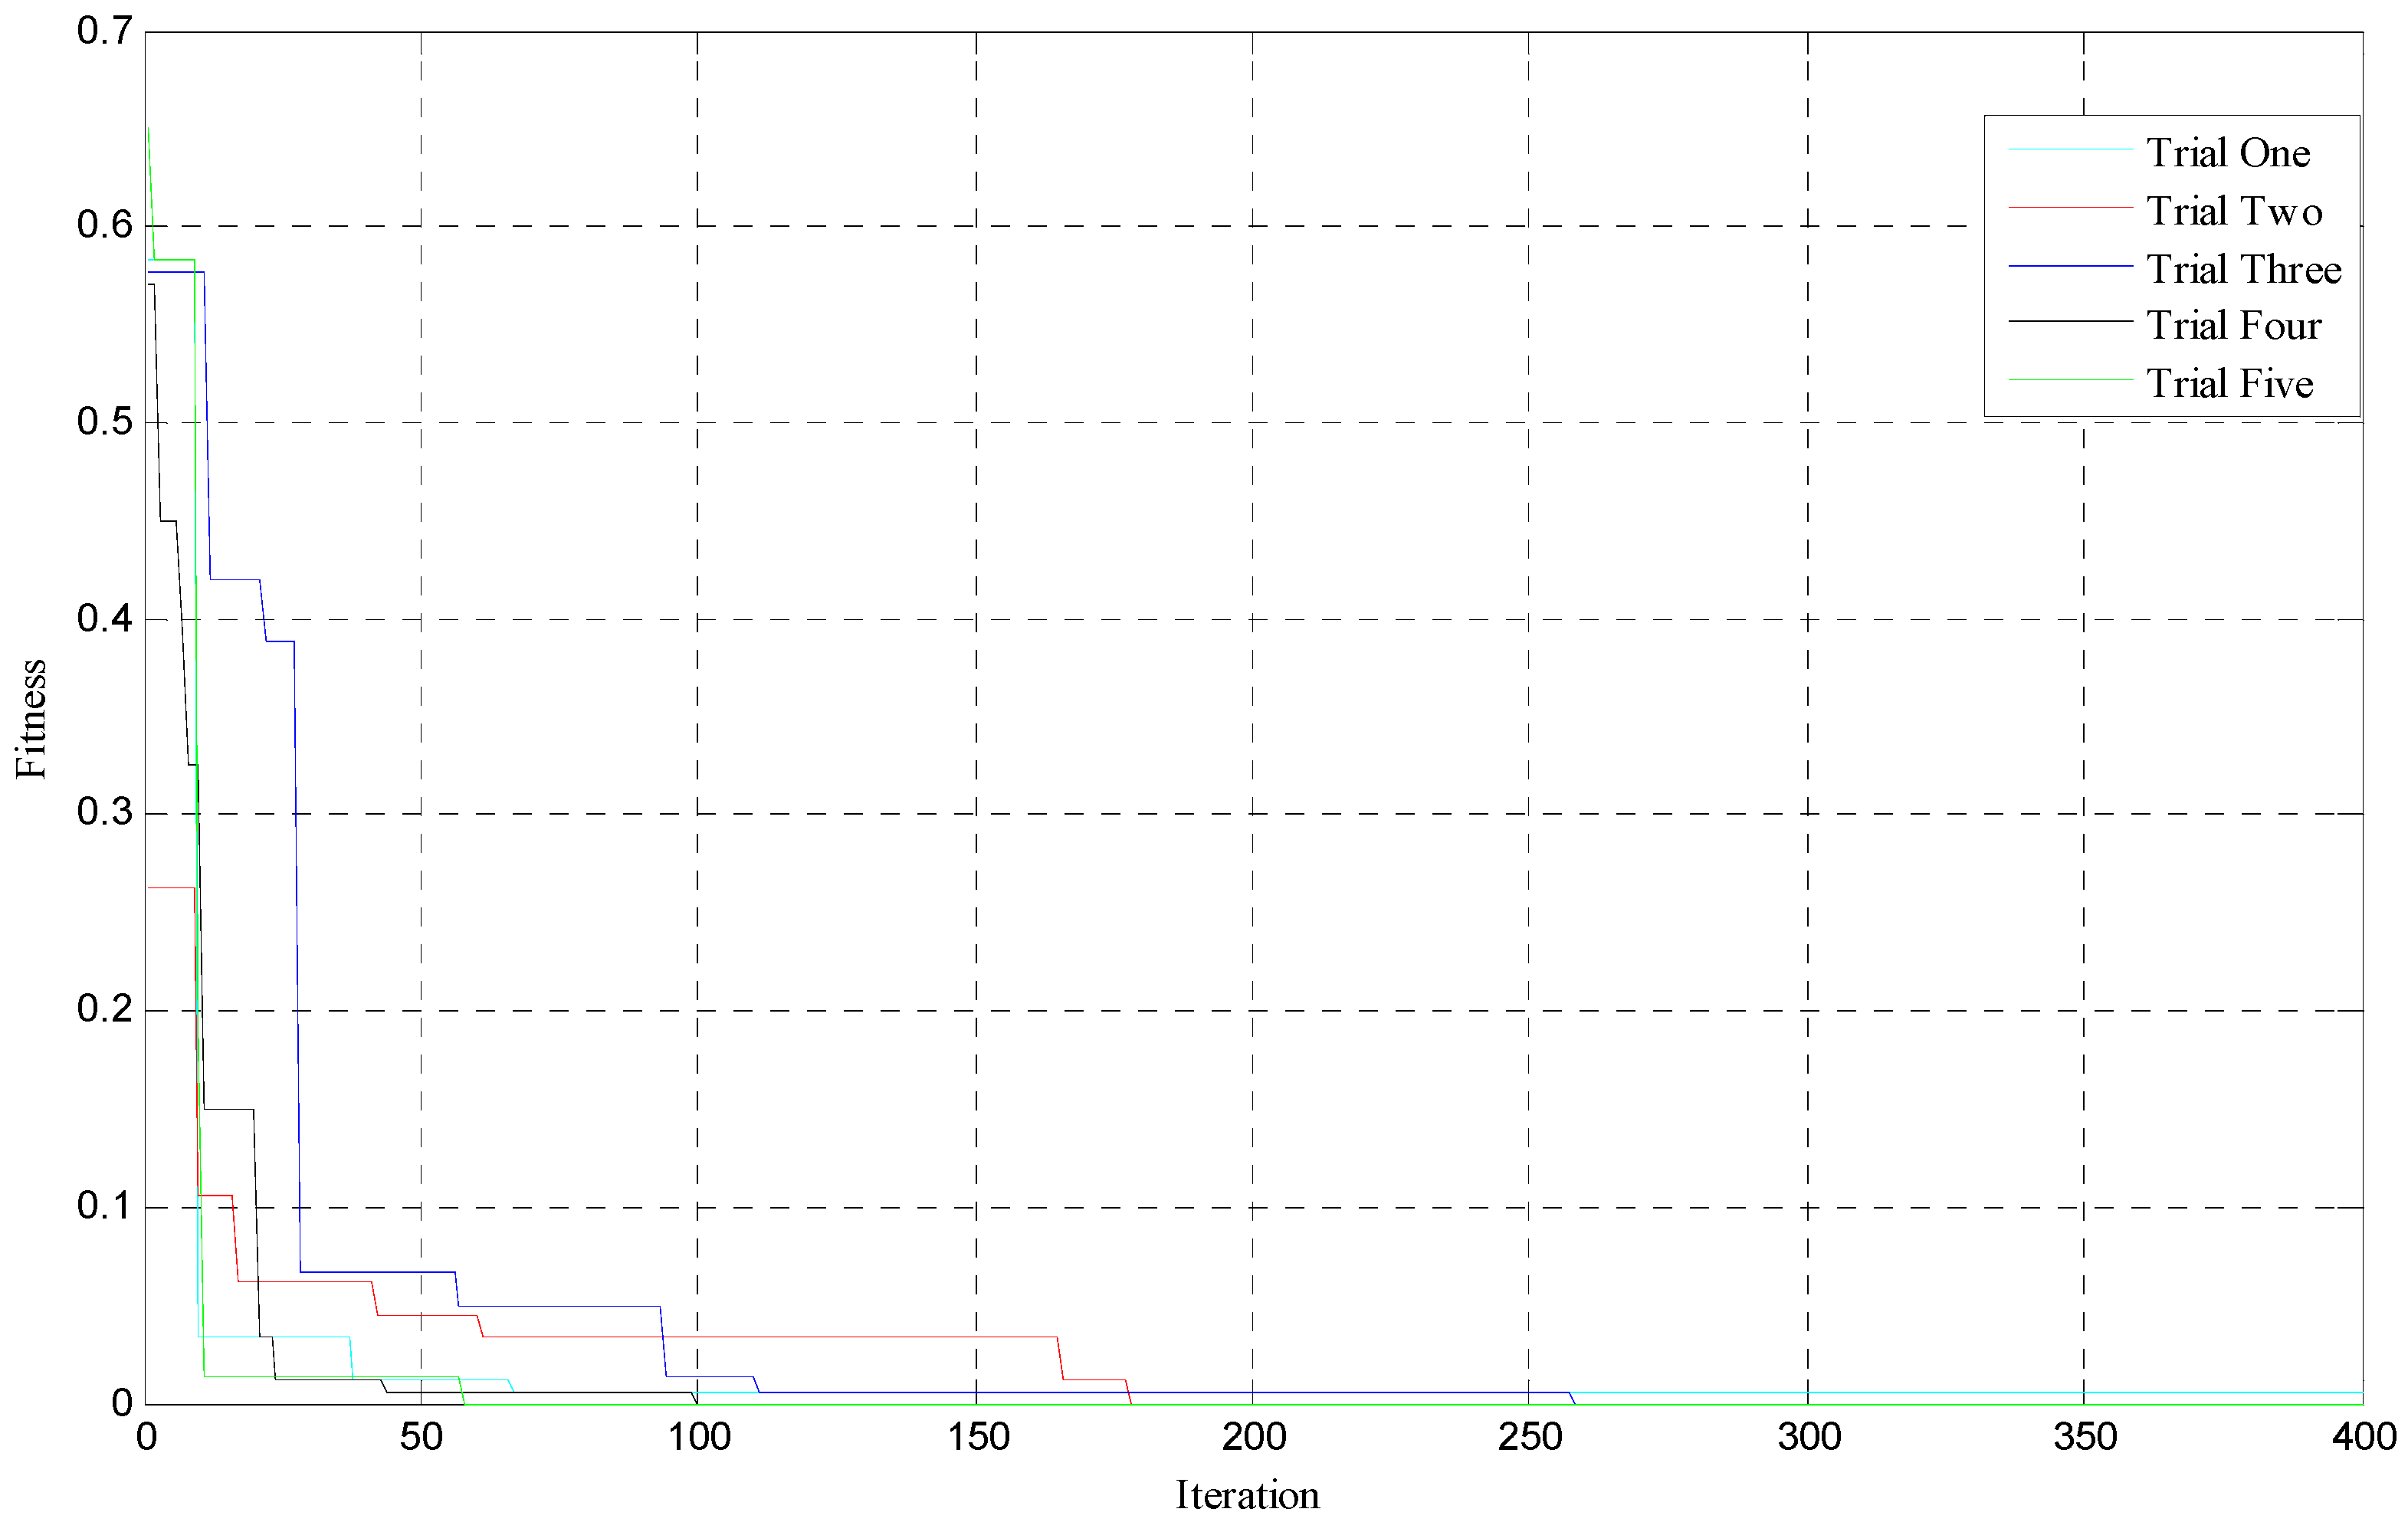
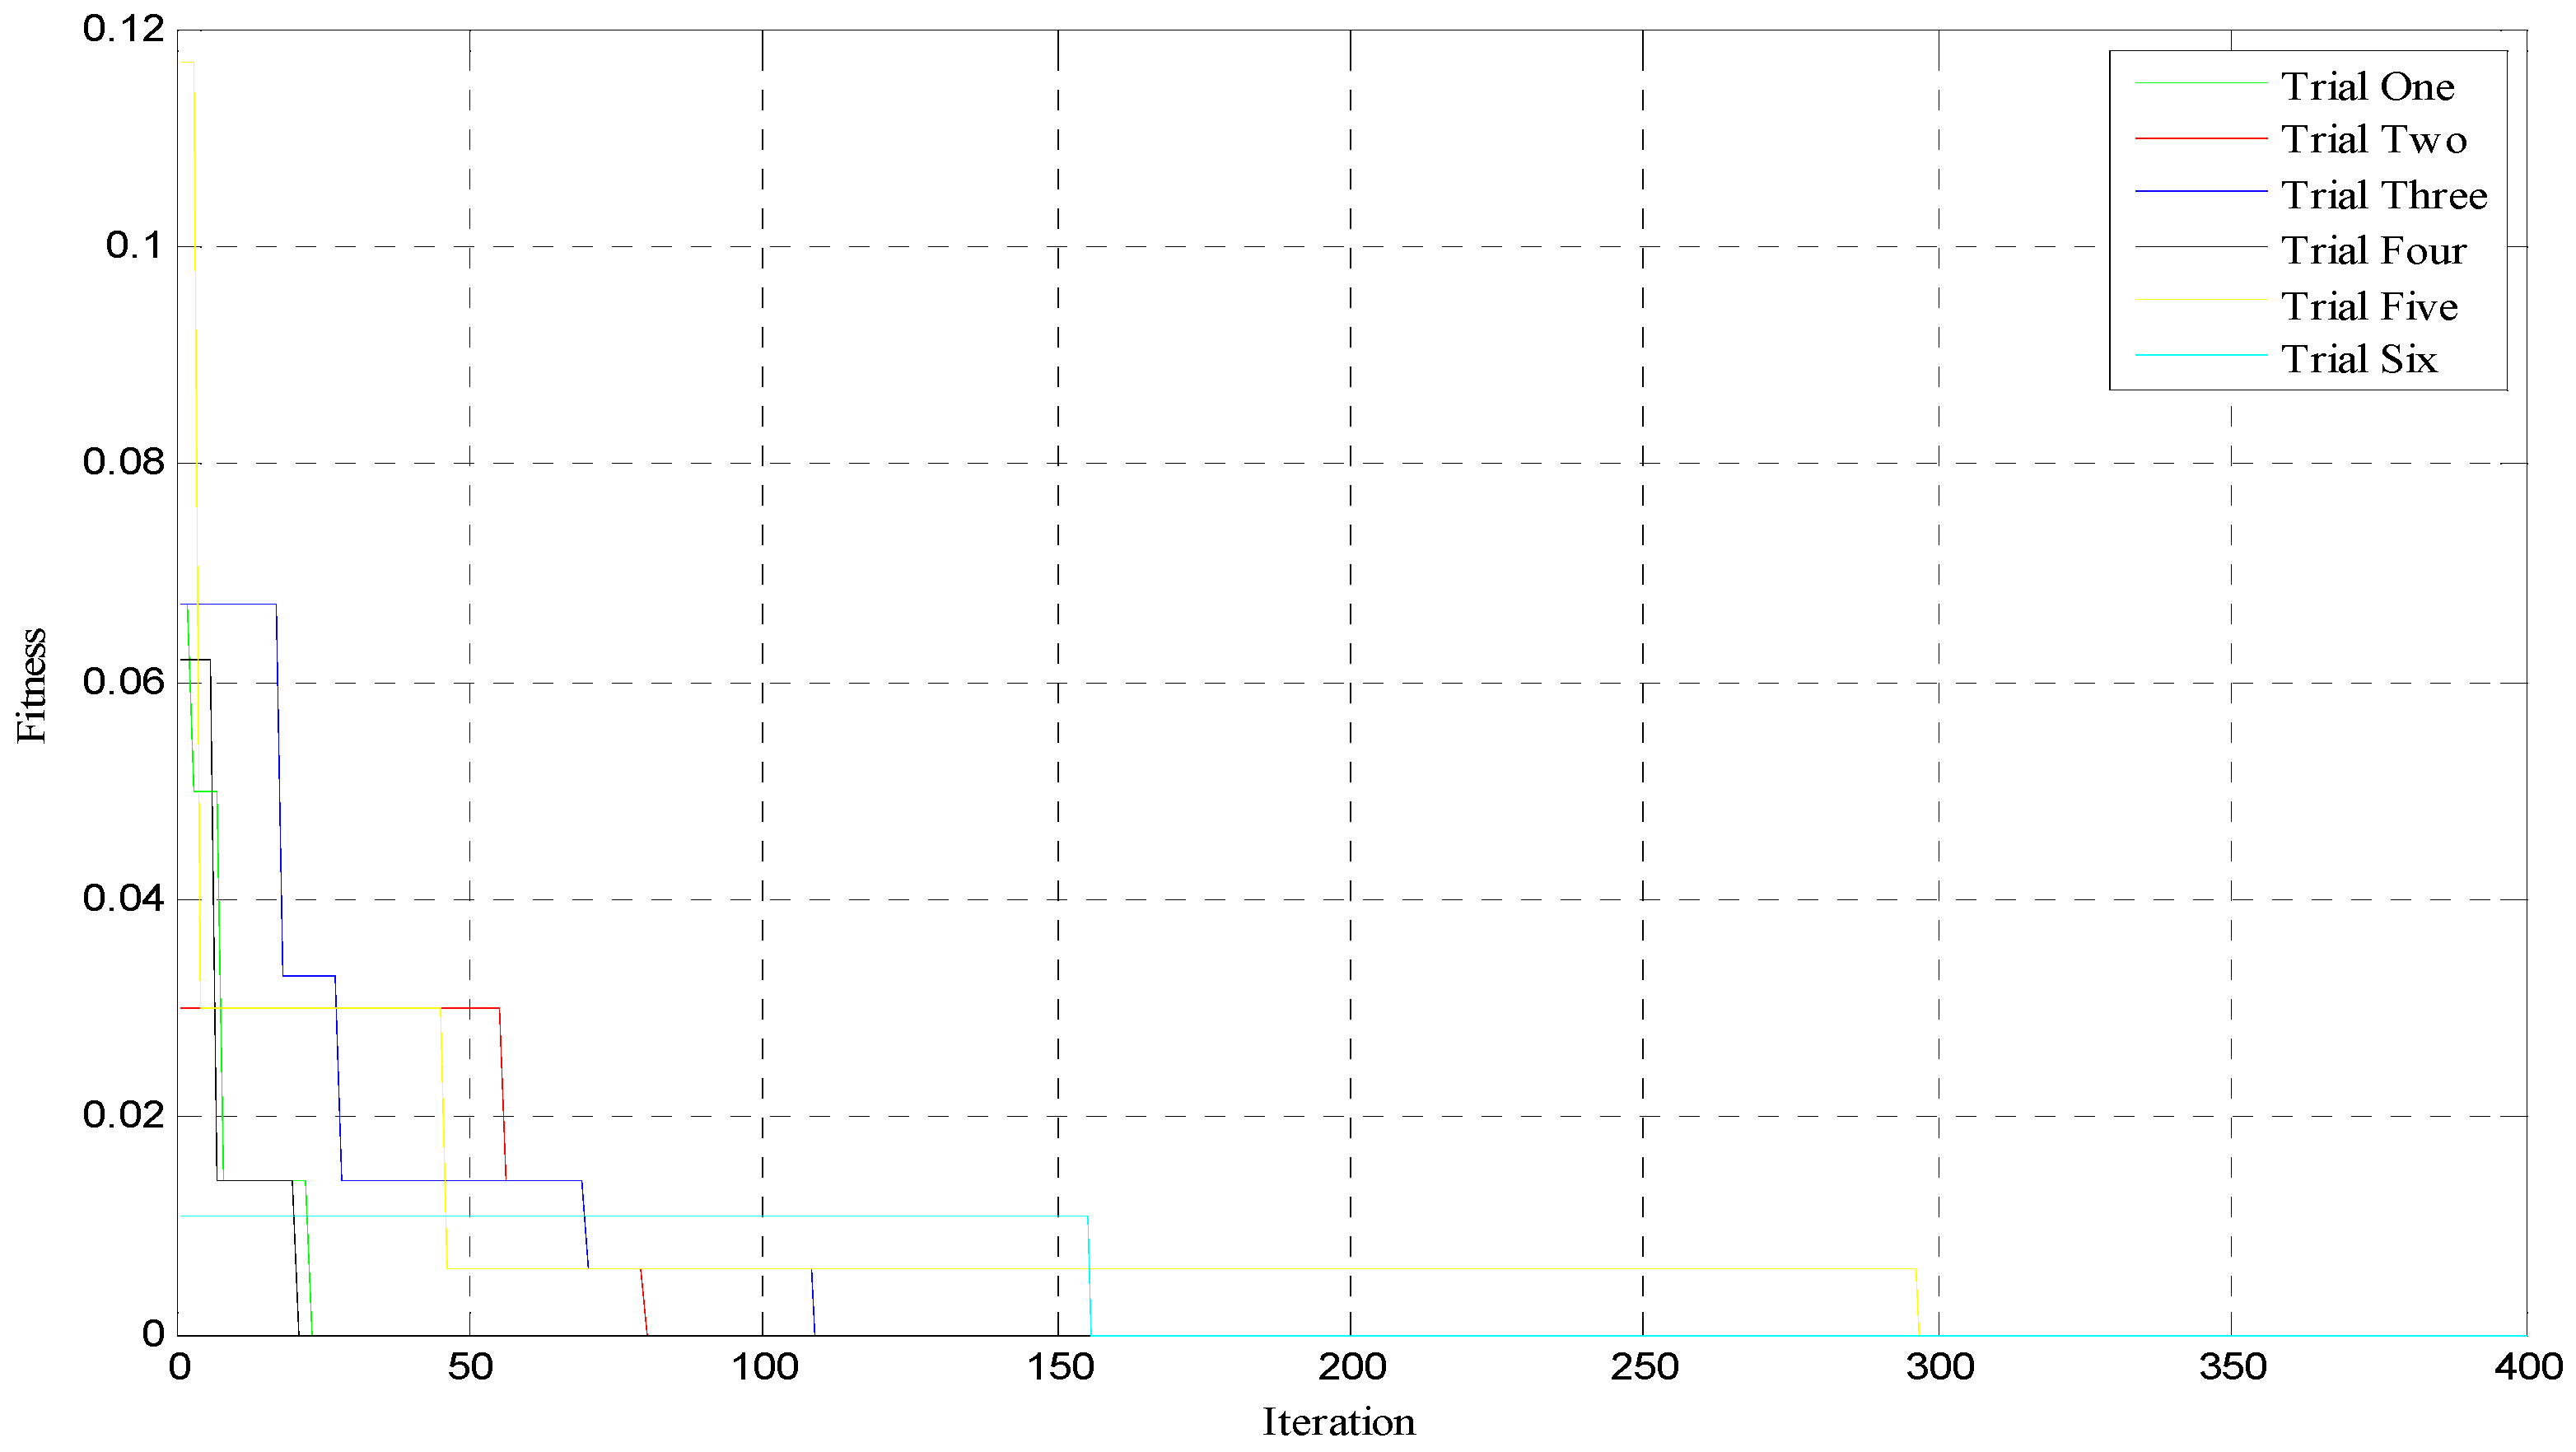
  • The third case represents a comparative simulation study between, BGA, BPSO, method proposed in [30], and BEP in terms of execution time and convergence curves.
  • The fourth case study represents the simulation study of UFLS scheme using BEP, BGA, and BPSO techniques, and method proposed in [30].

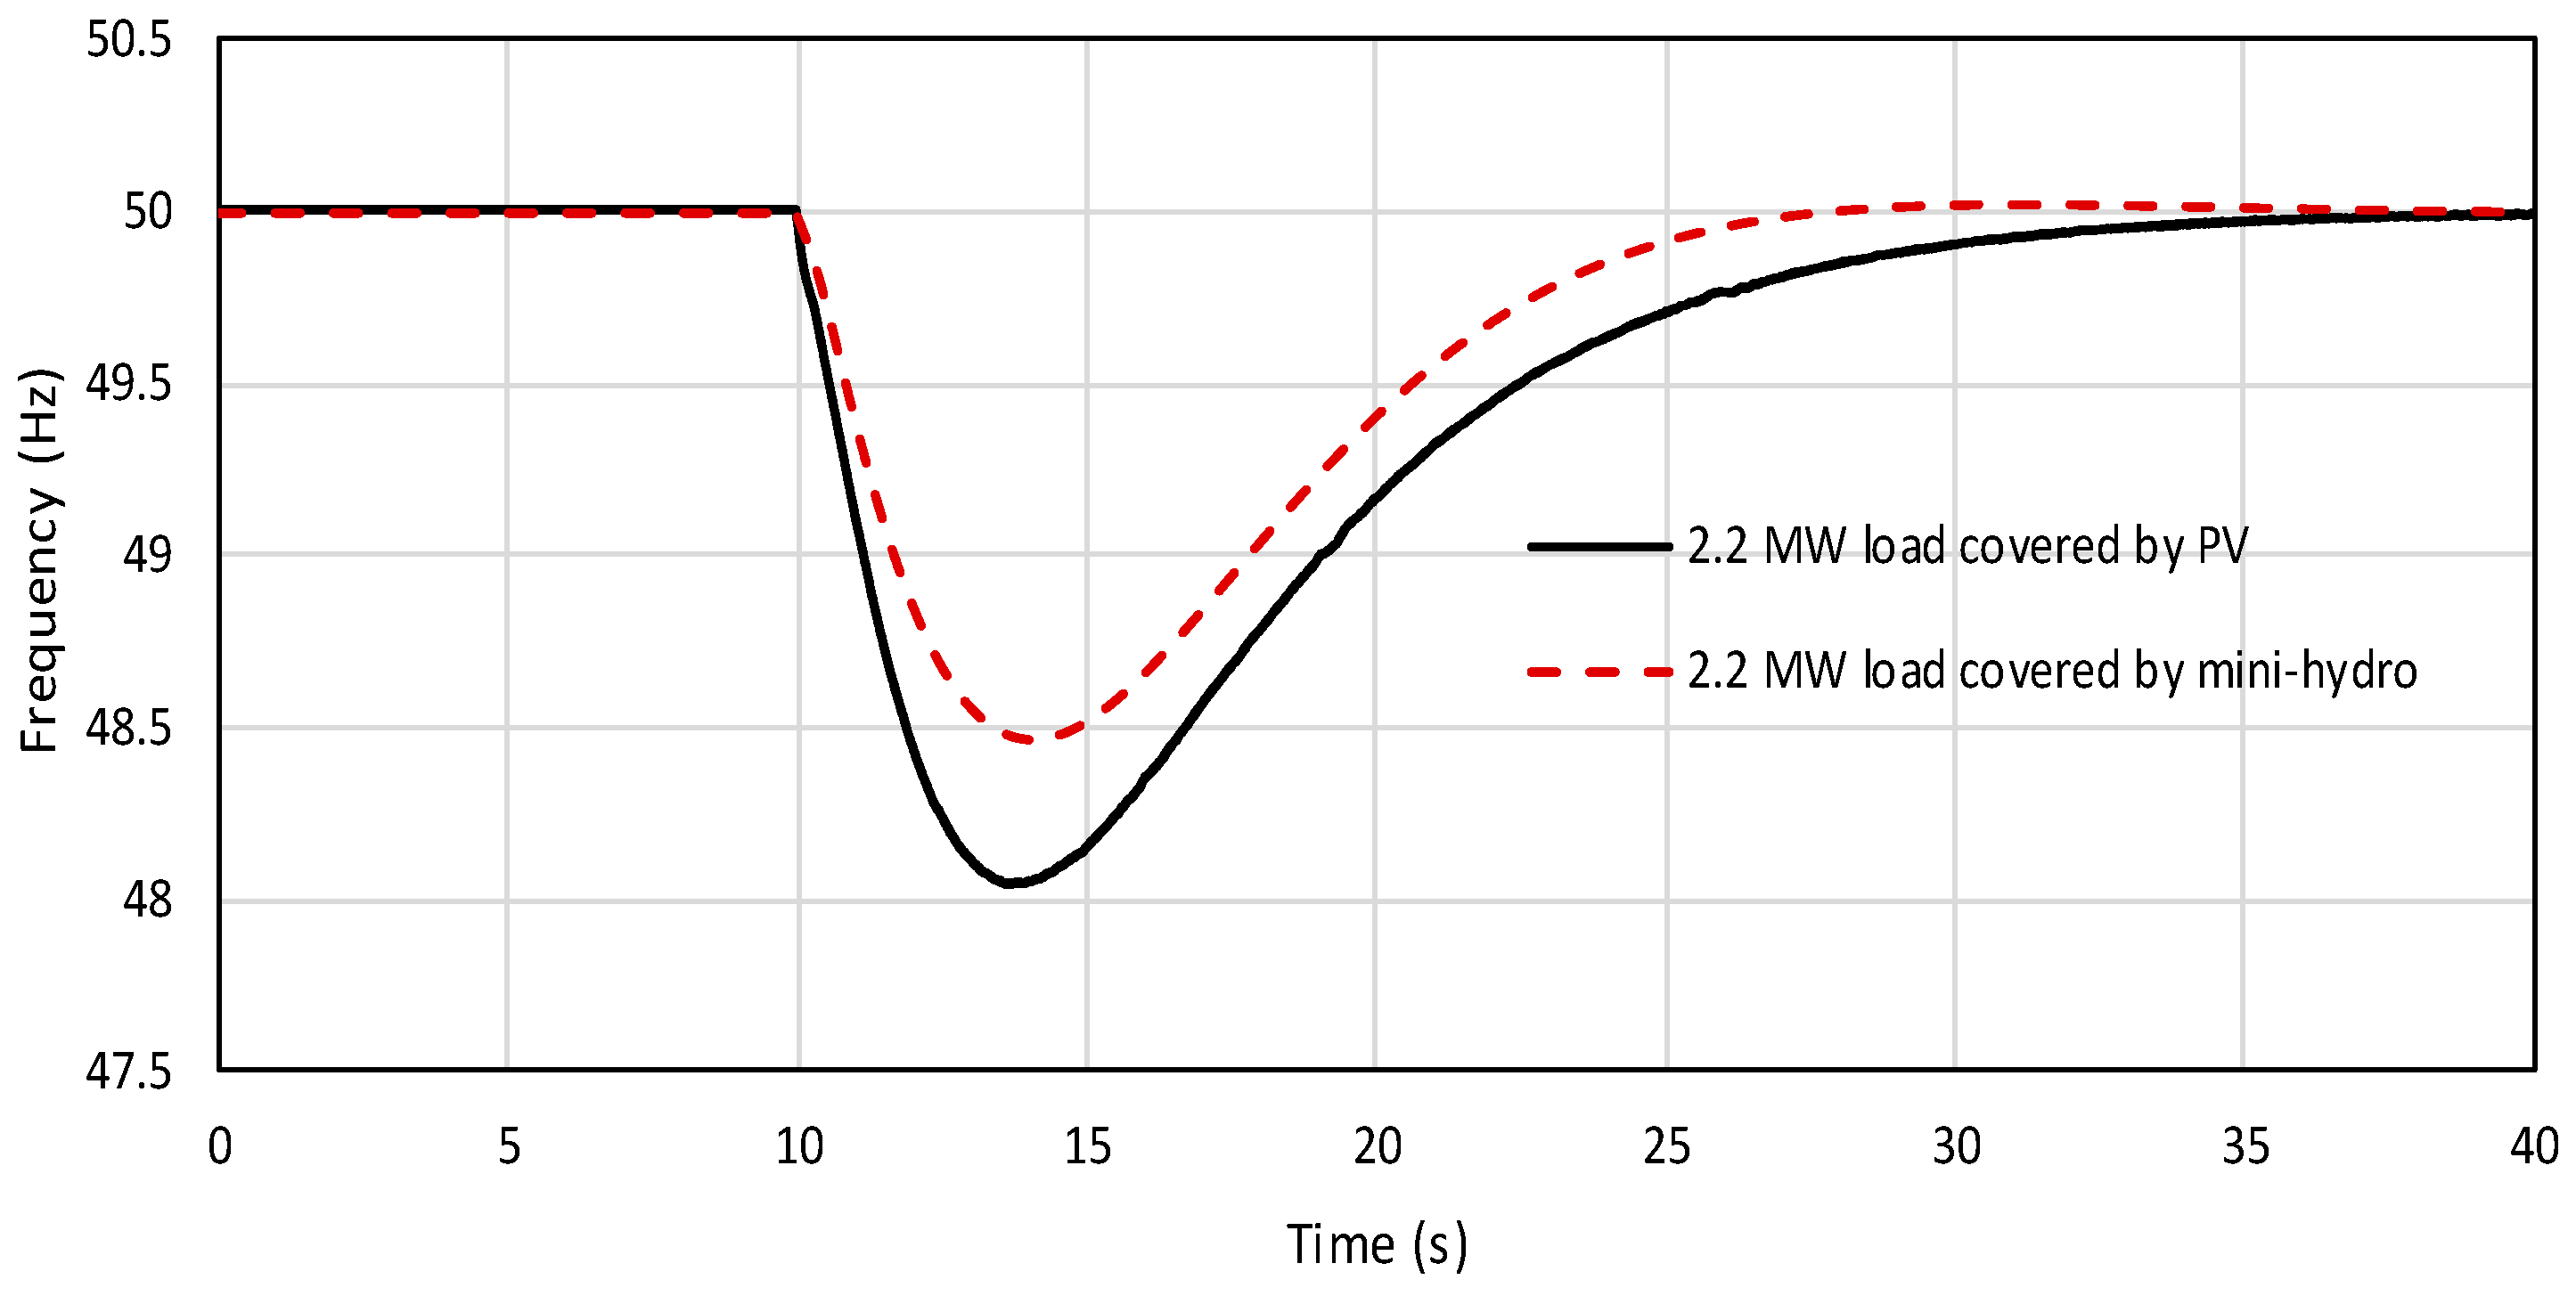
5.1. First Case Study

To show the effect of increasing PV penetration on frequency response of the distribution network, two scenarios are conducted. In the first scenario, the total network load (6 MW) is covered by three mini hydro-generators. After 10 s from starting the network is islanded, the system frequency start to decline due to excess load (0.45 MW) until it is recovered at 48.5 Hz. In the second scenario, the PV generation covered around 35% of load. After 10 s from starting the network is islanded, the system frequency start to decline due to excess load (0.45 MW) until it is recovered at 48 Hz. Figure 13 shows the simulation study for these two scenarios. From this result, it is clear that for high penetration of solar PV, the rate of change of frequency will be high and the system frequency will deviate more as shown in Table 6.

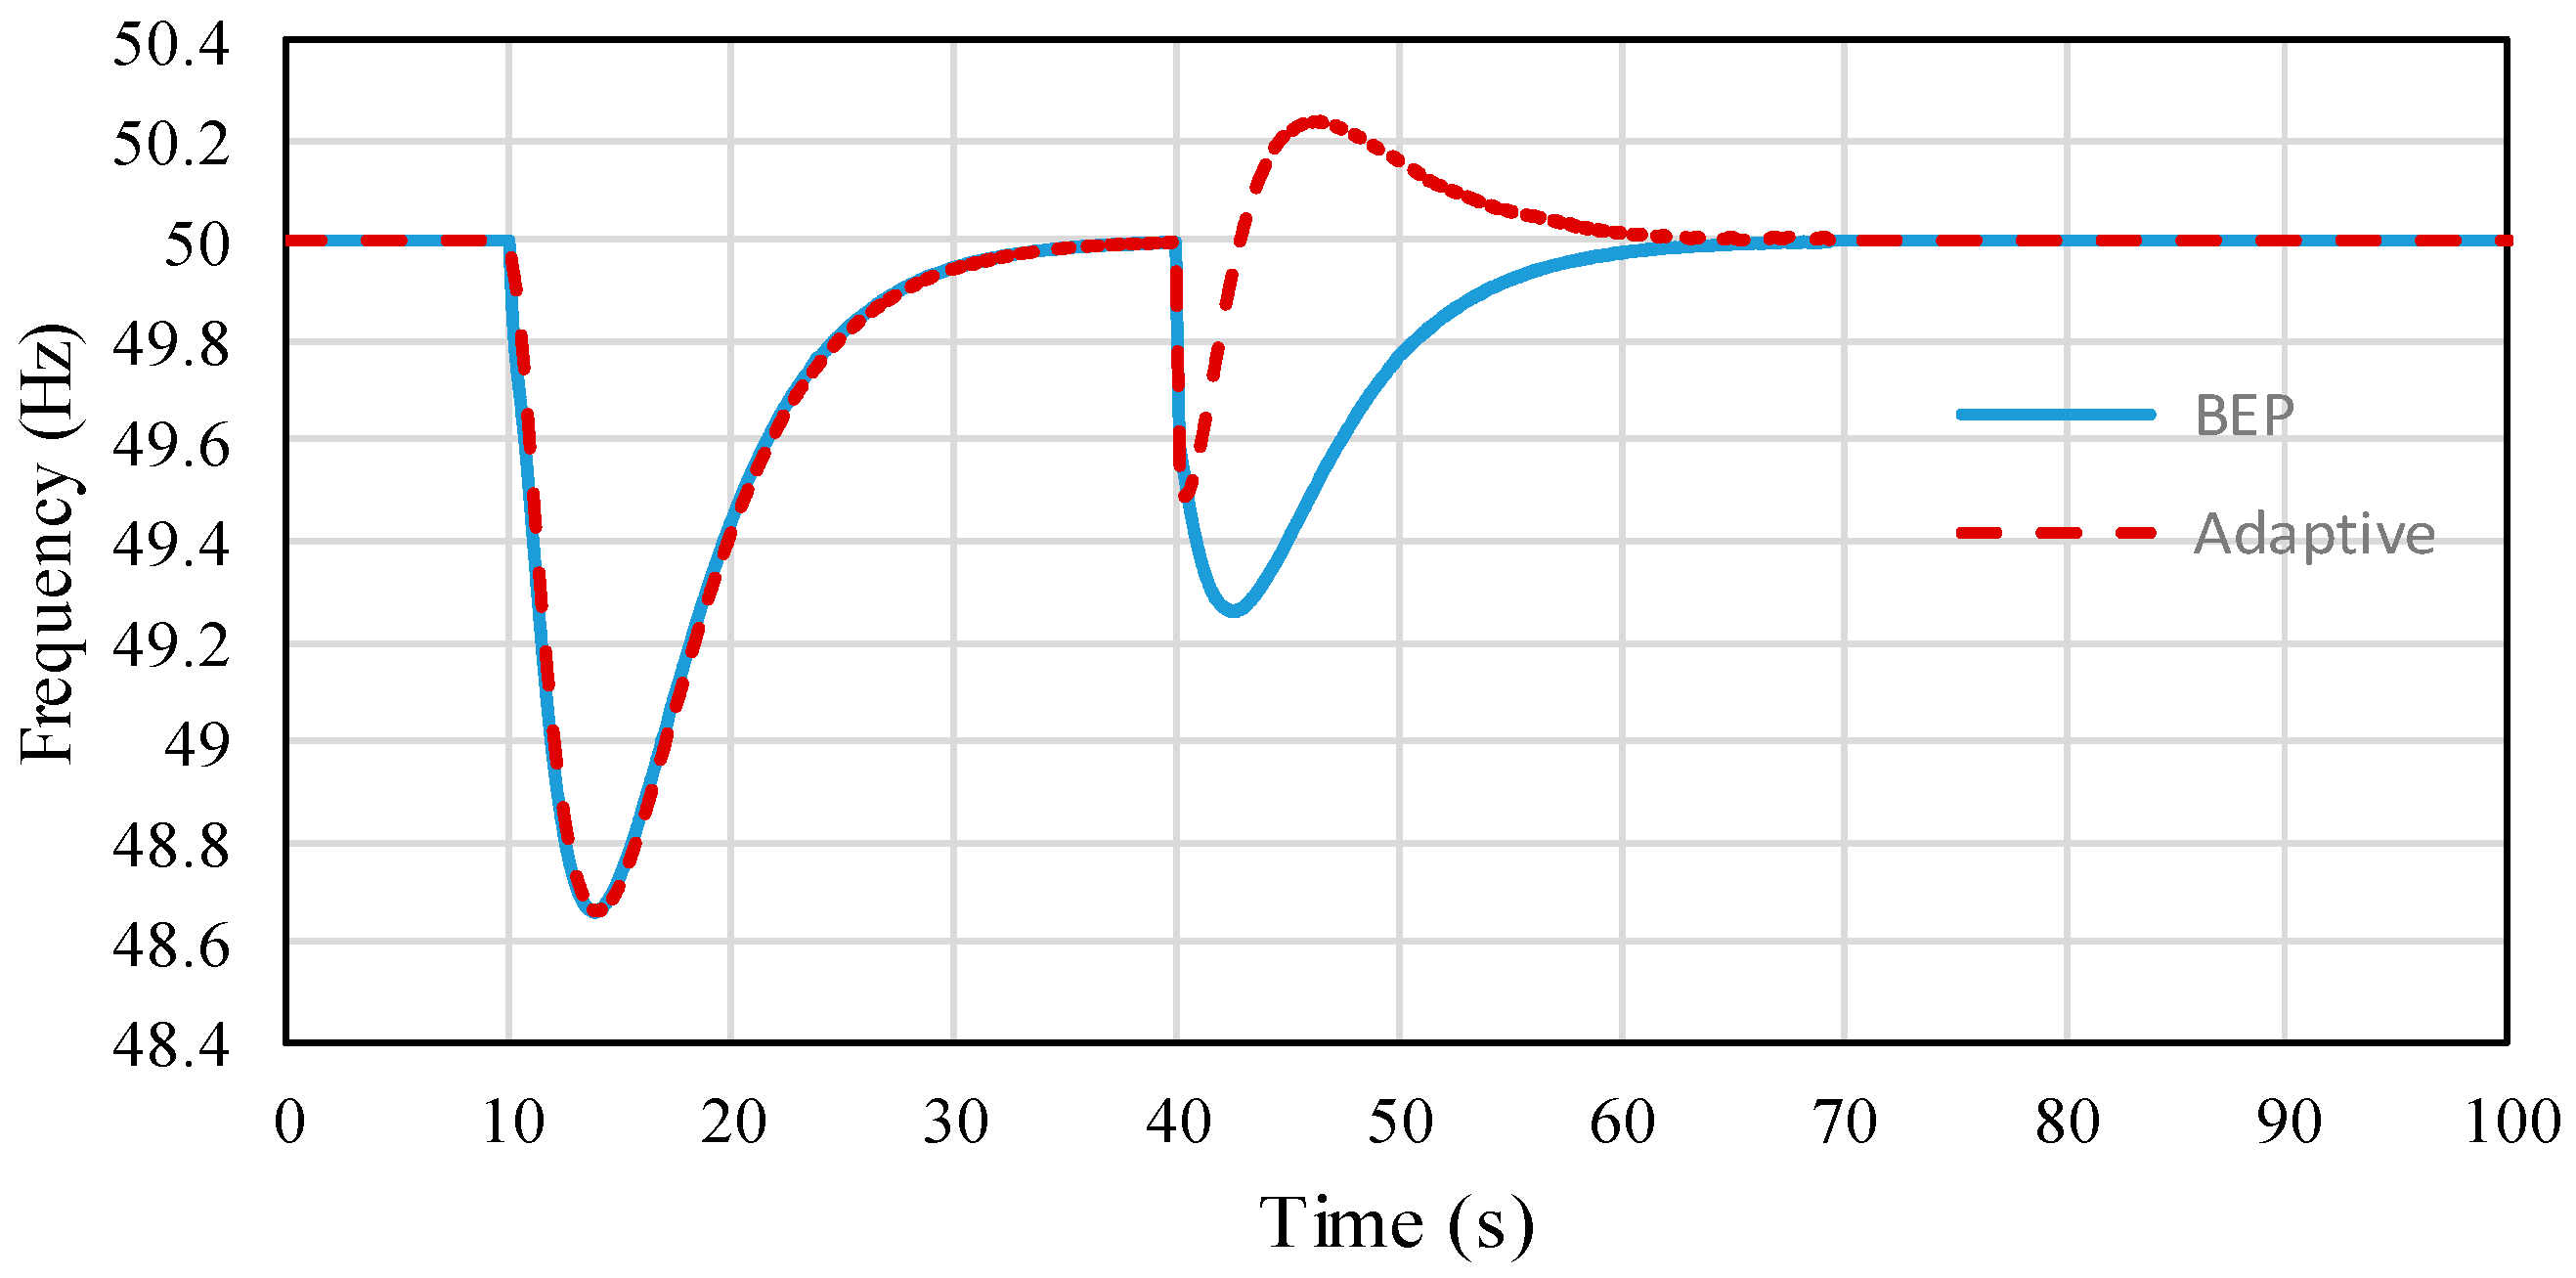
5.2. Second Case Study

Comparing the Operation of Proposed UFLS Scheme with Adaptive UFLS

This comparative study is required to show the preference of proposed UFLS scheme over the adaptive UFLS scheme, where this preference is due to the flexibility in load shedding priority. In this comparative analysis, BEP technique is chosen as the optimization technique in selecting optimal loads to be shed. Other optimization technique can also be applied. This comparative study is performed for load increment of 1 MW occurring at 40 s after islanding. Immediately after islanding, the system frequency begins to decline in response to excess loads (0.32 MW). Accordingly, the mini-hydro generators use their spinning reserves (0.48 MW) to cover the unbalance power. The UFLS controller will only be activated when the total load power exceeds 5.8 MW. At 40 s after islanding, the total power demand will be 6.68 MW. For this reason, the UFLS automatically activate its event based to stop the frequency declination by shedding the (Loads 2, 3 and 8) for BEP UFLS or (Loads 1–5) for adaptive UFLS, as per Table 7. The frequency responses of proposed UFLS controller and adaptive UFLS controller are shown in Figure 14.
Figure 14 and Table 7 clearly show that due to fixed priority of loads, the adaptive UFLS techniques will shed more load (1.07 MW), which leads to overshoot in the system frequency. However, the proposed UFLS technique sheds less load (0.84 MW) and recovers the system frequency without any overshooting.

5.3. Third Case Study

Generally, the success of load shedding technique is not only dependent on shedding the optimal number of loads, but it also depends on the execution time needed to perform the shedding operation. As discussed previously, the islanded microgrid with high penetration of solar PV generation suffers from rapid frequency changes. Accordingly, the load shedding controller, which is used as a last line of defense, will have only a short amount of time to make a decision. For this reason, a simulation study is required to compare the execution time of different meta-heuristic techniques to show the best one. Table 8 shows that the BEP technique has less execution time compared with the method proposed in [39], BGA, BPSO techniques, which makes it an excellent choice for application with a load shedding controller.
To show the performance of BGA, BPSO, and BEP optimization techniques, different convergence curves are performed, with 20 initial populations and 400 iterations. In this research, the initial populations selected based on several simulation trials with kind of balancing. In other words, when the initial population is increase, the optimization technique may achieve the convergence faster. However, this makes the optimization algorithm to lose its intrinsic characteristic to get the optimal value and work randomly. Regarding the iteration number, the same procedure is followed to select the appropriate number, where 400 iterations is selected to ensure the same condition applied for comparison study, even though some technique can convert on 200 iteration like the BGA.
As shown in Figure 15, Figure 16 and Figure 17, all techniques are reliable, as they achieve the lowest losses in all six trials. To get these trials, the optimization technique is executed six times; the only difference between these trials is the initial population, which explains the difference in the convergence value at the beginning. In Figure 15, it is clear that the BEP can get the optimal shedding load at 200 iterations. This result is coming from large number of trials. However, only six trials are included to make the figure clearer.
In Figure 16, it is clear that the BGA can get the optimal value of load shedding at 300 iterations. This result is coming from large number of trials. However, only six trials are included to make the figure clearer.
In Figure 17, it is clear that the BPSO can get the optimal value of load shedding at 400 iterations. This result is coming from large number of trials. However, only six trials are included to make the figure clearer.

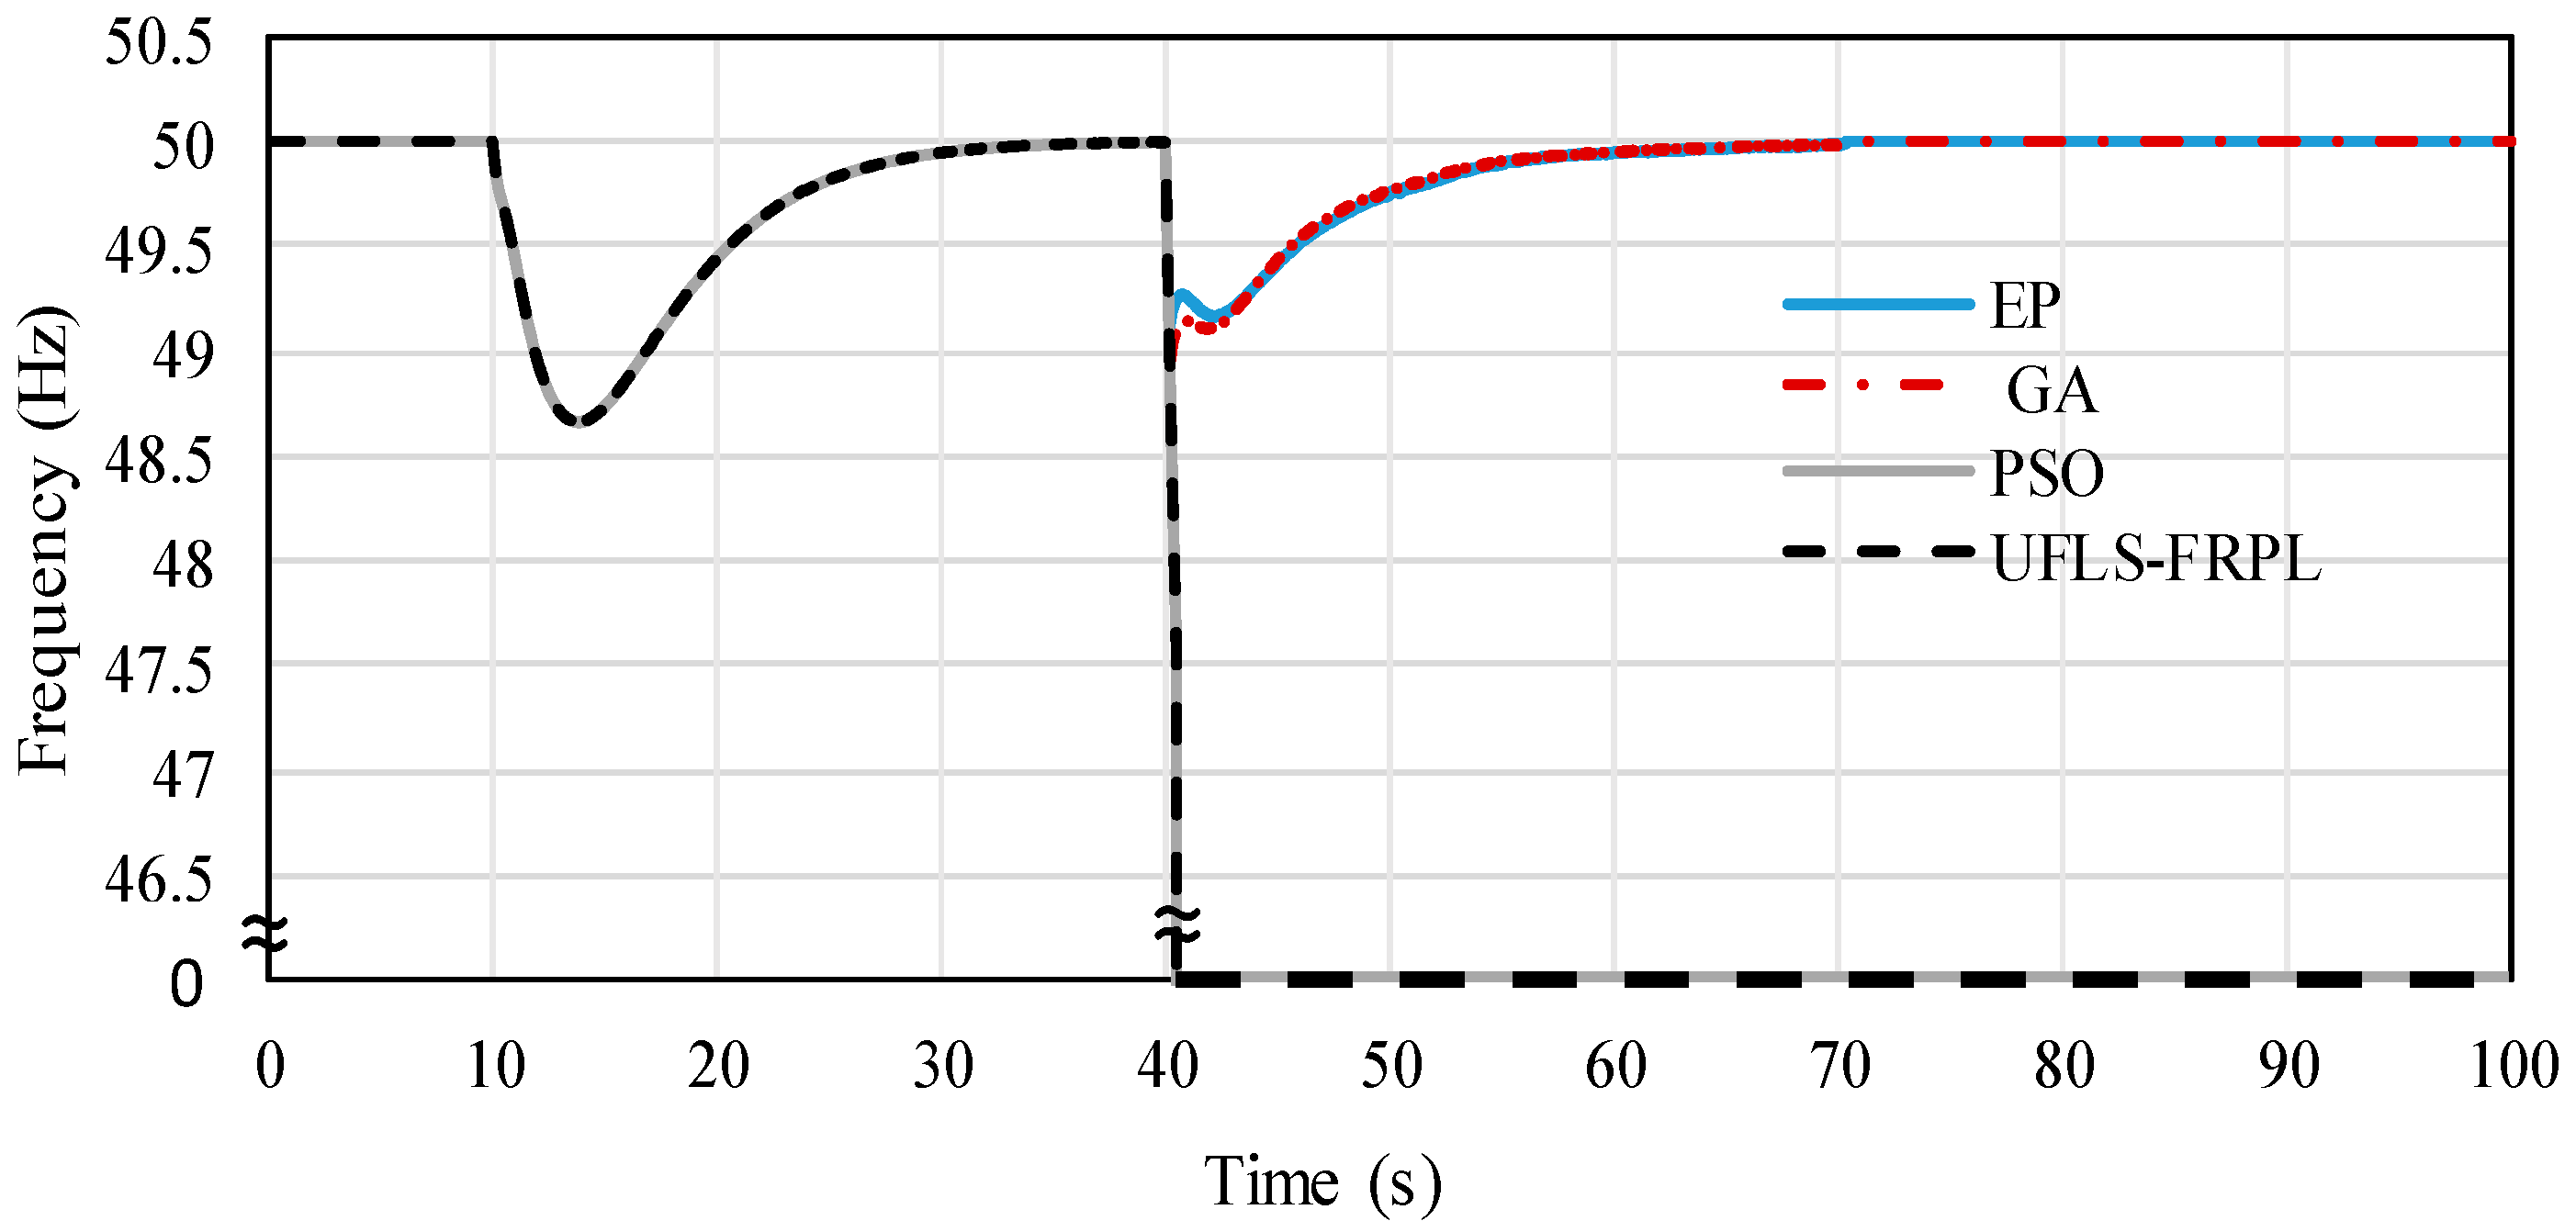
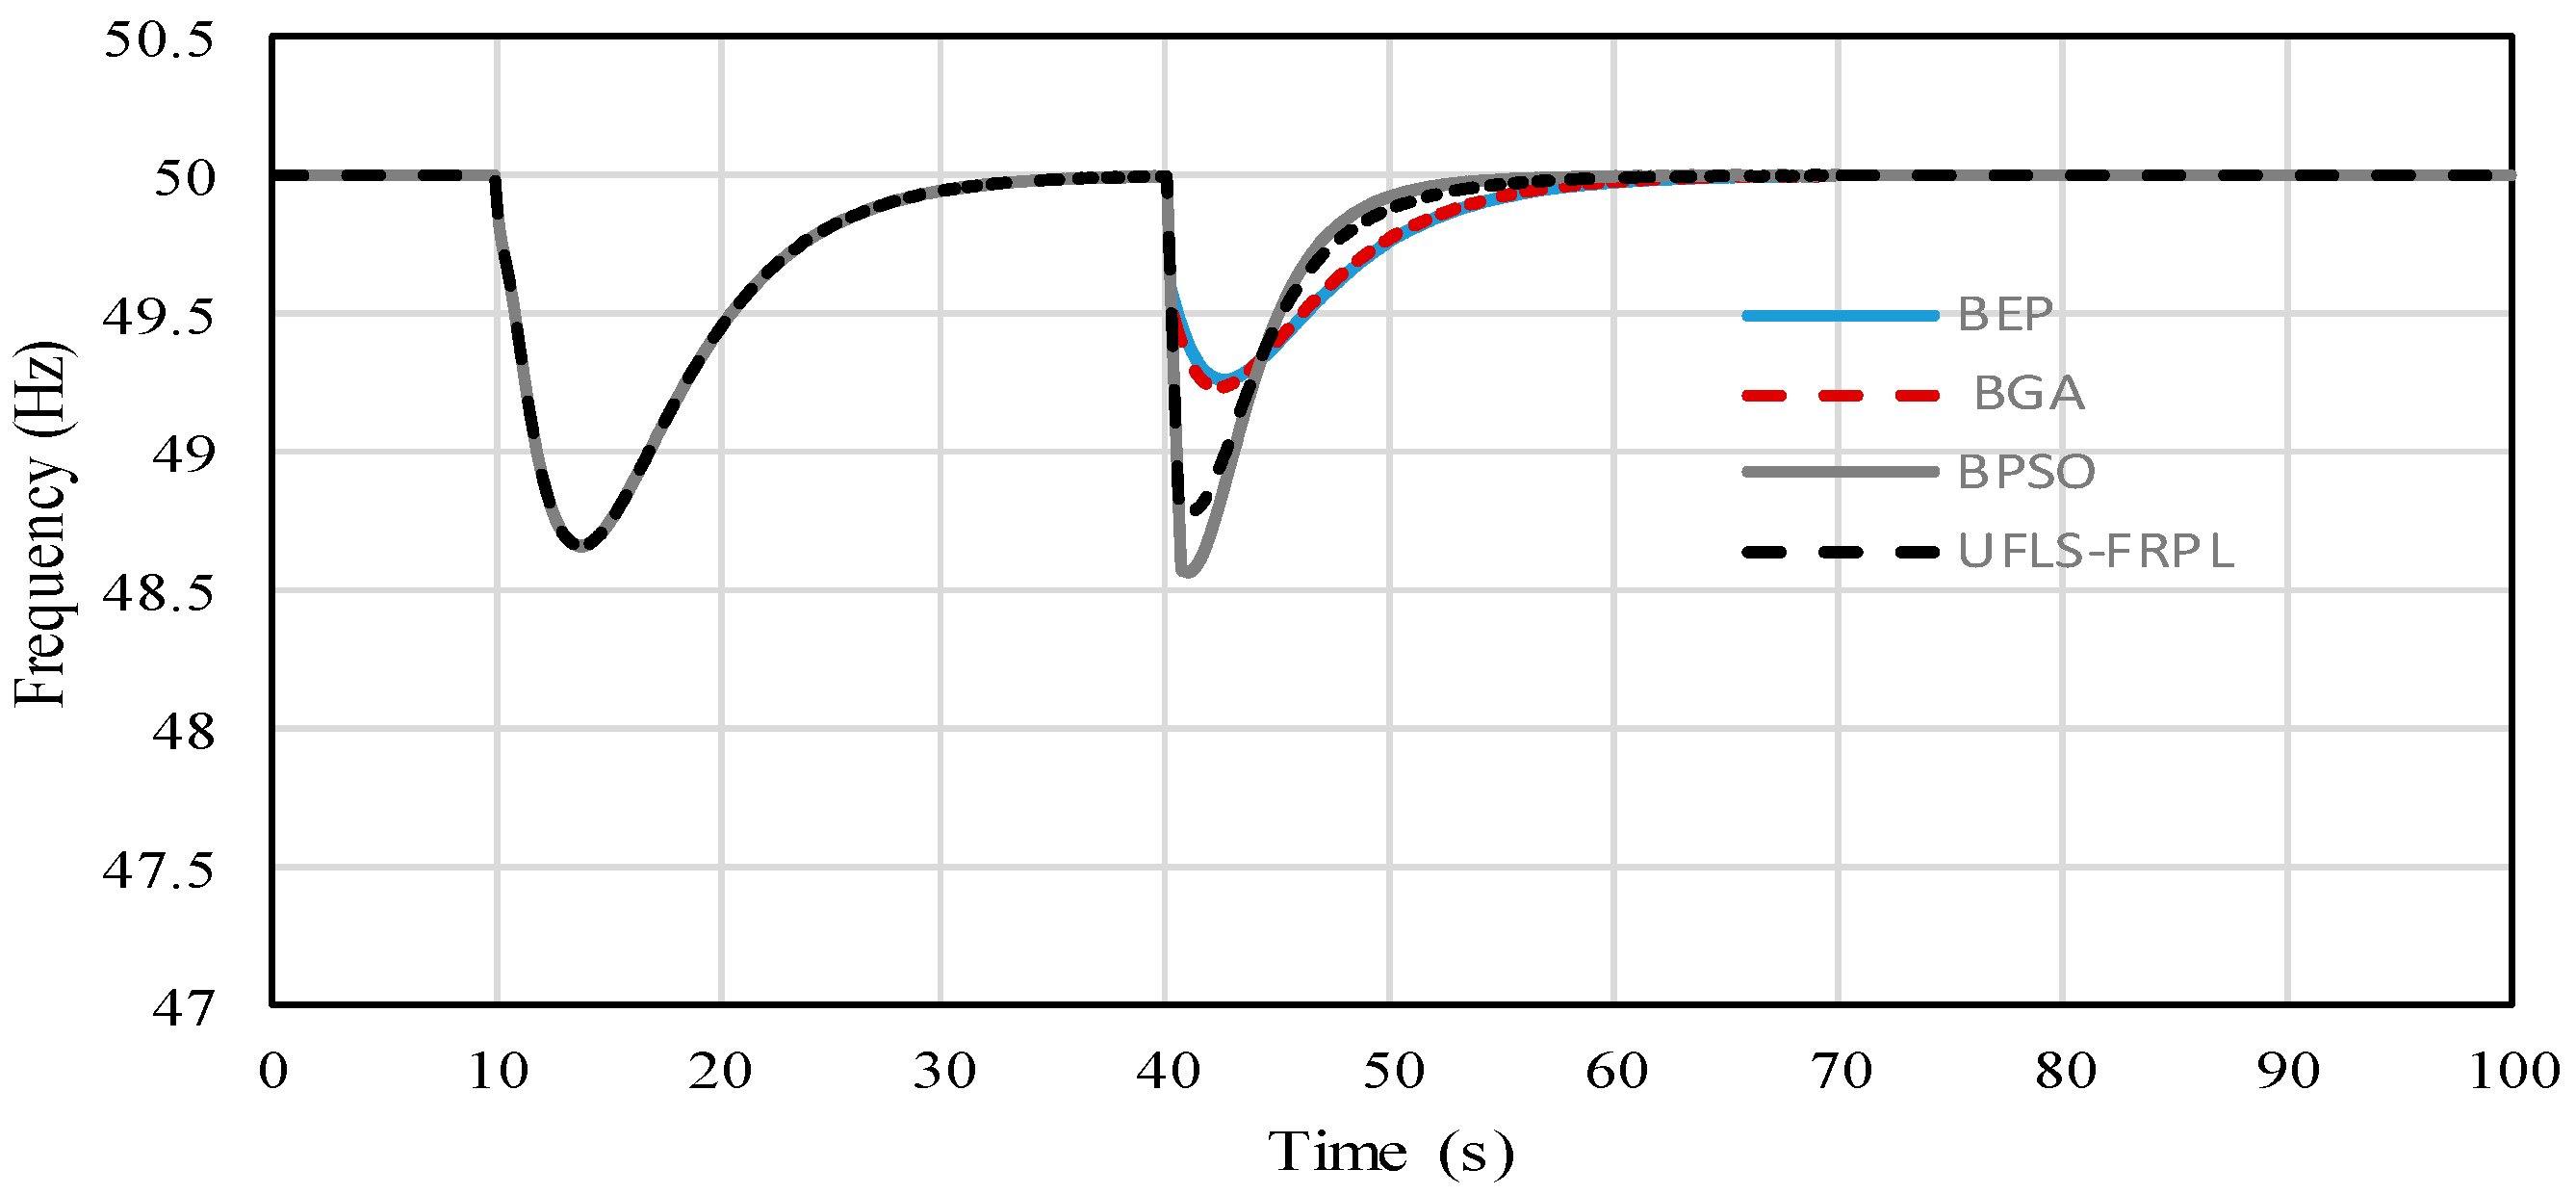
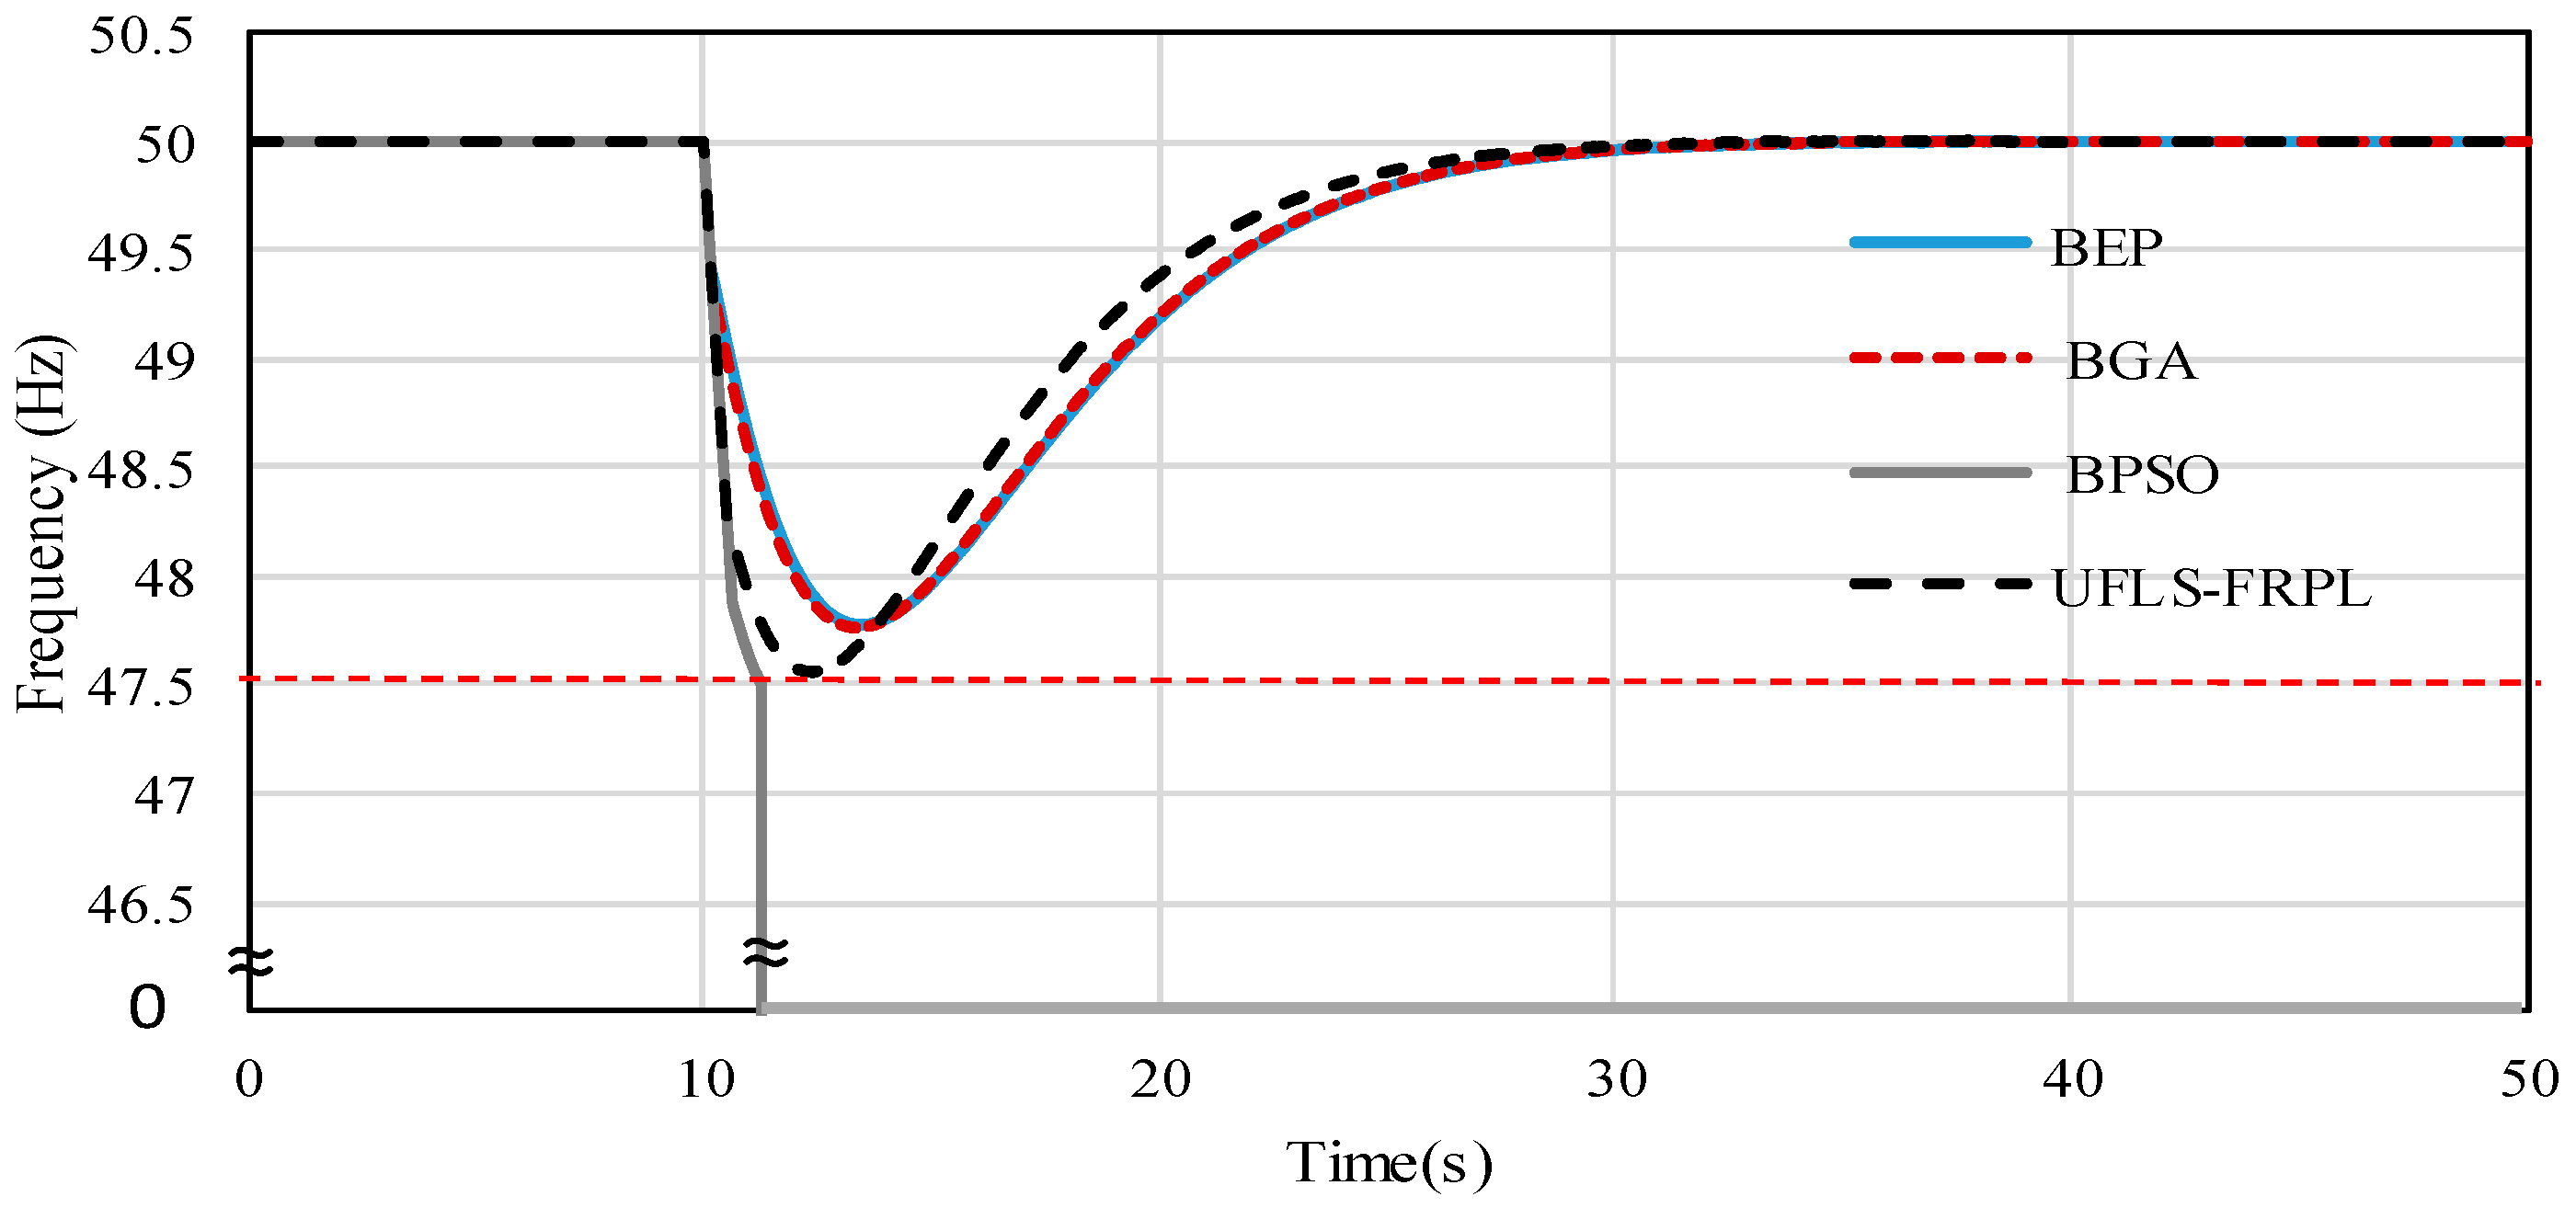
5.4. Fourth Case Study

5.4.1. Simulation Study of UFLS Scheme Using BEP, BGA, BPSO Techniques, and UFLS-FRPL

This study is performed to show the preference of UFLS scheme based on the BEP technique over the BGA, BPSO, and UFLS-FRPL.

Load Increment of 1 MW occurred at 40 s after Islanding

Immediately after islanding, the system frequency begins to decline in response to excess loads (0.32 MW). Accordingly, the mini-hydro generators use their spinning reserve (0.48 MW) to cover the unbalance power. The UFLS controller will only be activated when the total load power exceeds 5.8 MW. At 40 s after islanding, the total power demand will be 6.68 MW. Table 9 shows that all load shedding techniques will shed the same amount of power (0.84 MW). However, the nadir frequencies are not equal, due to the execution time difference. The frequency responses of all UFLS controller are shown in Figure 18.

Intentional Islanding at 1.56 MW Imbalance Power

In this scenario, the intentional islanding occurred at t = 10 s, when the solar radiation value is 500 W/m2. Immediately after islanding, the system frequency begins to decline in response to excess loads (1.56 MW). Accordingly, the mini-hydro generators use their spinning reserve (0.48 MW), but this value is insufficient to cover the unbalance power. For this reason, all load shedding techniques will be initiated to restore the system frequency. Table 10 shows that all load shedding techniques will shed the same amount of power (1.05 MW). However, Figure 19 shows that the BPSO technique fails to prevent the system frequency from dropping below 47.5 Hz, which leads to total blackout. In fact, the large execution time of BPSO technique is the main reason for protection failure.

Mini-Hydro DG Tripping at 40 s after Islanding

Immediately after islanding, the system’s frequency begins to decline in response to excess loads (0.32 MW). Accordingly, the mini-hydro generators use their spinning reserve (0.48 MW) to cover the unbalance power. The UFLS controller will only be activated when the total load power exceeds 5.8 MW. At 40 s after islanding, a mini-hydro DG of (1.71 MW) is tripped from the islanded microgrid. For this reason, all load shedding techniques are initiated to restore the system frequency. Table 11 shows that all load shedding techniques will shed the same amount of power (1.63 MW). However, Figure 20 shows that the BPSO technique and UFLS-FRPL fail to prevent the system’s frequency from dropping below 47.5 Hz, which leads to total blackout. In fact, the large execution time of BPSO technique and UFLS-FRPL is the main reason of operation inability.

6. Discussion

As discussed previously, it has become clear that the load shedding controller with fixed priority loads cannot shed the optimal combination of loads. Counter wise, the load shedding controller that uses random and fixed priority loads has the ability to shed the optimal combination of loads, as the UFLS-FRPL proposed in [30]. However, this method still suffers from time delay, which effects the operation of load shedding controller. For this reason, a comparative simulation study is conducted between three meta-heuristic techniques, BEP, BGA, and BPSO, and the method proposed in [30] to determine the best approach, as shown in Table 12. This comparative study shows that the BEP technique requires less time to shed the optimal combination of loads compared with BGA and BPSO techniques. Accordingly, the BEP technique is selected to be used with UFLS scheme to shed the optimal combination of loads from the islanding distribution network.

7. Conclusions and Future Research

In the near future, renewable energy sources such as solar PV will be significantly used. However, integrating more solar PV generation into the distribution network will result in several frequency stability issues and reduce the number of conventional generation units that provide the inertial response. This will cause the islanded distribution network to experience a fast frequency declination during disturbances. Therefore, this work presented a new UFLS scheme that is suitable for islanding distribution networks. This scheme utilizes the application of meta-heuristics techniques to determine the optimal combination of loads that needs to be shed from the network. In the first simulation case study, it is clear that at high solar PV penetration, the islanded network will experience a fast frequency declination. For this reason, a quick UFLS scheme must be available to stop frequency declination, which is a supposition that is supported in the third simulation case study, where different meta-heuristics techniques are applied with UFLS scheme to choose the fastest technique. The ability to shed optimal loads from islanded distribution network is another feature that is available in the proposed UFLS scheme, as shown in the 2nd and 4th simulation case studies. As concluded from the simulation results, the proposed UFLS scheme combines the advantage of high speed response with the ability to separate the optimal loads, rendering it suitable for application in a real islanded distribution network. The UFLS scheme proposed in this paper is more suitable for a small distribution network. However, for future research, it can be applied for a large distribution network by combining lumped group of loads with each other which possible in distribution network. Furthermore, the operation of the UFLS scheme can be coordinated with other inertia and frequency control schemes to obtain a stable island distribution network.

Acknowledgments

This research is funded by University of Malaya under postgraduate research grant: (PPP): PG156-2016A.

Author Contributions

Hazlie Mokhlis and Saad Mekhilef conceived and designed the experiments; Mohammad Dreidy performed the experiments and analyzed the data; and Mohammad Dreidy wrote the paper.

Conflicts of Interest

The authors declare no conflict of interest.

References

  1. Ruska, M.; Kiviluoma, J. Renewable Electricity in Europe. Current State, Drivers, and Scenarios for 2020; VTT Technical Research Centre of Finland: Otaniemi, Finland, 2011; p. 72. [Google Scholar]
  2. Basso, T. IEEE Standard for Interrconnecting Distributed Resources with the Electric Power System; Institute of Electrical and Electronics Engineers: Piscataway, NJ, USA, 2004; p. 1. [Google Scholar]
  3. Khamis, A.; Shareef, H.; Mohamed, A.; Bizkevelci, E. Islanding detection in a distributed generation integrated power system using phase space technique and probabilistic neural network. Neurocomputing 2015, 148, 587–599. [Google Scholar] [CrossRef]
  4. Hashemi, F.; Ghadimi, N.; Sobhani, B. Islanding detection for inverter-based DG coupled with using an adaptive neuro-fuzzy inference system. Int. J. Electr. Power Energy Syst. 2013, 45, 443–455. [Google Scholar] [CrossRef]
  5. Lee, S.-H.; Park, J.-W. New islanding detection method for inverter-based distributed generation considering its switching frequency. IEEE Trans. Ind. Appl. 2010, 46, 2089–2098. [Google Scholar] [CrossRef]
  6. Xu, D.; Girgis, A.A. Optimal load shedding strategy in power systems with distributed generation. In Proceedings of the 2001 IEEE Power Engineering Society Winter Meeting, Columbus, OH, USA, 28 January–1 February 2001; pp. 788–793.
  7. Laghari, J.; Mokhlis, H.; Bakar, A.; Mohamad, H. Application of computational intelligence techniques for load shedding in power systems: A review. Energ. Convers. Manag. 2013, 75, 130–140. [Google Scholar] [CrossRef]
  8. Tang, J.; Liu, J.; Ponci, F.; Monti, A. Adaptive load shedding based on combined frequency and voltage stability assessment using synchrophasor measurements. IEEE Trans. Power Syst. 2013, 28, 2035–2047. [Google Scholar] [CrossRef]
  9. Anderson, P.; Mirheydar, M. An adaptive method for setting underfrequency load shedding relays. IEEE Trans. Power Syst. 1992, 7, 647–655. [Google Scholar] [CrossRef]
  10. Jung, J.; Liu, C.-C.; Tanimoto, S.L.; Vittal, V. Adaptation in load shedding under vulnerable operating conditions. IEEE Trans. Power Syst. 2002, 17, 1199–1205. [Google Scholar] [CrossRef]
  11. Tso, S.; Zhu, T.; Zeng, Q.; Lo, K. Evaluation of load shedding to prevent dynamic voltage instability based on extended fuzzy reasoning. IEE Proc. Gener. Transm. Distrib. 1997, 144, 81–86. [Google Scholar] [CrossRef]
  12. Sasikala, J.; Ramaswamy, M. Fuzzy based load shedding strategies for avoiding voltage collapse. Appl. Soft Comput. 2011, 11, 3179–3185. [Google Scholar] [CrossRef]
  13. Mokhlis, H.; Laghari, J.; Bakar, A.; Karimi, M. A fuzzy based under-frequency load shedding scheme for islanded distribution network connected with DG. Int. Rev. Electr. Eng. 2012, 7, 4992–5000. [Google Scholar]
  14. Mahat, P.; Chen, Z.; Bak-Jensen, B. Underfrequency load shedding for an islanded distribution system with distributed generators. IEEE Trans. Power Deliv. 2010, 25, 911–918. [Google Scholar] [CrossRef]
  15. Zin, A.M.; Hafiz, H.M.; Wong, W. Static and dynamic under-frequency load shedding: A comparison. In Proceedings of the 2004 International Conference on Power System Technology (PowerCon 2004), Singapore, 21–24 November 2004; pp. 941–945.
  16. Hong, Y.-Y.; Wei, S.-F. Multiobjective underfrequency load shedding in an autonomous system using hierarchical genetic algorithms. IEEE Trans. Power Deliv. 2010, 25, 1355–1362. [Google Scholar] [CrossRef]
  17. Rad, B.F.; Abedi, M. An optimal load-shedding scheme during contingency situations using meta-heuristics algorithms with application of AHP method. In Proceedings of the 11th International Conference on Optimization of Electrical and Electronic Equipment (OPTIM 2008), Brasßov, Romania, 22–24 May 2008; pp. 167–173.
  18. Al-Hasawi, W.M.; El Naggar, K.M. Optimum steady-state load-shedding scheme using genetic based algorithm. In Proceedings of the IEEE 11th Mediterranean Electrotechnical Conference (MELECON 2002), Cairo, Egypt, 7–9 May 2002; pp. 605–609.
  19. Chen, C.-R.; Tsai, W.-T.; Chen, H.-Y.; Lee, C.-Y.; Chen, C.-J.; Lan, H.-W. Optimal load shedding planning with genetic algorithm. In Proceedings of the 2011 IEEE Industry Applications Society Annual Meeting (IAS), Orlando, FL, USA, 9–13 October 2011; pp. 1–6.
  20. Hong, Y.-Y.; Chen, P.-H. Genetic-based underfrequency load shedding in a stand-alone power system considering fuzzy loads. IEEE Trans. Power Deliv. 2012, 27, 87–95. [Google Scholar] [CrossRef]
  21. Luan, W.; Irving, M.R.; Daniel, J.S. Genetic algorithm for supply restoration and optimal load shedding in power system distribution networks. IEE Proc. Gener. Transm. Distrib. 2002, 149, 145–151. [Google Scholar] [CrossRef]
  22. Amraee, T.; Mozafari, B.; Ranjbar, A. An improved model for optimal under voltage load shedding: Particle swarm approach. In Proceedings of the 2006 IEEE Power India Conference, New Delhi, India, 10–12 April 2006; p. 6.
  23. Mozafari, B.; Amraee, T.; Ranjbar, A. An approach for under voltage load shedding using particle swarm optimization. In Proceedings of the 2006 IEEE International Symposium on Industrial Electronics, Montreal, QC, Canada, 9–13 July 2006; pp. 2019–2024.
  24. Sadati, N.; Amraee, T.; Ranjbar, A. A global particle swarm-based-simulated annealing optimization technique for under-voltage load shedding problem. Appl. Soft Comput. 2009, 9, 652–657. [Google Scholar] [CrossRef]
  25. El-Zonkoly, A.; Saad, M.; Khalil, R. New algorithm based on CLPSO for controlled islanding of distribution systems. Int. J. Electr. Power Energy Syst. 2013, 45, 391–403. [Google Scholar] [CrossRef]
  26. Hsu, C.-T.; Chuang, H.-J.; Chen, C.-S. Adaptive load shedding for an industrial petroleum cogeneration system. Expert Syst. Appl. 2011, 38, 13967–13974. [Google Scholar] [CrossRef]
  27. Hooshmand, R.; Moazzami, M. Optimal design of adaptive under frequency load shedding using artificial neural networks in isolated power system. Int. J. Electr. Power Energy Syst. 2012, 42, 220–228. [Google Scholar] [CrossRef]
  28. Hsu, C.-T.; Kang, M.-S.; Chen, C.-S. Design of adaptive load shedding by artificial neural networks. IEEE Proc. 2005, 152, 415–421. [Google Scholar] [CrossRef]
  29. Javadian, S.; Haghifam, M.-R.; Bathaee, S.; Firoozabad, M.F. Adaptive centralized protection scheme for distribution systems with DG using risk analysis for protective devices placement. Int. J. Electr. Power Energy Syst. 2013, 44, 337–345. [Google Scholar] [CrossRef]
  30. Laghari, J.; Mokhlis, H.; Karimi, M.; Bakar, A.H.A.; Mohamad, H. A new under-frequency load shedding technique based on combination of fixed and random priority of loads for smart grid applications. IEEE Trans. Power Syst. 2015, 30, 2507–2515. [Google Scholar] [CrossRef]
  31. Xia, J.; Dyśko, A.; O’Reilly, J. Future stability challenges for the UK network with high wind penetration levels. IET Gener. Transm. Dis. 2015, 9, 1160–1167. [Google Scholar] [CrossRef]
  32. Morren, J.; Pierik, J.; de Haan, S.W. Inertial response of variable speed wind turbines. Electr. Power Syst. Res. 2006, 76, 980–987. [Google Scholar] [CrossRef]
  33. Terzija, V.V. Adaptive underfrequency load shedding based on the magnitude of the disturbance estimation. IEEE Trans. Power Syst. 2006, 21, 1260–1266. [Google Scholar] [CrossRef]
  34. Kundur, P.; Balu, N.J.; Lauby, M.G. Power System Stability and Control; McGraw-Hill: New York, NY, USA, 1994; Volume 7. [Google Scholar]
  35. Wang, Q.; Tang, Y.; Li, F.; Li, M.; Li, Y.; Ni, M. Coordinated scheme of under-frequency load shedding with intelligent appliances in a cyber physical power system. Energies 2016, 9, 630. [Google Scholar] [CrossRef]
  36. Khamis, A.; Shareef, H.; Mohamed, A. Islanding detection and load shedding scheme for radial distribution systems integrated with dispersed generations. IET Gener. Transm. Dis. 2015, 9, 2261–2275. [Google Scholar] [CrossRef]
  37. Civicioglu, P. Backtracking search optimization algorithm for numerical optimization problems. Appl. Math. Comput. 2013, 219, 8121–8144. [Google Scholar] [CrossRef]
  38. Yuan, X.; Nie, H.; Su, A.; Wang, L.; Yuan, Y. An improved binary particle swarm optimization for unit commitment problem. Expert Syst. Appl. 2009, 36, 8049–8055. [Google Scholar] [CrossRef]
  39. Liu, W.; Liu, L.; Cartes, D.A.; Venayagamoorthy, G.K. Binary particle swarm optimization based defensive islanding of large scale power systems. Int. J. Comput. Sci. Appl. 2007, 4, 69–83. [Google Scholar]
  40. Dahej, A.E.; Esmaeili, S.; Goroohi, A. Optimal allocation of SVC and TCSC for improving voltage stability and reducing power system losses using hybrid binary genetic algorithm and particle swarm optimization. Can. J. Electr. Electron. Eng. 2012, 3, 100–107. [Google Scholar]
  41. Aman, M.; Jasmon, G.; Naidu, K.; Bakar, A.; Mokhlis, H. Discrete evolutionary programming to solve network reconfiguration problem. In Proceedings of the 2013 IEEE TENCON Spring Conference, Sydney, Australia, 17–19 April 2013; pp. 505–509.
  42. Aponte, E.E.; Nelson, J.K. Time optimal load shedding for distributed power systems. IEEE Trans. Power Syst. 2006, 21, 269–277. [Google Scholar] [CrossRef]
  43. Oluwadare, S.A.; Iwasokun, G.B.; Olabode, O.; Olusi, O.; Akinwonmi, A.E. Genetic algorithm-based cost optimization model for power economic dispatch problem. Br. J. Appl. Sci. Technol. 2016, 15, 6. [Google Scholar] [CrossRef]
  44. Thakur, P.; Singh, A.J. Study of various crossover operators in GeneticAlgorithms. Int. J. Adv. Res. Comput. Sci. Softw. Eng. 2014, 4, 7235–7238. [Google Scholar]
  45. Eberhart, R.C.; Shi, Y. Comparing inertia weights and constriction factors in particle swarm optimization. In Proceedings of the 2000 Congress on Evolutionary Computation, San Diego, CA, USA, 16–19 July 2000; pp. 84–88.
  46. Hoke, A.; Hambrick, R.B.J.; Kroposki, B. Maximum Photovoltaic Penetration Levels on Typical Distribution Feeders; National Renewable Energy Laboratory: Golden, CO, USA, 2012.
Figure 1. The proposed load shedding scheme.
Energies 10 00150 g001
Figure 2. Flow chart of frequency calculator unit.
Energies 10 00150 g002
Figure 3. Flow chart of the load shedding unit.
Energies 10 00150 g003
Figure 4. Flow chart of binary evolutionary programming technique.
Energies 10 00150 g004
Figure 5. Fixed and random priority loads with LSU.
Energies 10 00150 g005
Figure 6. The distribution network under test.
Energies 10 00150 g006
Figure 7. PSCAD model of solar PV generation unit.
Energies 10 00150 g007
Figure 8. PV module connected on series and parallel in array.
Energies 10 00150 g008
Figure 9. (a) Power-Voltage curve of solar PV generation unit; and (b) Current-Voltage curve of solar PV generation unit.
Energies 10 00150 g009
Figure 10. DC-DC Buck converter of solar PV unit.
Energies 10 00150 g010
Figure 11. MPPT controller of Solar PV.
Energies 10 00150 g011
Figure 12. Solar PV inverter control system.
Energies 10 00150 g012
Figure 13. Frequency response of intentional islanding at 0.45 MW imbalance power for 35% and 0% solar PV penetration.
Energies 10 00150 g013
Figure 14. The Frequency response for 1-MW load increment scenario.
Energies 10 00150 g014
Figure 15. The convergence trend of BEP technique.
Energies 10 00150 g015
Figure 16. The convergence trend of BGA technique.
Energies 10 00150 g016
Figure 17. The convergence trend of BPSO technique.
Energies 10 00150 g017
Figure 18. Frequency response for 1-MW load increment.
Energies 10 00150 g018
Figure 19. Frequency response of intentional islanding at 1.56 MW imbalance power.
Energies 10 00150 g019
Figure 20. Frequency response for mini hydro DG tripping event.
Energies 10 00150 g020
Table 1. The fitness values for each chromosome.
XiPi-Combination (MW)Fitness (fi) (MW)
X11 1 0 1 0 1 0 1 0 1P1 + P3 + P5 + P7 + P9 + P10 = 2.0911.091
X20 1 0 1 0 1 0 1 1 1P1 + P2 + P3 + P5 + P7 + P9 = 2.0411.041
X30 0 0 0 1 0 0 1 1 1P1 + P2 + P3 + P6 = 0.7830.217
....
....
X200 0 0 0 0 1 1 1 1 1P1 + P2 + P3 + P4 + P5 = 1.0120.012
Table 2. The initial population and fitness values of optimal UFLS technique based on fixed and random priority of Loads.
No.Load CombinationsPi-Combination (MW)Fitness fi
10000000001P1 = 0.0440.106
20000000010P2 = 0.0690.081
30000000100P3 = 0.150
40000001000P4 = 0.3140.164
50000010000P5 = 0.4350.285
....
....
10231111111111P1 + P2 + P3 + P4 + P5 + P6 + P7 + P8 + P9 + P10 = 3.6393.489
Table 3. Load data and their priority.
Load RankedBus No.P (MW)Proposed Priority
Load 110500.044Random
Load 210130.069Random
Load 31047, 10260.15Random
Load 410120.314Random
Load 511510.5Random
Load 610290.55Random
Load 71010, 10390.583Random
Load 810750.645Random
Load 91018, 1019, 1020, 10460.76Random
Load 1011440.119Random
Load 1110440.42Fixed
Load 1210560.223Fixed
Table 4. Parameters of solar PV module SM380 Poly at 1000 W/m2, 25 °C.
ParameterSymbolValue
Peak powerPmax380 W
Open circuit voltageVoc59.75 V
Short circuit currentIsc8.56 A
Max. power voltageVm47.9 V
Max. power currentIm7.93 A
Number of module connected in seriesNS17
Number of module connected in parallelNP82
Table 5. Parameters of buck DC-DC converter.
Parameter Symbol TargetParameter Symbol Parameter Value
Input VoltageVIN830 V
Output VoltageVOUT700 V
Switching FrequencyfSW1 KHz
Inductor Current Ripple RatioLIR0.3
Capacitor Voltage Ripple RatioCVR0.04
Maximum Output CurrentIOUT, MAX700 A
The Minimum Inductance ValueLmin500 µH
The Minimum Capacitance ValueCmin1000 µF
Table 6. Distribution network parameters of intentional islanding at 0.45 MW imbalance power.
ParameterWithout PV GenerationWith 35% PV Penetration
Imbalance power (MW)0.450.45
Δf/Δt (Hz/s)0.60.86
Nadir Frequency (Hz)48.548
Table 7. UFLS parameters for load increment of 1.0 MW after islanding.
ParameterUFLS Based BEPAdaptive UFLS Technique
ΔP (MW)1.01.0
Reserve (MW)0.160.16
Total Load Shed Power (MW)0.841.07
Shedding LoadsLoads 2, 3, 8Loads 1–5
Nadir Frequency (Hz)49.349.5
Frequency Overshoot (Hz)-50.25
Table 8. The execution time for BGA, BPS, BEP and UFLS-FRPL.
Trial NumberExecution Time (s)
PSOGABEPUFLS-FRPL
10.6460.1960.1620.5
20.6090.1790.1520.5
30.6260.1720.1550.5
40.6570.1780.1500.5
50.6050.1760.1530.5
60.6070.1890.1530.5
Average0.6250.1820.1540.5
Table 9. The UFLS parameters for load increment of 1.0 MW after islanding.
ParameterBEPBGABPSOUFLS-FRPL
ΔP (MW)1.01.01.01.0
Reserve (MW)0.160.160.160.16
Total Load Shed Power (MW)0.840.840.840.84
Shedding LoadsLoad 2, 3, 8Load 2, 3, 8Load 2, 3, 8Load 2, 3, 8
Nadir Frequency (Hz)49.349.2548.848.55
Table 10. UFLS parameter of intentional islanding at 1.56 MW imbalance power.
ParameterBEPBGABPSOUFLS-FRPL
ΔP (MW)1.561.561.561.56
Reserve (MW)0.480.480.480.48
Total Load Shed Power (MW)1.081.081.081.08
Shedding LoadsLoad 7, 5Load 7, 5Load 7, 5Load 7, 5
Nadir Frequency (Hz)47.847.8047.55
Table 11. The UFLS parameters for mini hydro DG tripping event.
ParameterBEPBGABPSOUFLS-FRPL
ΔP (MW)1.711.711.711.71
Reserve (MW)0.080.080.080.08
Total Load Shed power (MW)1.631.631.631.63
Shedding loadsLoad 1, 4, 6, 9Load 1, 4, 6, 9Load 1, 4, 6, 9Load 1, 4, 6, 9
Nadir Frequency (Hz)49.249.100
Table 12. The comparison study between different load shed techniques.
ParameterBEPBGAUFLS-FRPLBPSO
Load priorityFixed and randomFixed and randomFixed and randomFixed and random
Total load shed powerSame valueSame valueSame valueSame value
Time execution **1234
Frequency overshootWithout overshootWithout overshootWithout overshootWithout overshoot
Nadir frequency **4321
** 1 represents the lowest value and 4 is the highest value.

