Article

A System Dynamics Analysis of Investment, Technology and Policy that Affect Natural Gas Exploration and Exploitation in China

1
School of Economics and Management, China University of Geosciences, Wuhan 430074, China
2
Resources and Environment Economic Research Center, China University of Geosciences, Wuhan 430074, China
*
Authors to whom correspondence should be addressed.
Energies 2017, 10(2), 154; https://doi.org/10.3390/en10020154
Submission received: 24 September 2016 / Revised: 22 December 2016 / Accepted: 3 January 2017 / Published: 25 January 2017
(This article belongs to the Special Issue Applied Energy System Modeling 2016)

Abstract

:
Natural gas has an increasing role in Chinese energy transformation. We present a system dynamics model of the natural gas industry in China. A new system dynamics model for natural gas companies based on reserve exploration and well construction as well as investment dynamics is proposed. The contribution of the paper is to analyze the influence of technology, investment and policy factors on the natural gas industry. We found that the dynamics of the main variables, including gas policy, cost of investment, accounting depreciation and exploitation technology, are sensitive to the sustainable development of resources. The simulations and results presented here will be helpful for government to reform policies, and for upstream companies to make decisions.

1. Introduction

As a coal-dominated energy-consumption structured economy, China has been suffering from serious pollution problems. Country Environmental Analysis of China has pointed out that, in 2012, seven of the world’s ten most polluted cities are located in China. Among the largest 500 cities in China, less than 1% met the recommended air quality standards of World Health Organization [1]. In 2013, Beijing, and most of the eastern region in China, had experienced continued haze weather, which the public referred to as “haze China”. Improving energy consumption structure and increasing the proportion of low carbon emission energy have become effective ways to solve China’s current environmental pollution problems [2]. The Chinese government proposed the goal of CO2 emission reduction in 2009, attaining a 40%–50% decrease of CO2 emission per GDP by 2020 compared with that of 2005. Meanwhile, the 12th Five-Year Plan also set the goal of energy intensity control at a 3.7% decline every year. In 2014, the Sino–U.S. Joint Statement on Climate Change was signed, and the Chinese government proposed the plan for peaking the CO2 emission by 2030 or earlier. At present, natural gas is already the main energy consumed in European countries. In the future, the proportion of natural gas and other renewable energy will be further increased [3,4]. China’s current technology and market development of renewable energy is lagging, thus China is vigorously promoting the exploration and development of natural gas. Simultaneously, the government has put forward ambitious policies to promote the usage of natural gas [5]. Therefore, the government supports its strong determination to increase domestic production to guarantee energy security. Evidence of this decision includes the large-scale geological survey in potential domestic basins and strengthening the involvement of international natural gas market. According to Dai et al. (2015), conventional gas geological resources in China have risen from (5.4 − 7) × 1012 m3 in the early 1980s to 63 × 1012 m3 in 2010, as have been assessed by various scholars and institutes over the past thirty years [6]. China reported (39.0 − 39.2) × 1012 m3 recoverable reserves for conventional gas, which is among the greatest reserves in the world, and will provide a substantial foundation for the sustainable development of China’s natural gas industry. However, large-gas reserve fields in China are mainly spread in the Midwest region, including Sichuan Basin, Ordos Basin and Tarim Basin. However, the “gold” buried depths of reserves are deeper than those abroad and with low pressure and low discovery rate, i.e., the reserves at buried depths of 3000–4500 m account for 46.11% of the total reserves, hence their exploration will be more difficult with higher costs and more complexity. As a result, the wellhead price of gas in China is equivalent to or higher than the border prices of Europe’s imported gas. A number of studies have addressed the gas production and consumption patterns in China from a national perspective [7,8,9]. However, for a country as large as China in terms of market structure, competition and regulation reform, any analysis of natural gas market development needs to capture its industrial variations. Hence, it is very important to analyze corresponding measures and incentives, such as policy, technology, and regulation factors to reduce the production cost and improve investment efficiency.
Chinese upstream gas production has a long history characterized by oligopolies and monopolies with three dominating companies, i.e., China National Petroleum Corporation (CNPC), China Petroleum and Chemical Corporation (SINPEC) and China National Offshore Oil Corporation (CNOOC), which is unfavorable for technology progress, extraction cost reduction and market competition.
In recent years, China’s natural gas industry has undergone major reforms. It consists of the following actions:
  • The developing natural gas market has been in the process of transforming, consisting of improving investment efficiency and service quality through privatization. The desirability of expanding natural gas also calls for the strengthening of domestic and international exploration and exploitation. China has implemented various measures to better cope with supply–demand gap and significantly mitigate their effects, which means that the country seeks supplies from all possible sources, not only imports of liquefied natural gas (LNG) and pipeline gas but also from domestic gas production. The national oil companies (NOCs) have also increased their investment in exploration and development of upstream sector in order to meet increasing natural gas demands.
  • Gas pricing is to be changed from a “production cost” regime to a “market net return” regime. Since domestic cost-plus regulated pricing for produced gas is low compared to alternative sources, there is less incentive for upstream producers to engage in exploration and production activity. Therefore, a transforming step toward launching a market-driven pricing regime will provide encouragement to upstream companies.
  • Previously, the large corporations in the natural gas industry relied on command and control approaches. Since the mid-2000s, the Chinese government has hoped that NOCs will eventually rival the operation of major Western oil companies in the scope of their worldwide activities, which could promote the market evolution, leading to greater investment from private entrants. Thus, NOCs would become more profitable and market-oriented, thereby better able to increase their capital investment efficiency.
  • Before 2010, the accounting method mainly applied in NOCs was full cost. In that approach, firms capitalized all operating expenses generated in prospecting for oil and gas reserves as well as in acquiring, exploring and proving oil and gas properties, regardless of the uncertainty and risk. Then, companies switched to the total successful efforts approach, in which only those acquisition, exploration and development costs related to the discovery of commercially viable reserves need to be capitalized. Compared with Western companies, Chinese firms are less familiar with these accounting methods.
To be specific, it is important to have a perspective on the integrated systems in order to understand their behavior, and analyze those factors affecting the non-renewable resource exploration path and corresponding influence on investment behavior. In this paper, a new system dynamics model for natural gas companies based on reserve exploration and well construction as well as investment dynamics is proposed. The contribution of this paper is to analyze the influence of investment, technology and policy factors on the natural gas industry. The recommendations and simulations will be helpful for policy makers to formulate policies and to make decisions to create high returns for upstream companies.
The paper is organized as follows: in Section 2, the state of literature is reviewed. In Section 3, the subsystems are introduced through a step-by-step replication. Section 4 analyzes the results of the scenarios and Section 5 discusses the major conclusions and remarks.

2. State of Literature

As a tool for energy systems analysis, system dynamics (SD) has been used for more than 30 years [10]. The SD approach is suitable for modeling complex environments, such as ecosystems and human activities, on a muti-dimensional scope with time-dependent variables [11]. The SD modelling helps more clearly demonstrate the interactions of the environment and socio-economic variables, and also helps to identify the key factors that significantly alter a dynamic system. The original work that used system dynamics models in energy discussions traced back to Naill who modeled the process of natural gas discovery and production in the United States gas industry [12], originally advocated by Forrester [13]. Then, SD has a wide application in the energy field. After that, Naill developed the COAL1 and COAL2 models which eventually led to the FOSSIL1 model, which became the mainstream model for energy policy evaluation in the United states [14,15]. Following the same path, the use of SD methodology for the understanding of complex energy systems has increased significantly. Sterman was involved in the conversion of FOSSIL1 to FOSSIL2, a model that includes feedback from within the economy and energy system [16,17]. The SD modelling approach is very popular in literature on the energy sector and it has also been applied to many countries, such as the United States, UK, Argentine and so on [18,19,20,21]. Based on the life cycle of the petroleum resource, Davidsen et al. presented an SD model to show the interactions and feedback process of the petroleum industry in the United States [18]. Bodger showed that the SD model was also applicable to a small country where specific energy resources are available [20]. Chia et al. developed a system dynamics model to study the complex issues involving nuclear energy development in Singapore by evaluating four critical aspects, namely environmental, economic, political and social factors in various scenarios [21]. The SD modeling approach can be used to systematically model the oil and gas industry, and to conduct a scenario analysis and uncertainty analysis according to possible changes [22,23,24]. Chowdhurg et al. used the system dynamics model to study the long-term dynamic behavior of the oil and gas exploration and exploitation industry in India. The expected behavior of the model has been analyzed under different conditions [23]. Kiani and Amiri demonstrated a system dynamics model which analyzed the feedback between supply, demand and oil revenue of the energy system in Iran, simulating different sectors of the economy [24].
For the Chinese energy–environment system specifically, some SD models were newly developed during the 2000s. For example, some SD energy models were proposed to investigate the issues associated with resource development. Fan et al. analyzed the Chinese coal industry structure based on the SD model by regarding the coal production system as a huge system [25]. Li et al. developed a system dynamics model to forecast the future natural gas demand in China [7]. Feng, Chen and Zhang developed a similar model to study the energy consumption and CO2 emission tendencies in Beijing city from 2005 to 2030 [26]. Xu et al. identify the main uncertainty factors that affect industry planning using a rough set approach, a dynamic system and multiple-objective-programming approaches [27]. Wu et al. (2015) built a system dynamics model to point out various trends of the Chinese shale gas sector under different scenarios, which shows that technology, policy and cost factors have combined effects on market competitiveness [5]. At last, the simulations reveal that the number of competitors in the Chinese SG industry will peak from 2019 to 2020.
As a review of the research on the dynamic model of the natural gas industry, the present paper develops a system dynamics model to analyze the factors influencing upstream behaviour. Our research has substantially developed a broader model to assess the effect of policy, technology, and capital cost factors on the revolution in the natural gas industry. The results and remarks will be useful for government to reform policies, and for gas producers to make investment decisions.

3. SD Model of Upstream Natural Gas Investment

As we are interested in general energy system behavior, the model presumes that the Chinese natural gas industry has one monopoly firm exploring and producing homogeneous natural gas. In reality, the upstream activities are conducted by nationally owned companies. This assumption is similar to the work by Naill [12] and Sterman et al. [17]. The upstreaming activities are modeled based on the total life-cycle which is comprised of exploration, development and production phases. The study takes the case of China Petroleum Chemical Corporation (CPCC) as an example. It is also the first time that an SD model is established that shows the exploration and production process of the upper part of natural gas in China. The system dynamics model involves a total of 56 variables, six flow-bit variables, 49 auxiliary variables, and one hidden variable. First, this paper gives bit variables initial convections: total resources for 2531.18 × 108 m3, sales of the initial value for 1.01 billion parties, and the capital cost ratio for 5.5%. Most of the other relationships between variables are established through fitting, regression, table functions and other forms. Based on the analysis of economic relations, regression relationships between variables are established by the least squares or partial least squares method. The determination of table function is more complex. Most of them are obtained mainly through the conclusions of literature, expertise and continuous simulation adjustment.

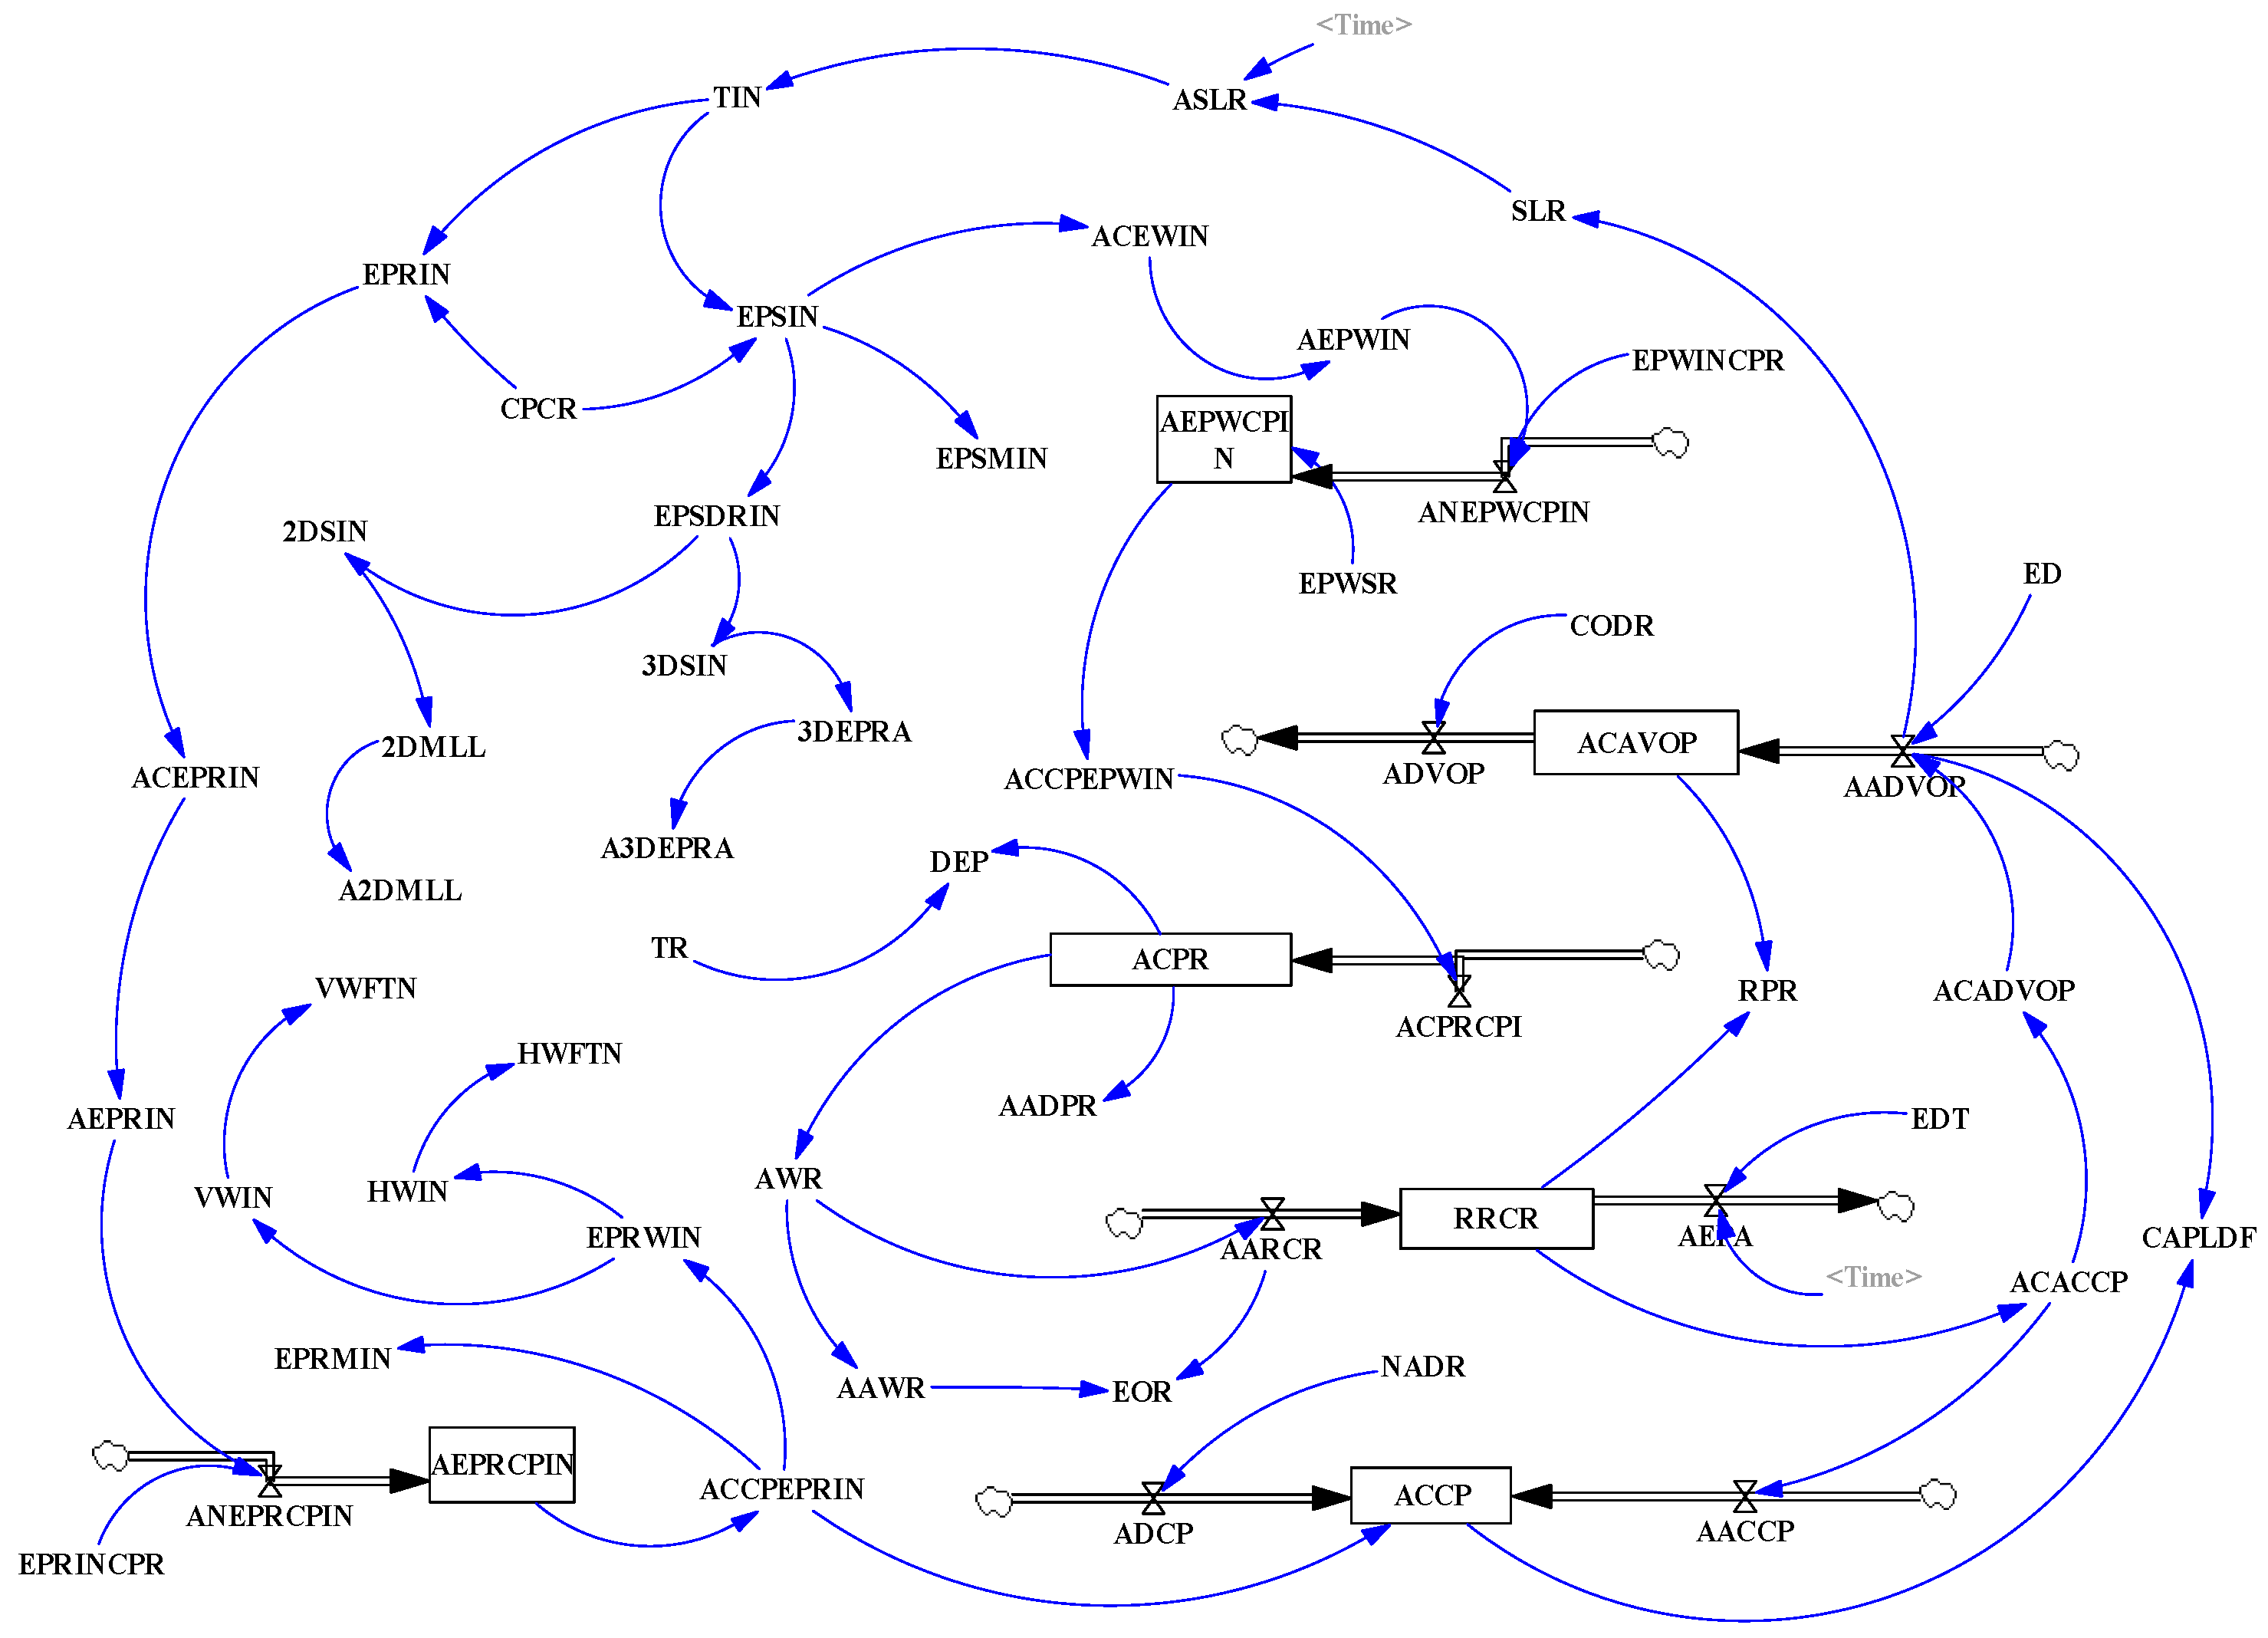
3.1. Establishment of the System Flow Diagrams

Natural gas upstream activities, including investment, exploitation and production are handled by large state-owned companies in China. Exploration activities involve investment decisions to undertake resource survey and assessment. Exploitation activity involves extraction from a reservoir and development by drilling. Production activity involves the production process of gas using the optimal control technique.
In this paper, the established natural gas system dynamics model can clearly reveal all kinds of production process aspects of gas company exploration and development, and the relationship between production process input factors and output factors. The system dynamics model is a combination of qualitative and quantitative methods; the most prominent feature of this method is its ability to handle non-linear, high-level, multiple feedback, complex time-varying system problems. China’s upstream gas companies often have insufficient data. In this situation, the system dynamics (SD) model can be used to carry out the calculation and research. In the exploration links, the investment includes direct investment and indirect investment. Direct investment includes investment in geophysical and exploratory wells and geophysical investment also includes two-dimensional and three-dimensional seismic earthquakes. All of these investments form the final output-proved reserves. Proved reserves have a direct impact on the development aspects of the inputs and outputs, and ultimately have a direct impact on sales. Therefore, all these critical nodes are mutually influential interactions.
The system is described diagrammatically in Figure 1. Then, we deconstruct the natural gas system into three subsystems.

3.2. Decomposition Analysis of SD Model

The internal subsystems of natural gas exploitation and exploration are analyzed in detail to build up the natural gas SD model. The parameters and their connotations are explained in Table 1. The model constructed in this paper includes three subsystems: investment subsystem, exploration subsystem and production subsystem. The investment subsystem is the driving link for the exploration and production of the natural gas upstream sector. The exploration subsystem is the material basis for the sustainable development of upstream natural gas enterprises, and also the basis for raising production. The production subsystem is the product value-added system.

3.2.1. Investment Subsystem

When the model is first being created, it is assumed that the main symbol identifying the model structure was its capacity of production. Converting the stock-flow diagram into a casual loop diagram allows a better understanding of the nature of the interaction between installed capacity and investment and depreciation flows. Therefore, the model was identified as two stocks: the total assets value of the natural gas industry and the depreciation of the facilities over time [28]. Assets value is increased by the company’s decision to order new capital and is decreased by its depreciation. Economic depreciation refers to the actual wearing out of the asset, as reflected in changes in the asset’s value over time. Each of the stocks was linked with two flows: an inflow and an outflow.
Major feedback loops in the investment subsystem include: Total investment → + Accumulative investment → − Capital depreciation → + Capitalized exploitation/development investment.
Based on the above analysis, it is assumed that the capacity of natural gas assets is influenced by two factors: the amount of investment and the depreciation of the equipment over time. The total capacity increases if the investment flow increases. Thus, the interaction between the investment flow and the natural gas assets’ depreciation forms a reinforcing loop that characterizes an exponentially growing systems structure. However, the larger the natural gas assets, the larger the depreciations.
The annual accounting depreciation method is estimated by deducting the salvage value of the end-of-life equipment (SV) from the capital cost base, i.e., the depreciable capital investment (DC), and dividing the value by the accounted years of depreciation (N) of the asset:
d n = ( D C S V N ) / N
d n means the annual depreciation subtraction in year n . The main equations in this subsystem are:
T I N = E P S I N + E P R I N E P S I N = ( 0.1632 × T I N ) × ( 1 C P C R ) E P R I N = ( 0.8368 × T I N ) × ( 1 C P C R )

3.2.2. Exploration Subsystem

As reported, there are mainly three types of resources in Chinese official statistics. These are the prospective resources, geological resources and proved resources [9]. Prospective resources are undiscovered but are assumed to be technically and economically recovered through geological estimations. In the case that the prospective resources are proven via exploration drilling activities, they will be transferred to geological resources if they are technically recovered but uneconomic, and they can become undeveloped reserves immediately. Relying on fluctuations in gas price, some reserves may become uneconomic to develop, or some economic to develop. Although they are economically recoverable, undeveloped reserves are used for recovery only when they are ready for production within the construction of production wells, and then become proven resources. The production rate is devised as the percentage of annual demand for gas and developed reserves, with the assumption that there is no capacity restriction on the production process.
Major feedback loops in the exploration subsystem include:
  • Exploration investment → + Two-dimensional seismic investment and Three-dimensional seismic investment → + Annual incremental proved reserve → + Annual incremental recoverable reserve → − Remaining recoverable reserve → + Annuity volume of production → + Total investment → + Exploration investment
  • Exploration investment → + Annuity incremental successful exploration well investment → + Annual incremental proved reserve → + Accumulative workable reserve → + Annuity volume of production → + Total investment → + Exploration investment
The loop explains exploratory activity and reserves additions as a result of investment, which is activated by capital cost. The following formula shows that the construction and operating costs play a critical role in determining the mix of capacity that will serve future demand for natural gas.
P V = C ( 1 + r ) t
P V is the present value of capital; C is the capital stock amount in each period(Year); and r is the discount rate, t is the investment period.
The other equations are as follows:
A E P W C P I N = A E P W I N × E P W I N C P R E P R I N = E P S D R I N + E P S M I N + E P S O I N E D = A C P R ÷ T R A N E P R C P I N = A E P R I N × E P R I N C P R A E P A = R R C R × R P P R R C R = A C P R + A A D P R A V O R A V O R = R R C R × E D E D = 50 %

3.2.3. Production Subsystem

Besides the aggregate investment-depreciation cycle and the investment-driven exploration diagram of the model, the input of construction investments for an exploration well will also lead to the formation of the production capacity.
The production capacity expands when new production wells are available, whilst it decreases when present wells are attenuated or old wells are scrapped. Its economic value is potentially influenced by specific intervention measures, such as regulations and certain policies.
The production capacity of natural gas requires drilling a higher number of wells due to the low recovery rate per-well in Orados basin. The allocation structure with wells enables the inclusion of the uncertainties issues in the model more explicitly. The objectives of this structure were exploration wells that result in an improved discovery rate and are beneficial in inducing effective production wells or stimulating the construction of new wells.
Similarly, major feedback loops in the production subsystem include: Exploitation investment → + Annual exploitation investment → + Exploitation well investment → + Well footage → + Annual production capacity → + Accumulative production capacity → + Annual production → + Sale → + Total investment
The production subsystem differs from others in terms of production techniques, demand signal and production technology, especially related to recovery degree. The main equations in this subsystem are:
A C A V O P = A A D V O P A D V O P C O D R = 16 % A C C P = 2 × 10 5 × ( A C C P E P R I N A E P R C P I N ) + A A C C P A D C P A V O P = A C C P × C A P L D F C A P L D F = 0.9

4. Simulation Results and Analysis

4.1. Model Testing

This part is going to examine how the model explains the basic features of gas exploitation and exploration in China. In other words, it is necessary to check out whether the model dynamically reflects the reliability and is valid for the variables, and to what extent the model fits the actual data.
Three key variables—total investment, proved reserves and production capability—are taken as examples. The comparisons between simulated values and historical observations of the variables are listed in Table 2, Table 3 and Table 4. Obviously, the error between the simulation value (from 2006 to 2013) and historical data vary from 1% to 8%, indicating that the model could be used for analysis in the case of the natural gas system.

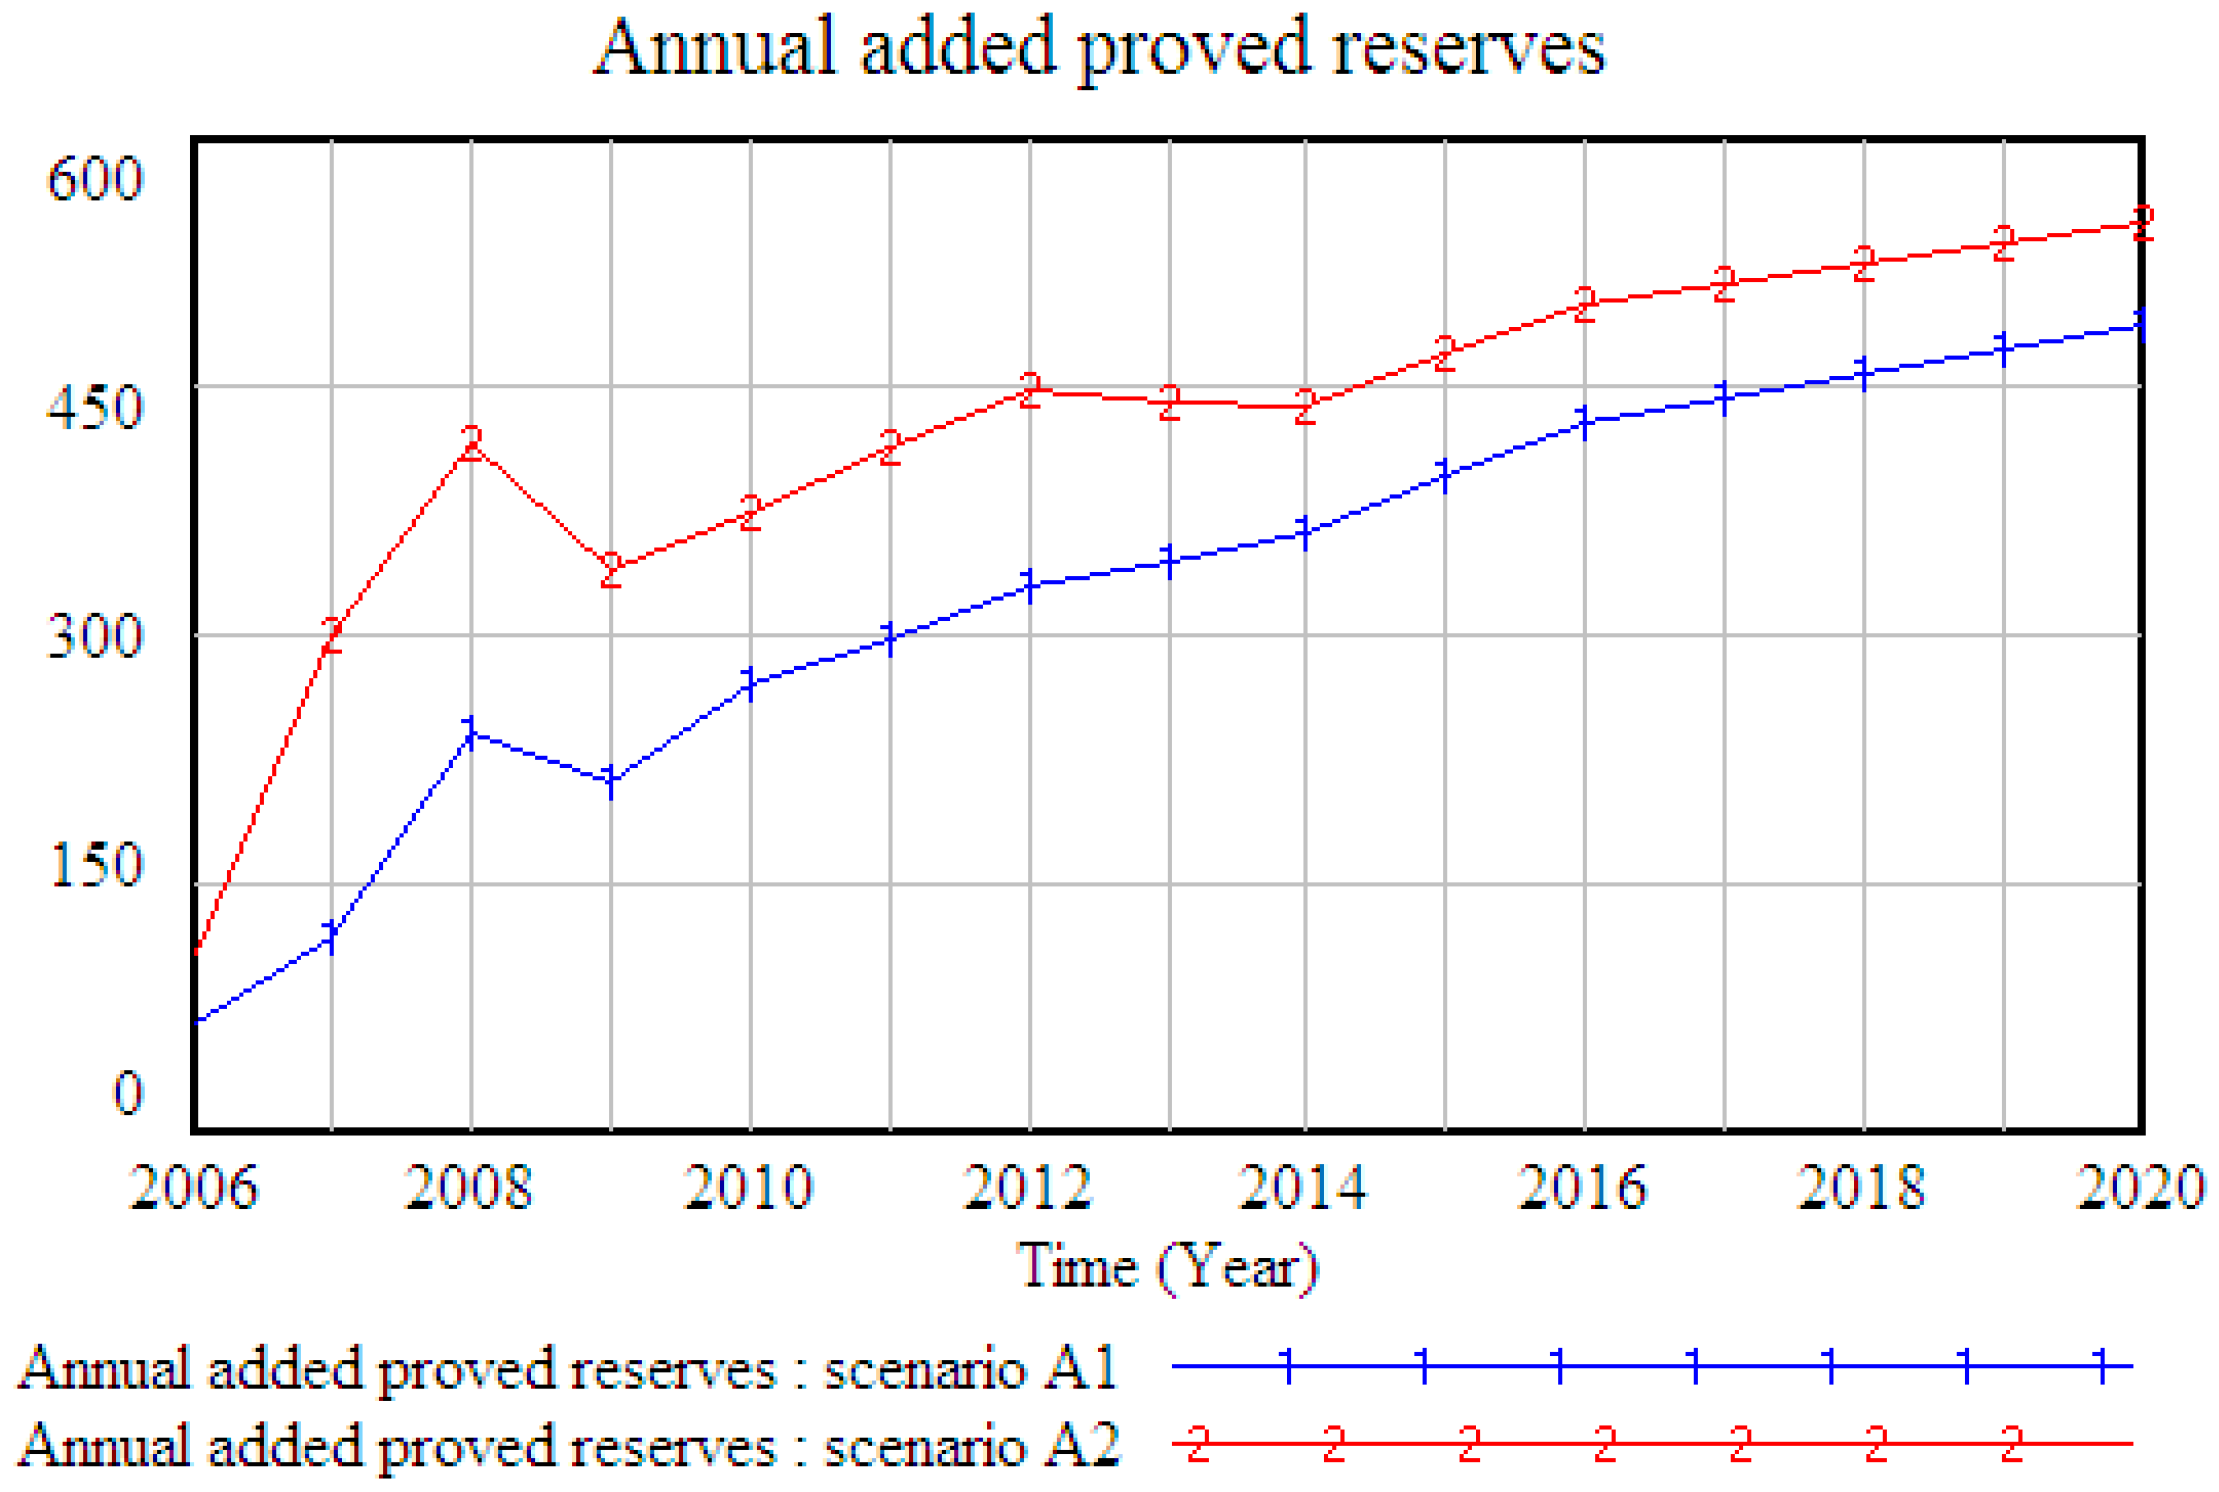
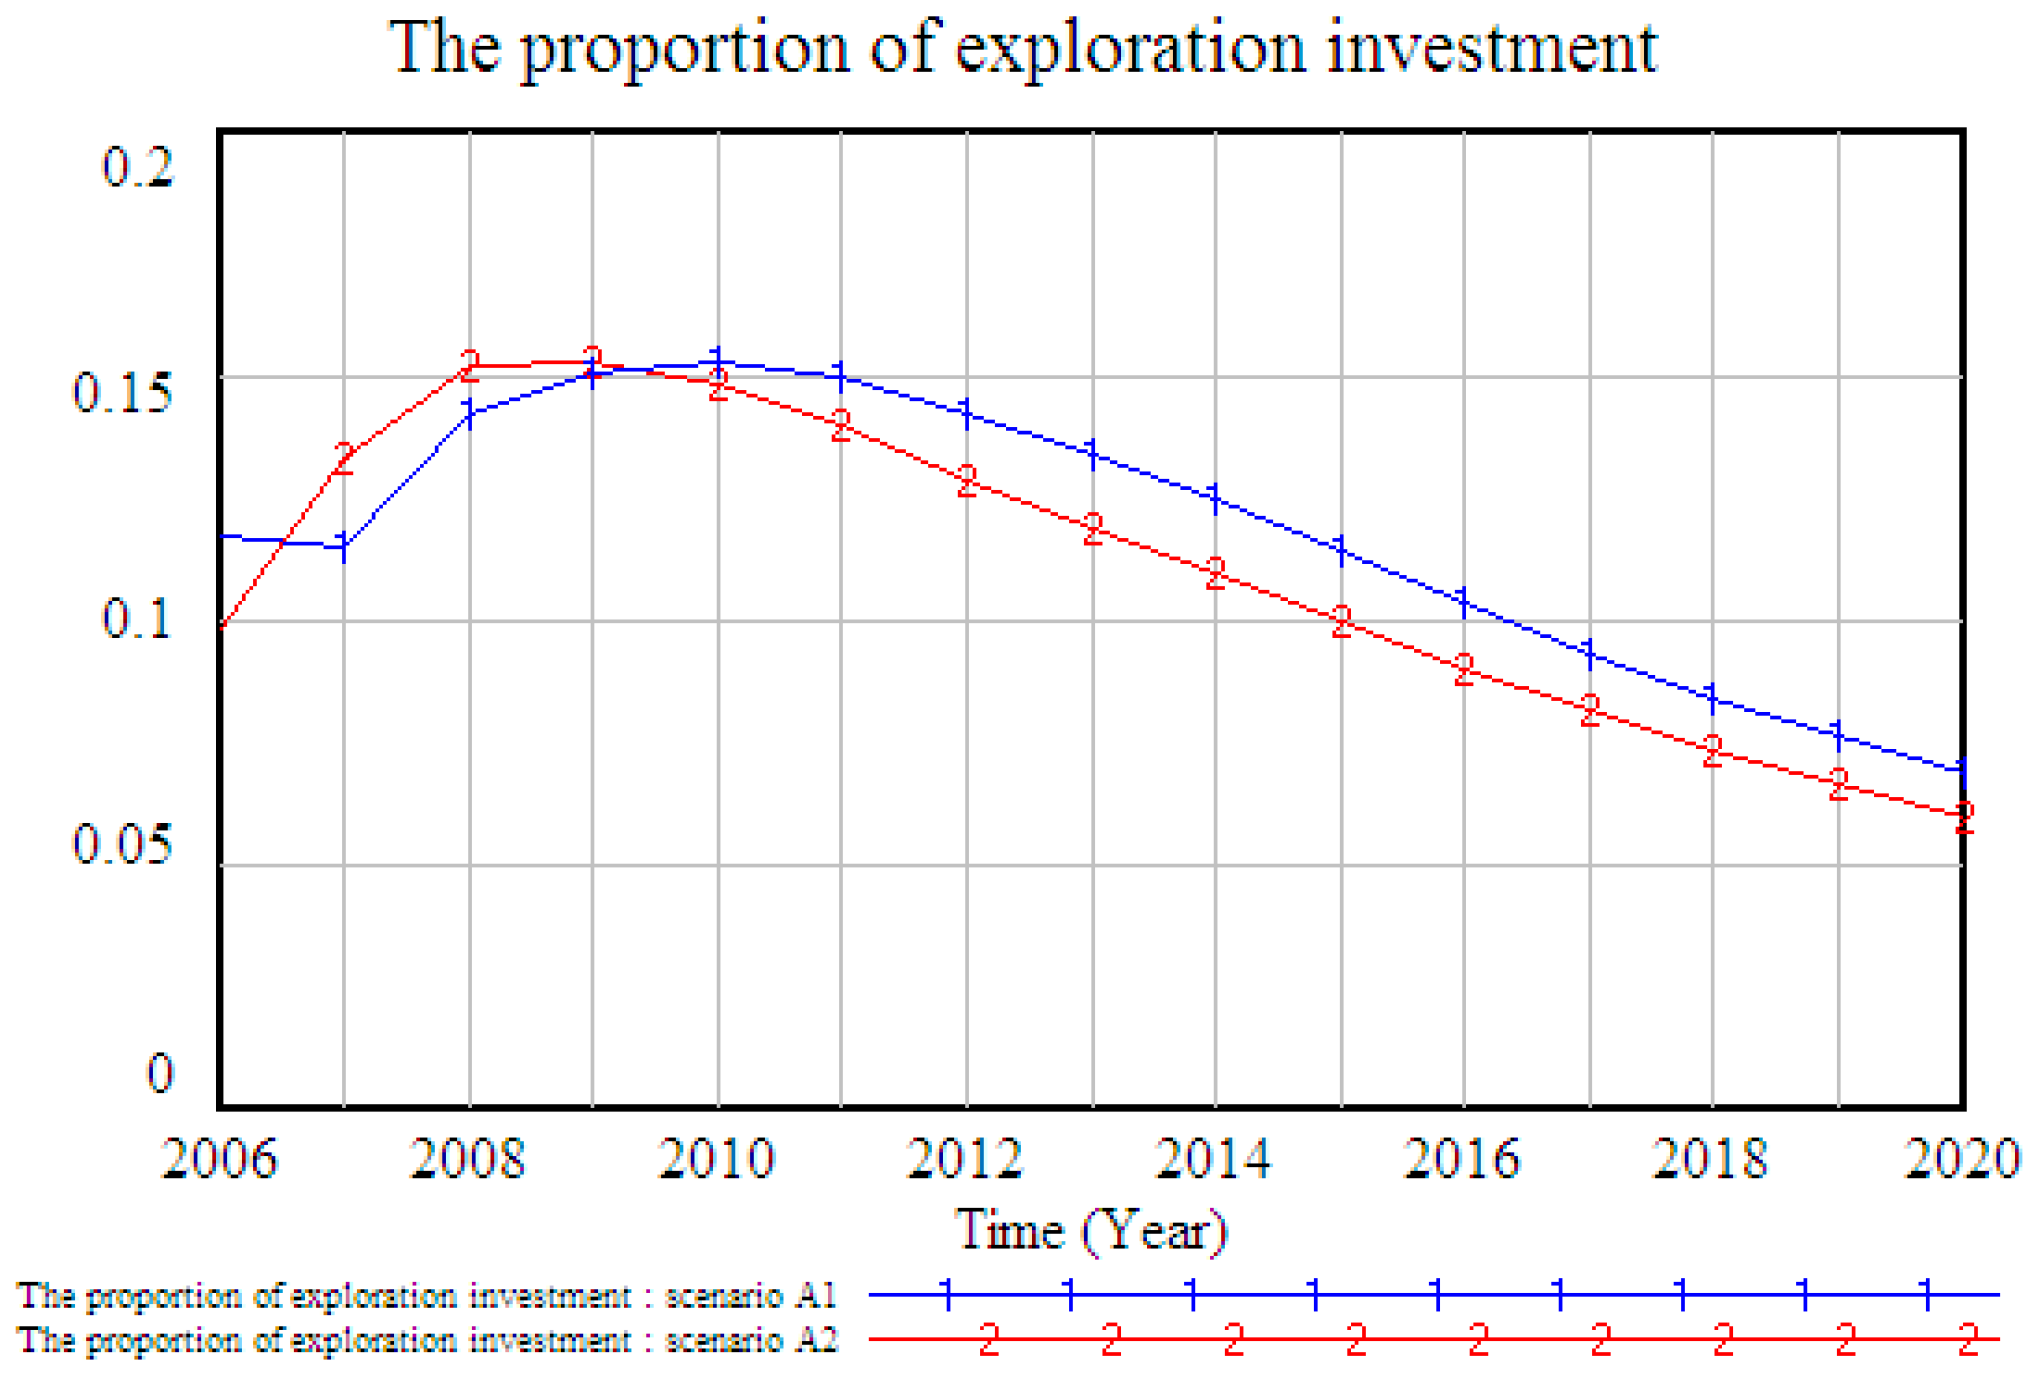
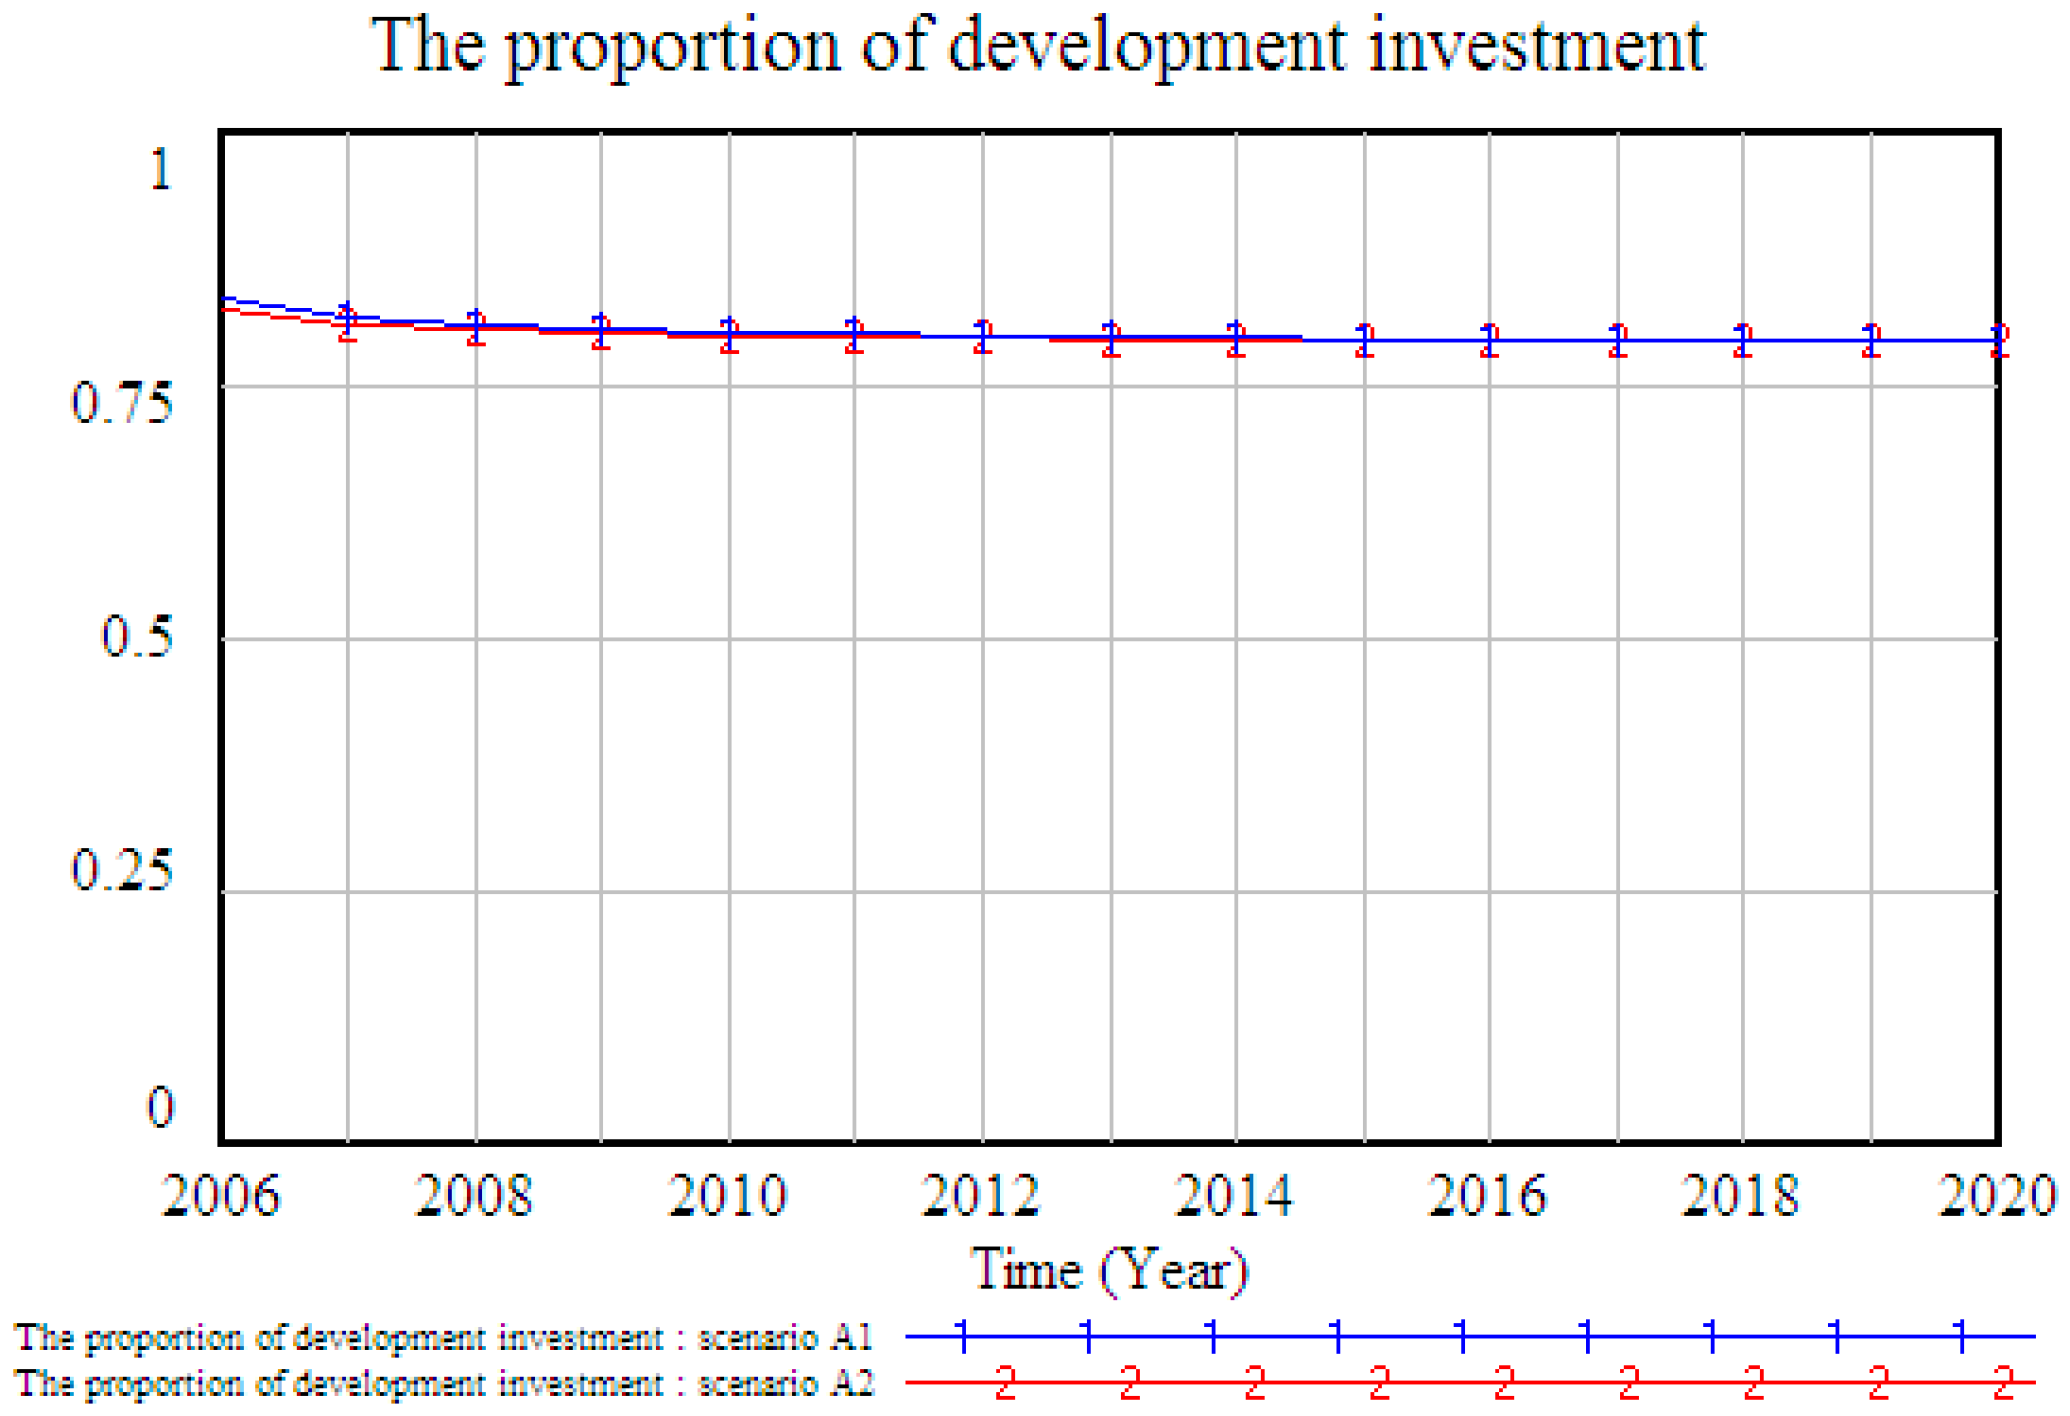
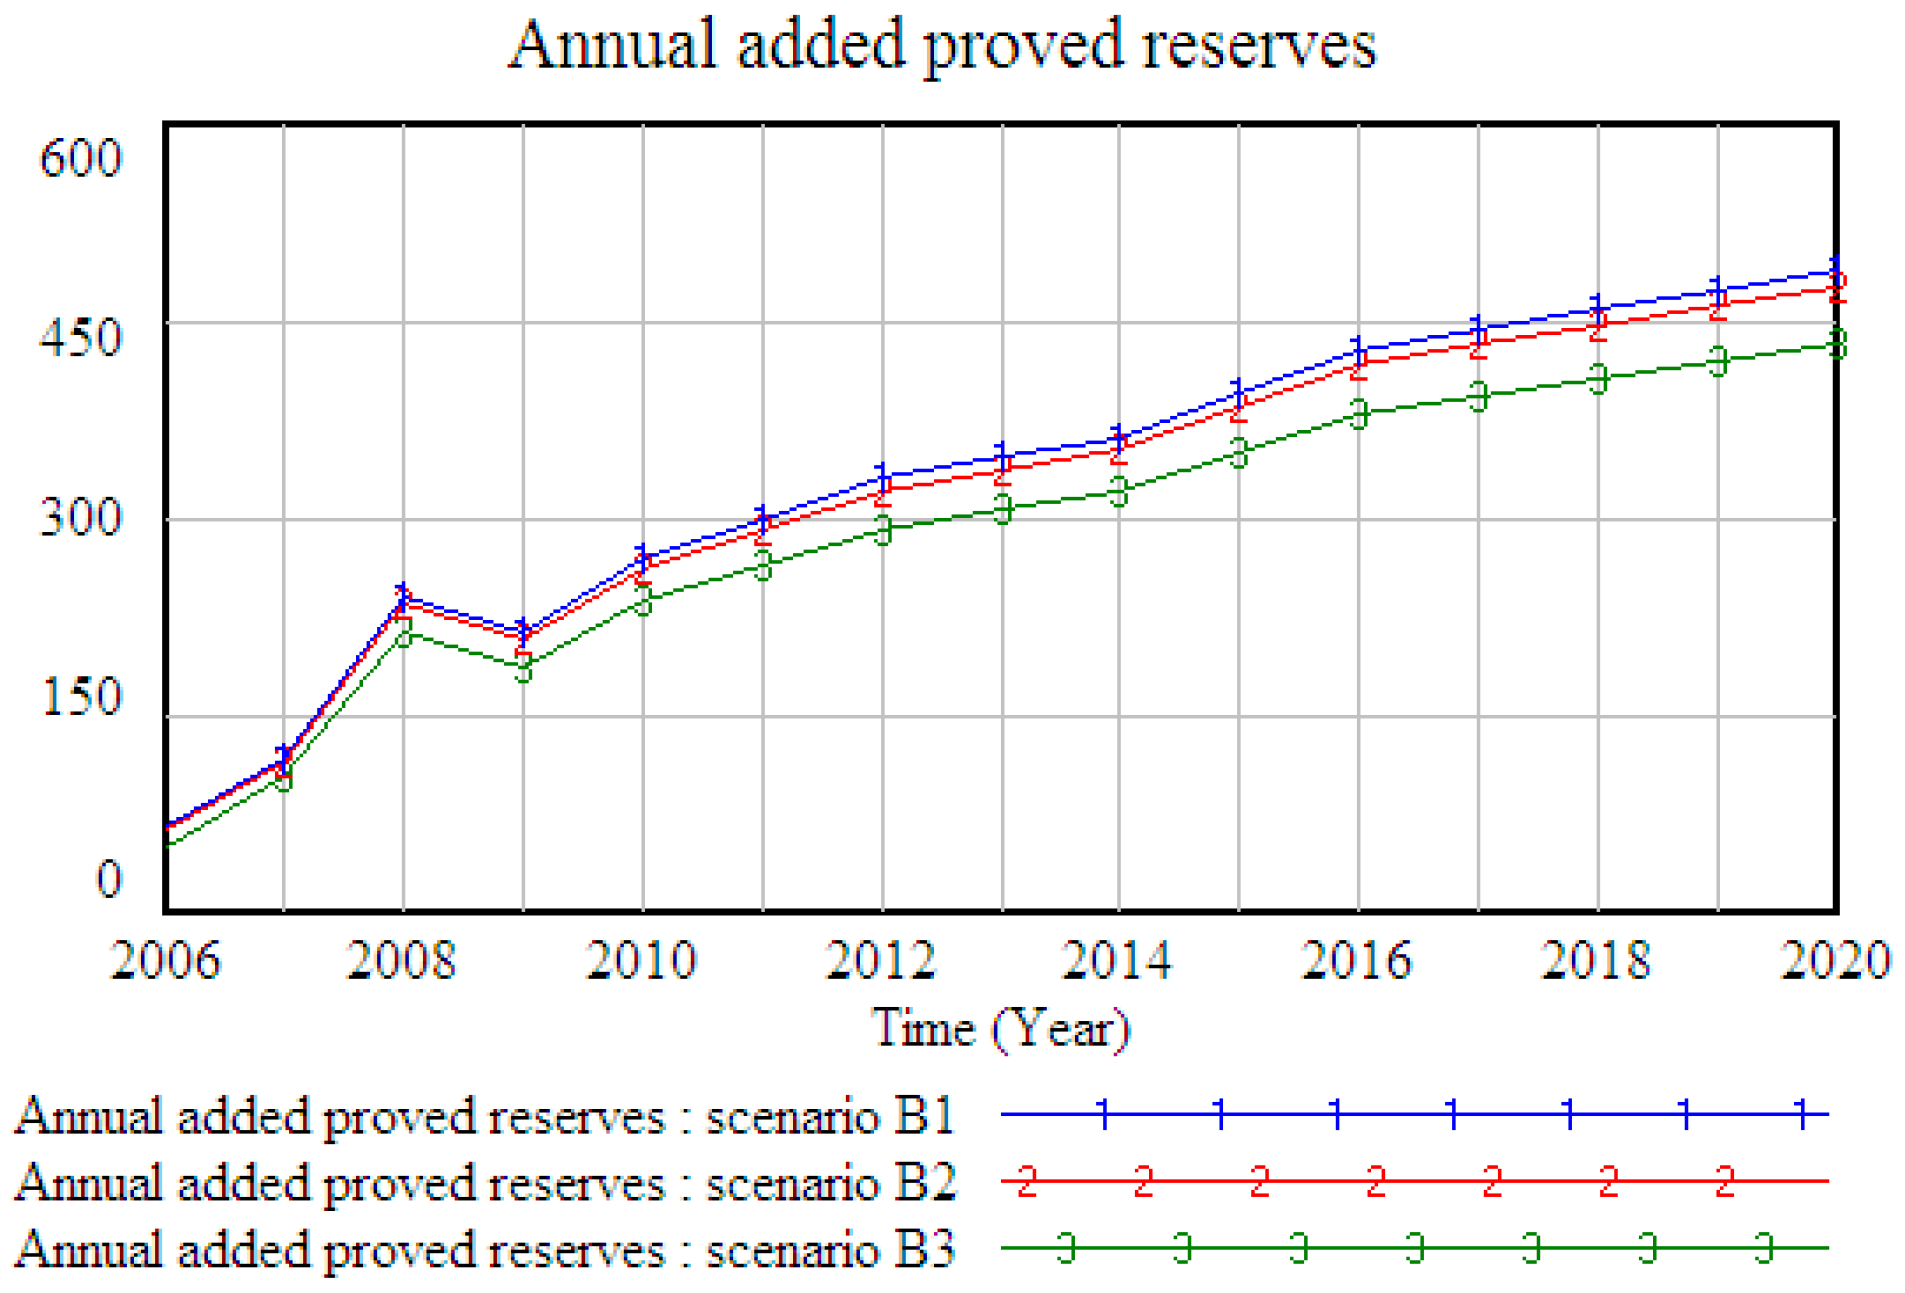
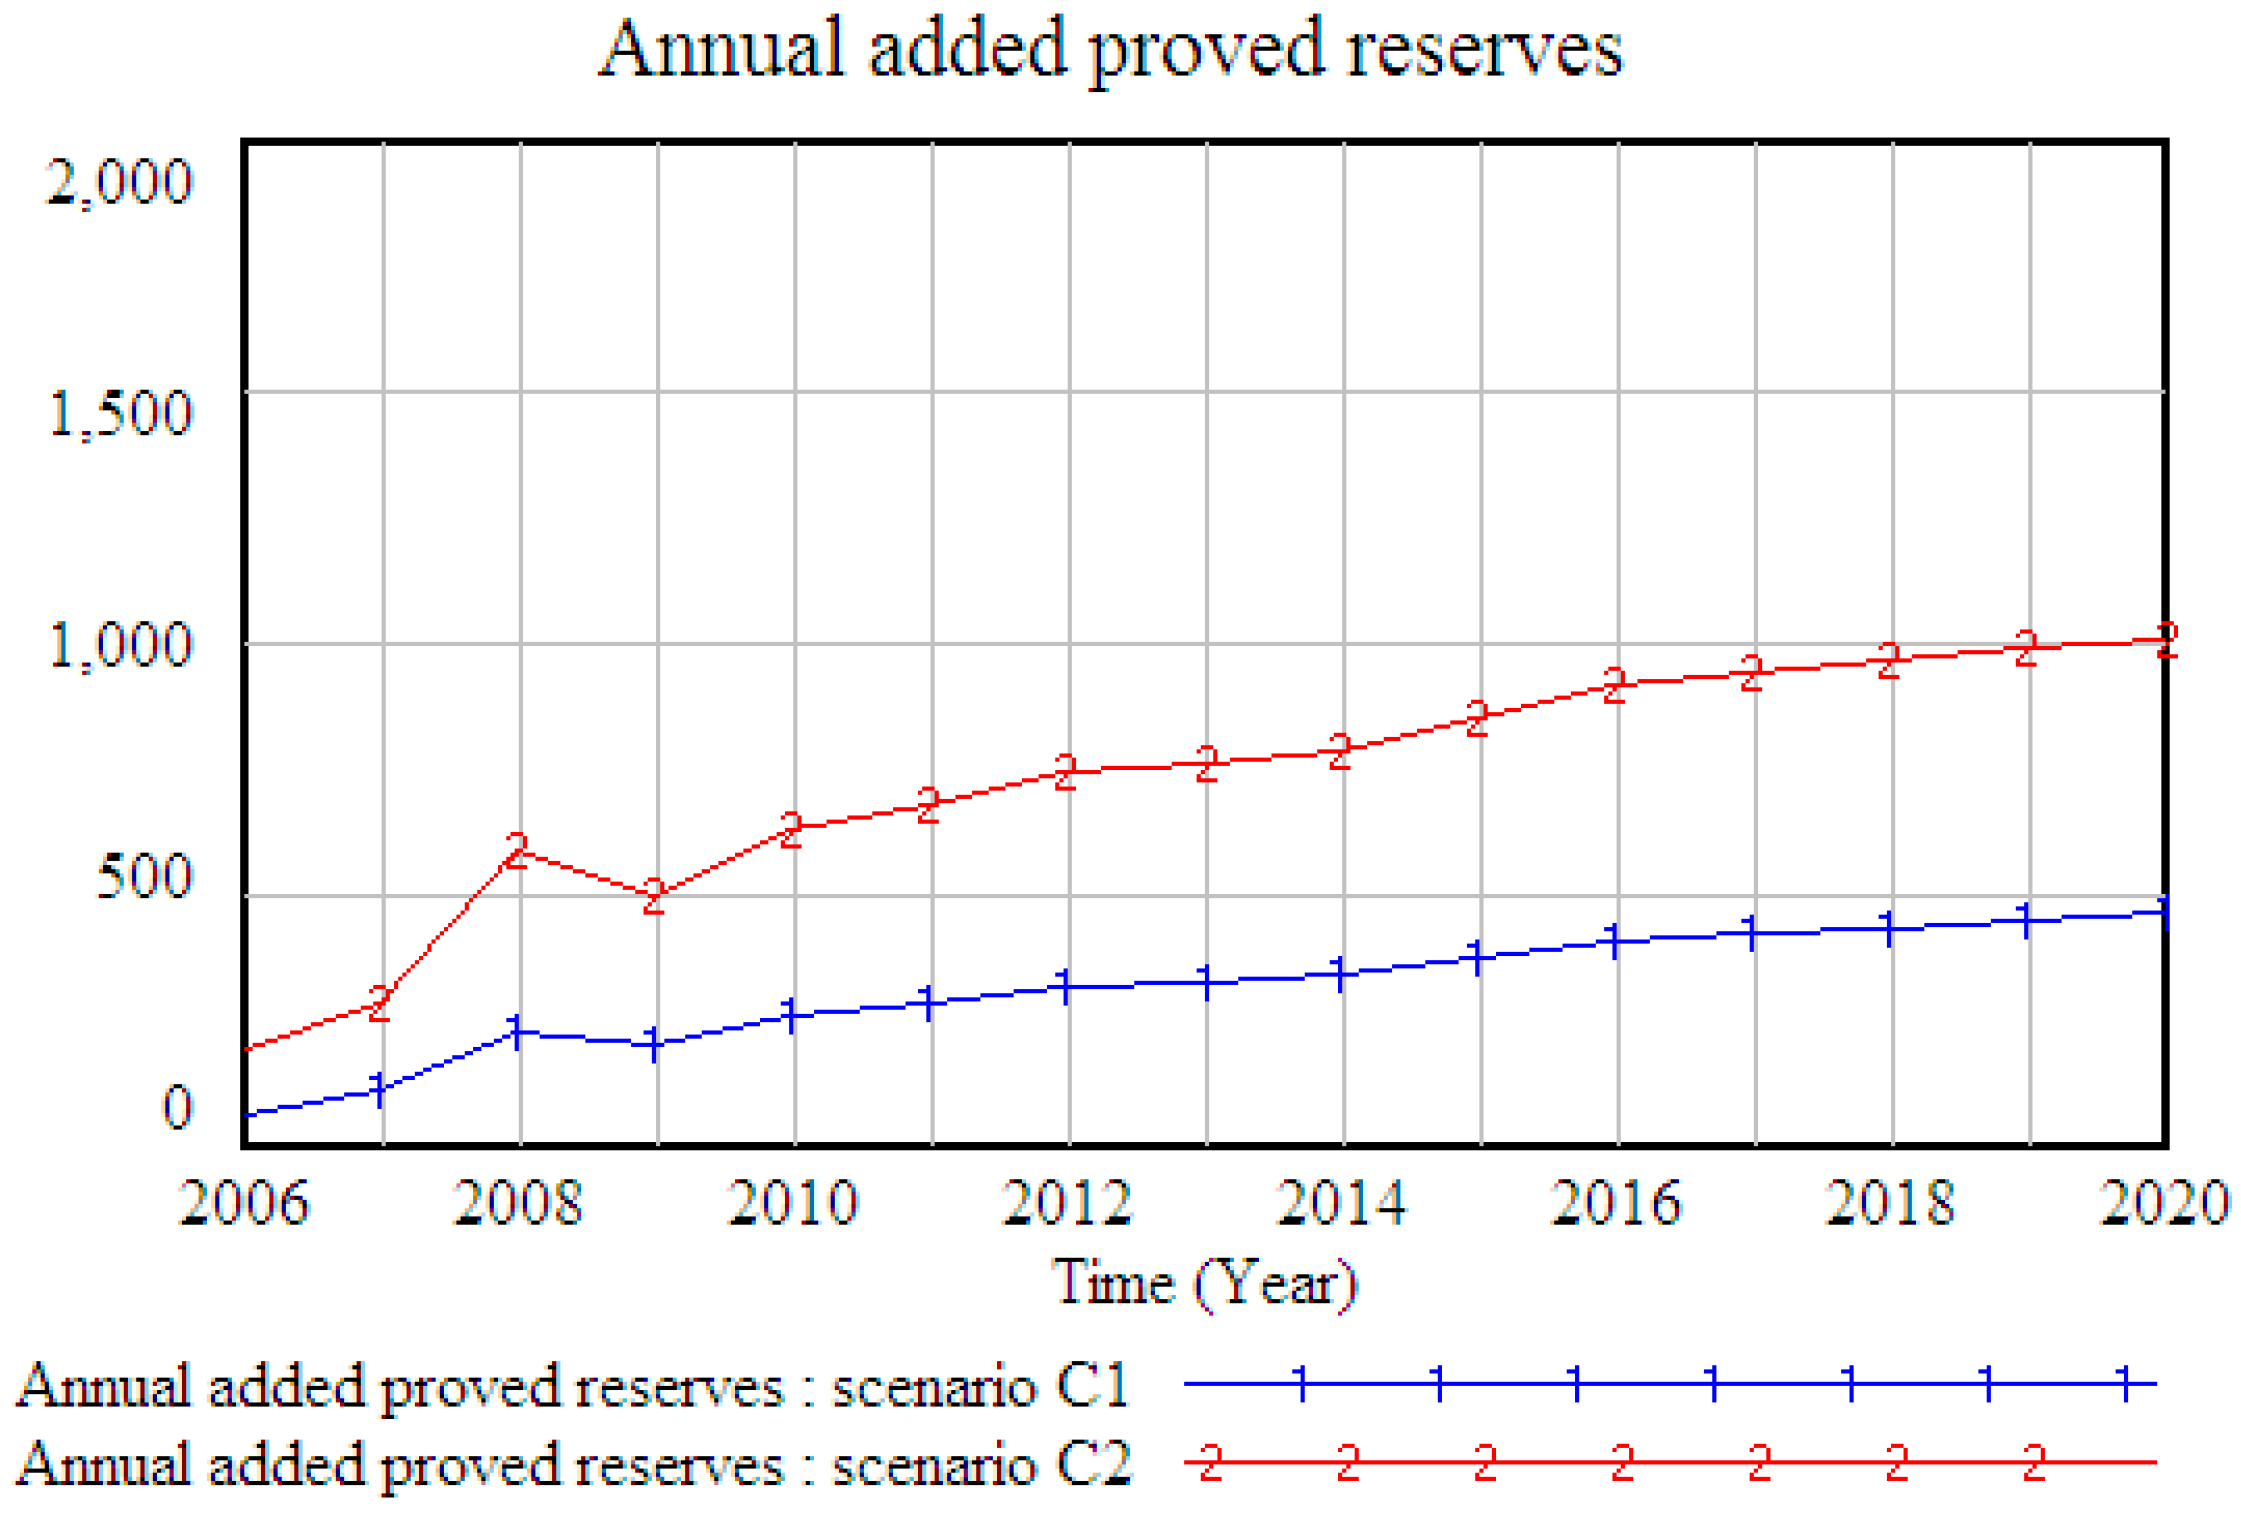
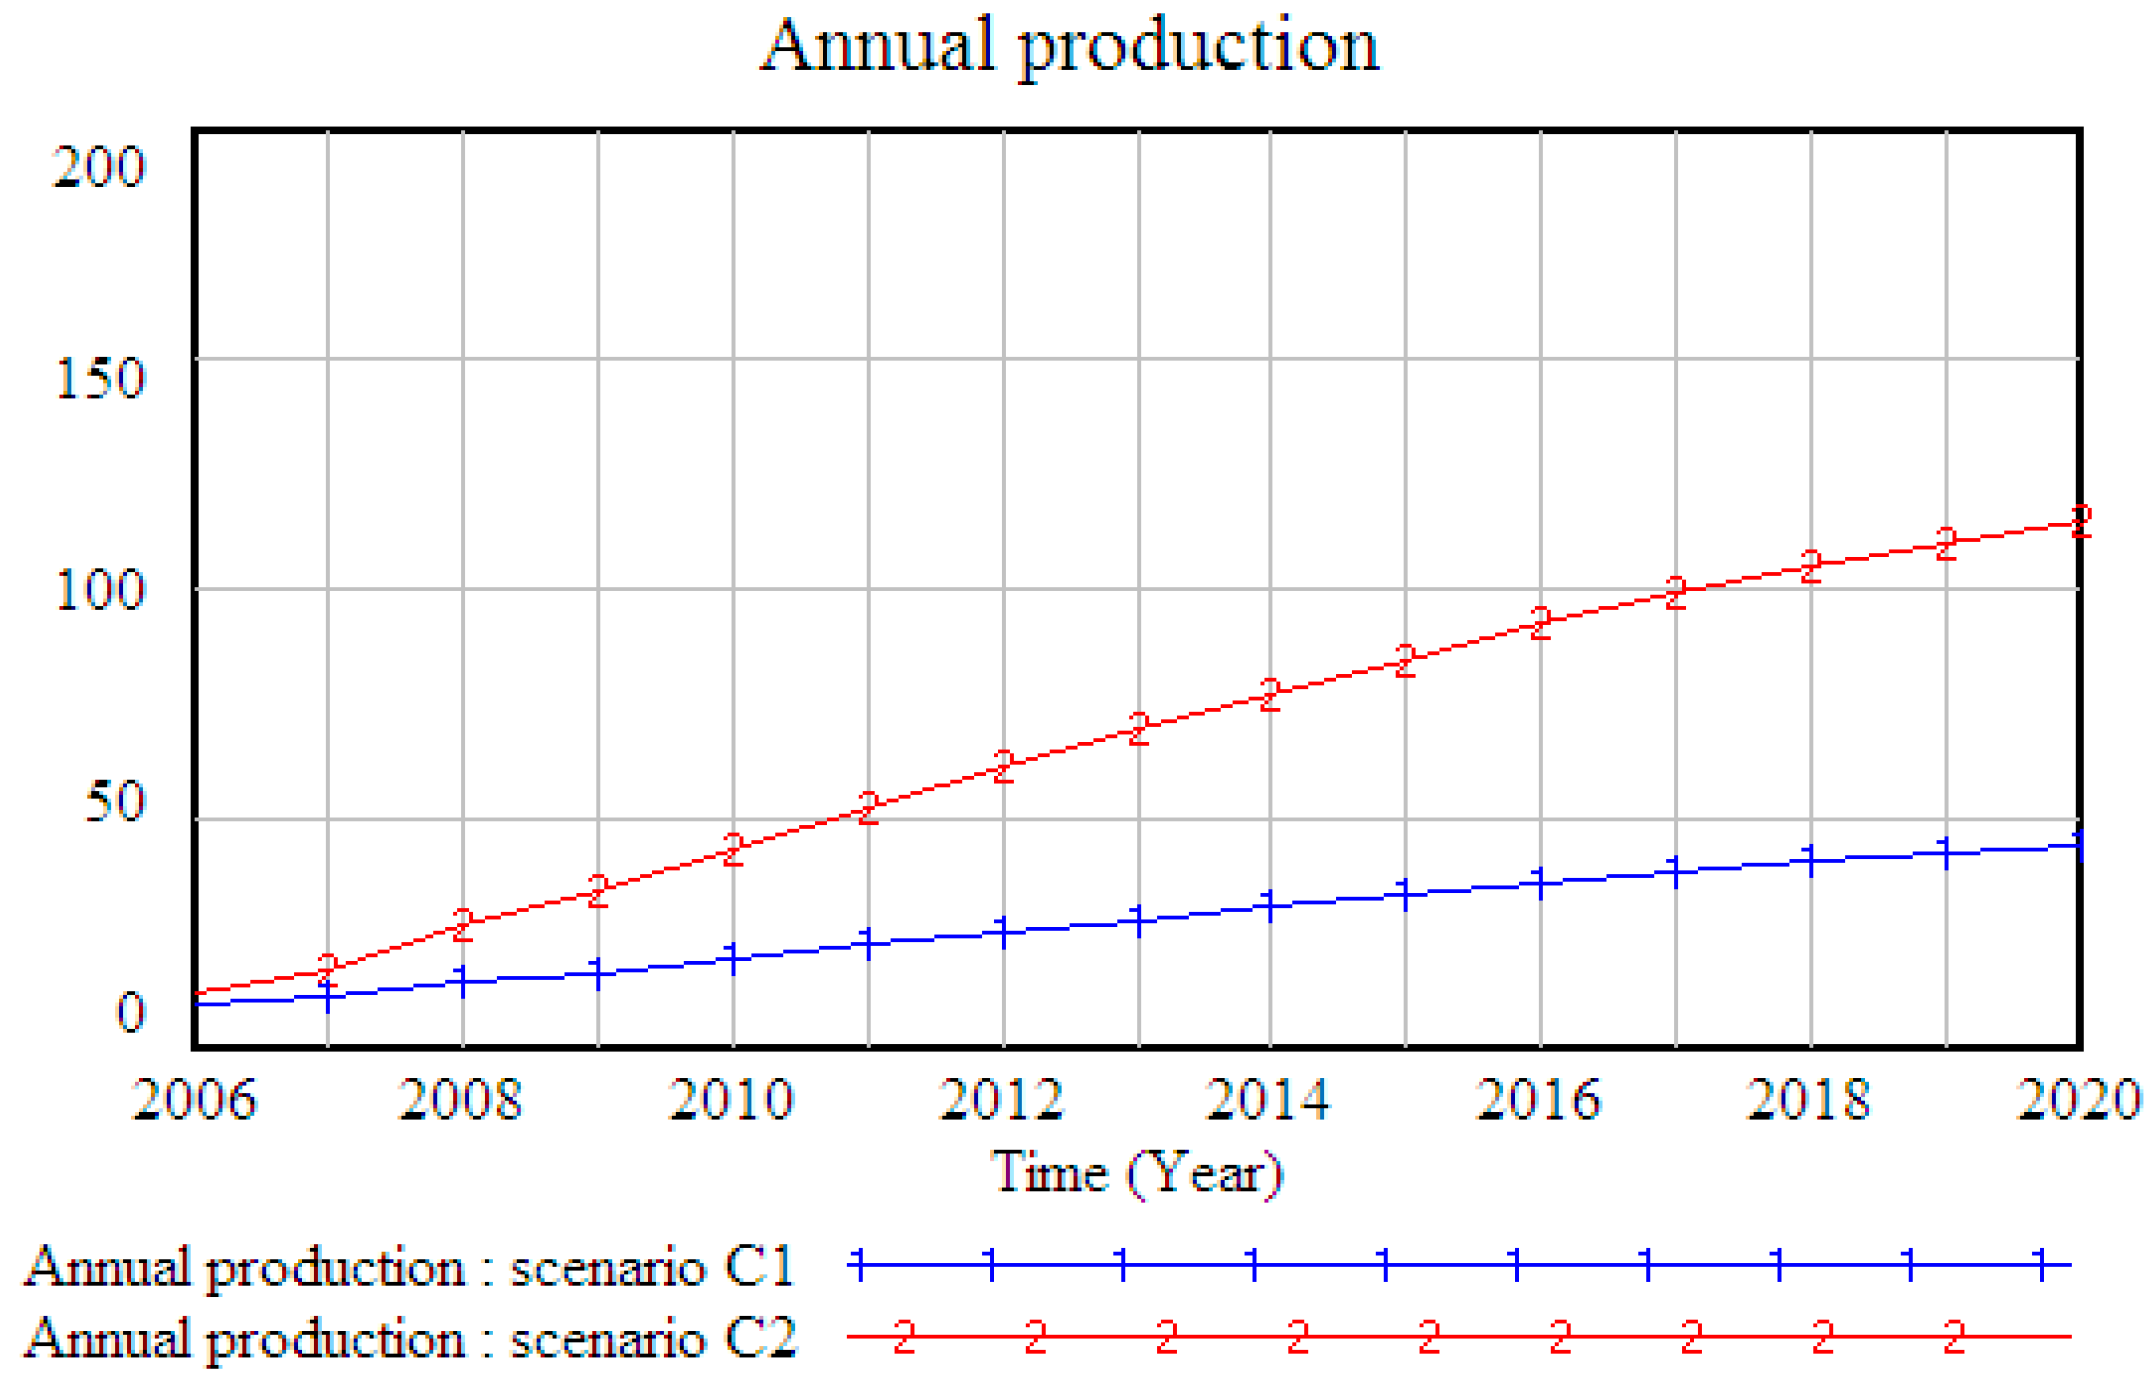
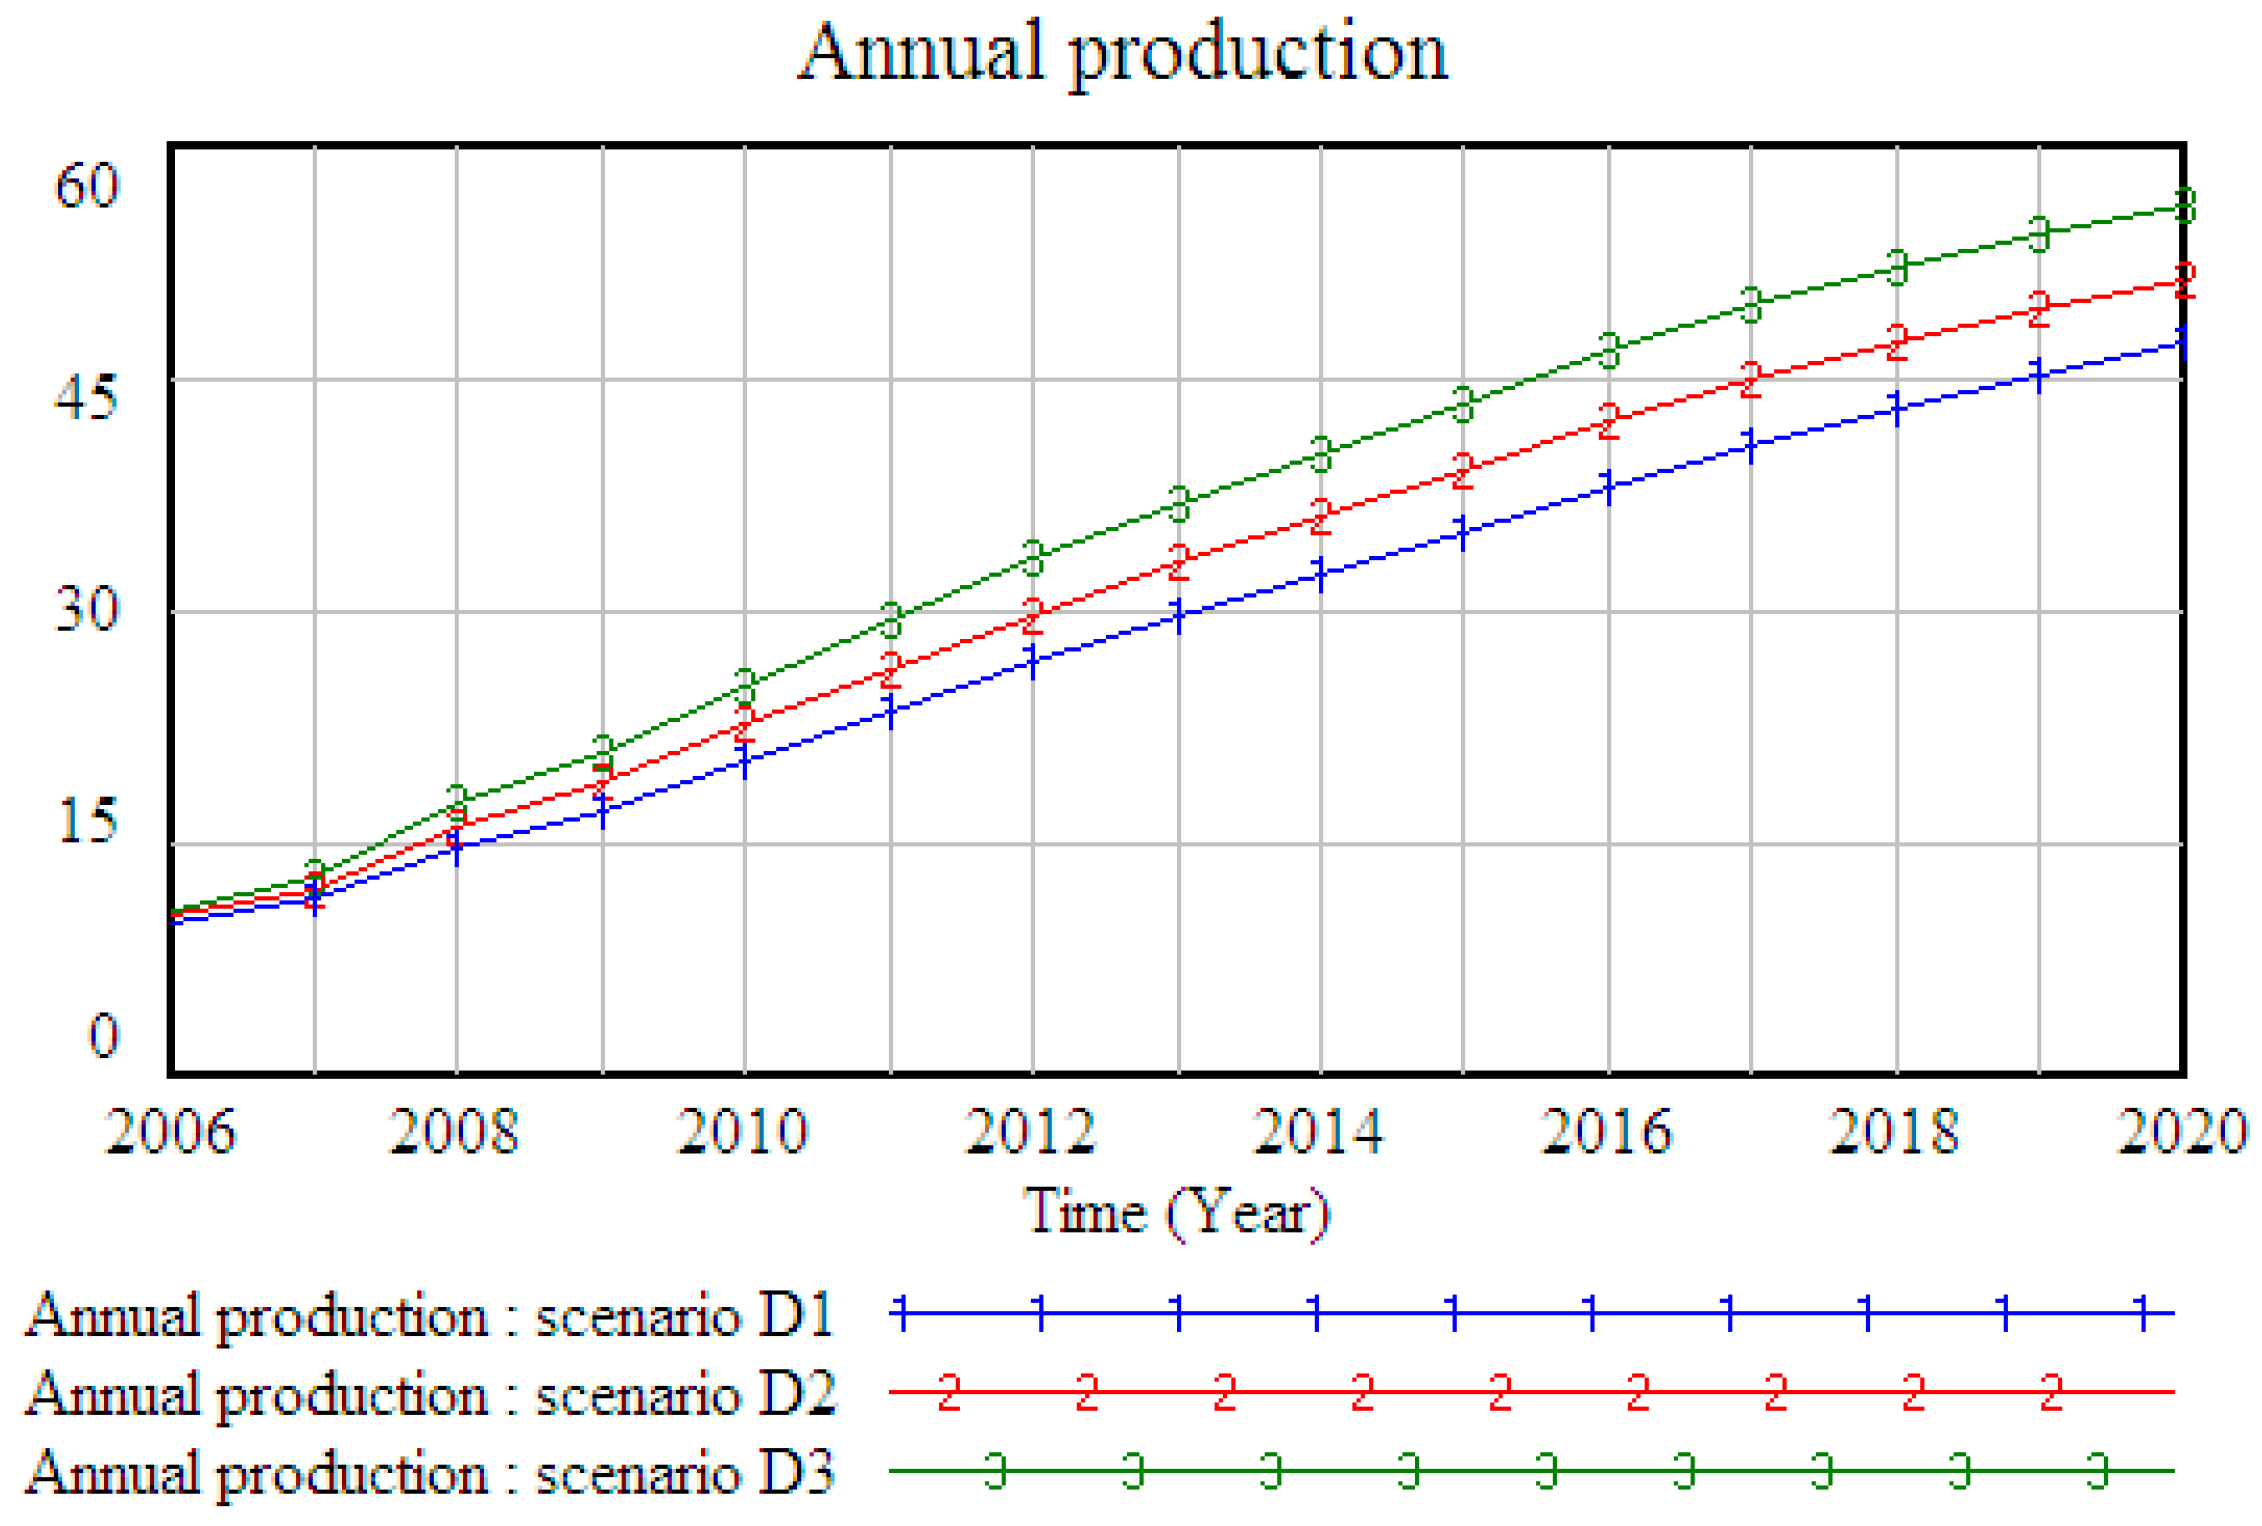
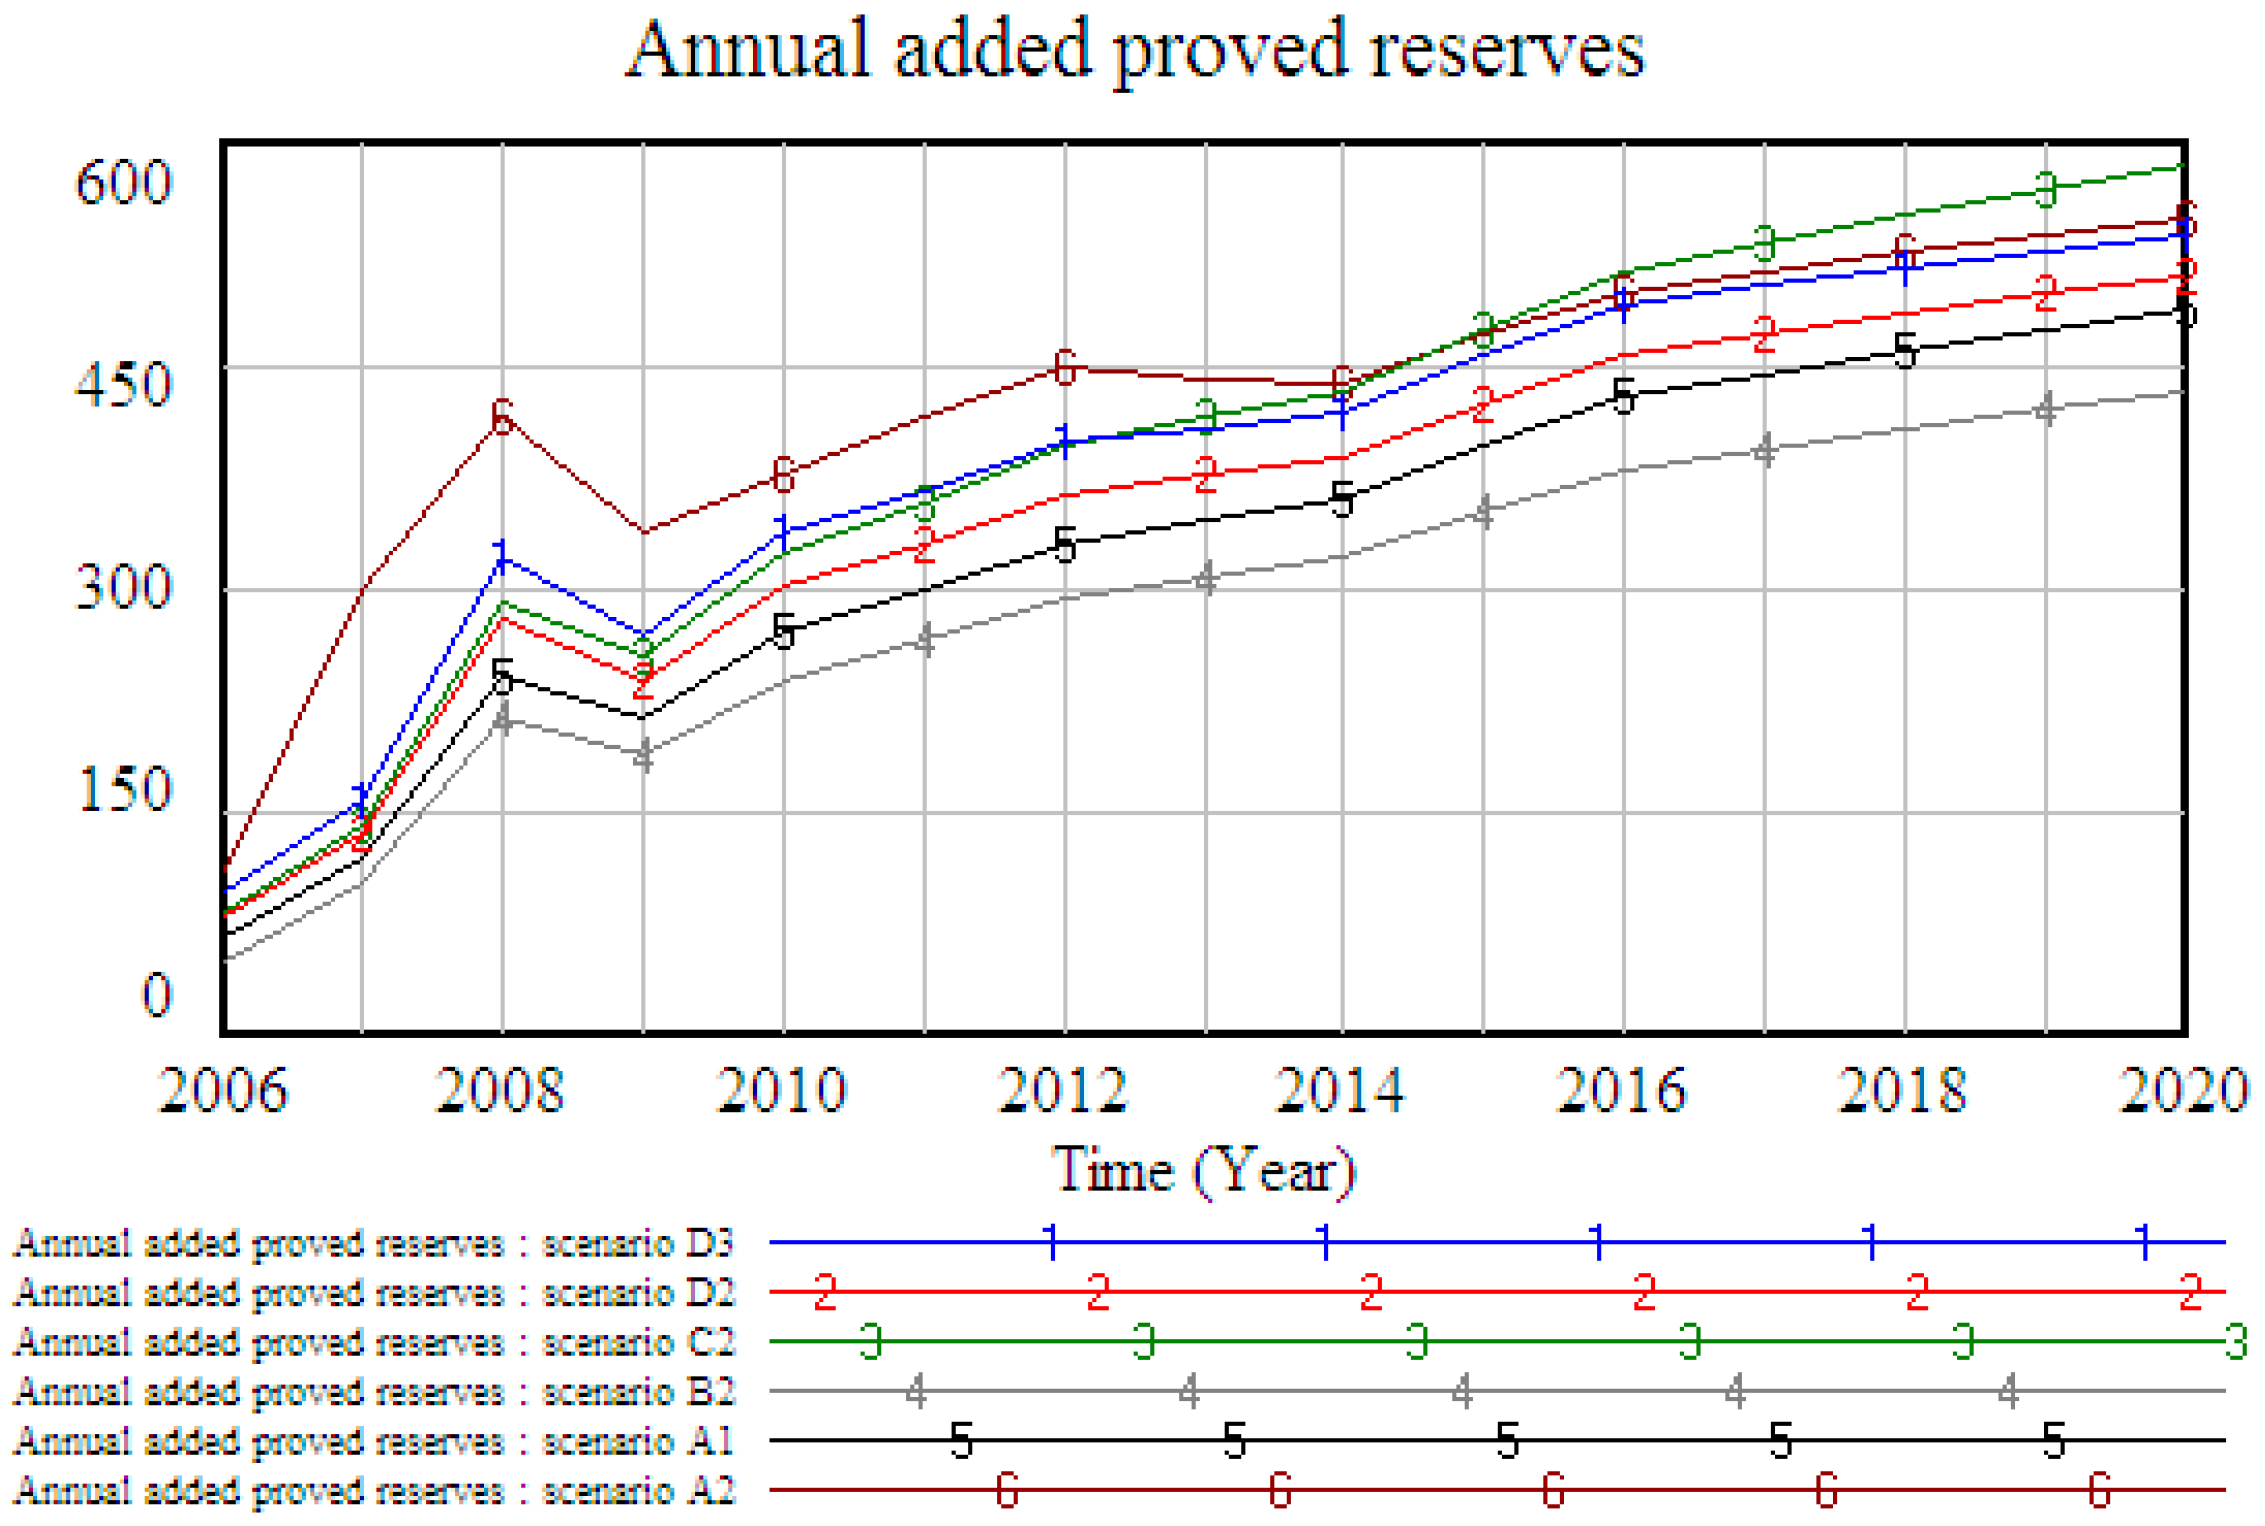
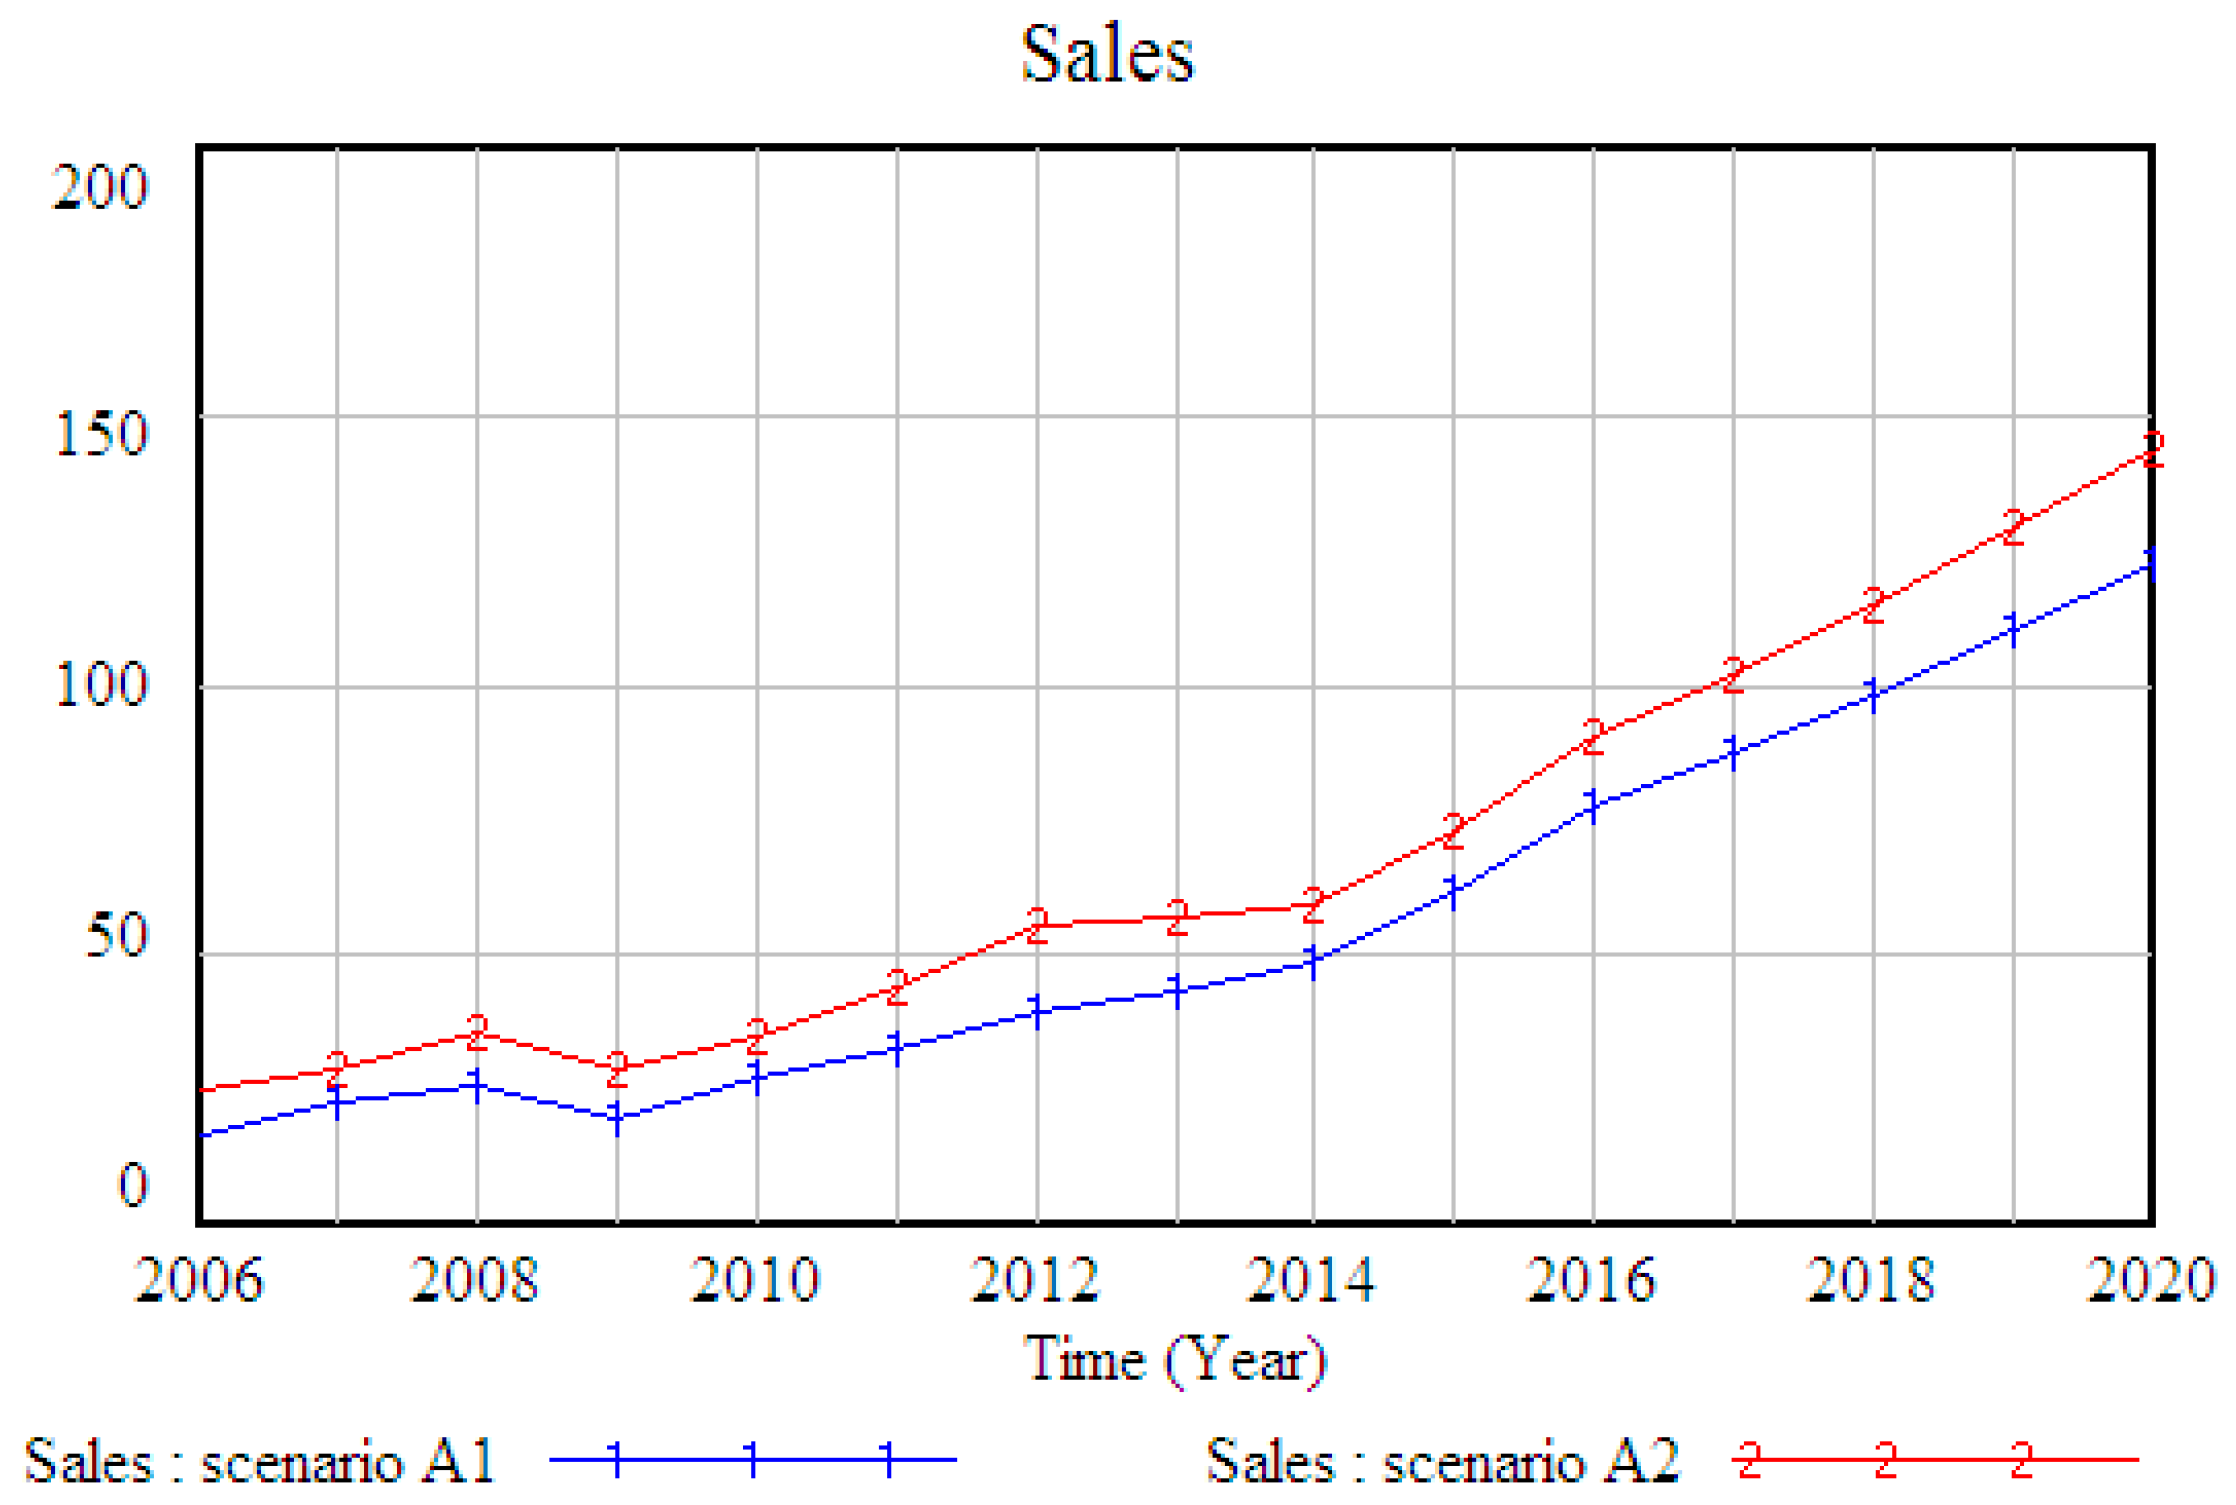
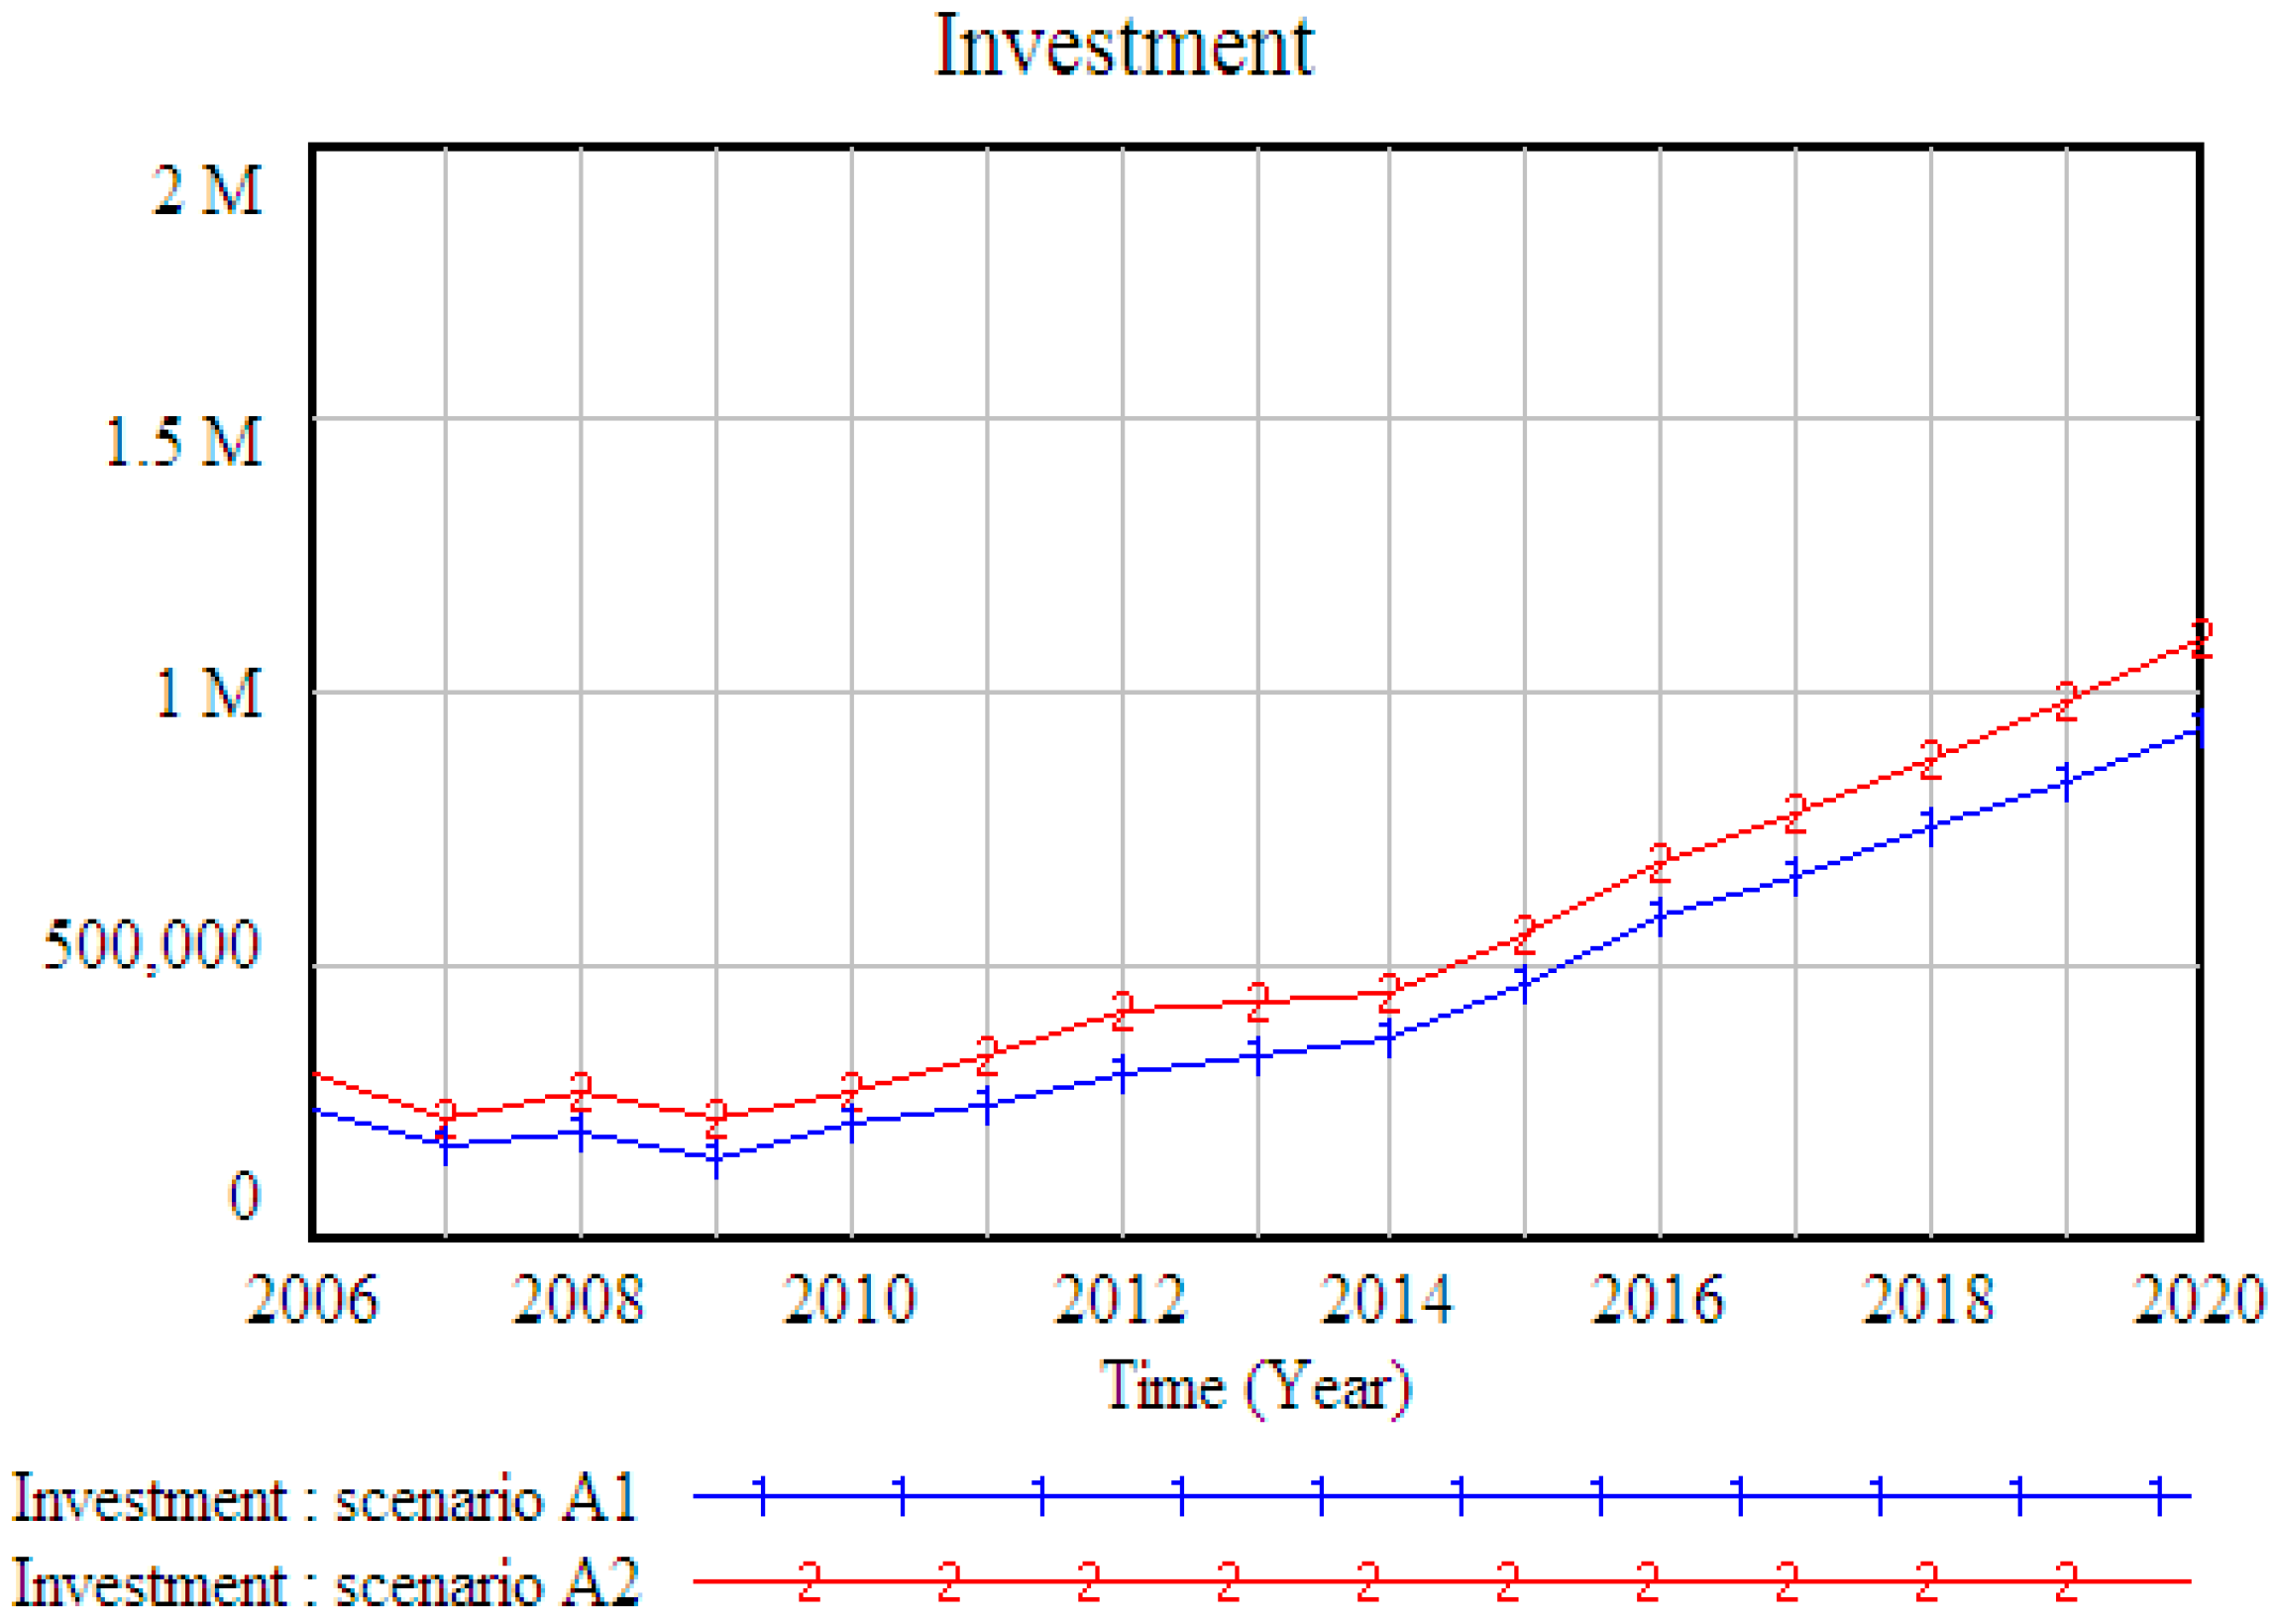
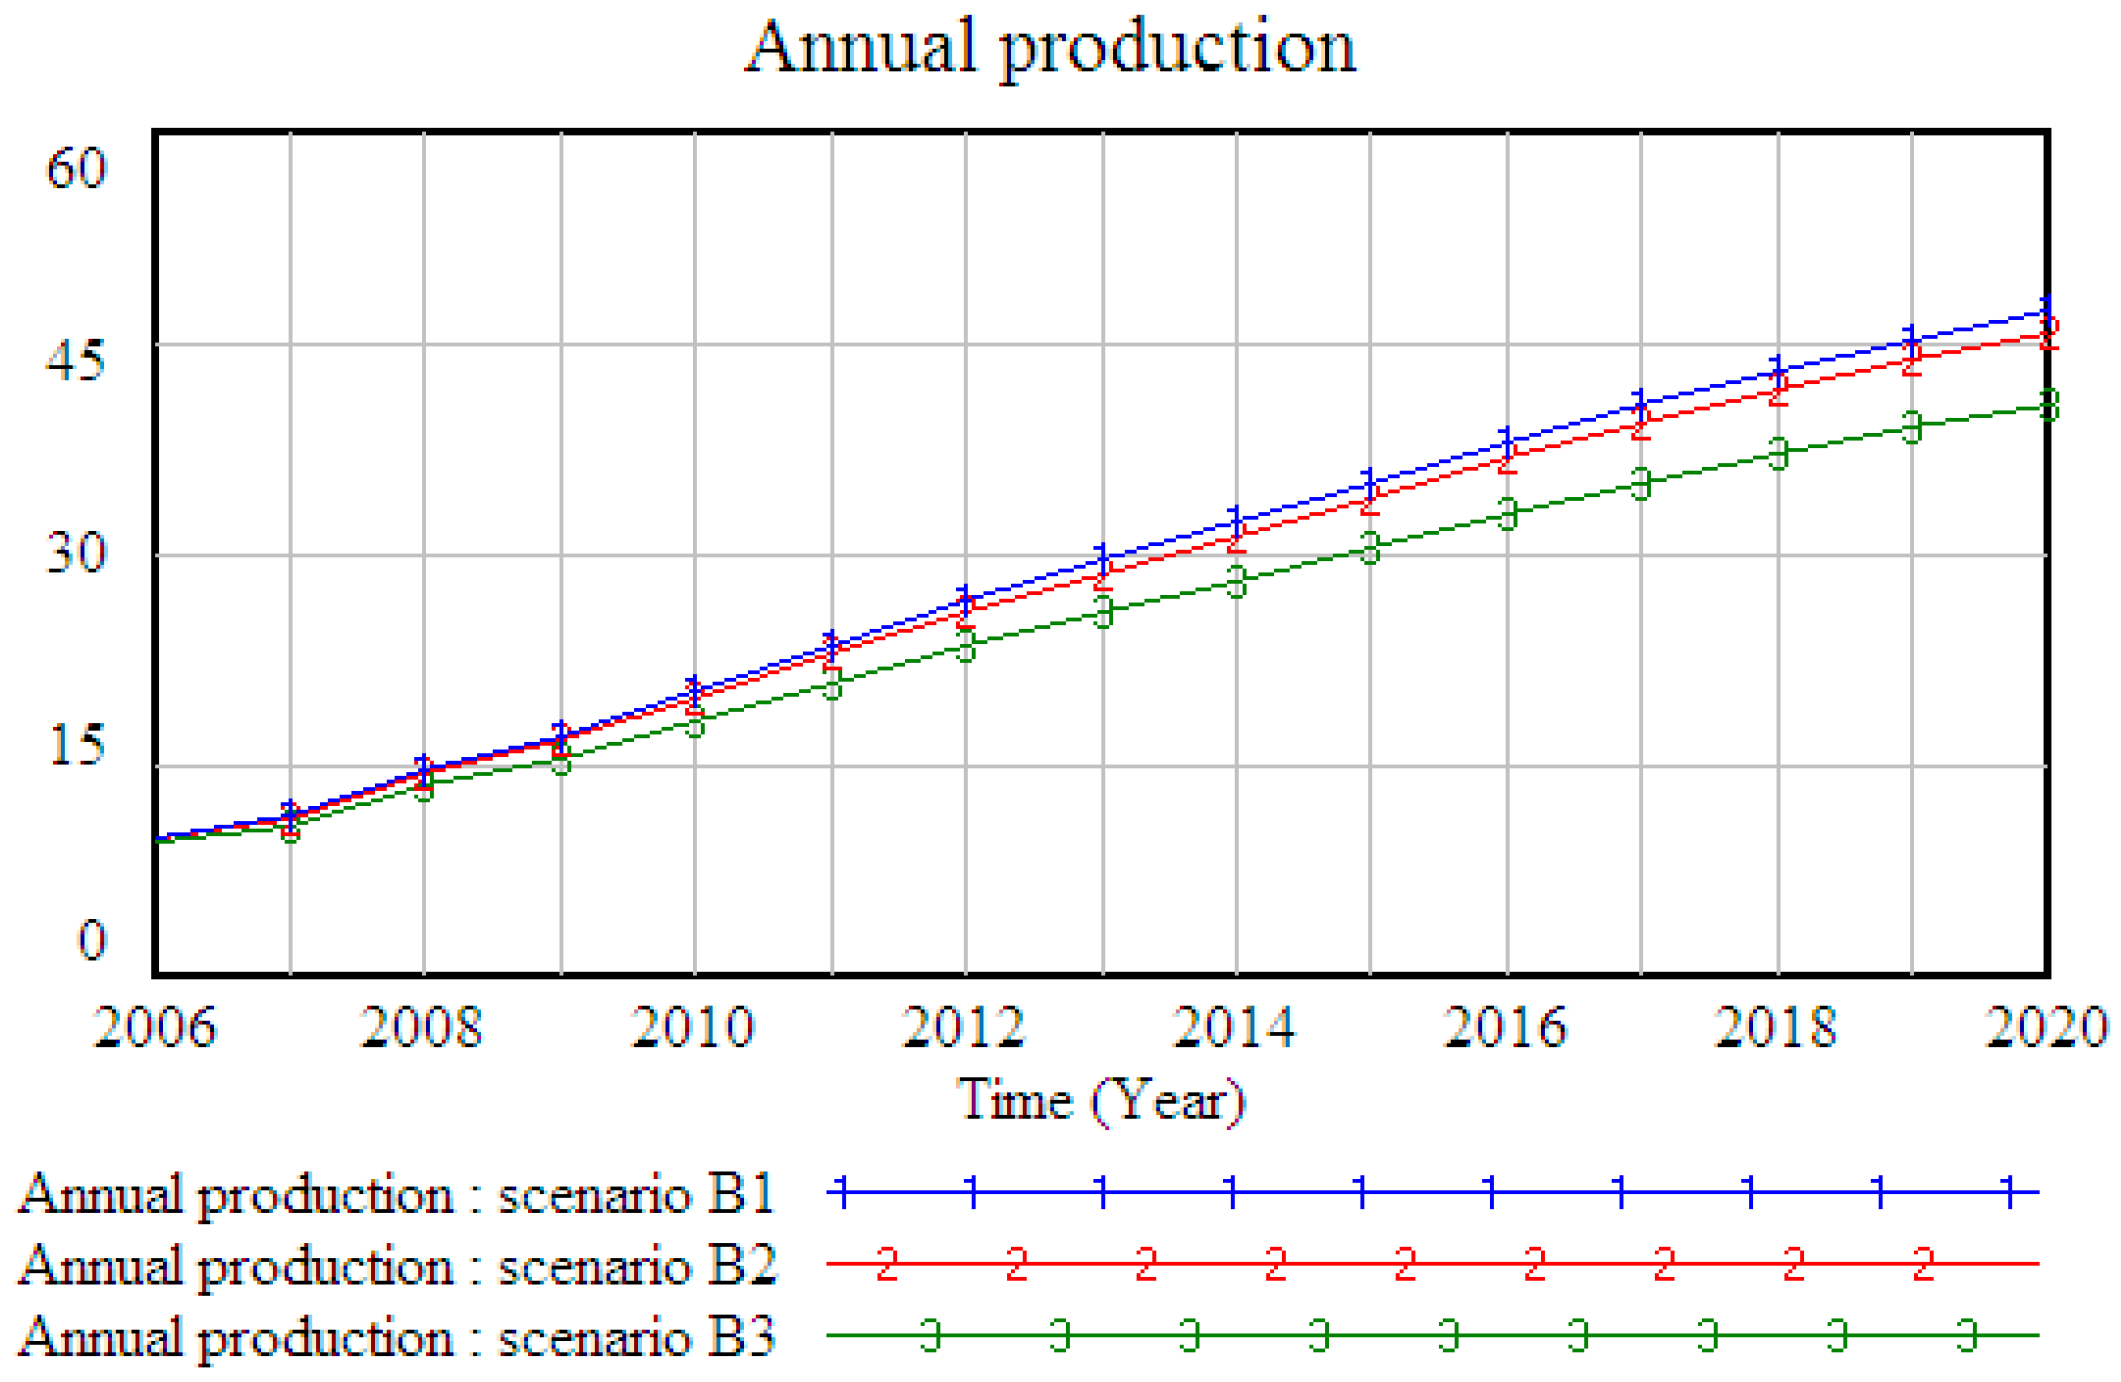
4.2. Scenario Modeling

The future natural gas policies in China will influence the process and path of China’s natural gas reform, and inevitably lead to reactions from agents in the gas industry to the gas market. Thus, the depreciation policy, gas pricing, technical progress and enterprise capital structure are considered. Thus, we develop a variety of scenarios to examine the response of upstream sectors.

4.2.1. Scenarios

• Gas pricing
China’s natural gas pricing policy has long been using the cost-plus method. The pricing provided a natural gas subsidy to the macro economy but has insufficient incentives to upstream producers. In 2011, pricing reform which adapted a net-back approach based on imported oil price indexation, had been piloted by Chinese government and then expanded trials to other provinces [29]. The new pricing regime is in deep contrast to the cost-plus regime as it moves the pricing point in the downstream market from the wellhead to city gate. While, under the cost-plus system, prices are dependent on production costs, city-gate prices are linked to market-oriented oil-product prices that serve as a benchmark for each province. Thus, the city-gate price is linked to the prices of fuel oil and Liquefied Petroleum Gas (LPG), weighted at 60% and 40%, respectively. The price setting formula is:
P = K × ( α × P 0 × H H 0 + β × P 1 × H H 1 ) × ( 1 + R )
where, K the discount rate (0.9), R the natural gas VAT rate, H , H 0 , H 1 the heat content of natural gas, fuel oil and LPG, α , β the weighted percentage of fuel oil and LPG, P 0 , P 1 the import price of fuel oil and LPG. Then, we have two scenarios:
Scenario A1: Cost-plus pricing; a pricing-regulated approach based on cost-plus for the production and pipeline tariffs. The cost-plus pricing method is the main pricing strategy of the Chinese natural gas industry, but it cannot meet the development demand for an integrated gas market.
Scenario A2: Net-back pricing; the natural gas price is linked with the price of imported fuel oil and LPG. From 2013, China began to pilot the net return value method in Guangdong and Guangxi, which is an important stage in China’s natural gas pricing reform process.
• Cost of Investment
The model shows the long-term investment efficiency of the natural gas upstream industry in China, therefore it is necessary to consider the time value, investment, and discount of investment [30].
We adjusted firm’s net operating profit after tax (NOPAT) and capital each year by adding an estimation of the increase in the net present value (NPV) of the firm’s investment in exploration and exploitation, and also to the capital flow that was carried into the next year. More specifically, we estimated the net present value by regarding the year-to-year change in the reserve value and added investment based on different levels of capital cost rate. A discount formula is:
P I = I ( 1 + r ) t
where, P I is the present value of investment; I is the investment volume of each period; and r is the capital cost rate, t is the investment period. Then, we have the following three scenarios:
Scenario B1: capital cost rate = 5.5%. In 2009, State-owned Assets Supervision and Administration Commission (SASAC) and National Development and Reform Commission (NDRC) decided to set the capital cost ratio at 5.5% on the basis of the bank loan interest rate.
Scenario B2: capital cost rate = 8%. This is the possible capital cost rate level that China’s upstream natural gas enterprises can reach in the future.
Scenario B3: capital cost rate = 12%. This is the average capital cost rate level of the industrial sector, or internal return rate (IRR) [31].
• Accounting Depreciation
Depreciation is the asset depleting over time and is properly recognized as a cost of business operation. Depreciation may bear some skepticism but it should be pointed out that accounting depreciation is a policy tool that may be used to encourage or discourage certain types of investment, especially in emerged energy fields. In China, depreciation is calculated on a straight-line basis and is subject to certain minimum depreciation periods. Under the same circumstances, accelerated depreciation should apply to enterprises engaged in oil and gas exploration activities.
Scenario C1: Straight-line depreciation for an 8-year depreciation settlement.
Scenario C2: Depreciation with the accelerated declining method combined with a switch to straight-line depreciation; 150% declining method for the former 4-year depreciation settlement, straight-line depreciation for the rest 4-year depreciation settlement.
• Discovery Rate for Exploratory Wells
Exploratory wells obviously continue to have a high risk of failure. However, the technology process has reduced the possibility of dry holes. Hence, the discovery rate is an important factor representing the exploitation technology.
Scenario D1: discovery rate for wildcat wells = 0.51. This is the current technological level of the discovery rate that is currently used by China’s upstream natural gas enterprises.
Scenario D2: discovery rate for wildcat wells = 0.6. It is a high technological level when the exploration and development of upstream enterprises achieve some technological progresses. Scenario D3: discovery rate for wildcat wells = 0.7. This is a higher technological level when the upstream enterprises achieve important technological progresses.

4.2.2. Simulation Results

In this section, we will show some simulation results from each scenario.
• Gas pricing scenario
Figure 2 and Figure 3 show the results of different gas pricing policy scenarios and the net-back method has a remarkable positive effect on both sales and investment. After using the net-back method, sales of natural gas improved by nearly 17%, and investment also had a 16% increase in the model. Due to the impact of the international economic crisis, the movement has a certain irregular fluctuation during 2007 and 2009. However, the overall trend of the natural market is reasonable. Natural gas sales increase in line with the upstream gas companies’ targets of maximizing the benefits. The evolution of natural gas pricing strategies has not only led to an increase in sales, but has also contributed to an increase in annual investment in upstream exploration activities, which is conducive to the positive cycle of the upstream natural gas business.
Figure 4 shows that annual proved reserves improved from 488.06 × 10⁸ m3 to 549.57 × 10⁸ m3 when the net-back method is applied. The amount of growth before 2015 is larger than that after 2015. The annual added proved reserves rose rapidly in 2006–2008. However, they drop sharply in 2009, which was mainly due to the global financial crisis sweeping the world in 2008. The exploration and development of the upstream natural gas industry is often lagging behind, and the impact of the financial crisis was fully apparent in 2009. However, after that, the exploration and development of the Chinese upstream natural gas industry began to rise steadily. This effect is more apparent when the net return pricing method is adopted.
Figure 5 and Figure 6 show that the proportion of exploitation investment and exploration investment is essentially unchanged in different sceneries. Different natural gas price making policy scenarios have little influence on the investment proportion of upstream sectors. In the process of increasing total investment, the company needs to maintain the increase in exploitation investment. However, the proportion of exploration investment declined after 2010; the proportion of investment in development changes is relatively small. The possible reason for the decline in the proportion of exploration investment is that the upstream enterprises are less active in exploration. This is not a positive signal. Because natural gas is still very limited in China’s total energy consumption, increasing natural gas exploration is the basis for ensuring China’s natural gas energy supply.
Much research has shown the negative effects of cost-plus pricing in developing the national natural gas market. Our simulations also indicate that the competitive pricing of natural gas based on alternative fuels really provides a stimulus to producers.
• Investment Cost Scenario
An excessive capital cost rate will affect the increase in annual added proven reserves and annual production. Simulations show that investment sufficiency did not receive enough attention. Figure 7 shows that the higher capital cost rate has some effect on the basic trend of annual proved reserves. In scenario B2, annual proved reserves are essentially unchanged. However, in scenario B2, annual proved reserves decrease obviously. Figure 8 shows that the capital cost rate is a negative factor to annual production. The possible capital cost rate level in the future leads to a 2% decrease and the industry average level is 16%. Therefore, governments and upstream gas companies need to be careful when setting the capital cost rate, which is more important for the exploration and production of upstream enterprises.
• Accounting Depreciation Scenario
General taxation policies have the strongest impact on industrial avenues. Since depreciation settlement has a direct influence on the industry’s returns, we assess the different depreciation methods (or scenarios) for Natural Gas Company.
We evaluate the impact of different depreciation settlements. Figure 9 and Figure 10 show that accelerated depreciation has an obvious impact on both annual proved reserves and annual production. The use of the double declining balance method can obviously increase both annual proved reserves and annual production.
Obviously, the high IRR is accompanied with relatively short depreciation periods of eight years, while the technical duration would be more like 40 to 60 years. This has the potential to increase the tangible cost even further. The depreciation period for energy assets is set too low by the accounting rules in China. If, as part of its investment policy, China decides to maintain the short depreciation period for tax balance and energy security purposes, it should reflect the real economic life of the upstream assets, otherwise, accelerated depreciation would create incentives for investment.
• Exploratory Technology Scenario
In general, technological progress encourages the discovery of exploration well, that is the success ratio of exploration well. Figure 11 and Figure 12 show that the effect of the technology factor on both annual proved reserves and annual production is both positive and effective. The higher the technical progress, the more annual proved reserves and annual production increase. The simulated results show that annual proved reserves of higher technology in 2020 have a 10% increase compared to annual proved reserves of current advanced technology, and annual production has an almost 19% increase. Therefore, the upstream enterprises need to increase investment in scientific research to promote technological progress. In addition, purchasing advanced equipment and implementing an advanced enterprise management model are also important for the enterprise to maintain indispensable sustained progress.
• Overall Scenarios Comparison
High-revenue expectation in exploration and production between 2006 and 2013 results in natural gas production rising. In the model, it is assumed that investments in exploration and development are supported by the cumulative profit obtained from the sales. Figure 13 shows that the reserve/production ratio does not change due to the different scenarios, and the basic trend is clear. At the beginning, it gradually decreases, but after 2015 it keeps constant and stays at about the level of 20. This finding has shown that the model is not able to provide investment levels that are sufficient to obtain a considerable production level, because low reserve/production rates result in low revenues and also low investments.
Overall, Figure 14 shows that different scenarios have different effects on annual proved reserves, but the basic trend does not change due to the different scenarios. Gas pricing and the discovery rate for exploratory wells are the most effective factors among the variables that we chose.

5. Conclusions

The presented model in this paper is the first large system dynamics model in Chinese natural gas industry and its approach is to analyze how the complicated factors, including price, policy, technology and cost, influence the whole natural gas system.
This model examines how the different factors affect the dynamic system and by simulating the results, the government can potentially make complementary policies for an upstream company. The model shows that reform of the gas pricing policy can create an intrinsic motivation for upstream sectors of natural gas to increase investment and annual production. This requires a fundamental reform of the gas pricing regime, by adopting a broader net-back approach based on the market-determined measure of gas compared with alternative fuels. If the government wants upstream enterprises to encourage the exploration and development of natural gas, it is necessary to implement the market-oriented pricing to fully mobilize the upstream gas production enterprise initiative. The net-back pricing method is only the first step, the final objective is establishing market-based natural gas pricing system in China. In addition, Chinese upstream gas companies need to accelerate the construction of natural gas infrastructure and improve the small cities and rural areas of the pipe network construction. The government also needs to enact policies and regulations, and actively guide the residents of green energy consumption.
The key challenge is to recognize that the gas industry needs to reconcile the required investment amount with the need to improve investment efficiency. More generally, the strategic objective of the gas industry is to ensure long-term efficiency. Therefore, the upstream natural gas enterprises need to increase R&D investment to continuously improve the production efficiency. In addition, due to the current low level of production and management of natural gas enterprises, improving the production and management level is also an important method to ensure higher production efficiency in upstream fields.
Obviously, the adjustment of depreciation can enhance the annual natural gas production of upstream sectors effectively, which shows that being inherently profit-driven can significantly increase gas production capacity. In this regards, the other elements of the tax and accounting regime should be propitious to foster re-investment into the expansion of upstream exploration and exploitation. This could call for accelerated depreciation providing incentives for re-investing earnings into the gas industry.
Technological improvement is an important factor for natural gas exploration and development; the enhancement of wildcat wells’ success rate can improve the annual proved reserves and annual production effectively. Gas recovery techniques can significantly extend proved reserves and hence support the sustainable development of the gas industry. In terms of upstream natural gas enterprises, it is necessary to strengthen the research of engineering technology and adopt advanced technology, such as horizontal well technology and multi-layer fracturing technology, so as to improve the success rate of exploration wells and ultimately improve enterprise efficiency. As China’s economic development went into the “new normal” stage, the natural gas demand growth has gradually slowed down. However, the development of the natural gas industry is in line with China’s energy-saving emission reduction strategy. Therefore, the government has the responsibility to increase the R&D support for upstream natural gas enterprises to promote their rapid development.

Acknowledgments

The authors gratefully acknowledge the support provided by the National Natural Science Foundation of China under Grant No. 71673257.

Author Contributions

Jianzhong Xiao and Jinhua Cheng designed the research; Jianzhong Xiao and Jun Shen collected and compiled the data and literature; Jun Shen and Xiaolin Wang finished the experiment and calculation; Jinhua Cheng and Xiaolin Wang analyzed the results and put forward the policies; Jianzhong Xiao and Jinhua Cheng revised and approved the manuscript. All authors read and approved the final manuscript.

Conflicts of Interest

The authors declare no conflict of interest.

References

  1. Zhang, Q.; Crooks, R. Toward an Environmentally Sustainable Future: Country Environmental Analysis of the People’s Republic of China; Asian Development Bank: Metro Manila, Philippines, 2012. [Google Scholar]
  2. Peters, G.P.; Weber, C.L.; Guan, D.; Hubacek, K. China’s growing CO2 emissions a race between increasing consumption and efficiency gains. Environ. Sci. Technol. 2007, 41, 5939–5944. [Google Scholar] [CrossRef] [PubMed]
  3. Andoura, S.; d’Oultremont, C. Energy Transition by 2050: A Multifaceted Challenge for Europe. Available online: http://www.egmontinstitute.be/wp-content/uploads/2013/10/EPB8-EU-energy-Roadmap.pdf (accessed on 19 December 2016).
  4. Budzianowski, W.M.; Budzianowska, D.A. Economic analysis of biomethane and bioelectricity generation from biogas using different support schemes and plant configurations. Energy 2015, 88, 658–666. [Google Scholar] [CrossRef]
  5. Wu, Y.; Chen, K.; Yang, Y.; Feng, T. A system dynamics analysis of technology, cost and policy that affect the market competition of shale gas in China. Renew. Sustain. Energy Rev. 2015, 45, 235–243. [Google Scholar]
  6. Dai, J.; Wu, W.; Fang, C.; Liu, D. Exploration and development of large gas fields in China since 2000. Nat. Gas Ind. B 2015, 2, 1–8. [Google Scholar] [CrossRef]
  7. Li, J.; Dong, X.; Shangguan, J.; Hook, M. Forecasting the growth of China’s natural gas consumption. Energy 2011, 36, 1380–1385. [Google Scholar] [CrossRef]
  8. Lin, B.Q.; Wang, T. Forecasting natural gas supply in China: Production peak and import trends. Energy Policy 2012, 49, 225–233. [Google Scholar] [CrossRef]
  9. Wang, J.; Feng, L.; Zhao, L. Simon Snowden. China’s natural gas: Resources, production and its impacts. Energy Policy. 2013, 55, 690–698. [Google Scholar] [CrossRef]
  10. Aslani, A.; Petri, H.; Marja, N. Role of renewable energy policies in energy dependency in Finland: System dynamics approach. Appl. Energy 2014, 113, 758–765. [Google Scholar] [CrossRef]
  11. Freeman, R.; Yearworth, M.; Cherruault, J.V. Review of Literature on Systems Thinking and System Dynamics for Policy Making; Department for Environment, Food and Rural Affairs: Manchester, UK, 2014.
  12. Naill, R.F. The Discovery Life Cycle of a Finite Resource: A Case Study of U.S. Natural Gas; Massachusetts Institute of Technology Press: Cambridge, MA, USA, 1972. [Google Scholar]
  13. Forrester, J.W. Industrial dynamics: A major breakthrough for decision makers. Harv. Bus. Rev. 1958, 36, 37–66. [Google Scholar]
  14. Naill, R.F. Managing the Energy Transition: A System Dynamics Search for Alternatives to Oil And Gas; Ballinger Publishing Company: Pensacola, FL, USA, 1977. [Google Scholar]
  15. Naill, R.F. A system dynamics model for national energy policy planning. Syst. Dyn. Rev. 1992, 8, 1–19. [Google Scholar] [CrossRef]
  16. Sterman, J.D. Economic vulnerability and the energy transition. Energy Syst. Policy 1983, 7, 259–301. [Google Scholar]
  17. Sterman, J.D.; Richardson, G.P. An experiment to evaluate methods for estimating fossil fuel resources. J. Forecast 1985, 4, 197–226. [Google Scholar] [CrossRef]
  18. Davidsen, P.I.; Sterman, J.D.; Richardson, G.P. A petroleum life cycle model for the United States with endogenous technology, exploration, recovery, and demand. Syst. Dyn. Rev. 1990, 6, 66–93. [Google Scholar] [CrossRef]
  19. Rego, J. Schedule Delays and New Financing for the Argentine Electricity Sector Growth; Springer: Berlin, Germany, 1989. [Google Scholar]
  20. Bodger, P.S.; May, D.G. A system dynamics energy model of New Zealand. Technol. Forecast. Soc. Chang. 1992, 41, 97–106. [Google Scholar] [CrossRef]
  21. Chia, E.S.; Chee, K.L.; Adam, N.; Nguyen, N.H.L. The System Dynamics of Nuclear Energy in Singapore. Int. J. Green Energy 2015, 12, 73–86. [Google Scholar] [CrossRef]
  22. Chi, K.C.; Nuttall, W.J.; Reiner, D.M. Dynamics of the UK natural gas industry: System dynamics modelling and long-term energy policy analysis. Technol. Forecast. Soc. Chang. 2009, 76, 339–357. [Google Scholar]
  23. Chowdhurg, S.; Sahu, K.C. A system dynamics model for Indian oil and gas exploration/exploitation industry. Technol. Forecast. Soc. Chang. 1992, 42, 63–84. [Google Scholar] [CrossRef]
  24. Kiani, B.; Hosseini, S.H.; Amiri, R.H. Examining the Hubbert peak of Iran’s crude oil: A system dynamics approach. Eur. J. Sci. Res. 2009, 25, 437–447. [Google Scholar]
  25. Fan, Y.; Yang, R.G.; Wei, Y.M. A system dynamics based model for coal investment. Energy 2007, 32, 898–905. [Google Scholar] [CrossRef]
  26. Feng, Y.Y.; Chen, S.Q.; Zhang, L.X. System dynamics modeling for urban energy consumption and CO2 emissions: A case study of Beijing, China. Ecol. Model. 2013, 252, 44–52. [Google Scholar] [CrossRef]
  27. Xu, J.; Dong, R.; Wu, D. On simulation and optimization of one natural gas industry system under the rough environment. Expert Syst. Appl. 2010, 37, 1854–1862. [Google Scholar] [CrossRef]
  28. Zhang, B.; Wang, Q. Analysis and forecasts of investment scale and structure in upstream sector for oil companies based on system dynamics. Pet. Sci. 2011, 8, 120–126. [Google Scholar] [CrossRef]
  29. Gas Pricing and Regulation: China’s Challenges and IEA Experience. Available online: http://www.iea.org/publications/freepublications/publication/ChinaGasReport_Final_WEB.pdf (accessed on 15 December 2012).
  30. Zhang, Q.; Li, Z.; Wanga, G.; Li, H. Study on the impacts of natural gas supply cost on gas flow and infrastructure deployment in China. Appl. Energy 2016, 162, 1385–1398. [Google Scholar] [CrossRef]
  31. National Development and Reform Commission. The Methods and Parameters of Economic Evaluation on Construction Projects, 3rd ed.Chinese Planning Press: Beijing, China, 2006.
Figure 1. The System Dynamics model of natural gas exploitation and exploration.
Energies 10 00154 g001
Figure 2. Sales of natural gas (billion cubic meters).
Energies 10 00154 g002
Figure 3. Annual investment (ten thousand Yuan).
Energies 10 00154 g003
Figure 4. Annual added proved reserves (billion cubic meters).
Energies 10 00154 g004
Figure 5. The proportion of exploration investment.
Energies 10 00154 g005
Figure 6. The proportion of development investment.
Energies 10 00154 g006
Figure 7. Annual added proved reserves (billion cubic meters).
Energies 10 00154 g007
Figure 8. Annual production (billion cubic meters).
Energies 10 00154 g008
Figure 9. Annual added proved reserves (billion cubic meters).
Energies 10 00154 g009
Figure 10. Annual production capability (billion cubic meters).
Energies 10 00154 g010
Figure 11. Annual added proved reserves (billion cubic meters).
Energies 10 00154 g011
Figure 12. Annual production (billion cubic meters).
Energies 10 00154 g012
Figure 13. Reserve/production ratio.
Energies 10 00154 g013
Figure 14. Annual added proved reserves (billion cubic meters).
Energies 10 00154 g014
Table 1. Parameter list of the SD model.
Variable NameDescriptionUnit
TINTotal investment10 thousand Yuan (RMB)
EPSINExploration investment10 thousand Yuan (RMB)
EPRINExploitation investment10 thousand Yuan (RMB)
CPCRCapital cost ratioPercentage %
AEPWINAnnual newly-increased exploration well investment10 thousand Yuan (RMB)
ACEWINAccumulative exploration well investment10 thousand Yuan (RMB)
EPWINCPRRatio of exploration well investment capitalizationPercentage %
AEPWCPINAnnual exploration capitalization investment10 thousand Yuan (RMB)
EPWSRSuccess ratio of exploration wellPercentage %
ACCPEPWINAccumulative capitalization exploration well investment10 thousand Yuan (RMB)
EPSDRINExploration directly investment10 thousand Yuan (RMB)
2DSINTwo-dimensional seismic investment10 thousand Yuan (RMB)
3DSINThree-dimensional seismic investment10 thousand Yuan (RMB)
EPSMINMatched investment for Exploration10 thousand Yuan (RMB)
EPSOINOther investment for Exploration10 thousand Yuan (RMB)
AADPRCPINAnnual newly-increased proved resource capitalization investment10 thousand Yuan (RMB)
AEPRINAnnual exploitation investment10 thousand Yuan (RMB)
ACEPRINAccumulated exploitation investment10 thousand Yuan (RMB)
EPRINCPRRatio of exploitation investment capitalizationPercentage %
ANEPRCPINAnnual newly-increased exploitation capitalization investment10 thousand Yuan (RMB)
AEPRCPINAnnual exploitation capitalization investment10 thousand Yuan (RMB)
ACCPEPRINAccumulated capitalization exploitation investment10 thousand Yuan (RMB)
EPRWINExploration well investment10 thousand Yuan (RMB)
HWINHorizontal well investment10 thousand Yuan (RMB)
VWINVertical well investment10 thousand Yuan (RMB)
EPRMINMatched investment for exploration10 thousand Yuan (RMB)
SLRSale revenuebillion cubic meters (bcm)
ASLRAccumulated sale revenuebillion cubic meters (bcm)
AADVOPAnnual newly-increased volume of productionbillion cubic meters (bcm)
ACADVOPAccumulated newly-increased volume of productionbillion cubic meters (bcm)
ADVOPAnnual diminished volume of productionbillion cubic meters (bcm)
ACCPAccumulated capacitybillion cubic meters (bcm)
2DMLL2-D measure line lengthmeter
3DEPRA3-D exploration areakilometer
A2DMLLAnnual 2-D measure line lengthmeter
A3DEPRAAnnual 3-D exploration areakilometer
AVWDPAverage well depthmeter
ADCPAnnual diminished capacitybillion cubic meters (bcm)
ACCPAccumulated production capacitybillion cubic meters (bcm)
AACCPAnnual newly-increased capacitybillion cubic meters (bcm)
ACACCPAccumulated newly-increased capacitybillion cubic meters(bcm)
AEPAAnnual exploration production reservebillion cubic meters (bcm)
RRCRRemaining recoverable reservebillion cubic meters(bcm)
AARCRAnnual newly-increased recoverable reservebillion cubic meters (bcm)
AAWRAnnual newly-increased workable reservebillion cubic meters (bcm)
AWRAccumulated workable reservebillion cubic meters (bcm)
UWRUnworkable reservebillion cubic meters (bcm)
AADPRAnnual newly-increased proved resourcebillion cubic meters(bcm)
ACPRAccumulated proved resourcebillion cubic meters (bcm)
ACPRCPIAccumulated proved resource capitalization investment10 thousand Yuan (RMB)
TRTotal reservesbillion cubic meters (bcm)
AVOPAnnual volume of productionbillion cubic meters (bcm)
ACAVOPAccumulated Annual volume of productionbillion cubic meters (bcm)
CAPLDFCapacity load factorPercentage %
RPRReserve/production ratioPercentage %
NADRNature diminished ratioPercentage %
CODRComposite diminished ratioPercentage %
HWFTNHorizontal well footage numbermeter
HWNHorizontal well numberNo.
VWFTNVertical well footage numberNo.
VWNVertical well numberNo.
EDExploitation degreePercentage %
EORExploitation oil recoveryPercentage %
EDTExploitation degree tablemeter
DEPDegree of exploration provedPercentage %
WNWell numberNo.
EPWFTExploration well footagemeter
EPWNExploration well numberNo.
Table 2. Simulated errors of total investment (10 thousand RMB/Year).
YearHistorical ValueSimulated ValueErrors (%)
2006214,446213,2180.57%
2007442,000464,219−5.03%
2008564,769581,278−2.92%
2009680,162680,809−0.10%
2010855,112883,749−3.35%
20111,068,8001,094,572−2.41%
20121,324,8601,405,523−6.09%
20131,627,5301,563,3583.94%
Table 3. Simulated errors of the accumulated proved resource (billion cubic meters).
YearHistorical ValueSimulated ValueErrors (%)
2006123112.718.37%
2007349330.635.26%
2008579540.486.65%
2009802768.514.18%
201010711066.310.44%
20111439.011507.21−4.74%
20121886.391835.252.71%
20132428.332520.1−3.78%
Table 4. Simulated errors of the annual production capability (billion cubic meters).
YearHistorical ValueSimulated ValueErrors (%)
200610.510.81−3.00%
200714.514.132.56%
200818.416.788.78%
200919.618.794.13%
201022.223.01−3.64%
201126.527.02−1.96%
201236.838.4−4.35%
201345.147.2−4.66%

