Numerical Investigation of the Production Behavior of Methane Hydrates under Depressurization Conditions Combined with Well-Wall Heating


Abstract
:1. Introduction
2. Mathematical Models
2.1. Mass Conservation Equations
2.2. Energy Conservation Equations
2.3. Kinetics Equations
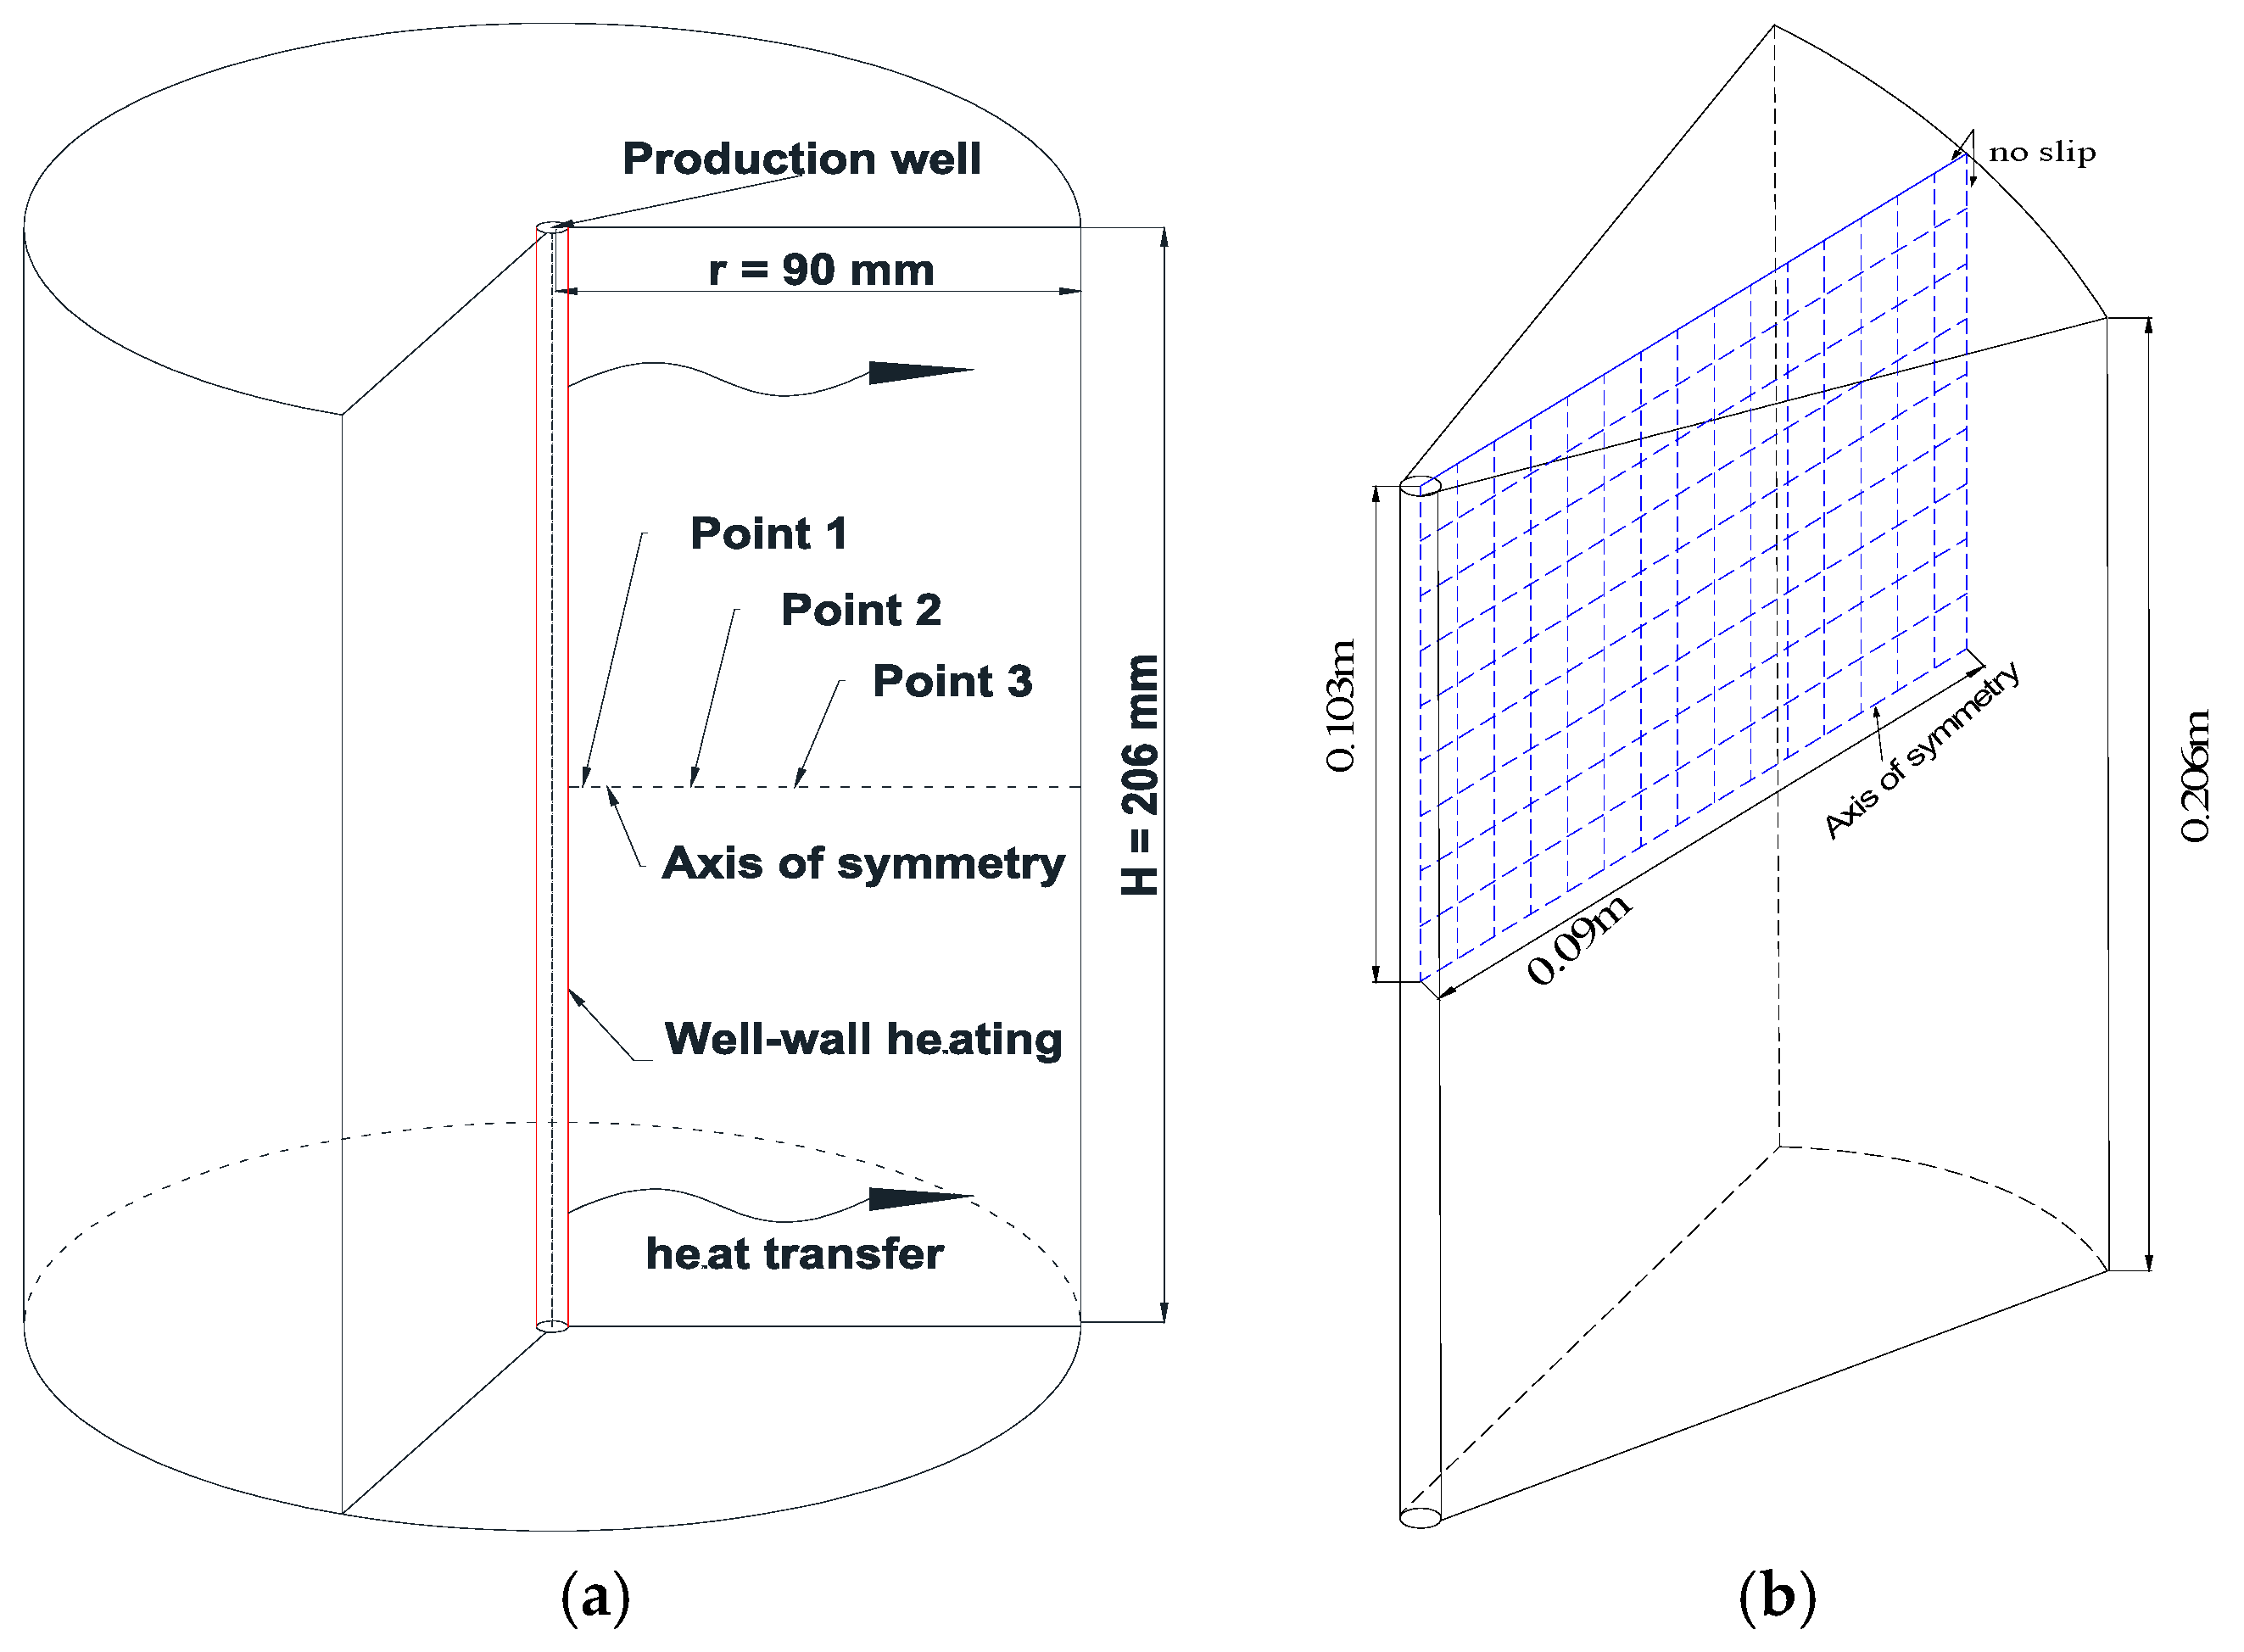
2.4. Initial and Boundary Conditions
3. Comparison of Numerical Simulation with Experiment Data
4. Results and Discussion
4.1. Different Production Methods
4.2. Sensitivity to the Combining Well-Wall Heating Temperature
4.3. Sensitivity to the Initial Hydrate Saturation Sh0
4.4. Sensitivity to the Initial Pressure P0
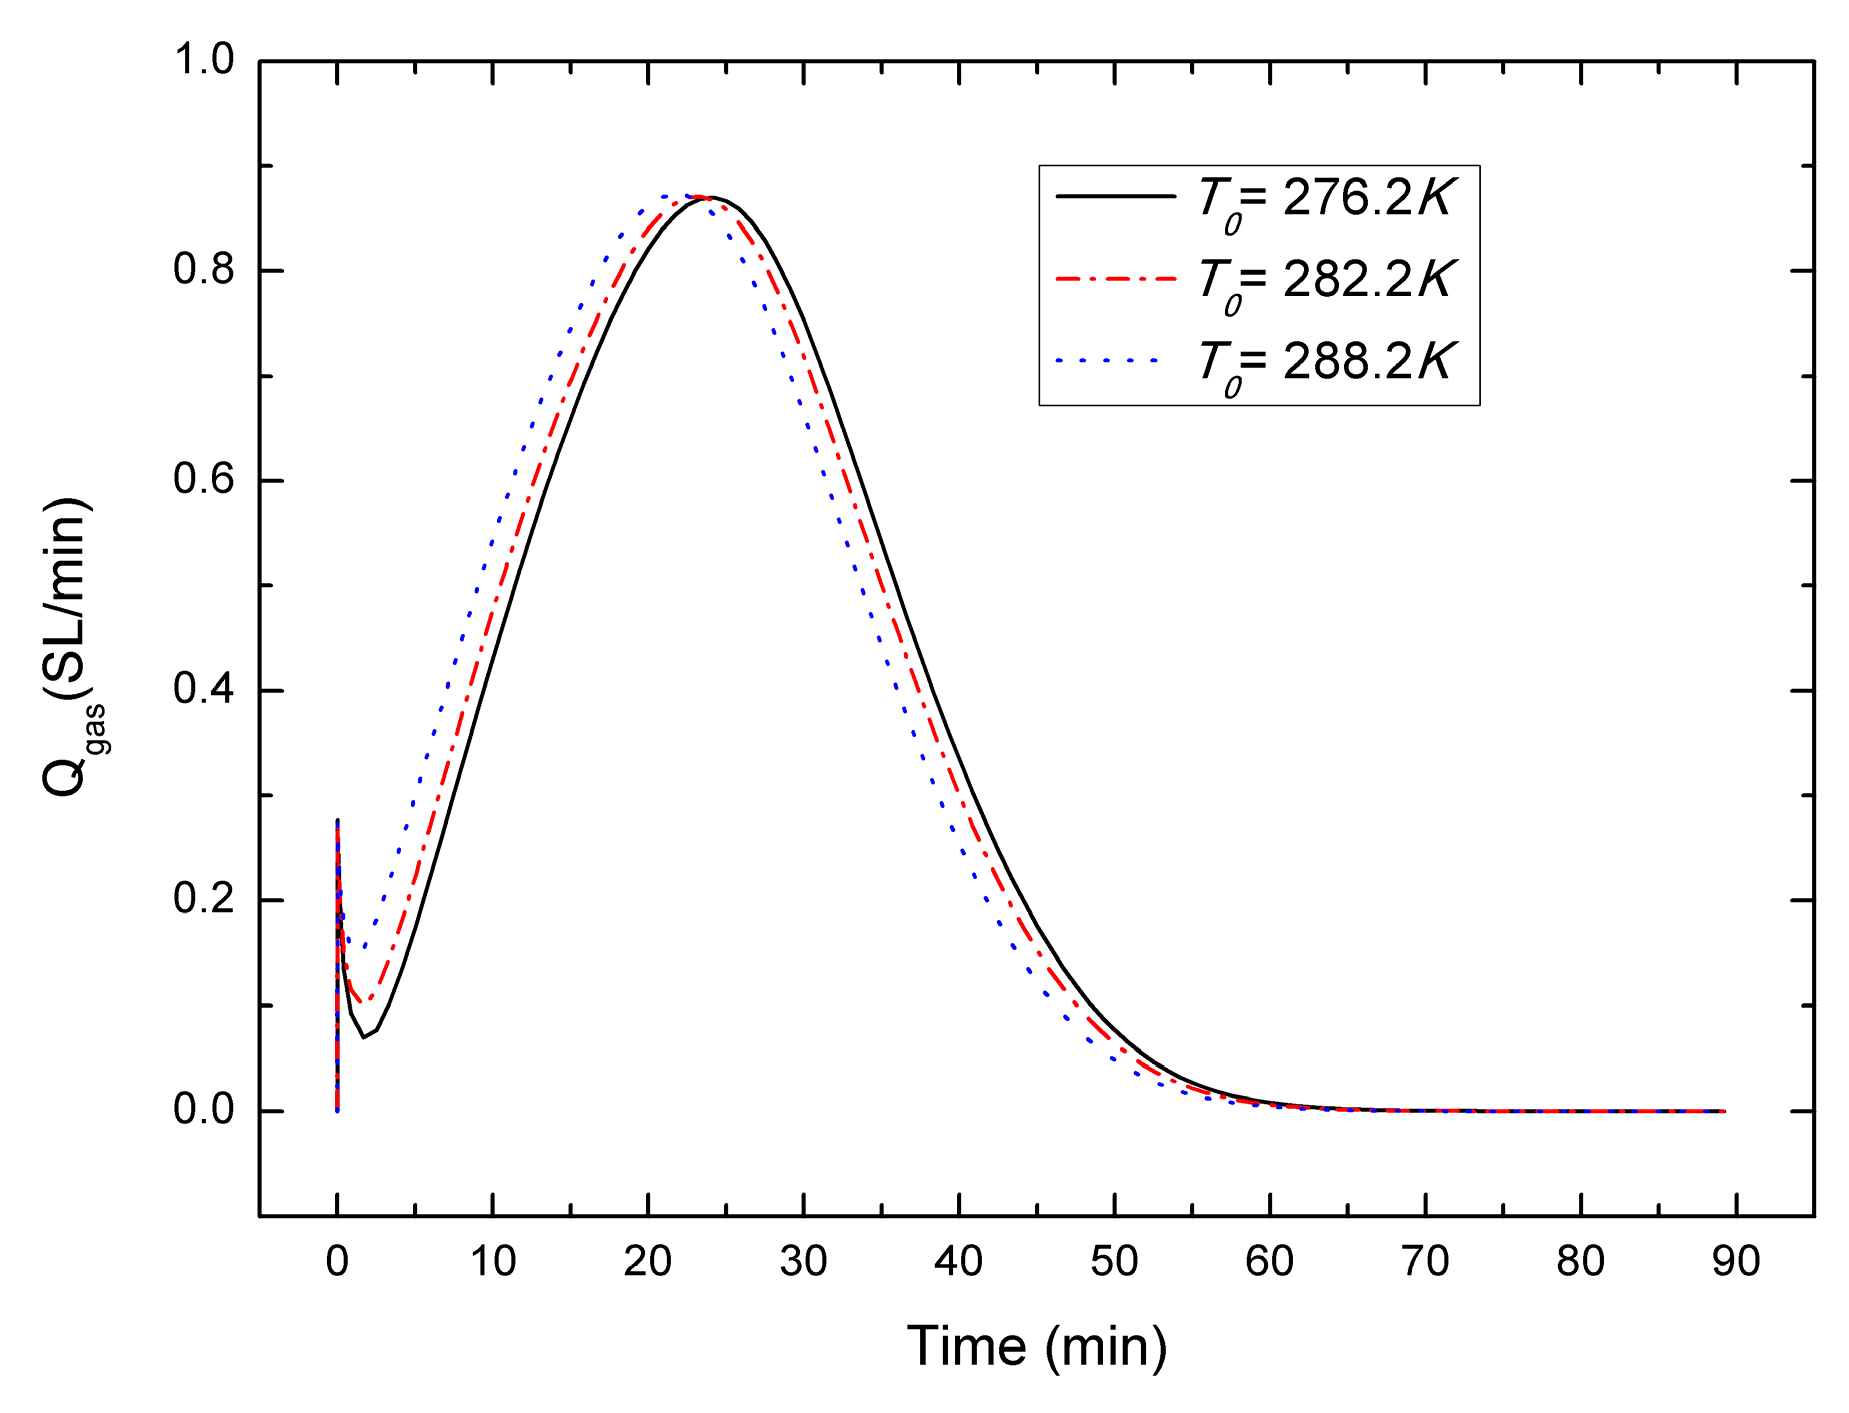
4.5. Sensitivity to the Initial Temperature T0
4.6. Sensitivity to the Thermal Boundary Conditions
5. Conclusions
- (1)
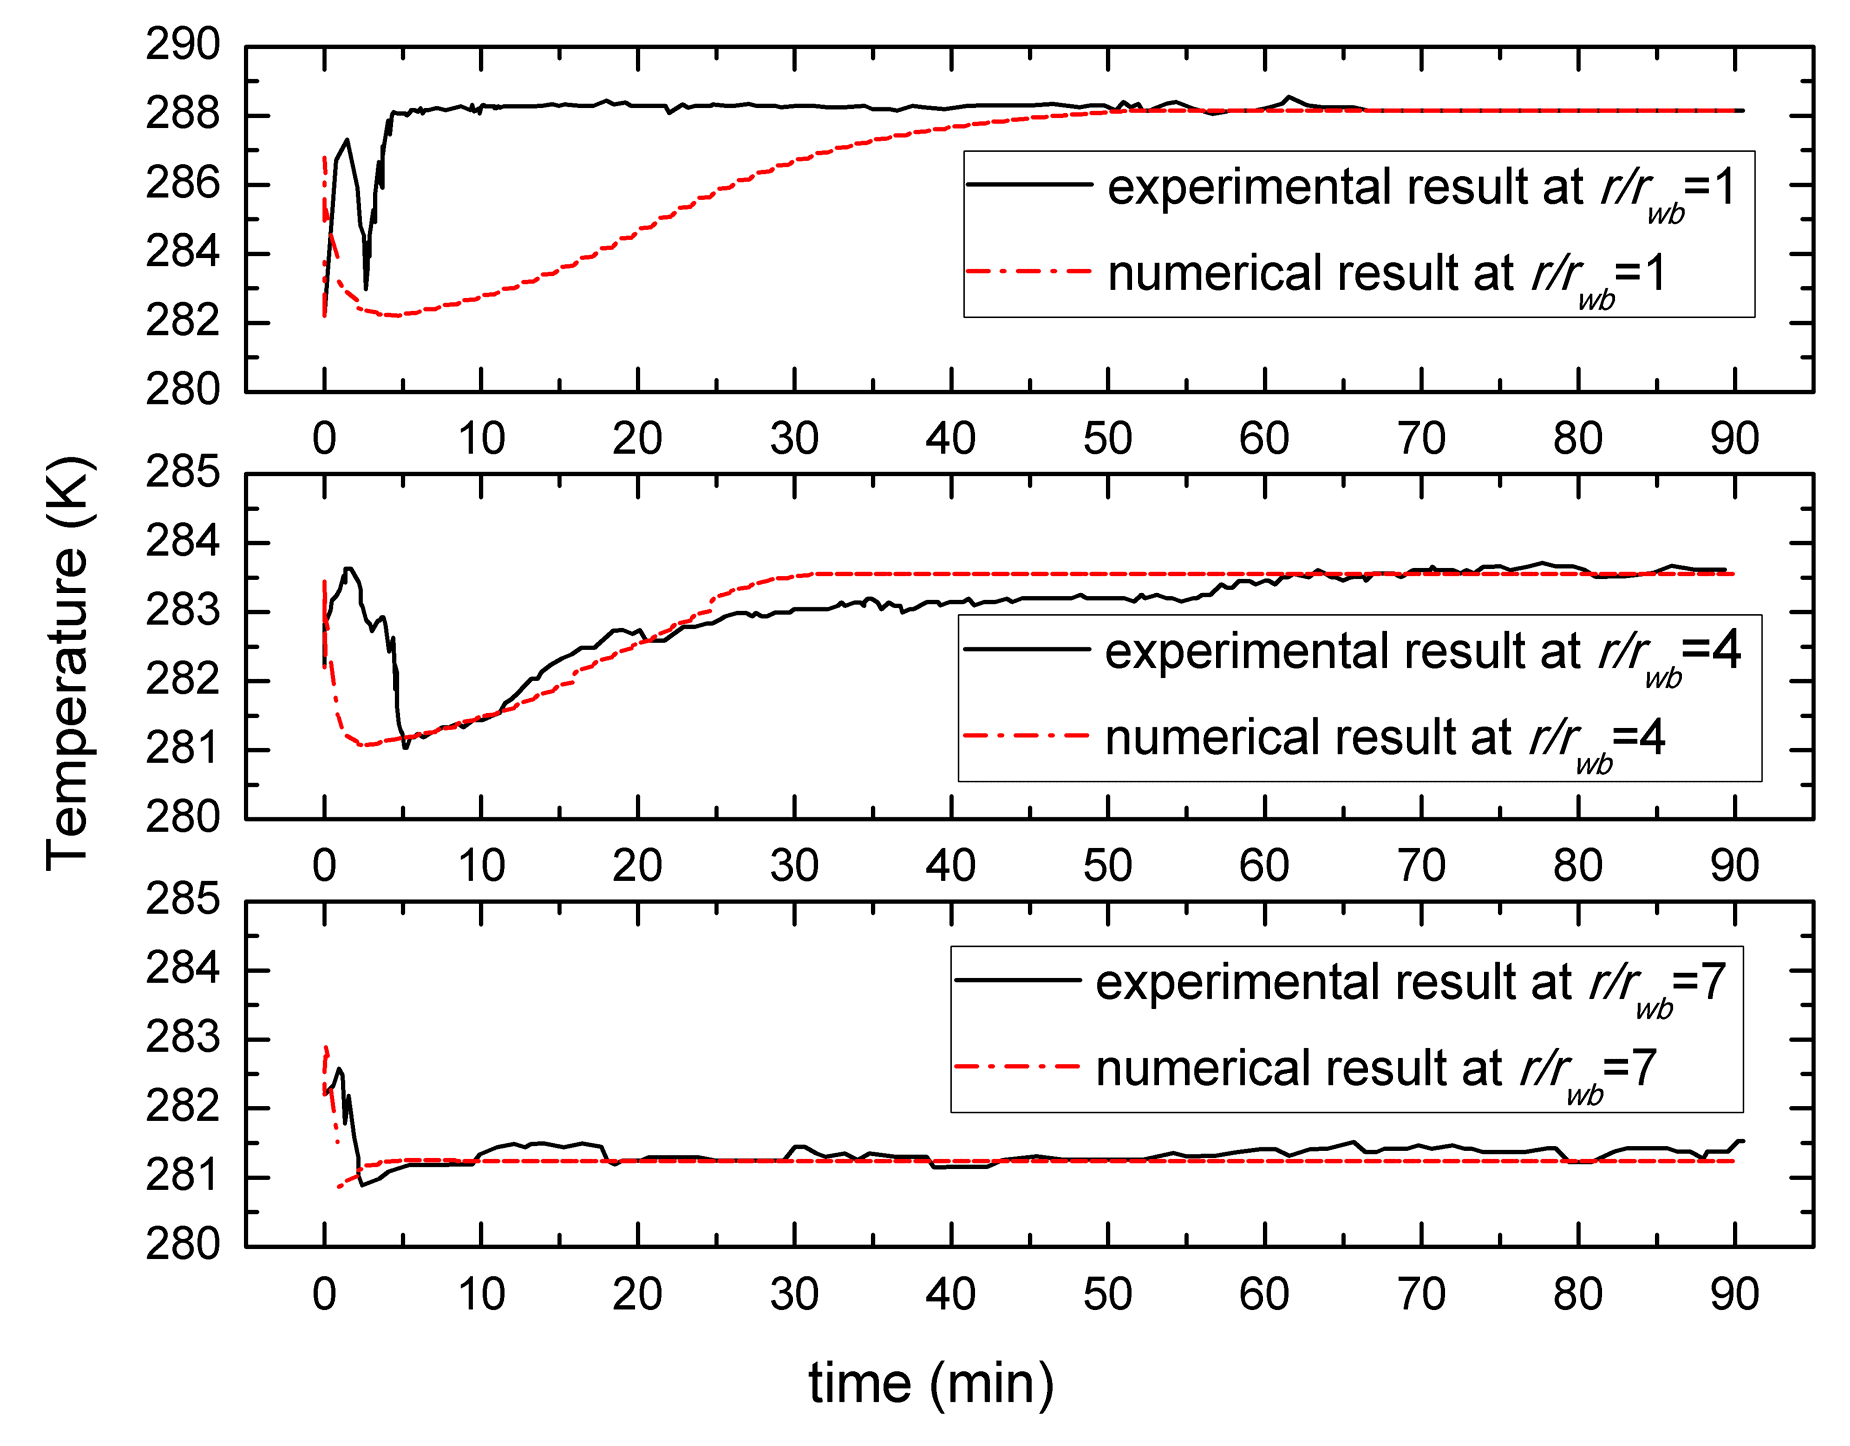
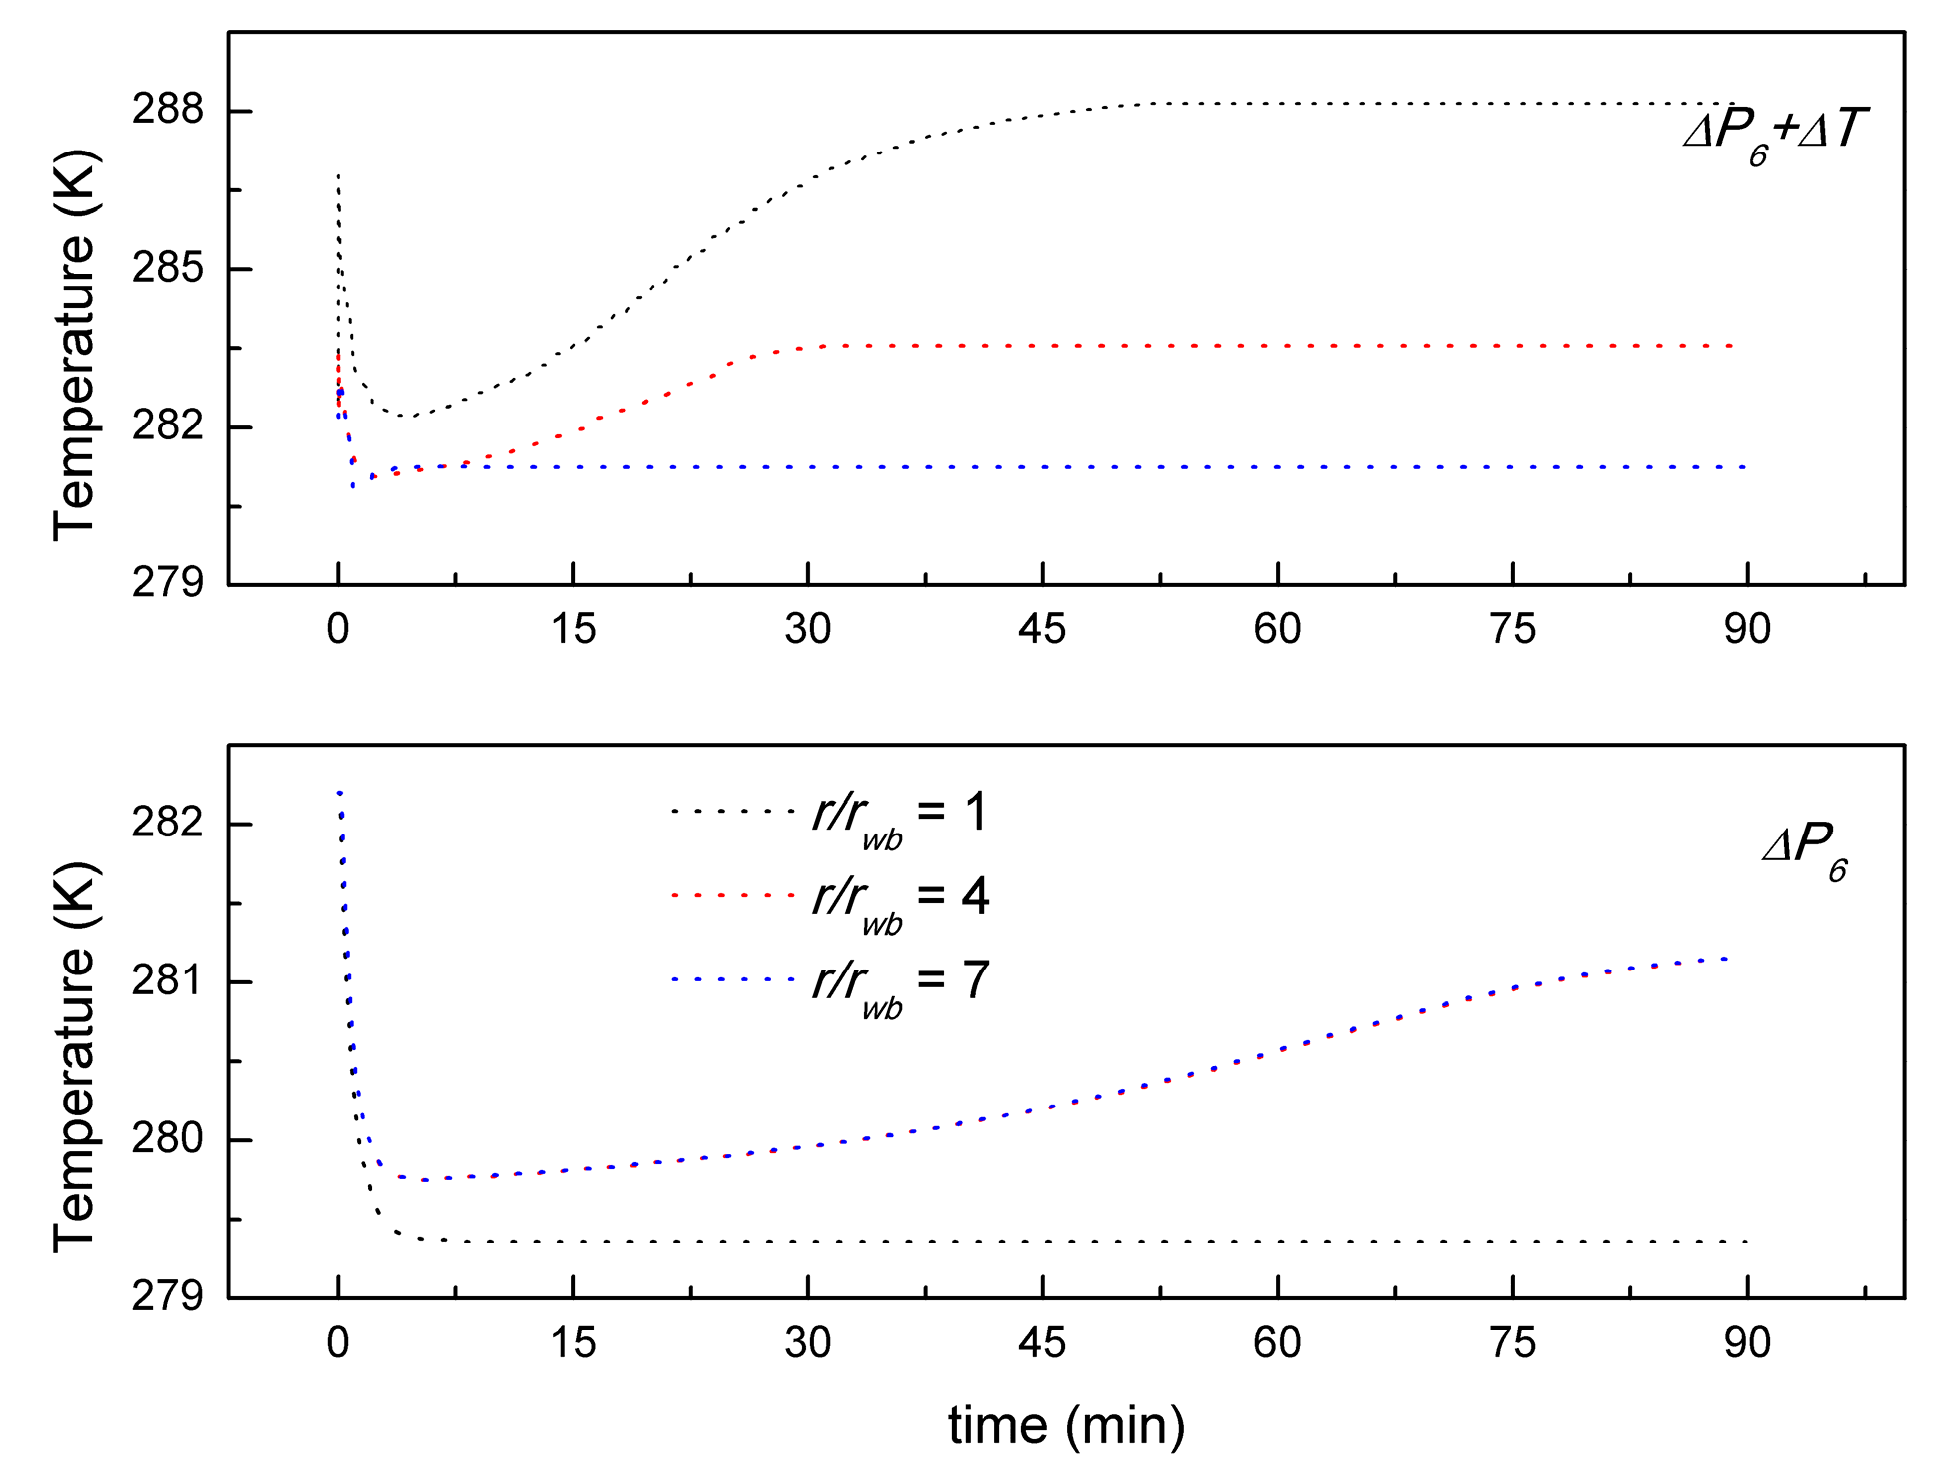
- The temperature distribution of depressurization combined with well-wall heating is significantly different from the case of depressurization. In the case of depressurization combined with well-wall heating, the temperature increases from the same initial temperature, then it decreases to a minimum, and then it will rebound to the environmental temperature or the heating temperature. In a word, the temperature shows a rapid increase due to the additional thermal input, however, the depressurization temperature is decreased from the initial value to the minimum.
- (2)
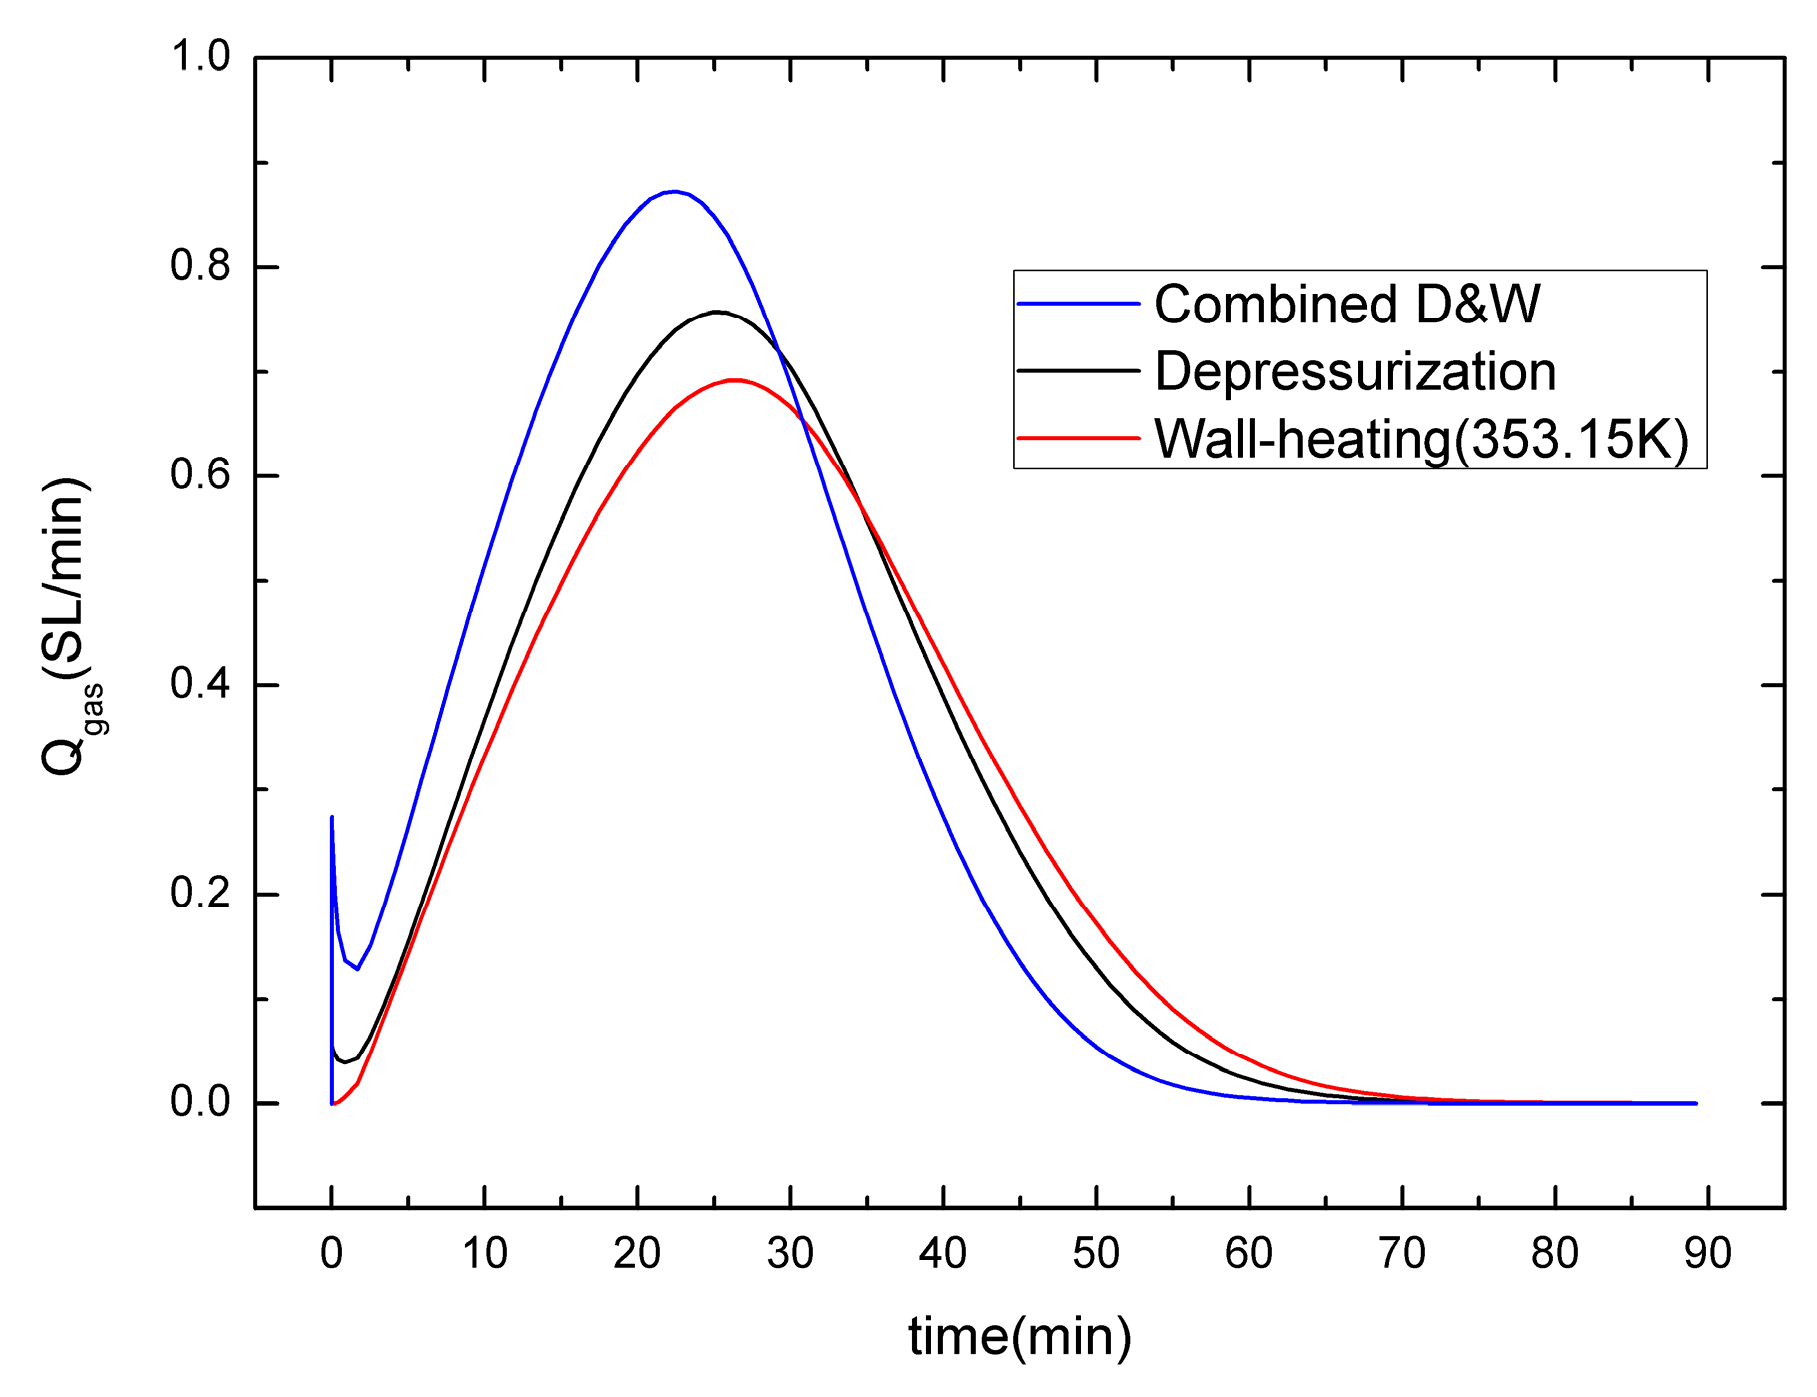
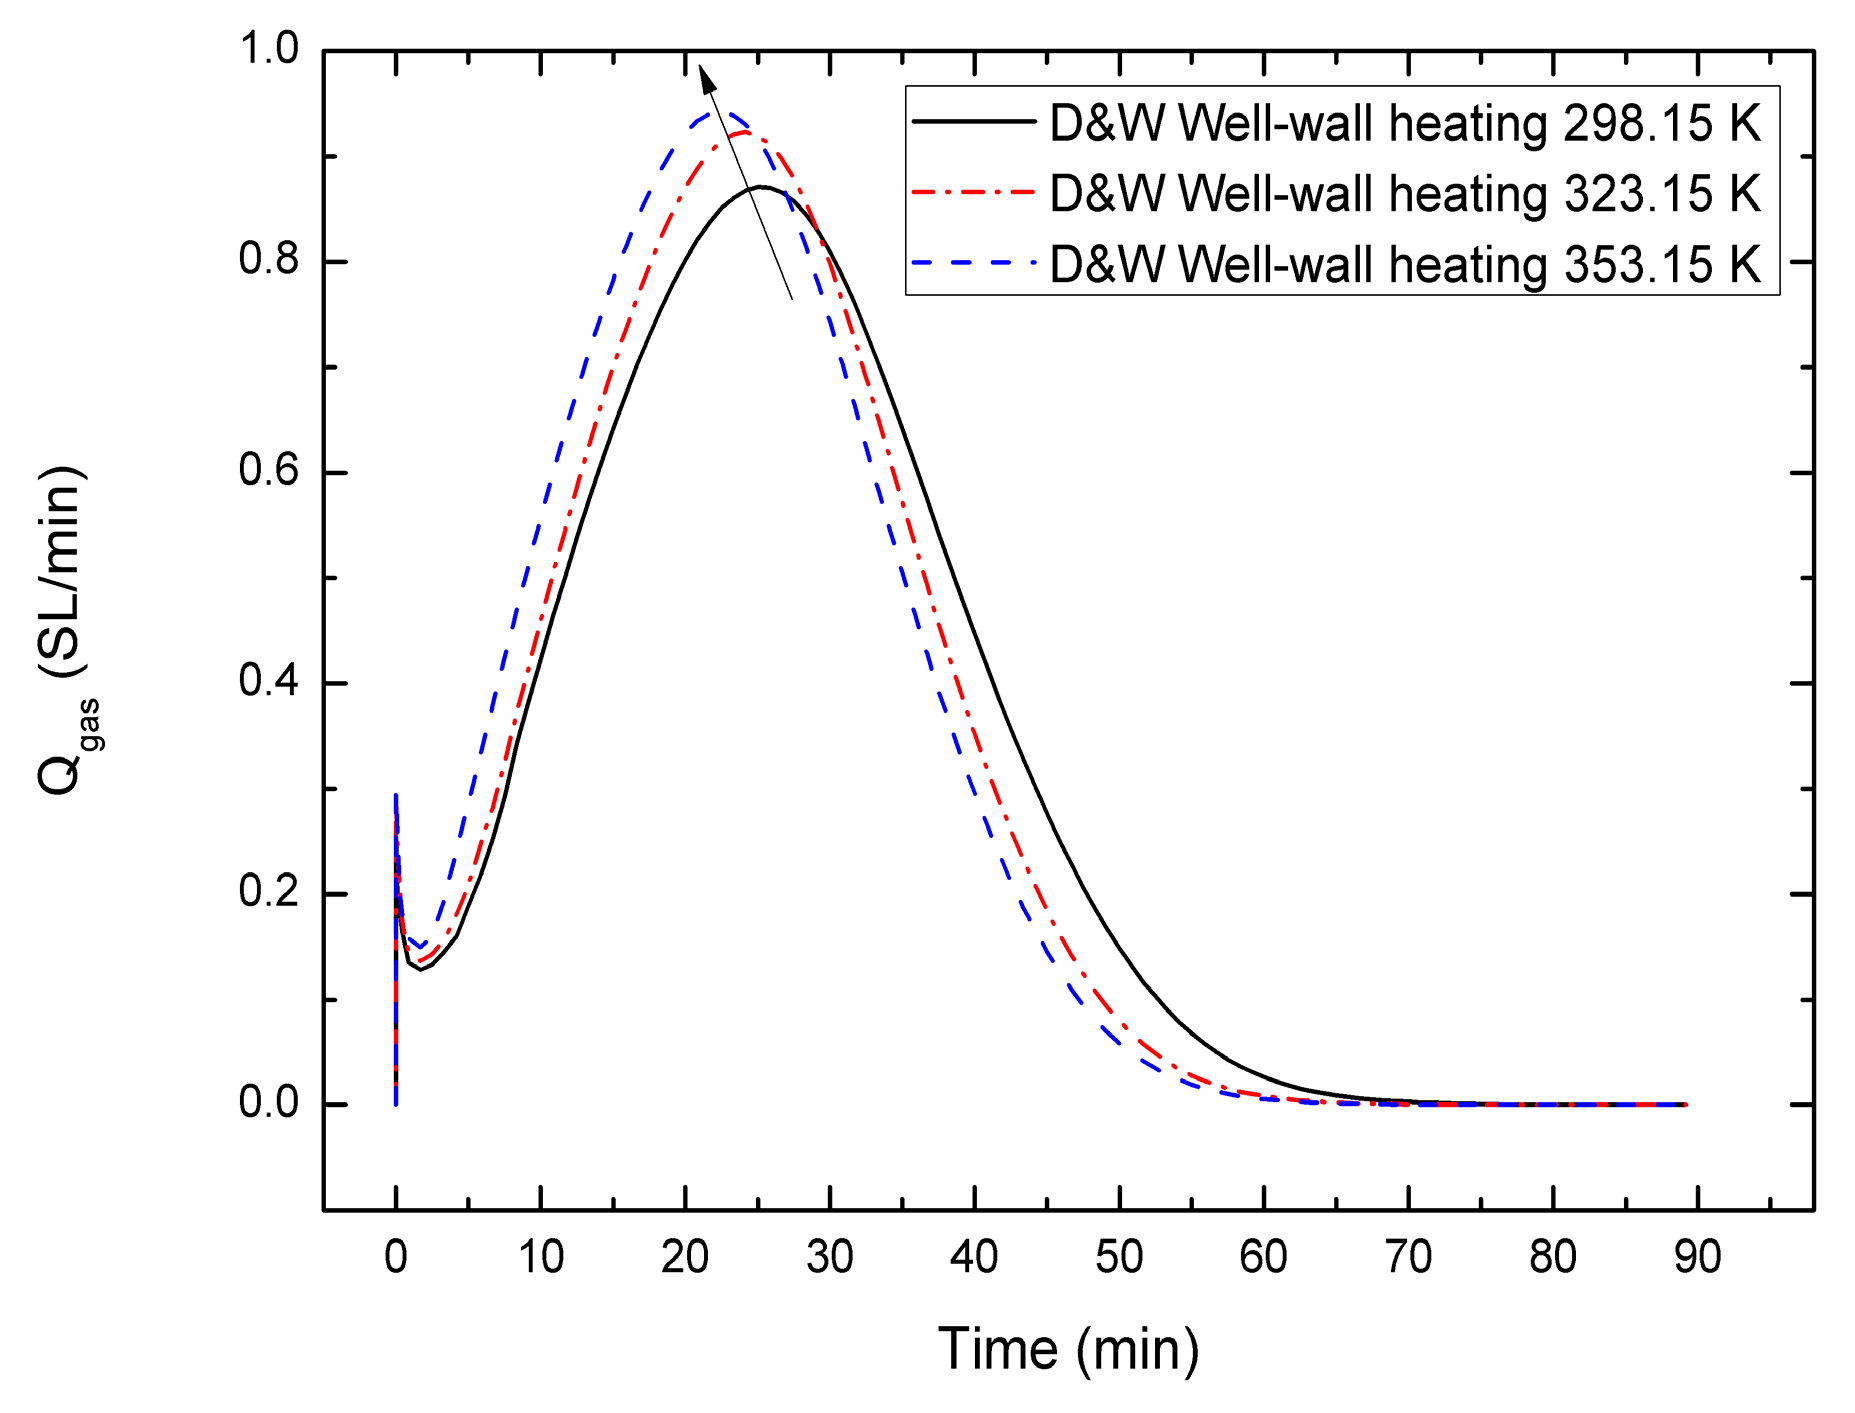
- Comparing with the gas production behaviors of the depressurization, well-wall heating and depressurization combined with well-wall heating method, the well-wall heating is benefit to increase the gas production, and the gas generation rate of the depressurization combined with well-wall heating method is highest, followed by the other cases. Meanwhile, owing to the fact that the thermal conduction of well-wall heating is slow and the heat transmits only to a small dissociation area, the influence of the well-wall heating on gas production is limited, even is gradually weakened with an increasing well-wall heating temperature. A single wellbore may not be suitable for the gas production from hydrate using the depressurization combined with higher well-wall heating temperature.
- (3)
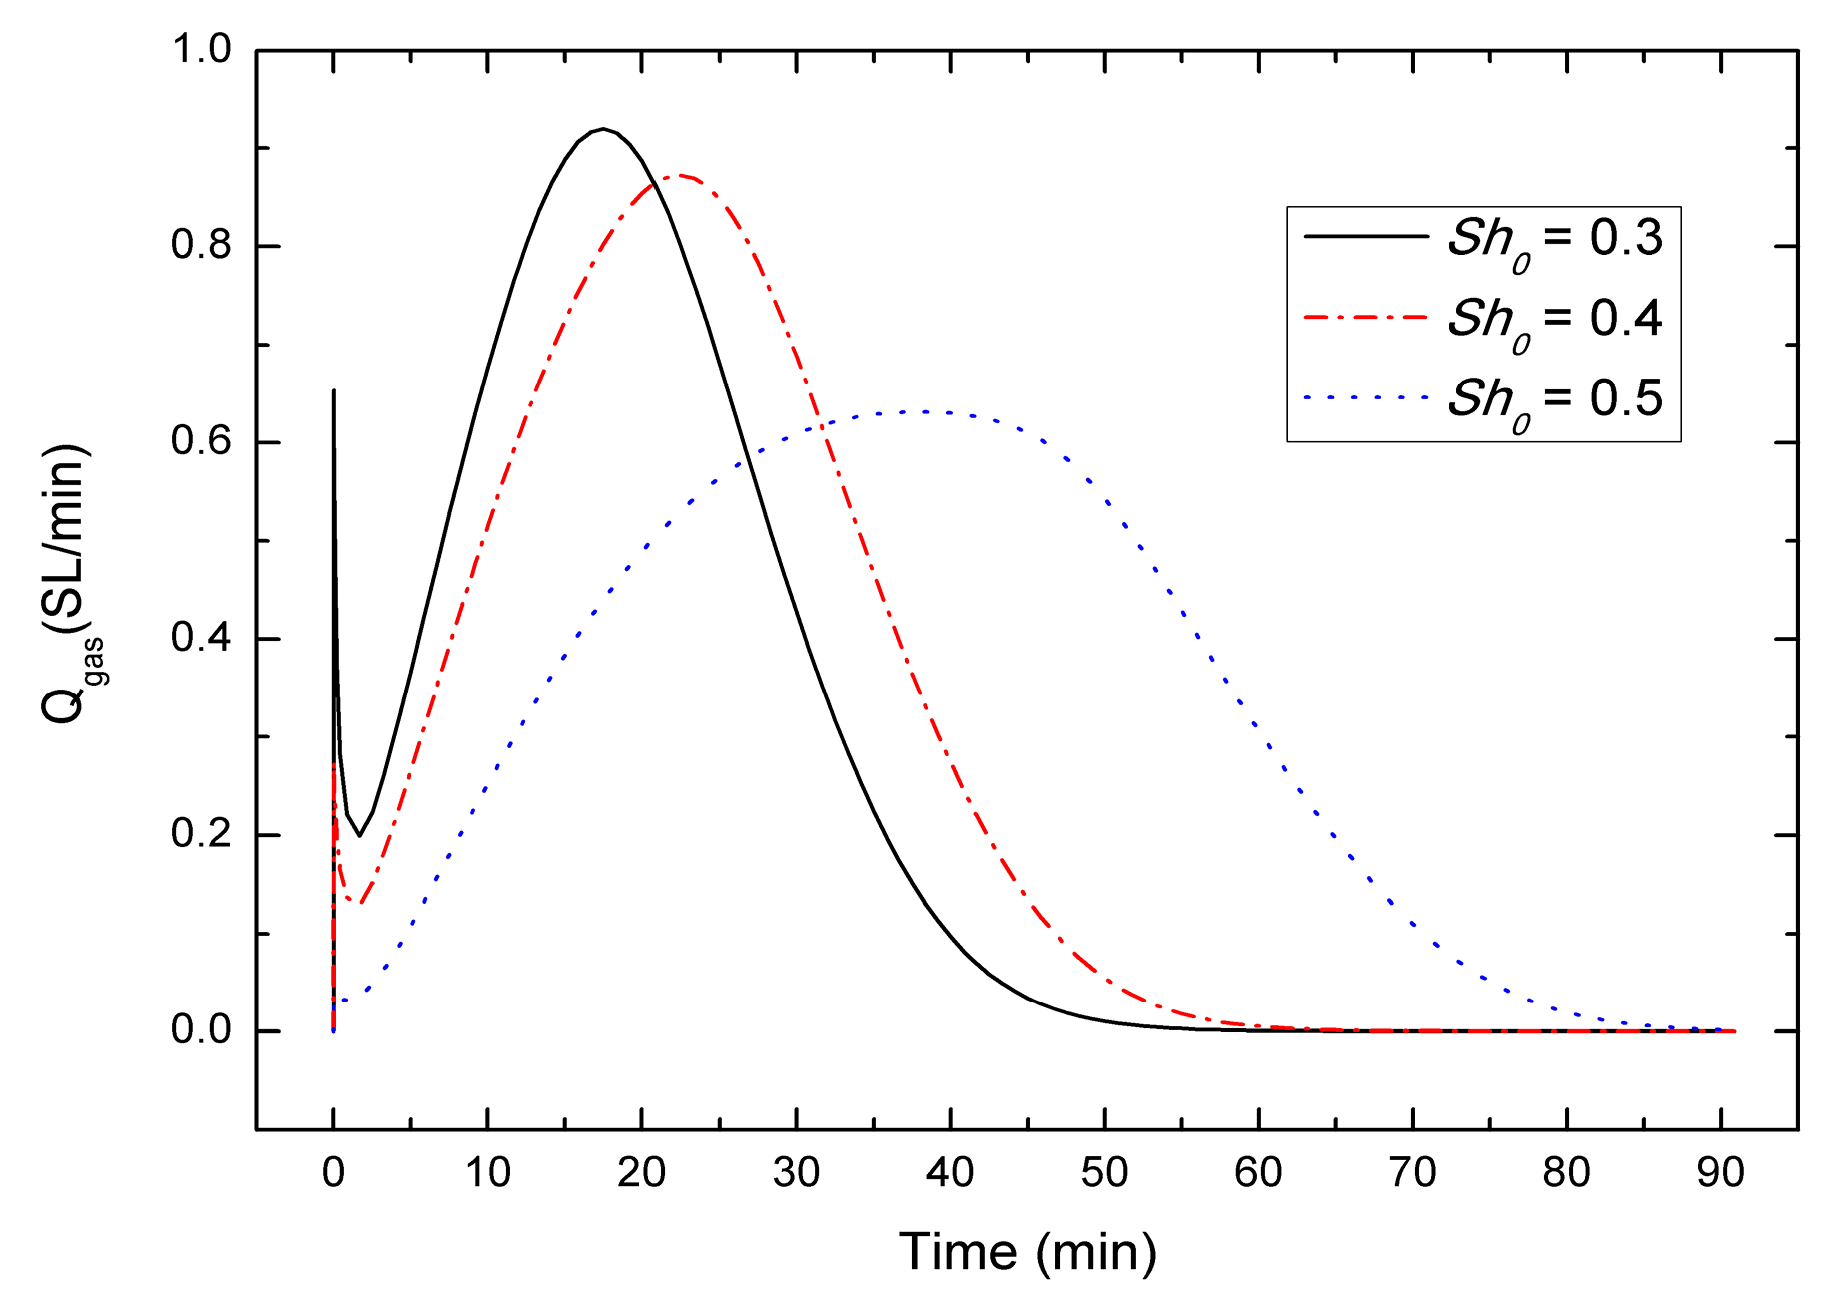
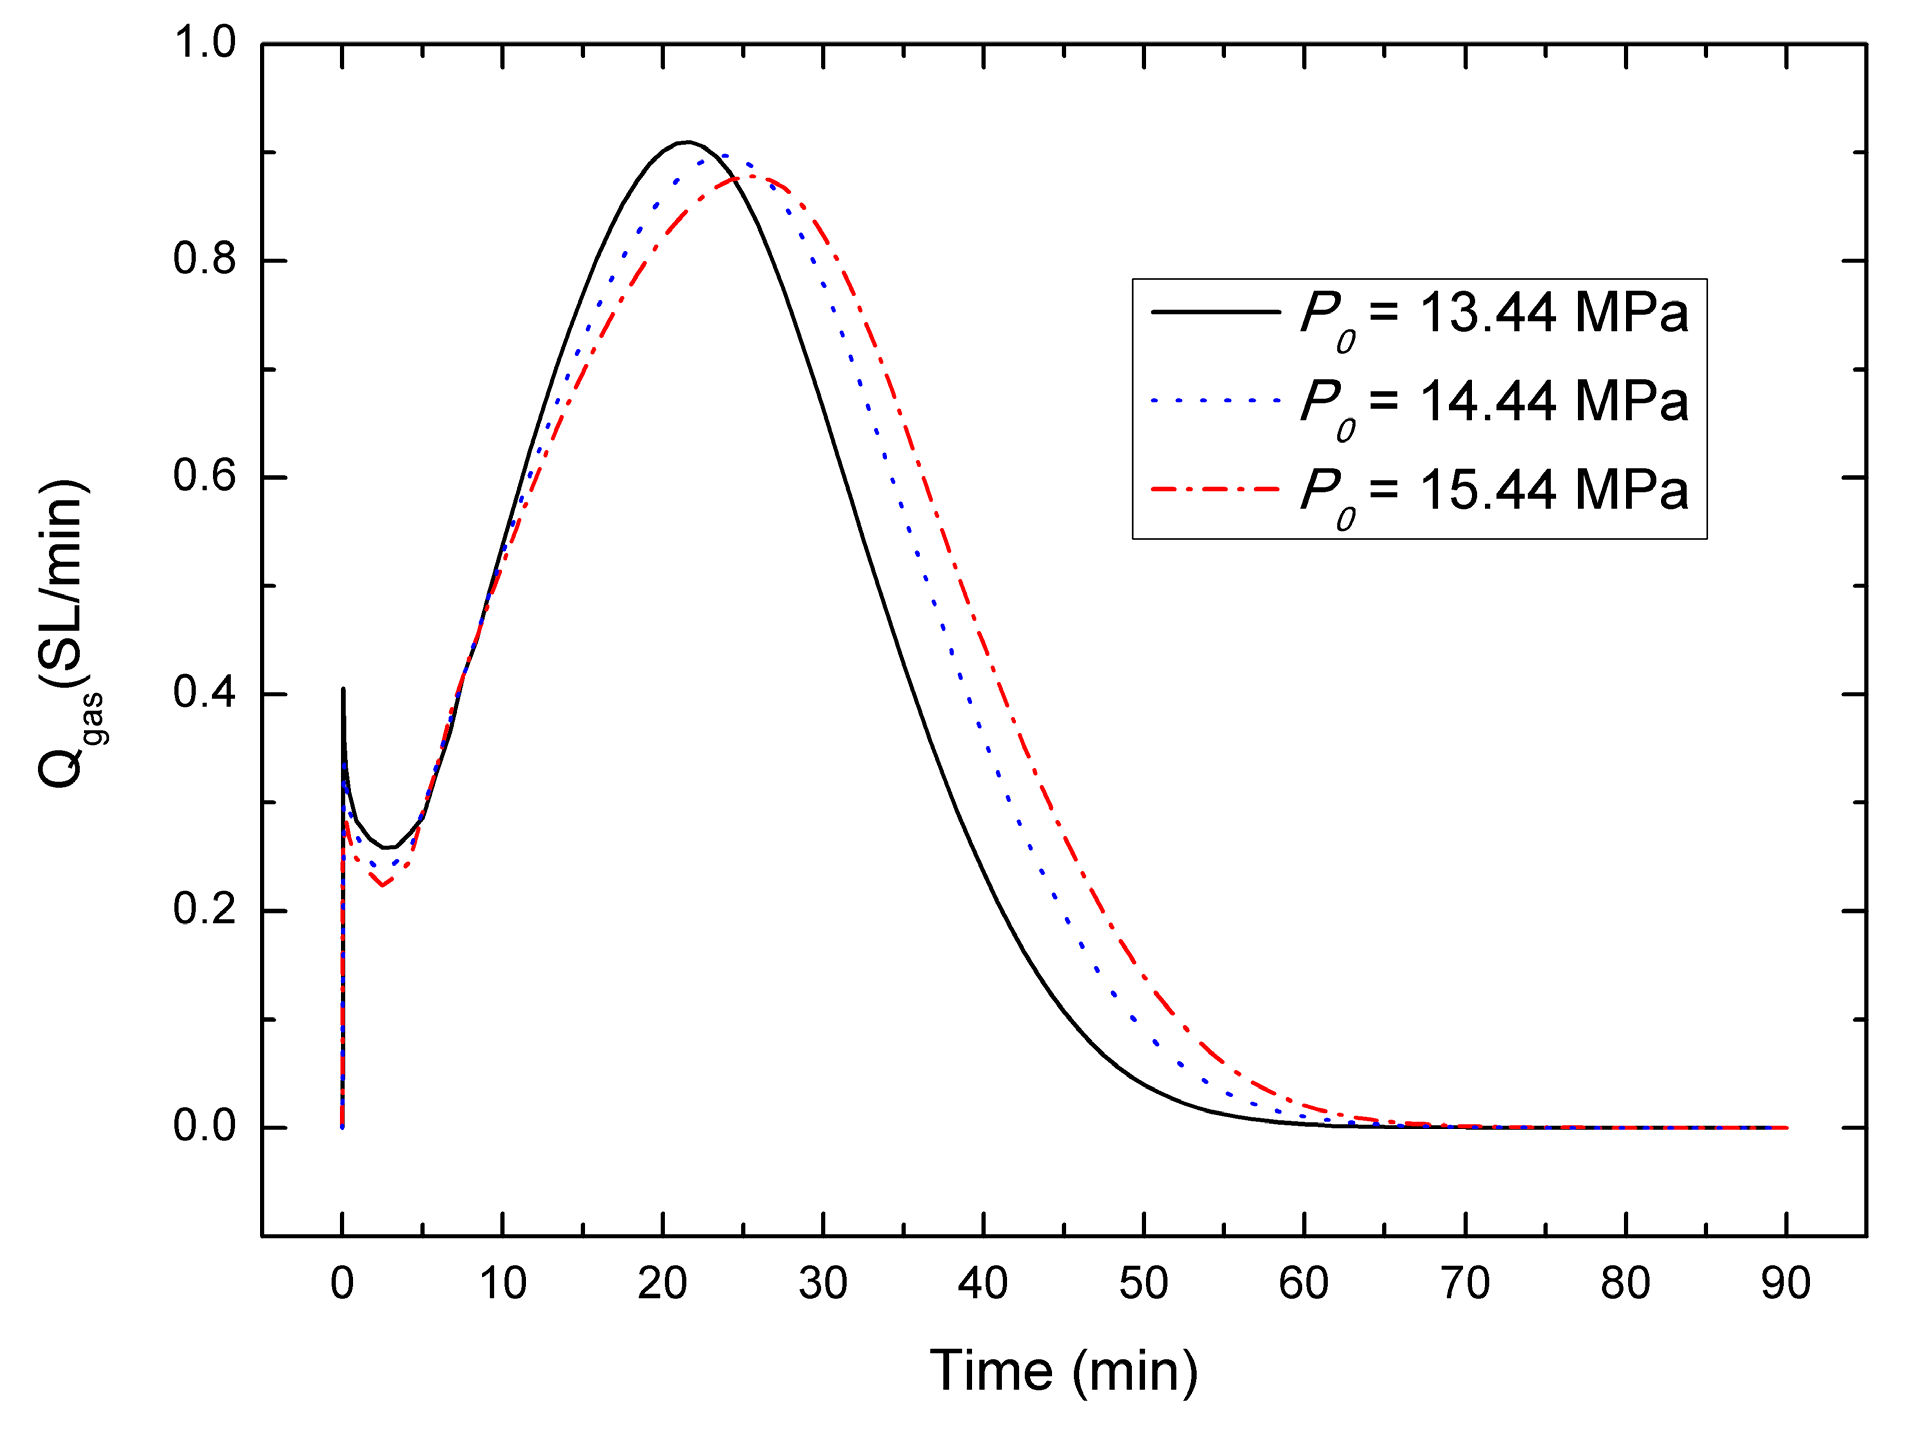
- For the depressurization combined with well-wall heating method, a lower initial hydrate saturation leads to a higher gas generation rate, the gas generation rate increases with the decrease of initial pressure, and in contrast with the effect of initial hydrate saturation and initial pressure, the effect of initial temperature on the gas production behavior could be nearly negligible, which is different from the case of other production method.
- (4)
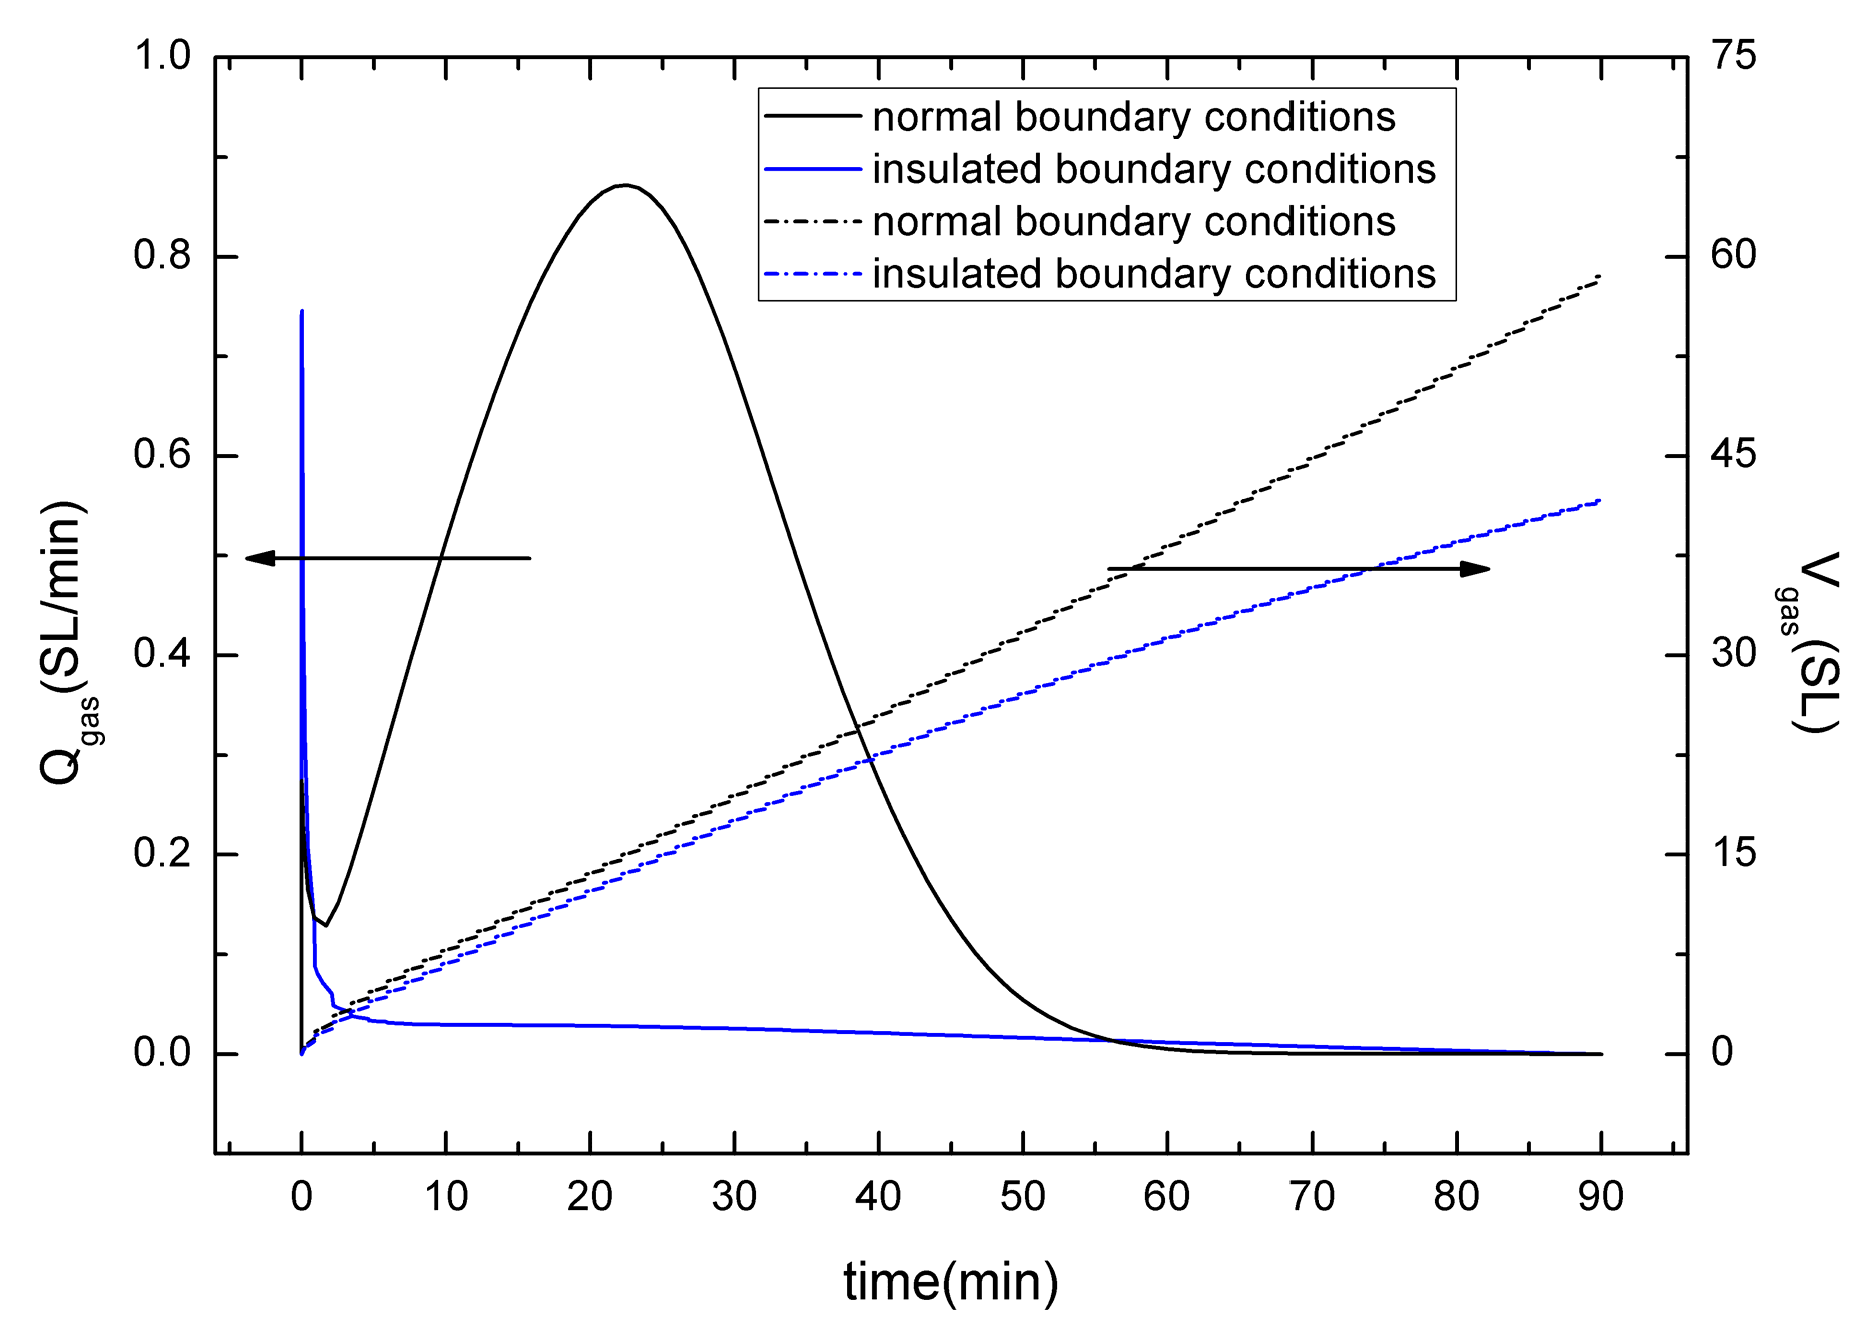
- For the depressurization combined with well-wall heating method, the gas production strongly depends on the heat originating from the boundaries, the supply of heat from surrounding boundaries controls the hydrate dissociation and gas production. The depressurization combined with well-wall heating method may be unfeasible for the hydrate exploitation in a surrounding with lower temperature.
Acknowledgments
Author Contributions
Conflicts of Interest
Nomenclature
| As | specific surface area of porous medium bearing gas hydrate (m2) |
| Cp | specific heat capacity (J·kg−1·K−1) |
| Cps | heat capacity of porous media (J·kg−1·K−1) |
| Cpg | heat capacity of gas (J·kg−1·K−1) |
| Cpw | heat capacity of water (J·kg−1·K−1) |
| Cph | heat capacity of hydrate (J·kg−1·K−1) |
| fe | fugacity of gas at the hydrate equilibrium pressure corresponding to the local temperature |
| f | fugacity of gas under the local temperature and pressure |
| the enthalpy change in hydrate dissociation (J·kg−1) | |
| Hg | enthalpy of gas (J·kg−1) |
| Hw | enthalpy of water (J·kg−1) |
| Hh | enthalpy of hydrate (J·kg−1) |
| Hs | enthalpy of porous media (J·kg−1) |
| k | thermal conductivity (W·m−1·K−1) |
| kc | thermal conductivity coefficient of hydrate-bearing medium (W·m−1·K−1) |
| kg | thermal conductivity coefficient of gas (W·m−1·K−1) |
| kw | thermal conductivity coefficient of water (W·m−1·K−1) |
| kh | thermal conductivity coefficient of hydrate (W·m−1·K−1) |
| ks | thermal conductivity coefficient of porous media (W·m−1·K−1) |
| K | absolute permeability (mD) |
| K0 | original permeability without hydrate (mD) |
| k0 | initial absolute permeability (mD) |
| kd | dissociation rate constant (mol/(m2·Pa·s)) |
| krg | relative permeability of gas phase |
| krw | relative permeability of water phase |
| L | sample length (mm) |
| mass rate of gas generated by hydrate dissociation per unit volume (kg/(m3·s)) | |
| mass rate of water generated by hydrate dissociation per unit volume (kg/(m3·s)) | |
| mass rate by hydrate dissociated per unit volume (kg/(m3·s)) | |
| Mg | molecular weight of gas (kg/kmol) |
| Mw | molecular weight of water (kg/kmol) |
| Nh | hydrate number |
| nw | empirical constant (nw = 4) |
| ng | empirical constant (ng = 2) |
| N | permeability reduction index |
| P | pressure (Pa) |
| Pe | equilibrium pressure (Pa) |
| Pg | gas pressure (Pa) |
| Pw | water pressure (Pa) |
| P0 | initial pressure (Pa) |
| ΔPBHP | bottom-hole pressure (Pa) |
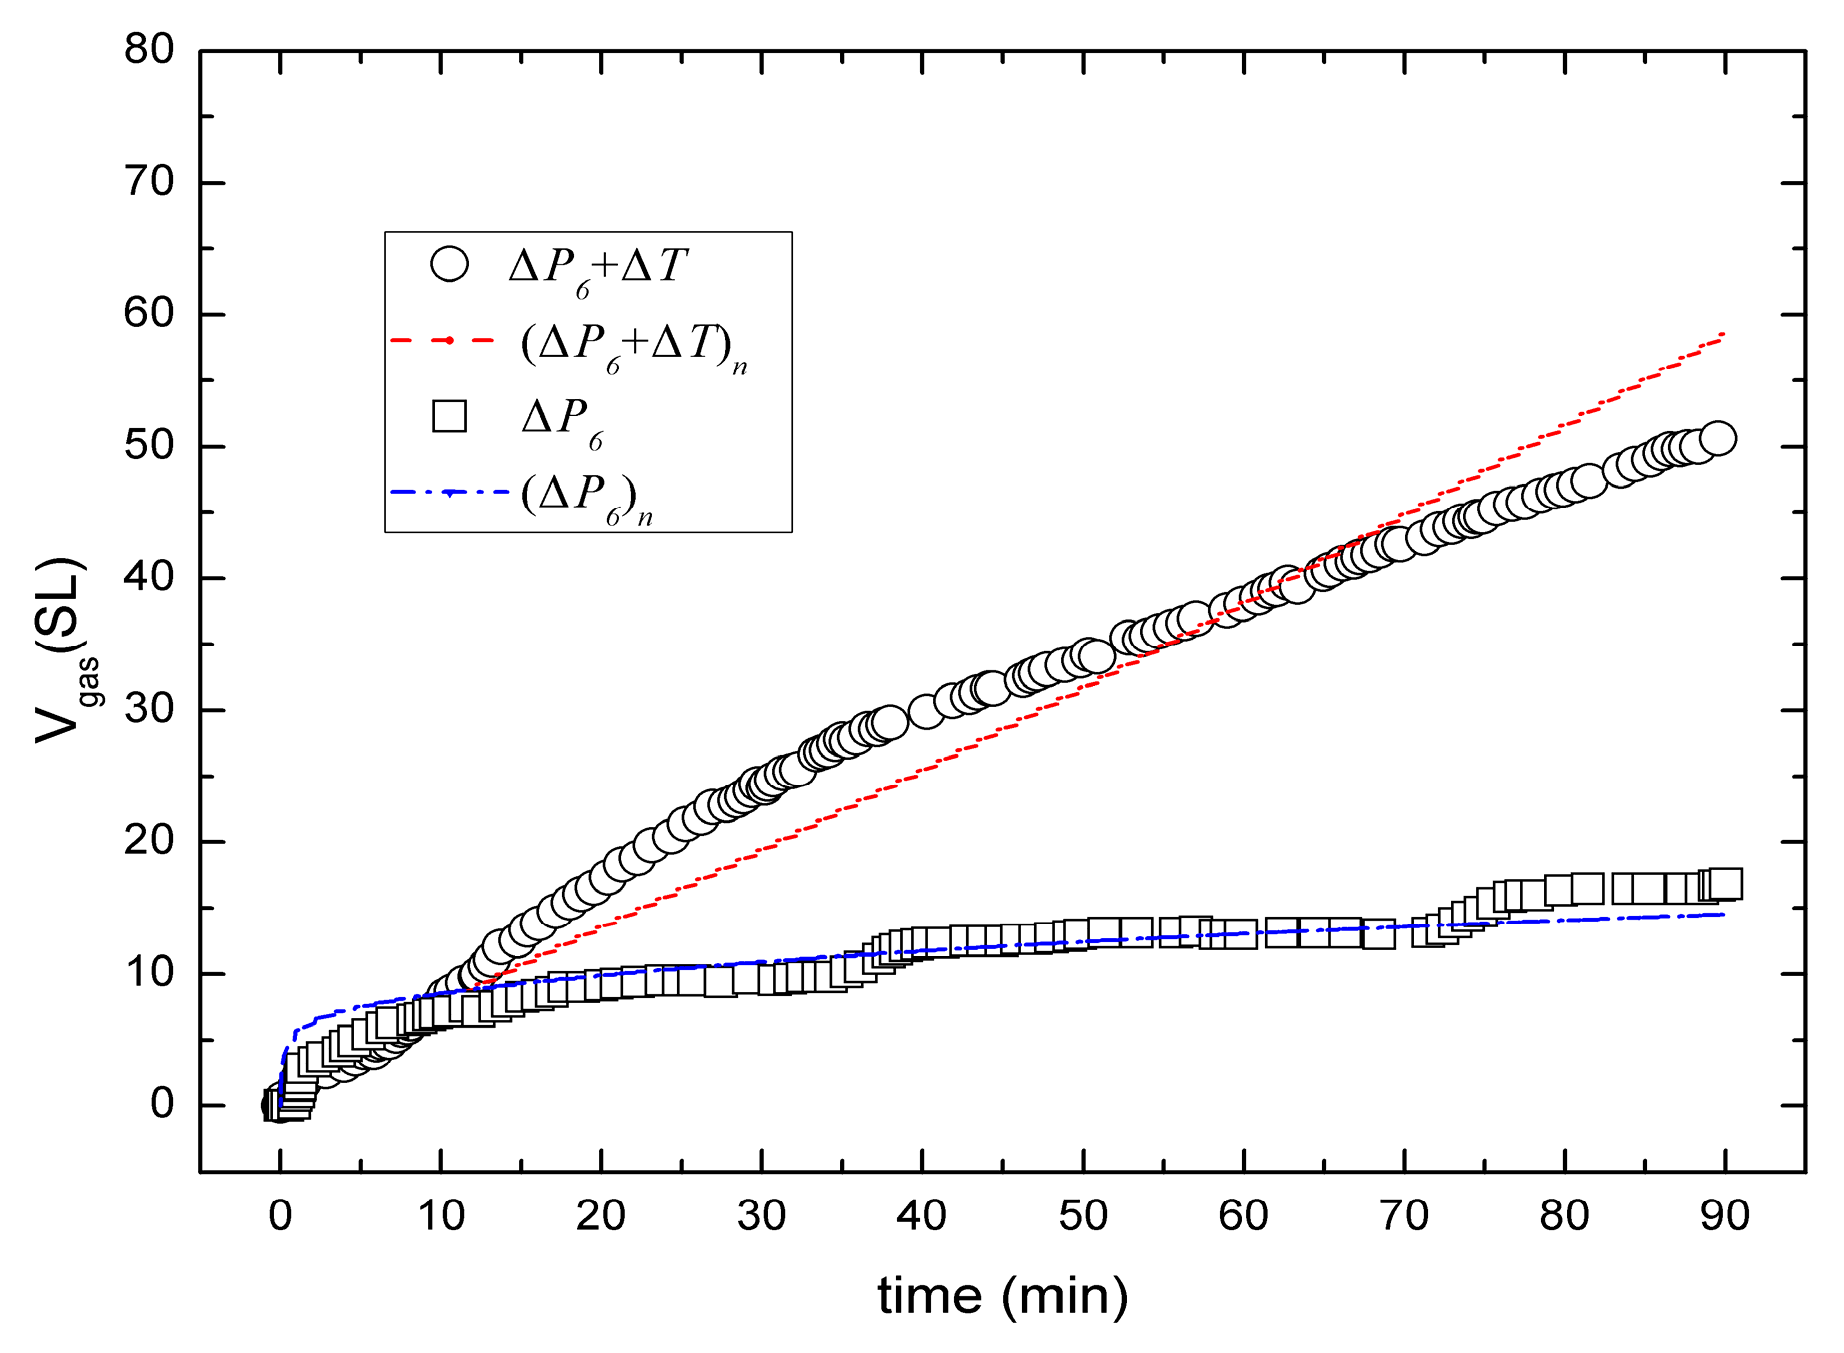
| ΔP6 | production pressure depressurized to 5.95 MPa |
| ΔP6 + ΔT | production pressure depressurized to 5.95 MPa with the well-wall heating |
| mass rate in terms of injection/production of gas (kg/(m3·s)) | |
| mass rate in terms of injection/production of water (kg/(m3·s)) | |
| heat of hydrate decomposition unit bulk volume (J/(m3·s)) | |
| heat from the surroundings (J/(m3·s)) | |
| R | sample diameter (mm) |
| Sg | hydrate saturation |
| Sw | water saturation |
| Sh | gas saturation |
| Sgr | residual gas saturation |
| Swr | irreducible water saturation |
| T | system temperature (K) |
| T0 | initial temperature (K) |
| Tb | boundary temperature (K) |
| TE | environment temperature (K) |
| Twell | well-wall heating temperature (K) |
| t | time (s) |
| νgr | velocity of gas in r-direction (m/s) |
| νgx | velocity of gas in x-direction (m/s) |
| νwr | velocity of water in r-direction (m/s) |
| νwx | velocity of water in x-direction (m/s) |
| x | axial distance |
| g | gas |
| w | water |
| r | radial distance |
| s | porous media |
| porosity | |
| σI | throttling coefficient for the i phase |
| ρg | density of gas (kg/m3) |
| ρw | density of water (kg/m3) |
| µg | viscosity of gas (Pa·s) |
| µw | viscosity of water (Pa·s) |
References
- Sloan, E.D.; Koh, C.A. Clathrate Hydrates of Natural Gases, 3rd ed.; CRC Press: Boca Raton, FL, USA, 2008. [Google Scholar]
- Makogon, Y.F.; Holditch, S.A.; Makogon, T.Y. Natural gas-hydrates—A potential energy source for the 21st century. J. Pet. Sci. Eng. 2007, 56, 14–31. [Google Scholar] [CrossRef]
- Moridis, G.J.; Collett, T.S.; Boswell, R.; Kurihara, M.; Reagan, M.T.; Koh, C.; Sloan, E.D. Toward production from gas hydrates: Current status, assessment of resources, and simulation-based evaluation of technology and potential. SPE Reserv. Eval. Eng. 2009, 12, 745–771. [Google Scholar] [CrossRef]
- Tang, L.G.; Xiao, R.; Huang, C.; Feng, Z.P.; Fan, S.S. Experimental investigation of production behavior of gas hydrate under thermal stimulation in unconsolidated sediment. Energy Fuels 2005, 19, 2402–2407. [Google Scholar] [CrossRef]
- Li, X.S.; Yang, B.; Li, G.; Li, B.; Zhang, Y.; Chen, Z.Y. Experimental study on gas production from methane hydrate in porous media by huff and puff method in pilot-scale hydrate simulator. Fuel 2012, 94, 486–494. [Google Scholar] [CrossRef]
- Castellani, B.; Rossetti, G.; Tupsakhare, S.; Rossi, F.; Nicolini, A.; Castaldi, M.J. Simulation of CO2 storage and methane gas production from gas hydrates in a large scale laboratory reactor. J. Pet. Sci. Eng. 2016, 147, 515–527. [Google Scholar] [CrossRef]
- Castaldi, M.J.; Zhou, Y.; Yegulalp, T.M. Down-hole combustion method for gas production from methane hydrates. J. Pet. Sci. Eng. 2007, 56, 176–185. [Google Scholar] [CrossRef]
- Sun, X.; Nanchary, N.; Mohanty, K.K. 1-D modeling of hydrate depressurization in porous media. Transp. Porous Media 2005, 58, 315–338. [Google Scholar] [CrossRef]
- Moridis, G.; Kowalsky, M.; Pruess, K. Depressurization-induced gas production from Class 1 hydrate deposits. SPE Reserv. Eval. Eng. 2007, 10, 458–481. [Google Scholar] [CrossRef]
- Konno, Y.; Masuda, Y.; Akamine, K.; Naiki, M.; Nagao, J. Sustainable gas production from methane hydrate reservoirs by the cyclic depressurization method. Energy Convers. Manag. 2016, 108, 439–445. [Google Scholar] [CrossRef]
- Zhang, L.X.; Zhao, J.F.; Dong, H.S.; Zhao, Y.C.; Liu, Y.; Zhang, Y.; Song, Y.C. Magnetic resonance imaging for in-situ observation of the effect of depressurizing range and rate on methane hydrate dissociation. Chem. Eng. Sci. 2016, 144, 135–143. [Google Scholar] [CrossRef]
- Kawamura, T.; Sakamoto, Y.; Ohtake, M.; Yamamoto, Y.; Haneda, H.; Yoon, J.H.; Komai, T. Dissociation behavior of hydrate core sample using thermodynamic inhibitor. Int. J. Offshore Polar Eng. 2006, 16, 5–9. [Google Scholar]
- Li, G.; Li, X.S.; Tang, L.G.; Zhang, Y. Experimental investigation of production behavior of methane hydrate under ethylene glycol injection in unconsolidated sediment. Energy Fuels 2007, 21, 3388–3393. [Google Scholar] [CrossRef]
- Ersland, G.; Huseb, J.; Graue, A.; Baldwin, B.A.; Howard, J.; Stevens, J. Measuring gas hydrate formation and exchange with CO2 in Bentheim sandstone using MRI tomography. Chem. Eng. J. 2010, 158, 25–31. [Google Scholar] [CrossRef]
- Xu, C.G.; Cai, J.; Lin, F.H.; Chen, Z.Y.; Li, X.S. Raman analysis on methane production from natural gas hydrate by carbon dioxide-methane replacement. Energy 2015, 79, 111–116. [Google Scholar] [CrossRef]
- Li, G.; Moridis, G.J.; Zhang, K.; Li, X.-S. Evaluation of gas production potential from marine gas hydrate deposits in Shenhu area of South China Sea. Energy Fuels 2010, 24, 6018–6033. [Google Scholar] [CrossRef]
- Falser, S.; Uchida, S.; Palmer, A.C.; Soga, K.; Tan, T.S. Increased gas production from hydrates by combining depressurisation with heating of the wellbore. Energy Fuels 2012, 26, 6259–6267. [Google Scholar] [CrossRef]
- Yang, S.; Lang, X.; Wang, Y.; Wen, Y.; Fan, S. Numerical simulation of Class 3 hydrate reservoirs exploiting using horizontal well by depressurization and thermal co-stimulation. Energy Convers. Manag. 2014, 77, 298–305. [Google Scholar] [CrossRef]
- Feng, J.C.; Wang, Y.; Li, X.S.; Li, G.; Zhang, Y.; Chen, Z.Y. Production performance of gas hydrate accumulation at the GMGS2-site 16 of the Pearl River mouth basin in the South China Sea. J. Nat. Gas Sci. Eng. 2015, 27, 306–320. [Google Scholar] [CrossRef]
- Song, Y.; Wang, J.; Liu, Y.; Zhao, J. Analysis of heat transfer influences on gas production from methane hydrates using a combined method. Int. J. Heat Mass Transf. 2016, 92, 766–773. [Google Scholar] [CrossRef]
- Dallimore, S.R.; Collett, T.S.; Taylor, A.E.; Uchida, T.; Weber, M.; Chandra, A.; Mroz, T.H.; Caddel, E.M.; Inoue, T. Scientific Results from the Mallik 2002 Gas Hydrate Production Research Well Program, Mackenzie Delta, Northwest Territories, Canada; Bulletin 585; Geological Survey of Canada: Qttawa, ON, Canada, 2005. [Google Scholar]
- Anderson, B.J.; Kurihara, M.; White, M.D.; Moridis, G.J.; Wilson, S.J.; Pooladi-Darvish, M.; Gaddipati, M.; Masuda, Y.; Collett, T.S.; Hunter, R.B.; et al. Regional long-term production modeling from a single well test, Mount Elbert gas hydrate stratigraphic test well, Alaska North Slope. Mar. Pet. Geol. 2011, 28, 493–501. [Google Scholar] [CrossRef]
- Moridis, G.J.; Silpngarmlert, S.; Reagan, M.T.; Collett, T.; Zhang, K. Gas production from a cold, stratigraphically-bounded gas hydrate deposit at the Mount Elbert gas hydrate stratigraphic test well, Alaska North Slope: Implications of uncertainties. Mar. Pet. Geol. 2011, 28, 517–534. [Google Scholar] [CrossRef]
- Yamamoto, K. Overview and introduction: Pressure core-sampling and analyses in the 2012–2013 MH21 offshore test of gas production from methane hydrates in the Eastern Nankai Trough. Mar. Pet. Geol. 2015, 66, 296–309. [Google Scholar] [CrossRef]
- Li, X.S.; Xu, C.G.; Zhang, Y.; Ruan, X.K.; Li, G.; Wang, Y. Investigation into gas production from natural gas hydrate: A review. Appl. Energy 2016, 172, 286–322. [Google Scholar] [CrossRef]
- Kurihara, M.; Sato, A.; Ouchi, H.; Narita, H.; Masuda, Y.; Saeki, T.; Fujii, T. Prediction of gas productivity from Eastern Nankai Trough methane-hydrate reservoirs. SPE Reserv. Eval. Eng. 2009, 12, 477–499. [Google Scholar] [CrossRef]
- Liang, H.; Song, Y.; Chen, Y. Numerical simulation for laboratory-scale methane hydrate dissociation by depressurization. Energy Convers. Manag. 2010, 51, 1883–1890. [Google Scholar] [CrossRef]
- Ruan, X.; Song, Y.; Zhao, J.; Liang, H.; Yang, M.; Li, Y. Numerical simulation of methane production from hydrates induced by different depressurizing approaches. Energies 2012, 5, 438–458. [Google Scholar] [CrossRef]
- Gerami, S.; Pooladi-Darvish, M. Predicting gas generation by depressurization of gas hydrates where the sharp-interface assumption is not valid. J. Pet. Sci. Eng. 2007, 56, 146–164. [Google Scholar] [CrossRef]
- Li, X.S.; Zhang, Y.; Li, G.; Chen, Z.Y.; Wu, H.J. Experimental investigation into the production behavior of methane hydrate in porous sediment by depressurization with a novel three-dimensional cubic hydrate simulator. Energy Fuels 2011, 25, 4497–4505. [Google Scholar] [CrossRef]
- Seol, Y.; Myshakin, E. Experimental and numerical observations of hydrate reformation during depressurization in a core-scale reactor. Energy Fuels 2011, 25, 1099–1110. [Google Scholar] [CrossRef]
- Falser, S. Gas Production from Methane Hydrate Bearing Sediments; National University of Singapore: Singapore, 2012. [Google Scholar]
- Seol, Y.; Kneafsey, T.J. Methane hydrate induced permeability modification for multiphase flow in unsaturated porous media. J. Geophys. Res. 2011, 116. [Google Scholar] [CrossRef]
- Ruan, X.; Yang, M.; Song, Y.; Liang, H.; Li, Y. Numerical studies of hydrate dissociation and gas production behavior in porous media during depressurization process. J. Nat. Gas Chem. 2012, 21, 381–392. [Google Scholar] [CrossRef]
- Sung, W.M.; Huh, D.G.; Ryu, B.J.; Lee, H.S. Development and application of gas hydrate reservoir simulator based on depressurizing mechanism. Korean J. Chem. Eng. 2000, 17, 344–350. [Google Scholar] [CrossRef]
- Moridis, G.J. Numerical studies of gas production from Class 2 and Class 3 hydrate accumulations at the Mallik Site, Mackenzie Delta, Canada. SPE Reserv. Eval. Eng. 2004, 7, 175–183. [Google Scholar] [CrossRef]
- Liu, Y.; Strumendo, M.; Arastoopour, H. Simulation of methane production from hydrates by depressurization and thermal stimulation. Ind. Eng. Chem. Res. 2009, 48, 2451–2464. [Google Scholar] [CrossRef]
- Konno, Y.; Masuda, Y.; Hariguchi, Y.; Kurihara, M.; Ouchi, H. Key factors for depressurization-induced gas production from oceanic methane hydrates. Energy Fuels 2010, 24, 1736–1744. [Google Scholar] [CrossRef]
- Ruan, X.; Song, Y.; Liang, H.; Yang, M.; Dou, B. Numerical simulation of the gas production behavior of hydrate dissociation by depressurization in hydrate-bearing porous medium. Energy Fuels 2012, 26, 1681–1694. [Google Scholar] [CrossRef]
- Masuda, Y.; Fujinaga, Y.; Naganawa, S.; Fujita, H.; Sato, T.; Hayashi, Y. Modeling and experimental studies on dissociation of methane gas hydrates in Berea sandstone cores. In Proceedings of the 3rd Internatinal Conference on Gas Hydrates, Salt Lake City, UT, USA, 18–22 July 1999.
- Sun, X.F.; Mohanty, K.K. Kinetic simulation of methane hydrate formation and dissociation in porous media. Chem. Eng. Sci. 2006, 61, 3476–3495. [Google Scholar] [CrossRef]
- Moridis, G.J.; Kowalsky, M.B.; Pruess, K. TOUGH + Hydrate v1.0.1 User’s Manual: A Code for the Simulation of System Behavior in Hydrate-Bearing Geologic Media; Lawrence Berkeley National Laboratory: Berkeley, CA, USA, 2005.
- Reagan, M.T.; Moridis, G.J.; Zhang, K. Sensitivity analysis of gas production from Class 2 and Class 3 hydrate deposits. In Proceedings of the Offshore Technology Conference (OTC), Houston, TX, USA, 5–8 May 2008.
- Tester, J.W.; Modell, M. Thermodynamics and Its Applications; Prentice Hall: Upper Saddle River, NJ, USA, 1997. [Google Scholar]
- Kim, H.; Bishnoi, P.; Heidemann, R.; Rizvi, S. Kinetics of methane hydrate decomposition. Chem. Eng. Sci. 1987, 42, 1645–1653. [Google Scholar] [CrossRef]
- Amyx, J.W.; Bass, D.M.; Whiting, R.L. Petroleum Reservoir Engineering; McGraw-Hill Book Company: New York, NY, USA, 1960. [Google Scholar]
- Su, Z.; Huang, L.; Wu, N.; Yang, S. Effect of thermal stimulation on gas production from hydrate deposits in Shenhu area of the South China Sea. Sci. China Earth Sci. 2013, 56, 601–610. [Google Scholar] [CrossRef]


| Variable | Value | Variable | Value |
|---|---|---|---|
| Sample length, L (mm) | 206 | Sample diameter, R (mm) | 180 |
| Initial pressure, P0 (MPa) | 14.44 | Initial temperature, T0 (K) | 282.2 |
| Heating temperature Twell (K) | 288.15 | Boundary temperature, Tb (K) | 282.2 |
| Intrinsic porosity, | 0.378 | Absolute permeability, k0 (mD) | 350 |
| Hydrate saturation, Sh0 | 0.42 | Environment temperature, TE (K) | 282.2 |
| Water saturation, Sw0 | 0.50 | Bottom-hole pressure, ΔPBHP (MPa) | 5.95 |
| Gas saturation, Sg0 | 0.08 | Permeability reduction exponent, N | 10 |
| Variable | Value | |||
|---|---|---|---|---|
| Specific heat capacity (T = 293 K), Cp (J·kg−1·K−1) | 800 (sand) | 2010 (hydrate) | 4189 (water) | |
| 500 (steel) | 2157 (methane) | - | ||
| Thermal conductivity, k (W·m−1·K−1) | 3.92 (sand) | 0.62 (hydrate) | 0.56 (water) | |
| 16 (steel) | 0.034 (methane) | - | ||
| Density, ρ (g/cm3) | 2.60 (sand) | 0.90 (hydrate) | 1.0 (water) | |
| 7.8 (steel) | 16 (methane, g/mol) | |||
| Cory parameters | nw = 4 | ngas = 2 | ||
| Viscosity (T = 293 K), μ (Pa·s) | 0.001 (water) | 1.25 × 10⁻⁵ (methane) | ||
| Phase equilibrium pressure, Pe (kPa) | 1.15 × e49.3185 − 9459/T | |||
| Cumulative gas production after 90min, Vgas (SL) | 17 (experimental result of ΔP6) [17] | |||
| Cumulative gas production after 90min, Vgas (SL) | 53 (experimental result of ΔP6 + ΔT) [17] | |||
© 2017 by the authors. Licensee MDPI, Basel, Switzerland. This article is an open access article distributed under the terms and conditions of the Creative Commons Attribution (CC BY) license ( http://creativecommons.org/licenses/by/4.0/).
Share and Cite
Ruan, X.; Li, X.-S.; Xu, C.-G. Numerical Investigation of the Production Behavior of Methane Hydrates under Depressurization Conditions Combined with Well-Wall Heating. Energies 2017, 10, 161. https://doi.org/10.3390/en10020161
Ruan X, Li X-S, Xu C-G. Numerical Investigation of the Production Behavior of Methane Hydrates under Depressurization Conditions Combined with Well-Wall Heating. Energies. 2017; 10(2):161. https://doi.org/10.3390/en10020161
Chicago/Turabian StyleRuan, Xuke, Xiao-Sen Li, and Chun-Gang Xu. 2017. "Numerical Investigation of the Production Behavior of Methane Hydrates under Depressurization Conditions Combined with Well-Wall Heating" Energies 10, no. 2: 161. https://doi.org/10.3390/en10020161