1. Introduction
Combustion processes are supported by the heat produced by the combustion reactions [
1,
2,
3,
4]. For a small volume of the reaction chamber, the surface-to-volume ratio becomes large, and the heat escapes from the volume too quickly to sustain the combustion. Quenching of the reactions is the main obstacle for scaling down internal combustion engines [
5,
6], which could be used to power different kinds of micro and minidevices [
7,
8]. Nevertheless, combustion of a stoichiometric mixture of hydrogen and oxygen was recently observed in nanobubbles [
9,
10] and at special conditions in microbubbles [
11,
12]. The reaction between gases is ignited spontaneously at room temperature, and cannot be explained by the standard combustion process. The high density of nanobubbles observed in the experiments suggests that the reaction is a surface-assisted process [
13], but no specific mechanism has ever been discussed.
Here we propose a mechanism for the combustion of the hydrogen–oxygen mixture in nanobubbles. The mechanism is related to charges existing on the gas–electrolyte interface. These charges provide sites where H2 (and possibly O2) molecules dissociate, producing H and O atoms in the gas phase. These atoms ignite and support the combustion reactions. The main prediction of the model that can be directly checked experimentally is that the surface-assisted combustion produces an appreciable amount of hydrogen peroxide, in contrast with the normal combustion.
Nanobubbles containing a mixture of gases were produced by the alternating polarity electrolysis when the voltage polarity of an electrode changes with a frequency
f ∼
kHz. In this case, a thin layer adjacent to the electrode is highly supersaturated with both gases [
9]. Nanobubbles that are formed in the layer do not grow large, and disappear in phase with the electrical pulses. Periodic reduction of the gas concentration was observed in different systems with a vibrometer [
9,
10]. Direct observation of the nanobubbles was not possible due to the small size (∼
nm) and short lifetime (∼
s) of the objects. However, at some conditions [
11,
12] the nanobubbles can merge to form a visible short-lived microbubble, which is also ignited spontaneously and disappears with a significant release of energy.
Energy production on the time scale of microseconds provides proof that the observed process is the combustion but not just conversion of the gases. The reaction between H
2 and O
2 gases in nanobubbles produces heat that cannot be explained by the Joule heating of the electrolyte. Because the heat escapes very quickly to the liquid and solid substrates, the temperature rise around the electrodes was expected less than 1 °C. Nevertheless, it was measured by a gold probe located in the vicinity of the electrodes [
9]. In an independent study [
14], the effect was investigated in detail using a built-in thermal microsensor. Much stronger heating—up to 50 °C—was observed in a microchamber covered with a flexible membrane [
10]. A significant heating due to a small thermal mass of the device was measured using the thermal dependence of the current passing through the electrolyte.
At high nanobubble density, they start to coalesce and form short-lived microbubbles. In a closed microchamber, the bubbles with a size of 5–10
m last for just a few microseconds [
11]. Each microbubble is accompanied by a pressure jump in the chamber, so the combustion energy was transformed not only to the heat, but also to the enthalpy of the liquid and to the mechanical work done by the flexible membrane. For an open millimeter-scale system, the microbubbles formed by coalescence have original size of
m, combustion happens in less than
s, and produces a well-audible sound (click) [
12]. The bubble inflates during
s to a size of
m, and the main part of the combustion energy is transformed to mechanical work done by the inflating bubble. The mechanism of combustion in microbubbles is related in some way to their origin from merging nanobubbles: the reaction is not ignited in bubbles with a size of
m produced by a microfluidic bubble generator from the premixed gases.
It has been known for a long time that bubbles in water carry a negative charge [
15,
16,
17,
18]. A similar effect was observed for oil drops in water [
19,
20]. The experiment showed that
-potential of the bubbles (drops) changes with pH from zero at pH = 2–4 up to
mV at pH
. The surface density of charges measured for oil drops [
20] corresponds roughly
cm
−2 at neutral pH. For bubbles in water, the charge density is expected to be in the same range, because the pH dependence of the
-potential is similar to that for the drops [
21].
Significant
-potential of the bubbles and drops is typically associated with the adsorption of hydroxyl ions at the interface. However, not all authors support this point of view. For example, it was proposed in [
22] that the charge transfer is related to the anisotropy of water–water hydrogen bonding at the interface. Different points of view on the origin of the charges on the interface are reviewed in [
21,
22] (see original references therein), but the experimental fact that the negative charges exist on the interface is not disputed.
2. Model
We assume that the charges on the bubble walls can play the role of special sites for dissociation of H
2 and possibly O
2 molecules. Although there is no direct experimental evidence for this specific dissociation, the generation of OH free radicals was observed in collapsing microbubbles filled with air, oxygen, or ozone in the absence of external dynamic stimuli [
23,
24]. The microbubbles with a size smaller than
m decrease in size and collapse softly under water after several minutes. Although pressure in the shrinking bubble increases, temperature does not change significantly because the process proceeds slowly in comparison with acoustically driven bubbles [
25,
26]. The pressure increase alone is not sufficient to produce radicals, and it was proposed [
23] that the charges on the bubble surface play a role. We believe that surface-assisted reactions have to be involved and the surface charges provides sites for these reactions.
A molecule impinging on a charged site acquires the electrostatic energy , where is the static polarizability of the molecule (for hydrogen Å3), is the vacuum permittivity, q is the electric charge of the site, and h is the distance between the site and the molecule. The equilibrium distance due to the van der Waals attraction and the short-range repulsion is about Å. Using the maximal charge on the site to be the charge of an electron, , one finds eV, which is much smaller than the dissociation energy (eV for H2). Therefore, direct interaction of the induced dipole with the charged site can play only a marginal role.
In spite of a large dissociation energy, plasmon-induced dissociation of H
2 was reported on gold nanoparticles [
27,
28]. The mechanism includes transition of a hot electron on an antibonding state of an approaching molecule with the following dissociation of
ion. In our case, if the charged site is OH
−, the energy of electron with respect to vacuum is
eV [
29]. It is considerably deeper than the antibonding level in a free hydrogen molecule
eV [
30]. Nevertheless, the electron transfer is possible because the external potential
is applied to the system. The electrochemical potential of OH
− ion is then
, where
eV is the chemical potential of the ions without the field and
q the charge of the ions. On the other hand, the hydrogen molecule is neutral and interacts with the field only via the induced dipole moment. The external potential sweeps from
to
with a frequency
f ∼
kHz [
9]. For sufficiently large amplitude
there is always a moment of time when the electron energy in the ion is equal to the energy of the antibonding level of H
2 molecule. Combustion in nanobubbles is observed at a rather high potential
V [
13].
We assume that the radicals are formed in the gas phase as is observed for shrinking microbubbles [
23,
24]. The process—which we call the “surface assisted dissociation”—differs from the catalytic process, where the products of the dissociation are adsorbed on the surface. The difference can be related to two factors: the gas–liquid interface has no fixed positions for molecules as there are for the gas-solid interface, and the surface charges will push the transitional state out of the wall.
Many details of the proposed mechanism are not clear yet. For example, energy levels of hydrogen can change when a molecule approaches the charged site so as the energy of the solvated OH− ion at the bubble surface can differ from eV. Moreover, it is even debated that the charged sites are related to OH− ions. Because of the uncertainties, we approach the problem from a different side. It is simply assumed that there are non-zero probabilities for the dissociation of H2 and O2 molecules on the charged sites. Using these probabilities as parameters, we solve the chemical kinetic equations inside of a nanobubble to see if the reaction can be ignited spontaneously at room temperature, and what the main products of the reaction are.
The combustion of hydrogen–oxygen mixture is a well-investigated process [
1,
2,
3,
4] that is more complex than the one-step overall reaction
. The process is controlled by chain branching reactions in the volume competing with the volume and surface termination reactions. The combustion can be ignited spontaneously (see [
31,
32] on autoignition limits) at moderate temperature (
K), but no combustion is possible at lower temperatures. All species taking part in the reaction include: three molecules H
2, O
2, and H
2O; four short-lived radicals H, O, OH, and HO
2, plus one long-lived radical H
2O
2. Since in this work we consider the processes on nano- and microsecond scales, the latter can be considered as a stable molecule.
If the combustion happens in the nanobubble, the gas temperature during the process can be considered as a constant equal to the temperature of the surrounding liquid. This is because the thermalization time is quite short. It is limited by the heat diffusion in the gas phase; the time needed to reach homogeneous temperature in the bubble is estimated as s, where r ∼ 50 nm is the bubble radius and m2/s is the heat diffusion coefficient in the stoichiometric gas mixture at room temperature and normal pressure , and is the pressure in the bubble that includes the Laplace pressure (J/m2 is the surface tension of the electrolyte). Thus, the heat diffusion is faster than most of the elementary steps of the combustion reaction.
Because of low temperature, the main chain branching reactions and are strongly suppressed, and cannot drive the process. Instead, the H and O radicals can be generated at the bubble surface by the dissociation reactions at the charged centers and . These reactions becomes increasingly important for nanobubbles due to large surface-to-volume ratio . Although we do not yet understand the dissociation mechanism, the surface reaction seems to be the only way to explain combustion in a small volume at room temperature.
The reaction constant for the surface processes can be presented in the following way [
1]:
where
is the average thermal velocity of the
i-th species. The sign “+” corresponds to the surface dissociation reaction, and “−” is related to the surface termination reactions. The parameter
can be considered as the probability of the surface reactions. For the radical termination on glass walls, the typical values are in the range
[
1,
2]. For the dissociation reactions,
can be presented in the form
, where
is the dissociation cross-section for hydrogen or oxygen molecules, and
is the concentration of the centers for dissociation on the bubble surface. If we relate the centers to the surface charges, this concentration is estimated as
∼
cm
−2. For the cross-section
∼ 1 Å
2, one finds the dissociation probability
∼
.
3. Combustion Kinetics
We solve the equations of chemical kinetics for eight relevant species H, O, OH, HO2, H2, O2, H2O, and H2O2 enumerated as , respectively. It is assumed that the species are distributed homogeneously in the bubble. This is a good approximation for all molecules and radicals, except maybe hydrogen atoms. For H radicals, the diffusion time ∼ s—where ∼ m2/s is the diffusion coefficient—is comparable with the fastest reaction linear in H. This is the reaction that proceeds with the participation of a third body M. For this process, the reaction time is also on the level of s, and the diffusion of atoms competes with the reaction. The effect becomes important for bubbles larger than nm in diameter. Here we assume that H atoms are distributed homogeneously in the bubble; therefore, our analysis is applicable for rather small bubbles.
Although the bubbles are small, the gas inside of them can be considered as a continuum medium. This is because the pressure inside the bubble increases with the decrease of the bubble size due to the Laplace pressure. For example, the mean free path in a bubble with a radius of nm is estimated as nm, and scales as r. For this reason, the Knudsen number stays constant for bubbles, where the Laplace pressure dominates.
The total list of the elementary reactions was taken from Reference [
33], but the detailed information on the reaction rates was collected from a number of papers [
31,
34,
35,
36,
37,
38,
39,
40,
41]. The kinetic equations are significantly simplified by the absence of temperature variation in the bubble. In this case, all the reaction rates stay constant during the process. Since nanobubbles with a mixture of gases last less than a few microseconds (combustion can proceed much faster), we select only those reactions that happen on a time scale of
s or faster. The list of these reactions together with the reaction constants at
K and
nm is presented in
Table 1. Note that the reverse reactions are not included in the list, because they happen on a time scale longer than
s. The first six processes are the termolecular reactions, and the remaining 13 reactions are the bimolecular reactions. The concentration of all species are defined with respect to the initial gas concentration in the bubble:
where
K,
J·mol
−1·K
−1,
= 50nm, and it is assumed that the Laplace pressure dominates in the bubble
. We define the reaction constants as the probability per unit time, which are related to the standardly defined reaction constants as:
Here and have dimensions m3·mol−1·s−1 and m6·mol−2·s−1 for bi- and termolecular reactions, respectively.
A few comments on
Table 1 are in place. The rates of the termolecular reactions depend on the concentration of the third component, [M]. Since the concentration of radicals is always small, as the third body M we consider stable molecules H
2, O
2, H
2O, and H
2O
2. In the third-order reactions 1–6, three numbers correspond to H
2, O
2, and H
2O, respectively. Efficiencies for H
2O and H
2O
2 are considered to be equal. Typically, the reaction rate is measured directly only for one or two components M. The rates for unknown components are predicted using a recommended table of relative efficiencies, such as Ar:H
2:O
2:H
2O:H
2O
2 = 1:2.8:3.3:17:17 [
33]. For reactions 1–4, the data are available for the pressure up to a few bars. We assume that in the bubble (where the pressure is somewhat higher), these reactions keep the third order. The reaction rates in the low and high pressure limits are known for reaction 5. The transition happens at
mol·m
−3, depending on M. This is higher than the gas concentration in nanobubbles, and the reaction is of the third order. On the contrary, for reaction 6, the transition happens at
mol·m
−3, which is much smaller than the concentration in the bubble. Therefore, reaction 6 is effectively of the second order, resulting in equal efficiencies for all M.
Introducing the dimensionless concentrations
defined with respect to
and using
ns as the unit of time, we can write the system of eight ordinary differential equations. This system has the following structure:
where
is a vector with the components
,
are the reaction rates for
i-th species of the first, second, and third order in the concentration. The term
includes the first six reactions in
Table 1, while the term
includes the rest of the reactions in the table. The linear term
includes only the surface reactions. For example, for hydrogen atoms this last term can be presented in the form:
which corresponds to the termination of one H atom at the surface with the probability per unit time
and creation at the surface of two H atoms from a hydrogen molecule with the probability
. We introduce nonzero creation terms
only for H and O, and the termination terms
can be nonzero only for radicals H, O, OH, and HO
2 (
). Termination of radicals on the surface is considered as permanent, meaning that the radicals sticking to the surface interact within the liquid phase. In this sense, the number of atoms of each kind in the gas phase is not conserved, but it can be considered as a quasi-constant on a time scale of
s.
4. Results
The kinetic Equations (
4) were solved numerically with the initial conditions that only hydrogen and oxygen molecules are present in the moment
. For the stoichiometric mixture of gases in the initial state, one has
and
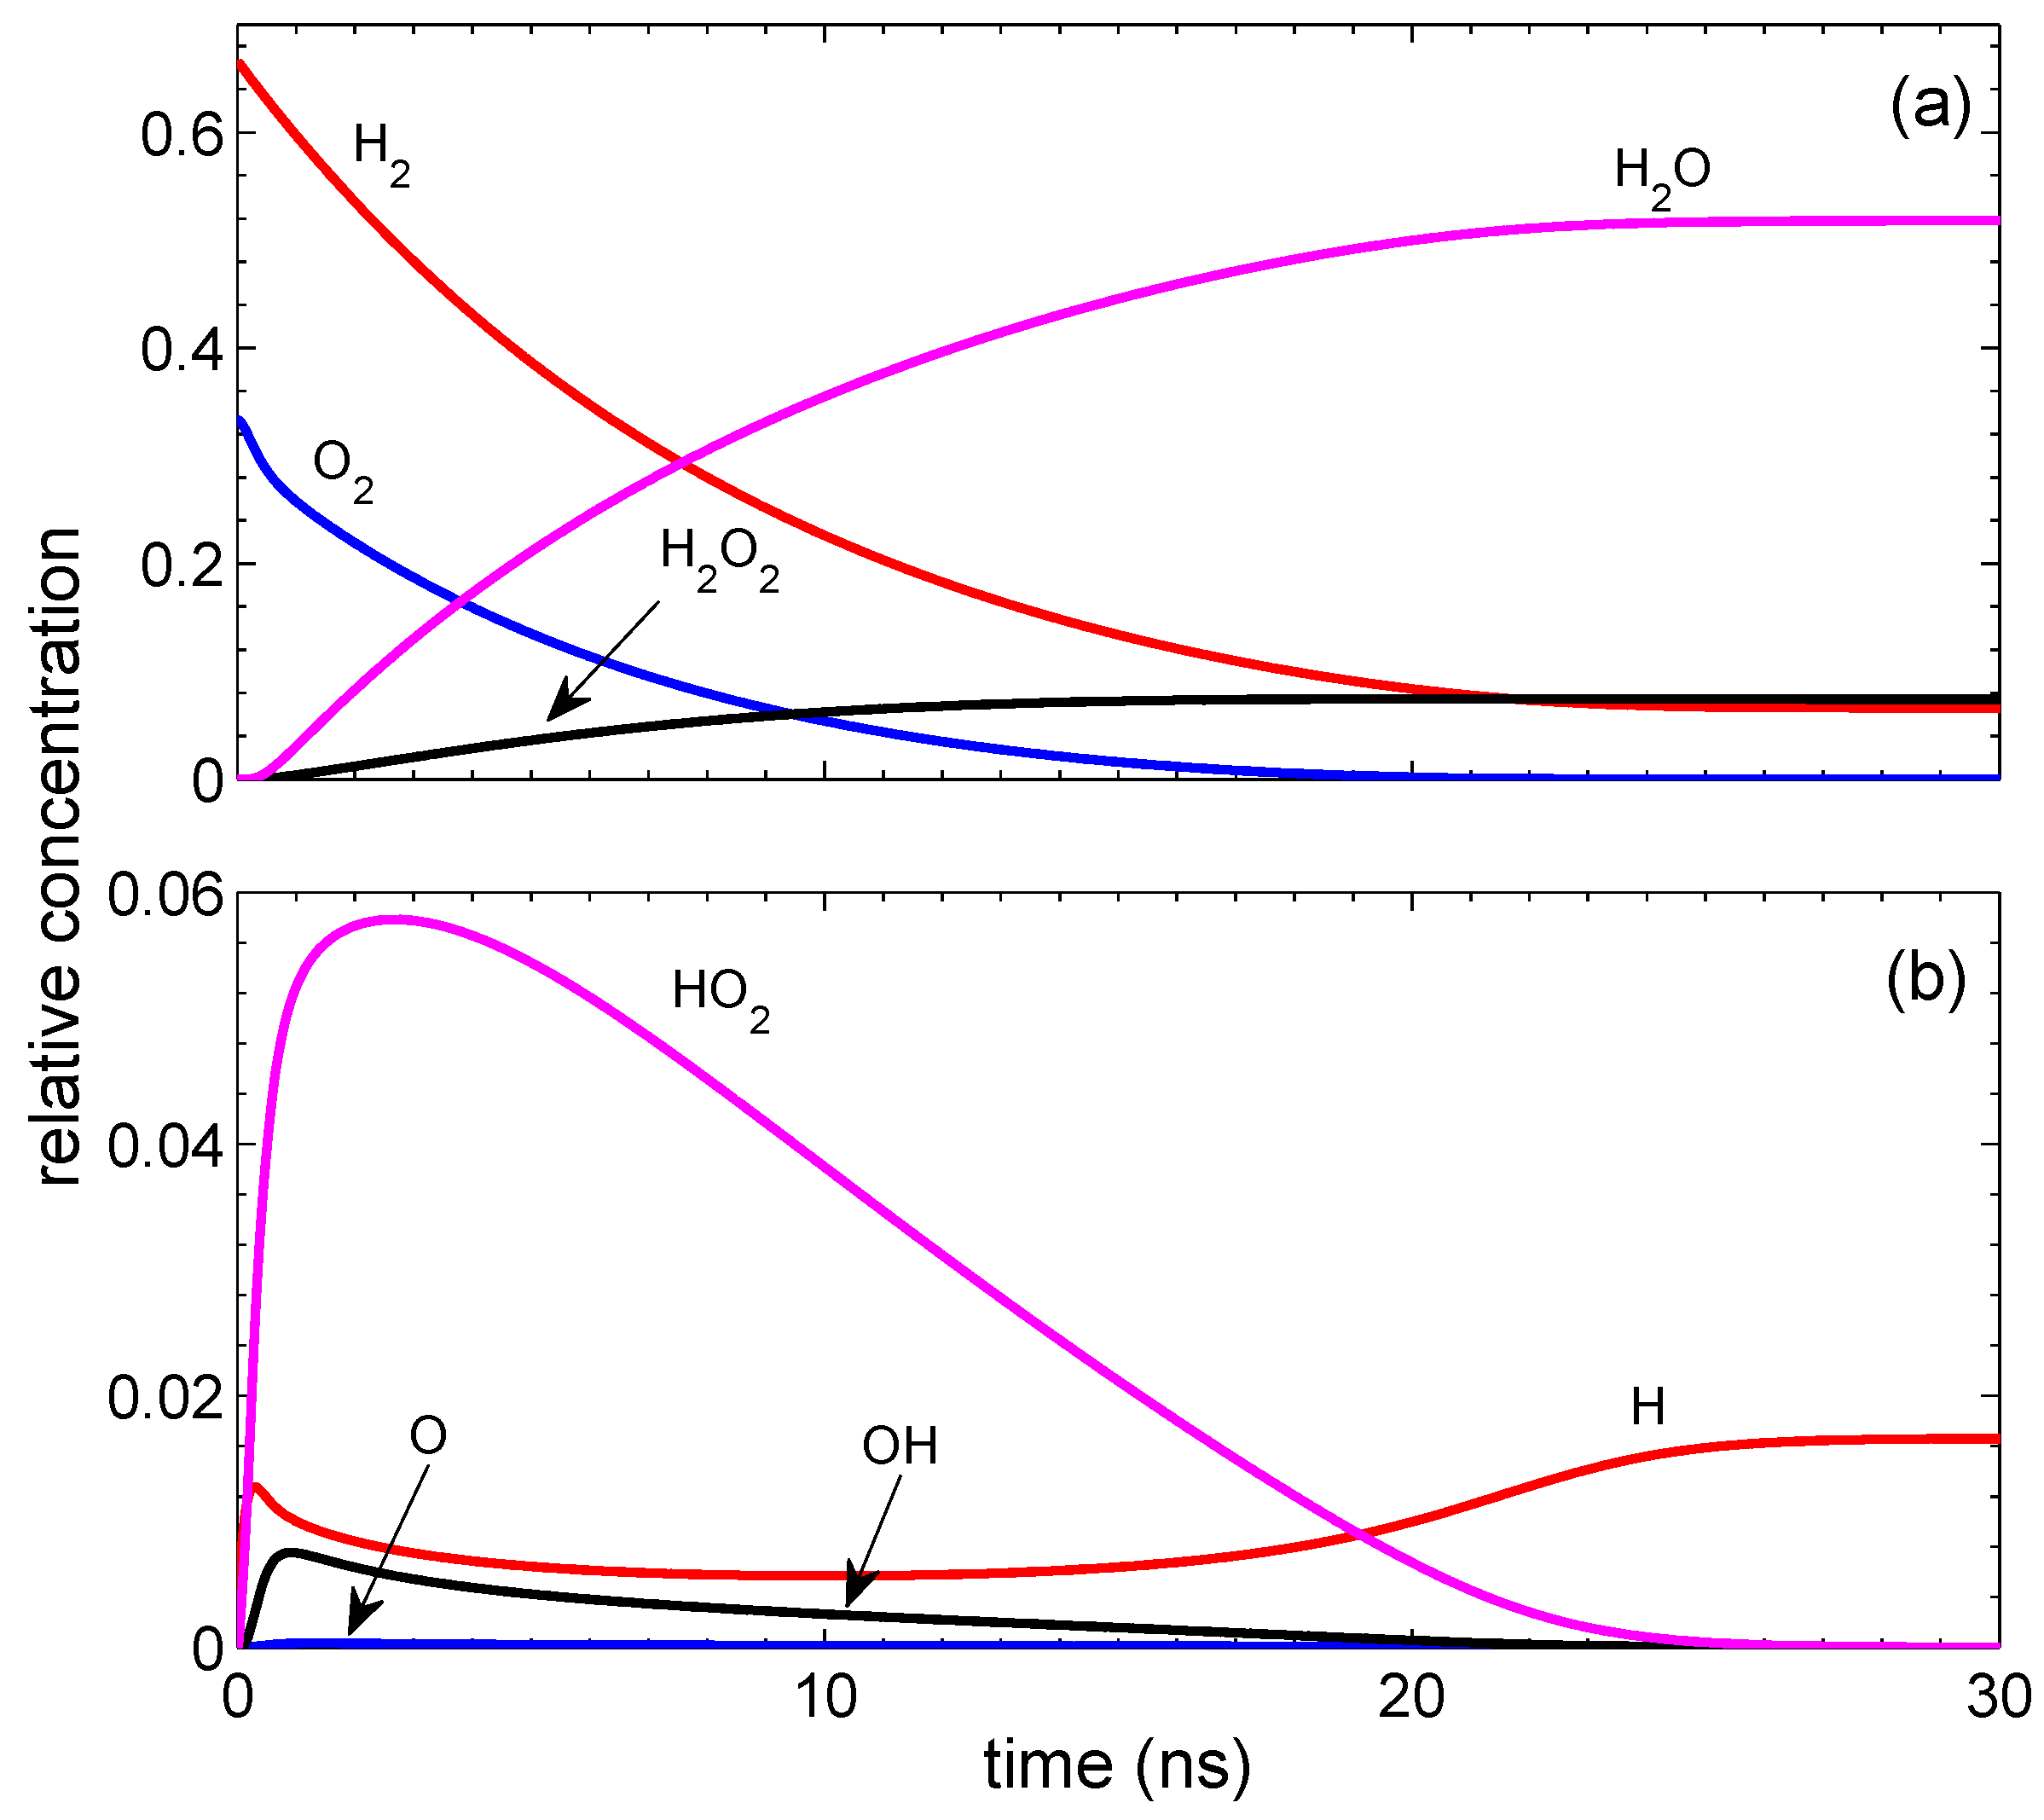
. Suppose that only hydrogen atoms can be produced on the bubble surface and termination of the radicals on the surface can be neglected. A solution that corresponds to the probability of hydrogen dissociation on the surface
is shown in
Figure 1. It reaches a quasi-steady-state in
ns, and the concentrations vary only on a time scale of ∼
s. In contrast with the standard combustion, the final state contains not only water, but also H
2O
2. The presence of H
2O
2 is a characteristic feature of the surface-assisted combustion. Hydrogen peroxide appears mainly due to reaction 19. If we put the corresponding reaction rate to be zero, the concentration of H
2O
2 is reduced from 0.073 to 0.004. Due to the extra oxygen atom in hydrogen peroxide, not all molecular hydrogen is consumed. A stationary concentration of hydrogen atoms in the final state is due to the absence of the surface termination. Note that the dimensionless termination rate
0.001 gives a much smaller effect than the creation rate
0.001 because the termination is proportional to a small concentration of radicals. Of course, the concentration of hydrogen atoms cannot stay constant for a long time. It is reduced on a microsecond time scale due to reactions 10 and 11. On the same time scale of
s, the surface termination of H atoms becomes important. All this results in the reduction of H radicals. At
ns, the concentrations of the radicals and molecules are the following: ([H], [O], [OH], [HO
2])/[M
0] = [0.0166, 0, 0, 0] and ([H
2], [O
2], [H
2O
2], [H
2O])/[M
0] = [0.0659, 0, 0.0741, 0.5183]. It is easy to check that the initial relative number of hydrogen atoms equal to 4/3 coincides with that in the finale state and is similar for oxygen atoms.
The generation of hydrogen atoms on the surface is of principal importance. The reaction is not ignited if only oxygen atoms are generated on the surface. At a fixed
, the concentration of H
2O
2 slightly decreases relative to water when
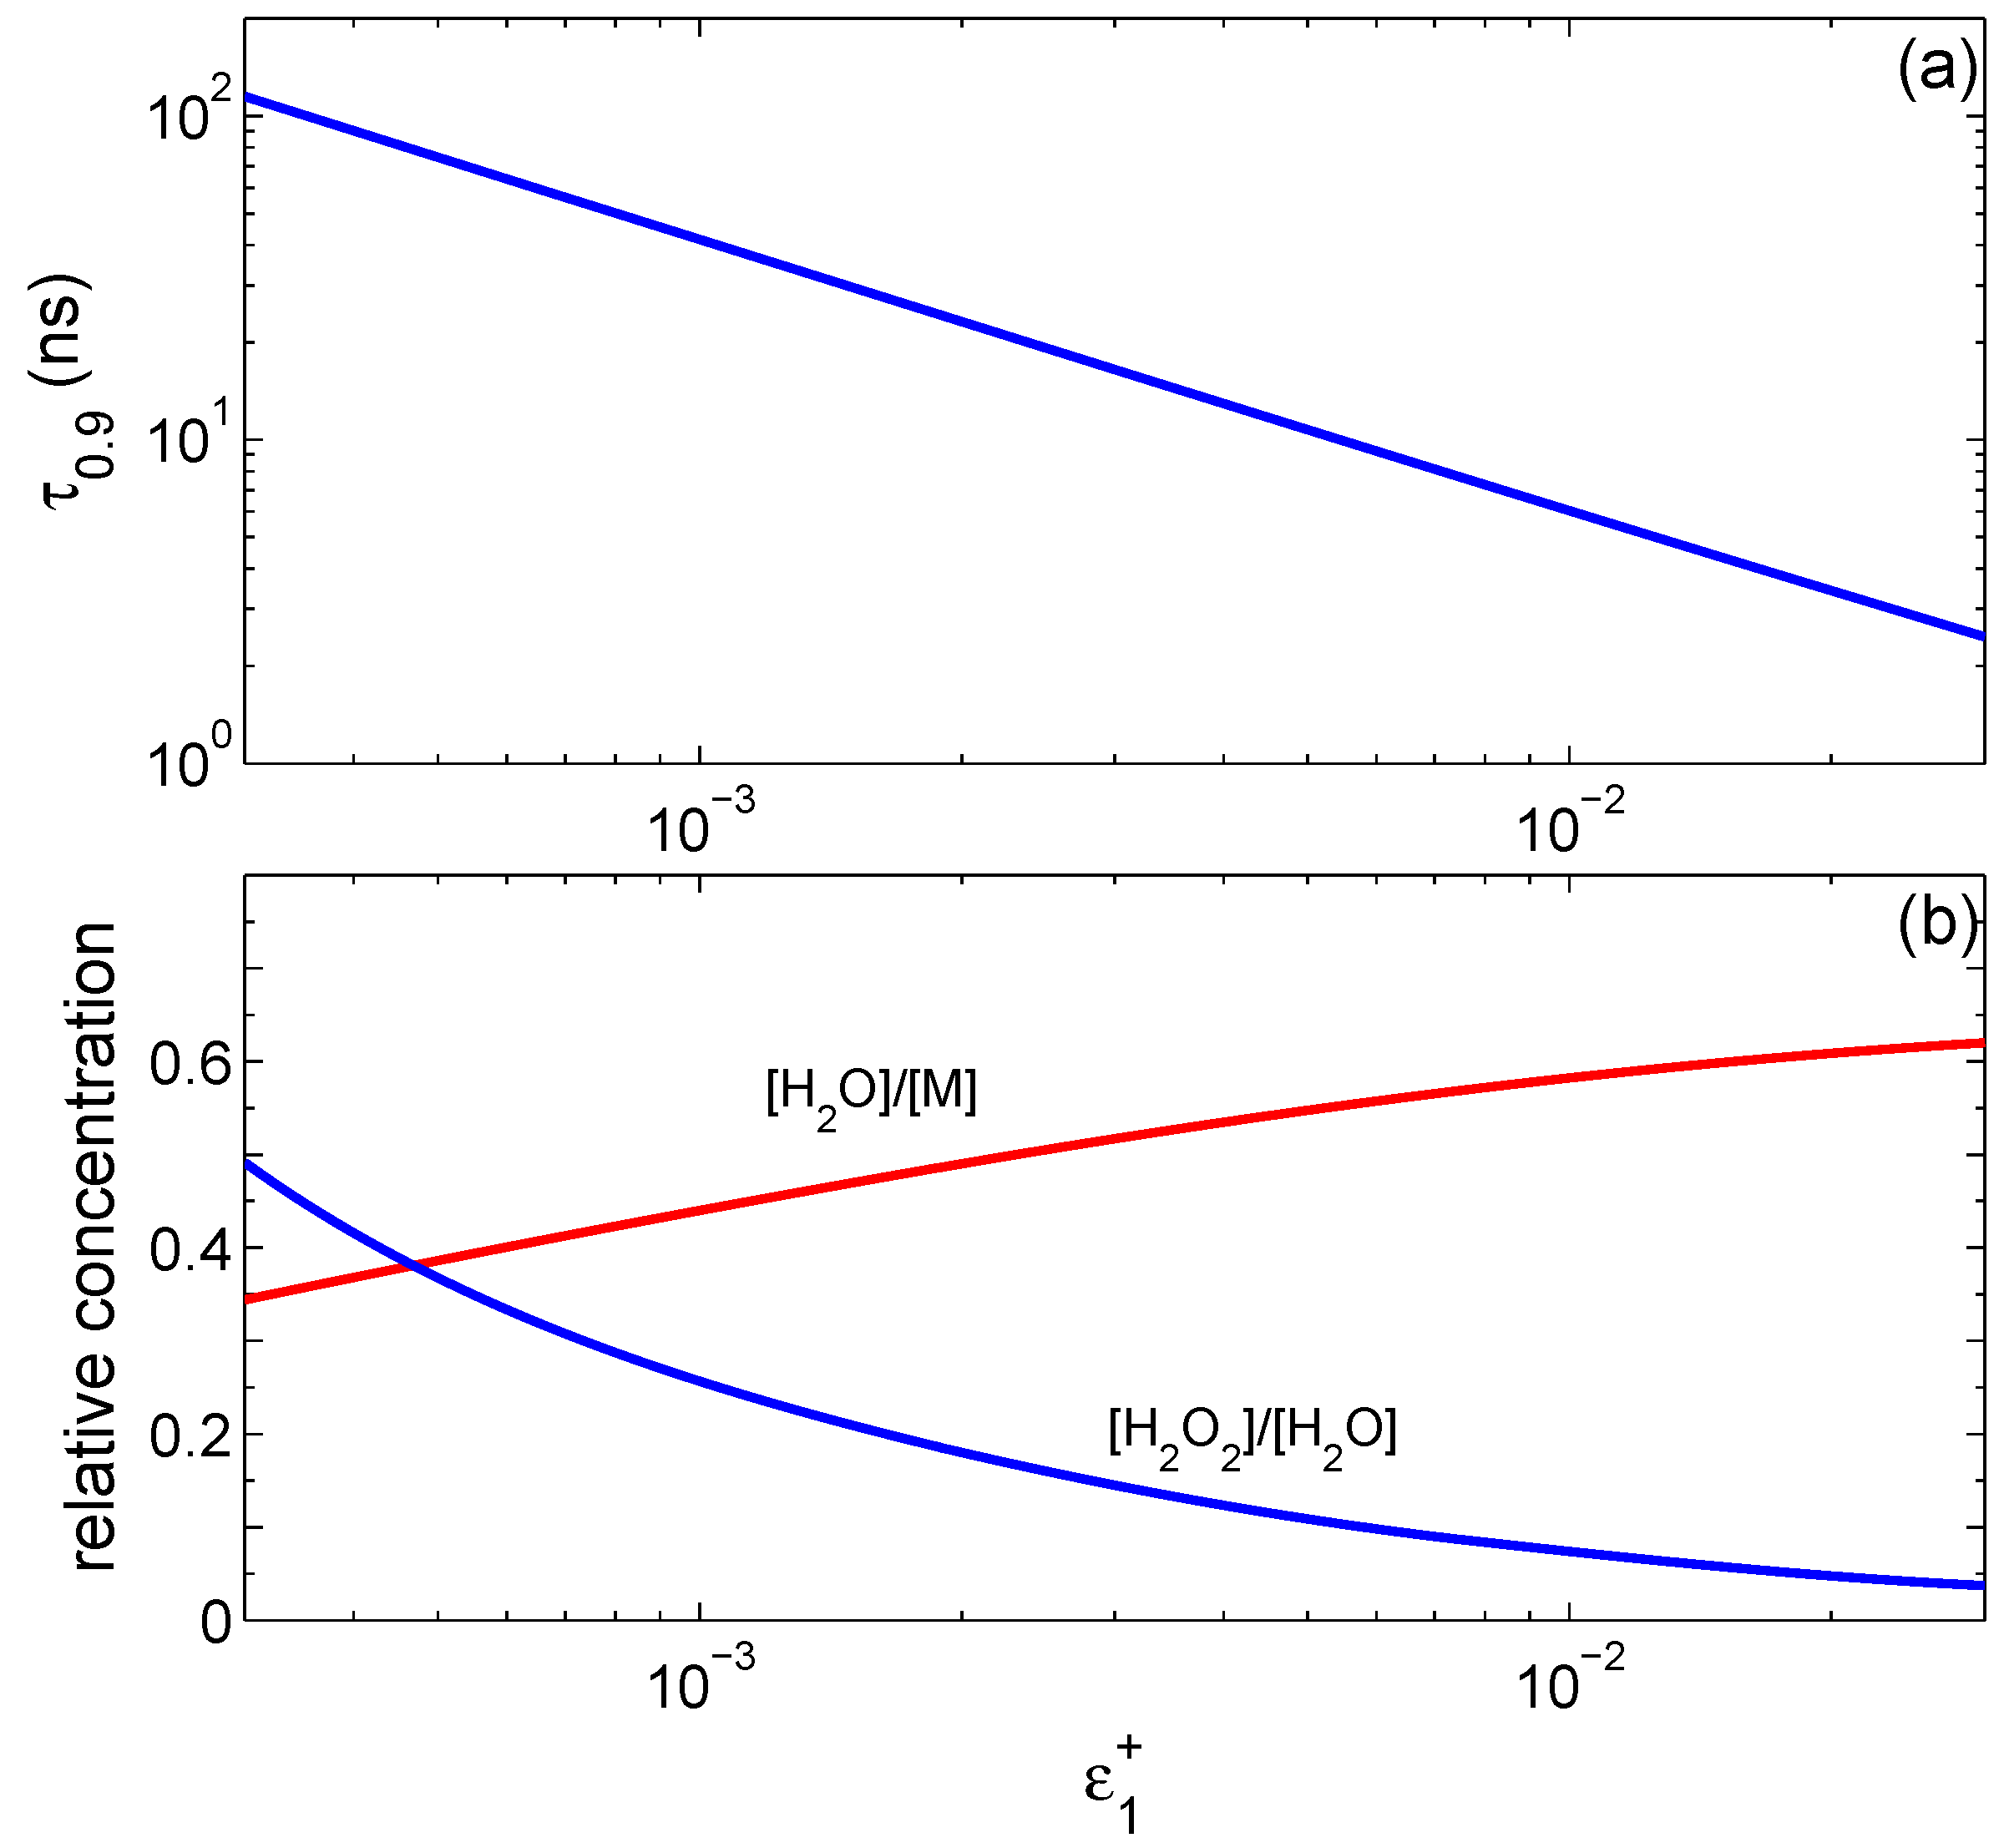
increases. The time
to reach a steady state strongly depends on
, as shown in
Figure 2a. We define
as the time when water concentration reaches 90% of its stationary value. It is well approximated by the function
ns.
Figure 2b shows how water concentration in the final state depends on
(red curve), and shows the relative concentration of H
2O
2 with respect to H
2O (blue curve) at steady state. For very small
, the concentration of hydrogen peroxide becomes comparable to that of water.
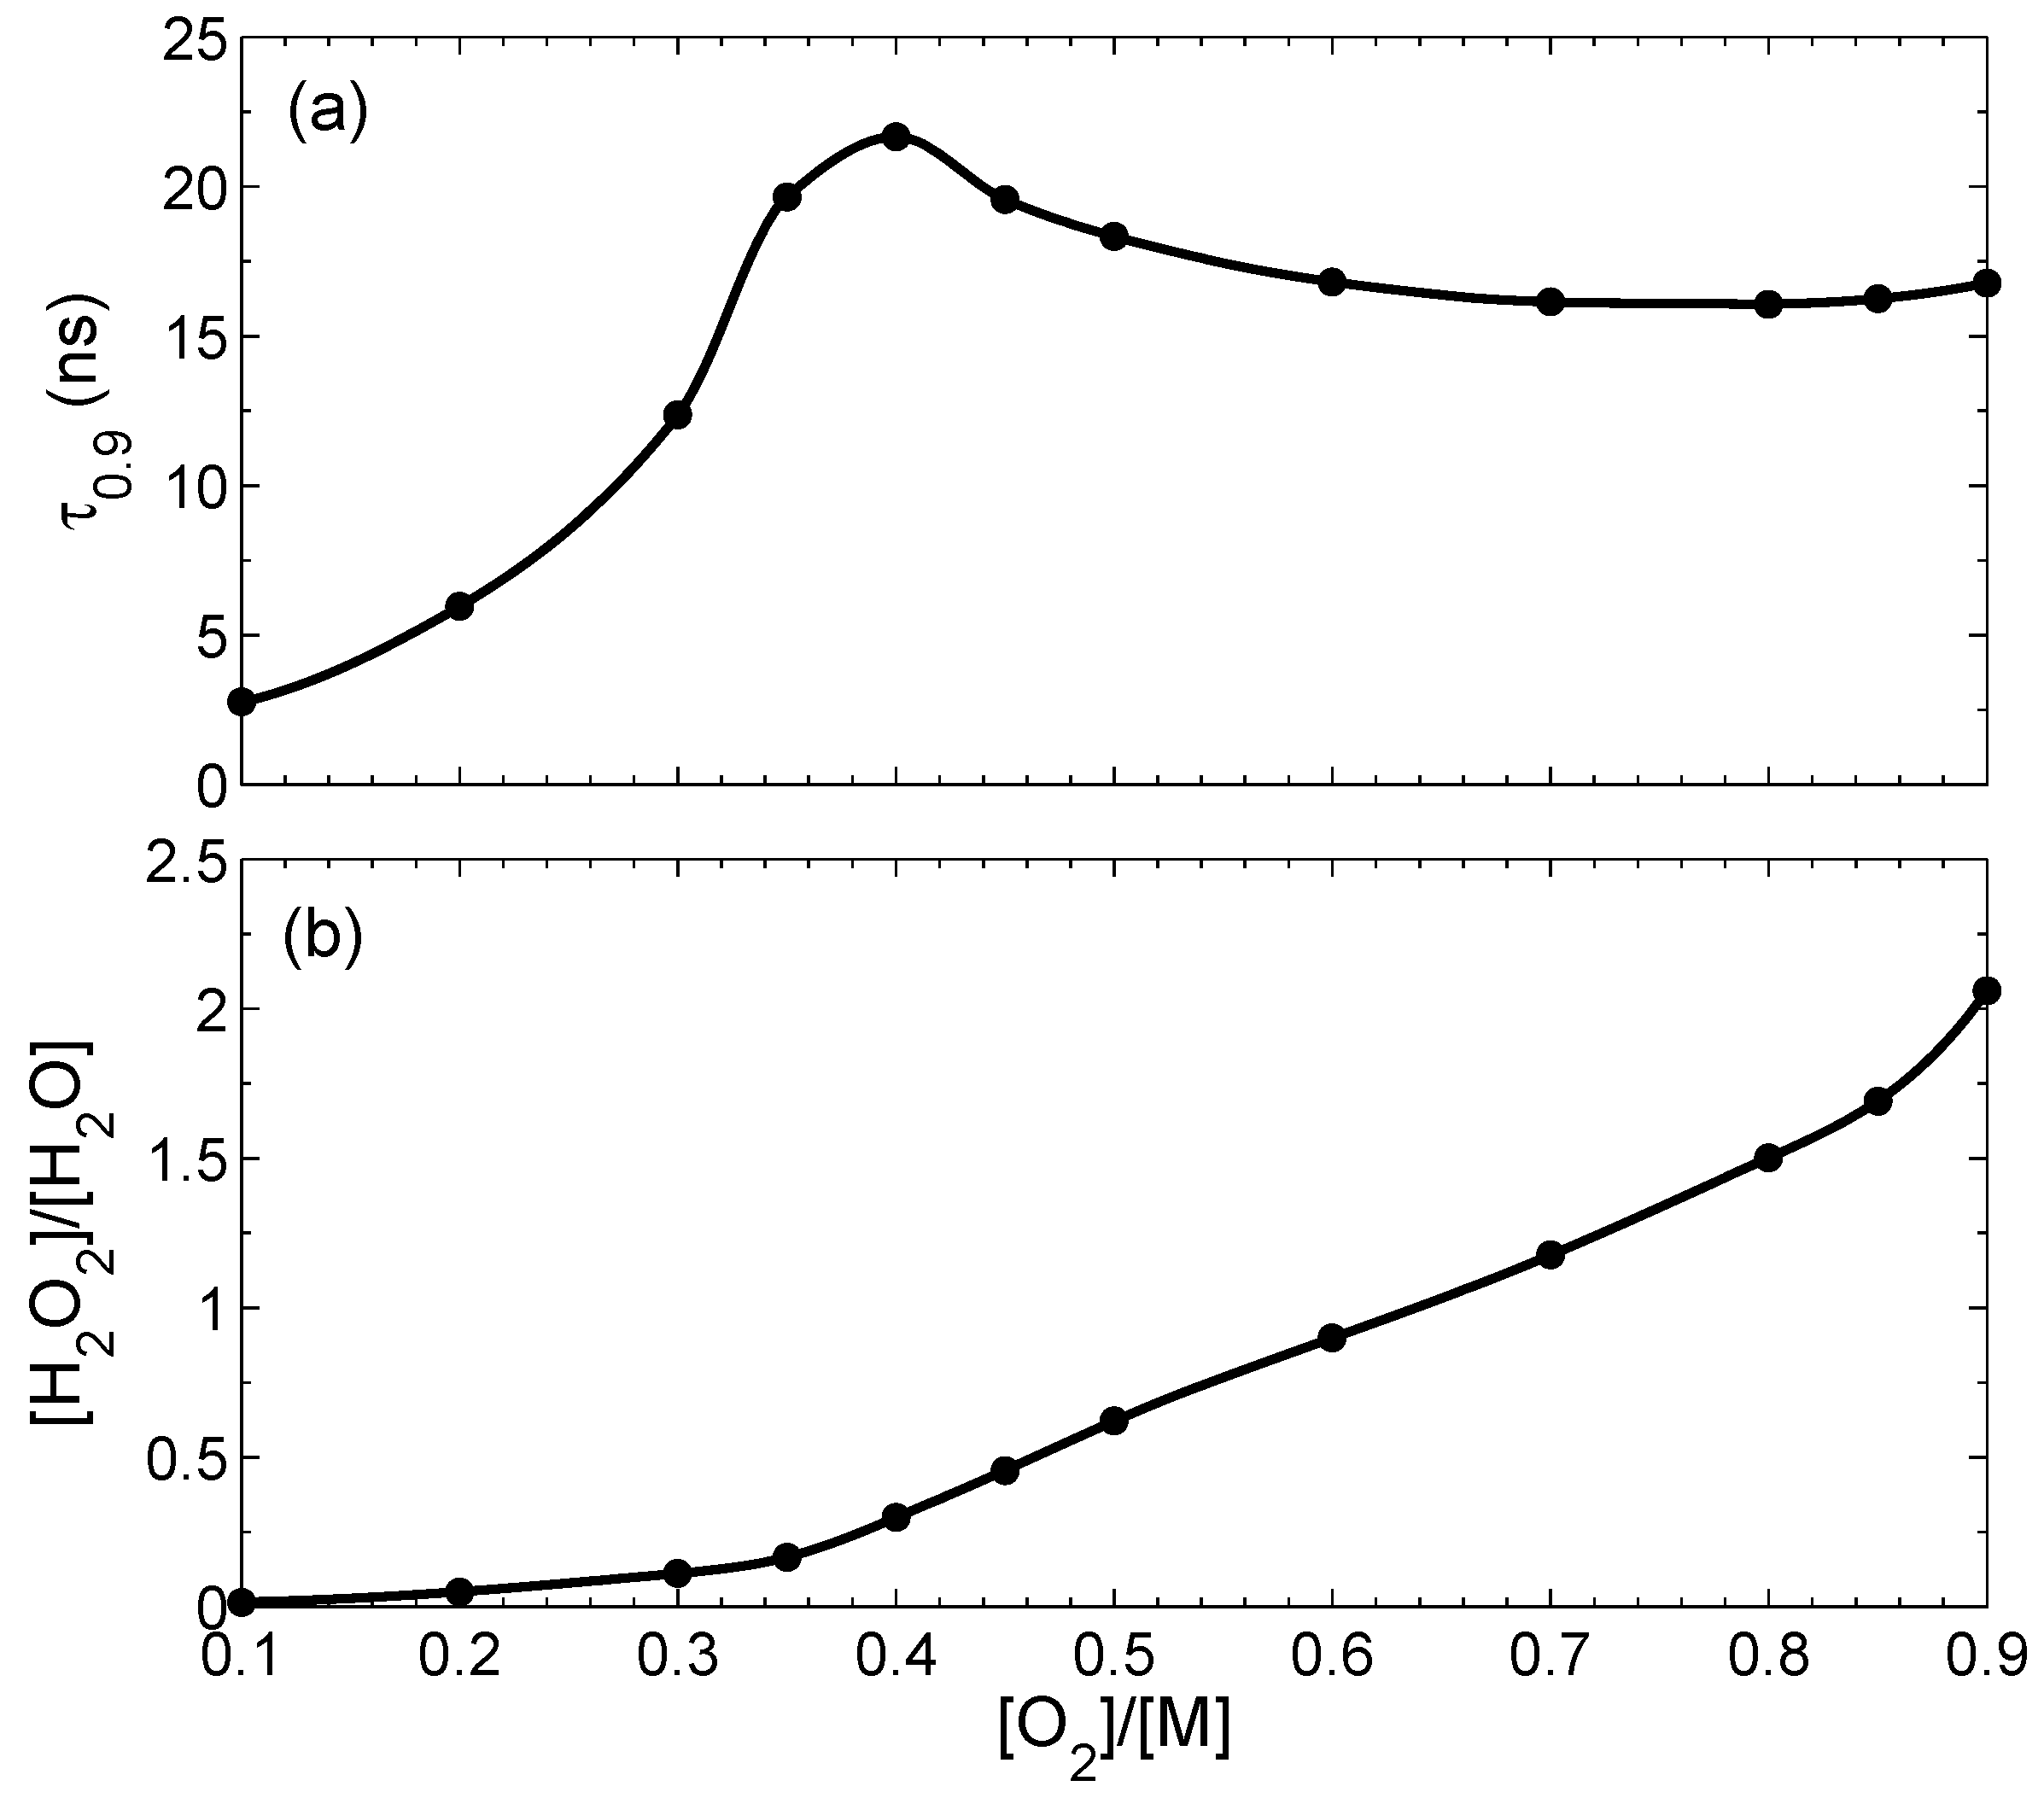
Figure 3a shows the dependence of
on the initial concentration of oxygen
at the condition that total concentration at
is fixed:
. This time has a maximum close to the stoichiometric ratio. Dependence of the peroxide/water ratio in the final state on the initial concentration of oxygen is shown in
Figure 3b. The relative contribution of H
2O
2 increases with the increase of the oxygen fraction in the initial state. The peroxide/water ratio also increases with the decrease of the bubble size
r: at
nm it is 0.047, and at
nm it is as large as 0.14.
Uncertainties in the rates of termolecular reactions do not change the combustion process significantly. For reactions 1–3, we do not know where the transition between high and low pressure limits is. However, if we exclude reactions 2 and 3, the concentrations for all species practically coincide with that presented in
Figure 1. Reaction 1 influences the concentrations of H and H
2, but has only a weak effect on all the other components. Qualitatively, the time dependence and the magnitude for all components does not change if we switch off all the termolecular reactions, excepting reaction 5. In absence of reaction 5, the mixture of gases is not ignited.


