Article

Using a Reactive Transport Simulator to Simulate CH4 Production from Bear Island Basin in the Barents Sea Utilizing the Depressurization Method†

Department of Physics and Technology, University of Bergen, Allegaten 55, 5007 Bergen, Norway
*
Author to whom correspondence should be addressed.
Energies 2017, 10(2), 187; https://doi.org/10.3390/en10020187
Submission received: 31 December 2016 / Accepted: 4 February 2017 / Published: 8 February 2017
(This article belongs to the Special Issue Methane Hydrate Research and Development)

Abstract

:
The enormous amount of methane stored in natural gas hydrates (NGHs) worldwide offers a significant potential source of energy. NGHs will be generally unable to reach thermodynamic equilibrium at their in situ reservoir conditions due to the number of active phases involved. Lack of reliable field data makes it difficult to predict the production potential and safety of CH 4 production from NGHs. While the computer simulations will never be able to replace field data, one can apply state-of-the-art modelling techniques to evaluate several possible long-term scenarios. Realistic kinetic models for hydrate dissociation and reformation will be required, as well as analysis of all phase transition routes. This work utilizes our in-house extension of RetrasoCodeBright (RCB), a reactive transport simulator, to perform a gas hydrate production case study of the Bjørnøya (Bear Island) basin, a promising field with very limited geological data reported by available field studies. The use of a reactive transport simulator allowed us to implement non-equilibrium thermodynamics for analysis of CH 4 production from the gas hydrates by treating each phase transition involving hydrates as a pseudo reaction. Our results showed a rapid propagation of the pressure drop through the reservoir following the imposition of pressure drawdown at the well. Consequently, gas hydrate dissociation and CH 4 production began in the early stages of the five-year simulation period.

Graphical Abstract

1. Introduction

Hydrates are ice-like crystalline structures of water containing gas molecules trapped in cages formed by hydrogen-bonded water molecules. The variation of hydrate formers in a natural gas mixture, or other gas or liquid mixtures containing hydrate formers will result in formation of distinct phases of hydrates due to the differences in free energy and density of each hydrate phase. The combined first and second laws of thermodynamics will require mixtures of hydrate formers to create the most stable hydrates first under constraints of mass and heat transport. The Gibbs phase rule will also prohibit hydrate-containing systems from reaching thermodynamic equilibrium in reservoirs due to the number of active phases involved (including adsorbed phases). There will therefore exist a competition between different hydrate phase transitions. For instance, formation of hydrate on the water/hydrate former interface will slow down the transport of hydrate formers to the aqueous phase. Hydrates will still continue to grow using dissolved hydrate formers until the stability limit is reached when the chemical potential of both water and hydrate formers in hydrate and aqueous phase equalises. Since diffusion-driven transport of hydrate formers in liquid water will be orders of magnitudes faster than mass transport processes across the solid hydrate film, hydrate formers dissolved in water may be diluted on the other side of the hydrate film. The situation will be even more complex in porous media due to the presence of additional adsorbed phases, and coupling to hydrate nucleation and growth.
Natural gas hydrates (NGHs) tend to occur in regions where temperature and pressure conditions facilitate the formation of hydrates from natural gas components, subpermafrost sediments and marine sediments on continental margins. Absolute thermodynamic stability of these hydrates will require that the hydrate phase be the one where chemical potential for all hydrate components has its lowest value compared to any other possible coexisting phases. This is the reason behind the dissociation of methane hydrate coming in contact with methane-free ground water (i.e., a phase where methane’s chemical potential is at its infinite dilution value). Except for fairly limited librational modes, the charge distribution of water molecules forming a hydrate nucleus or crystals of any size will be quite rigid. Thus, the aqueous-phase water will have to accommodate these relatively fixed electrostatic environments as well. In practice, this will translate into adsorbed water layers, 2–3 water molecules, in width facing the hydrate surface. Charge distribution of mineral surfaces is incompatible with that on the hydrate surface, with its structural influence spanning a 3–4 molecular diameter of water. Water layers adsorbed onto mineral surfaces and hydrates will form unique phases due to differences in free energy and density, which will be reflected in chemical potential profiles and transport properties and thus affect phase transition routes. Even when only one hydrate former is present, the Gibbs phase rule will only allow for a single degree of freedom, i.e., only one independent thermodynamic variable may be defined for equilibrium to be possible. In view of the above, it becomes obvious that natural gas hydrates in porous sediment media will be unable to reach equilibrium since two independent thermodynamic variables (temperature and pressure) will be defined everywhere in the reservoir due to hydrostatics, hydrodynamics, and geothermal gradients. It would therefore be more rigorous to discuss the occurrence of hydrates in sediments as being in a stationary state while trapped beneath clay, shale or other impermeable sealing structures. Hydrates coming into contact with water under-saturated with respect to hydrate formers through a network of fractures will dissociate almost immediately (relative to time scales characteristic of reservoir flow). The resulting fluxes of released gas may find their way to the seafloor if the fracture system is open towards it. For reasons discussed above, the formation of hydrate on the seafloor will be driven by local pressures and temperatures. This hydrate will enter a stationary state where fresh gas coming from below will enable hydrate growth, while the aqueous-phase gas in contact with hydrates will be diluted by diffusion and ocean currents. The rate of dynamic methane fluxes originating from these seafloor hydrates can be low if pressure is very high and/or temperature very low. Ultimately, the outcome will be decided by many local factors, including microbial activity tied to interconnected ecosystems.
Gas trapped inside natural gas hydrates can be of two different origins: biogenic sources that originate from decay of organic-rich sediments, and leakages from deeper layers and thermogenic sources formed via thermal maturation of organic substances [1].
Due to the ever increasing demand for energy, there is a worldwide demand for new sources. Estimates suggest that the amount of fuel gas trapped inside the natural gas hydrate reservoirs could be twice that of explored natural fossil fuels [2]. The main hydrocarbon component of NGH reservoirs is CH 4 , and thus NGHs have attracted attention as a potential future source of energy.
Several conventional methods have been proposed for production of CH 4 from these reservoirs, including pressure reduction, thermal stimulation, and inhibitor injection [3]. Recently, some new techniques have come to the forefront, such as CO 2 gas exchange through sequestration of CO 2 into NGHs reservoirs [4], fluorine gas and microwave technology [5]. However, apart from the economics, their application has yet to be proven safe enough in the long term. During the production of CH 4 from natural gas hydrate reservoirs, the hydrate phase will dissociate, releasing huge amounts of water alongside the produced gas. This may affect geomechanical stability of the area and cause structural deformation.
In addition, the ongoing temperature rise at the Arctic sea bottom has the potential to destabilize the hydrate-bearing sediments and cause the release of significant methane volume due to hydrates melting into the ocean and atmosphere. Given that CH 4 is a much more aggressive greenhouse gas compared to CO 2 , this effect may accelerate the climate change [6].
The Bjørnøya (Bear Island) basin is located in the southwest of the Barents Sea. The gas hydrate and free gas layers are inferred either in close proximity or on top of several large faults [1]. These faults control displacements of gas hydrate-filled sediments and sediments containing free gases. The region of hydrate thermodynamic stability is located close to the sea bed. Thus, the thickness of the gas hydrate layer will be affected by the geothermal gradient, pore water salinity, and sea bed water temperature [7].
Gas leakage in this basin may be related to the Cenozoic evolution of the Barents Sea that removed 1 km of sediments from the basin shelf, which, in turn, resulted in expansion of gas and tilting of the old reservoirs, thus releasing gas [1]. The area lithology associated with the accumulation of gas hydrate and free gas mostly consists of claystone and siltstone, as well as sandstone to a smaller degree. Therefore, the diffusion of gas driven by a concentration gradient may be treated as the dominant phenomenon during the primary stages of gas migration [1]. Another possible stage of gas accumulation will be facilitated by gas migration through fractures and faults towards the hydrate stability zone, either as bubbles or in a dissolved form [1]. The total accumulation of gas hydrates in the Bjørnøya basin may cover an area of up to 55 km 2 [1].
Understanding the long-term processes that may be triggered by CH 4 production from NGHs is of crucial importance, not only for the purposes of assessing the actual production rates and volumes but also when it comes to geomechanical stability of sediments. The primary targets for production from gas hydrates will consist of unconsolidated sand filled with hydrates, free water, and pore-bound water. Conducting field scale experiments is a very costly and time-consuming option. Laboratory experiments can never reproduce real hydrate behaviour even when actual representative cores are used, since they cannot hope to truly reproduce reservoir conditions. As discussed earlier, in situ hydrates in sediments are unable to reach thermodynamic equilibrium and must therefore exist in a stationary state. This state often results from a balance between the upcoming gas fluxes and the flow through the hydrate-filled sediments via a portion of the fracture network; it is reached through a rearrangement on a geological time scale. When hydrate is produced from sediment in a laboratory setting, there will be either no flow at all or one specific flow channel for water and methane, respectively. Hydrate formation will proceed very rapidly at the the methane/water interface, eventually leading to pockets of trapped gas and water. Any rearrangement inside sediment will take time. This uncertainty will be combined with the fact that every hydrate reservoir is unique with regards to its fluid fluxes, mineral types, non-uniformities of sediments, sealing structures (clay, shale, permafrost), and a number of other factors, including minerals affecting fluid and hydrate inside the pores.The hydrate saturation inside the pores is therefore a function of many dynamic variables. We do not mean to imply that laboratory experiments lack merit and should not be conducted. On the contrary, one can learn a lot, as long as one firmly differentiates between the real hydrate reservoir and what is achievable in a short time-scale experiment in the laboratory. Theoretical models of hydrates suitable for modelling purposes are far from perfect, but reservoir simulations are inexpensive, and our lack of knowledge and/or quality of reservoir related properties can at least be compensated to a certain degree by means of systematic sensitivity analysis that can shed light on possible ranges of scenarios. Therefore, using computer simulations to analyse several production scenarios and associated development of stresses as a function of pore filling volumes can be an efficient tool, both from a time consideration as well as from an economic point of view.
Most hydrate simulators treat hydrate phase transitions using the equilibrium approach. Some reservoir simulation codes also include built-in kinetic models, with the majority being oversimplified and empirical in origin. A frequently used model is one from Kim and Bishnoi [3]; it has been derived from laboratory experiments studying various degrees of stirring in a pressure volume temperature (PVT) cell. The empirical formulation of a kinetic model that uses fugacity difference as a driving force and is based on experiments far away from the actual flow through a hydrate filled sediment makes this choice questionable. Another limitation that all available academic and commercial hydrate simulators suffer from in common is the fact they only consider a single route for hydrate phase transition, which is towards water and hydrate formers in the gas phase (ignoring any other possible options). However, other routes do exist. For example, hydrates can also form from water and hydrate formers dissolved in the aqueous phase. Furthermore, hydrates can also form from hydrate formers adsorbed onto mineral surfaces.
This work employed RetrasoCodeBright (RCB), a hydrate reactive transport simulator [8], as its numerical tool. RCB was developed originally as a hydrogeological simulator, and has previously been modified to model CH 4 production from natural gas hydrate reservoirs by means of depressurization techniques [9,10]. Two different routes for hydrate phase transitions are implemented: hydrate formation, reformation and dissociation from hydrate formers inside the gas phase and hydrate formers inside the aqueous phase. A non-equilibrium thermodynamic package [11,12,13,14] developed by our group has been added to the RCB, making it possible to treat competing hydrate phase transitions through minimization of Gibbs free energy. Nucleation theory was used as a primary step to relate mass and heat transfer contributions to the kinetic rate of hydrate phase transition. The Appendix contains further information about RCB.
Today, the Messoyakha field is the only NGH reservoir in the world producing gas. However, gas production data from this field is not accurate enough for the purposes of history matching. We have used the RCB simulator to examine a case study of a real NGH reservoir located in the Bjørnøya basin. We briefly present our approach in Section 3 (methods and procedures); an interested reader can find a more detailed calculation and implementation method in References [9,10], respectively. The Simulation Setup section lists the properties used by our model as inputs. The results of our modifications are discussed in the Results and Discussion section. Conclusions are outlined in the Conclusions section.

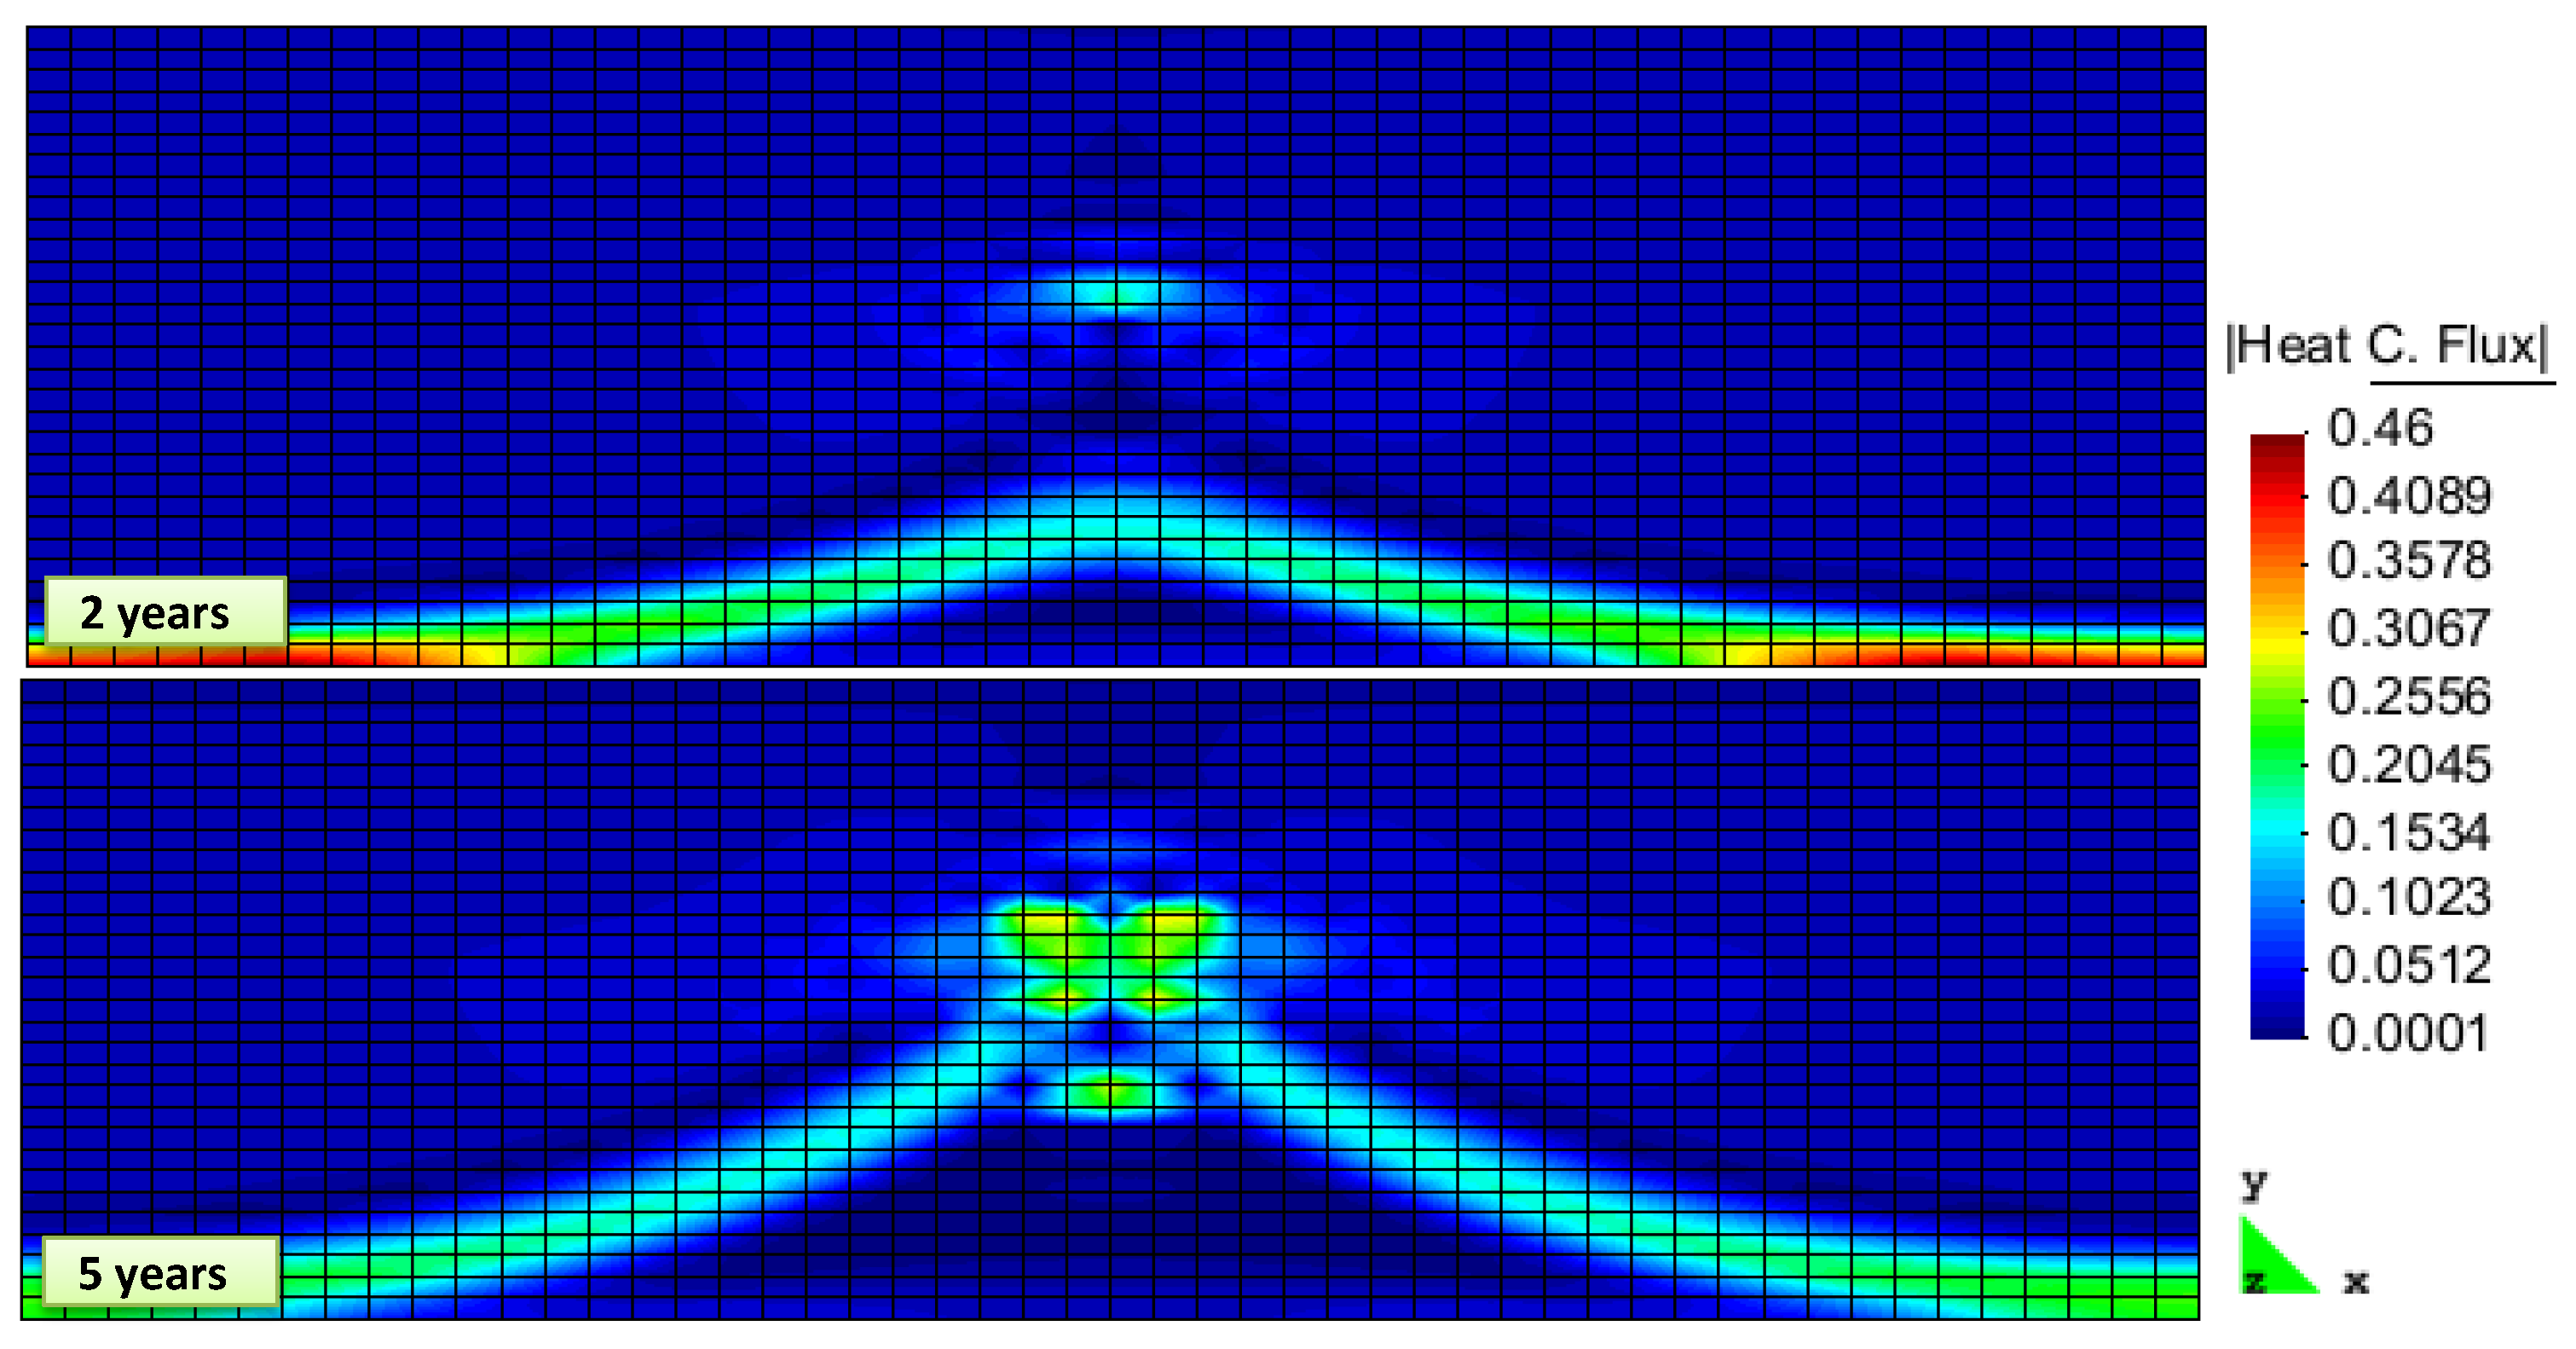
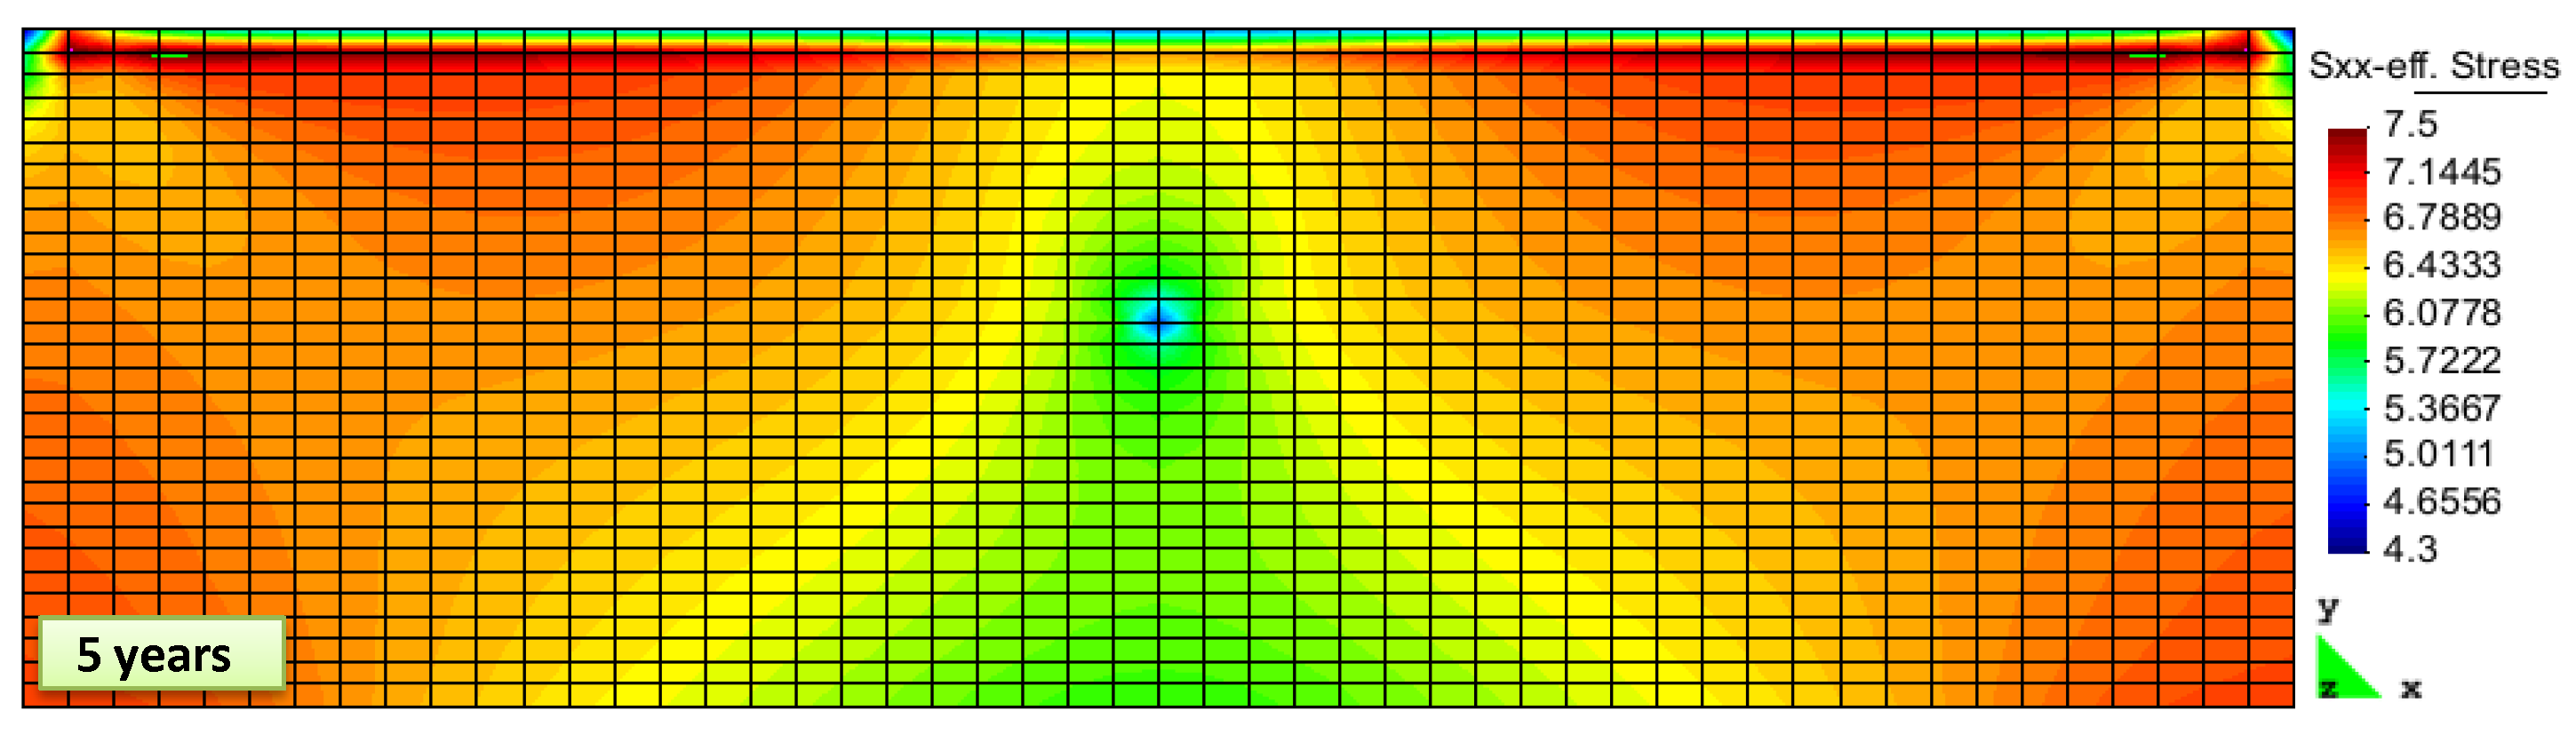
2. Results and Discussion
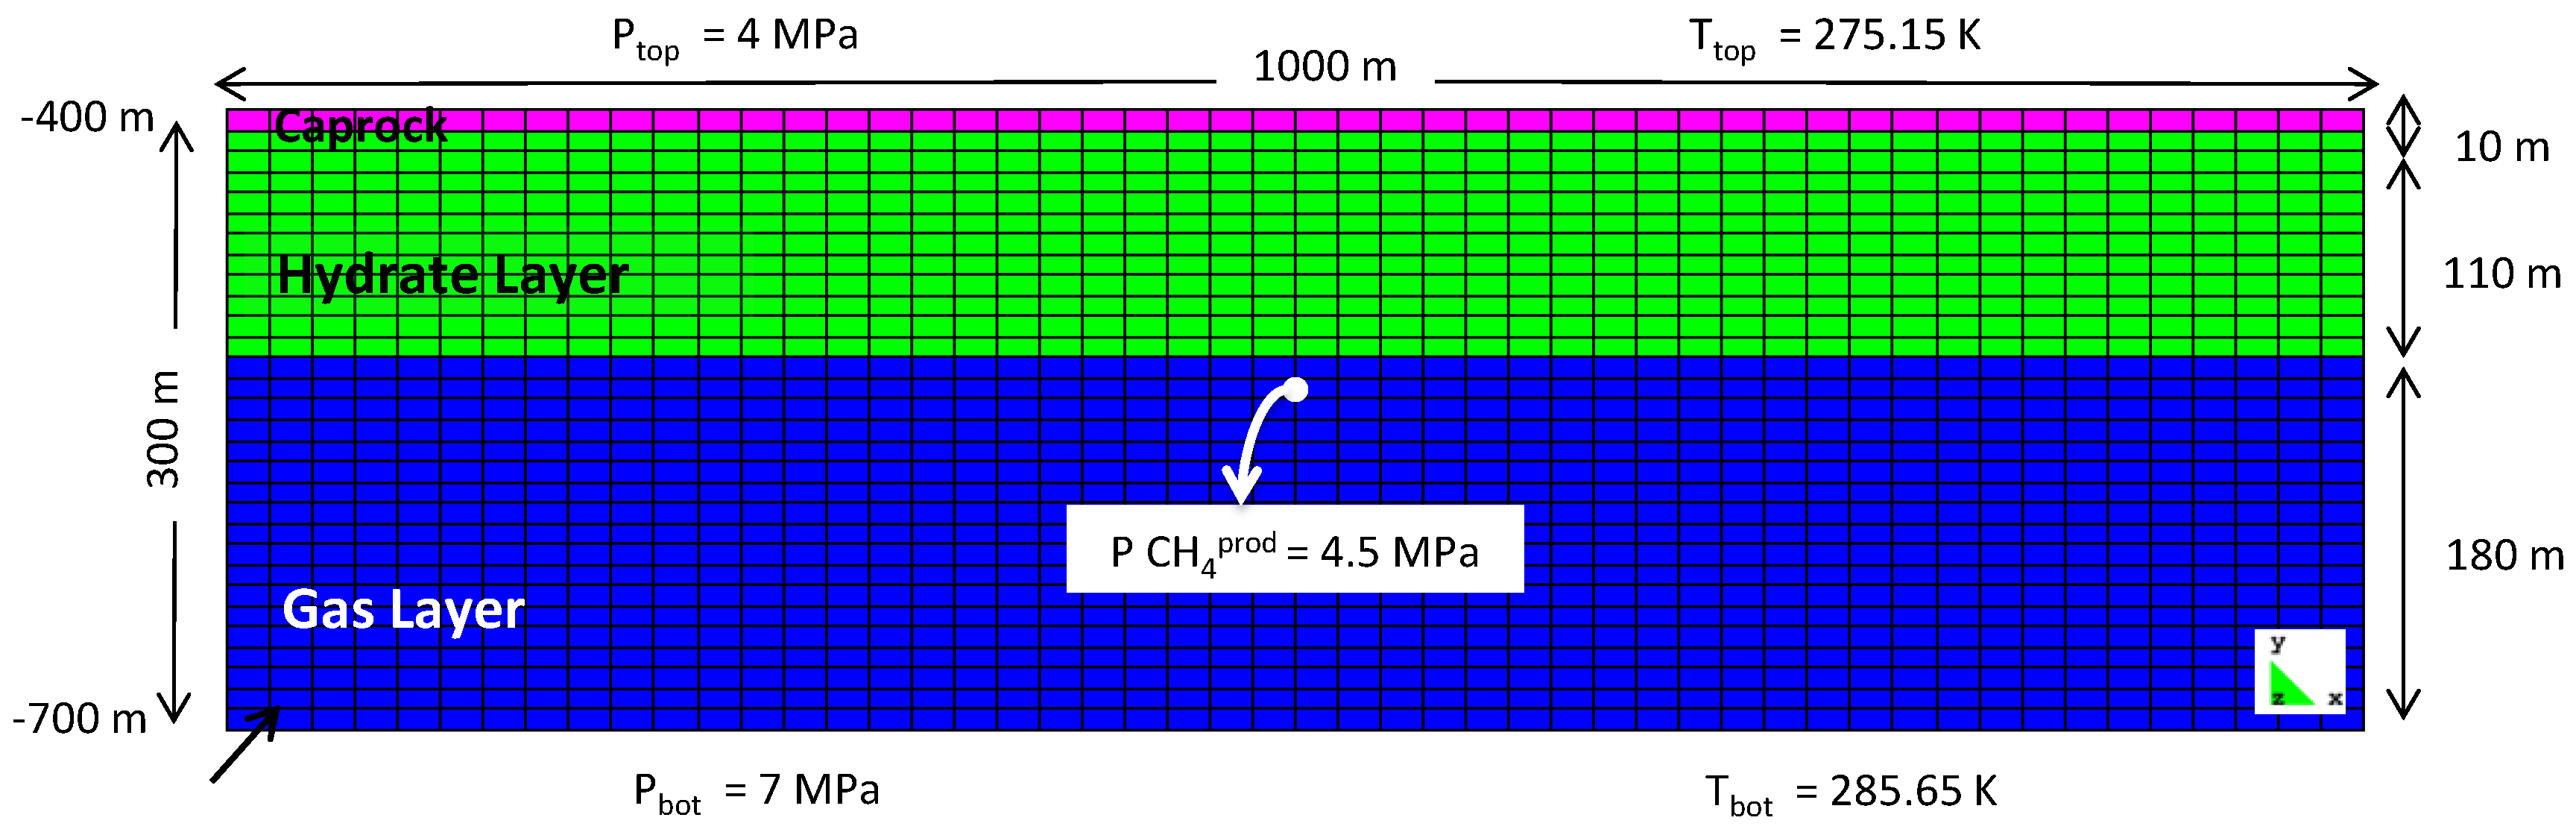
Simulation Setup

The gas hydrate-bearing sediments at Bjørnøya overlay a gas zone. This gas is thermogenic in origin [15] and has migrated upwards from deeper sources. To simulate gas production from this basin, we have built a two-dimensional model shown in Figure 1. The modelled reservoir section spanned 1000 m in length and was 300 m thick. We divided the model into 300 equal-size elements with dimensions of 20 m × 10 m. The model consists of three layers, a sealing layer at the top, a hydrate layer in the middle, and an underlying gas layer at the bottom.
The average water depth in the Barents Sea is about 230 m, with the inferred gas hydrate occurring at a sea depth of 400 m [15]. Thus, the caprock top is located at a sea depth of 400 m in the model. The location of the assigned production well is inside the gas layer, 10 m below the hydrate layer. Well production pressure was set to 4.5 MPa, which is outside of the CH 4 -hydrate stability region of that specified node. The gas hydrate stability zone rises steeply with a sea depth of up to 500 m, becoming more gradual after that [7].
Unconsolidated sediments are spread alongside the young continental margins in the west [16]. Due to the mineralogy of Bjørnøya basin [1], and the lack of any representative permeability data for either hydrate or gas layers, we have assigned values corresponding to unconsolidated siltstone and very fine sandstone, set to 3 × 10 15 m 2 for the hydrate layer and 2 × 10 14 m 2 for the gas layer.
The average density and porosity have been estimated to be 2150 kg/m 3 and ϕ = 30%, respectively, while the maximum and minimum hydrate saturation is expected to range between 47% and 26% [15]. Thus, the highest and the lowest hydrate in situ volume will vary between 3.8 × 10 8 m 3 and 1.9 × 10 8 m 3 [15]. We used the minimum hydrate saturation value as the input for our model. The geothermal gradient in the Barents Sea varies significantly [7], with its average approximately equal to 0.03 C/m [1]. The pressure gradient has been estimated to be 0.01 MPa/m [1].
The average bottom water temperature in the Barents Sea is heavily affected by water mass movements [17]. The main water mass is a mixture of cold water from the Arctic and warm water from the Atlantic. At the cold water mass boundary, the temperature varies between −1.5 C and 5 C from the bottom to the top, while it is 2 C to 10 C in the warm water region. The difference in temperature between summers and winters is negligible [7]. The sea bottom temperature is approximately 2 C [1]. The thickness of the hydrate stability zone varies from approximately 155 m at water depth 395 m to 170 m at water depth 440 m [1]. The hydrate layer thickness has been estimated to be approximately 110 m in this paper.
The initial pressure, temperature, and mean stress were set to 4 MPa, 275.15 K and 8.97 MPa, respectively, for the top boundary, and 7 MPa, 285.65 K and 15.4 MPa, for the bottom boundary. The initial hydrate saturation was 0.26. The reservoir properties and material properties used as inputs to model the Bjørnøya gas hydrates are listed in Table 1 and Table 2. The primary chemical species in the aqueous phase included H 2 O, HCO 3 , OH and O 2 ( gas ) , with CH 4 ( aq . ) , CO 3 2 , H + and CO 2 ( aq . ) treated as secondary chemical species. The gas phase was considered to contain only CH 4 gas . The model was run for 5000 time steps, which is equivalent to a 5-year period.
CH 4 production from the assigned production well started at time point zero. The temperature and pressure of the production well were set to values outside of the gas hydrate stability region, with the pressure difference between the production well and surroundings being the main driving force triggering hydrate dissociation. As evident from Figure 2, the pressure draw down propagated rapidly throughout the entire hydrate layer.
The hydrate phase transitions were tracked through porosity changes. As the result of rapid pressure drops propagating throughout the entire reservoir, all of the hydrate layer was driven outside the stability region at the early stages of simulation, thus causing hydrates to dissociate. The increase in porosity is depicted in Figure 3.
Gas flux towards the production well from the gas layer and the hydrate layer is shown in Figure 4.
Methane hydrate dissociation is an endothermic process that adsorbs heat from surroundings, thus making heat transfer its controlling mechanism. Figure 5 shows the heat flux in the model. As shown in Figure 6, reservoir temperature decreased continuously, with temperature reduction due to gas expansion clearly visible in the gas-containing layer.
The strength of hydrate-bearing sediments will be heavily affected by the strain rate, consolidation stress, grain size, temperature, density, and hydrate cage occupancy [19]. Being a pseudo mineral, hydrates are a part of the matrix, and hydrate saturation exceeding 25%–40 % can contribute to the overburden stress-bearing capacity of the top layers [20], with the dissociation of hydrate reducing the volume of the load-carrying matrix. Thus, effective stress becomes the dominant mechanism that controls the sediment stiffness and strength [20]. Furthermore, during the production of CH 4 from hydrate reservoirs, the pore pressure will gradually drop, while the net compaction pressure on the matrix increases. Therefore, the stability of the dissociated area will be negatively affected and may cause compaction and destruction of the local structures. This geomechanical effect of hydrate dissociation in the hydrate bearing sediments is taken into account implicitly inside the RCB via geomechanical calculations performed on the same time step as the flow calculations. Figure 7 and Figure 8 plot the effective stress in the vertical and horizontal directions. The lack of tensile strength data for the hydrate layer in Bjørnøya made it impossible to analyse the probability of structure collapse and compaction.

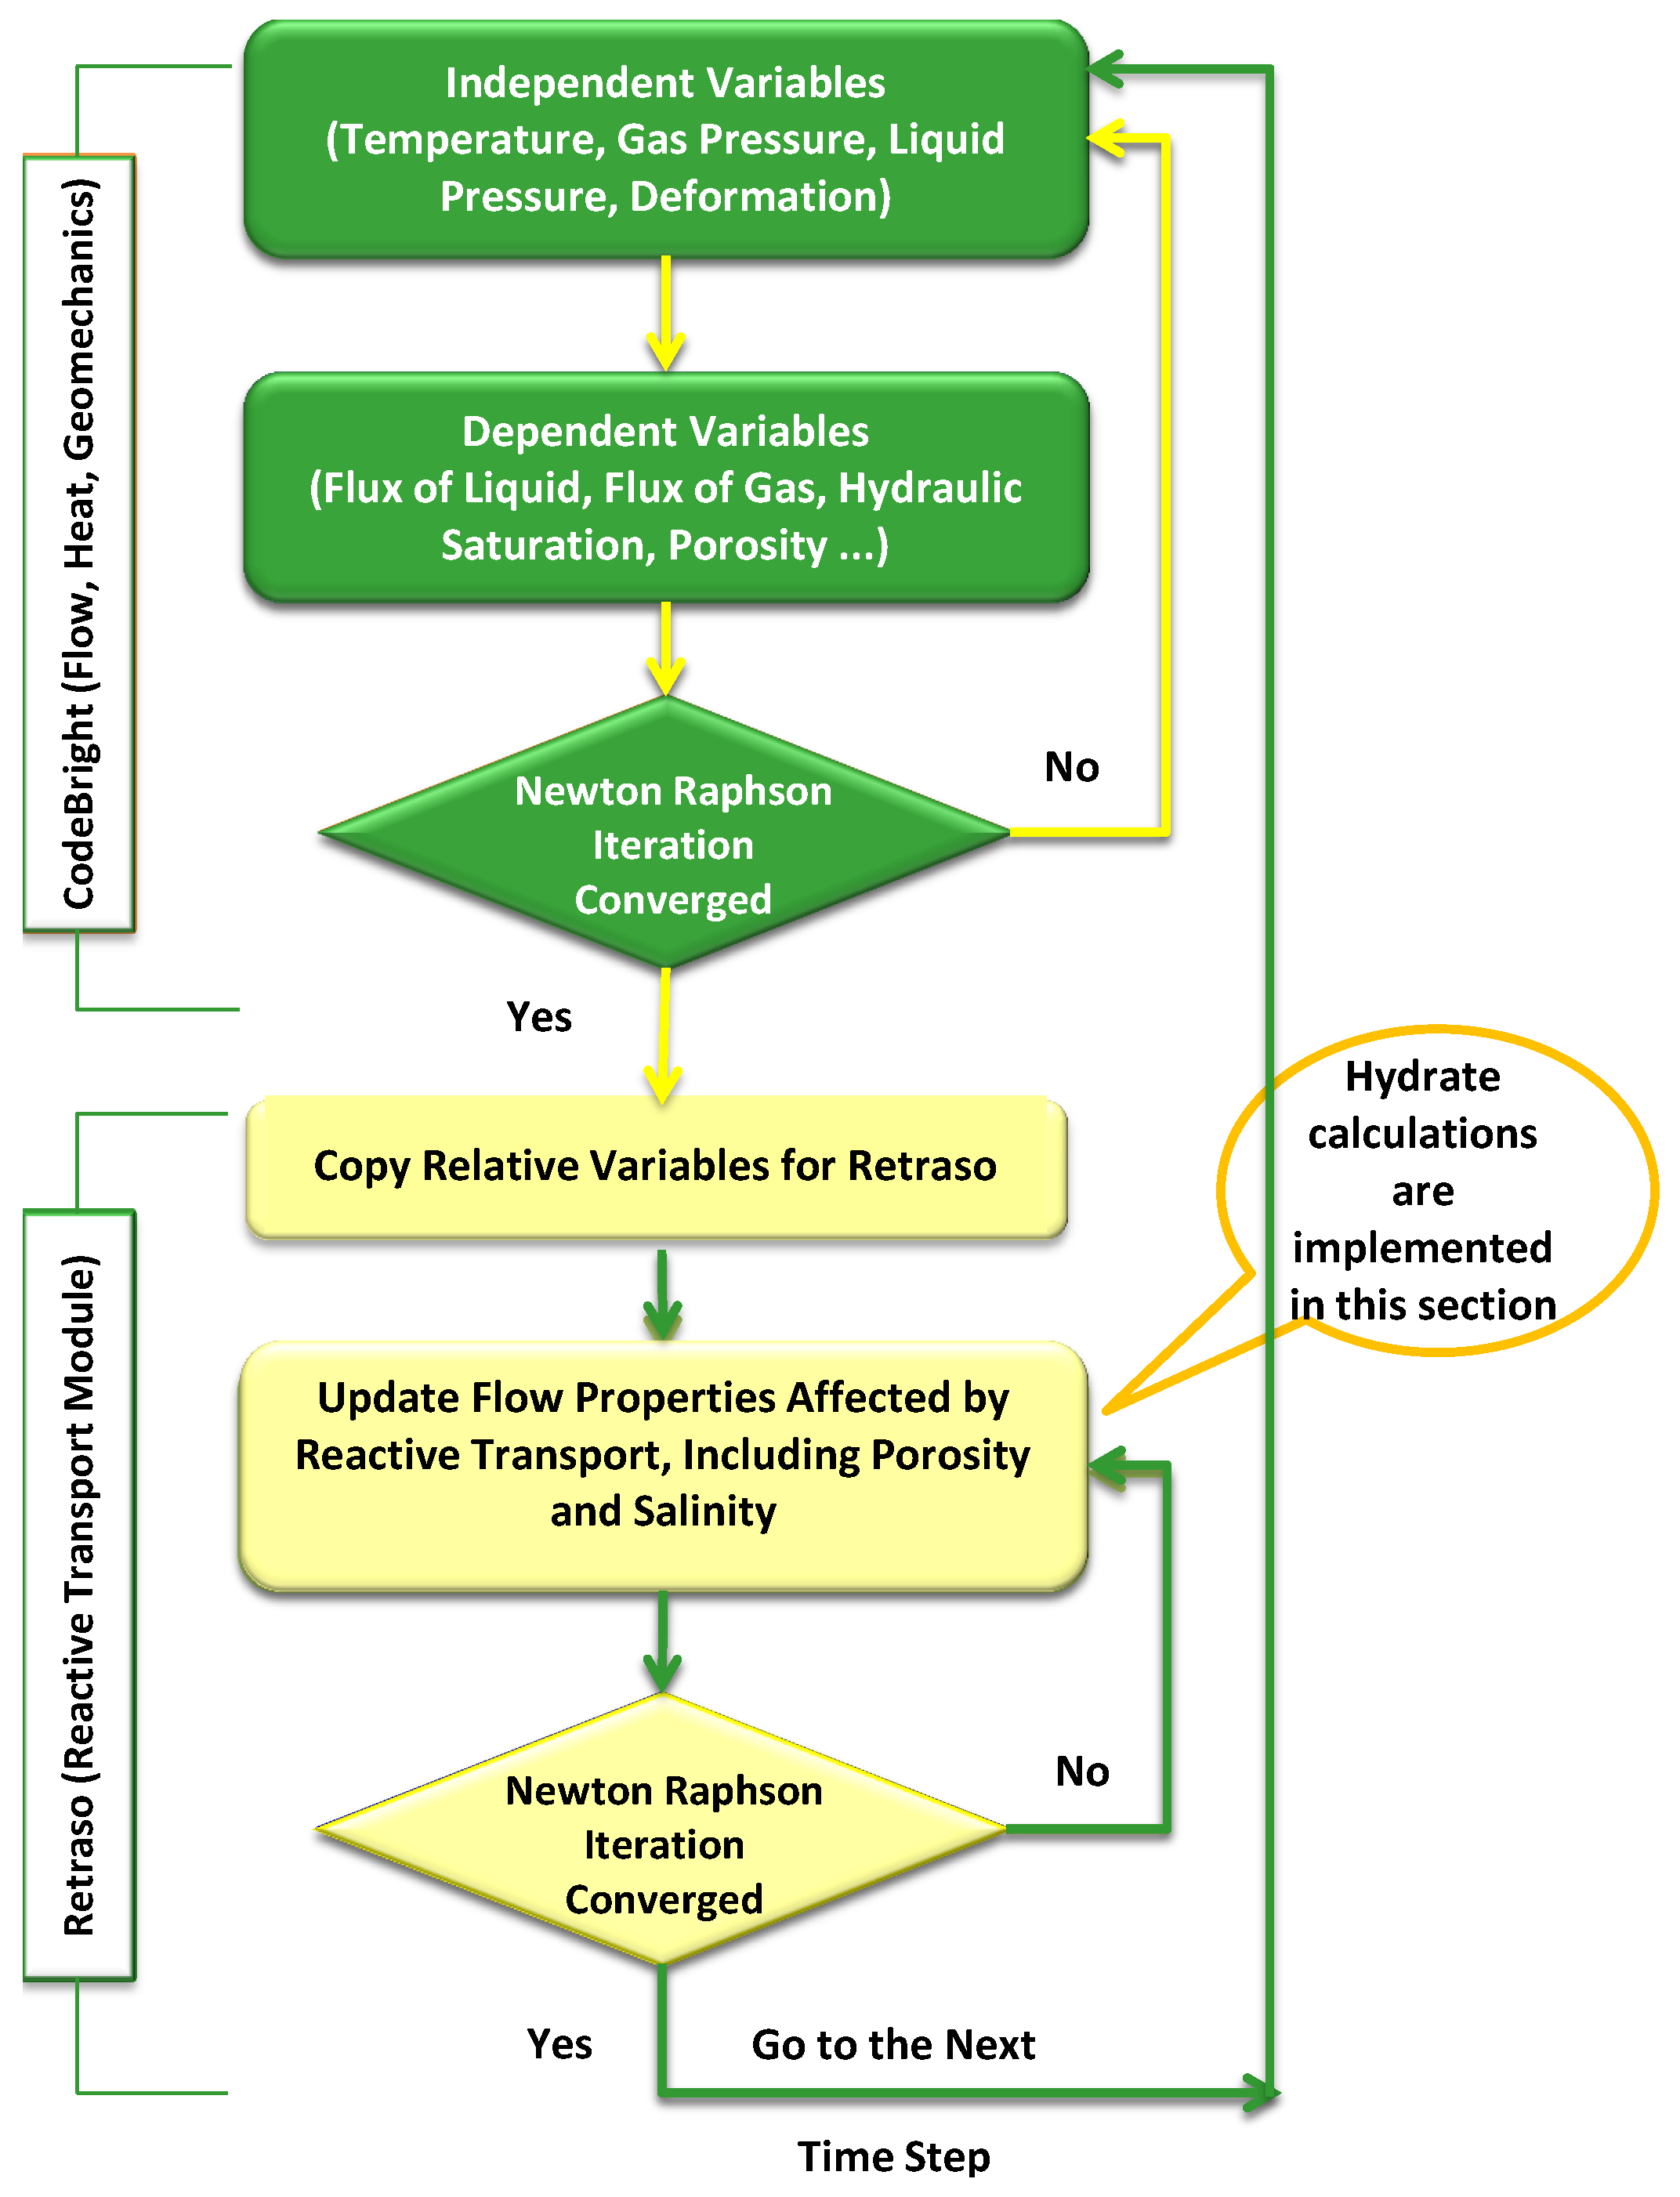
3. Methods and Procedures

Theory

When temperature and pressure are both fixed by local conditions, as they are in real reservoirs, an equilibrium between the three phases will be impossible to establish even in a simple system containing water and methane. This trivial conclusion forms the basis for all equilibrium measurements where only one of these two parameters is fixed. Another consequence will be the inhomogeneity of methane chemical potential in different phases. Accordingly, hydrates created from methane as free gas, methane dissolved in water, or methane trapped in water layers adsorbed on mineral surfaces will all have different compositions and thus by definition constitute unique phases. The complexity of this non-equilibrium situation will increase when more than one hydrate former is present. As a result, equilibrium could not be reached, and competition will always exist between various hydrate formers. Thus, at each time step and each node, only those hydrate phase transitions that yield the largest negative free energy change have the possibility to occur. A realistic modelling of NGHs requires taking into account all of the various phase transition routes by considering the competition between all hydrate formers using Gibbs free energy minimization. Previously, two routes for methane hydrate phase transitions were implemented in the RCB using the following reactions: CH 4 ( gas ) + 5.75 H 2 O ( liq . ) ( Hydrate ) 1 , and CH 4 ( aq . ) + 5.75 H 2 O ( liq . ) ( Hydrate ) 2 . The interested reader can find detailed calculations and explanations of implementation techniques in References [9,10]. The following description is the methodology that we used to implement the second route where the guest molecule is CH 4 ( aq . ) . At this stage, we applied classical nucleation theory to calculate the kinetic rate of hydrate phase transitions. Through nucleation theory, it is possible to relate mass transfer, heat transfer and non-equilibrium thermodynamic calculations to the kinetic rate of hydrate phase transitions:
R ( i , t , n ) = R 0 · e β Δ G ,
where R ( i , t , n ) is the dissociation/formation/reformation rate of hydrate type i at node number n at time step t. R 0 is the mass transport controlling term that is calculated using Fick’s Law. Water will be the dominant component and always exists in the environment in the CH 4 -hydrate system. This makes the mass transport of CH 4 inside the aqueous phase the constraint for phase transitions. Thus, we have that R 0 = D · ρ ¯ · X / z , where R 0 is the mean value of the CH 4 diffusive flux at the hydrate and water interface. X / z is the CH 4 mole fraction gradient from the hydrate surface to the interface. ρ ¯ is the methane hydrate molar density that is equal to 949.4 mol/m 3 .
A non-equilibrium thermodynamic package developed in-house by our group has been added to the RCB [11,12,13,14]; it enables one to define the constraints within the system with respect to thermodynamic variables. To determine which hydrate phase transitions are likely to occur for every node at every time step, Δ G of each phase transition is calculated based on the independent thermodynamics variables—namely, pressure, temperature and CH 4 ( aq . ) concentration. We ignore both hydrate phase transitions associated with positive changes Δ G as well as unlikely ones with Δ G s < ϵ , thus considering only phase transitions with free energy changes negative enough to cross the nucleation barrier. The free energy change will amount to
Δ G = δ [ x w H ( μ w H μ w ( aq . ) , a ) + x CH 4 H ( μ CH 4 H μ CH 4 ( aq . ) , a ) ] ,
where Δ G is calculated for every hydrate phase transition. δ will become + 1 for hydrate formation and 1 for hydrate dissociation. The superscripts H and (aq.) denote hydrate and aqueous phases. Superscript (a) refers to the mole fraction of CH 4 ( aq . ) in Figure 9 at given pressure and temperature conditions of the specific node.
Whether the aqueous phase is super-saturated or under-saturated with respect to the hydrate former, CH 4 ( aq . ) , will depend on CH 4 ( aq . ) concentration at given pressure and temperature at every node and every time step. CH 4 ( aq . ) concentration falling either above the blue line or below the red plane in Figure 9 will mean that the aqueous phase is super-saturated with respect to CH 4 ( aq . ) . The hydrate formation will then occur at the kinetic rate defined in Equation (1). If the specific area in the reservoir model comes into contact with brine water under-saturated with respect to CH 4 , then the CH 4 ( aq . ) concentration in Figure 9 will fall below the blue line, and the hydrate will start to dissociate.

4. Conclusions

We have applied the RCB hydrate simulator [8] to perform a case study of pressure reduction-facilitated production of natural gas from the Bjørnøya hydrate reservoir [1] using available geological data. Our hydrate simulator utilizes a reactive transport algorithm that minimizes local free energy to determine and evaluate phase distribution most probable in a non-equilibrium system. The advantage of this approach lies in the fact that each competing phase transition can be treated as a non-equilibrium pseudo reaction subject to free energy minimization. At every time step, the solver uses an implicit algorithm to calculate mass flow, heat flow, and reservoir geomechanical conditions. The mass flow is then used, in the same time step, to make corrections for changes in distribution of all components over all possible phases, and hand the individual mass fluxes of all components back to the primary solver in preparation for the next time step. RCB applies the classical nucleation theory to calculate the kinetic rates of hydrate dissociation and reformation. Competing phase transitions associated with the two possible hydrate routes were treated using the non-equilibrium thermodynamic package developed by our group and added to the simulator.
The results of our study showed that pressure drop imposed through the production well propagated rapidly throughout the reservoir. This may have been due to high permeability of both hydrate and gas layers, resulting in a better connection between pores inside the medium. Thus, methane hydrate dissociation from the hydrate layer started at the early stages of simulation.
The gas hydrates at Bjørnøya exist in a loose fine-grained sediment, with their occurrence most likely spread throughout the sediment, forming veins and nodules [20]. A consideration of sand production due to hydrate dissociation can also be of importance for this basin. A sensitivity study of critical parameters like permeability, porosity, possible inhomogeneities, and initial mechanical strength of hydrate-filled sediments will be required to get a better picture of its hydrate production potential.
Lack of specific data on flow parameters and initial mechanical strength of hydrate-containing sediments imposes certain limitations when it comes to quantitative interpretation of the simulation. A sensitivity study on critical model parameters for the actual conditions is in the planning stages currently.

Acknowledgments

We acknowledge the grant and support from the Research Council of Norway and Industrial partners through the following projects: CLIMIT “Safe long term sealing of CO 2 in hydrate”, Research Council of Norway, project number: 224857, SSC-Ramore, “Subsurface storage of CO 2 —Risk assessment, monitoring and remediation”, project number: 178008/I30, FME-SUCCESS, project number: 804831, PETROMAKS, “CO 2 injection for extra production”, Research Council of Norway, project number: 801445, PETROMAKS “CO 2 Injection for Stimulated Production of Natural Gas”, Research Council of Norway, project number: 175968 and 230083, and STATOIL, under contract 4502354080.

Author Contributions

Khadijeh Qorbani implemented the necessary code changes and extensions needed within the RCB hydrate simulator, as well setting up and running the simulations. She was also the primary author of the manuscript and performed the majority of the analysis of the simulation results. Bjørn Kvamme did implement all the changes from ideal gas description to thermodynamics based on Soave-Redlich-Kwong equation of state. Associated changes in various algorithms in order to improve convergence for the modified version was also guided by Bjørn Kvamme. Bjørn Kvamme also provided the complete thermodynamic package for hydrate description and thermodynamic changes for all phase transition involved in hydrate formation and dissociation. Tatiana Kuznetsova provided both language corrections, as well as support in the analysis of the results.

Conflicts of Interest

The authors declare no conflict of interest.

Abbreviations

The following abbreviations are used in this manuscript:
D (m 2 /s)Diffusion coefficient
P (MPa)Pressure
R (mol/(m 2 s))Rate
T (K)Temperature
x , X (1)Mole-fraction
z (nm)Distance
HHydrate phase
β (mol/kJ)Inverse temperature 1/ ( R T )
ρ ¯ (mol/m 3 )Molar density
μ (kJ/mol)Chemical potential
G (kJ/mol)Gibbs free energy

Appendix A. RCB Simulator Package

RCB is a reactive transport simulator; as illustrated in Figure A1, it is a coupling of two codes, CodeBright and Retraso [8]. At every time step, the CodeBright module implicitly solves the mass flow, heat flow, and geomechanical equations [21,22,23]. The CodeBright output is then handed to the Retraso module [24], which solves geochemistry equations required (including the hydrate "pseudo" reactions). Finally, after updating the flow properties, all of the results are returned to the CodeBright module in preparation for the next time step. Reference [8] contains further details on the governing equations utilized by the RCB. Finite-element and finite-difference methods are used to solve spatial and temporal discretization, and the Newton–Raphson method is used to solve these non-linear equations.
Figure A1. RetrasoCodeBright (RCB) flowchart.
Energies 10 00187 g010
Implicit geomechanical calculations inside the CodeBright module enable the sampling and analysis of stress changes at every relevant time step without noticeable time lag because hydrate-phase transitions are substantially faster than mineral reactions. Relative permeabilities of liquid and gas are estimated using Van Genuchten model [21,22,23,25] and generalized power law, respectively. Additionally, intrinsic permeability and capillary pressure model were calculated using Kozeny’s correlation [26] and Van Genuchten model, respectively [21,22,23]. The Retraso module includes a wide range of species, which enabled us to implement various hydrate types as pseudo minerals and their reactions as pseudo reactions.
Pressure and temperature ranges used in our version of the code make the Soave–Redlich–Kwong (SRK) equation of state [27] accurate enough to model CO 2 and CH 4 gases, while CH 4 -hydrates and CO 2 -hydrates are introduced as pseudo minerals with their own pseudo reactions inserted into the database. CH 4 gas production through de-pressurization of the methane–hydrate reservoir, as well as storage of CO 2 -gas in the form of CO 2 -hydrate through injection, were implemented separately. Non-equilibrium thermodynamics were implemented by employing pressure and temperature perturbations from equilibrium using Taylor expansions [28]. Phase field theory (PFT) findings were used to account for the constant rate of the classical nucleation formula [28]. We used the GID post processor [29] to generate density plots from RCB output data.

References

  1. Laberg, J.S.; Andreassen, K. Gas hydrate and free gas indications within the Cenozoic succession of the Bjørnøya Basin, western Barents Sea. Mar. Pet. Geol. 1996, 13, 921–940. [Google Scholar] [CrossRef]
  2. Kvenvolden, K. Gas hydrates as a potential energy resource—A review of their methane content. U. S. Geol. Surv. Prof. Pap. (U. S.) 1993, 1570, 555–561. [Google Scholar]
  3. Sloan, E.; Koh, C. Clathrate Hydrates of Natural Gases; Chemical Rubber Company (CRC) Press: Boca Raton, FL, USA, 2007. [Google Scholar]
  4. Graue, A.; Kvamme, B.; Baldwin, B.; Stevens, J.; Howard, J.J.; Aspenes, E.; Ersland, G.; Husebo, J.; Zornes, D. MRI visualization of spontaneous methane production from hydrates in sandstone core plugs when exposed to CO2. SPE J. 2008, 13, 146–152. [Google Scholar] [CrossRef]
  5. Singh, S.; Arora, A. Techniques for exploitation of gas hydrate (clathrates) an untapped resource of methane gas. J. Microb. Biochem. Technol. 2015, 7, 108–111. [Google Scholar]
  6. Chabert, A.; Minshull, T.A.; Westbrook, G.K.; Berndt, C.; Thatcher, K.E.; Sarkar, S. Characterization of a stratigraphically constrained gas hydrate system along the western continental margin of Svalbard from ocean bottom seismometer data. J. Geophys. Res. 2011, 116. [Google Scholar] [CrossRef] [Green Version]
  7. Chand, S.; Mienert, J.; Andreassen, K.; Knies, J.; Plassen, L.; Fotland, B. Gas hydrate stability zone modelling in areas of salt tectonics and pockmarks of the Barents Sea suggests an active hydrocarbon venting system. Mar. Pet. Geol. 2008, 25, 625–636. [Google Scholar] [CrossRef]
  8. Saaltink, M.; Ayora, C.; Olivella, S. User’s Guide for RetrasoCodeBright (RCB); Institute of Earth Sciences Jauma Almera, Spanish Research Council (CSIC): Barcelona, Spain, 2005. [Google Scholar]
  9. Qorbani, K.; Kvamme, B. Non-equilibrium simulation of CH4 production from gas hydrate reservoirs through the depressurization method. J. Nat. Gas Sci. Eng. 2016, 35, 1544–1554. [Google Scholar] [CrossRef]
  10. Chejara, A.; Kvamme, B.; Vafaei, M.T.; Jemai, K. Simulations of long term methane hydrate dissociation by pressure reduction using an extended RetrasoCodeBright simulator. Energy Convers. Manag. 2013, 68, 313–323. [Google Scholar] [CrossRef]
  11. Kvamme, B. Kinetics of Hydrate Formation From Nucleation Theory; International Society of Offshore and Polar Engineers: Mountain View, CA, USA, 2002. [Google Scholar]
  12. Kvamme, B. Droplets of Dry Ice and Cold Liquid CO2 for Self-Transport of CO2 to Large Depths; International Society of Offshore and Polar Engineers: Mountain View, CA, USA, 2003. [Google Scholar]
  13. Kvamme, B.; Kuznetsova, T.; Kivelæ, P.H.; Bauman, J. Can hydrate form in carbon dioxide from dissolved water? Phys. Chem. Chem. Phys. 2013, 15, 2063–2074. [Google Scholar] [CrossRef] [PubMed]
  14. Kvamme, B.; Qasim, M.; Baig, K.; Kivelä, P.H.; Bauman, J. Hydrate phase transition kinetics from Phase Field Theory with implicit hydrodynamics and heat transport. Int. J. Greenh. Gas Control 2014, 29, 263–278. [Google Scholar] [CrossRef]
  15. Laberg, J.S.; Andreassen, K.; Knutsen, S.M. Inferred gas hydrate on the Barents Sea shelf—A model for its formation and a volume estimate. Geo-Mar. Lett. 1998, 18, 26–33. [Google Scholar] [CrossRef]
  16. Knutsen, S.M.; Vorren, T.O. Early Cenozoic sedimentation in the Hammerfest Basin. Mar. Geol. 1991, 101, 31–48. [Google Scholar] [CrossRef]
  17. Løvø, V.; Elverhøi, A.; Antonsen, P.; Solheim, A.; Liestøl, O. Submarine Permafrost and Gas Hydrates in the Northern Barents Sea; Technical Report; Norsk Polarinstitutt: Tromsø, Norway, 1990. [Google Scholar]
  18. Waite, W.F.; Stern, L.A.; Kirby, S.H.; Winters, W.J.; Mason, D.H. Simultaneous determination of thermal conductivity, thermal diffusivity and specific heat in sI methane hydrate. Geophys. J. Int. 2007, 169, 767–774. [Google Scholar] [CrossRef]
  19. Winters, W.J.; Pecher, I.A.; Waite, W.F.; Mason, D.H. Physical properties and rock physics models of sediment containing natural and laboratory-formed methane gas hydrate. Am. Mineral. 2004, 89, 1221–1227. [Google Scholar] [CrossRef]
  20. Waite, W.F.; Santamarina, J.C.; Cortes, D.D.; Dugan, B.; Espinoza, D.N.; Germaine, J.; Jang, J.; Jung, J.W.; Kneafsey, T.J.; Shin, H.; et al. Physical properties of hydrate-bearing sediments. Rev. Geophys. 2009, 47. [Google Scholar] [CrossRef]
  21. Olivella, S.; Carrera, J.; Gens, A.; Alonso, E.E. Nonisothermal multiphase flow of brine and gas through saline media. Transp. Porous Med. 1994, 15, 271–293. [Google Scholar] [CrossRef]
  22. Olivella, S.; Gens, A.; Carrera, J.; Alonso, E. Numerical formulation for a simulator (CODE_BRIGHT) for the coupled analysis of saline media. Eng. Comput. 1996, 13, 87–112. [Google Scholar] [CrossRef]
  23. Olivella, S.; Gens, A.; Carrera, J. CodeBright User’s Guide; Universitat Politecnicade Catalunya and Institutode Ciencias de la Tierra, CSIS: Barcelona, Spain, 1997. [Google Scholar]
  24. Saaltink, M.W.; Batlle, F.; Ayora, C.; Carrera, J.; Olivella, S. RETRASO, a code for modeling reactive transport in saturated and unsaturated porous media. Geol. Acta 2004, 2, 235–251. [Google Scholar]
  25. Van Genuchten, M.T. A closed-form equation for predicting the hydraulic conductivity of unsaturated soils. Soil Sci. Soc. Am. J. 1980, 44, 892–898. [Google Scholar] [CrossRef]
  26. Kozeny, J. Ueber kapillare leitung des wassers im boden. Akad. Wiss. 1927, 136, 271–306. [Google Scholar]
  27. Soave, G. Equilibrium constants from a modified Redlich-Kwong equation of state. Chem. Eng. Sci. 1972, 27, 1197–1203. [Google Scholar] [CrossRef]
  28. Vafaei, M.; Kvamme, B.; Chejara, A.; Jemai, K. A new reservoir simulator for studying hydrate dynamics in reservoir. Int. J. Greenh. Gas Control 2014, 23, 12–21. [Google Scholar] [CrossRef]
  29. International Center for Numerical Methods in Engineering. GID—The Personal Pre and Post Processor. Available online: http://www.gidhome.com/ (accessed on 31 December 2016).
Figure 1. The gas hydrate reservoir model in Bjørnøya with one production well.
Energies 10 00187 g001
Figure 2. Pressure changes after two and five years of production.
Energies 10 00187 g002
Figure 3. Porosity changes inside the reservoir after two and five years of production.
Energies 10 00187 g003
Figure 4. CH 4 gas flux inside the reservoir after two and five years of production.
Energies 10 00187 g004
Figure 5. Heat flux inside the reservoir after two and five years of production.
Energies 10 00187 g005
Figure 6. Temperature after two and five years of production.
Energies 10 00187 g006
Figure 7. Effective stress in the y-direction after five years of production.
Energies 10 00187 g007
Figure 8. Effective stress in the x-direction after five years of production.
Energies 10 00187 g008
Figure 9. The maximum CH 4 solubility into aqueous phase (red surface) and the minimum soluble CH 4 inside the aqueous phase required to keep hydrate stable (blue line).
Energies 10 00187 g009
Table 1. Properties of the reservoir model layers.
PropertyGas LayerHydrate LayerCaprock
Young’s modulus (GPa)0.50.50.5
Poisson’s ratio0.250.250.25
Zero stress porosity0.30.30.08
Zero stress permeability (m 2 )2 × 10 14 3 × 10 15 10 35
Van Genuchten’s gas entry pressure (at zero stress) (MPa)0.01960.01960.196
Van Genuchten’s exponent (m)0.4570.4570.457
Longitude dispersion factor (m)111111
Molecular diffusion (m)10 10 10 10 10 10
Table 2. Medium properties.
PropertyValueUnit
Thermal conductivity of saturated medium2.18W/(m·K)
Thermal conductivity of dry medium2.0W/(m·K)
Solid Phase Density2150Kg/m 3
Specific heat of rock874J/(kg·K)
CH 4 -hydrate molecular weight119.5g/mol
CH 4 -hydrate density907.40kg/m 3
CH 4 -hydrate specific heat2200J/(kg·K) [18]
CH 4 -hydrate reaction enthalpy53.24kJ/mol

