1. Introduction
The implementation of energy saving measures in the building sector is nowadays key in energy development policies supported by the European Union to reduce both its energetic dependence and the emissions of greenhouse gases. Simultaneously, thermal comfort requirements must still be met. On the path towards energy efficiency, the use of an appropriate control for heating, ventilation and air-conditioning (HVAC) systems can be as important as the use of improved construction materials and the thermal insulation of the building envelope [
1].
Being a low exergy thermal system, TABS takes advantage of the high thermal inertia of the building structure and becomes an adequate choice to achieve significant economic and energetic savings when used under an appropriate HVAC control as model predictive control, MPC. Many authors have studied the behaviour and modelling of a specific TABS, Concrete Core Activation (CCA), where the concrete floor or ceiling is thermally activated. Most importantly, the heat transfer model by Koschenz and Lehmann [
2], the RC equivalent network model by Weber et al. [
3] and its validation in the frequency and time domain by Weber and Jóhannesson [
4] deserve to be mentioned here. The advantage of a high thermal inertia for efficient heating and cooling requires an adequate control strategy in order to avoid overheating, undercooling or destroying useful cooling or heating power by compensating it before it has reached the adjacent zone as described by Sourbron et al. [
5]. Therefore, usually MPC is proposed because it explicitly considers these slower system dynamics as explained by Gwerder et al. [
6].
The chosen HVAC control strategy for buildings influences the amount of energy needed to meet comfort requirements. Although On-Off switch and rule-based control (RBC) are widely used control schemes in office buildings, the need to improve the energetic and economic efficiency of the HVAC systems calls for more advanced controls such as the genetic algorithm used by Yu and Nam [
7]. The development of schemes as the classical proportional integral (PI) [
8], fuzzy logic based methods [
9], artificial neural networks (ANN) [
10] or fuzzy and MPC integration [
11] allow for the reduction of the energy use while maintaining the required thermal comfort.
In the last years the domain where MPC is implemented has expanded, from the first papers about its applications in the chemical field by Richalet et al. [
12] to a wide spectre of studies and applications as the plasma control simulations of Garrido et al. [
13,
14], the trajectory generation of unmanned aerial vehicles as describe Singh and Fuller in [
15], the management of the energy for electric vehicles provided by Ji et al. [
16] or even in the treatment of diabetes as described in [
17]. In the building sector, the literature shows multiple studies and implementation cases such as the ones associated to the OptiControl project collected in [
18] by Gyalistras et al. and in [
19] by Gwerder et al., those related to the work of Picard et al. [
20] and Antonov [
21] or the recent study of Killian and Kozek [
22] about the important aspects associated with the use of MPC in energy efficient buildings. Focused on energy saving policies, some of those studies show reductions in the energy use of about 15% or even higher. As an example, the study of De Coninck and Helsen [
23] suggests an energy cost reduction of 30% for an office building in Brussels while Široký et al. [
24] studied the behaviour of different buildings getting potential energy saving ranging from 15% to 28%. The studies in Australia of West et al. [
25] provide energy savings of 19% and 32%. Although the MPC in building sector is usually applied to office blocks, there are also successful studies on other buildings typologies, namely residential buildings, as the gathered by Carrascal et al. in [
26] where the study of MPC in a low construction quality building provides potential energy savings over 15%. The use of MPC for scheduling the energy use in residential buildings is studied by Chen et al. in [
27]. Meanwhile Patteeuw and Helsen [
28] focused on the reduction of CO
2 emissions of residential heating systems by using MPC. Therefore, it is nowadays possible to consider MPC as an appropriate control for building climate applications.
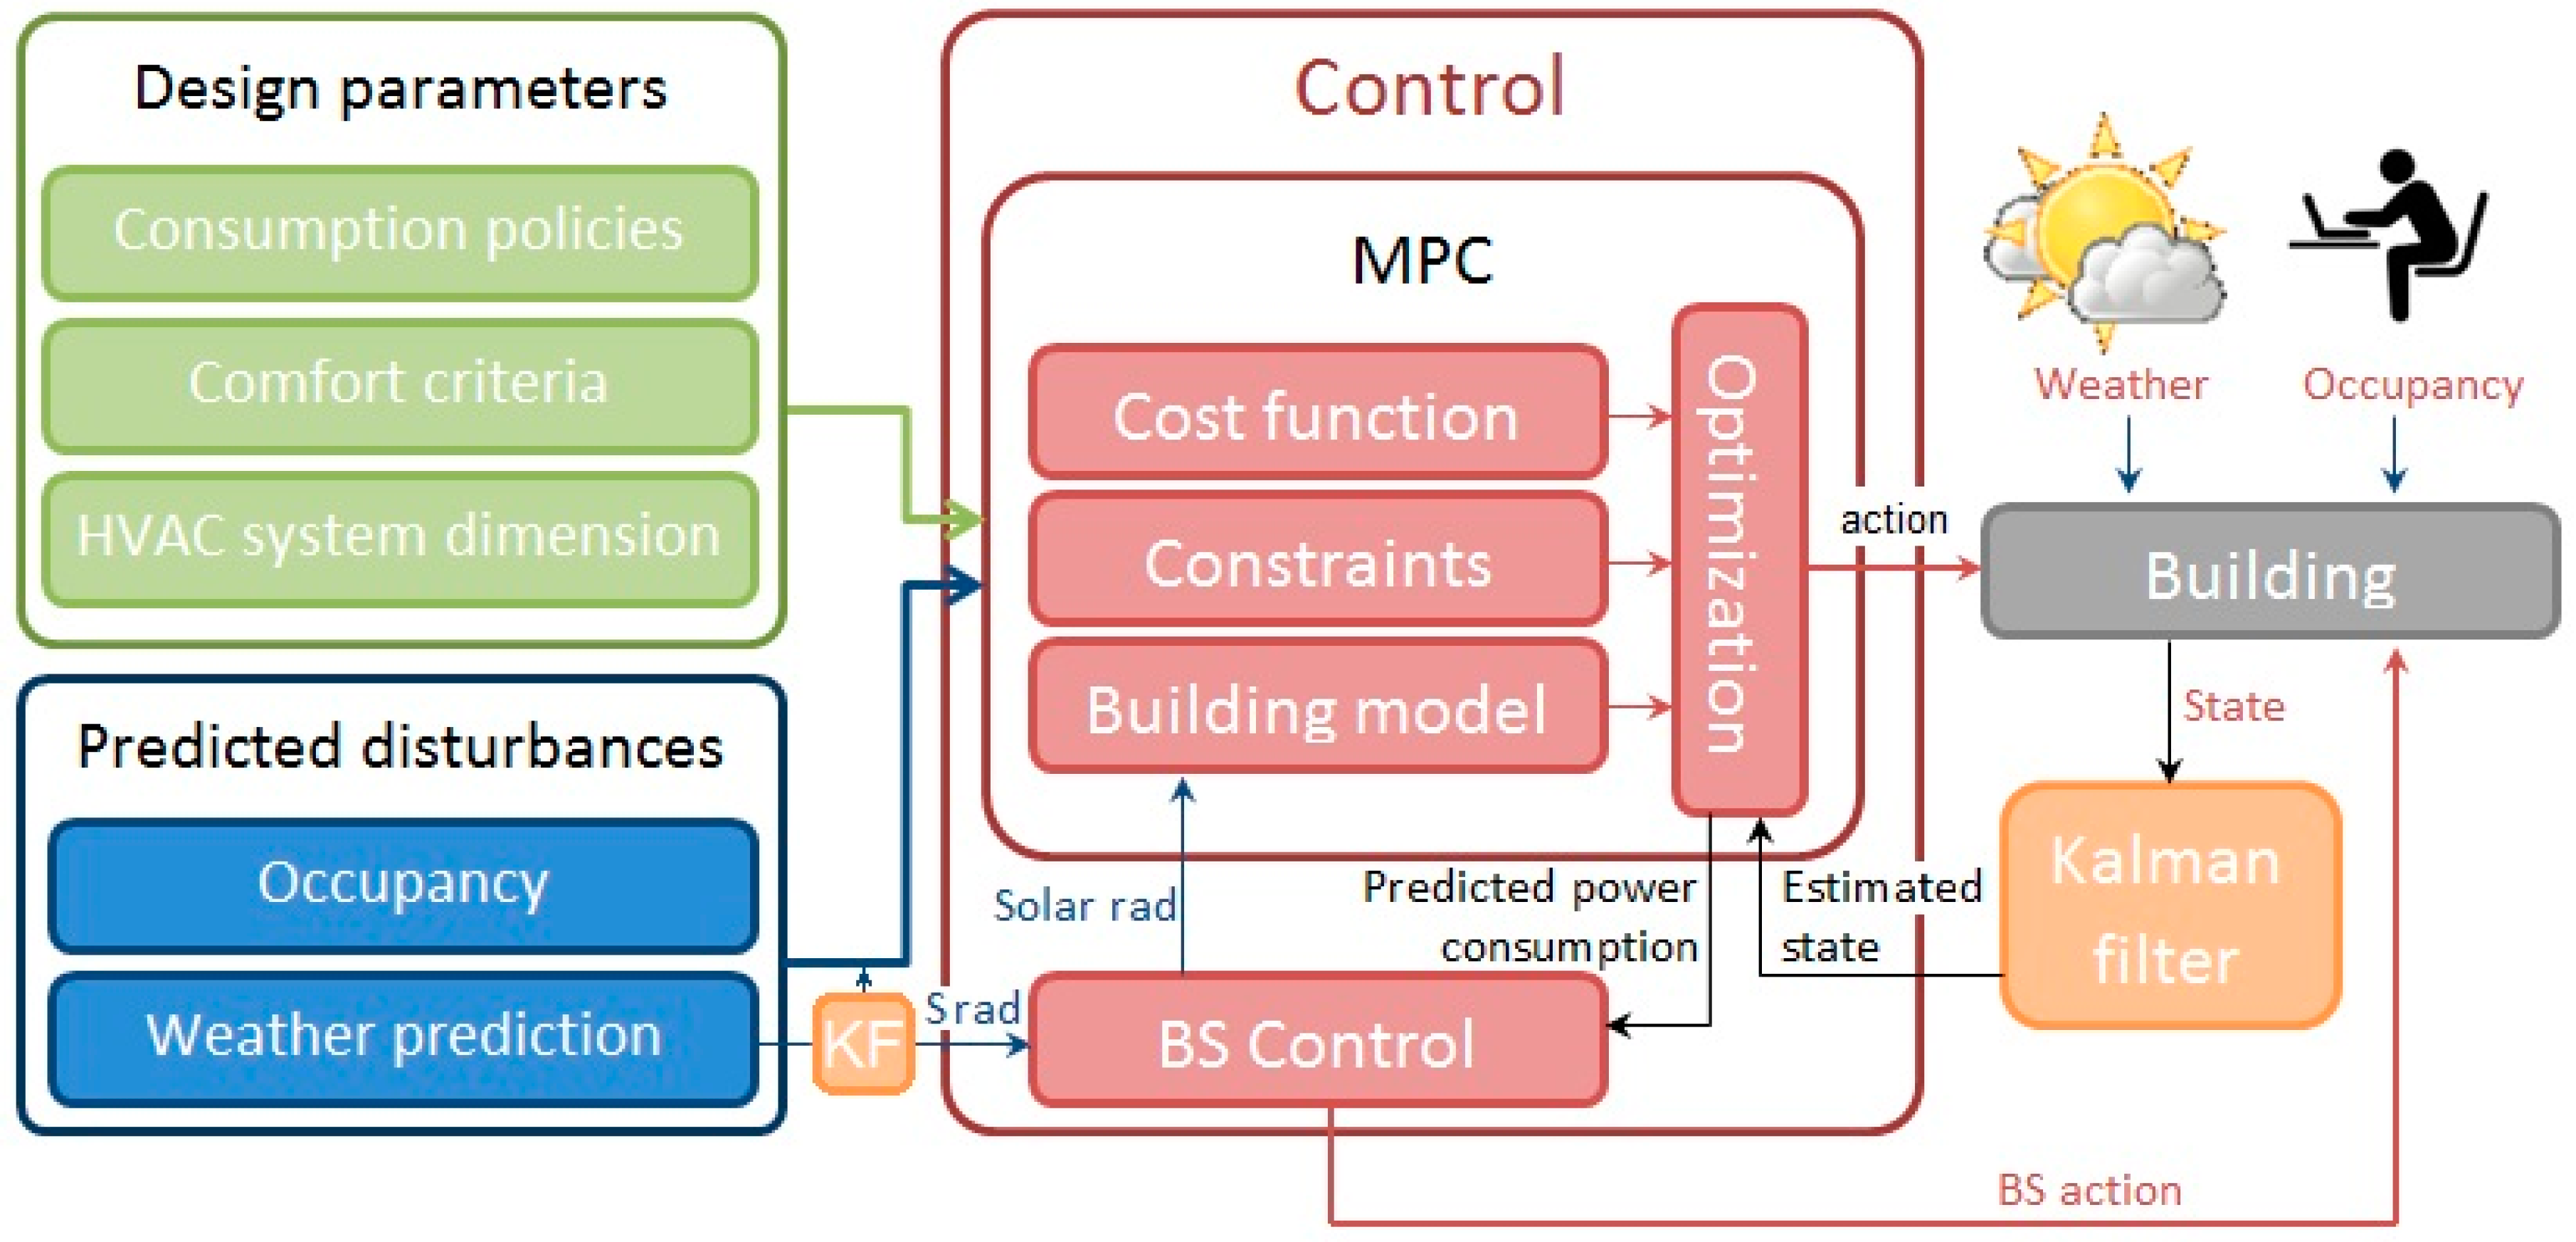
The usage of an MPC to develop the control policies of HVAC systems exploits the knowledge of the predicted values of variables like meteorological disturbances or the heat gains associated to the activity in the building. Moreover, it can use information about the variation of the comfort conditions over time, the use of different climate equipment or the changes in energy rates. The control guaranties thermal comfort with a minimum control objective namely energy use. Therefore, the MPC is an improved control option provided that the predicted disturbances are close to the actual disturbances and it has a correct model of the building.
The main challenge MPC has to face towards its successful implementation is the development of an adequate model for the building under study. As the control action is calculated for the prediction horizon, the development of an accurate model of the building is critical to obtain an appropriate response. Good predictions for meteorological variables and use-patterns are also necessary in order to get an adequate response of the system and to maintain the desired comfort conditions. The difference between the modelled and the real behaviour of the building implies an error in control action. This is usually smoothed by using a state estimation filter, namely a Kalman filter [
29]. The effect of the difference between predicted and real disturbances also decreases when a filter is applied. Maasoumy et al. [
30] discuss the building model uncertainty under the MPC, Zhang et al. [
31] discourses about the treatment of uncertainty in weather and occupancy predictions.
Solar radiation is one of the crucial factors regarding the comfort quality of a building. Its incidence on the façade causes the wall temperature to increase, which in turn influences the heat exchange with the interior. Incident radiation through the windows, after reflection and absorption in the glass layers, strikes the indoors walls, floor and furniture, and then propagates to the indoor environment. An appropriate use of this radiation will reduce the power consumption in winter, but it must be avoided in summer to eliminate overheating.
Previous studies have considered a hysteresis control for the blind system (BS) as the one of Sturzenegger et al. [
32], presenting the results of the OptiControl project or Sourbron’s PhD [
33] where the office model used for this study is described. The study of Le et al. [
34] about the influence of the BS in the energetic expenses of a building proposes at first stance a hybrid MPC in which the BSC, integrated in the MPC, operates in four discrete positions. A second part of the study proposes a controller by learning from the optimal controller behaviour using a support vector machine. The work of Lawal [
35] also studies the integration of the BS in the MPC as a hybrid combination of continuous actions for the heating-cooling system and three discrete positions for the BS based on indoor temperature. The work of Dussault et al. [
36] provides a comparison between different control algorithms for smart windows.
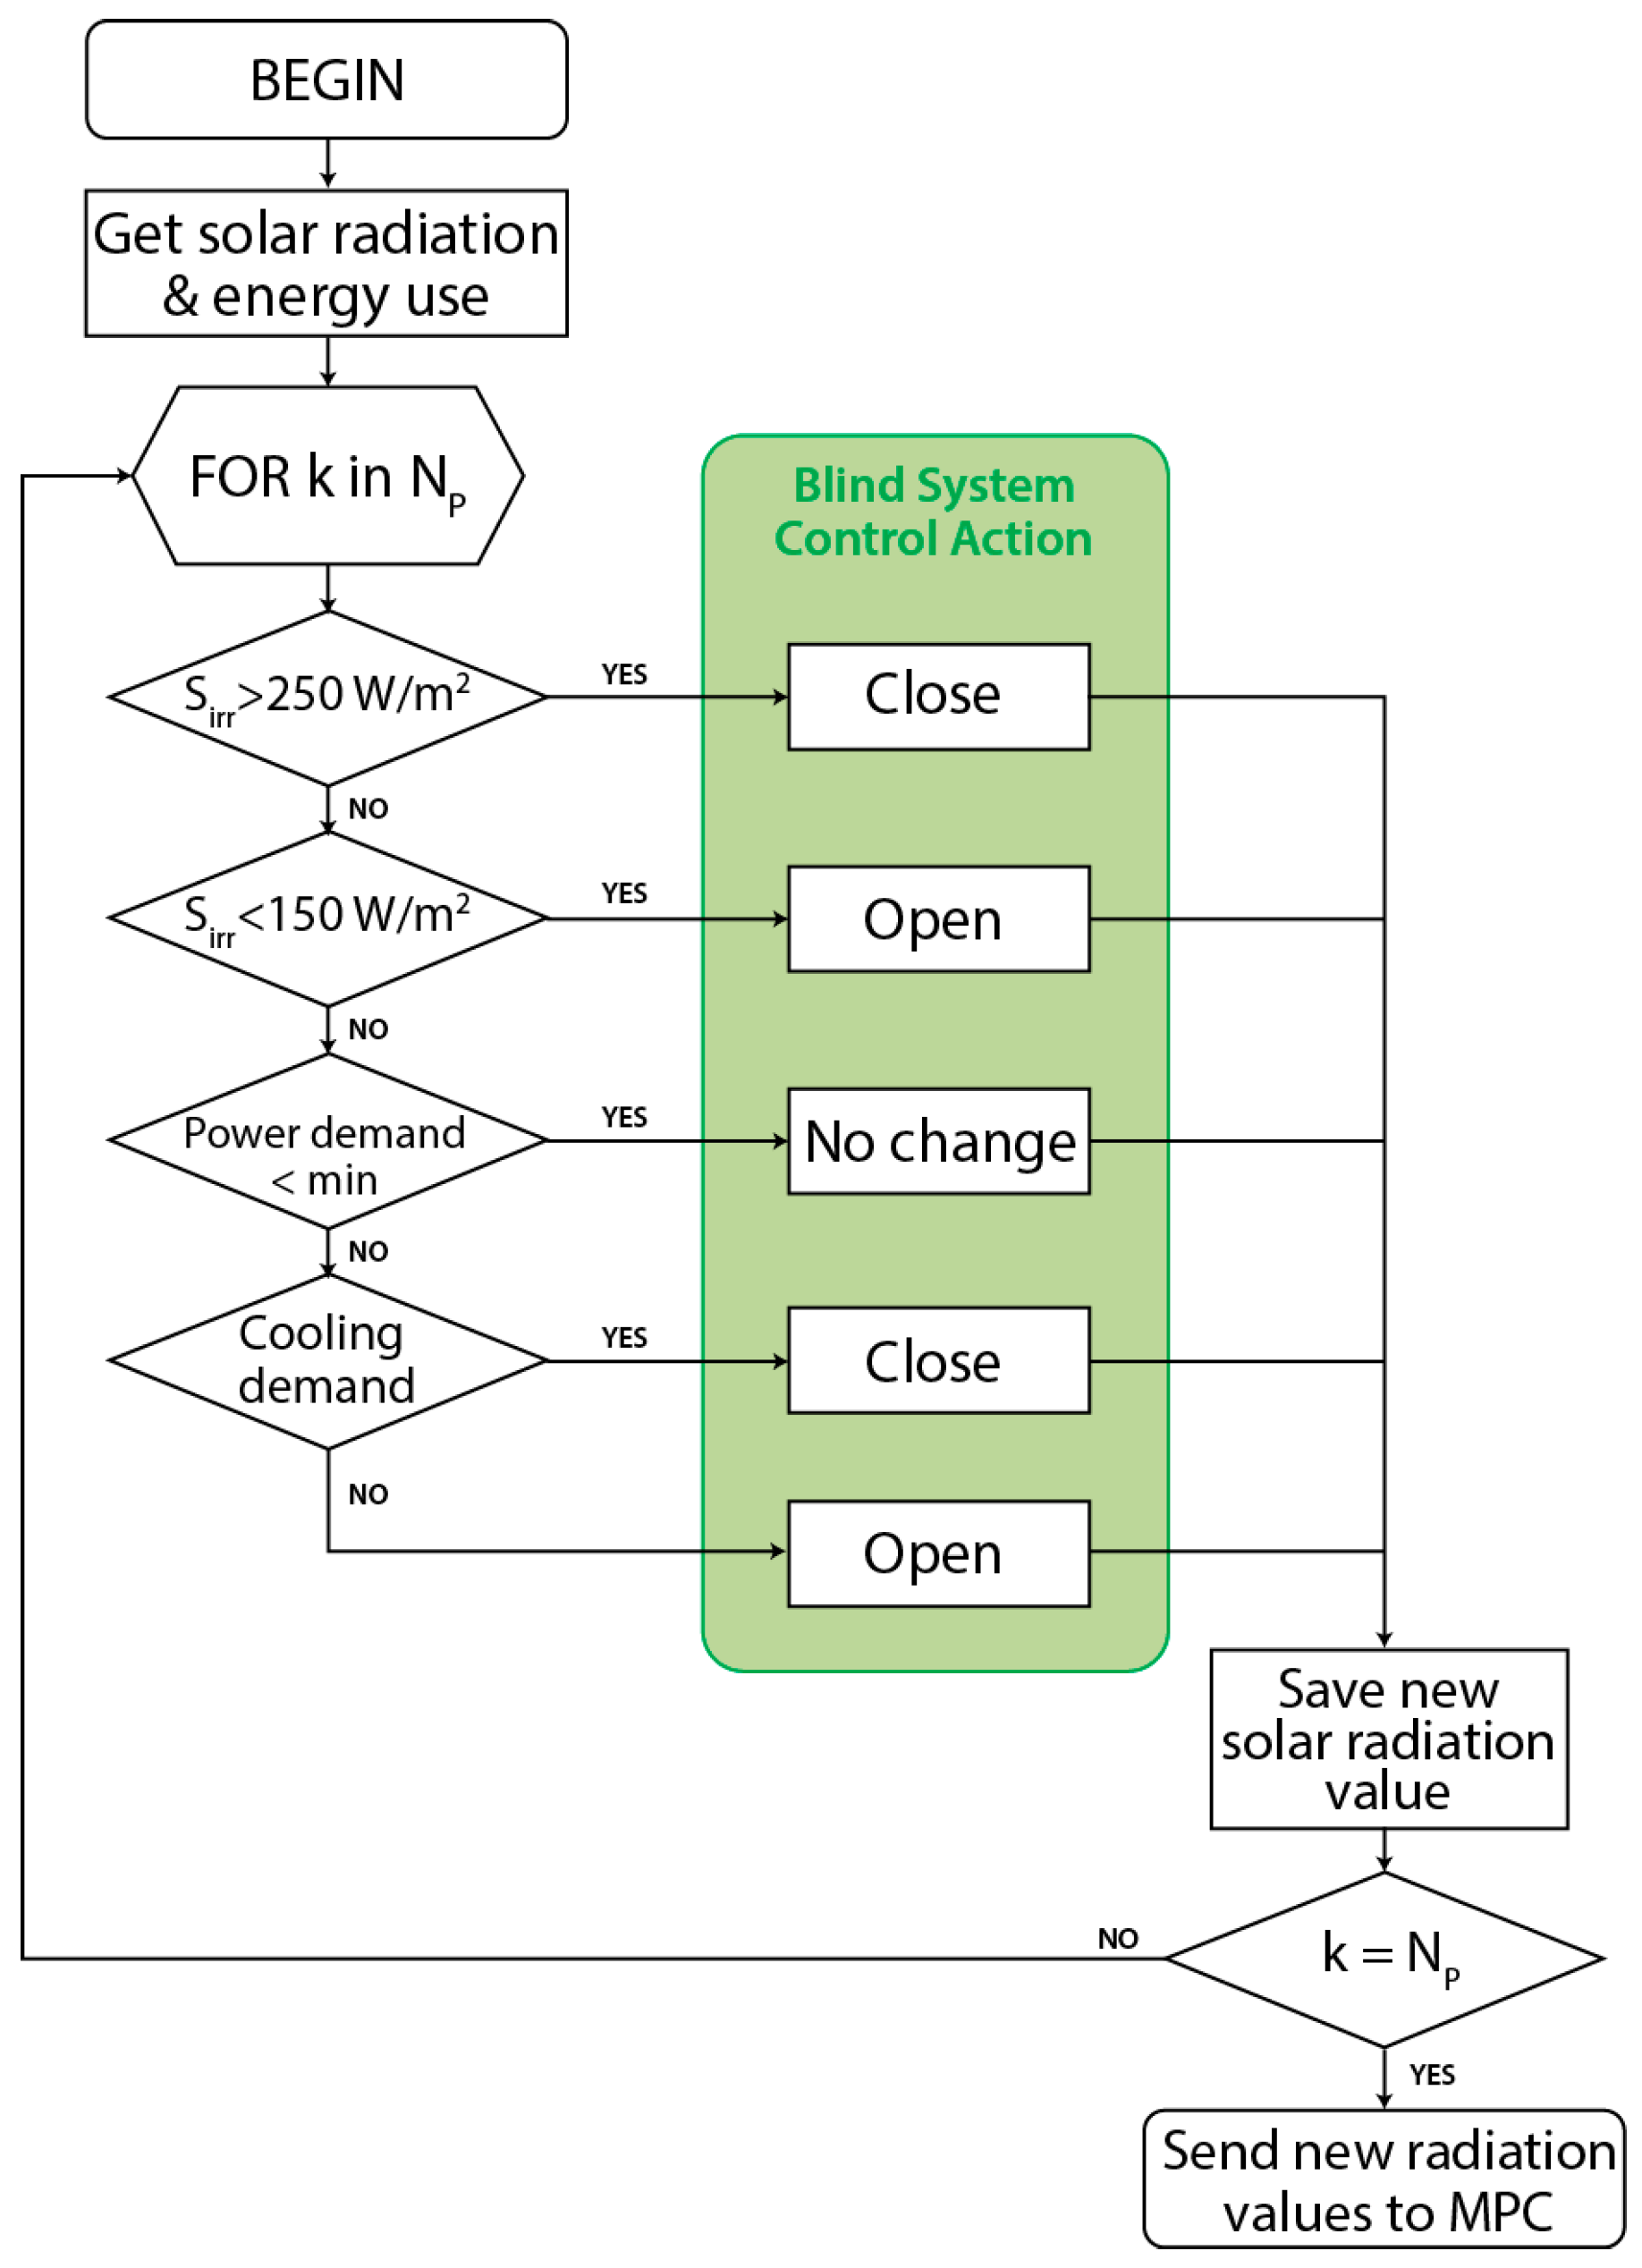
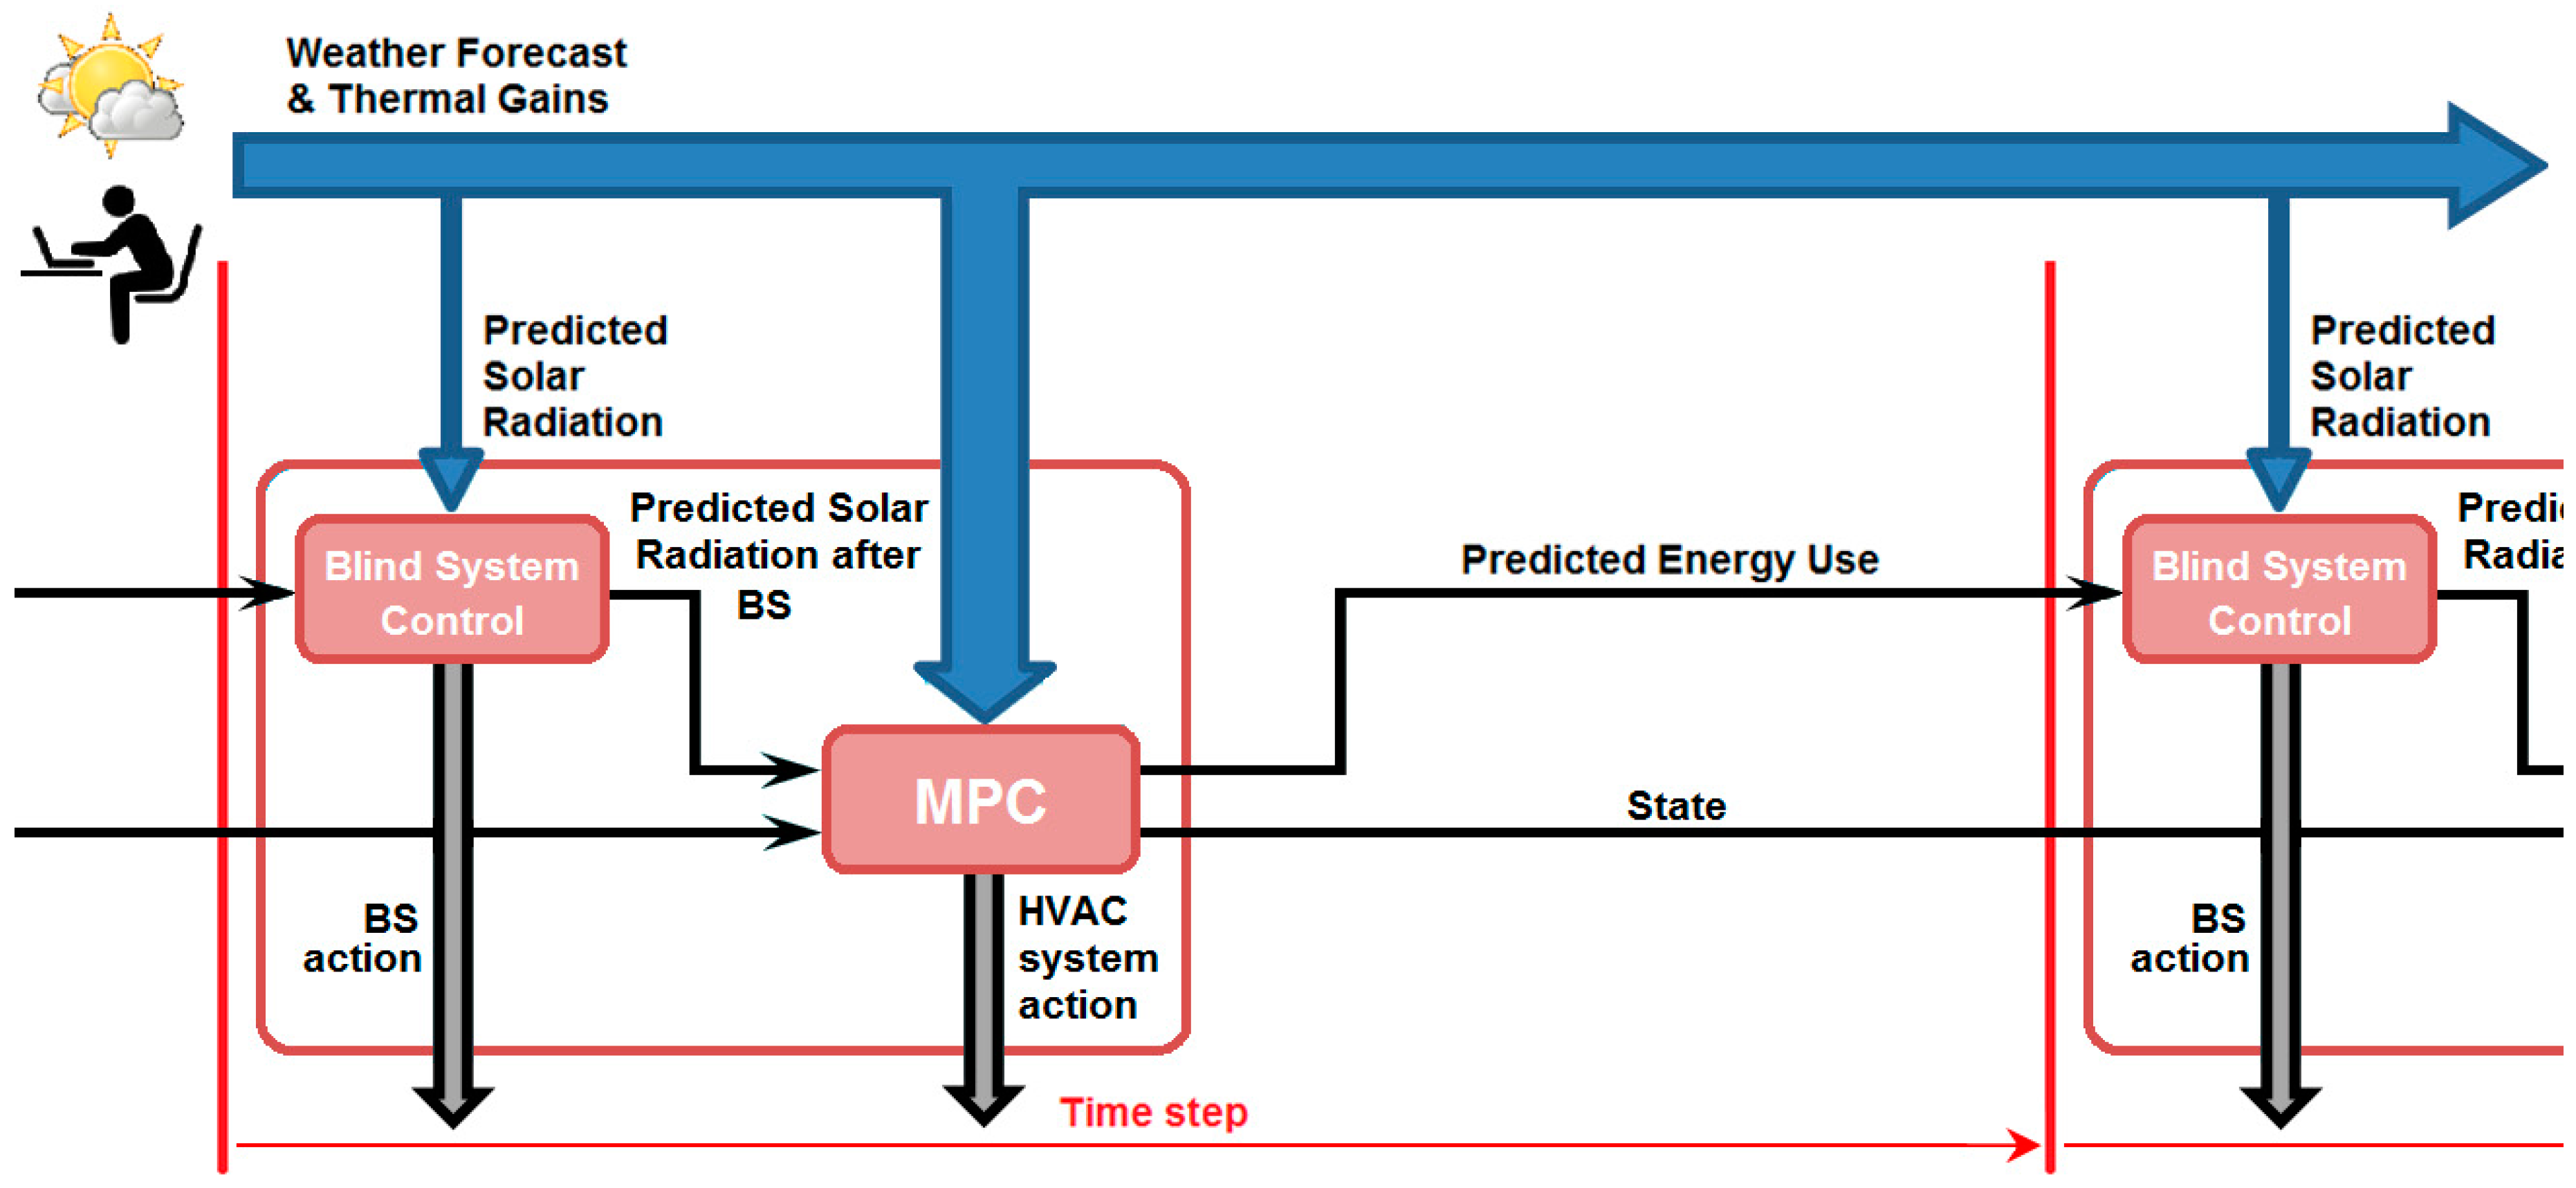
As novel scientific contribution, this paper proposes the use of a simple but improved blind system control (BSC), decoupled from the MPC, that enhances the energy savings of the HVAC system regulating the solar radiation through the windows. This paper studies the energetic behaviour of an office module under the influence of the weather conditions of a typical Belgian meteorological year in Ukkel, Brussels region according to TMY3 data. An MPC controls the main action of the HVAC system to maintain thermal comfort conditions. The noticeable influence that solar radiation has on the comfort parameters motivates the detachment of the windows’ BS from the main MPC. The study proposes an enhanced control that couples the benefits of the predictive information with the simplicity associated to a BS-dedicated control.
The rest of this paper is organized as follows: the paper describes the elements of the office module used for the study in
Section 2. Then,
Section 3 characterizes the model of the module and the control schemes used for the HVAC system and the novel BS. It also describes the conditions of the study performed. The results will show the benefits of the proposed BSC in
Section 4. Finally, the authors will present their conclusions based on the obtained results.
2. Study of the System: Building, Office Zones and Climate System
The design of the proposed office block allows creating a module that once modelled will represent the thermal behaviour of the building using a simple, repetitive structure. The building is north-south oriented and the module is composed of three spaces, two office zones and a corridor for separation and access. Each office zone is 12 m
2 and the corridor section is 4.32 m
2 leading to the total heated volume 96.3 m
3.
Figure 1 shows a scheme of the module with a representation of the HVAC system and disturbances that affect it.
The model considers the walls between modules to be adiabatic. This follows from the assumption that the temperature of adjacent modules remains the same and the heat flux between them can be neglected. The thermal capacity of the indoor volumes, office zones and corridor, is the combination of the thermal capacity values of the air, the furniture and one of the separating walls. TABS in north and south office zones and air-handling unit (AHU) in office zones and corridor compose the HVAC system. Three main disturbances affect the system: outdoor temperature, solar radiation and internal thermal gains. Outdoor temperature and solar radiation values, as already mentioned, are obtained from a typical meteorological year in Ukkel.
The module model was designed using the IDEAS library (OpenIDEAS Modelica model environment for Integrated District Energy Assessment Simulations (IDEAS), source code available on GitHub (
https://github.com/open-ideas/IDEAS)) [
37] for Modelica [
38], which allows the creation of the model specifying the construction materials, the heating systems action and the disturbances in the module in a similar way as TRNSYS (Thermal Energy System Specialists, LLC, Madison, WI, USA) or EnergyPlus (U.S. Department of Energy, Washington, DC, USA). This kind of representation allows the design of model dynamics close to the real behaviour.
Table 1 shows a summary of the characteristic values of the façade of the module used in the model design. Used materials can be said to be considered of high quality.
Table 2 presents the characteristics of the module. These values were defined in [
33].
Table 3 describes the internal gains associated to the activity in a standard office and other internal gains. These values are described in ASHRAE Fundamentals [
39] for an occupancy of one person/10 m
2 [
40], being one of the three disturbances that actuates in the office model. Other operative parameters are also represented. Office hours are considered from 08:00 to 18:00; rest of the time the office is considered unoccupied. In order to describe the internal gains derived from the office use, people occupancy and office appliance use are considered to be from 08:00 to 12:00 and from 13:00 to 18:00. If during office hours no people are present, ventilation and infiltration losses are not compensated by internal heat gains and as a consequence the indoor temperature decreases, as discussed by Reynders [
41].
The core purpose of this research is the control of the BS for the windows of the office zones. The main MPC does not integrate this control so as to favour modularity and simplicity of the system. The BS has a hole pattern, which allows all solar radiation to pass when it is open and only 25% when it is closed.
Figure 2 shows a representation of this effect.
The windows are three-layer glass with a global g-value of 0.36, as mentioned in
Table 1. The design of the building HVAC system provides the module with two different climate systems:
Thermally Activated Building System (TABS) is the main option for heating and cooling operations in the building. In order to take advantage of the thermal inertia of the building structure, water pipes are embedded in the concrete, which stores and provides the energy for climate control to the office zones via convection and radiation. Considering the typical heat pump and direct cooling configurations, Sourbron defines in [
33] the maximum heating values between 79 and 86 W/m
2 for heating and between 42 and 65 W/m
2 for cooling. The model supposes a power of 50 W/m
2 for both heating and cooling, which provides 600 W power for one office zone. The MPC prioritizes its use by minimizing energy use.
An auxiliary Air–Handling Unit (AHU), necessary for ventilation and air conditioning, fulfils additional power request. The system adjusts the indoor temperature when the TABS is not able to provide enough heating or cooling power or its response is not quick enough to maintain the comfort conditions. The AHU can contribute with an additional 850 W for heating and cooling in each office zone and 360 W in the corridor.
By simulating the dynamic behaviour of the system under the effect of TABS only for a constant outside temperature and no solar radiation nor internal gains it is possible to calculate the time constant (
) of the TABS in the office zones. Using the expression:
where
is the temperature at stationary state and
is the temperature at the beginning of the simulation, The value obtained for
is about six days.
5. Conclusions
The climatization of office buildings represents an important fraction of the total energy use in our society. Besides conditioning the indoor air quality, the system must provide thermal comfort to the users. The use of an MPC gives rise to energy savings of about 15% with respect to traditional control policies.
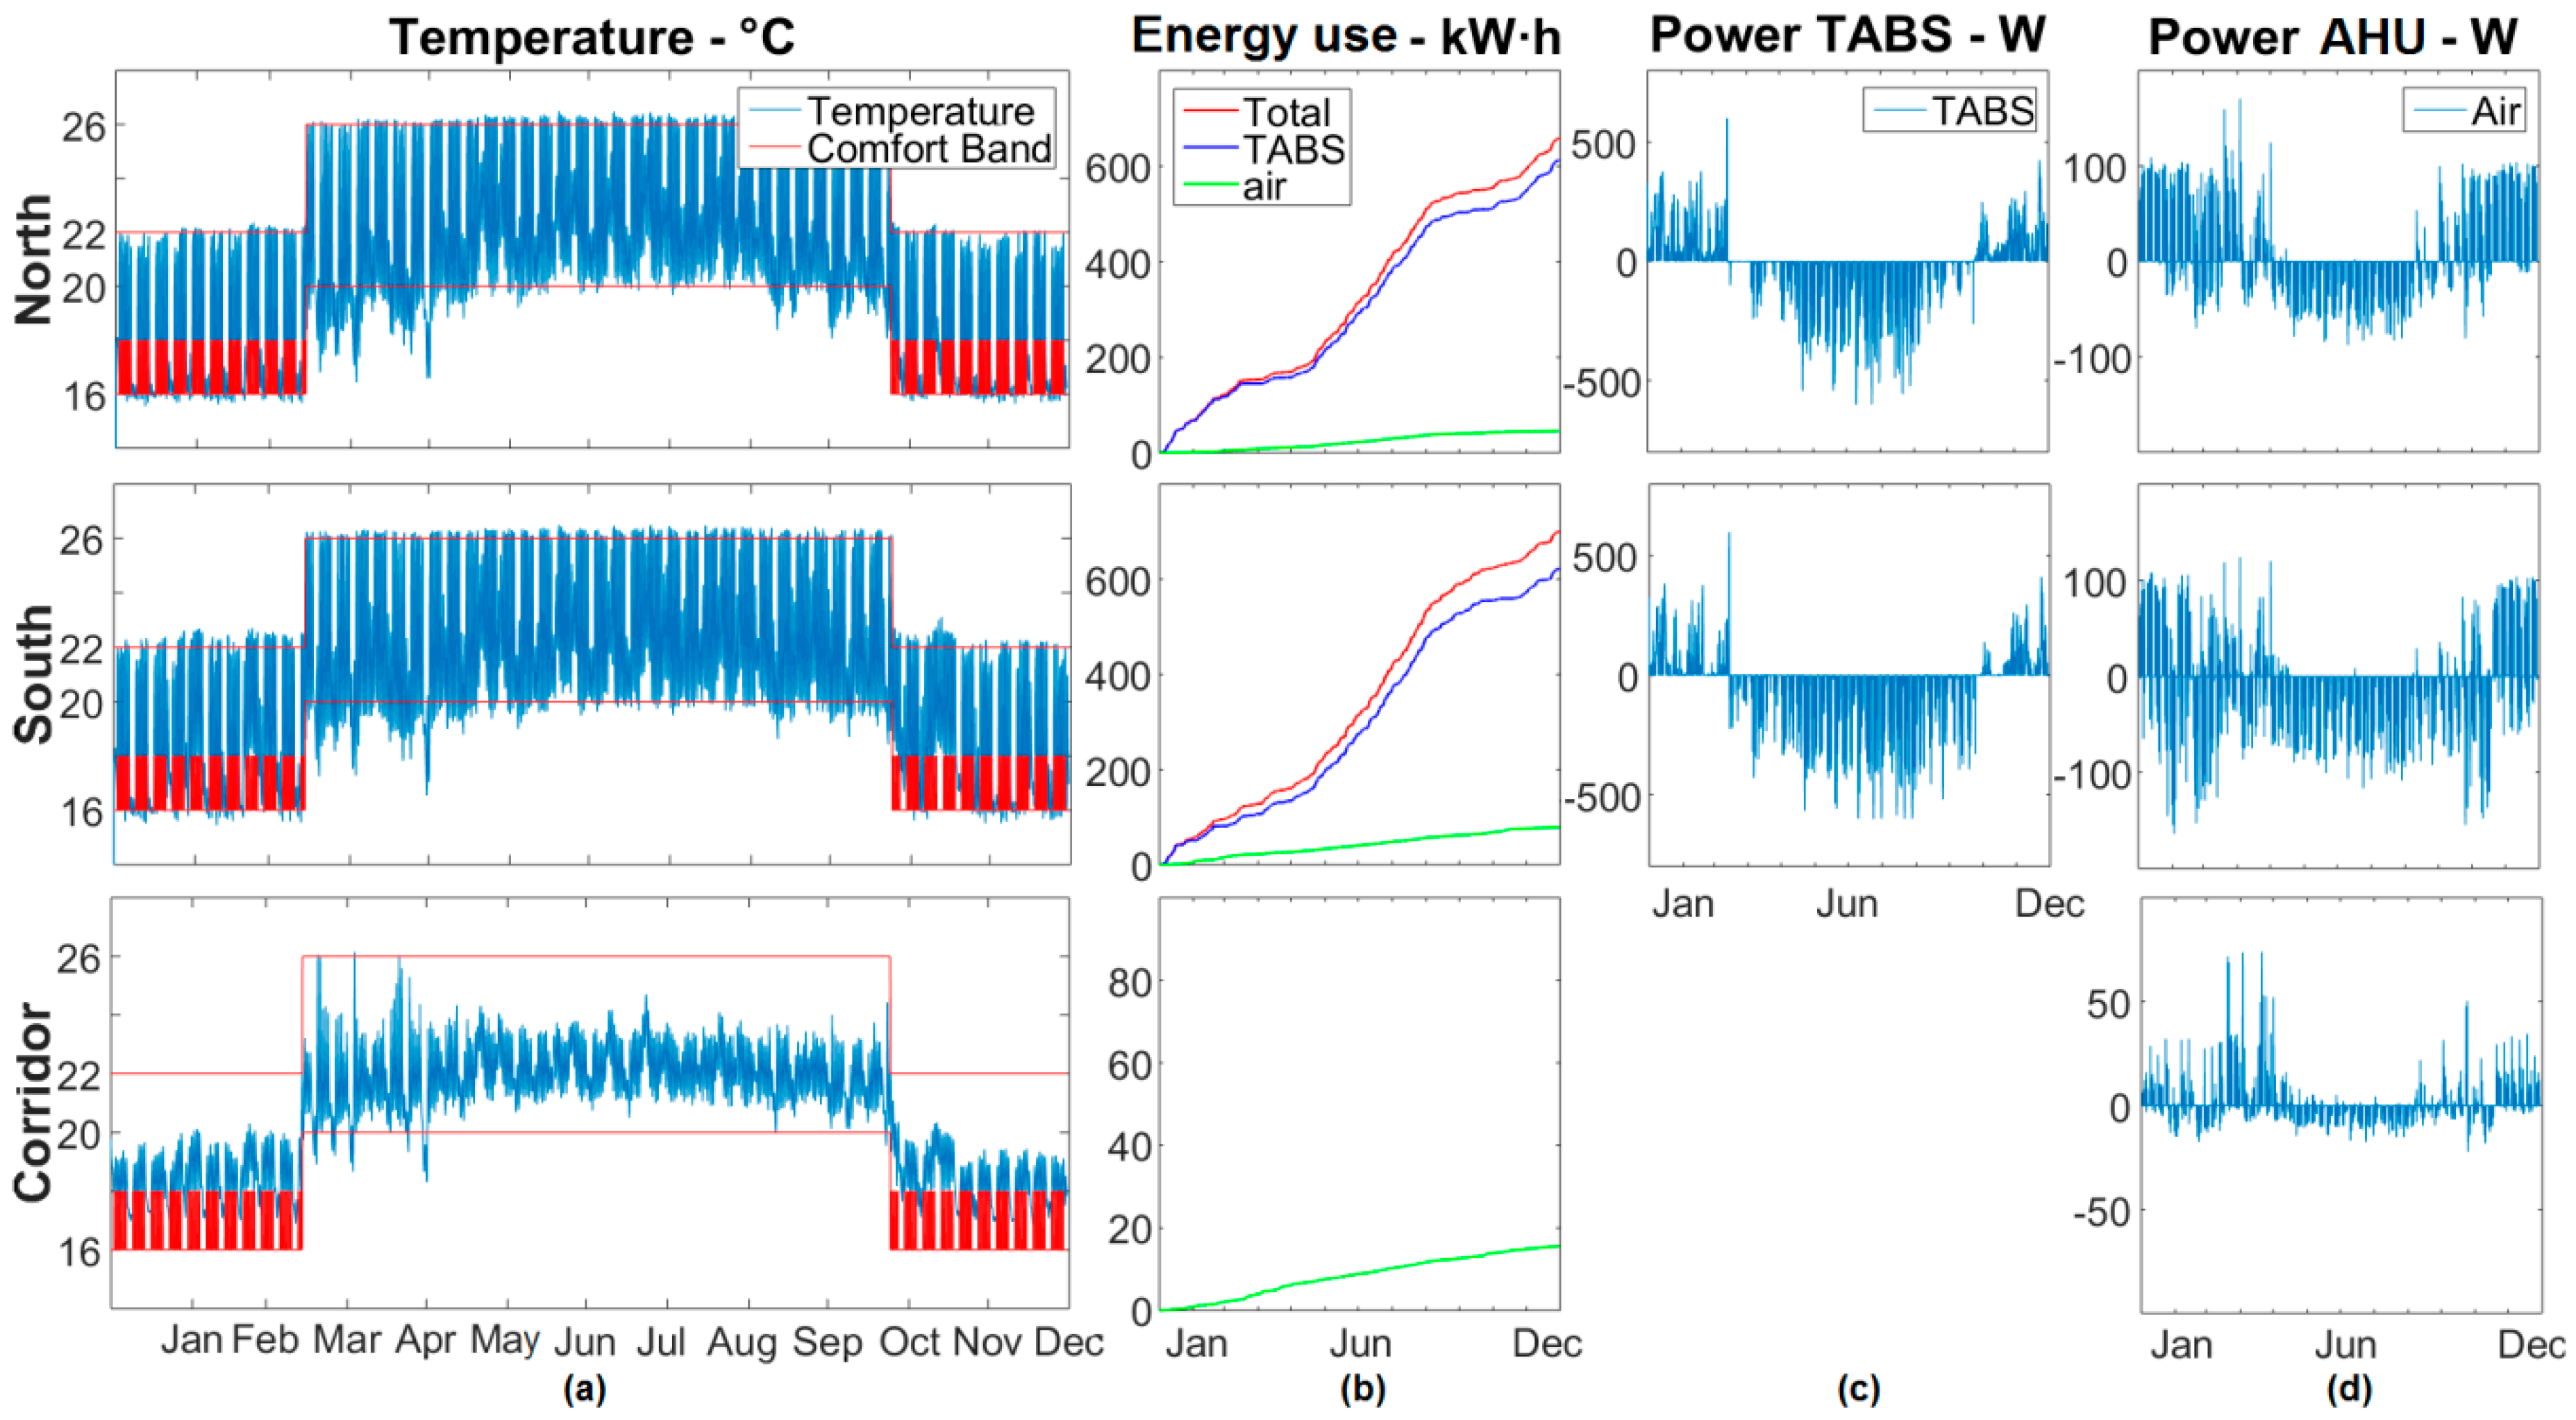
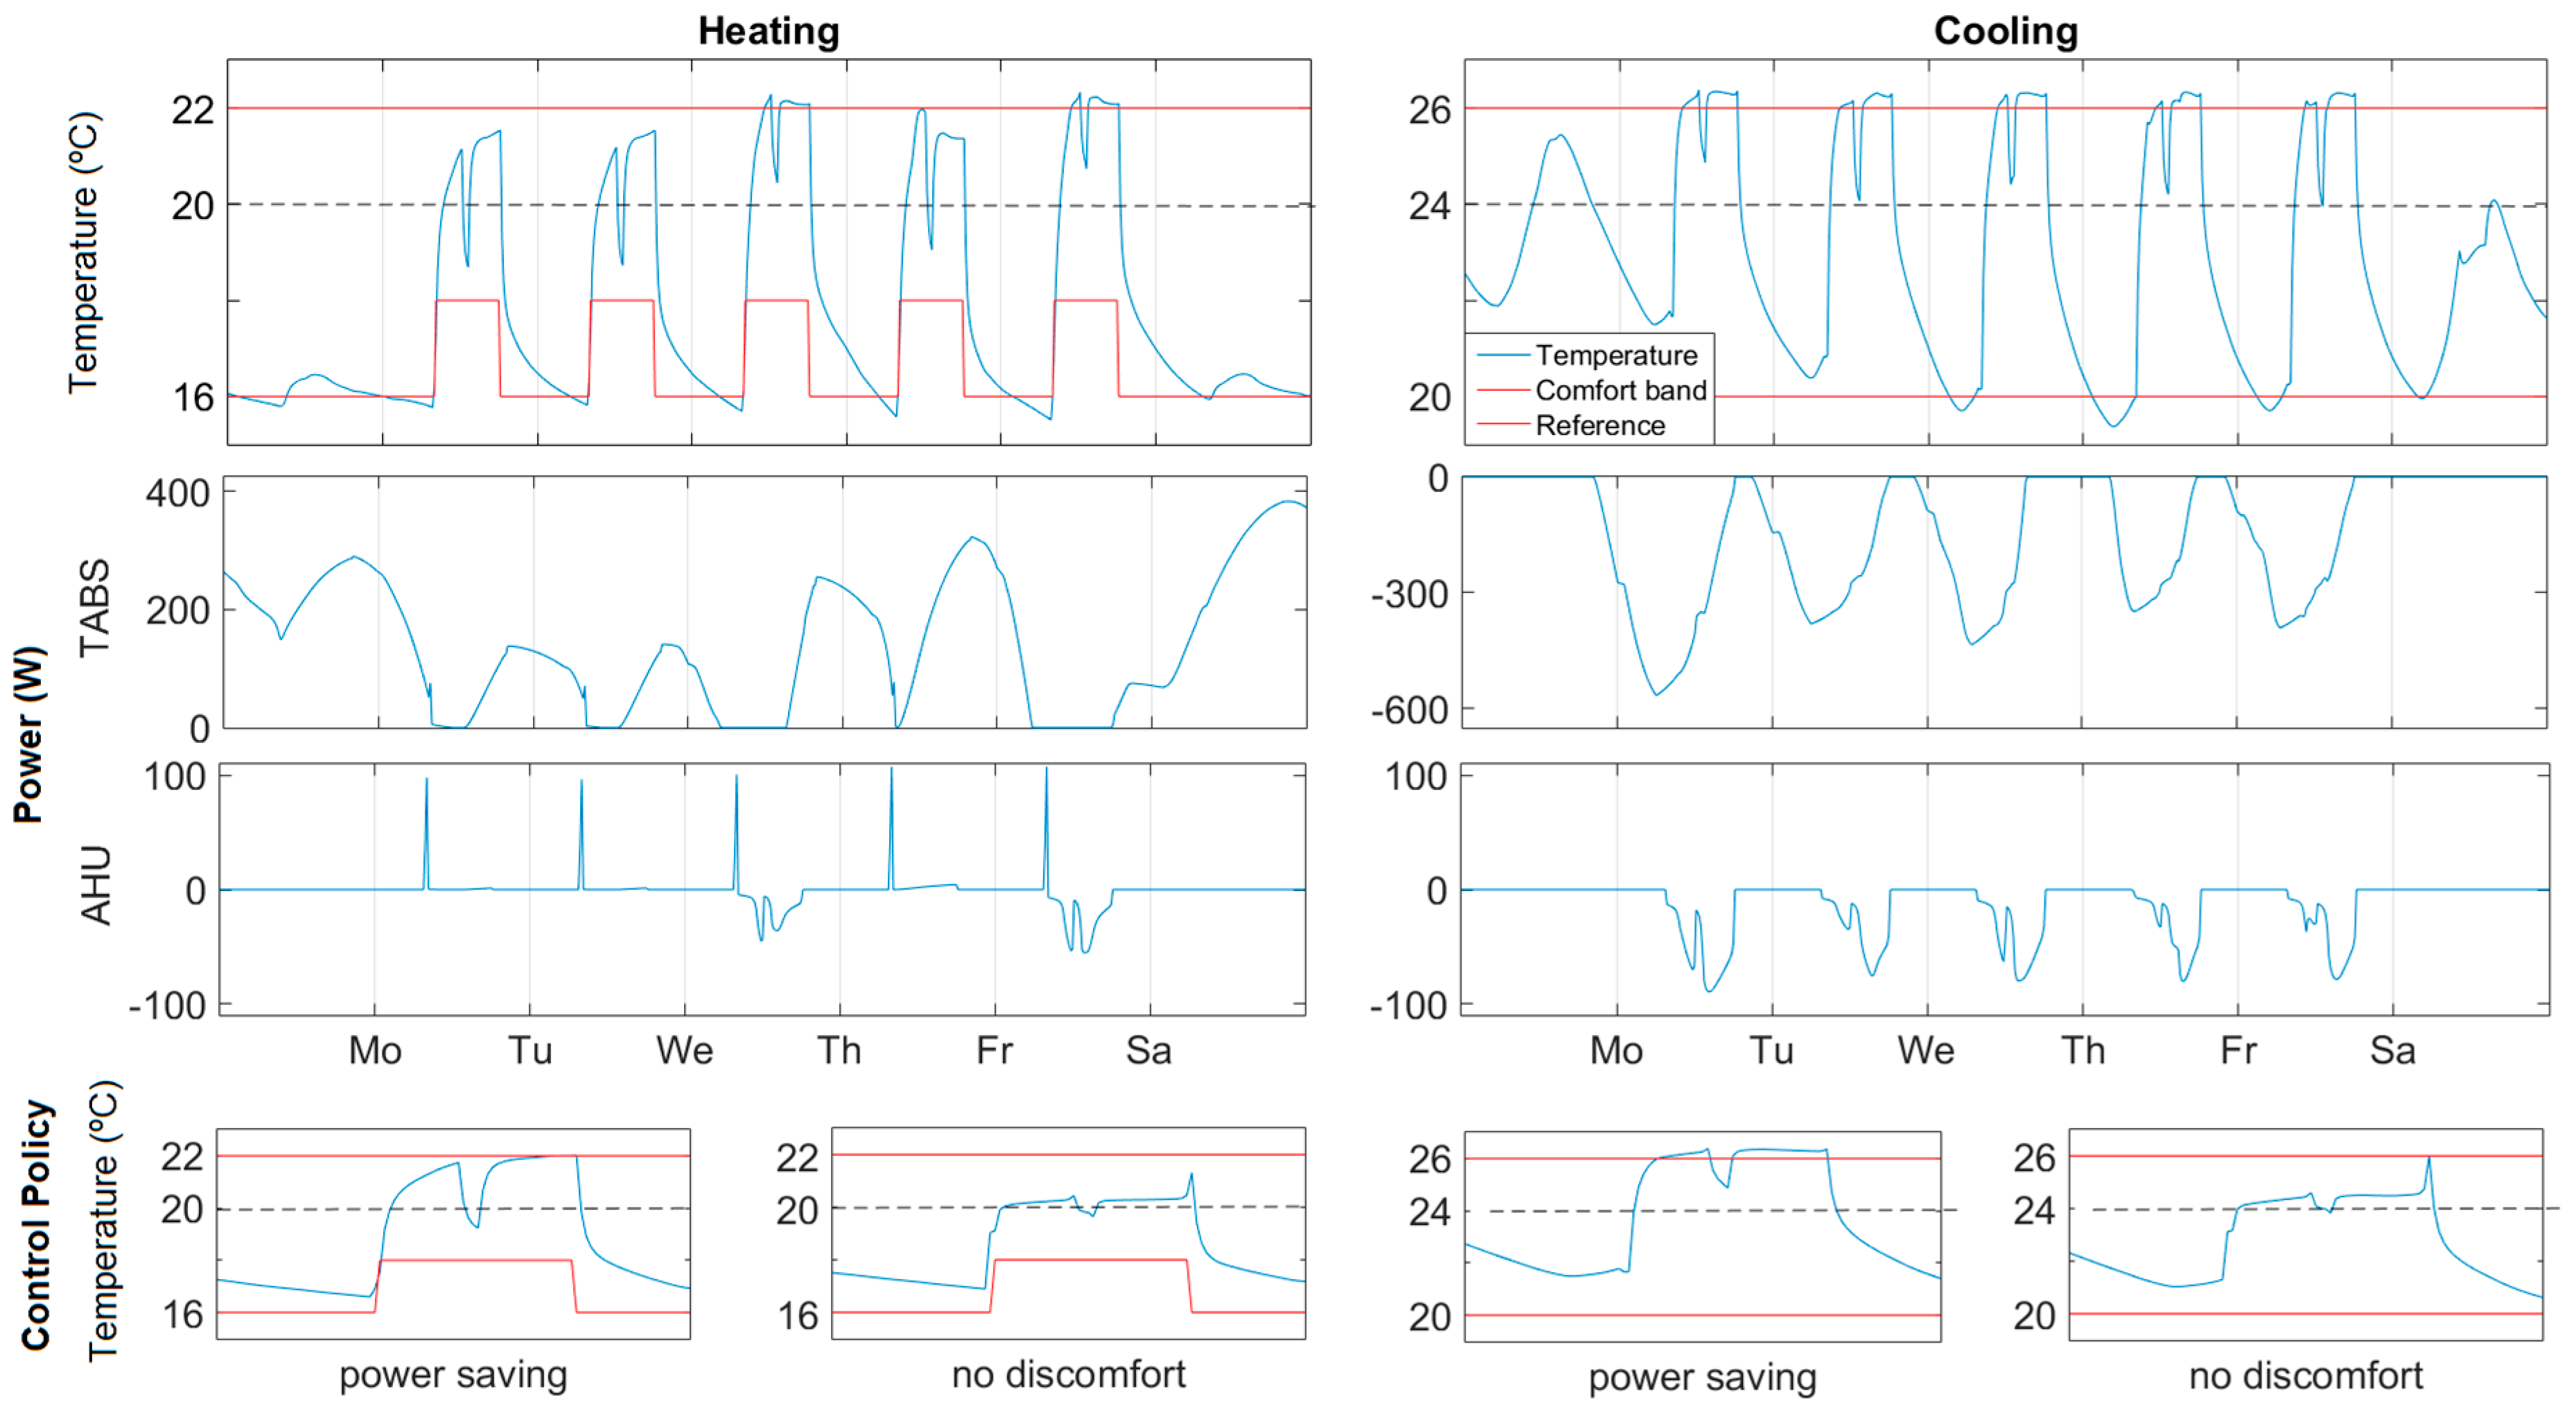
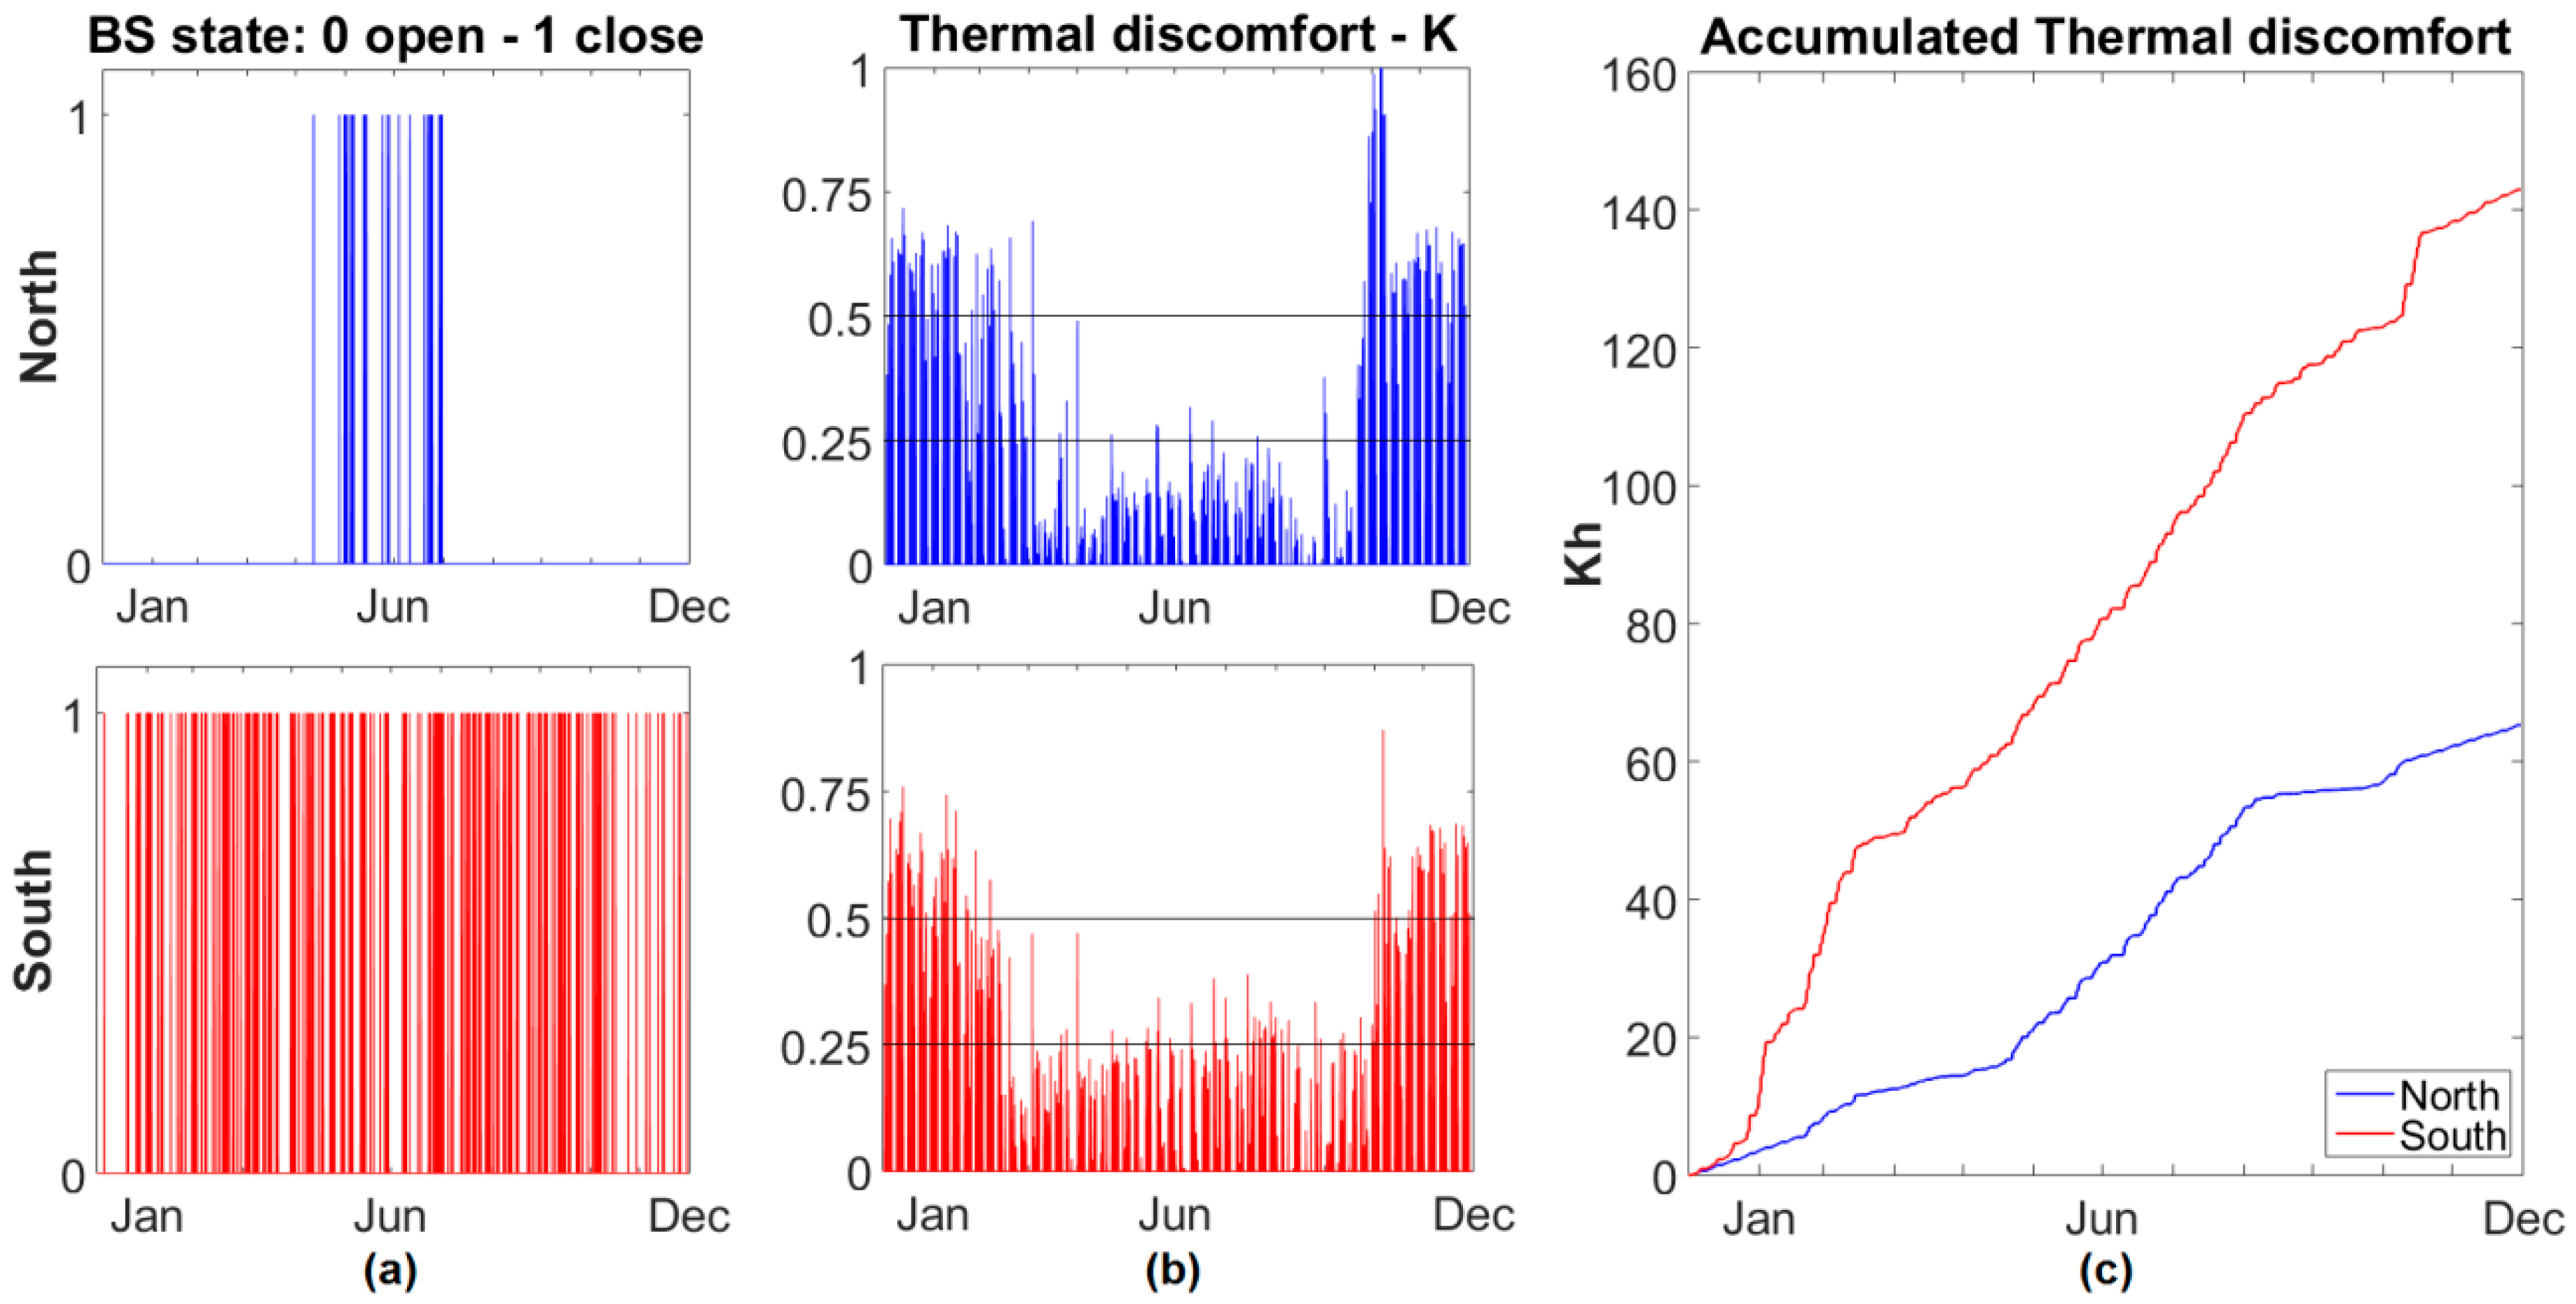
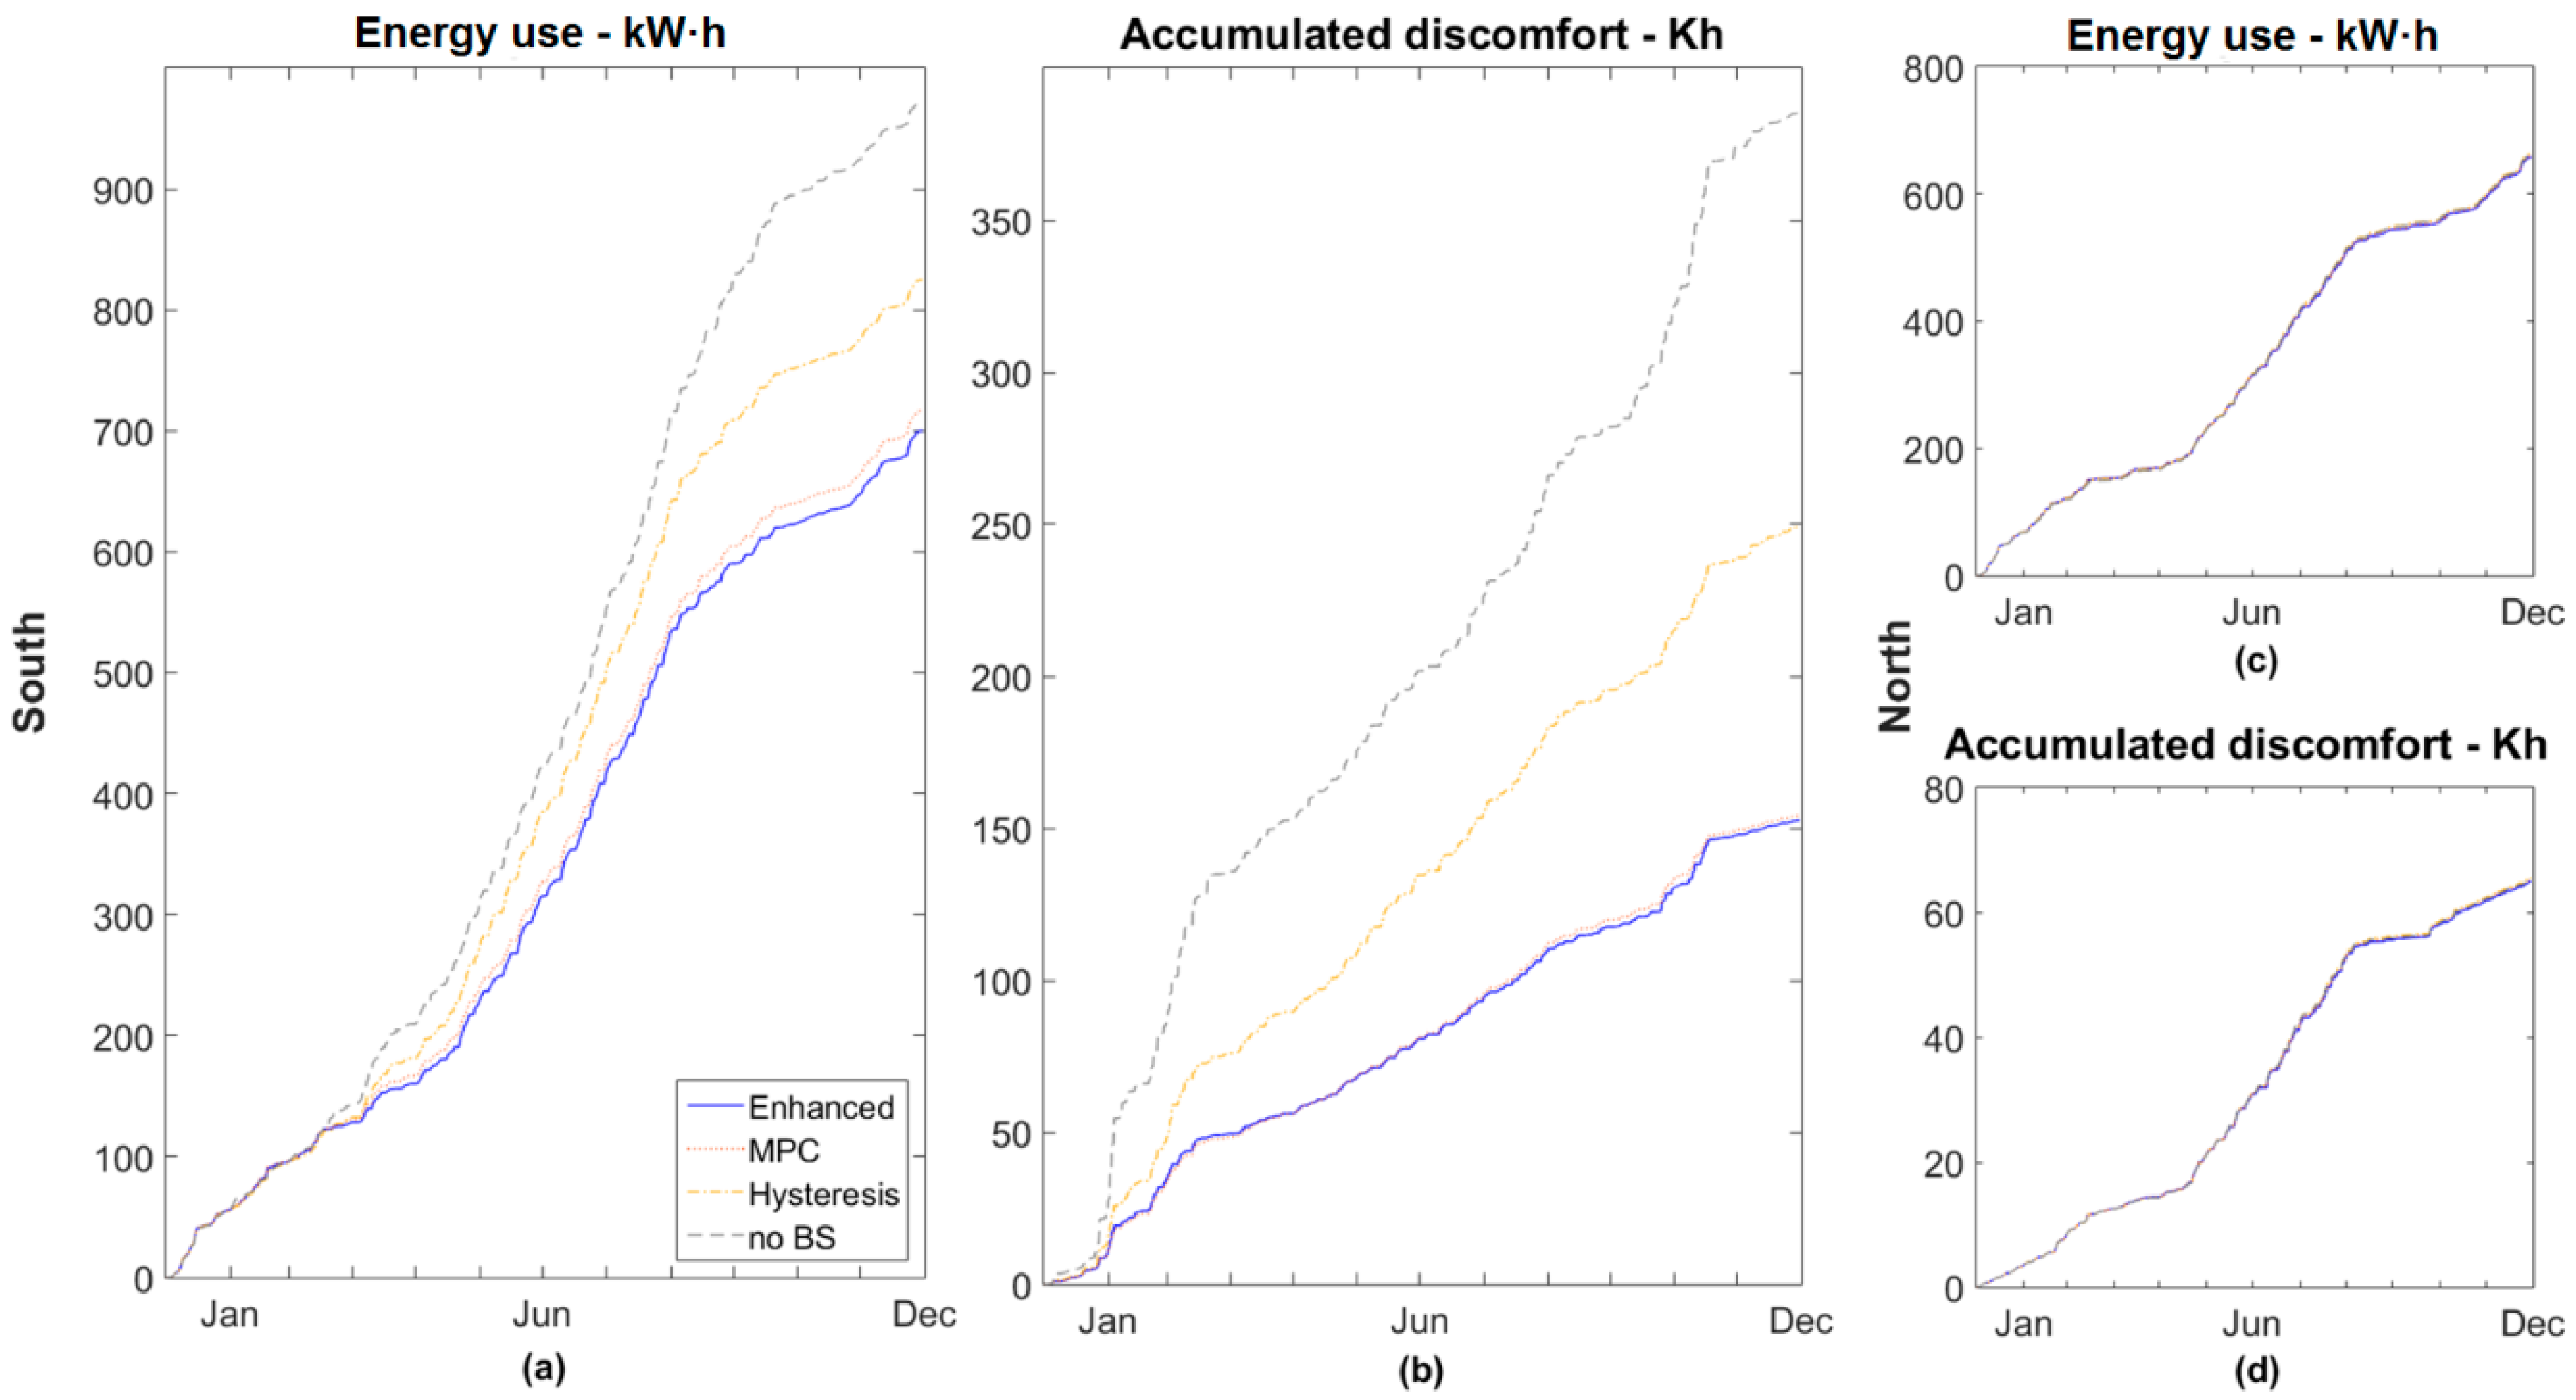
The power dissipation of electronic devices in present-day offices provides heat gains, which together with human activity and solar radiation introduces heat sources that will significantly increase the temperature in the office zones. Although all these energy sources, considered in the HVAC control, reduce the heat power consumption during winter, they substantially increase the cooling needs in summer. This study investigates an office module, designed with high quality building materials and a solar BS, allowing decreasing the total use of energy of an MPC controlled HVAC system by simulations. The simulations for a novel enhanced BS algorithm decoupled from the MPC, but considering its predicted energy use values, provide a potential energy use reduction for the HVAC system of 15% in comparison with a usually proposed hysteresis control. The evaluation of the predicted energy need provides a good indicator to determine the state of the BS.
The proposed control shows similar results for energy use and thermal comfort to an MPC that integrates the BS under similar conditions, which in some of its variants has been successfully studied. Therefore, the obtained results can be considered significant. The use of a decoupled control reduces computational requirements in the MPC minimization; meanwhile On-Off BS hardware is potentially simpler than multistate one.
Unlike the outside temperature or the heat gains associated with occupancy, the strong effect of solar radiation on thermal comfort, mostly in summer, can be counteracted. The development of an appropriate BSC provides an opportunity to significantly decrease the energy use, which justifies this study and the use of an advanced control strategy. The enhanced BSC also improves the distribution of the energy use over the two HVAC systems, TABS and AHU, which should entail a cost reduction by favouring the system with lower running costs.
The comparison among the different BSCs has been carried out considering perfectly known predictions for the disturbances. Deviations between the predicted and real values of solar radiation can introduce errors in the behaviour of the BSC. Therefore, once the control feasibility has been validated when comparing with other BSCs, future studies should contemplate the implementation under real conditions, taking into account on-line weather forecast predictions. In this case, a state estimation Kalman filter should be used to reduce the errors in the predictions. The study of the proposed BSC in other weather conditions or other qualities of the construction materials can also continue this research work.


 and
and 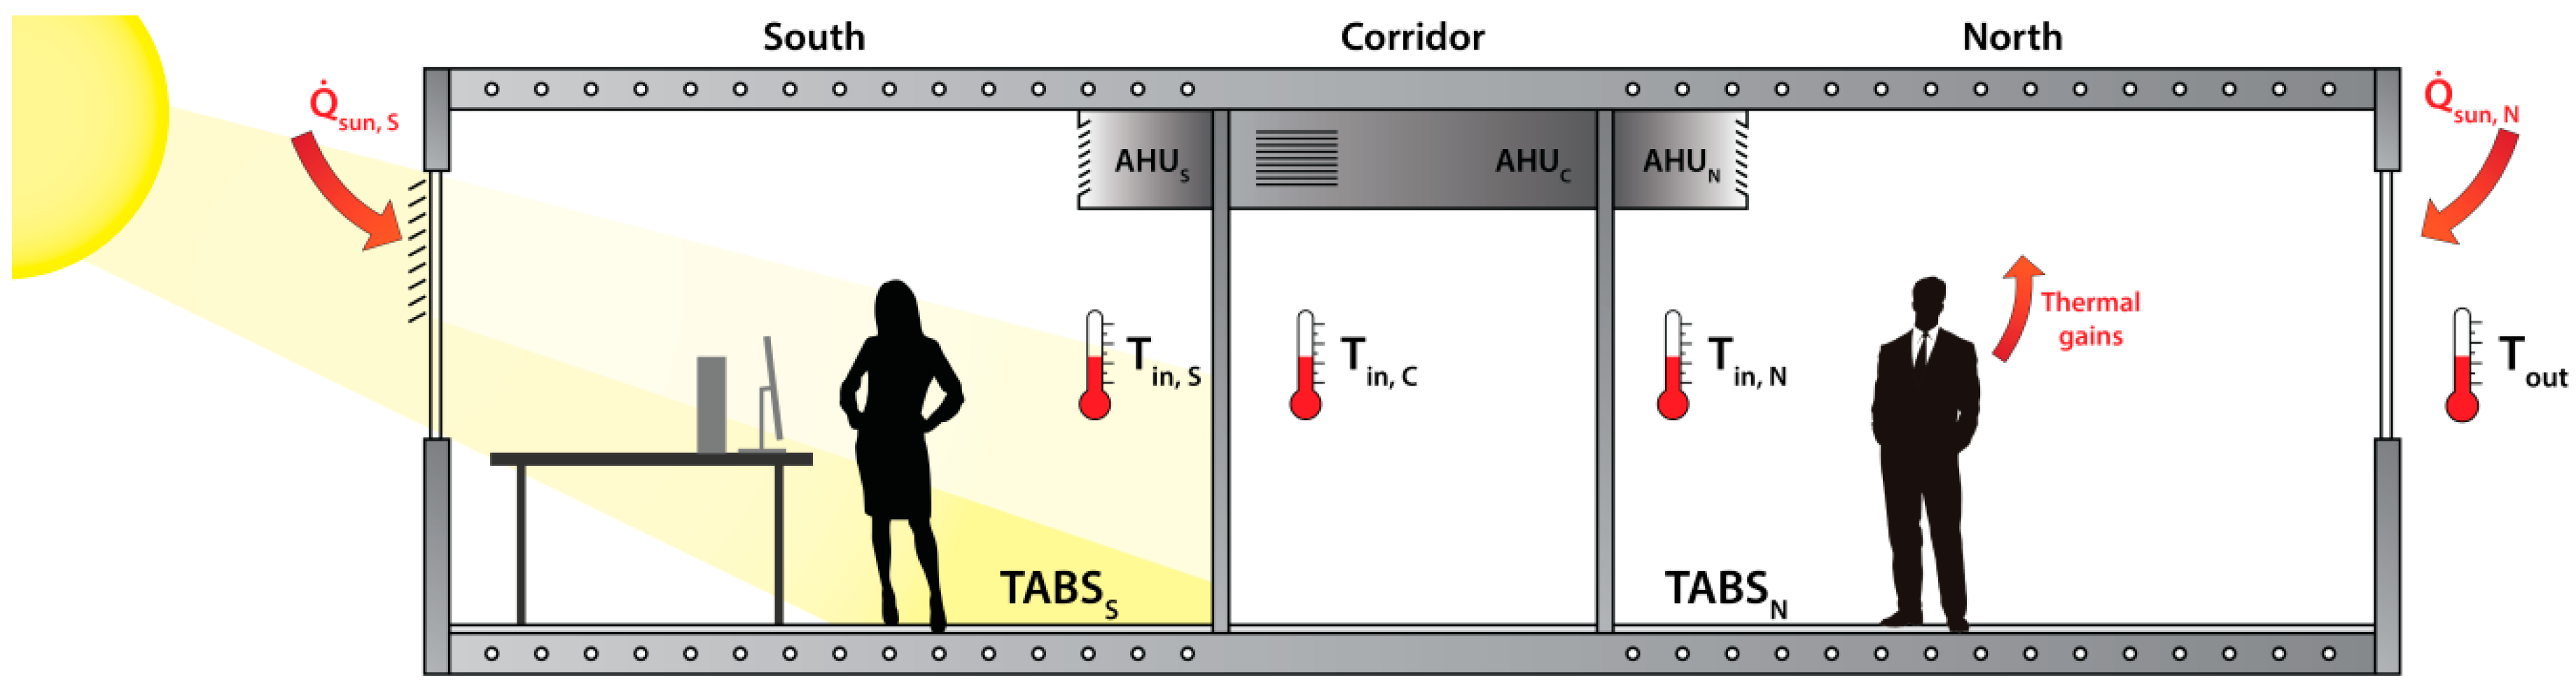


