1. Introduction
To achieve significant CO
2 emission reduction, energy networks will face great challenges in managing large-scale deployment of intermittent renewable generation, increased load from electrification of transportation and space heating. The amount of electricity generated must be constantly equal to the load demand, and the entire process must be well controlled and managed. Constant load balance is managed mainly through fossil-fuelled peaking power plants that respond passively to the load changes. Any imbalance beyond critical boundary conditions may lead to unstable operation and possible blackouts. To achieve significant CO
2 emission reduction, energy networks are facing great challenges in managing large-scale deployment of intermittent power generation from renewable sources [
1,
2]. Additionally, the total power generation capacity must meet the highest peak load demand, although the average load demand is much lower. That leads to excessive infrastructure investment, and consequently many power plants have to work at low load factors with low generation efficiencies [
3,
4]. Operating profiles of conventional power plants also significantly changed due to the increasing share of intermittent renewable generation [
5]. Former base load power plants have to follow rigorous dispatching scenarios, including fast ramp rates, possible low load levels and cycling operations involving overnight shutdowns [
6,
7,
8].
It is very challenging to achieve flexible operation for a conventional power plant with high energy conversion efficiency and fast dynamic responses at the same time. It becomes an urgent task to explore the strategy and technologies for achieving flexible and efficient thermal power plant operation. It is anticipated that the increased unit flexibility might be achieved by Thermal Energy Storage (TES) integration into the power plant process cycle [
9]. Excess thermal energy generated during low electrical load demand can be stored and reused during high load demand periods of time, when the electricity price is high [
10]. TES should also help to avoid overnight shutdowns by reducing minimum allowable load level operation. The heat energy released from storage during the discharging process can boost the power plant output and provide valuable overload capacity for frequency response. The TES energy buffer should also smooth power plant operation, increasing the lifetime of power plant components [
7].
Energy storage technologies as a key solution for the future secure power system operation have become a hot topic in recent years. Several review articles assessing the current state of the art technologies confirming high interest in this area have been published [
11,
12]. TES conceptual design has been already investigated in nuclear [
13], coal-fired power plants [
14], industrial waste heat recovery systems [
15] and also hybrid solutions [
16]. Whereas most of the solutions are conceptual only, currently, the most mature TES technology is applied to concentrated solar power (CSP) plants [
17,
18,
19], with well-known phase change material properties [
20]. In this article, TES integration into a conventional thermal plant is investigated in depth.
TES integration into a conventional coal-fired power plant has been already investigated by Pacific Northwest Laboratory (Richland, WA, USA) in 1990 [
21,
22]. This conceptual design and the cost estimations of TES integration revealed substantial improvement in the economic attractiveness of meeting peak and intermediate loads. A sensible heat storage concept with two storage tanks filled with nitrate salt (60% sodium, 40% potassium) has been selected. The generation of thermal energy and its conversion to electricity have been temporarily decoupled by the TES system, which requires substantial changes in the process cycle. The evaluation indicates that TES integration produces 5%–20% lower cost power than the conventional cycling plant, and this solution is also feasible for advanced coal combustion technologies, such as integrated gasification combined cycle (IGCC) [
23,
24].
Another simulation work has been conducted by Vandersickel et al. [
25]. A latent heat energy storage integration concept in a coal-fired power plant has been assessed for a commercially available heat transfer medium, like nitrates solar salt (NaNO
3-KNO
3), HITEC molten salt (NaNO
3-NaNO
2-KNO
3) and others. Several different charging and discharging scenarios have been assessed, indicating high (over 60%) coal-to-coal efficiency. This feasibility study has been verified using the power plant model implemented in the EBSILON Professional software package (STEAG Energy Services GmbH, Essen, Germany;
www.steag-energyservices.com) for the design and 40% load level condition. The concept also requires substantial investment costs, as higher feedwater pressure is required, and feedwater pumps have to be replaced.
There is also noticeable interest in TES integration in the industry. Peak Power Integrated Solution concept presented by Alstom Thermal Services (Alstom Power GmbH, Berlin, Germany) is one example, where a sensible TES system is linked to a low pressure preheating train in the conventional power plant process cycle [
26,
27]. Feedwater, as a storage medium, is preheated in parallel to the process loop during low load demand. The main advantage of this system is that the preheated feedwater can be discharged almost instantaneously allowing one to increase power plant ramp rates. The system also offers a 5%–10% overload capacity and a 5%–15% reduction of the minimum load. The disadvantages of this solution come from the low energy density and variable discharging temperature characterising all sensible TES systems.
All previously-presented solutions indicate high potential for successful TES system integration in the conventional power plant cycle. This task is complex and requires careful parameter assessment, especially for off-design conditions. The proposed solutions very often require substantial changes to the power plant process loop and hardware upgrades. An initial assessment has been also performed for a limited number of off-design conditions.
This paper reports the recent work in the feasibility study of the integration of TES with the plant water/steam cycle. Compared to the earlier published work in this area, this assessment brings the plant process steam/water parameters within the entire plants’ operational load level range, not only for just one/two off-design operational points previously reported. The feasibility study performed in this paper helps to find the most suitable locations for TES system integration for both the TES charging and discharging process. As many of the currently-operating conventional power plants might be equipped with a TES system, retrofitting is considered to avoid unnecessary redesign and additional costs. The proposed solution aims to bring the minimal influence to the power plant process loop without major changes in existing components and their alignment (hardware). Although no particular TES material is investigated, the result provides guidance for thermal engineers to exploit the full potential of TES integration, find suitable thermal materials and design TES systems: heat exchangers (HX), storage tanks, etc. The paper explores and presents a new route to avoid excessive investments in new peaking fossil fuel power plants that have very low load factors and to allow the power plants to operate closer to their rated power. Finally, the solution leads to a possible route of improving power generation efficiency, while it operates flexibly to response load changes.
In the first section of this paper, a subcritical power plant model is described, and the model performance is presented without the TES system. Then, the feasible integration strategies analysis is presented for the TES system charging and discharging processes. The simulation results from both processes are presented, which reveal the plant performance, boundary conditions and efficiency in the function of the plant load level. The best candidate location points for the integration of both processes are assessed. Furthermore, the steam/water parameters are given as a function of plant load level, which could help find the most suitable TES design and thermal material properties to get the highest possible efficiency of the system.
2. Power Plant Modelling and Simulation Platform
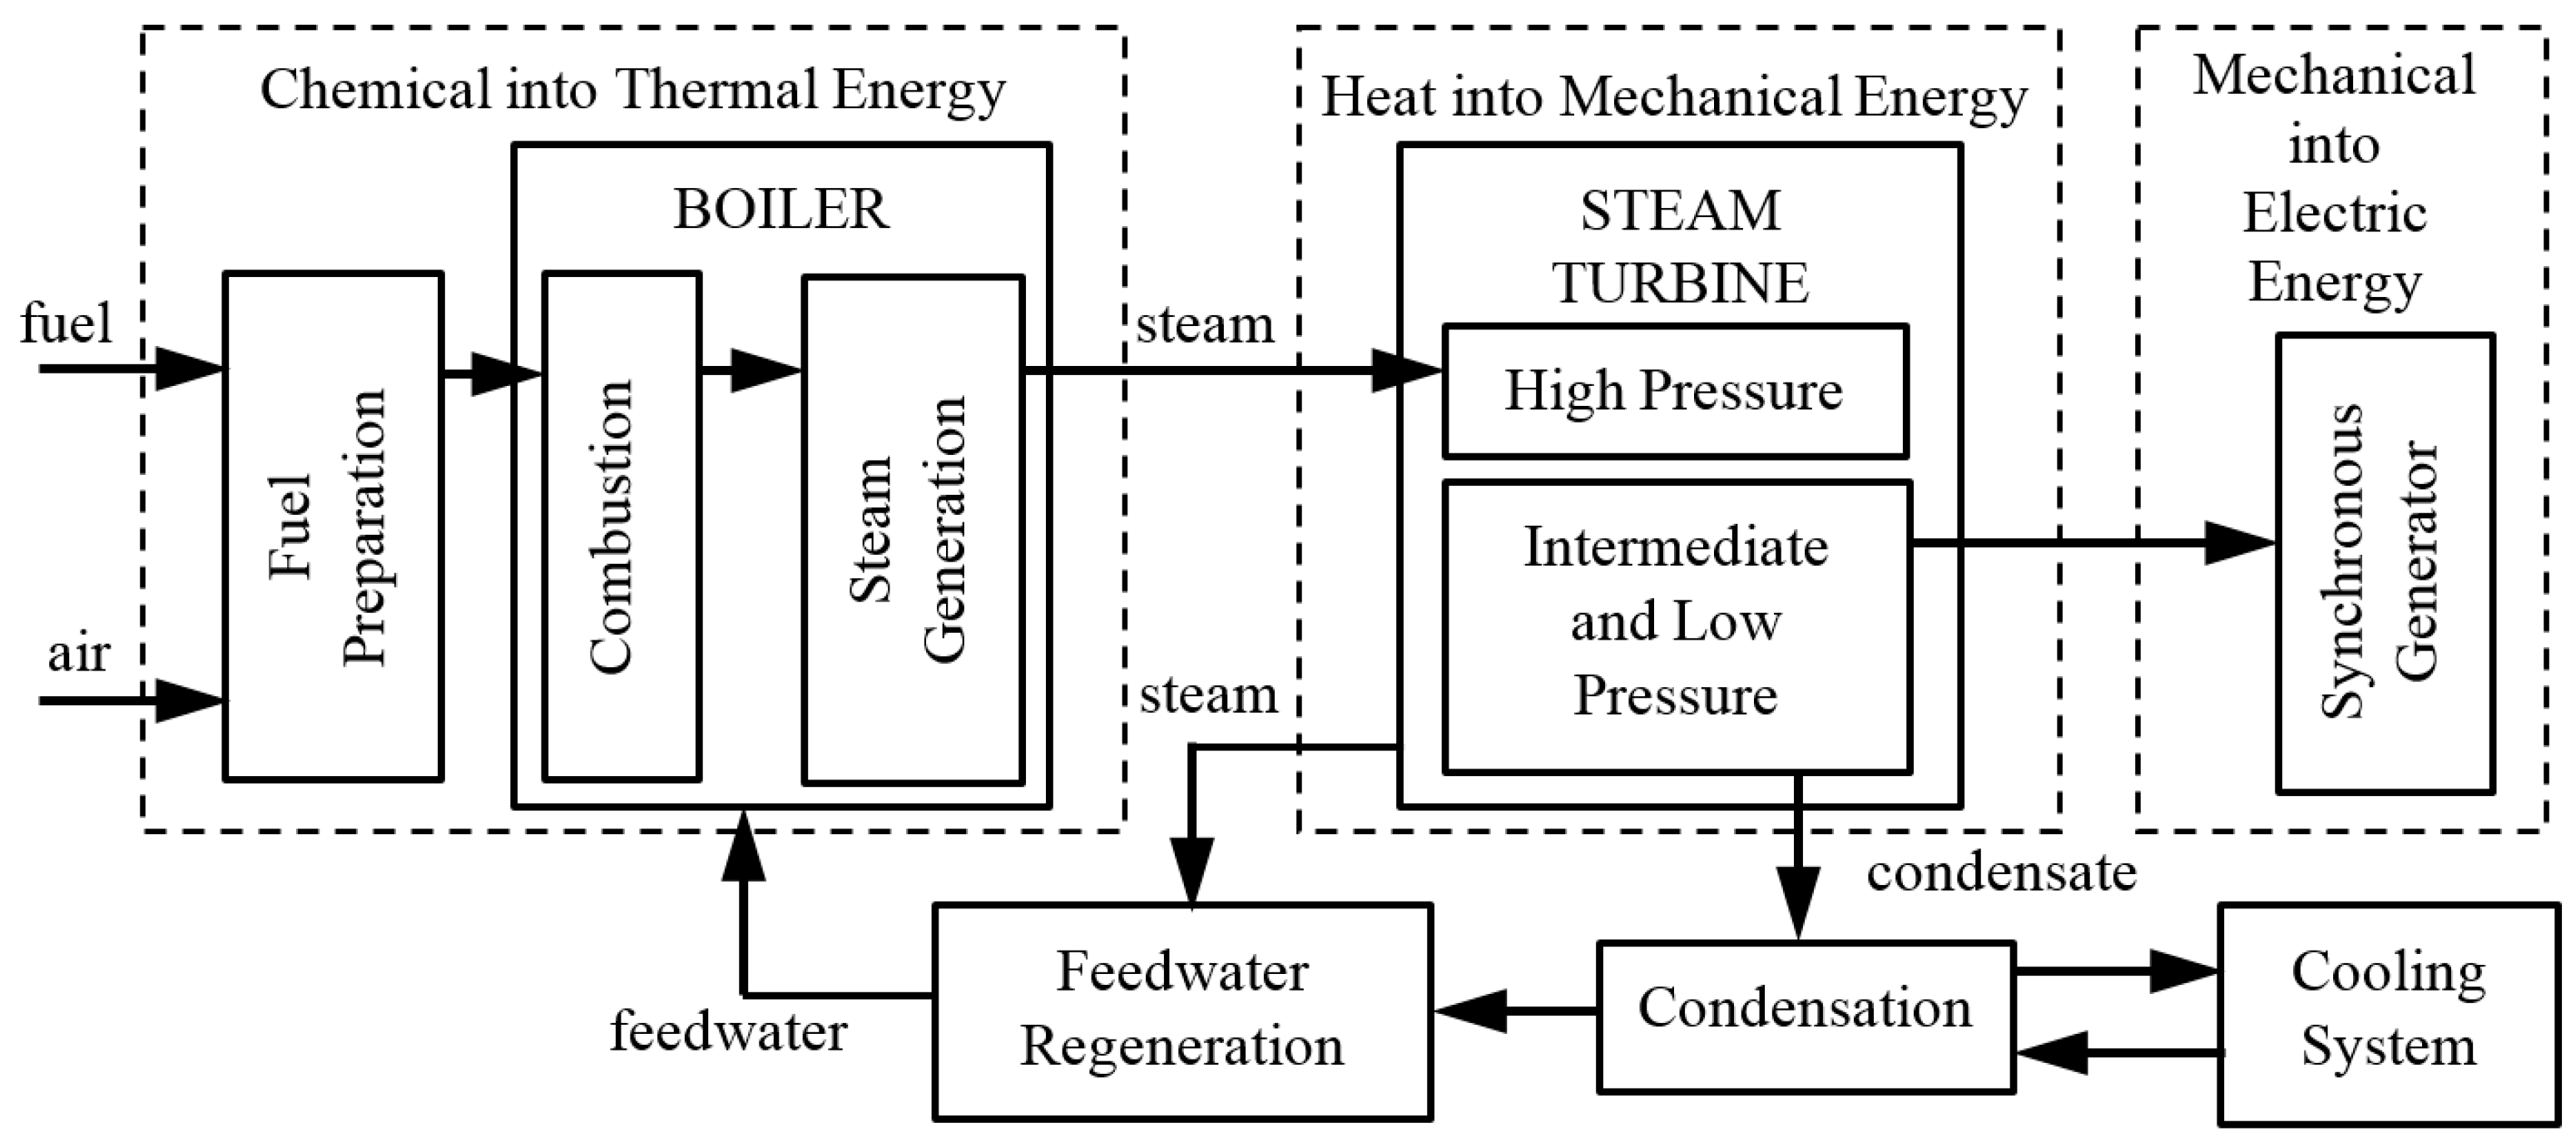
As it is almost impossible to implement any kind of heat extraction experiments without concrete pre-studies in a real power plant, mathematical modelling and simulation of the plant process cycle can be considered as the first step towards the real implementation. The mathematical model was developed for describing the major process of the transformation of the fuel chemical energy into thermal energy (heat), then thermal energy into mechanical (rotational) energy and, finally, electric energy [
28,
29,
30]. The structure of the system model realisation is illustrated in
Figure 1.
TES integration analysis requires a detailed power plant model implementation to accurately assess steam/water parameters in numerous points in the plant process loop [
31]. A broad number of modelling tools and platforms can be found for plant and power system operation simulations. Numerous simulation packages are available on the market, such as Aspen Plus and Aspen HYSYS (
www.aspentech.com), APROS (
www.apros.fi), Autodynamics (
www.simulationrsi.com), EBSILON Professional, gProms (
www.psenterprise.com), MATLAB/Simulink (
www.mathworks.com), MMS (
www.nhancetech.com), SIMODIS (SImulation MODeling Integrated System,
www.ieav.cta.br/efa/lev/projeto/simodis), PowerSim (Seoul, Korea) and ProTRAX (TRAX LLC Energy Solutions, Lynchburg, VA, USA). These packages have different functionality using pre-developed component libraries for modelling of coal, gas or combined cycle gas turbine (CCGT) units.
The ProTRAX Simulation System has been chosen as a simulation platform for power plant modelling work. This software package is a powerful tool allowing engineers who are already familiar with the equipment and the entire power plant process to effectively develop high fidelity models for both process and control system analysis. It is a modular structuring software at the component level, and an extensive library incorporated in the program allows one to interconnect modules into any physically-realistic configurations. Mathematical models of modules are based on first principles conservation relations, the second law of thermodynamics and relations for heat transfer and fluid mechanics. Mathematical equations describing the model behaviour are not represented generically by any comprehensive subroutine. For example, the most complex aspect of heat transfer modelling is based on a module-by-module basis, and the equations are tailored to the effect known to occur in an individual component. Therefore, it is necessary to study in detail each module description to accurately simulate the component [
32]. Many years of experience using the software can demonstrate the usability of the tool as a top class real-time simulator for power plant companies, as well as research institutions. The main advantage of using such a platform is to accurately simulate off-design conditions, which is highly important in the low load factor operation scenarios considered in this paper. For the feasibility study, a 375-MW subcritical oil-fired thermal power plant model has been developed and used in the ProTRAX v7.2 software environment. This case study was selected based on available documentation. The main parameters of the model are listed in
Table 1.
The power plant model consists of the steam-water loop, fuel-air-flue gas loop, the electrical system with synchronous generator and the auxiliary system connected to the grid. Each important component of the process loop is implemented. A master control system is employed with the possibility to work in two modes: boiler follow (BF) or turbine follow (TF). The fastest BF mode has been selected to ensure rapid unit response to load changes in the grid. The output power is controlled by main turbine control valve (CV) throttling action. The model can also work in two pressure control system operation modes: fixed pressure (FP) or sliding pressure (SP) mode. Local controllers are also implemented to control the water level in: the boiler drum, condenser, deaerator and two feedwater preheaters. The master and local control systems are based on the standard proportional-integral (PI) controllers.
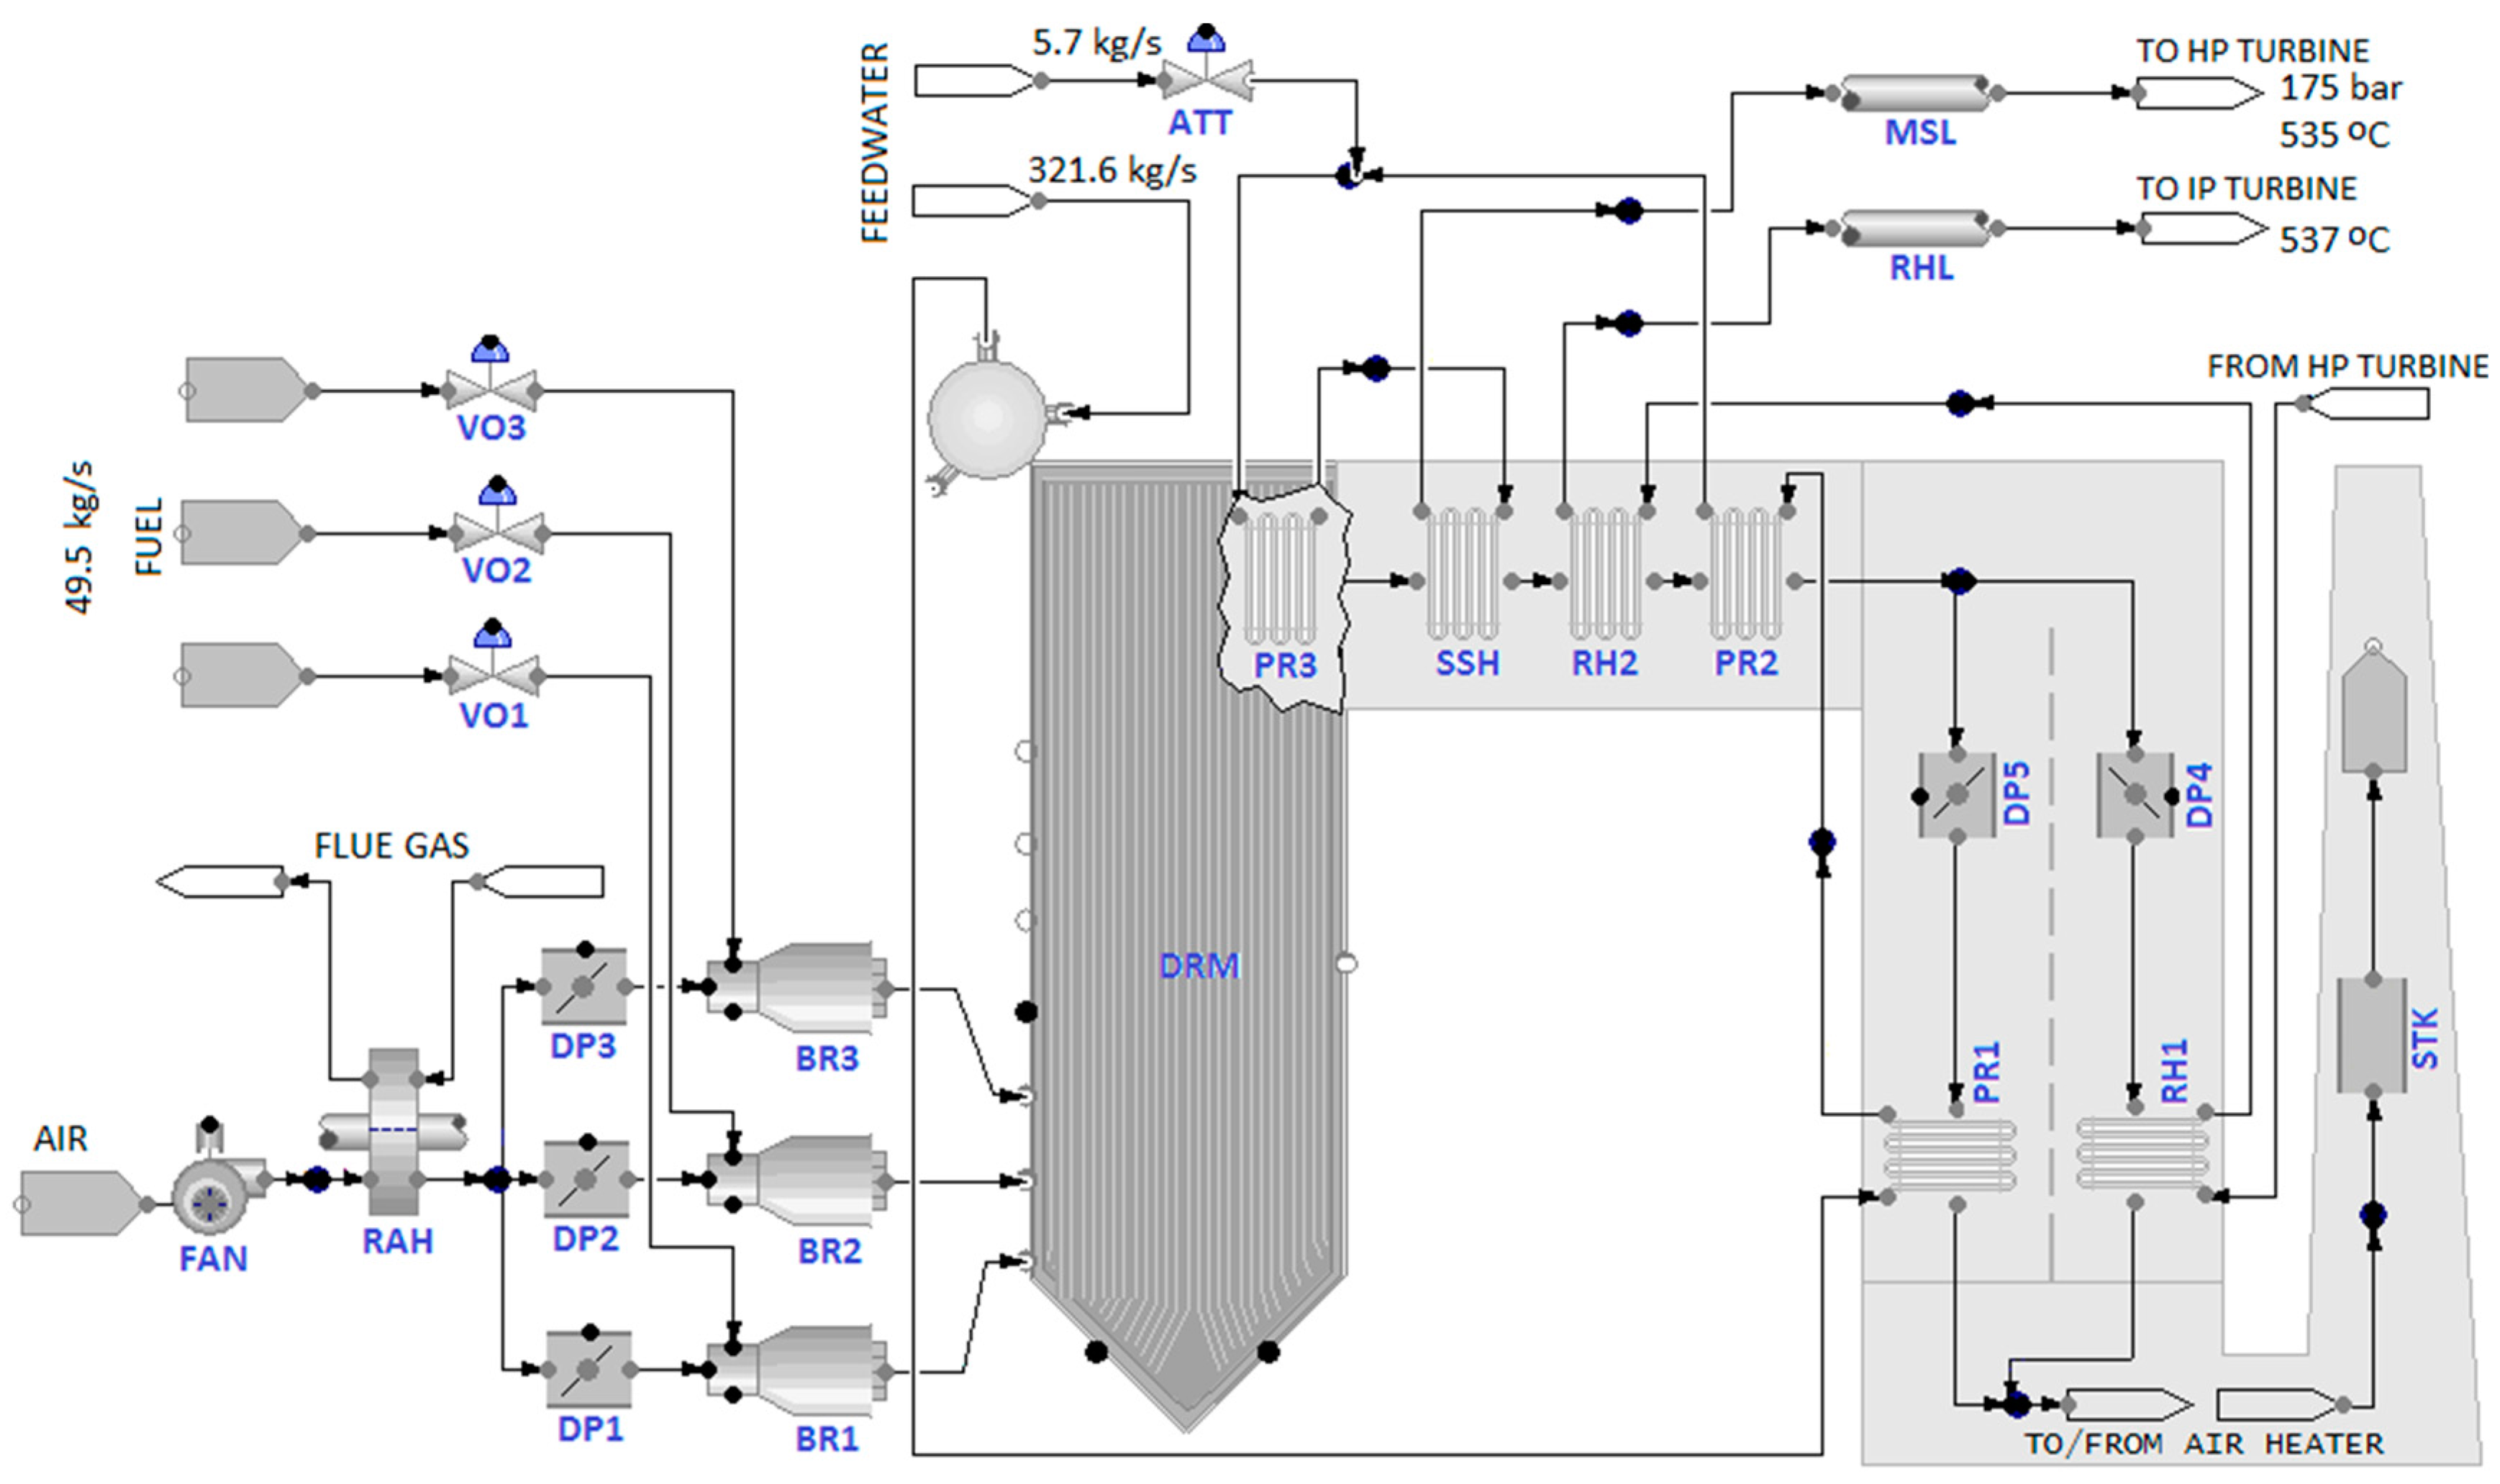
The boiler model is depicted in
Figure 2. It consists of a waterwall with drum (DRM), a four-stage superheater (depicted as PR1, PR2, PR3, SSH) and two-stage reheater (RH1, RH2). The main steam temperature (MST) is controlled by the one-stage superheater attemperator (ATT). The reheater steam temperature (RHT) is controlled by flue gas circulation in the boiler second pass via two dampers’ adjustment (DP4 and DP5).
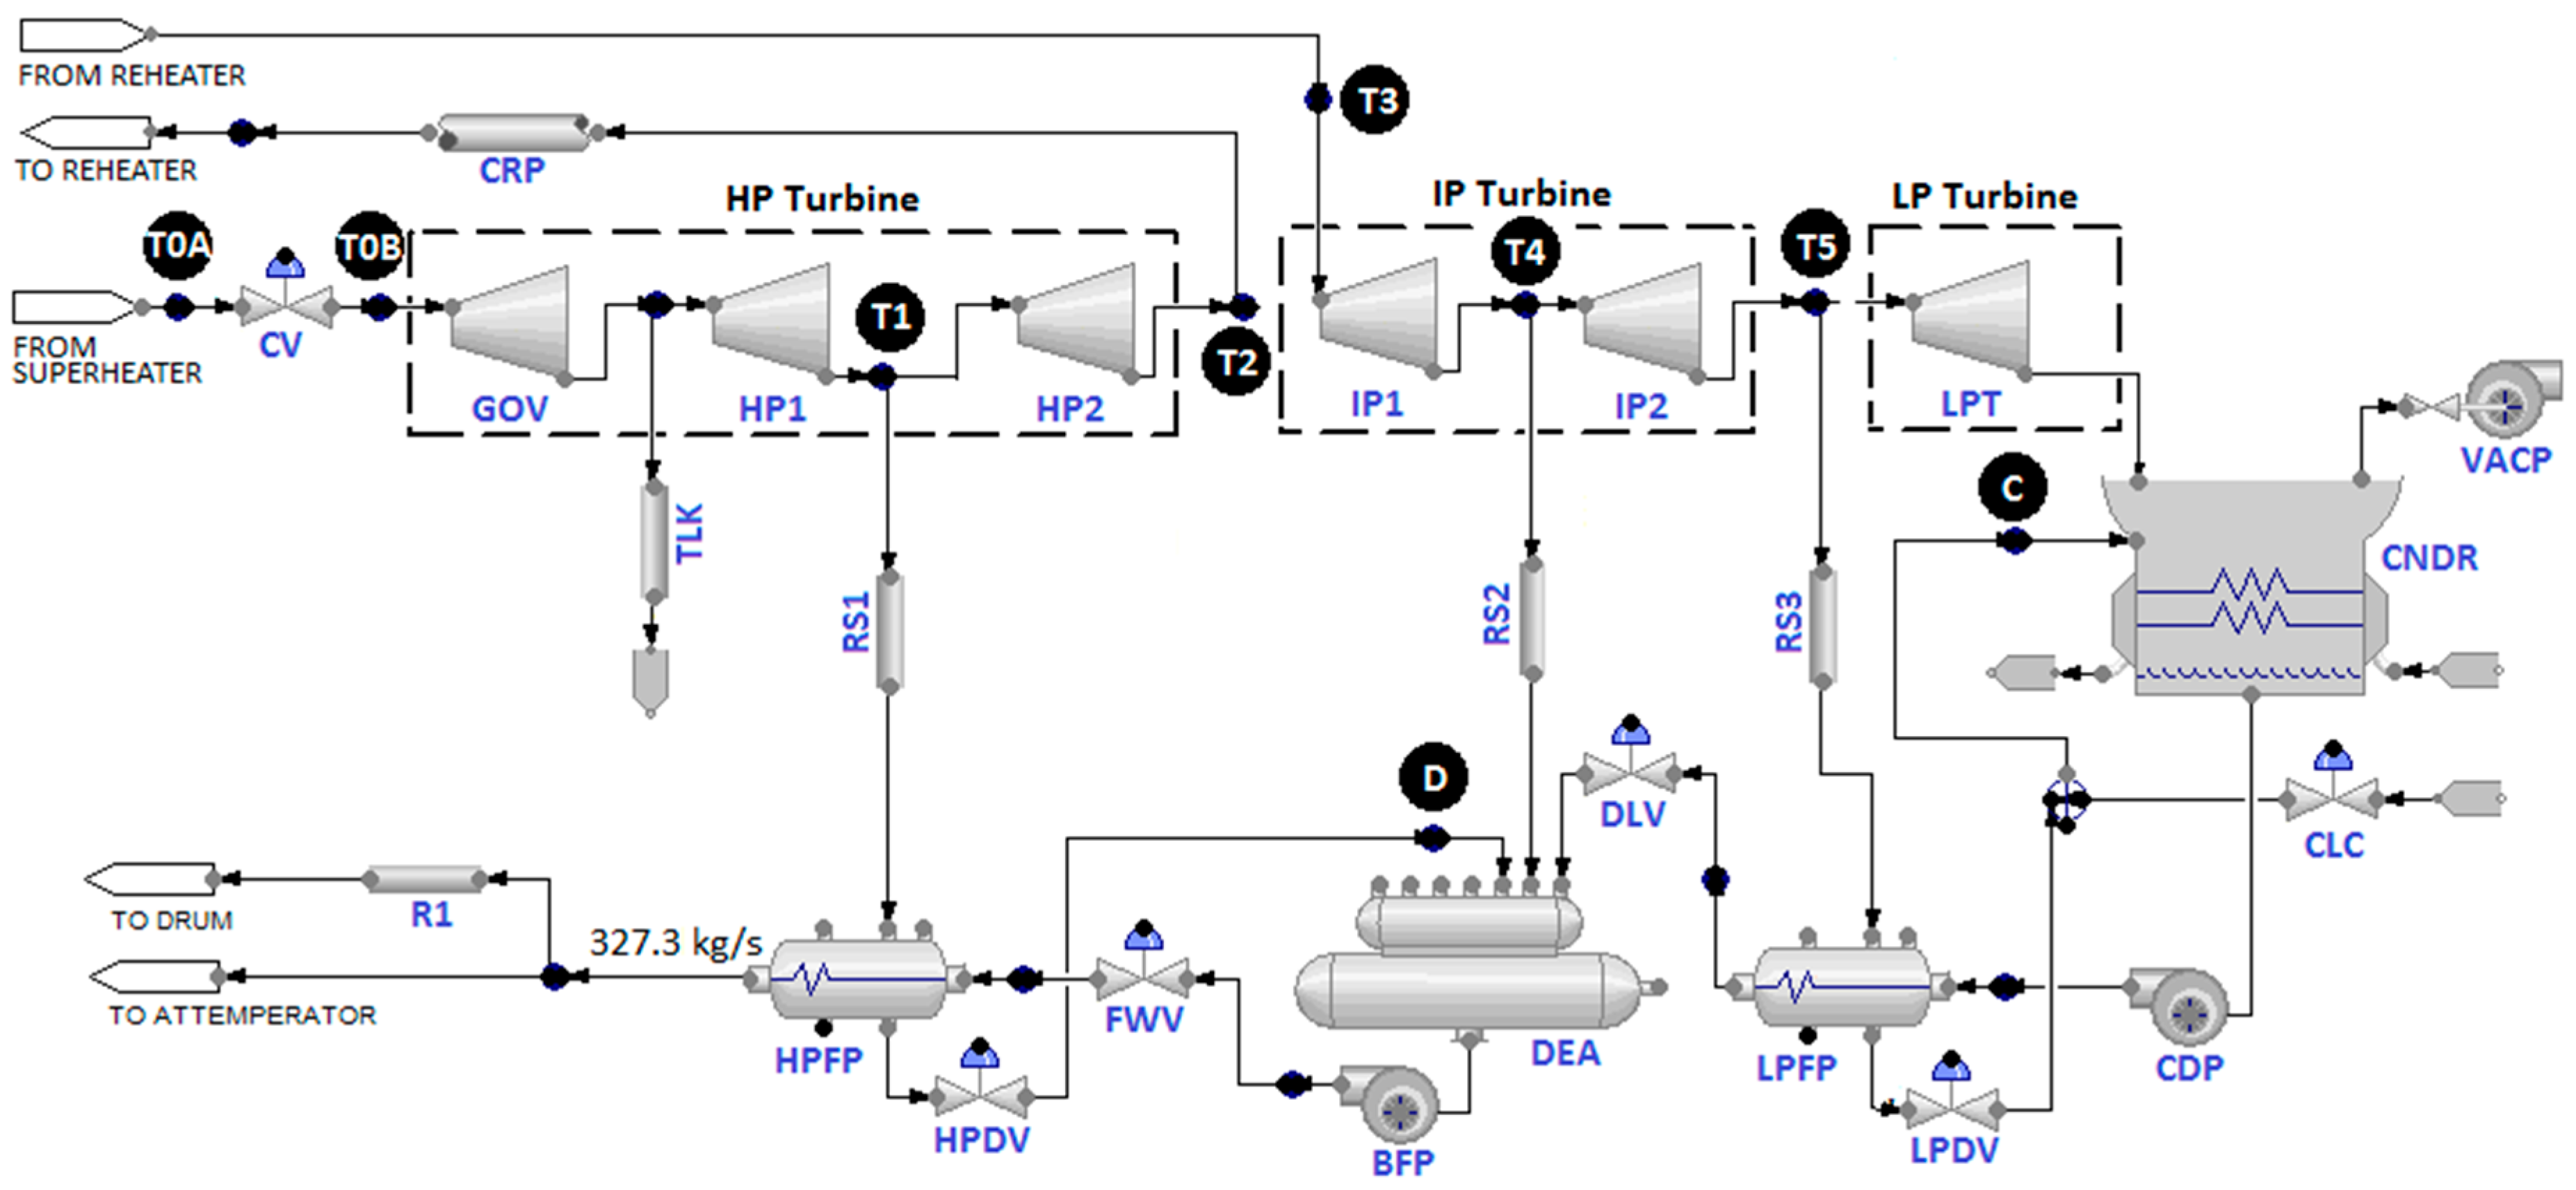
The balance of plant model is depicted in
Figure 3. It consists of high, intermediate and low pressure (HP, IP and LP) steam turbine stages. The HP turbine is split into three stages in the simulation model (depicted as GOV, HP1 and HP2). There are two steam taps located in the HP part: the first one represents the overall steam turbine leakages (TLK), whereas the second one supplies superheated steam to the high pressure feedwater preheater (HPFP). After expansion in the HP part, steam is returned to the boiler reheater, heated up to 537 °C and directed back to the IP steam turbine. There are two IP turbine stages (IP1, IP2). Between these stages, another steam tap is located to deliver steam to the deaerator (DEA). The third steam tap supplying steam to the low pressure feedwater preheater (LPFP) is located between the IP and LP parts of the turbine. The LP part is represented by only one stage (LPT). Superheated steam after expansion is condensed in a condenser (CNDR). The steam-water loop is implemented as the complete closed-loop system, so also, a make-up water system is implemented (CLC). The feedwater is circulated through a condenser pump (CDP) and preheated in the LPFP and deaerator. The main boiler feedwater pump (BFP) increases the pressure of feedwater and after heating up in the HPFP is supplied to the boiler drum. A small part of the feedwater is also directed to the superheater attemperator to control the MST. Although there are three HPFP and four LPFP stages in the power plant, for simplification, only one stage of each one has been used in the modelling work.
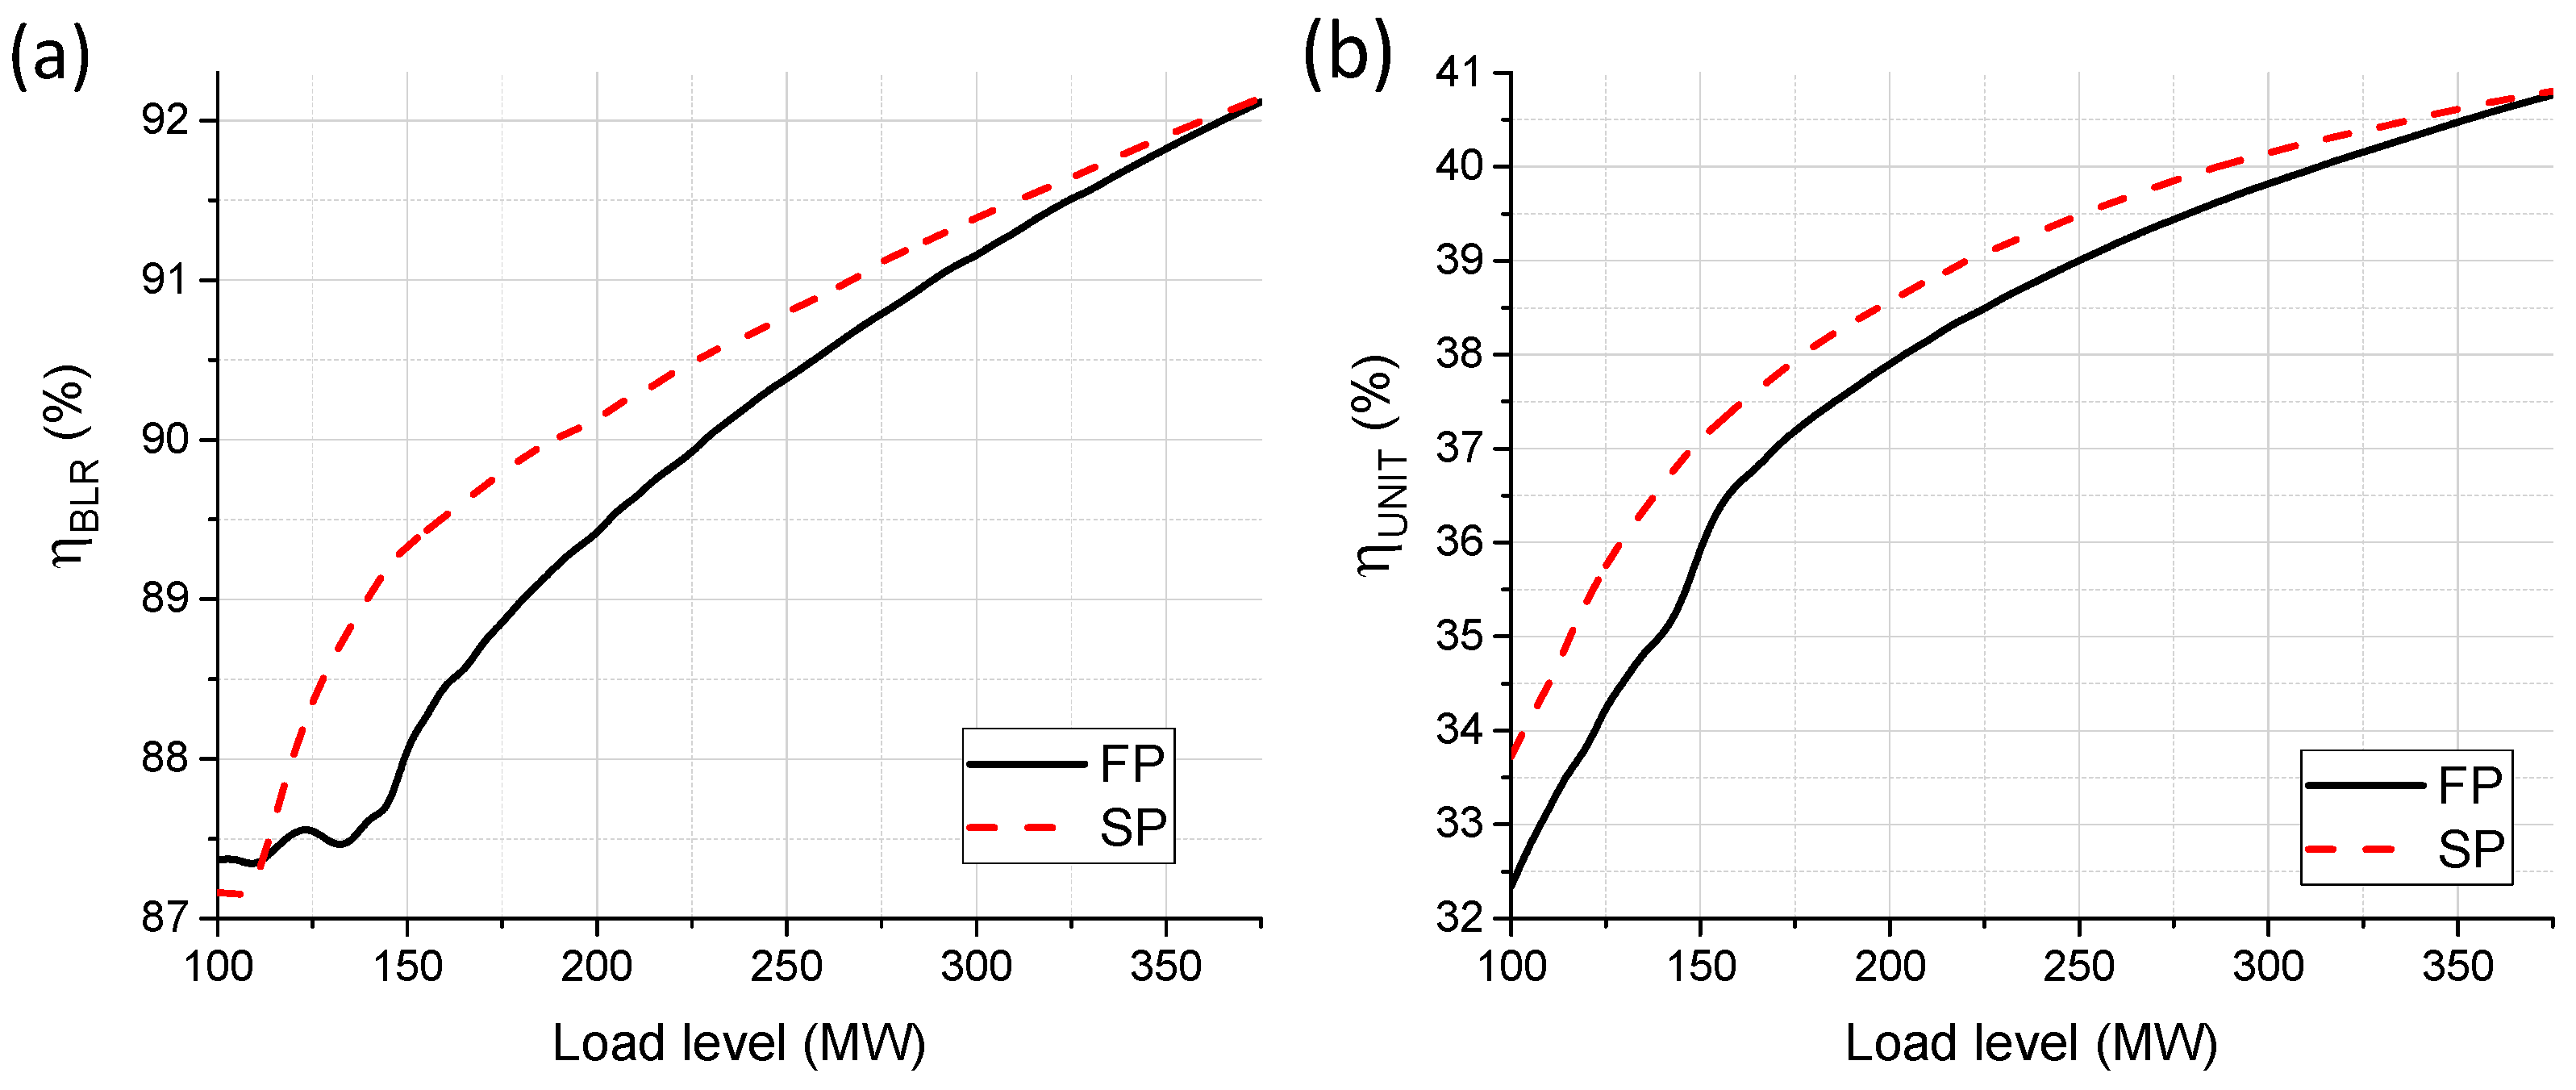
To fully assess the potential of TES integration, it is necessary to initially accomplish the model performance check without any modifications. According to the distributed control system (DCS), the power plant is able to operate within the 100–375-MW load level range. FP control mode implies constant steam pressure of 175 bar of the main steam line over the unit’s load range. High CV throttling action causes substantial energy losses, especially for lower load levels. As the steam turbine requires less steam mass flow rate and less pressure at the lower load levels, consequently greater efficiency and reduced emission can be achieved in SP mode. On the other hand, reduced pressure throttling provides a narrower steam reserve in the boiler drum, so the power plant will not be able to provide the modest amount of fast reserve. The difference in boiler efficiency (η
BLR) and unit efficiency (η
UNIT) in both modes are presented in
Figure 4.
The boiler efficiency (η
BLR) varies between 87% and 92%, and it is calculated based on the following formula:
where
W, mass flow;
H, enthalpy; points on the
Figure 2: SSH, Superheater outlet; RH2, Reheater outlet; CRP, reheater inlet; FW, Feedwater inlet; ATT, superheater Attemperator inlet; BR1–BR3, Burner fuel inlet; FAN, Fan inlet.
The total unit generation efficiency (η
UNIT) also takes into consideration auxiliary power consumption in the plant, and it is calculated based on the following equation:
where
PGEN is the power plant output power (electrical);
PAUX the auxiliary power (feedwater, condenser pumps and air fan);
W, the mass flow;
H, the enthalpy; BR1–BR3, Burner fuel inlet; FAN, Fan inlet; CLC, makeup water inlet.
Whereas there is no difference in unit efficiencies for the designed condition (full load), it is clearly seen that the unit in SP operating mode is able to reach up to 1% higher efficiency than in FP mode for the lowest load levels.
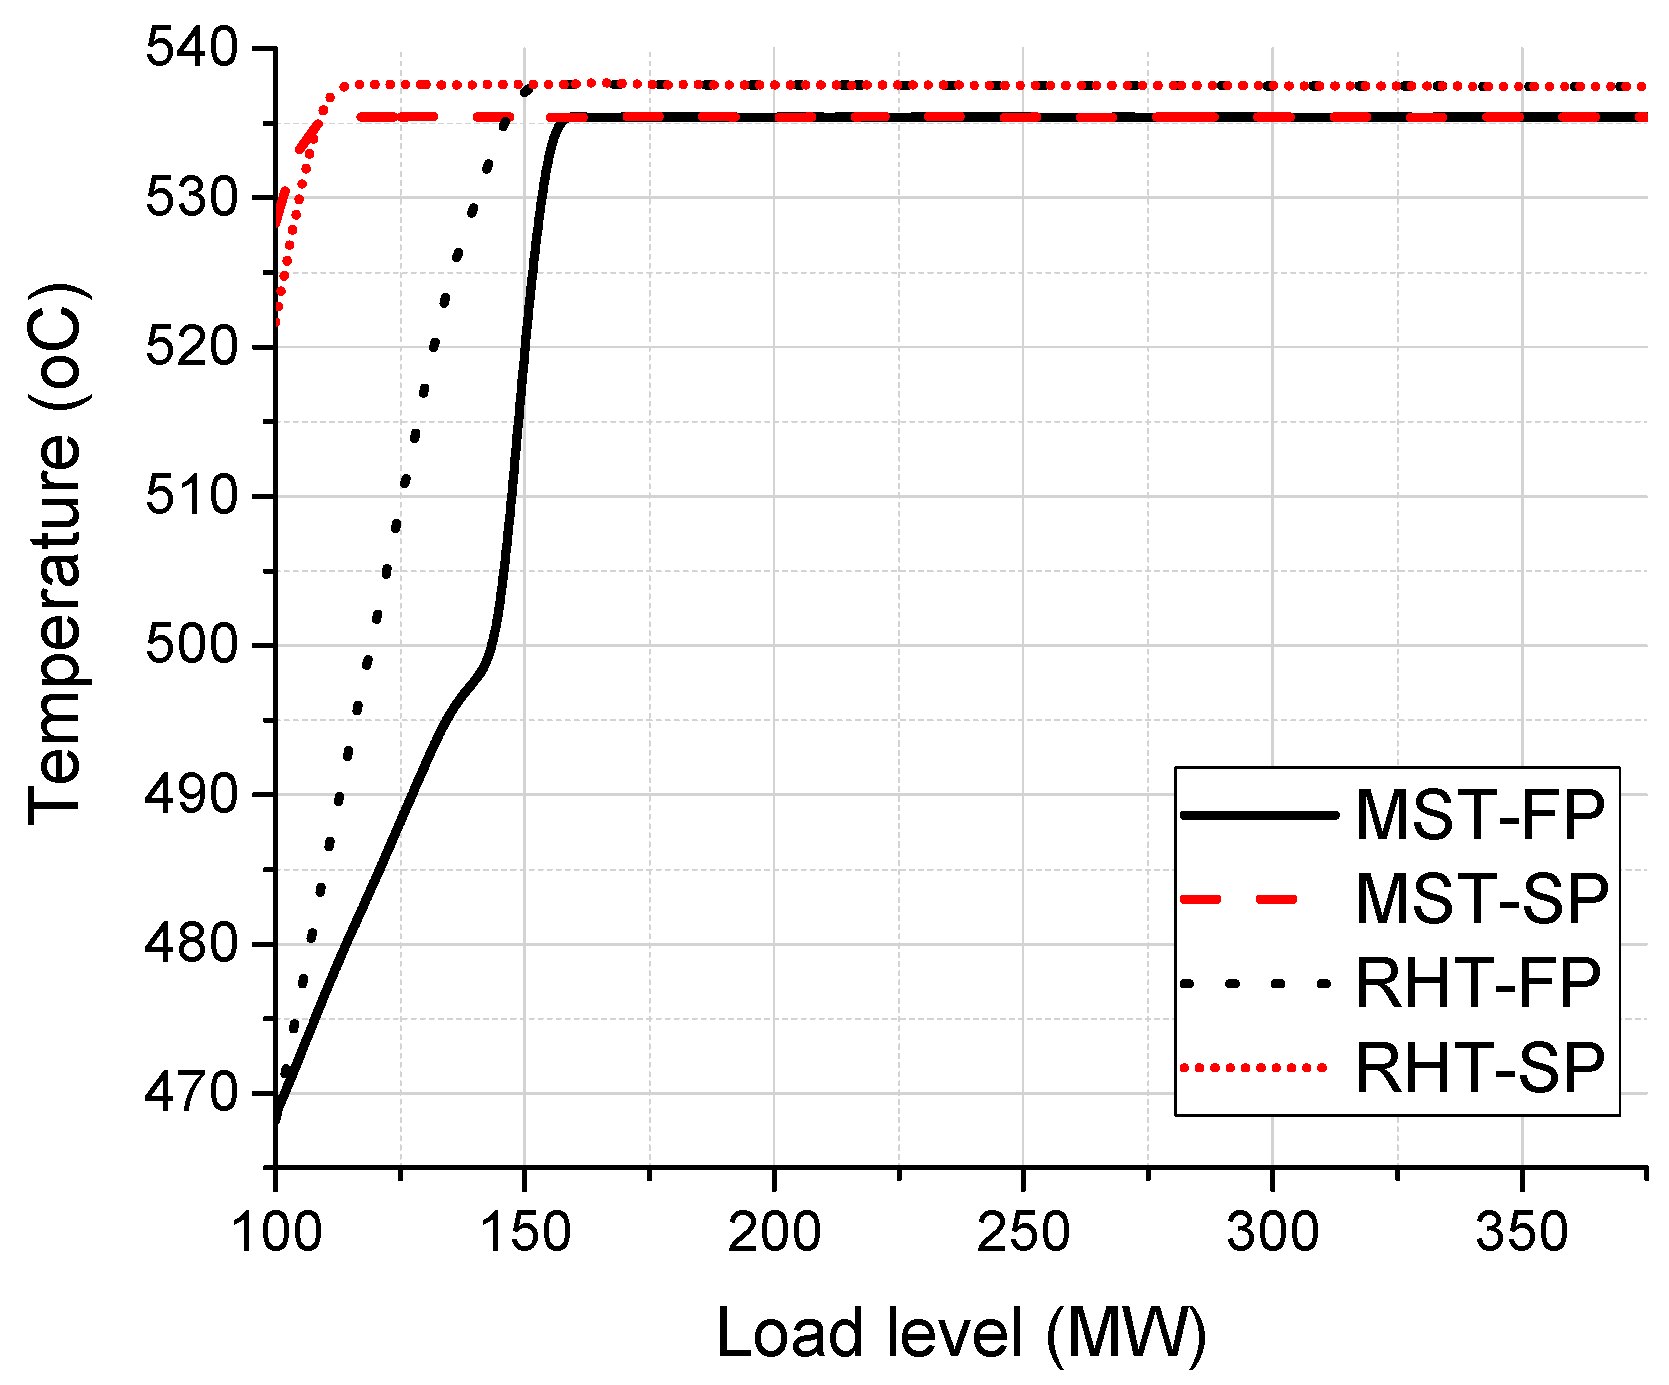
The effective power plant operational range is restricted by steam parameters, as steam temperatures at the main steam line and reheater line decrease below the rated values for certain conditions. In
Figure 5, it is clearly seen that MST and RHT decrease below the rated values for low load levels. The minimum load level is restricted to 155 MW in FP mode and 110 MW in SP mode. Therefore, the minimum load level should be maintained above these values for secure power plant operation, as any rapid load change can cause steep temperature gradients, result in severe component thermal stresses and equipment lifetime decrease. Higher unit efficiency and increased plant operational range at low load levels make SP control mode more preferred and widely used in industry.
3. Analysis of Feasible Integration Strategies
The principals of each TES system are to store heat (or cold) to be used later and overcome the mismatch between energy generation and energy use [
10,
33]. The general concept of TES integration in the power plant cycle is to take the heat out from the plant process cycle during low load demand and send it to storage. The heat should be returned back to the process loop when it is required, usually during high load demand, when the electricity price is high. The general idea of TES integration into the plant cycle is briefly explained in
Figure 6.
In this article, no particular TES scheme is considered, as the main aim is to assess the influence of a hypothetical TES system on the plant process cycle. The authors’ intention is not to consider any specific TES technology, although this has significant influence on the feasibility of the entire concept. Recently, there has been high interest in TES technology, and many new articles are focused on new TES materials, their parameters and design concepts. By investigating the current state of the art TES system, we would be limited by its current parameters. Consequently, the storage phase is not discussed in the paper, and two main TES processes are simulated: the charging and discharging process. In the plant process cycle, the superheated steam is used as the heat transfer fluid (HTF) and the source of heat. As it is not possible to effectively keep the superheated steam in a storage tank, the heat from the superheated steam should be exchanged with suitable thermal material filling the storage tank in the TES charging process. Usually, the most cost effective solutions can be achieved using retrofitting; therefore, only relatively easily accessible points for steam extraction from the plant process loop are considered. Extraction points could be located at the inlet and outlet from the steam turbine and also at steam taps to feedwater preheaters. Seven different possible locations for TES steam extraction points are considered in the steam-water loop for the TES charging process. These points (T0A–T5) are shown in
Figure 6, which also corresponds to
Figure 3:
On the main steam line, just before and after the main control valve (T0A and T0B respectively);
At the inlet and outlet from the boiler reheater (T2 and T3 respectively);
At the steam taps to feedwater preheaters: HPFP, the deaerator and LPFP (T1, T4 and T5, respectively).
Superheated steam used in the TES charging process should be promptly returned back to the steam-water loop, as the loop is very sensitive to any imbalances. Return points are located at the deaerator and condenser (D and C in
Figure 3). There are direct-contact type HX that allow for direct steam and water mixing, so it is possible to return steam or water from the TES charging process. The return point is chosen based on the minimal pressure difference between TES extraction and return points to avoid any unnecessary pressure throttling on the TES control valve. The deaerator (D) is chosen as the return point for extraction points T0A–T3, whereas the condenser (C) is selected for extraction points T4 and T5.
Another challenge is to find a suitable way to reuse the heat in the power plant process cycle. Heat stored in TES tank can be used in the feedwater preheating process; therefore, another HX should be integrated in the TES tank for the discharging process. A bypass can be built around feedwater preheaters, and the heat from the TES system can be used instead. In this case, superheated steam extraction from the steam turbine to the bypassed feedwater preheater is no longer required. Consequently, more steam flows through the steam turbine and generates more electricity. This is highly important for grid frequency support, as the TES discharging process can provide additional power boost, and the power plant is able to generate above the registered capacity. LPFP and/or HPFP bypassing has been considered. The deaerator, which is also a feedwater preheater, is not considered for the TES discharging process, as it is a crucial component in dissolved gas removal from the feedwater. Additionally, a deaerator tank is also acting as the water return point in the TES charging process (D). Simulations have been performed to assess the potential of TES integration in all listed points for the charging and discharging processes.
4. Simulation Test and Results
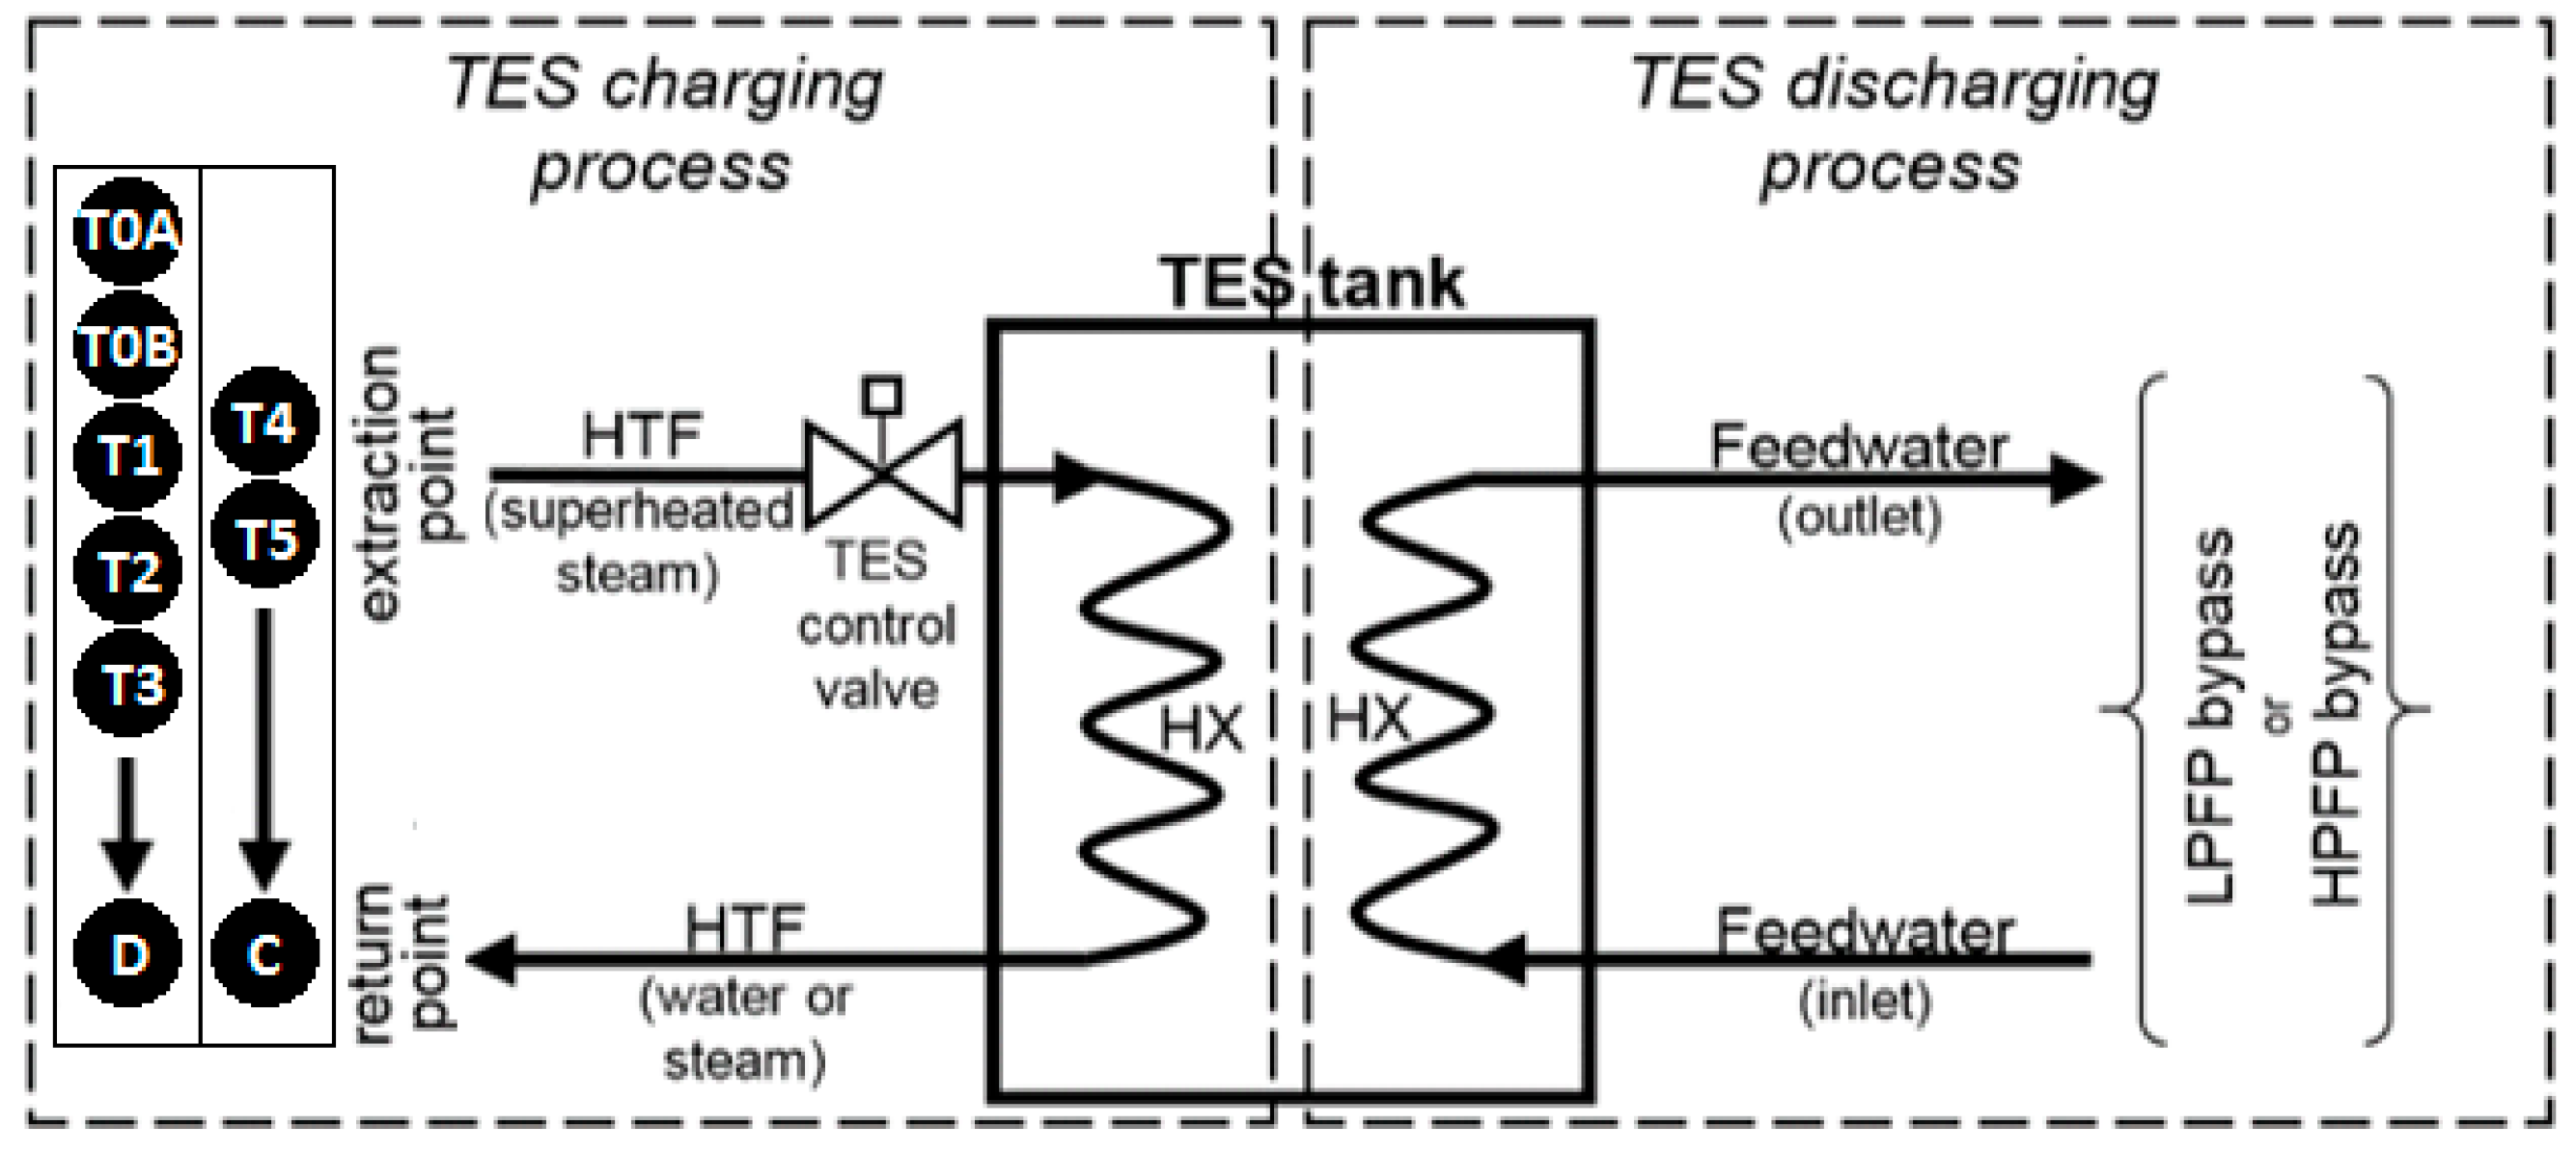
This feasibility study is not focused on any particular TES technology and design, so the entire TES system is designed as a black box with the operation conditions suitable for both charging and discharging processes. Inlet and outlet steam/water parameters are taken into consideration to assess the maximum possible heat transfer in the TES charging and discharging processes. The main aim is to extract the maximum heat to and from the TES system with the minimum negative influence on the power plant process cycle. Although the ProTRAX software platform is capable of dynamic process simulations, a steady state analysis has been performed for load levels within the entire plant operational range of 100–375 MW. The results are presented for TES charging and discharging processes in two pressure control system modes: FP and SP mode. It is assumed that only one TES configuration is tested at a time for the TES charging process. The TES discharging process has been tested for bypasses low pressure, high pressure and both feedwater preheaters.
4.1. TES Charging Process
The TES charging process requires a TES control valve implementation for each considered charging point separately. Superheated steam is taken from one point at a time (T0A–T5). A simple PI controller maintains constant steam mass flow to the TES HX within the range of 0–100 kg/s (with 5 kg/s step). The TES charging power (
PTES) is proportional to the steam mass flow and the difference in enthalpies between the inlet and outlet points of TES HX and can be calculated according to the following equation:
where
WTES is the mass flow rate of extracted steam;
Hi and
Ho are the specific enthalpies of the inlet and outlet streams of HX.
To get the maximum available charging power
PTES, it is necessary to ensure the maximum available steam mass flow and the maximum possible difference in enthalpies between TES HX inlet and outlet nodes. Therefore, the steam condensation process should occur in TES HX in the TES charging process. To assume the minimum negative influence on the plant cycle, the water parameters at the outlet from TES HX are equal to the water parameters in the devices’ return point: deaerator tank or condenser tank (depending on the TES charging point). Pressure drop across TES HX is considered to be constant within the entire load level range (0.3 bar). The remaining pressure drop between the TES steam extraction point and the water return point is reached on the TES control valve. It is also essential to assess the power penalty on the plant process cycle (
dP) caused by steam extraction in the TES charging process. In this case, it is necessary to disable the power plant master control system, leaving all local controllers active. The power penalty is the difference between requested load level and the actual value of generated power. The real benchmark for the TES charging process is the difference between TES charging power
PTES and the power penalty
dP, according to the following equation:
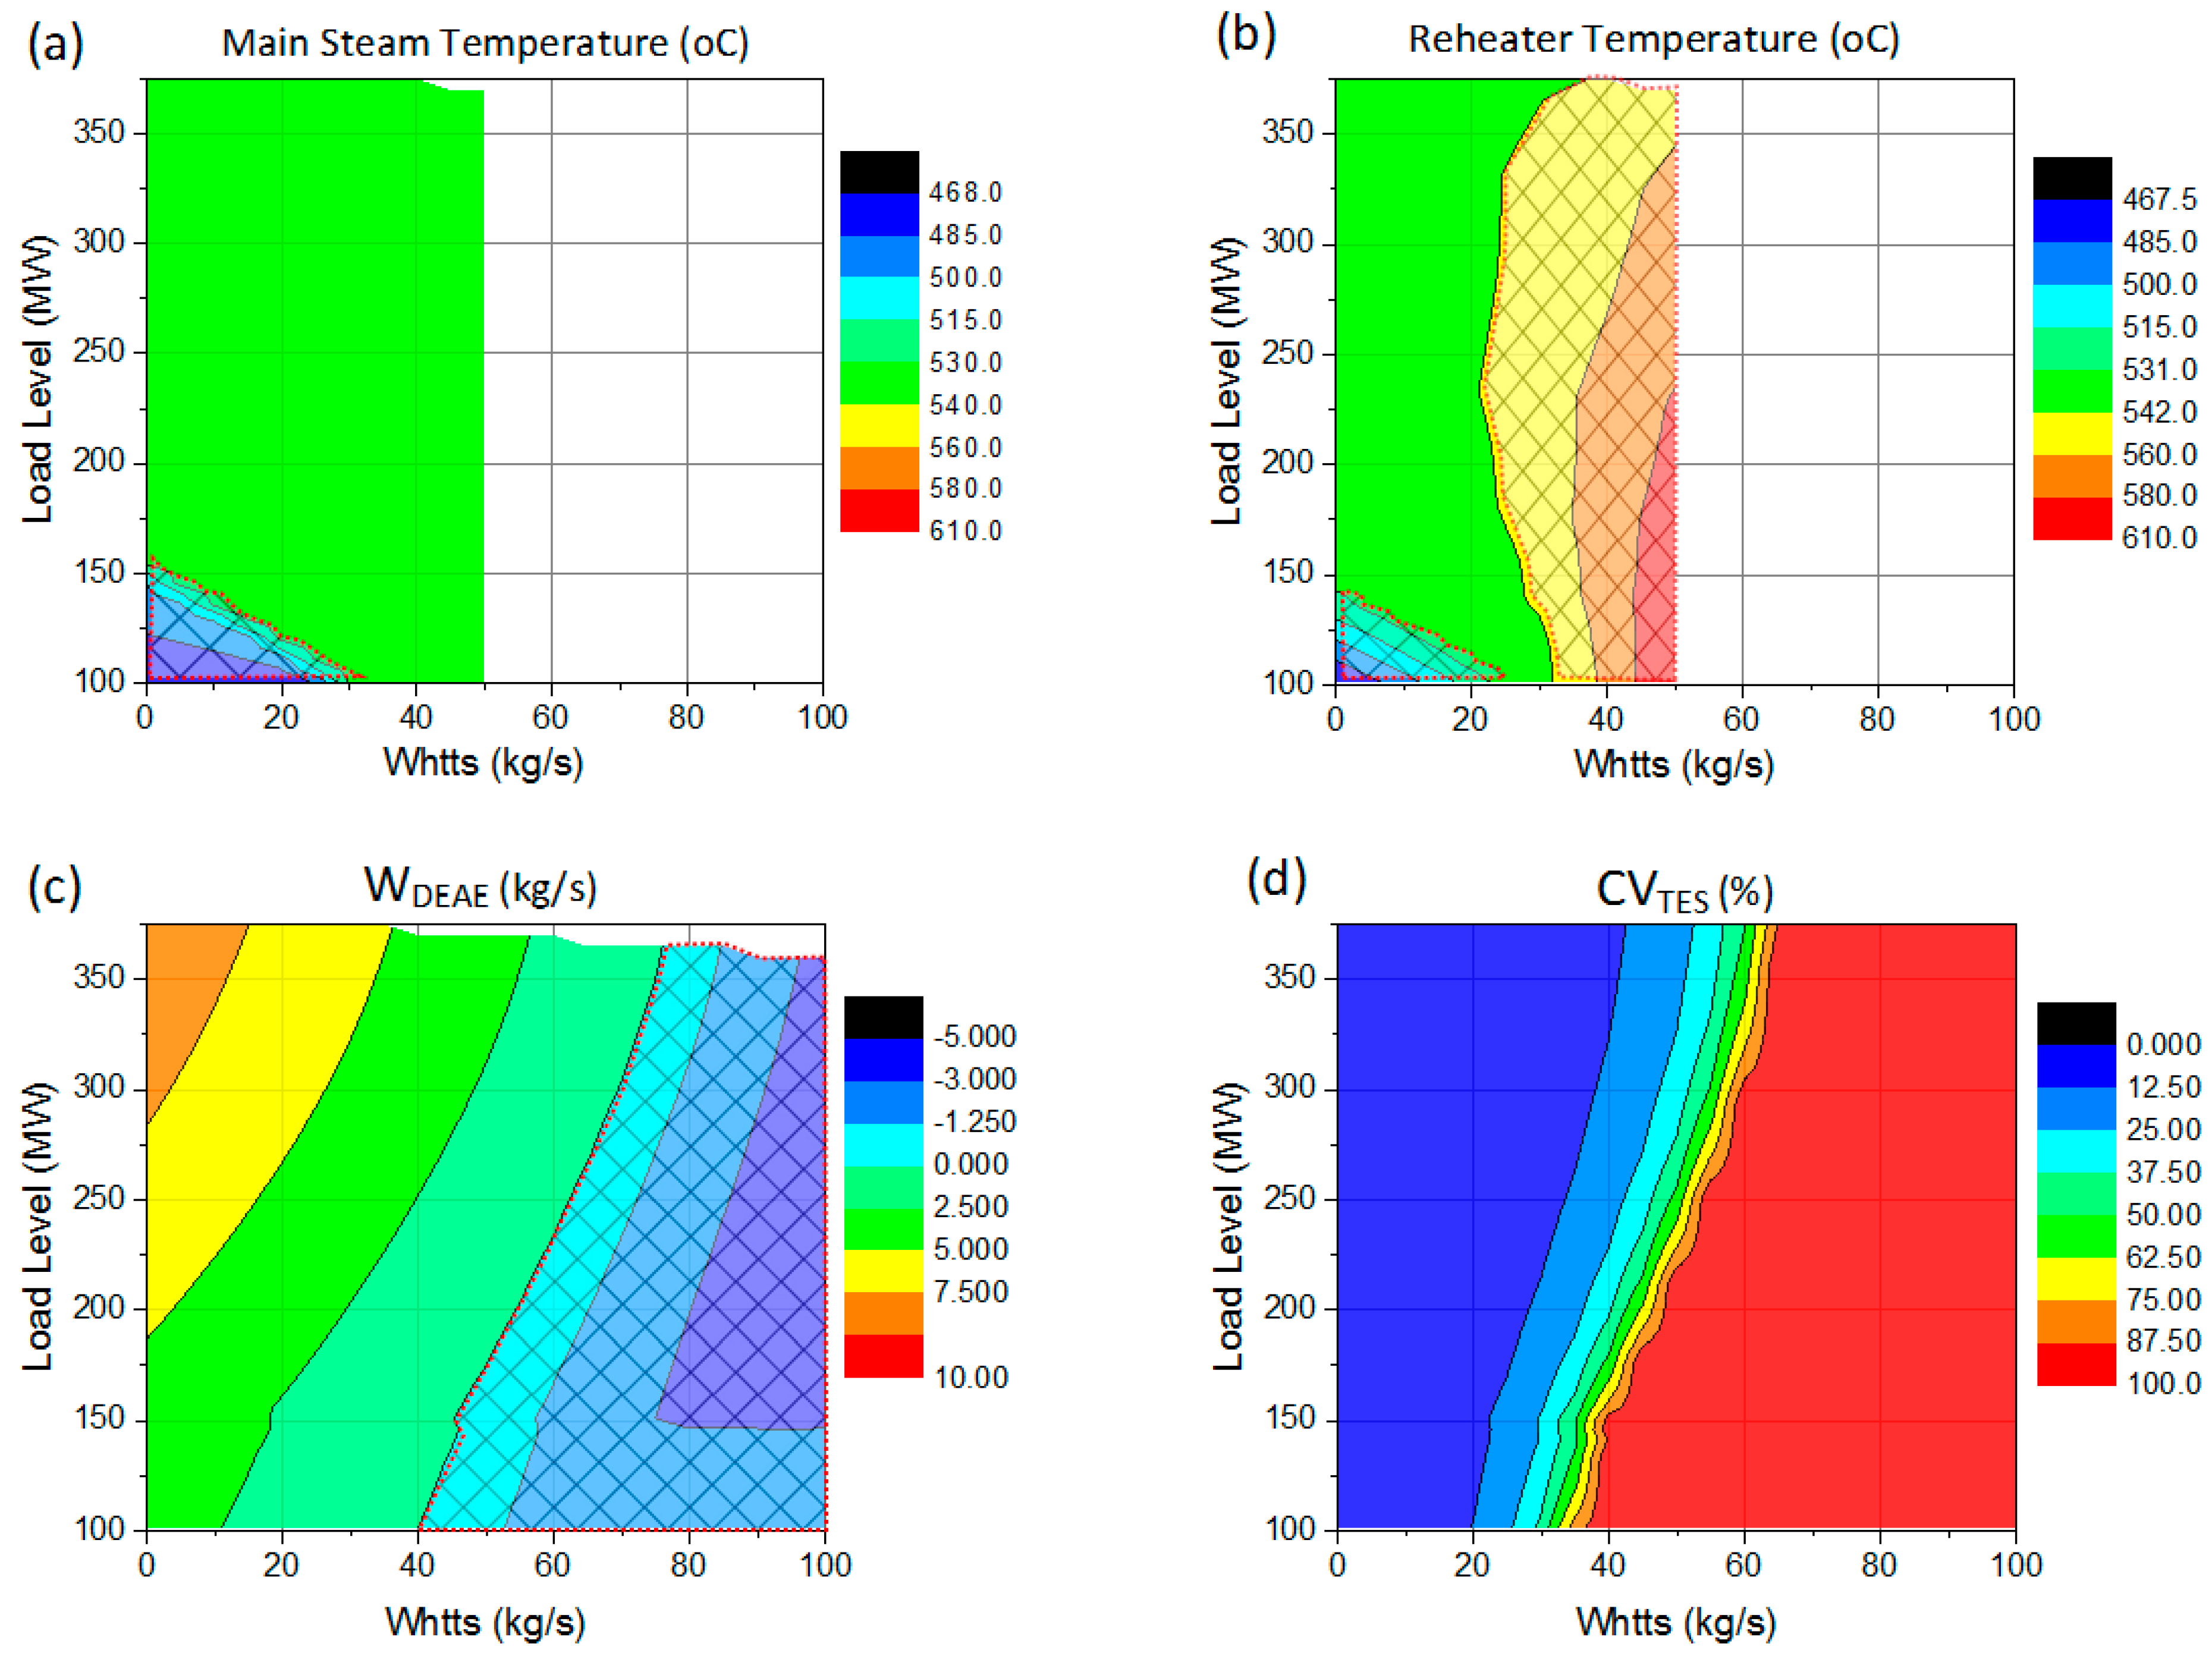
Simulation results shown in
Figure 7 indicate four main restrictions in the maximum possible steam mass flow (
WTES) in TES charging mode:
- (1)
MST restriction: MST should be kept constant (535 °C ± 10%) within the entire load level range. The power plant model is not able to reach the rated MST value for the lowest load levels: <155 MW in FP mode and <110 MW in SP mode (
Figure 5). Additional steam extraction for the TES charging process allows one to increase MST for the lowest load levels for TES extraction points located before the reheater (T0A–T2). In this case, it is possible to extend the plant operational range for low load levels. No influence has been noticed for TES points located downstream of the reheater (T3–T5).
Figure 7a shows an example for point T1, where MST is too low for the lower load levels (100–150 MW) and
WTES 0–30 kg/s (the crossed area).
- (2)
RHT restriction: RHT should be kept constant (537 °C ± 10%) within the entire load level range. RHT acts similar to MST for low load levels. Additionally, RHT rises suddenly with increasing TES steam mass flow extraction for points T0A–T2; therefore, the maximum TES steam mass flow is restricted to 20–30 kg/s. This is caused by insufficient reheater cooling, as the steam mass flow through the reheater is much smaller than through the superheater. This is the main limiting factor for all TES extraction points located before the reheater. Furthermore, no influence has been noticed for points located downstream of the reheater (T3–T5).
Figure 7b shows an example for point T1, where the RHT is too high for
WTES higher than 20–30 kg/s (the crossed area). RHT also acts similar for low load levels as MST shown in the previous point (
Figure 7a).
- (3)
Deaerator functionality is limited for TES charging point T3. A negative steam mass flow can be observed in the steam tap supplying the deaerator (the crossed area in
Figure 7c). This condition occurs for TES steam mass flow greater than 35 kg/s. This is caused by the pressure increase in the deaerator tank above the pressure level in the steam tap.
- (4)
Maximum pipe diameter restriction: The maximum steam mass flow is also restricted by the maximum diameter of the pipe delivering steam to the TES system. The condition where the maximum steam mass flow to TES (
WTES) is reached occurs for TES steam extraction point T5 (
CVTES = 100%, the red colour in
Figure 7d). The left border of the red area indicates the maximum possible steam mass flow to TES system (38–63 kg/s).
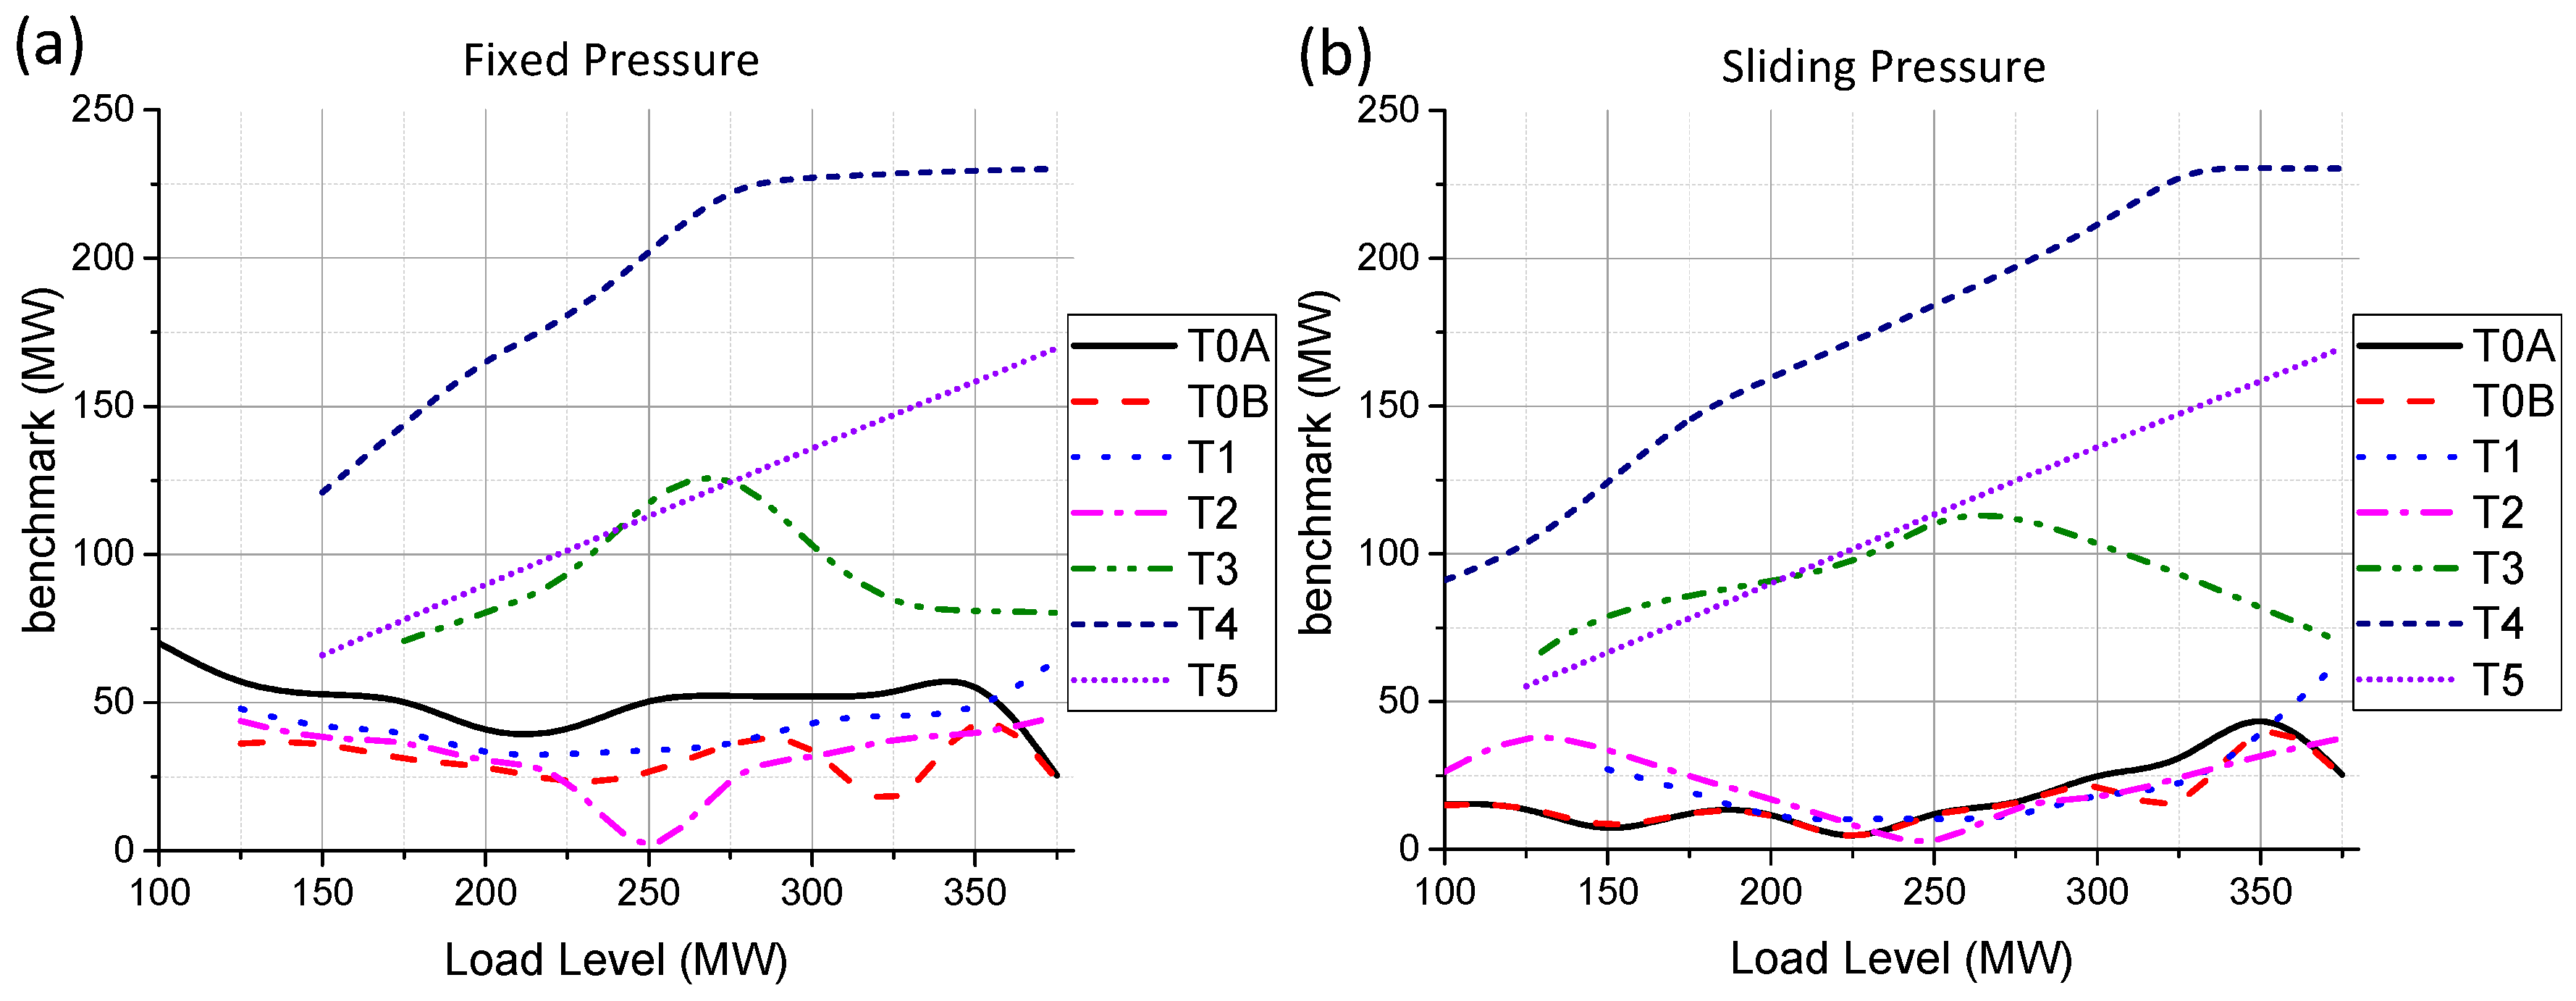
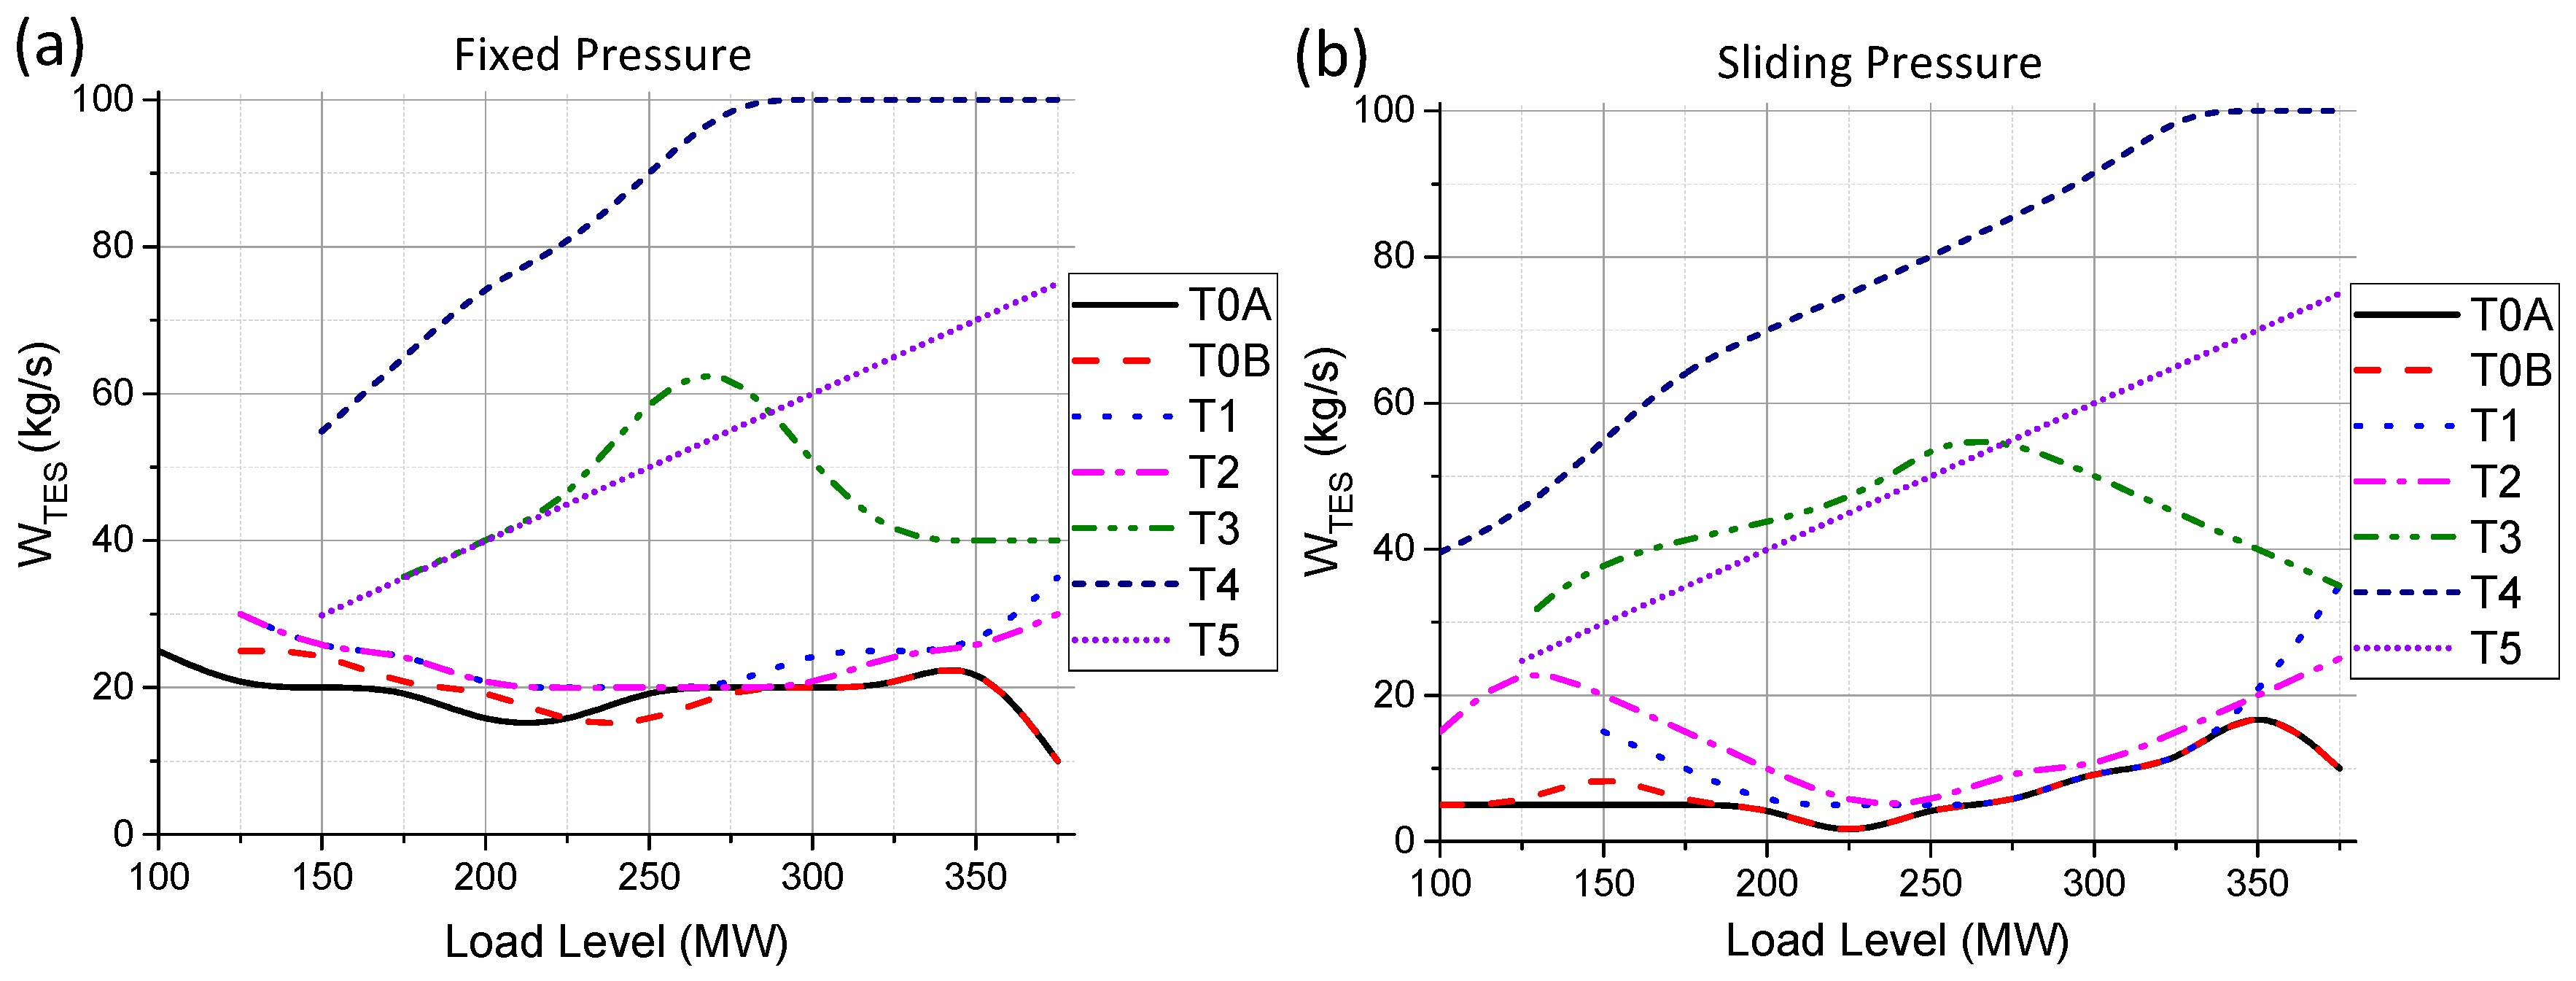
A superposition of all specified restrictions for each investigated scenario allows one to draw an available power plant operational range for all investigated TES charging points. The maximum available TES steam mass flow (
WTES) is depicted in
Figure 8. The maximum value is reached for location T4. The linear outcome for point T5 comes from the maximum allowable steam mass flow reached for the assumed diameter of the pipe delivering steam to TES HX. TES steam mass flow is significantly restricted for all TES extraction points located before the reheater (points T0A–T2), although in FP mode, it is possible to reach slightly higher values than in SP mode. The main benefit in SP mode is slightly extended operational range for the lowest load levels below 150 MW. It is really important that power plants are able to operate for the lowest possible load levels allowing for TES charging at the same time.
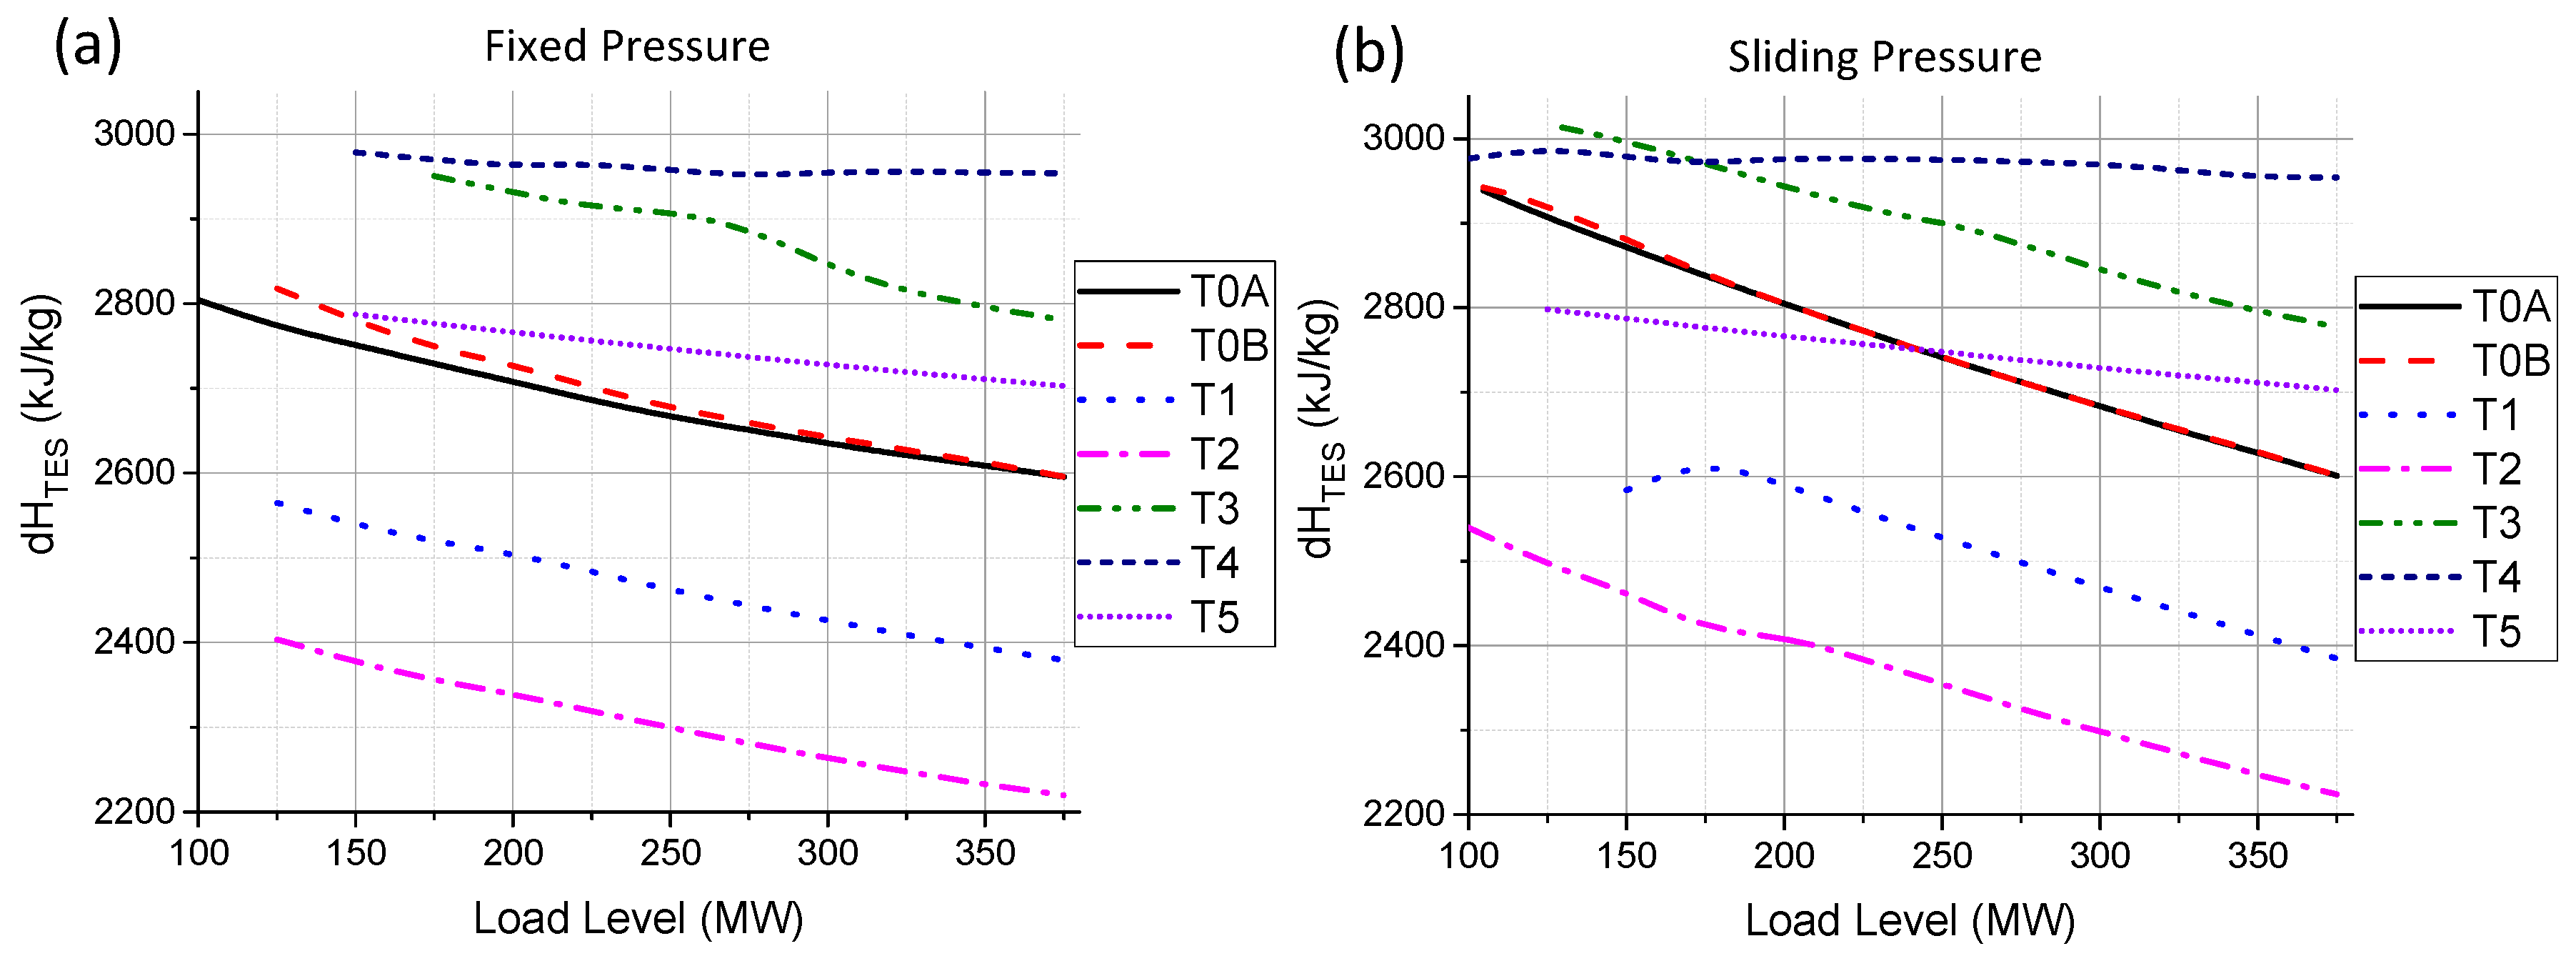
SP operation mode also allows one to get a higher difference in TES inlet and outlet enthalpies (
dHTES) for all extraction points located before the reheater (
Figure 9). The difference is more visible at lower load levels. The condensation process, which occurs in TES HX, helps to obtain the highest possible difference in enthalpies, as the enthalpy of saturated water is much lower than saturated steam.
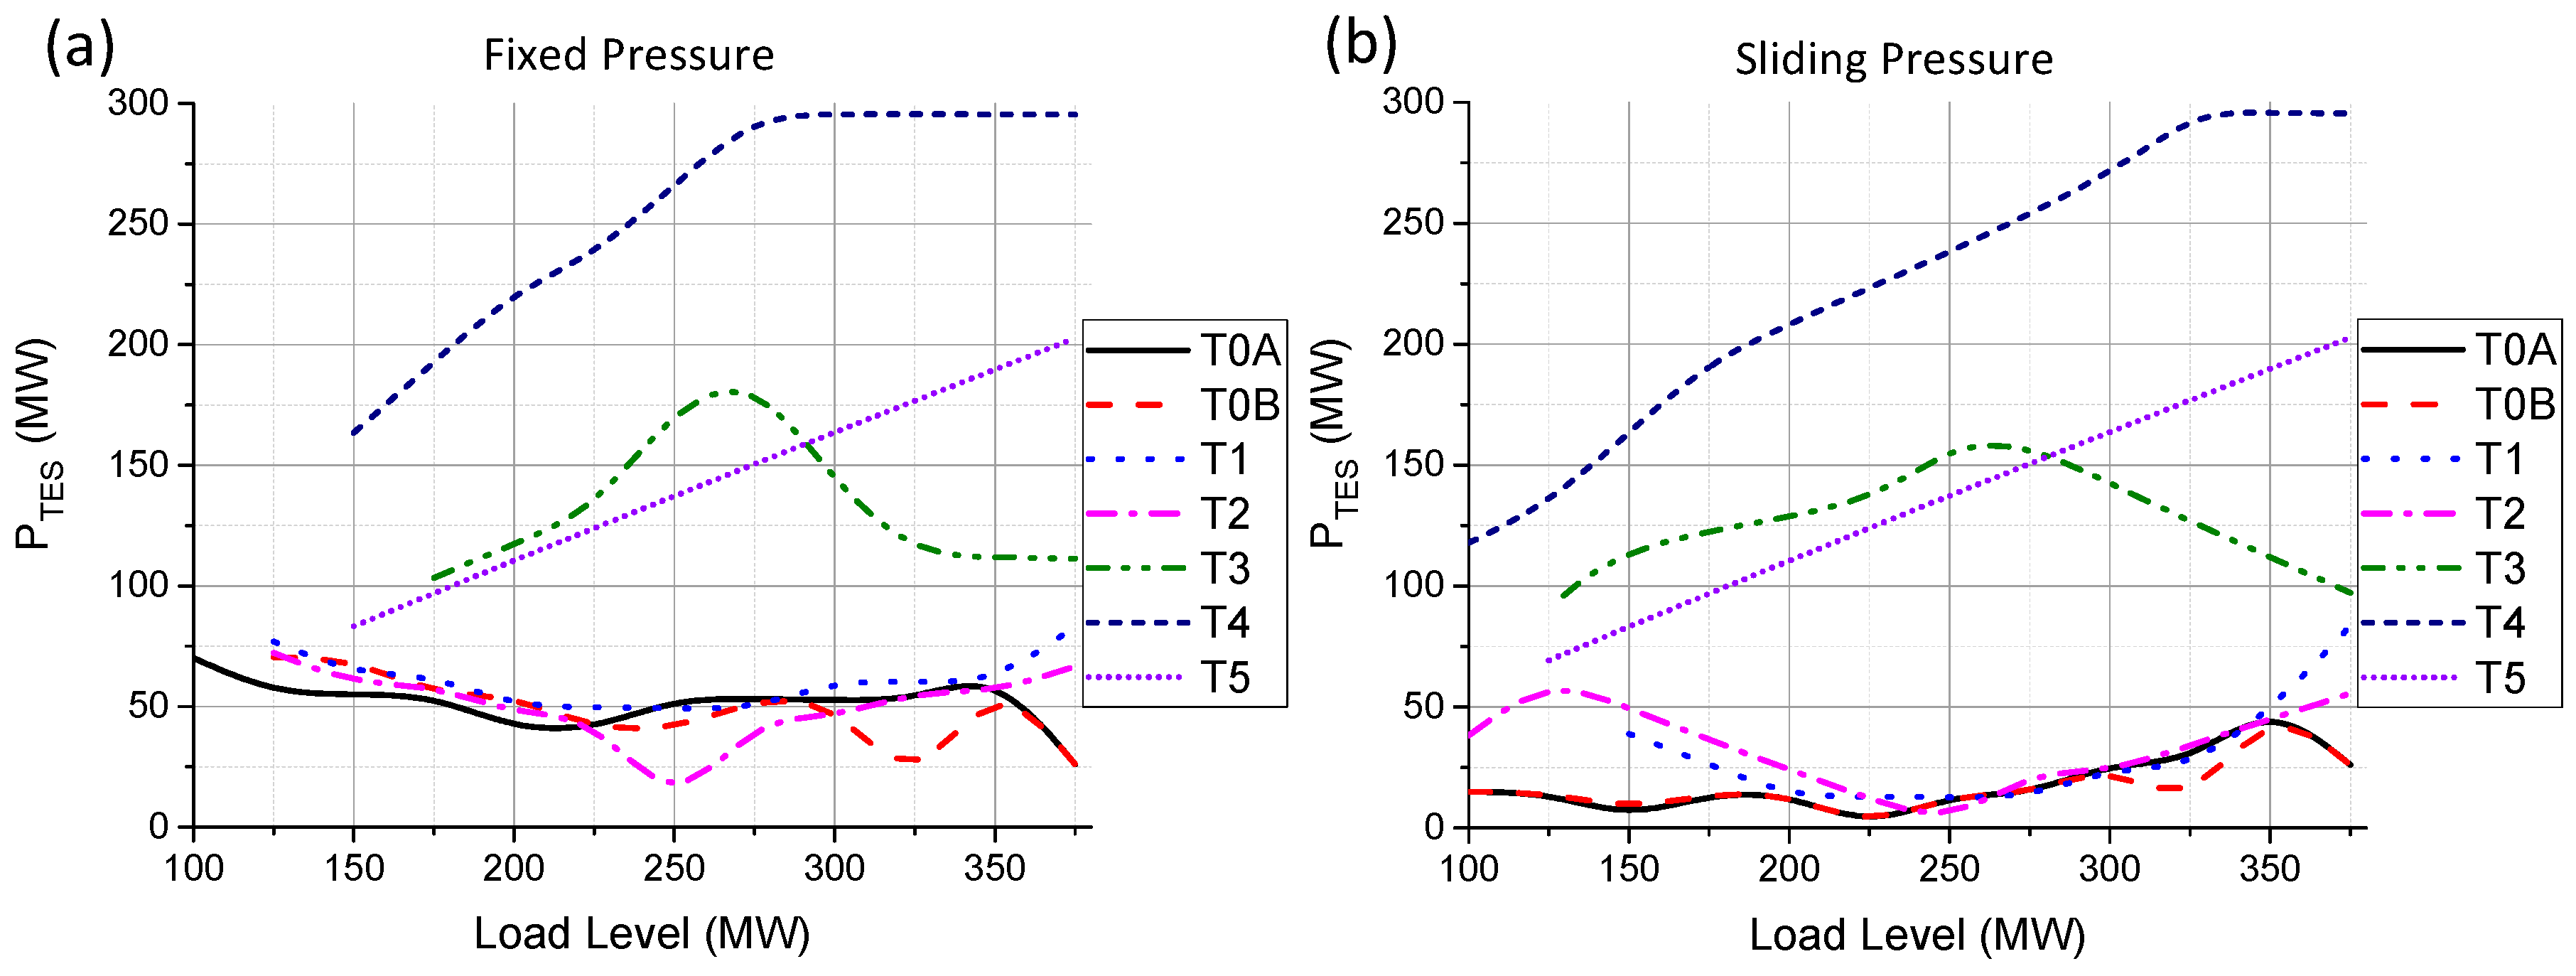
TES charging power (
PTES), as the result of multiplication of the above values, reaches the highest values for TES locations T4, T5 and T3, respectively (
Figure 10). The advantage for points T4 and T5 comes from the lower water parameters in the condenser tank than in the deaerator (TES return point). TES charging power is restricted for all locations upstream of the boiler reheater up to 50 MW in FP mode and about 20 MW in SP mode. The main benefit in SP control system mode is the extended TES operational range, which allows one to decrease the power plant load level to the minimum during the TES charging process.
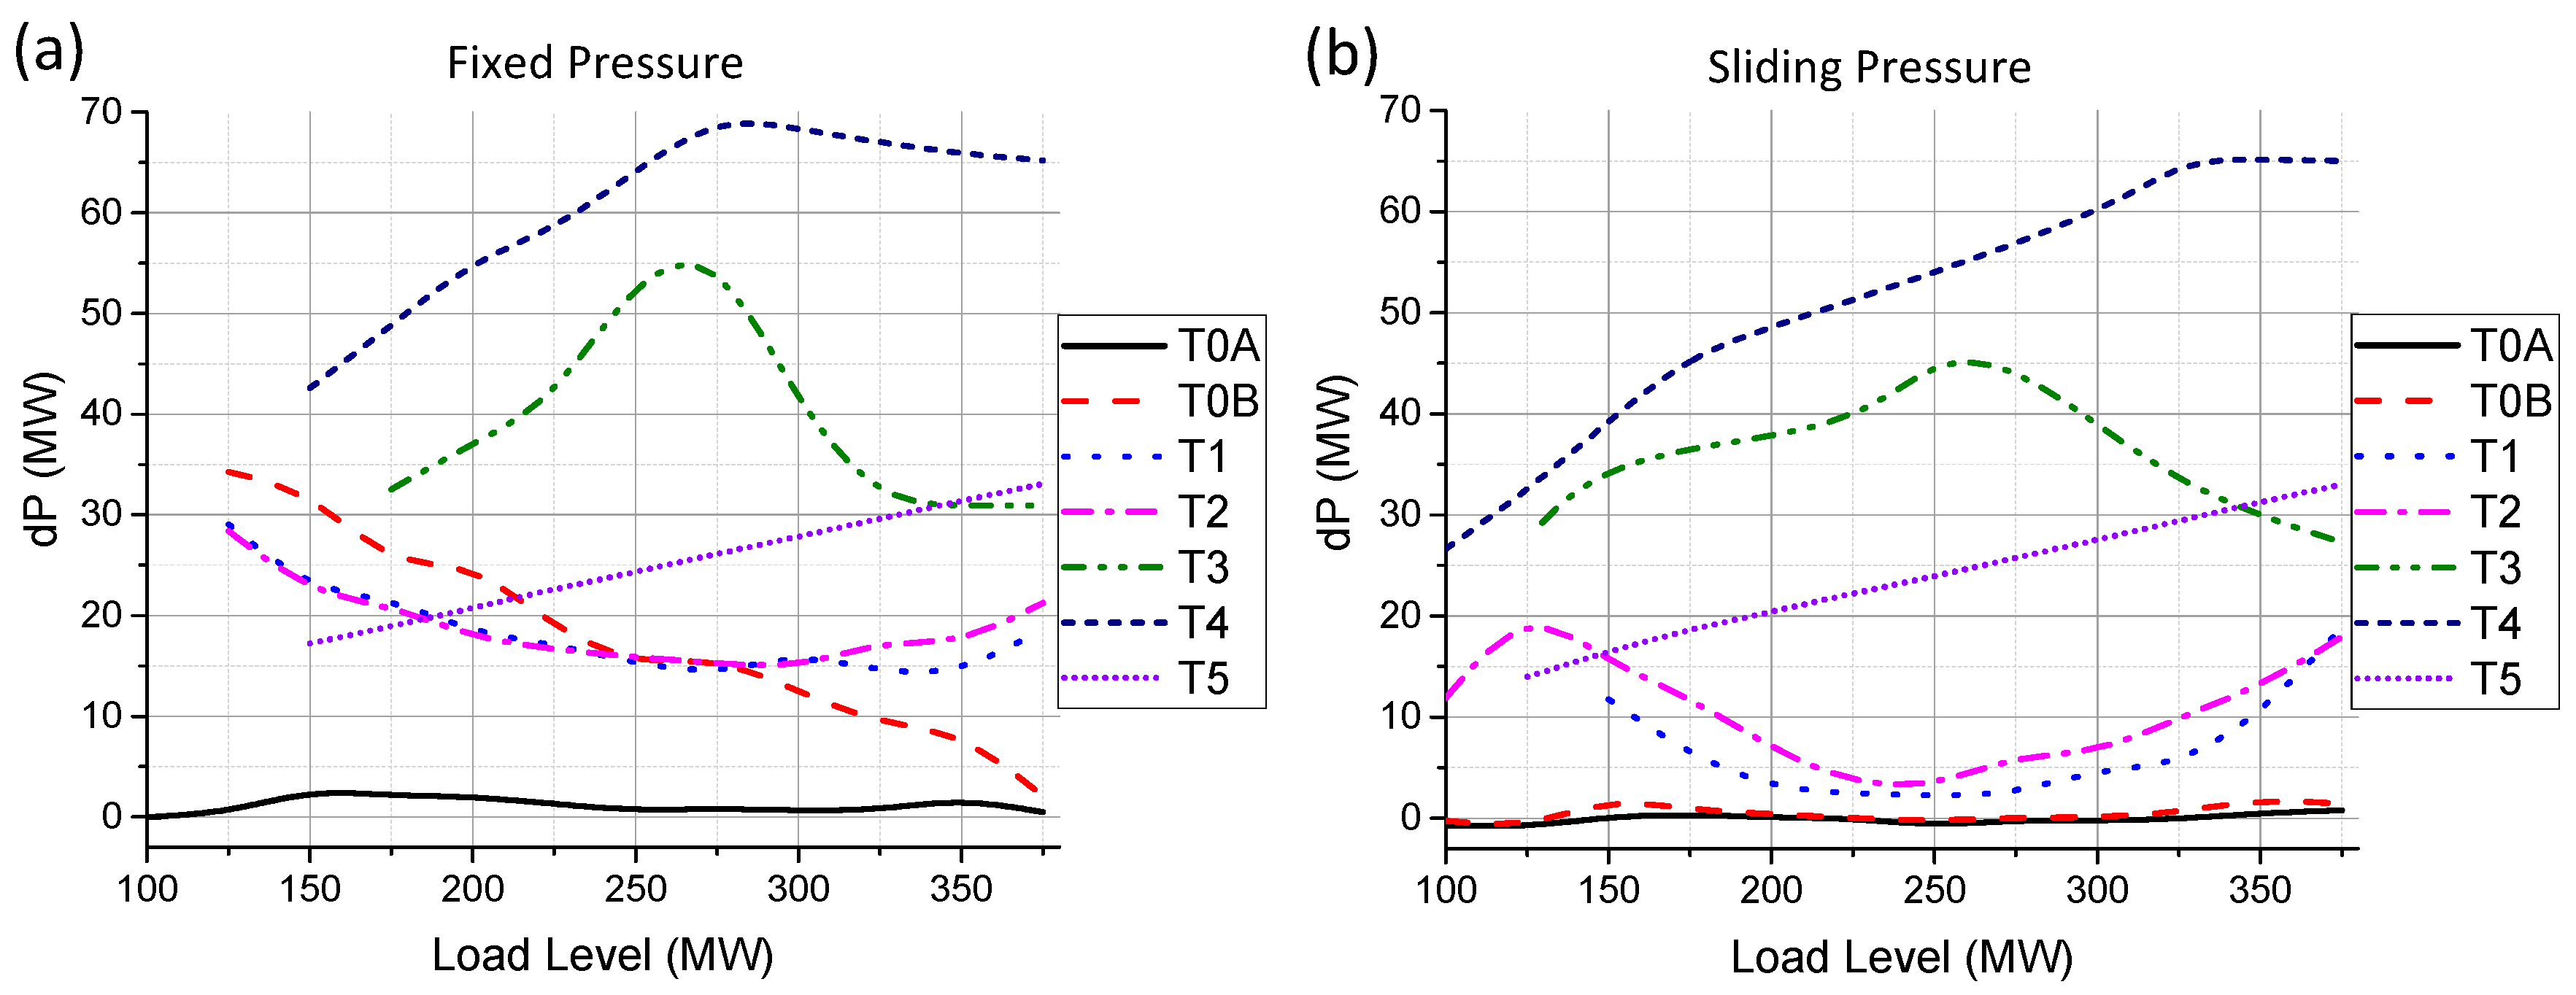
The power penalty (
dP) on the plant cycle during the TES charging process is proportional to the charging power
PTES (
Figure 11). The smallest values are reached for the charging point located at the outlet from the superheater (T0A).
The benchmark value (
benchmark) calculated according to Equation (4) is presented in
Figure 12 and takes into consideration the power penalty (
dP) during the TES charging process. According to the obtained results, the best candidate points are all locations downstream of the boiler reheater: points T4, T3 and T5, respectively. Slightly lower values can be reached in SP mode, but the main advantage is the extended plant operational range for low load levels.
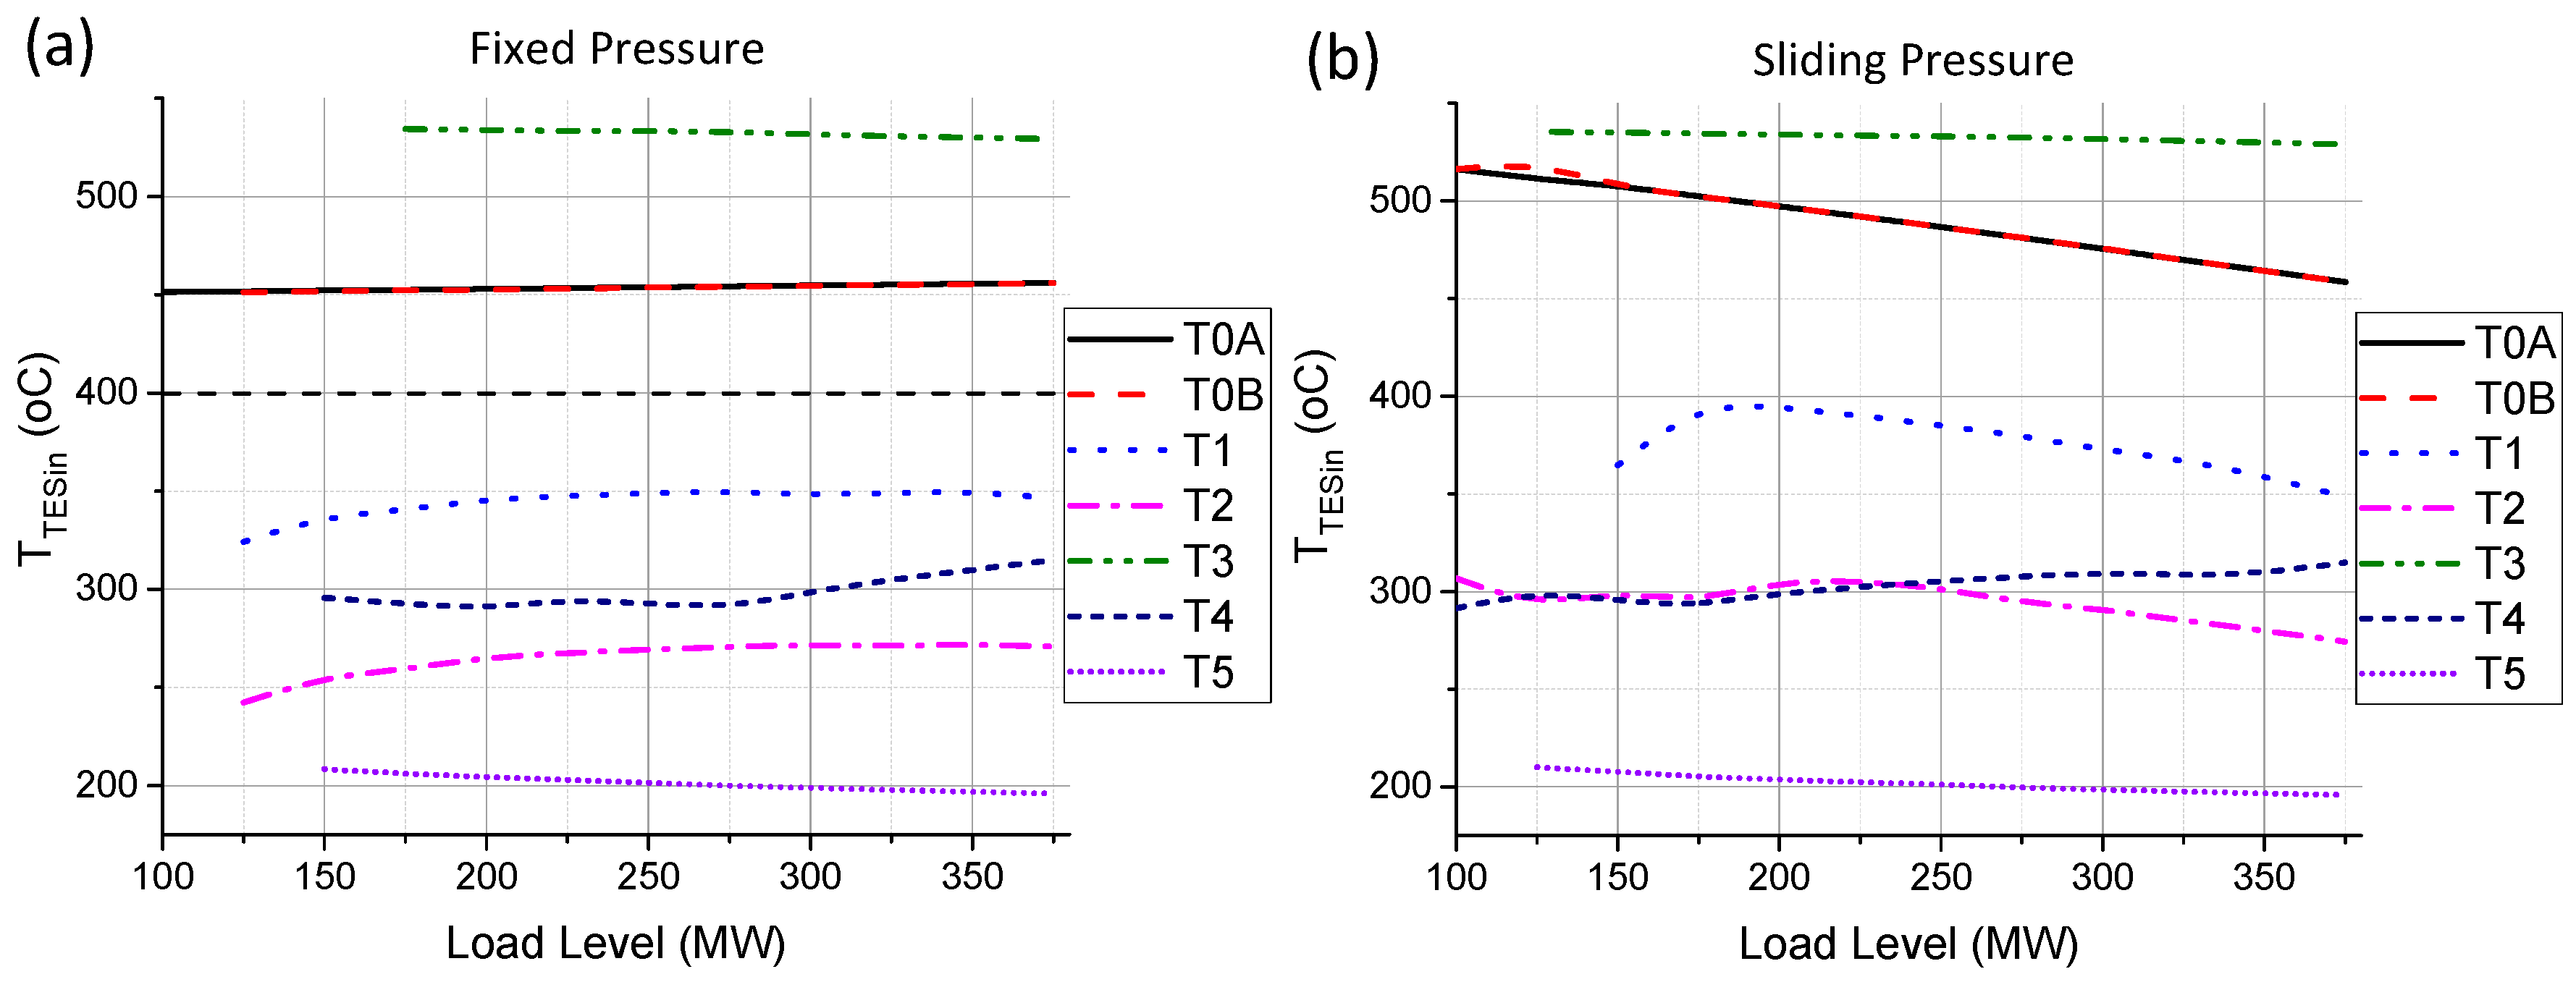
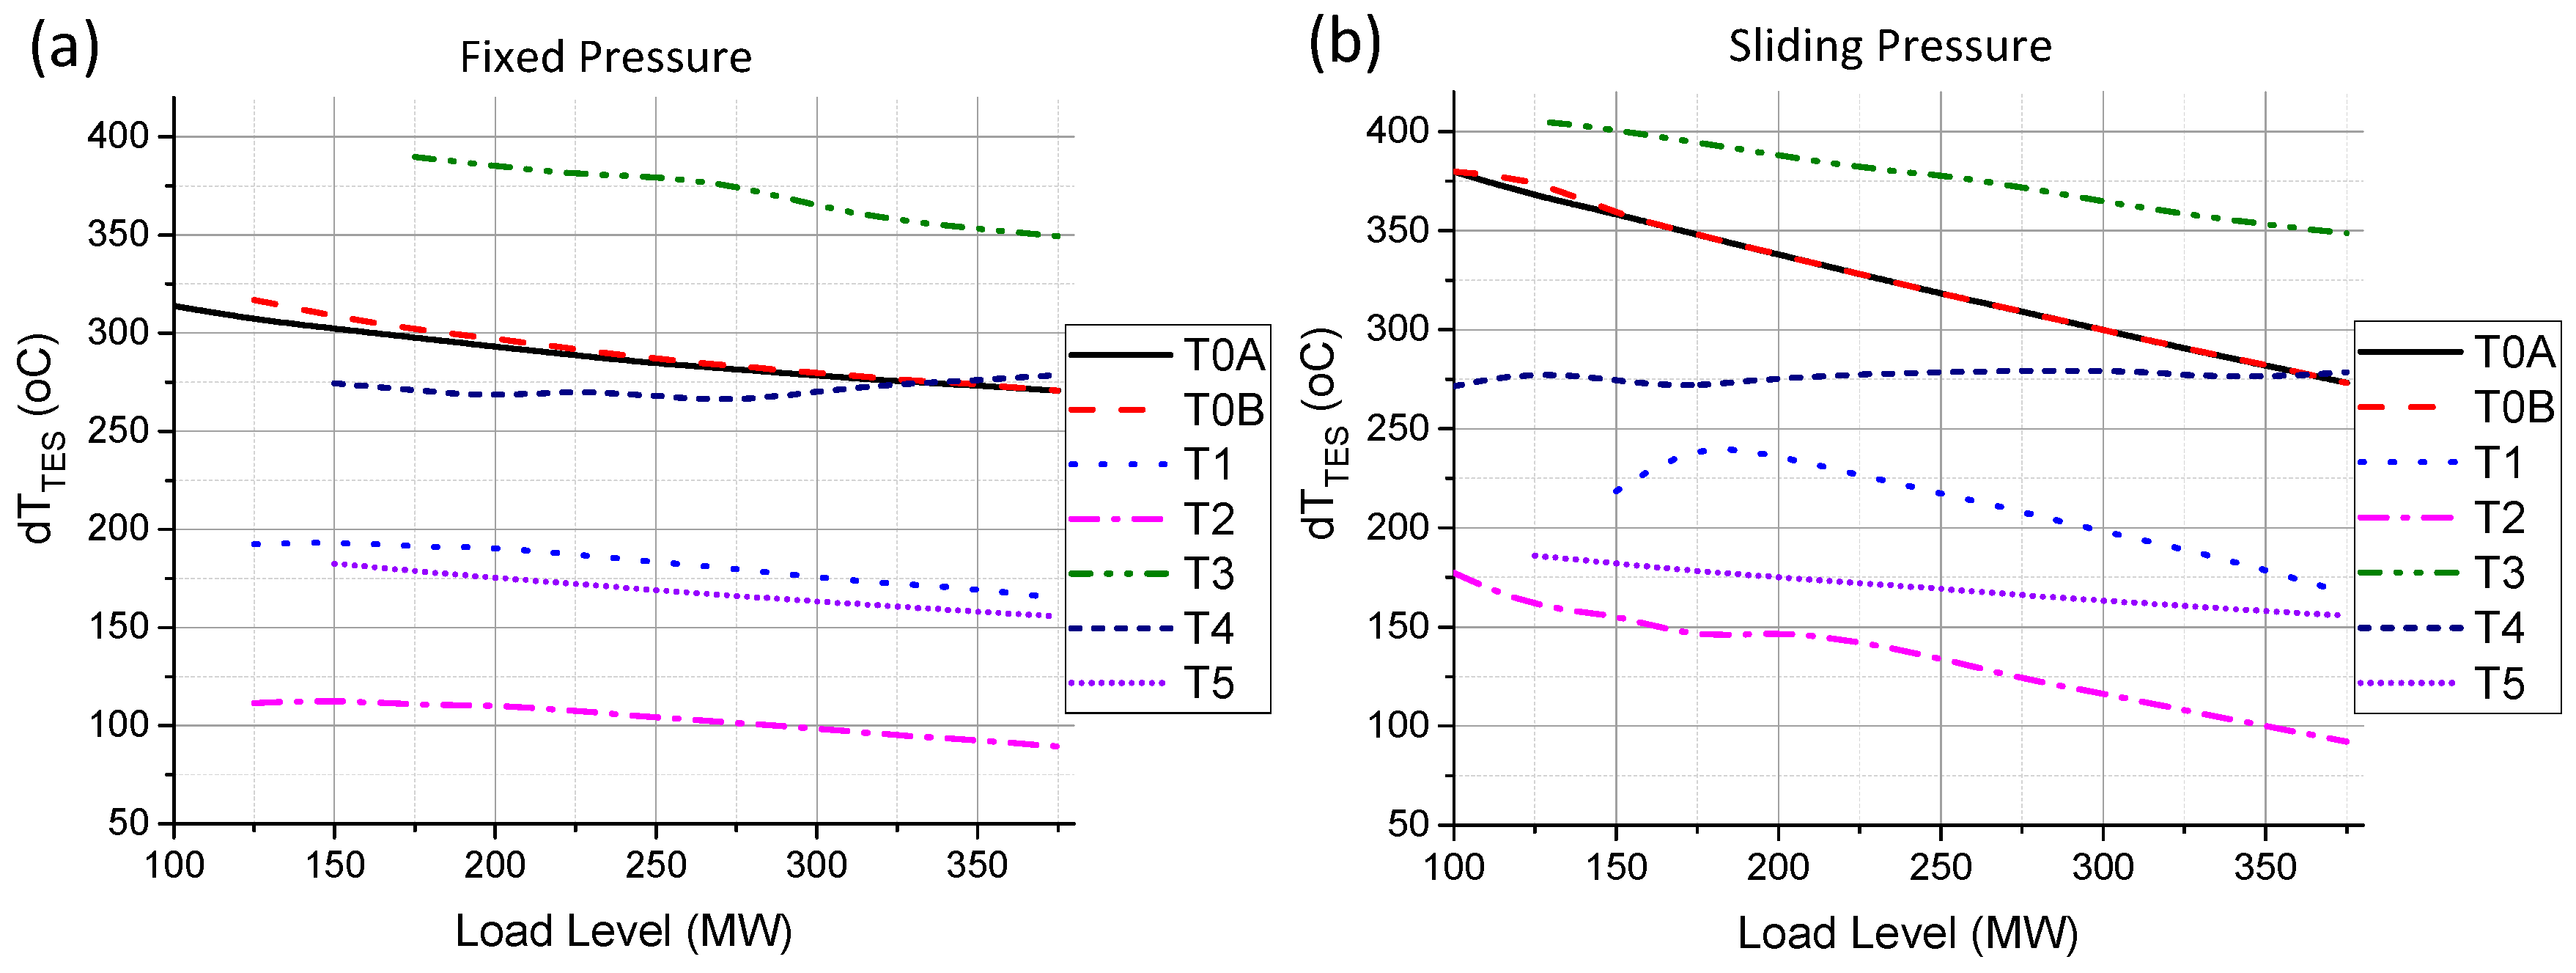
Another important factor in determining a potential TES integration is the superheated stream temperature (
TTESin) entering TES HX in the charging process (
Figure 13). High Temperature Thermal Storage (HTTS) systems require temperature levels above 400 °C [
17,
18,
34], which could be achieved only for extraction points closest to the main steam line and the reheater line: T3, T0A and T0B, respectively. The steam temperature is relatively uniform across the plant load level in FP operation mode. SP mode offers elevated steam temperature for all points located upstream of the boiler reheater due to lower pressure throttling at the TES control valve (up to 70 °C for the lowest load level). TES HX inlet temperature for all points located downstream of the boiler reheater remains at the same level, as the pressure difference between the FP and SP control system modes is marginal.
The results for temperature gradients across TES HX in charging mode are depicted in
Figure 14. To ensure the minimal TES influence of the TES charging process on the plant cycle, the temperature level at the outlet from TES HX equals the temperature level in the device’s discharging point (deaerator or condenser tank). There is a considerable difference between temperature levels in the deaerator and condenser (about 150 °C). SP mode also offers slightly elevated temperatures for all TES charging points located upstream of the boiler reheater.
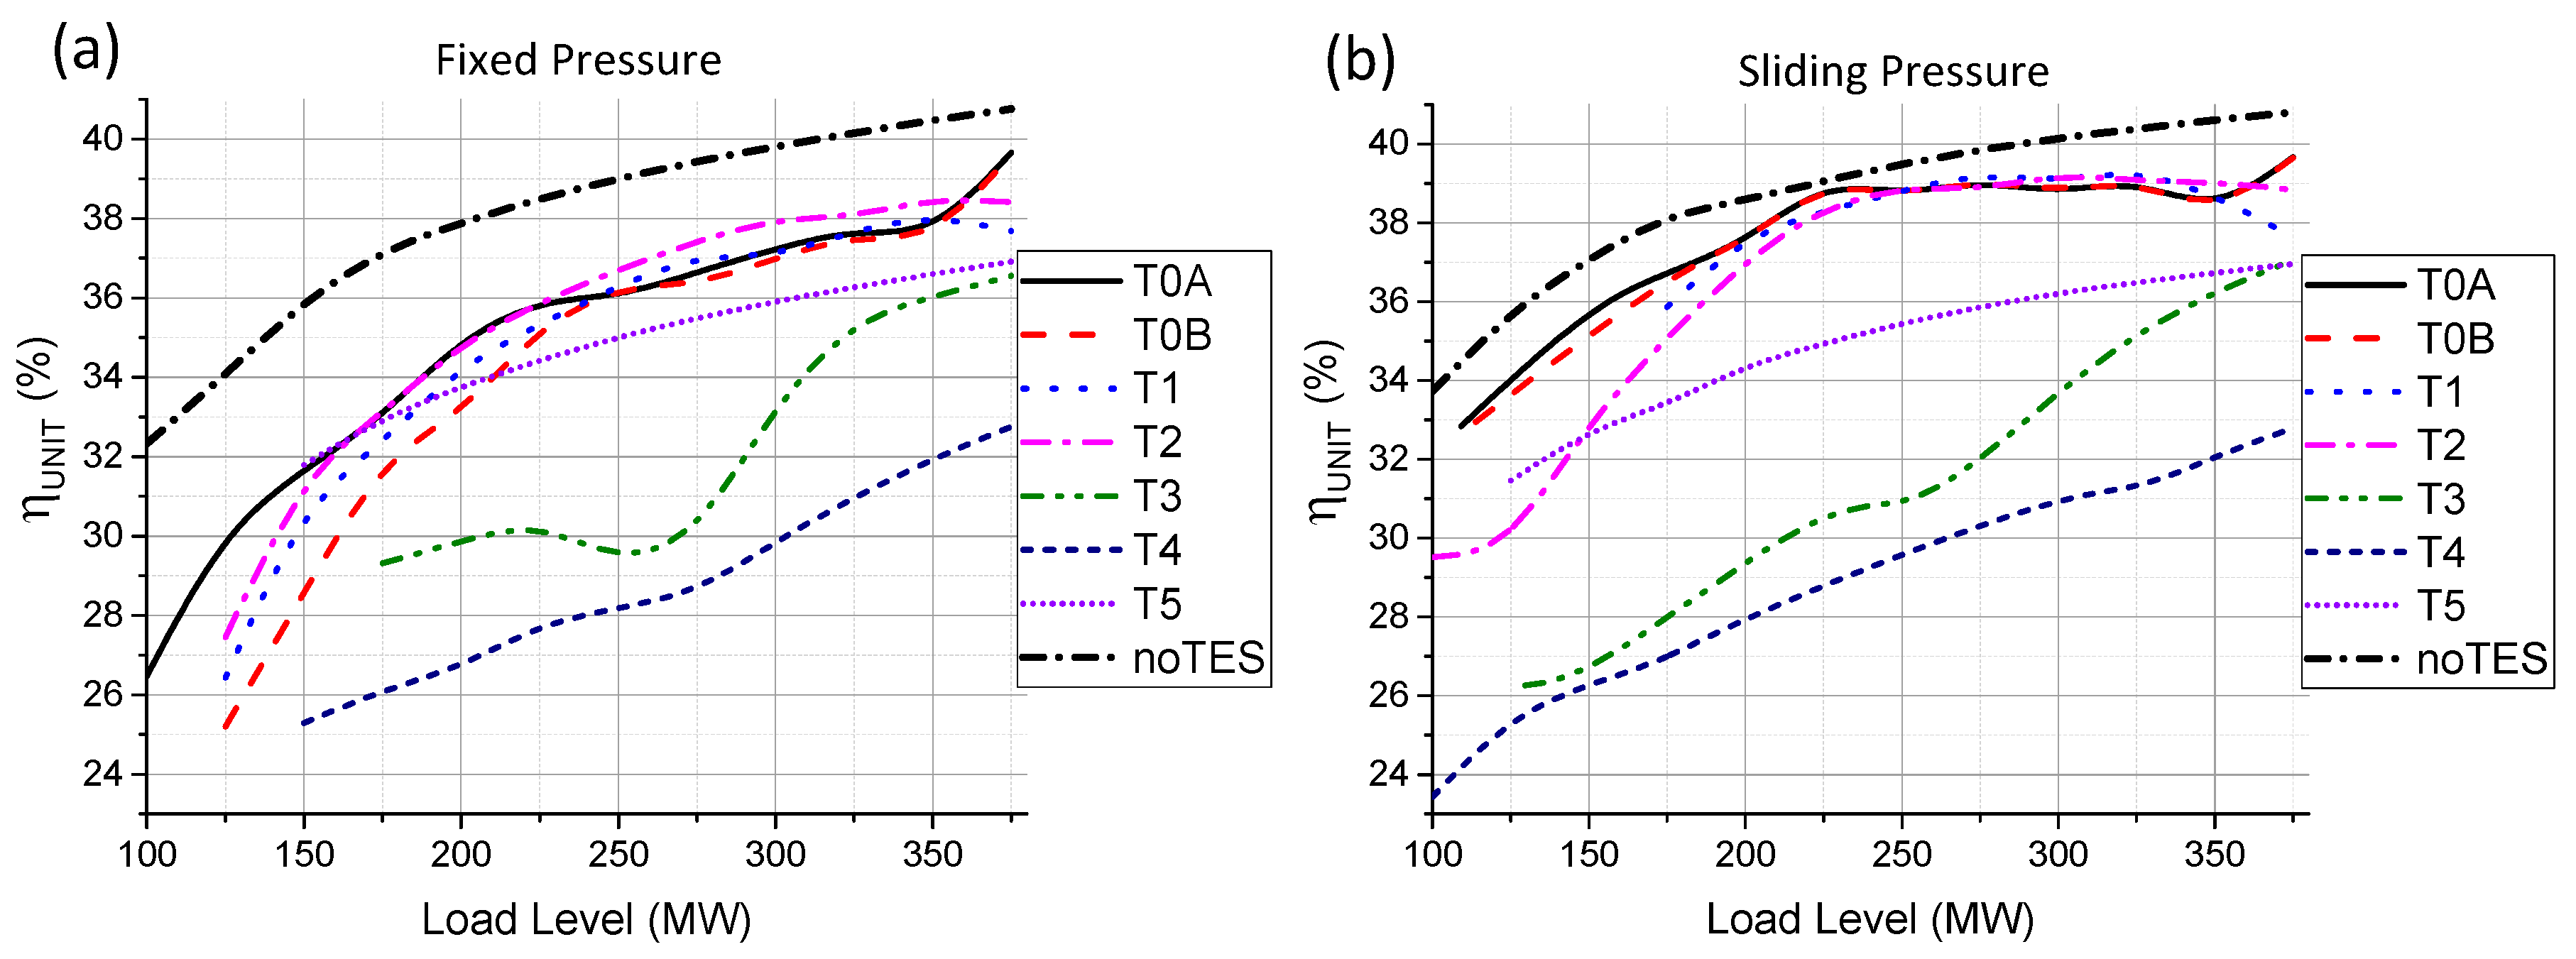
Unit generation efficiency (η
UNIT) during the TES charging process is depicted in
Figure 15. The dash-dotted black line represents the unit efficiency without the TES charging process (no TES). Superheated steam extraction causes the unit efficiency to drop in each examined TES charging case, which is proportional to the power delivered to the TES system (
PTES).
The best candidate point selection for the TES charging process is a multi-dimensional task, and all presented parameters have to be taken into consideration. Taking into account both the benchmark value and the stream temperature (TTESin), the best candidate point for steam extraction in the TES charging process is the boiler reheater outlet (T3) with the peak value of the TES charging power for moderate load levels around 275 MW.
4.2. TES Discharging Process
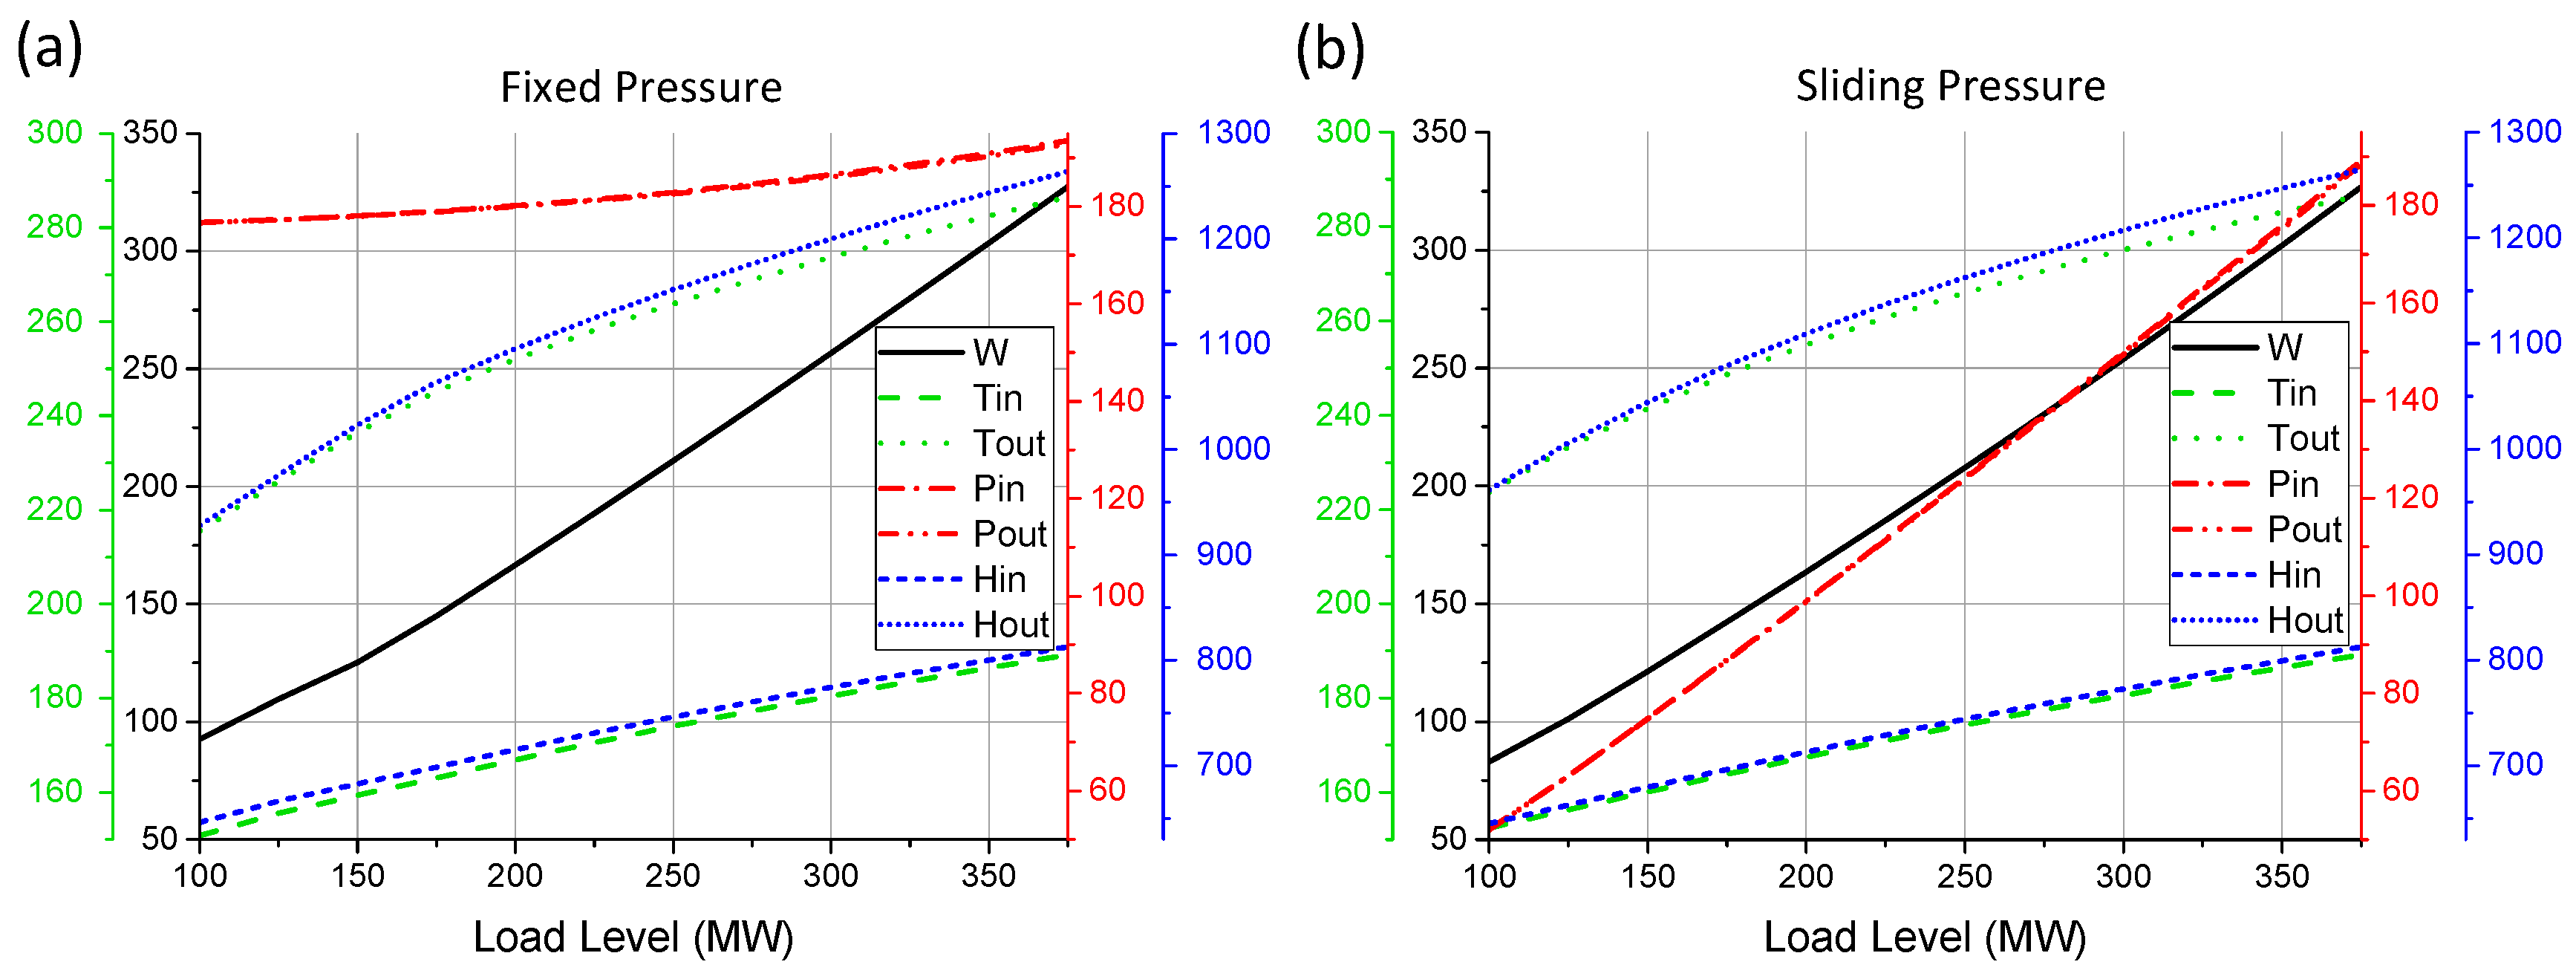
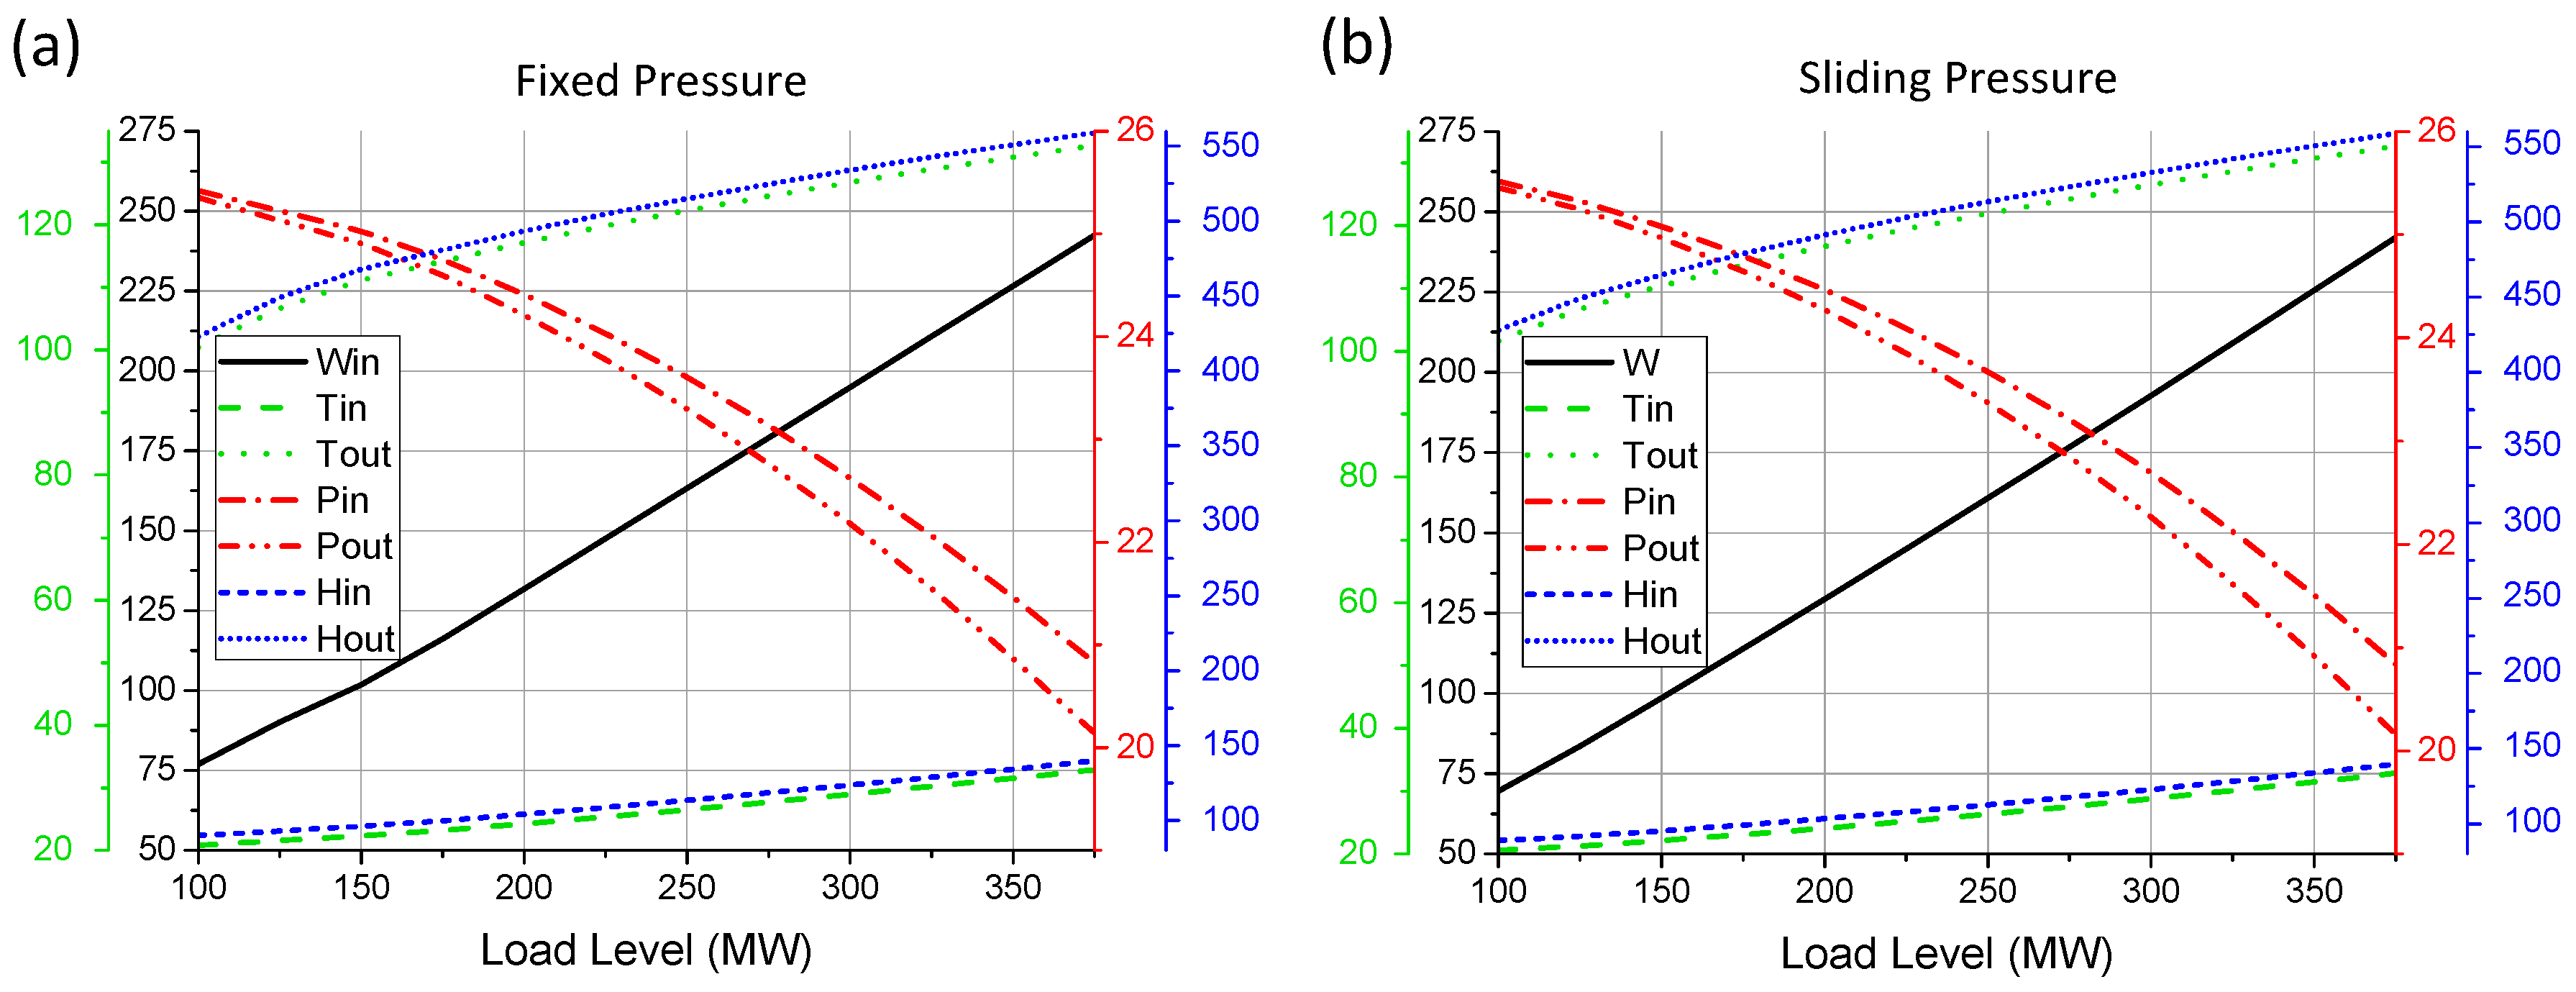
The heat from the TES system should be used by bringing it back into the power plant process loop. During normal power plant operation, a part of the superheated steam from the steam turbine is extracted to feedwater preheaters (HPFP, deaerator and LPFP) for the feedwater preheating process, increasing the efficiency of the cycle at the same time. The heat from TES could be used for the same purpose instead of using the superheated steam from the steam turbine. Steam extraction to feedwater preheaters is stopped during the TES discharging process, and more steam flows through the steam turbine stages allowing for increased electricity generation. In the power plant cycle, there are two possible locations for the TES discharging process. A bypass could be built around LPFP and/or HPFP. Although the deaerator is one of the feedwater preheaters, no bypassing is considered in this case. This component is crucial for the oxygen and other dissolved gas removal processes from the feedwater before entering into the main feedwater pumps. Any negligence in this process could cause serious feedwater pump damage and overall boiler equipment corrosion. Ideal feedwater preheater substitution requires identical feedwater parameters when the heat from the TES system is used instead. LPFP and HPFP feedwater parameters in FP and SP operation modes within the entire power plant load level range are depicted in
Figure 16 and
Figure 17.
LPFP is a 102 MW HX preheating feedwater at 21 bar from 33 to 133 °C (Δ
T = 100 °C) in the designed condition. HPFP is a 148 MW HX preheating feedwater form 189 to 286 °C (Δ
T = 97 °C) at a much higher pressure of 190 bar. As there is no major difference in the feedwater pressure in LPFP between FP and SP operation modes, there is also no difference in feedwater parameters in both modes (
Figure 16). Feedwater mass flow rate and pressure are reduced in SP mode for low load levels, which causes slightly higher feedwater temperature and enthalpy (about 5 °C and 50 kJ/kg, respectively).
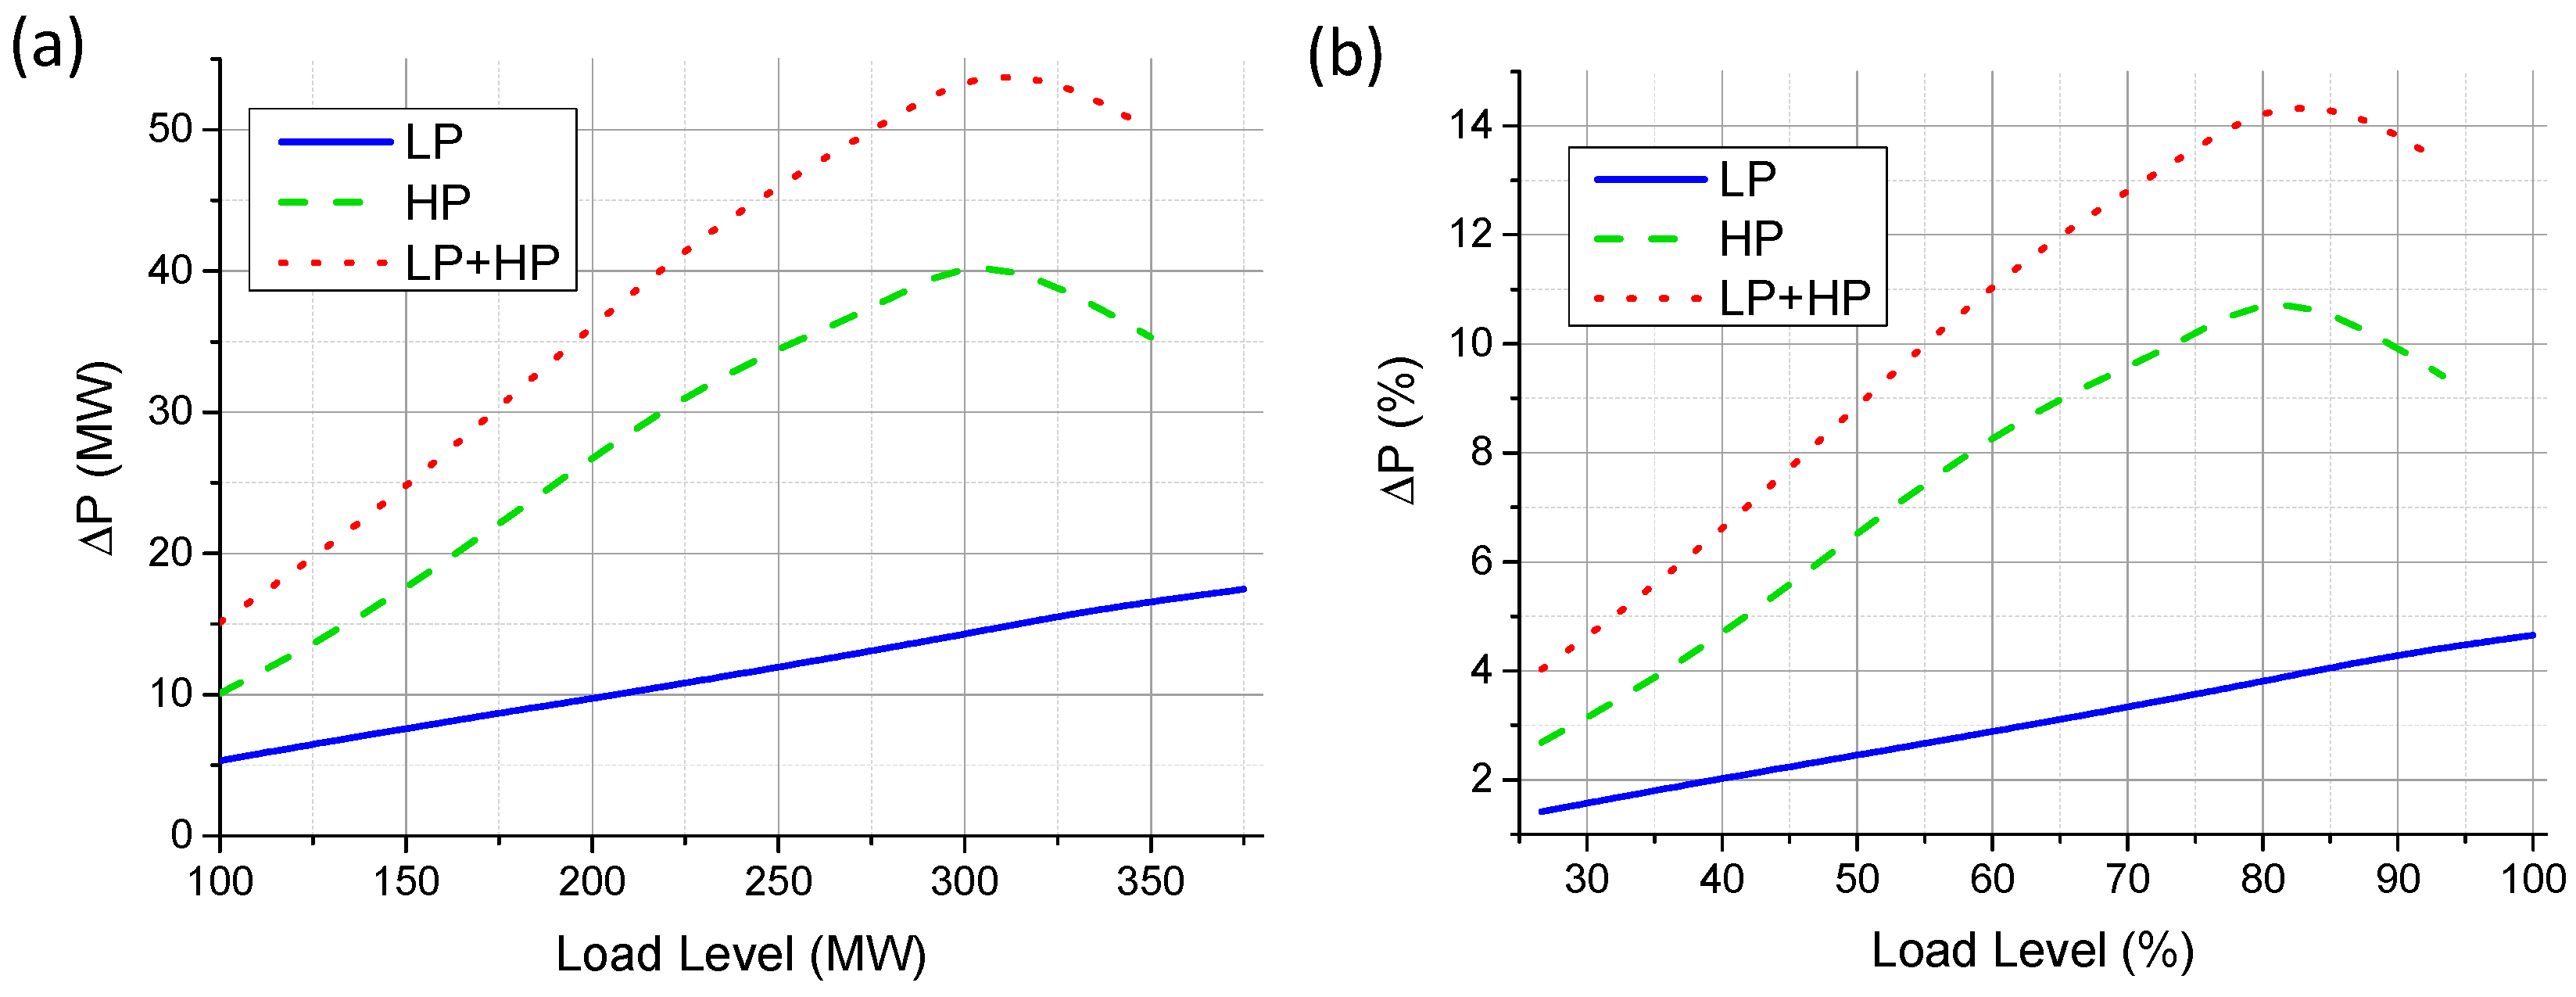
To get the maximum profit from TES integration, it should be possible to reuse the heat from the TES system during peak demand, when the electricity price is at the highest level. The TES system should be able to preheat the feedwater to the designed condition for full load level operation. The power plant capacity increase above the rated value (Δ
P) during the TES discharging process is depicted in
Figure 18. LPFP bypassing allows one to increase the power plant output up to 5% (18 MW) (solid line), and the relation between the power increase Δ
P and load level is linear within the entire load level range. A better result can be achieved for HPFP bypassing, as more steam flows through a higher number of steam turbine stages. The peak value of 11% (40 MW) could be achieved for an 80% load level (dashed line). It is not possible to substitute the HP feedwater preheater for the highest load levels (more than 350 MW), as the model does not work stably. The best result can be obtained with both LPFP and HPFP substitution. The peak Δ
P value is reached for a plant load level around 80% and the maximum possible power output increase up to 14.5% (53 MW) (dotted line). The results confirm that the feedwater preheaters bypassing is feasible for retrofitting, as the maximum power generated from the steam turbine should not exceed 115% of registered capacity [
35,
36].
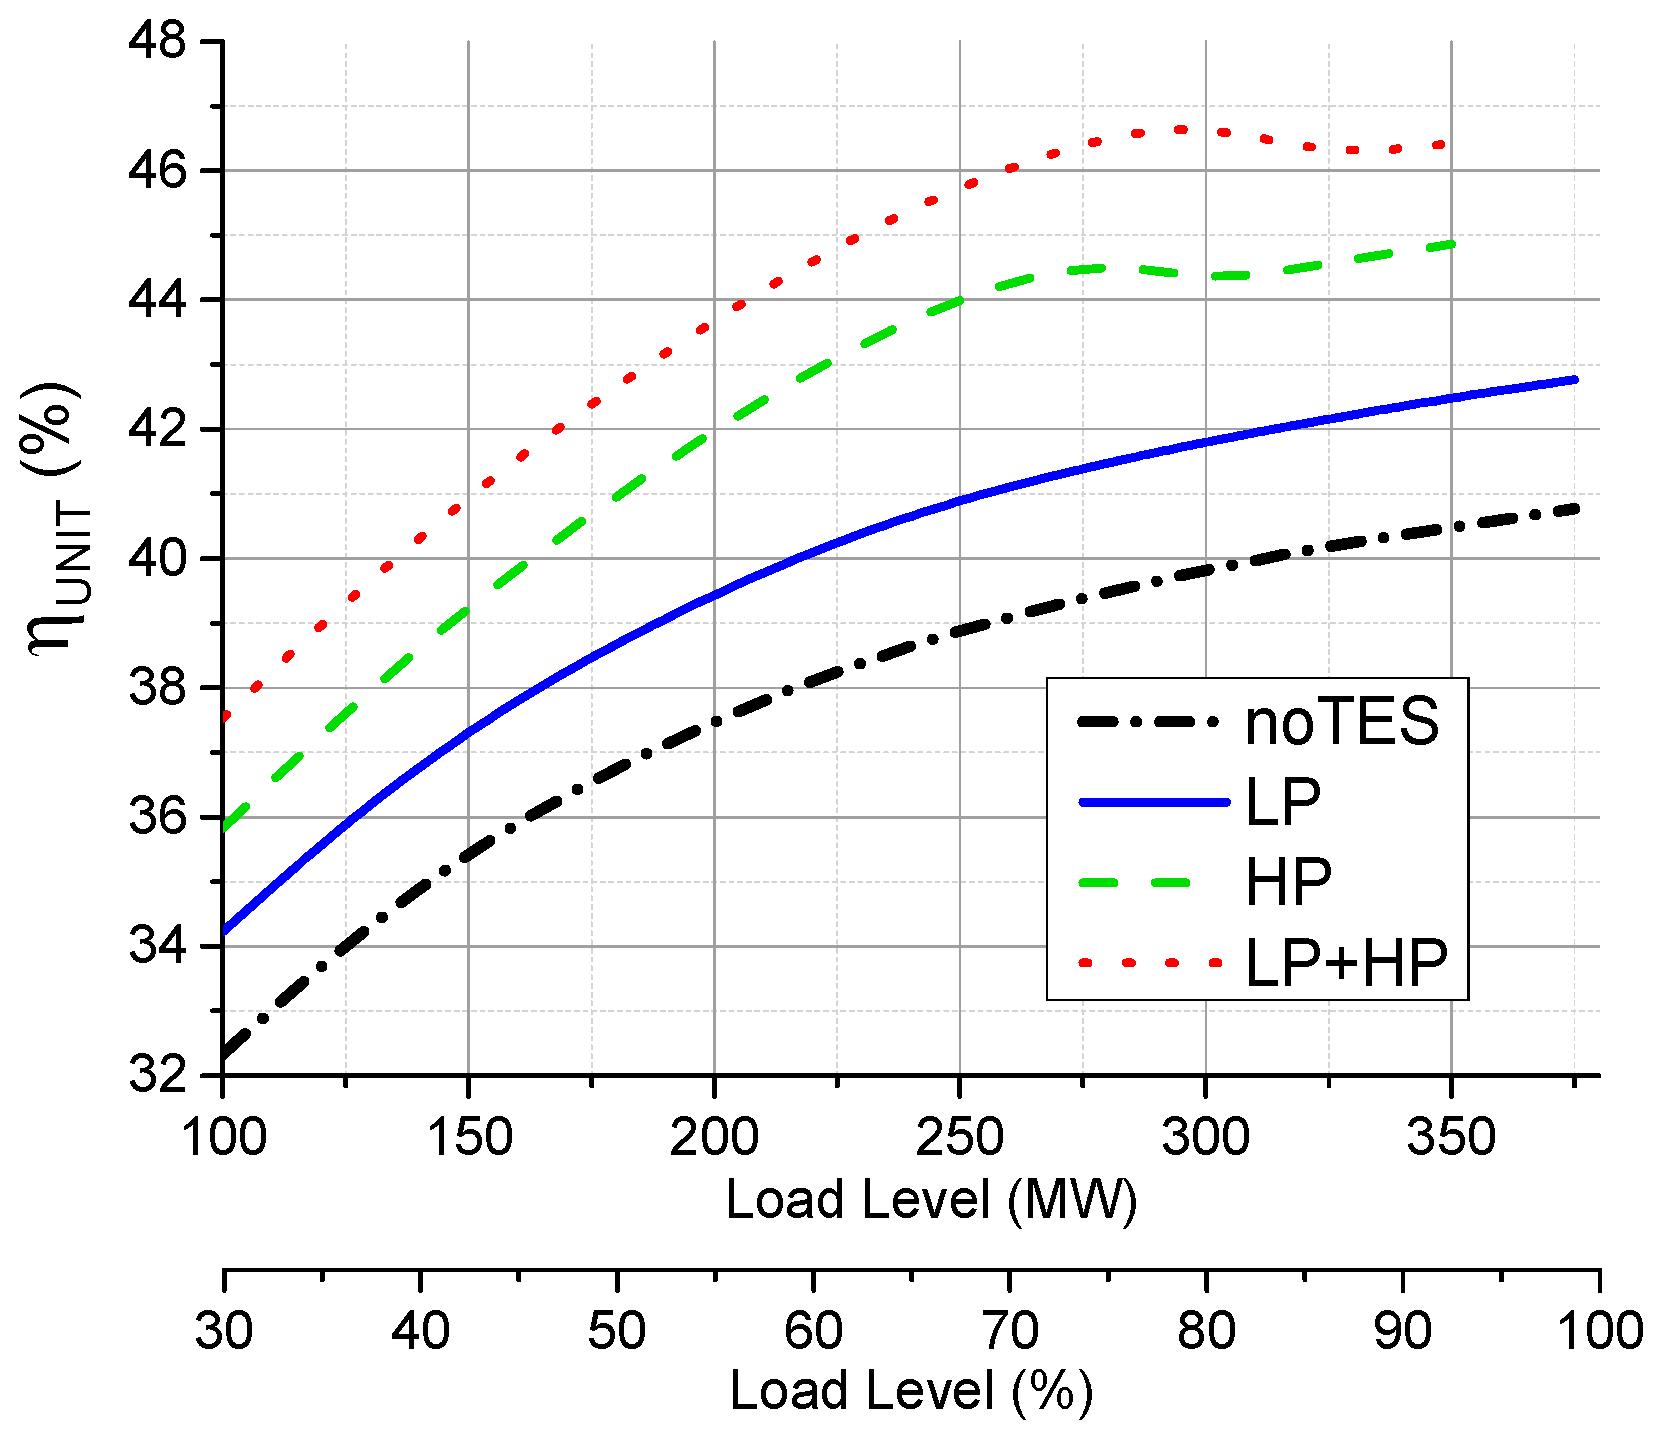
As the power output increases during the TES discharging process, the unit efficiency (
) calculated based on Equation (2) also increases. The simulation results are presented in
Figure 19. LPFP bypassing allows for a 2% efficiency increase in the entire load level range, whereas HPFP substitution allows for a further efficiency increase to the maximum value of 45% for load levels above 75%. The highest available efficiency can be achieved for both HPFP and LPFP bypassing and can reach 47% for load levels above 80%.
The TES discharging process allows one to effectively increase the operational flexibility of the power plant, as it is possible to operate at a lower load factor and to generate electricity with the same efficiency as for the plant designed condition. In the case of LPFP bypassing, the load level could be reduced to 65%, and the unit efficiency is still maintained at the level of 41%. HPFP bypassing allows for further load level reduction down to 47%. HPFP and LPFP bypassing allows for further plant load reduction to 39%.
There are potential limitations in LPFP bypassing, as some of the steam taps can be integrated into the condenser in a way that it is difficult to install any stop valves to cut the steam mass extraction (it is site-specific). Another potential limitation in the HPFP bypassing case emerges from very high feedwater pressure. The HP preheater is located directly downstream of the main feedwater pump, and the feedwater pressure is the highest in the entire steam-water loop (192 bar). It makes the TES HX design difficult and potentially expensive, as it requires thick walls and more material to be used.
4.3. Boundary Conditions for TES Integration in the Plant Process Cycle
Superheated steam extraction for the TES charging process causes the steam and water parameters to change in the plant process loop. The boundary conditions for maximum heat extraction come from several factors. The first one comes from superheated steam temperature deviations at the main steam and the reheater line. This significantly reduces the maximum steam mass flow for all TES charging points located upstream of the reheater outlet. Another restriction comes from physical boundaries, like the maximum pipe diameter delivering steam to the TES system. Furthermore, parameters in the deaerator can change significantly, leading to feedwater deaeration process obstruction. All of these restrictions allow for drawing an allowable plant operational range as a function of the load level for each considered TES point separately. Additionally, to get the highest possible enthalpy difference, the steam condensation process should occur in TES HX. Another important factor that has to be taken into consideration is the steam temperature at the inlet and outlet of TES HX. These parameters will allow one to choose the most suitable type of TES system (sensible, latent or chemical) and make an initial design assessment. All of these factors should be taken into account in the TES charging point selection. Steam and water parameters in the plant process loop can change significantly for different assumptions and different steam/water conditions at the TES HX inlet and outlet points in the charging process.
This feasibility study also defines the requirements for the TES discharging process, as all feedwater parameters are known as a function of the plant load level. It should help to design TES HXs accurately and assess the potential for feedwater preheater bypassing.
5. Conclusions
The feasibility study of TES integration into a conventional power plant cycle performed in this article confirms that the power plant model is able to accommodate the TES system for each considered location with different impacts on the steam-water process loop. Superheated steam extraction for the TES charging process causes steam/water parameters to change in the process cycle allowing one to draw a TES charging operational map. The best location for the TES system should ensure the lowest power penalty dP and the highest TES charging power PTES at the same time. Another important factor is the steam temperature entering TES HX with the highest values reached for charging points located closest to the boiler outlets. Plant pressure control system mode also has a significant influence on the results, as the SP mode offers a wider TES operational range and higher steam temperatures, especially for lower load levels. This is very beneficial as the charging process should occur for the possible lowest load levels. The best candidate point selection for the TES charging process is a multi-dimensional task, and all previously-presented parameters have to be carefully taken into consideration.
Furthermore, the TES discharging process can be successfully applied to the steam-water loop. Both feedwater preheaters could be bypassed, and additional steam mass flow through steam turbine stages allows for increased power generation. The TES discharging process supports power plant generation during the peak load demand, increases unit efficiency and improves overall power plant flexibility. The TES concept also helps to maintain optimum thermodynamic efficiency, allowing the power plant to work closer to its design condition, and increases the power plant component lifetime. Retrofitting, as one of the major assumptions in this paper, is feasible as the steam turbine can accommodate a 15% increase in power generation above the design level. Further work is required to identify a suitable TES system to match the HTF parameters investigated in this work. The TES technology choice will have significant influence on the feasibility of the system integration, as different TES technologies have different constructive, structural and economic implications.


