Article

Voltage-Based Hot-Spot Detection Method for Photovoltaic String Using a Projector

1
Department of Electrical and Electronic Engineering, Kanagawa Institute of Technology, Atsugi 243-0292, Japan
2
Department of Energy and Power Engineering, Yangzhou University, Yangzhou 225000, China
*
Author to whom correspondence should be addressed.
Energies 2017, 10(2), 230; https://doi.org/10.3390/en10020230
Submission received: 30 November 2016 / Revised: 12 January 2017 / Accepted: 1 February 2017 / Published: 15 February 2017

Abstract

:
This paper proposes a voltage-based hot-spot detection method for photovoltaic (PV) string using the projector. Hot-spots form in solar cells at defects causing a high carrier recombination rate, it appears as a high reverse leakage current of p-n junctions when solar cells are partially shadowed. Using this characteristic, authors previously developed a voltage-based hot-spot detection method to quickly identify and characterize the severity of a module hot-spot. However, previous experimental results were shown for just one module. In this paper, experiments are done on plural modules in the string. From the result, this method works effectively for PV string. Correlations among illuminance, load resistance, hot-spot temperature, and risk factor are also discussed.

1. Introduction

Introduced in July 2012, Japan’s feed-in tariff (FIT) policy was famously generous and triggered a surge in solar investment in the country. As photovoltaic (PV) installation density increases, more systems suffer from various failures. According to the failure reports, hot-spot heating accounts for a large proportion [1].
Hot-spot heating occurs when, due to some anomaly, such as shadows on cells, the reduced short-circuit current of affected cells becomes lower than the operating current of the module. This will force affected cells into a reverse bias condition, acting as an internal load, dissipating the power generated by other cells in the form of heat [2]. Figure 1 illustrates an infrared (IR) image of a hot-spot cell. Due to the poor thermal conductivities of cell encapsulation materials, temperatures of 100 °C are easily attained. Such temperatures degrade the optical and mechanical properties of encapsulation material, reducing array performance, and operating lifetime [3]. In severe cases, the melting of interconnections can lead to total failure of the array [4]. Currently, bypass diodes are inserted in antiparallel with the PV cells to counteract the detrimental effect of shading. However, hot-spot heating may still occur even if bypass diodes are built-in. Due to crystal defects, some PV cells may exhibit a large reverse current, even before reaching the breakdown voltage [5,6,7].
Most of the recent methods of hot-spot inspection are based on I-V characteristics and temperature, and these methods are hard to locate hot-spot cells in assembled modules. Besides, it has been pointed out that it is important to classify reverse characteristic of each cell to determine the worst case with respect to the hot-spot heating [8,9,10,11]. Furthermore, compliance with International Electrotechnical Commission (IEC) and/or Underwriters Laboratories (UL) standards only requires 8–10 unit samples during hot-spot testing. The samples used for compliance testing are not representative of the typical product coming off the production line. Based on these considerations, our lab is striving to develop a new hot-spot inspection method which enables us to determine the hot-spot susceptibility of each cell in all modules coming off of the production line.
To achieve this goal, authors previously investigated the hot-spot heating caused by crystal defects and developed a voltage-based hot-spot detection method in the form of a projector which enables identification of defective cells. This method can eliminate the modules with defective cells due to voltage ratio before they are assembled into a system which will hopefully improve the reliability of PV system. However, crystal defects may also appear in normal cells after installation due to various factors. Apparently, it is unrealistic to diagnose the modules by disassembling them respectively. Aiming to avoid this problem and further confirm the practicability of the voltage-based hot-spot detection method, we conducted several real field experiments for the PV string. The experimental process and results will be presented in this paper.

2. Theoretical Background

Before presenting the details of the present study, it will be useful to review the general background associated with cell hot-spot heating. Crystal defects degrade the electrical characteristics of p-n junctions, and, under reverse bias, can act as sites for premature avalanche or Zener breakdown by locally enhancing the electric field. The resulting non-uniform current densities produce hot-spots [3].
As a representative example, we prepared a solar PV module with the purpose of accessing each one of the cells. Figure 2 indicates the reverse leakage current as discrete cells were reverse biased by a power supply of 10 V in a darkened room. The normal cells without defects exhibit a small reverse current. Conversely, defective cells, with a high possibility hot-spot heating arising, consequently present large reverse leakage current. Figure 3 declares the reverse I-V curve of the cells individually. As can be clearly observed in Figure 3, the current of the defect cells has a linear relationship with the reverse load voltage. The cells numbered 6, 24, 26 and 34 demonstrate severe reverse current on the electrical properties. In other words, once a solar cell like No. 6 is reverse biased by any abnormality, its small reverse shunt resistance negates the effect of the bypass diode. The thermal images of defective cells are presented in Figure 4.
Figure 5 is the reverse bias model of a crystalline silicon solar cell. The current flows through the reverse biased solar cell can be expressed as:
I r e v = I R + I s h = I R + V R I r e v R s R s h ,   I r e v = I 0 + V R I r e v R s R s h   I r e v = I 0 R s h R s h + R s + V R R s h + R s
Here, Irev is the reverse current of the solar cell energized at reverse voltage VR, IR is the leakage current of diode, and Rsh is the shunt resistance which is process-induced, caused by grown-in defects of the material. Either the saturation current of silicon diode I0 increases or Rsh decreases, the reverse current Irev increases [5].
As a microcosmic explanation, the existence of a partially crystal defect region, on the surface or inside the PV cells, abates the lifetime and accelerates the recombination rate of carriers (electrons and holes) inside these regions. Short carrier lifetime is more prone to cause soft breakdown even under low voltage. Generally, the presence of a high recombination rate has two origins [12,13,14]. The first is the production of crystal defects on the surface of the solar cell during manufacturing, which results in high carrier recombination at the surface, another origin is when a carrier is trapped and recombines in a crystal defect lattice within the semiconductor. For explanation purposes, the first case can be expressed by following equations:
U s u r f = p n n i 2 1 / S p ( n + n 1 ) + 1 / S n ( P + P 1 ) ,   S p = 1 τ p V p N t ,   S n = 1 τ n V n N t
Here, ni is intrinsic density (1/cm3); Sp and Sn are surface recombination velocity (cm/s); τp and τn are hole and electron lifetime (s); vp and vn are hole and electron thermal velocity (cm/s); Nt is trap density (1/cm3); p1 and n1 are hole and electron density when energy level Et of the recombination center and Fermi level Ef are matched. The other case can be explained by Equation (3):
U S R H = p n n i 2 τ p ( n + n 1 ) + τ n ( P + P 1 )
Considering the theoretical formula for recombination, the reverse leakage current JR is given by the sum of the diode saturation current JO and the generation current JG produced by recombination of the carriers. It is described as Equation (4):
J R = J O + J G ,   J G = q ( U ) d x
U means total recombination rate (sum of Usurf and USRH) that occurs in cells. According to Equations (1)–(3), when the carrier lifetime (τp and τn) is shortened by crystal defects, the recombination rate U increases and the leakage current component in the reverse direction JR raises.
Figure 6 is the equivalent circuit of a solar module. IA is the short circuit current of shaded cell in cluster A, and IB is the short circuit current of the cell of cluster B. Figure 6a shows the case without shadow, IA = IB and the module output current ipv flows through cluster A and B. The bypass diodes are all OFF. When partial shadows are added in cluster A, the characteristics of the respective clusters are different, and IA < IB. In Figure 6b, when the hot-spot cell is shaded, its small shunt resistance negates the effect of the bypass diode, the output current ipv of the solar module is smaller than IA, and the same operation as in the Figure 6a is obtained. The operation efficiency is decreased and a hot-spot arises. When the normal cell is shaded as in Figure 6c, due to its large reverse shunt resistance, ipv becomes larger than IA, the current of cluster A becomes short circuit current IA as shown in the figure. As a result, the bypass diode of cluster A turns ON, and the difference current between ipv and IA flows through it. The bypass diode of cluster B is still OFF. Therefore, only cluster B generates power and the hot-spot is prevented by the bypass diode. Based on these physical phenomena discussed above, a voltage-based hot-spot detection method is developed, and it enables to inspect defective cells in PV module. This method will be discussed in the following sections.

3. Proposed Voltage-Based Hot-Spot Detection Method

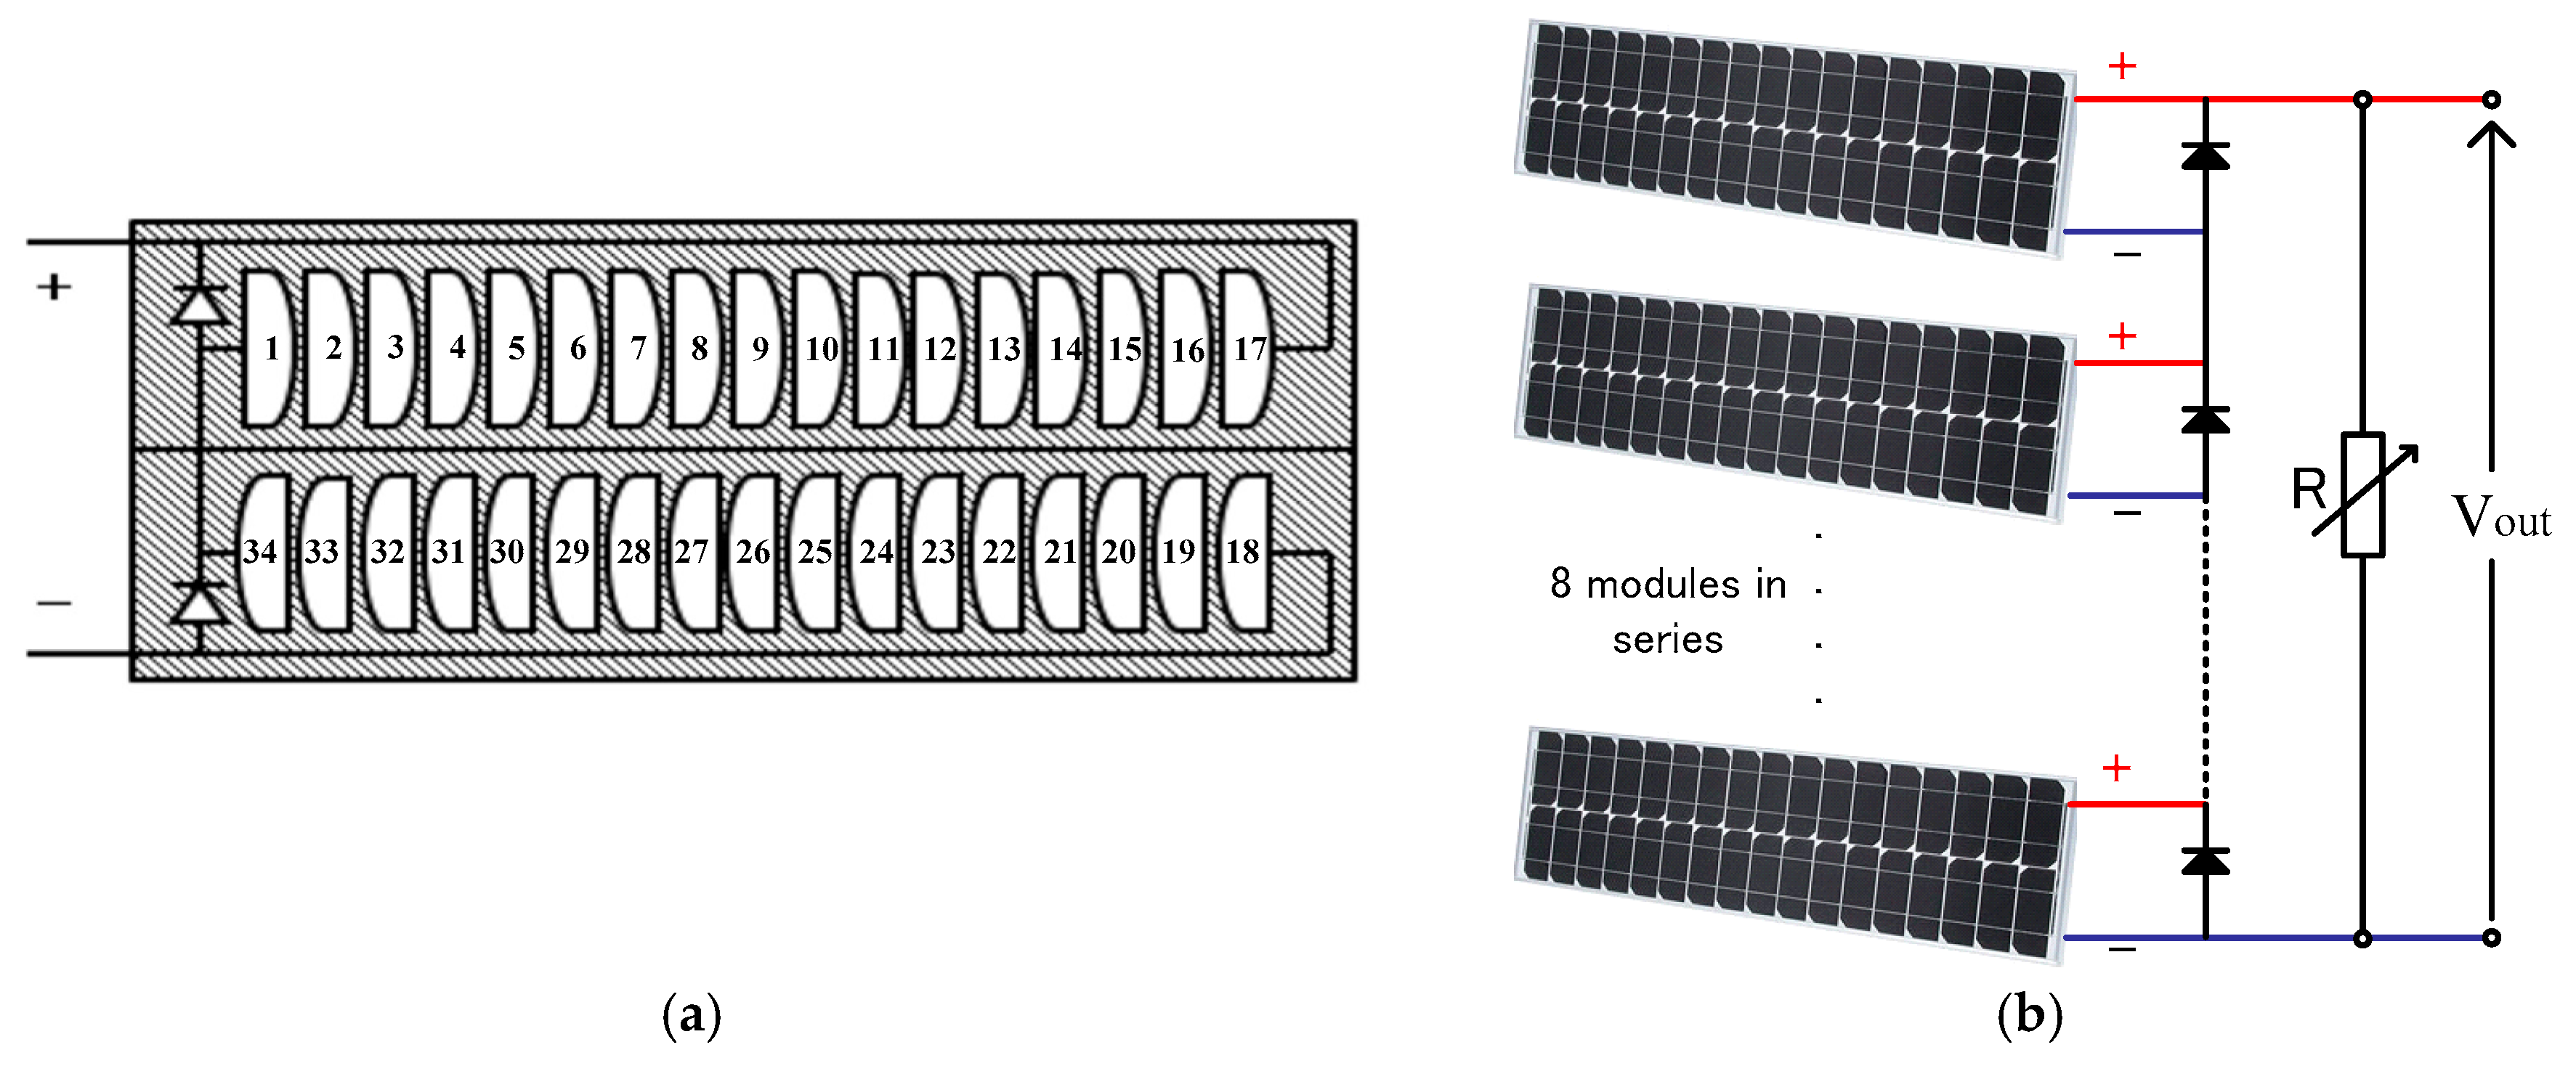
3.1. Specification of Experimental Module

Electrical scheme of a PV module is exhibited in Figure 7a. It is a single-crystal silicon PV module with two series associated groups, each of them made up of 17 cells and a by-pass diode. We consider the PV string scheme as shown in Figure 7b. The string is composed of a series of eight identical modules. Table 1 shows the specification of it at 25 °C, air mass (AM) 1.5, 1000 W/m2.

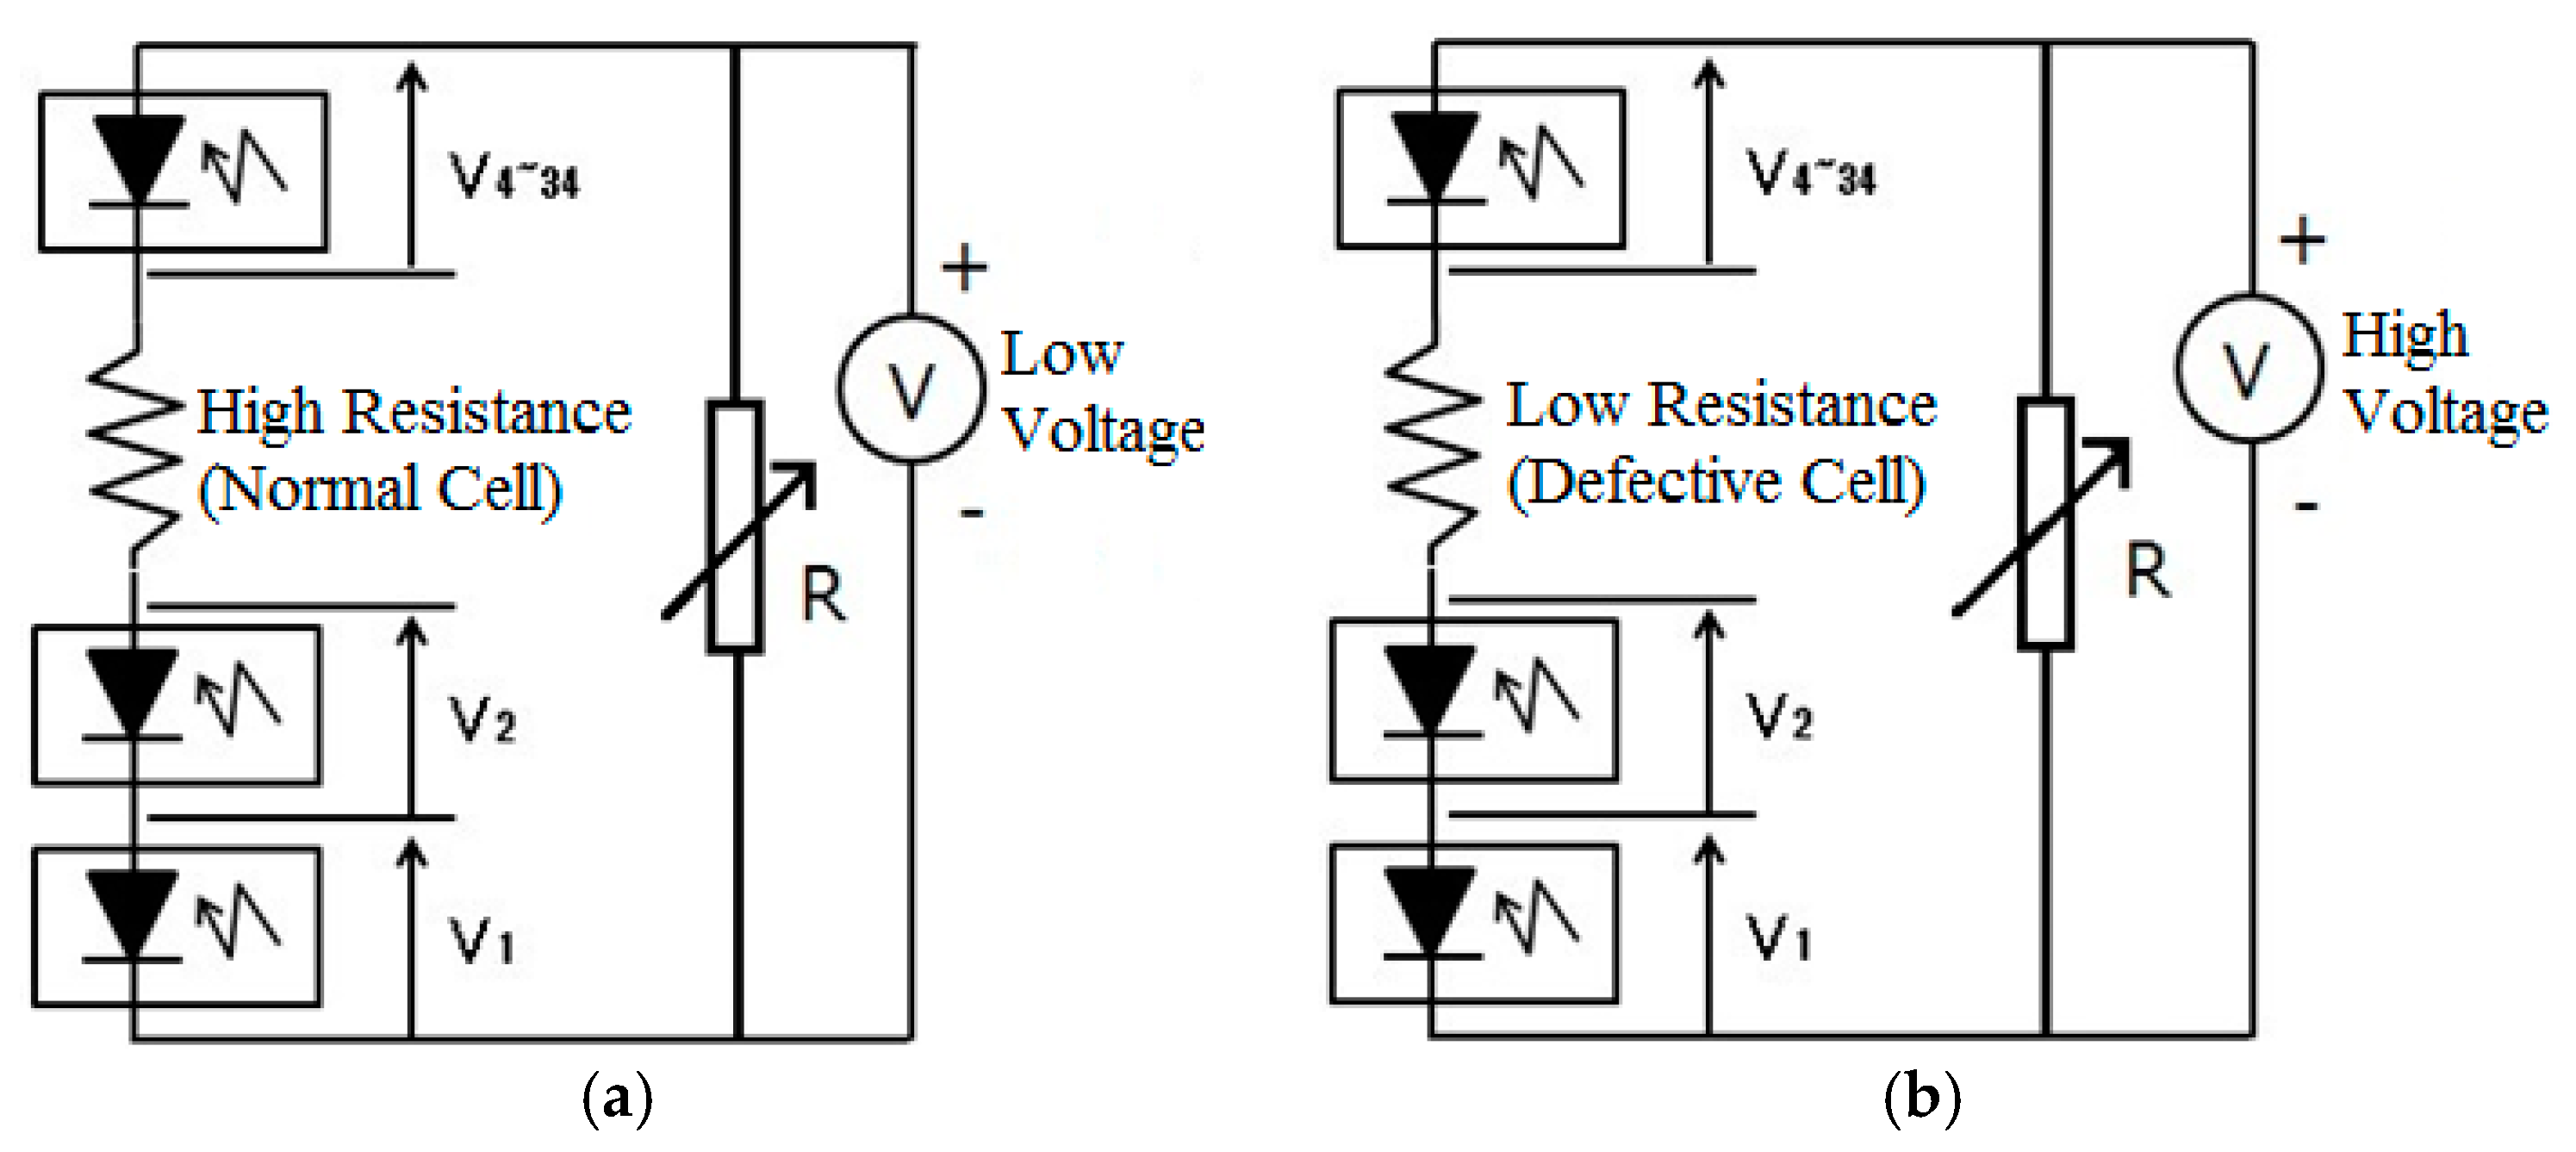
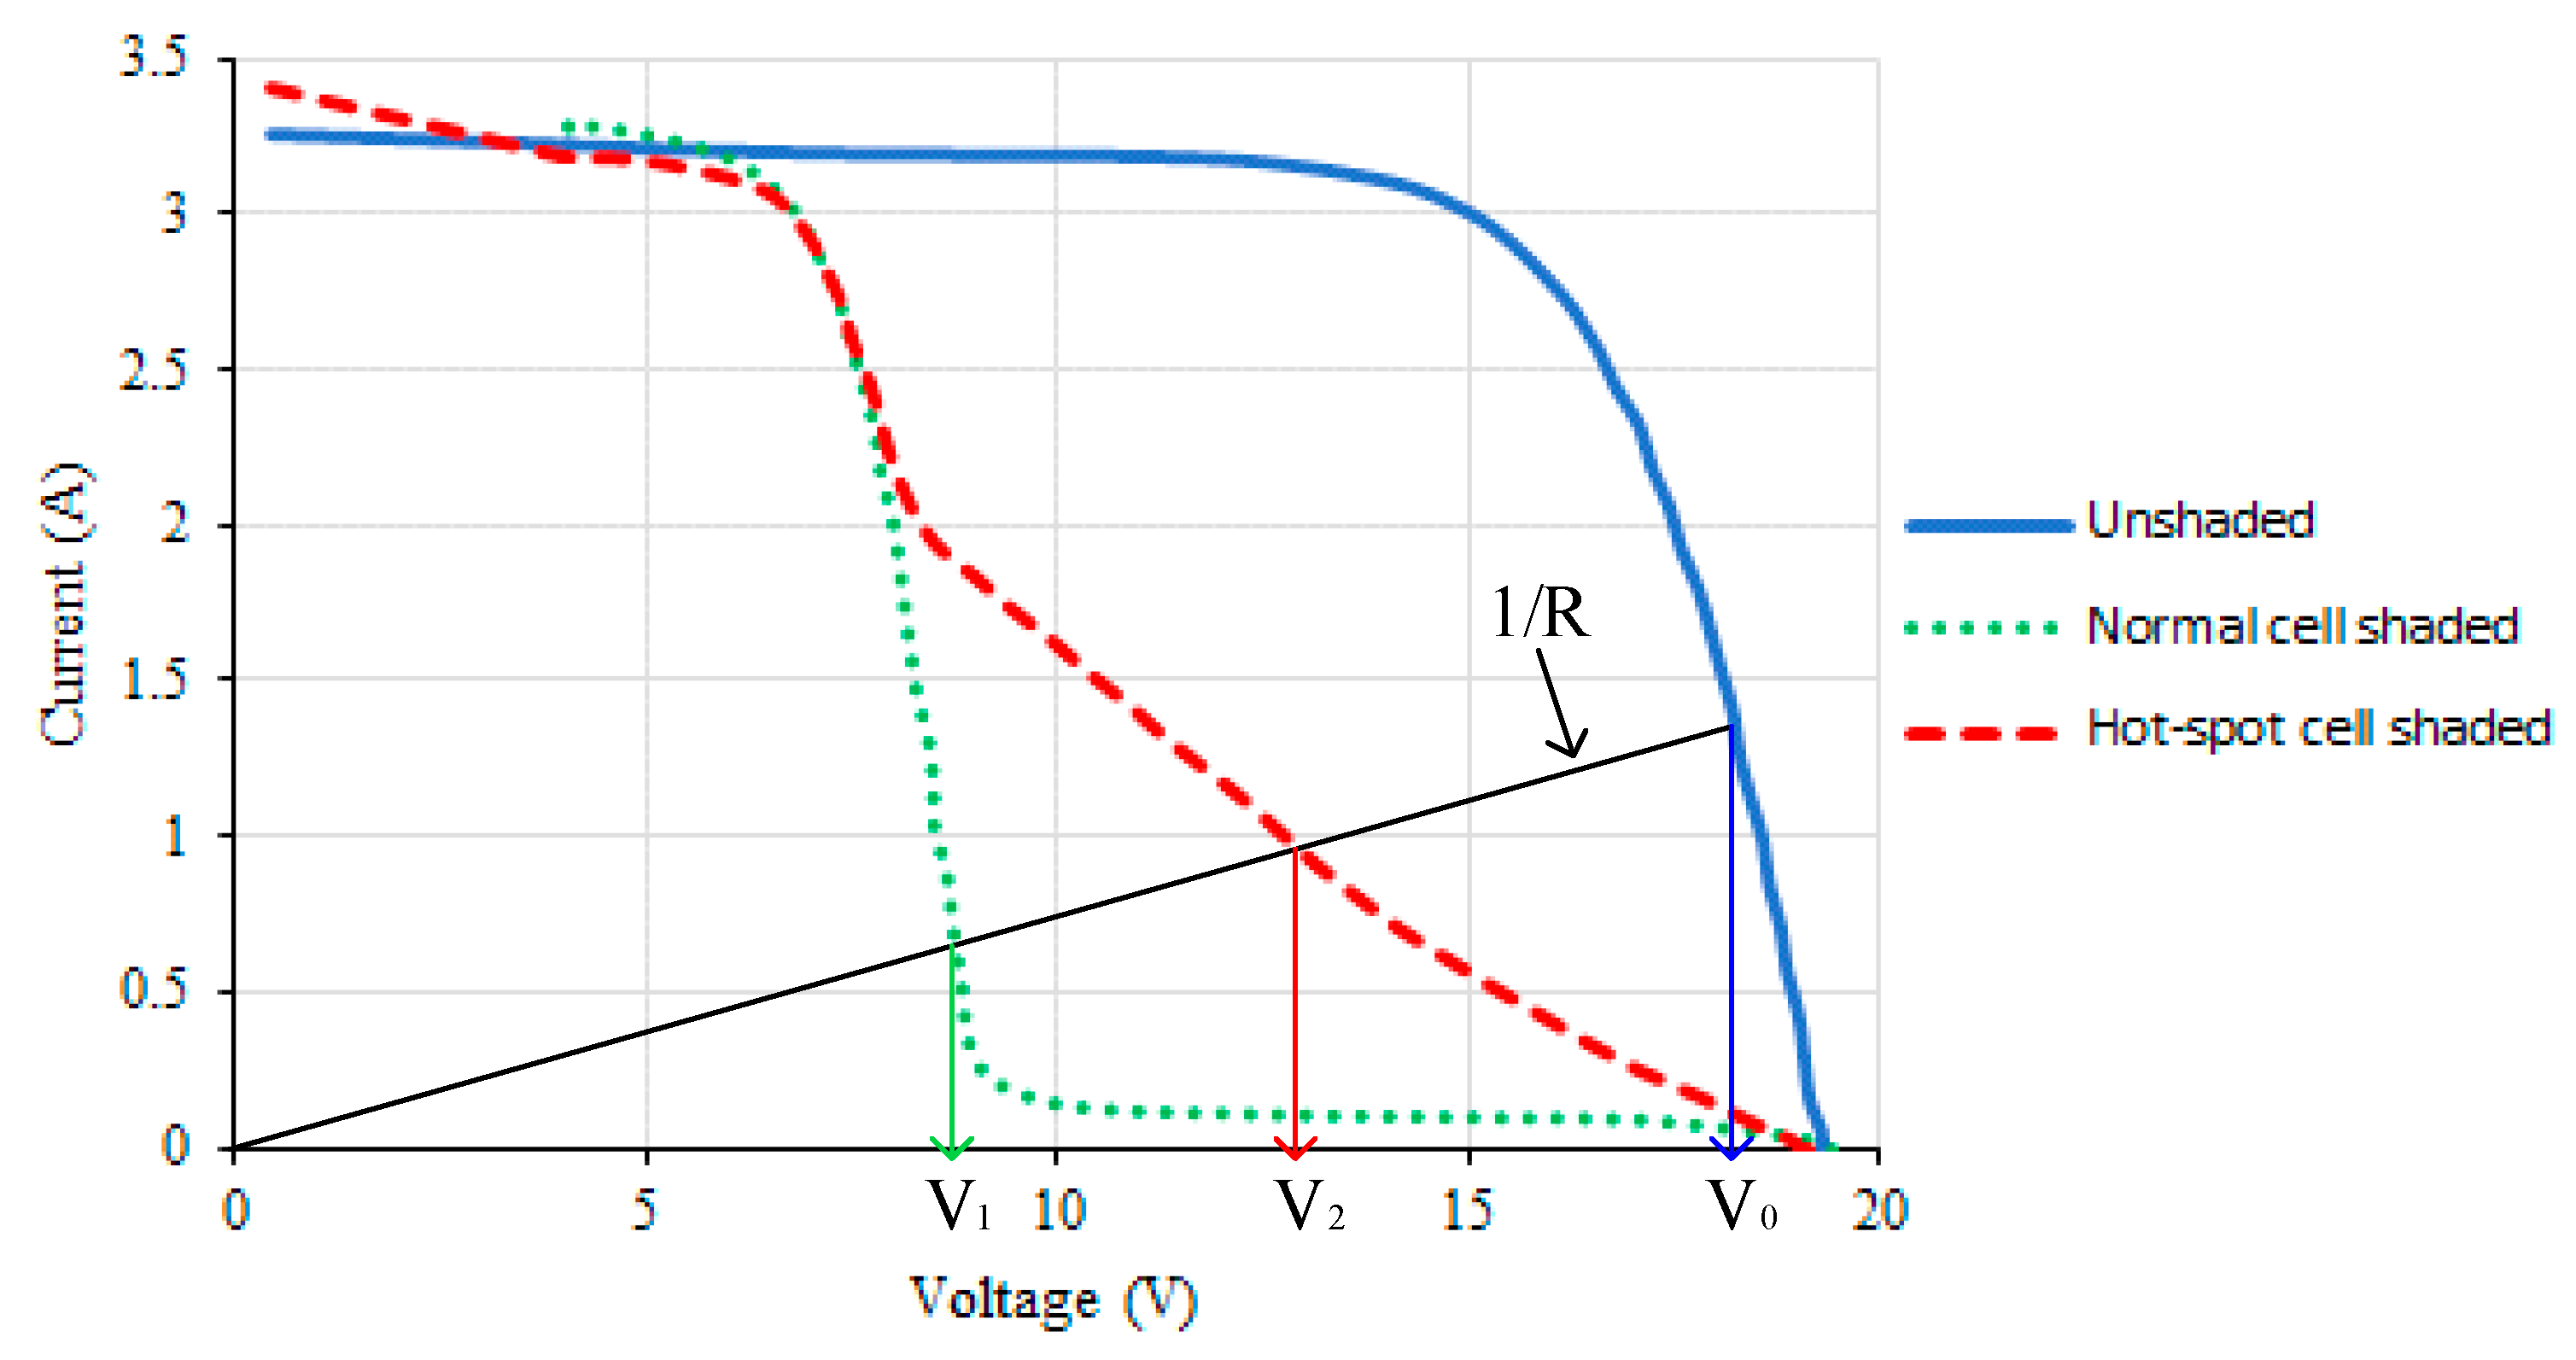
3.2. Detection Theory

In a general way, the reverse current of crystalline silicon solar cells originates in cell defects and impurity center in the materials and can be represented by a shunt resistance. As complete solar modules are normally packaged after manufacturing, it is impractical to electrically isolate each cell from its circuit and subject it during each of the test runs to reverse bias by DC supply individually. We apply a projector to create dark and illuminated regions on the surface of the solar PV module so that the power generated by illuminated solar cells shall energize at the shaded one. Due to the low radiation intensity of the projector light source, the short circuit current is too low to detect (approximately 30–50 mA), measuring the short circuit current directly will result in large errors. However, the open circuit voltage is still relatively large, even under low light intensity. The equivalent circuit of voltage-based hot-spot detection is shown in Figure 8. The shadowed normal cell behaves as a diode with large reverse resistance, as well as the defective cell can be regarded as a low resistor.
Figure 9 presents the I-V characteristics of normal cell shaded condition and Defective cell shaded condition to better understand the theory. V0 is the reference voltage of load resistor without shadow. Since the shaded normal cell becomes p-n junction diodes with high shunt resistance, the voltage share of the resistor R is low (V1). Meanwhile, shunt resistance of the shaded defective cell is relatively low, so that the resistor R shares much higher voltage (V2). Accordingly, the current of the defect cells has a linear relationship with the reverse load voltage, the voltage share ratio between the defective cell and resistor R is generally stable.

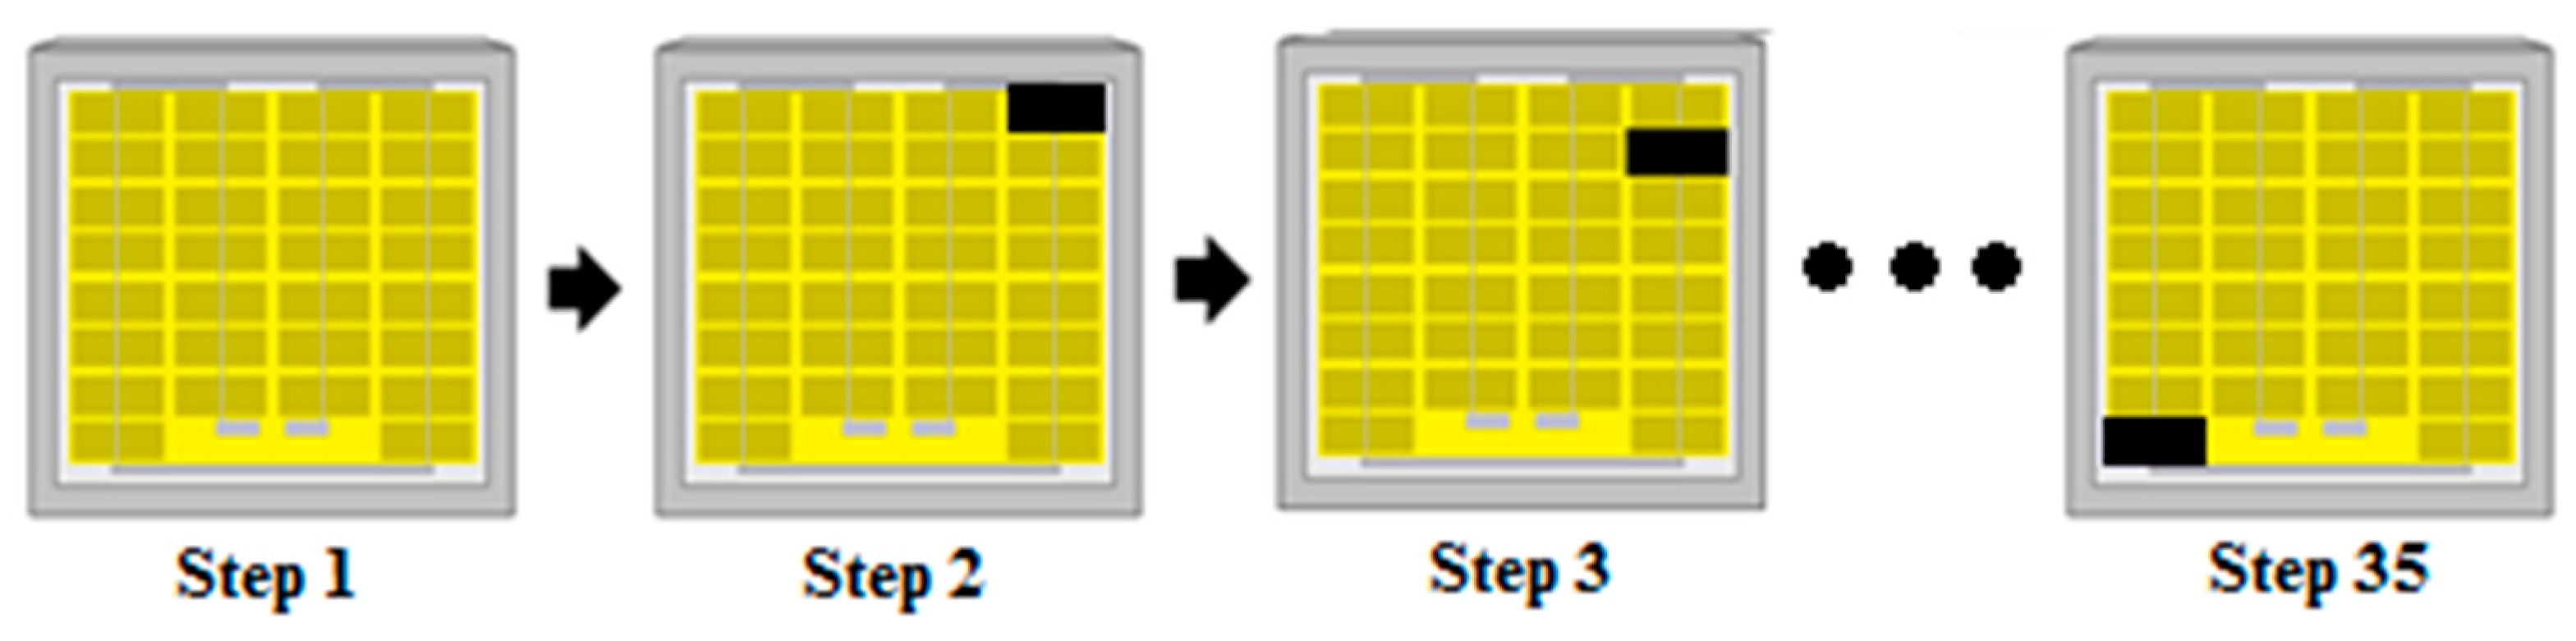
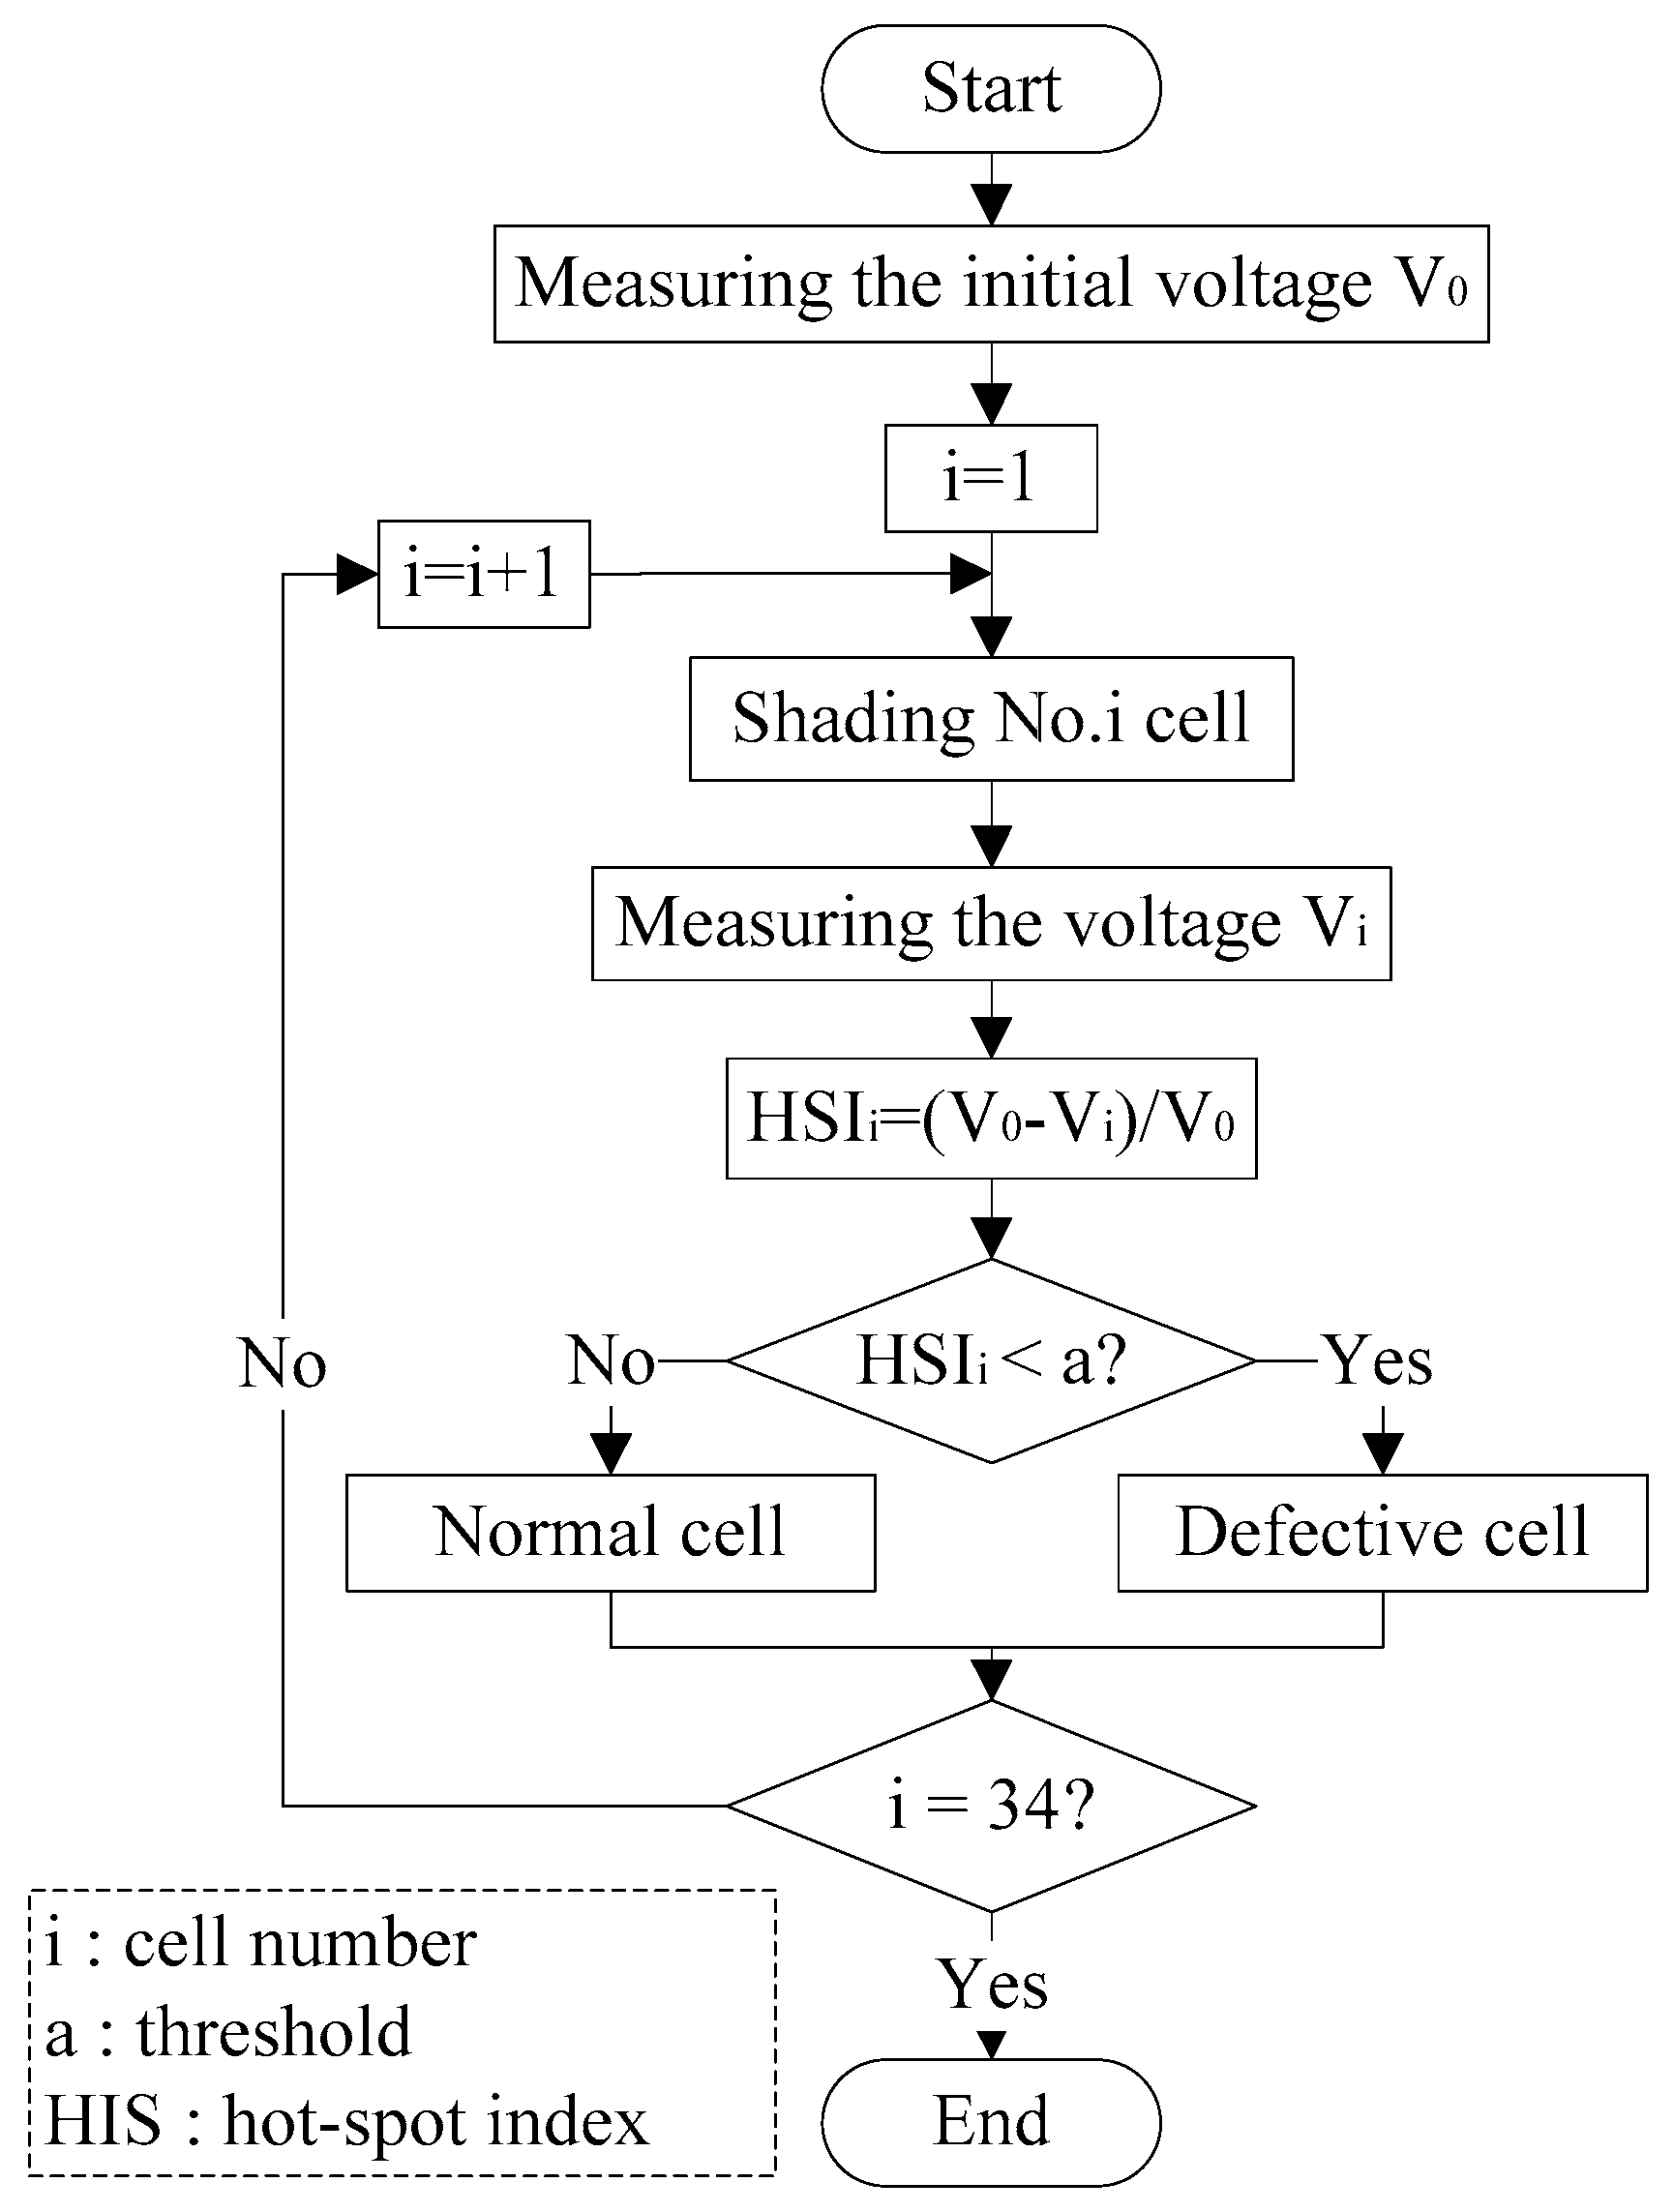
3.3. Operating Procedure

The detection is started with illuminating an entire module by the projector. Afterward, variable resistor R is adjusted to an appropriate value. Then the projector displays the animation as shown in Figure 10 on each module individually. The initial voltage value V0 is measured when the module is fully illuminated as Step 1 in Figure 10. Next, each cell is partially shadowed successively for 5 s to measure another voltage parameter, Vi. Therefore, the risk factor Hot-Spot Index (HSI) of the voltage-based hot-spot detection method is defined as Equation (5):
H S I i = V 0 V i V 0
As described in Section 3.2, when one defective cell within a series of PV cells is shaded, its low value of the shunt resistance will originate a large voltage share Vi in resistor R. In other words, if the HSI of a cell comes out extremely low, it means this cell is high possibly defective. The flow chart of the detection is represented in Figure 11.

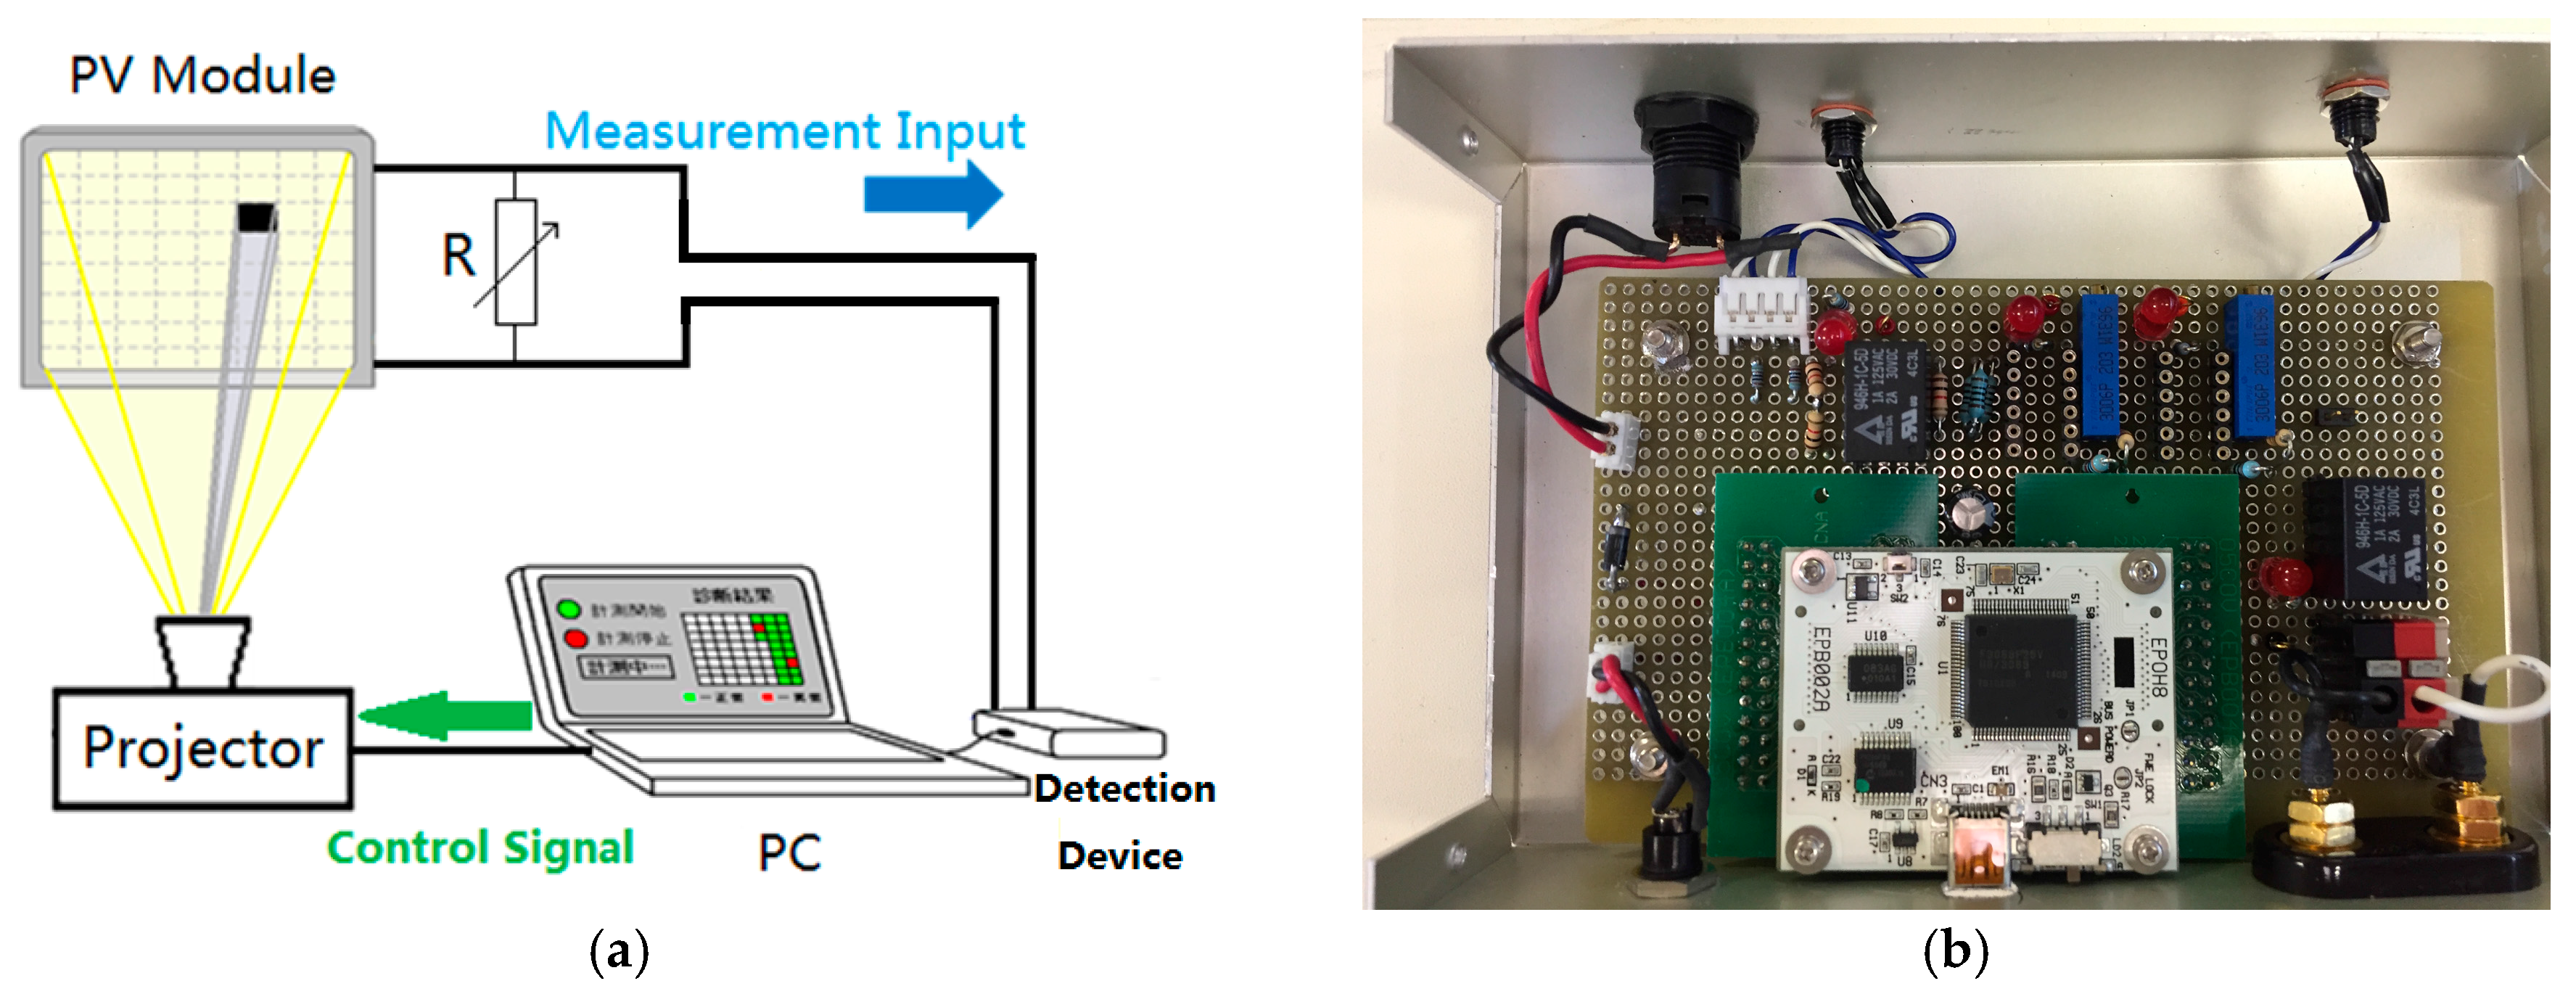
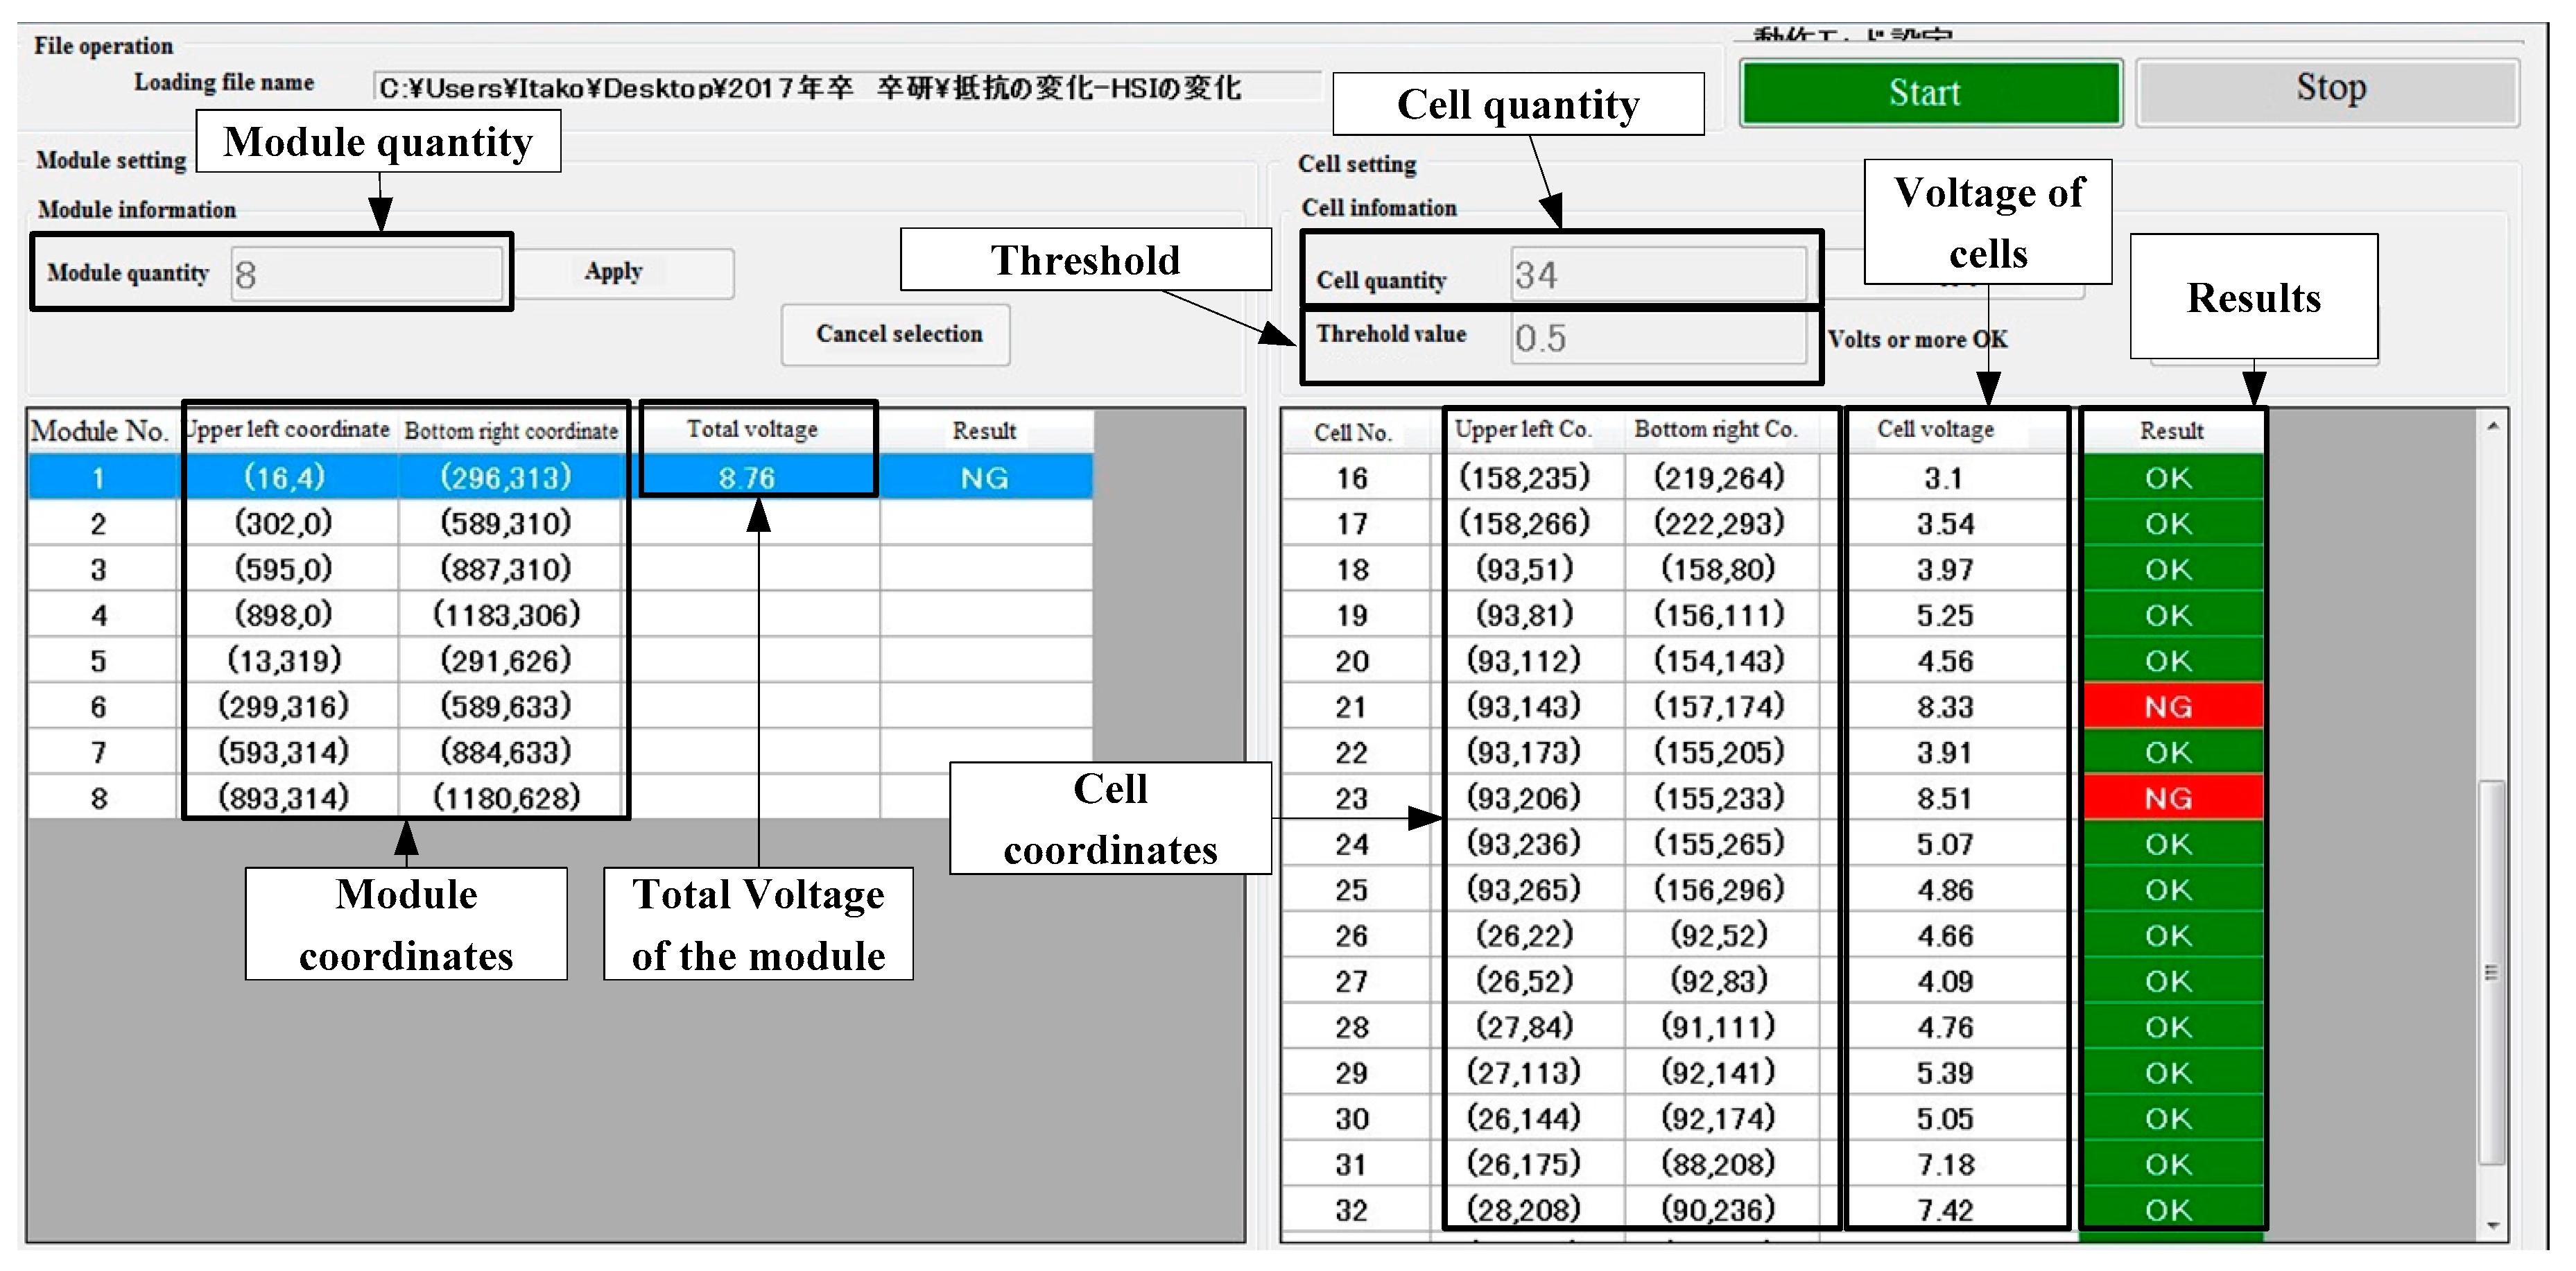
3.4. Proposed Voltage-Based Hot-Spot Detection System

Our lab developed a detection system to conduct the experiment automatically. As shown in Figure 12a, the experimental system for detection consists of two units working simultaneously: the projector system displaying the animation to create the dark and illuminated regions on the surface of the solar PV module and the measurement system to detect the voltage of resistor R.
Figure 12b is the prototype of the developed detection device, it acts as an analog-to-digital (ADC) converter measuring the voltage of resistor R and transferring it into personal computer (PC). The projector and detection device are controlled and coordinated by monitor software called Solar Check inside a PC. Its interface is shown in Figure 13. Quantity of modules and cells and threshold of detection can be set inside the software due to the specification of each PV system. To create the shadow, we can locate each specific module and cell by entering the coordinates. Data from the detection device is processed and represented in the software, too. The detection result is displayed directly on the right side of the interface in green OK or red No Good (NG). Figure 14 is the picture of the real field detection for the PV string.

4. Results

Based on the detection method described above, several sets of experiments are performed to investigate the correlations between load resistance, illuminance, and HSI. The relationship between HSI and hot-spot temperature is also discussed using thermal camera. Results are described as follows.

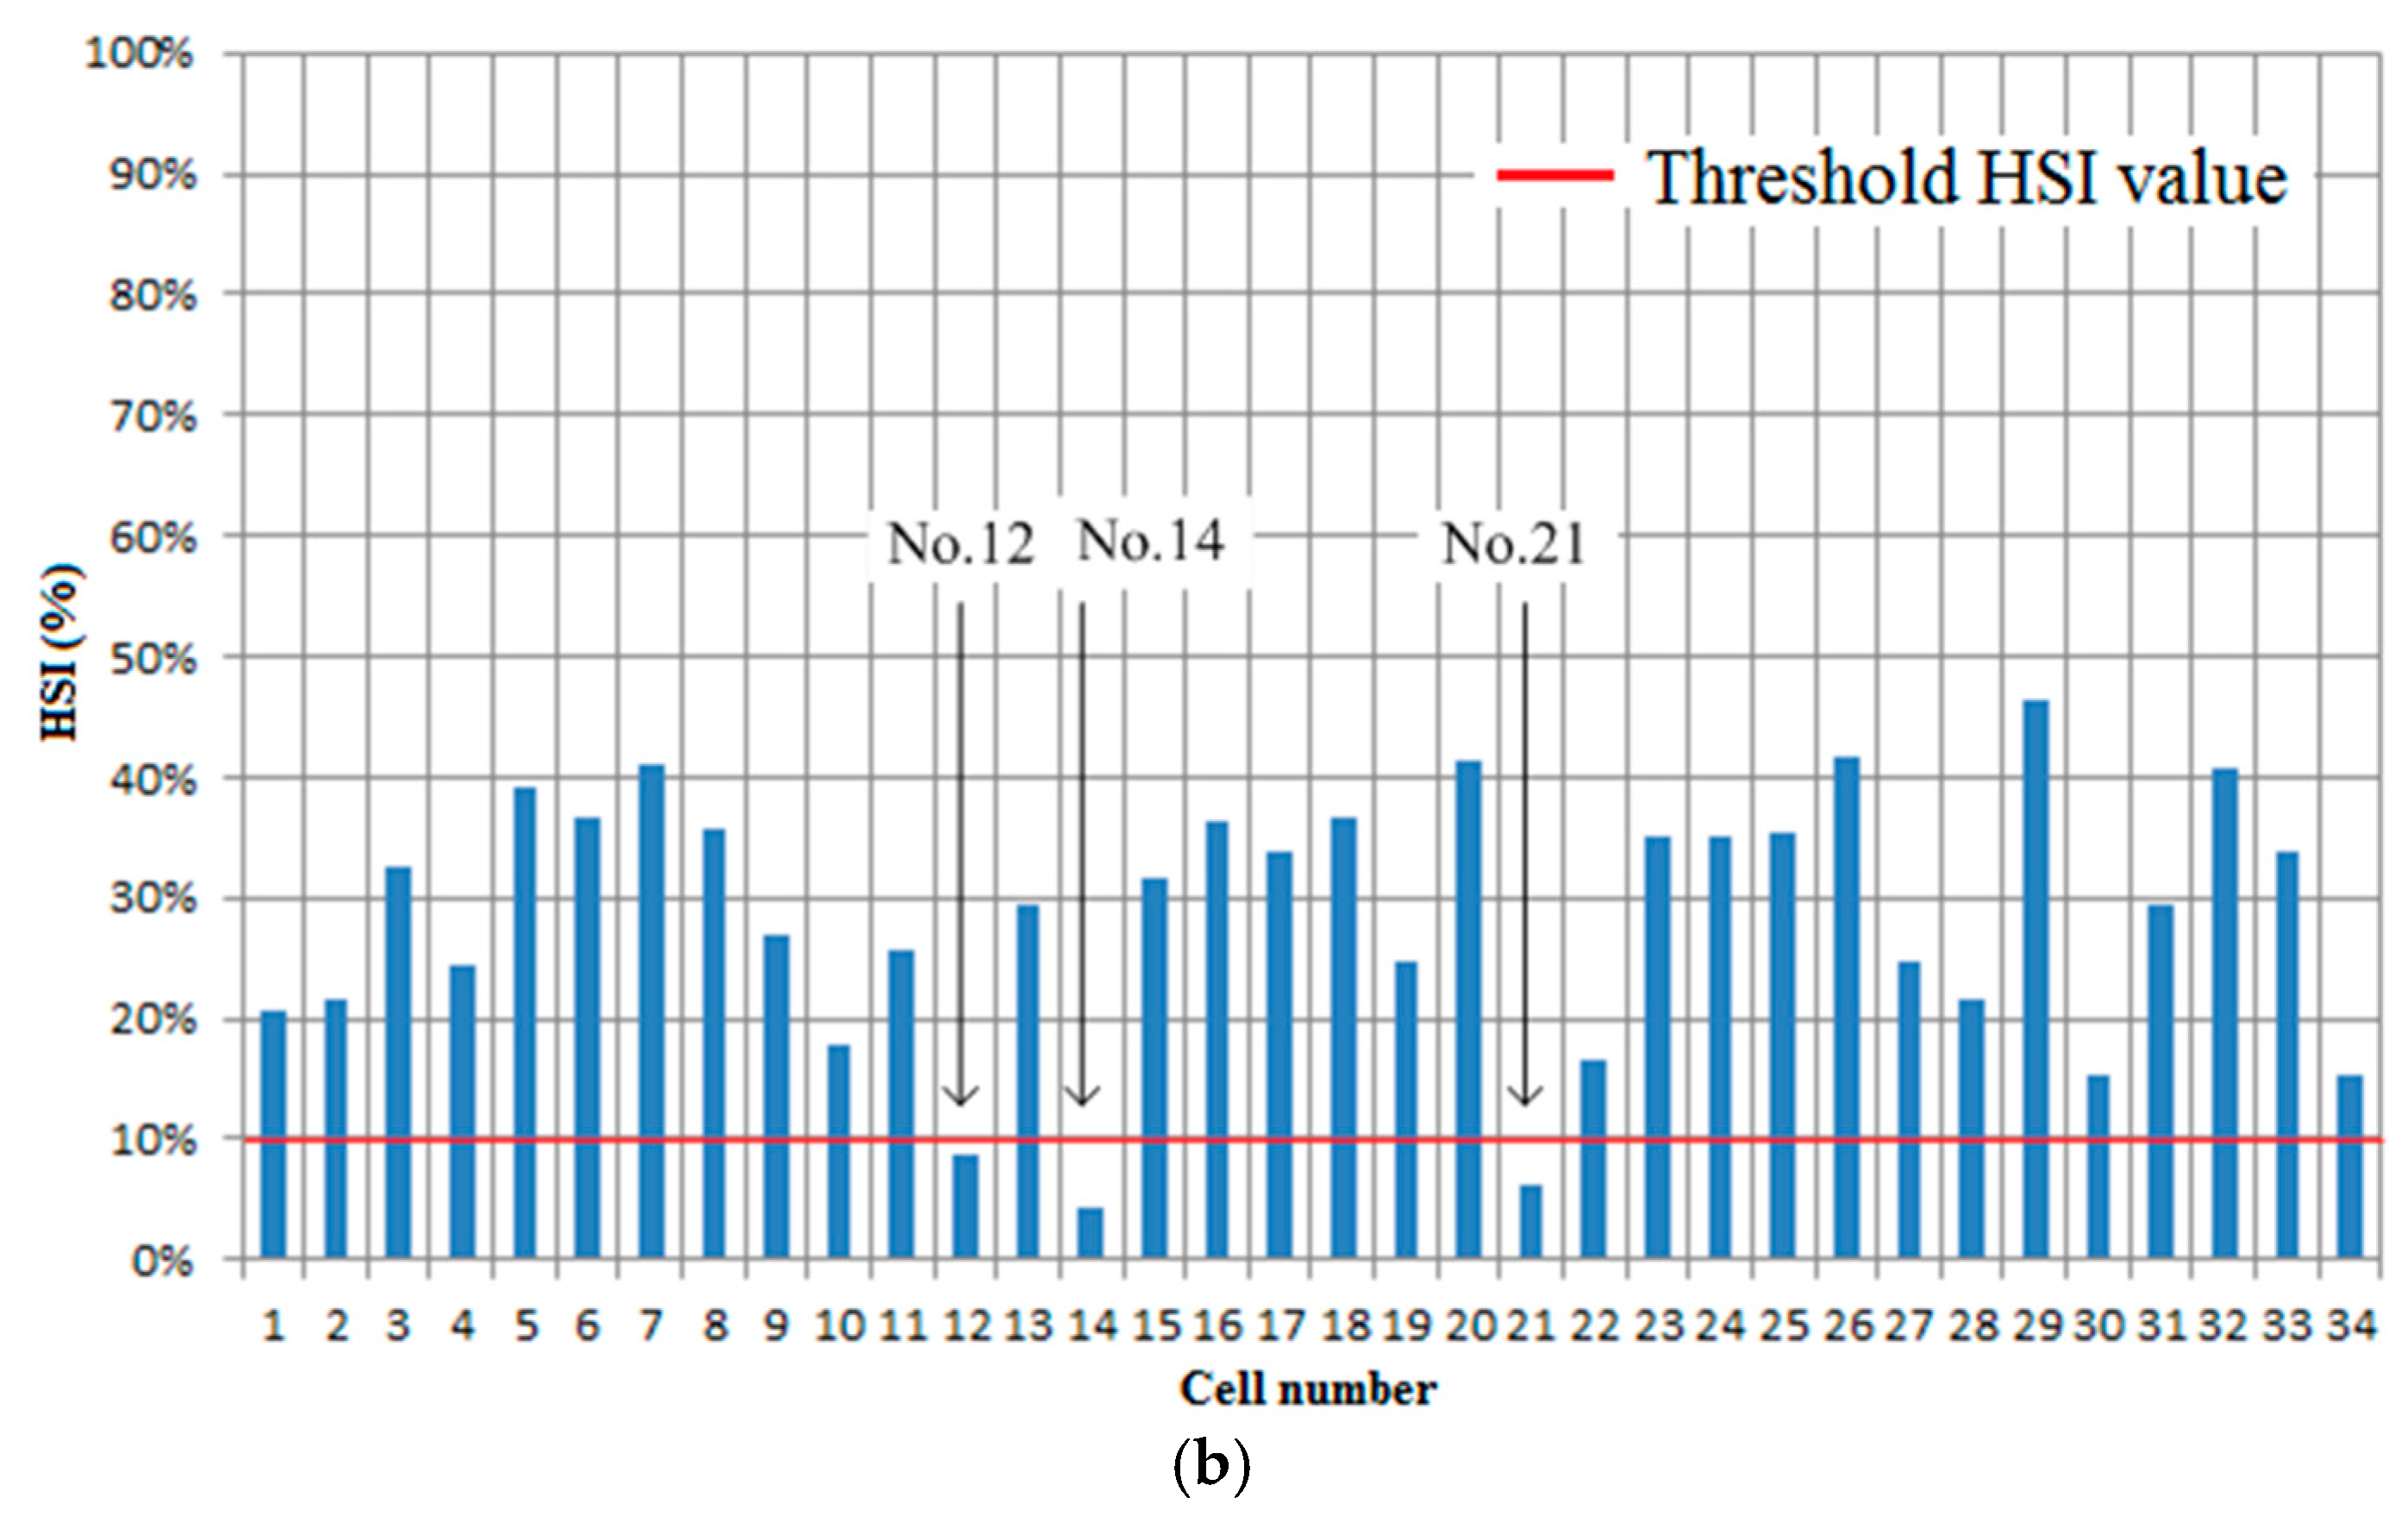
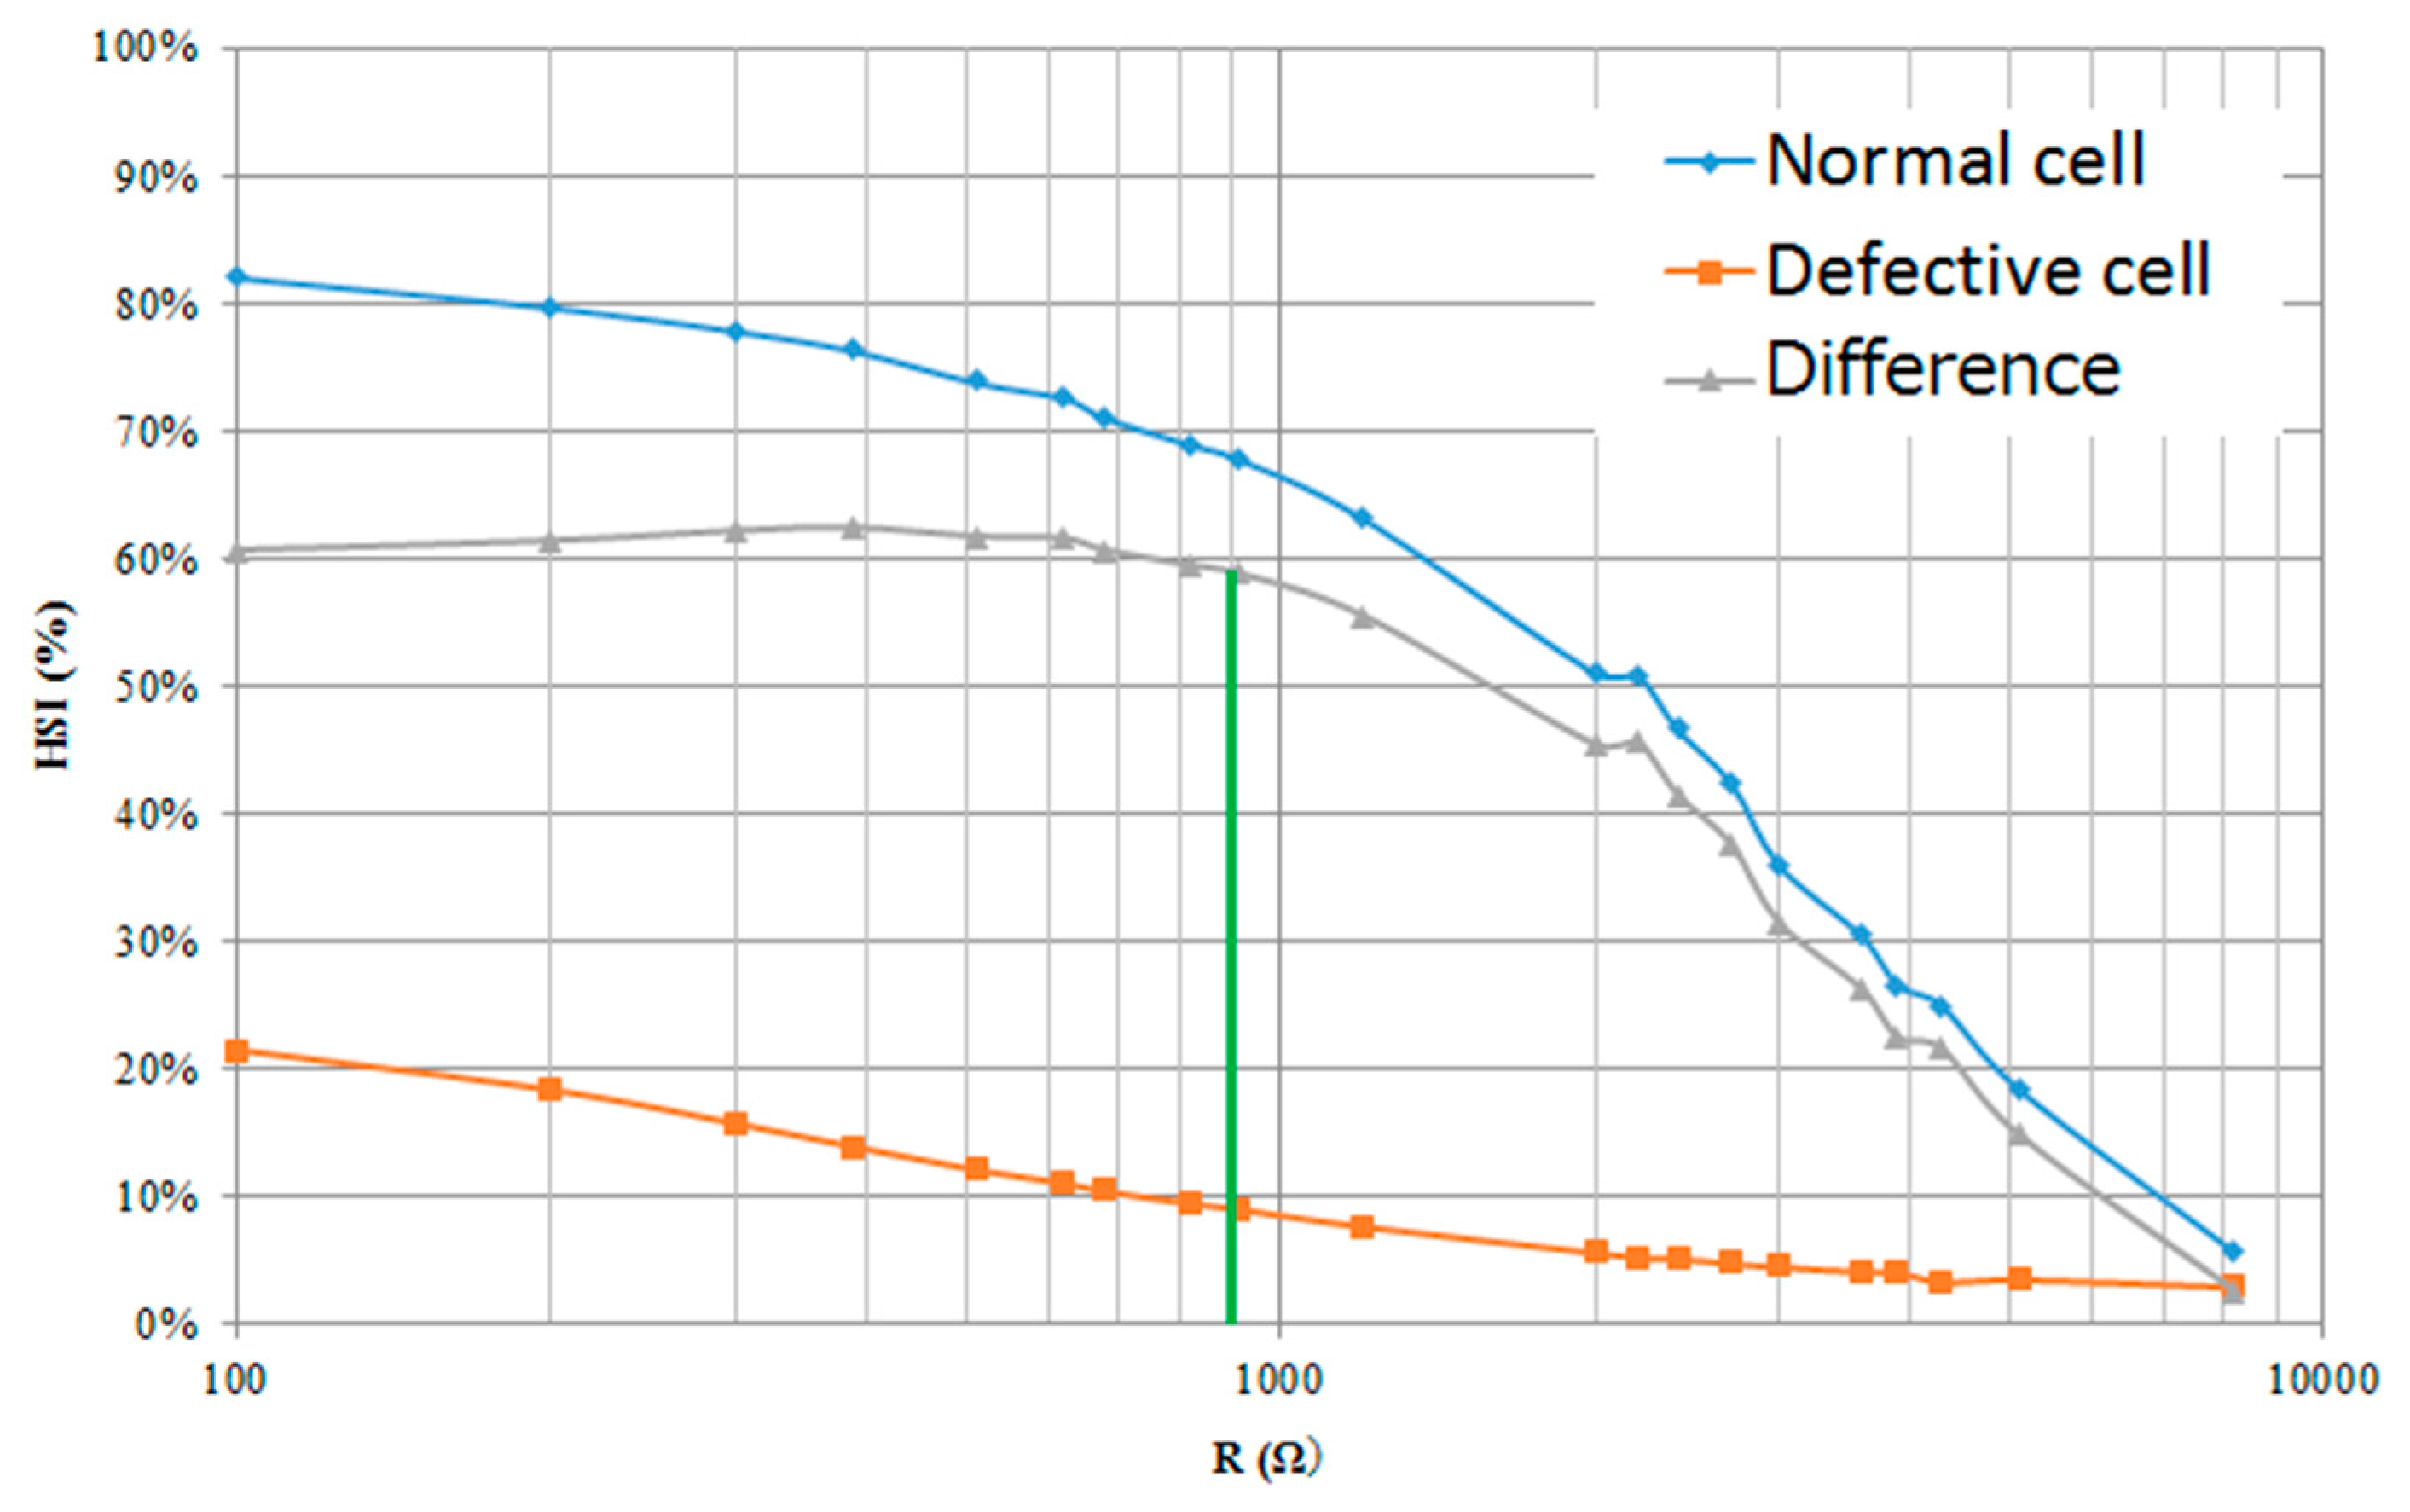
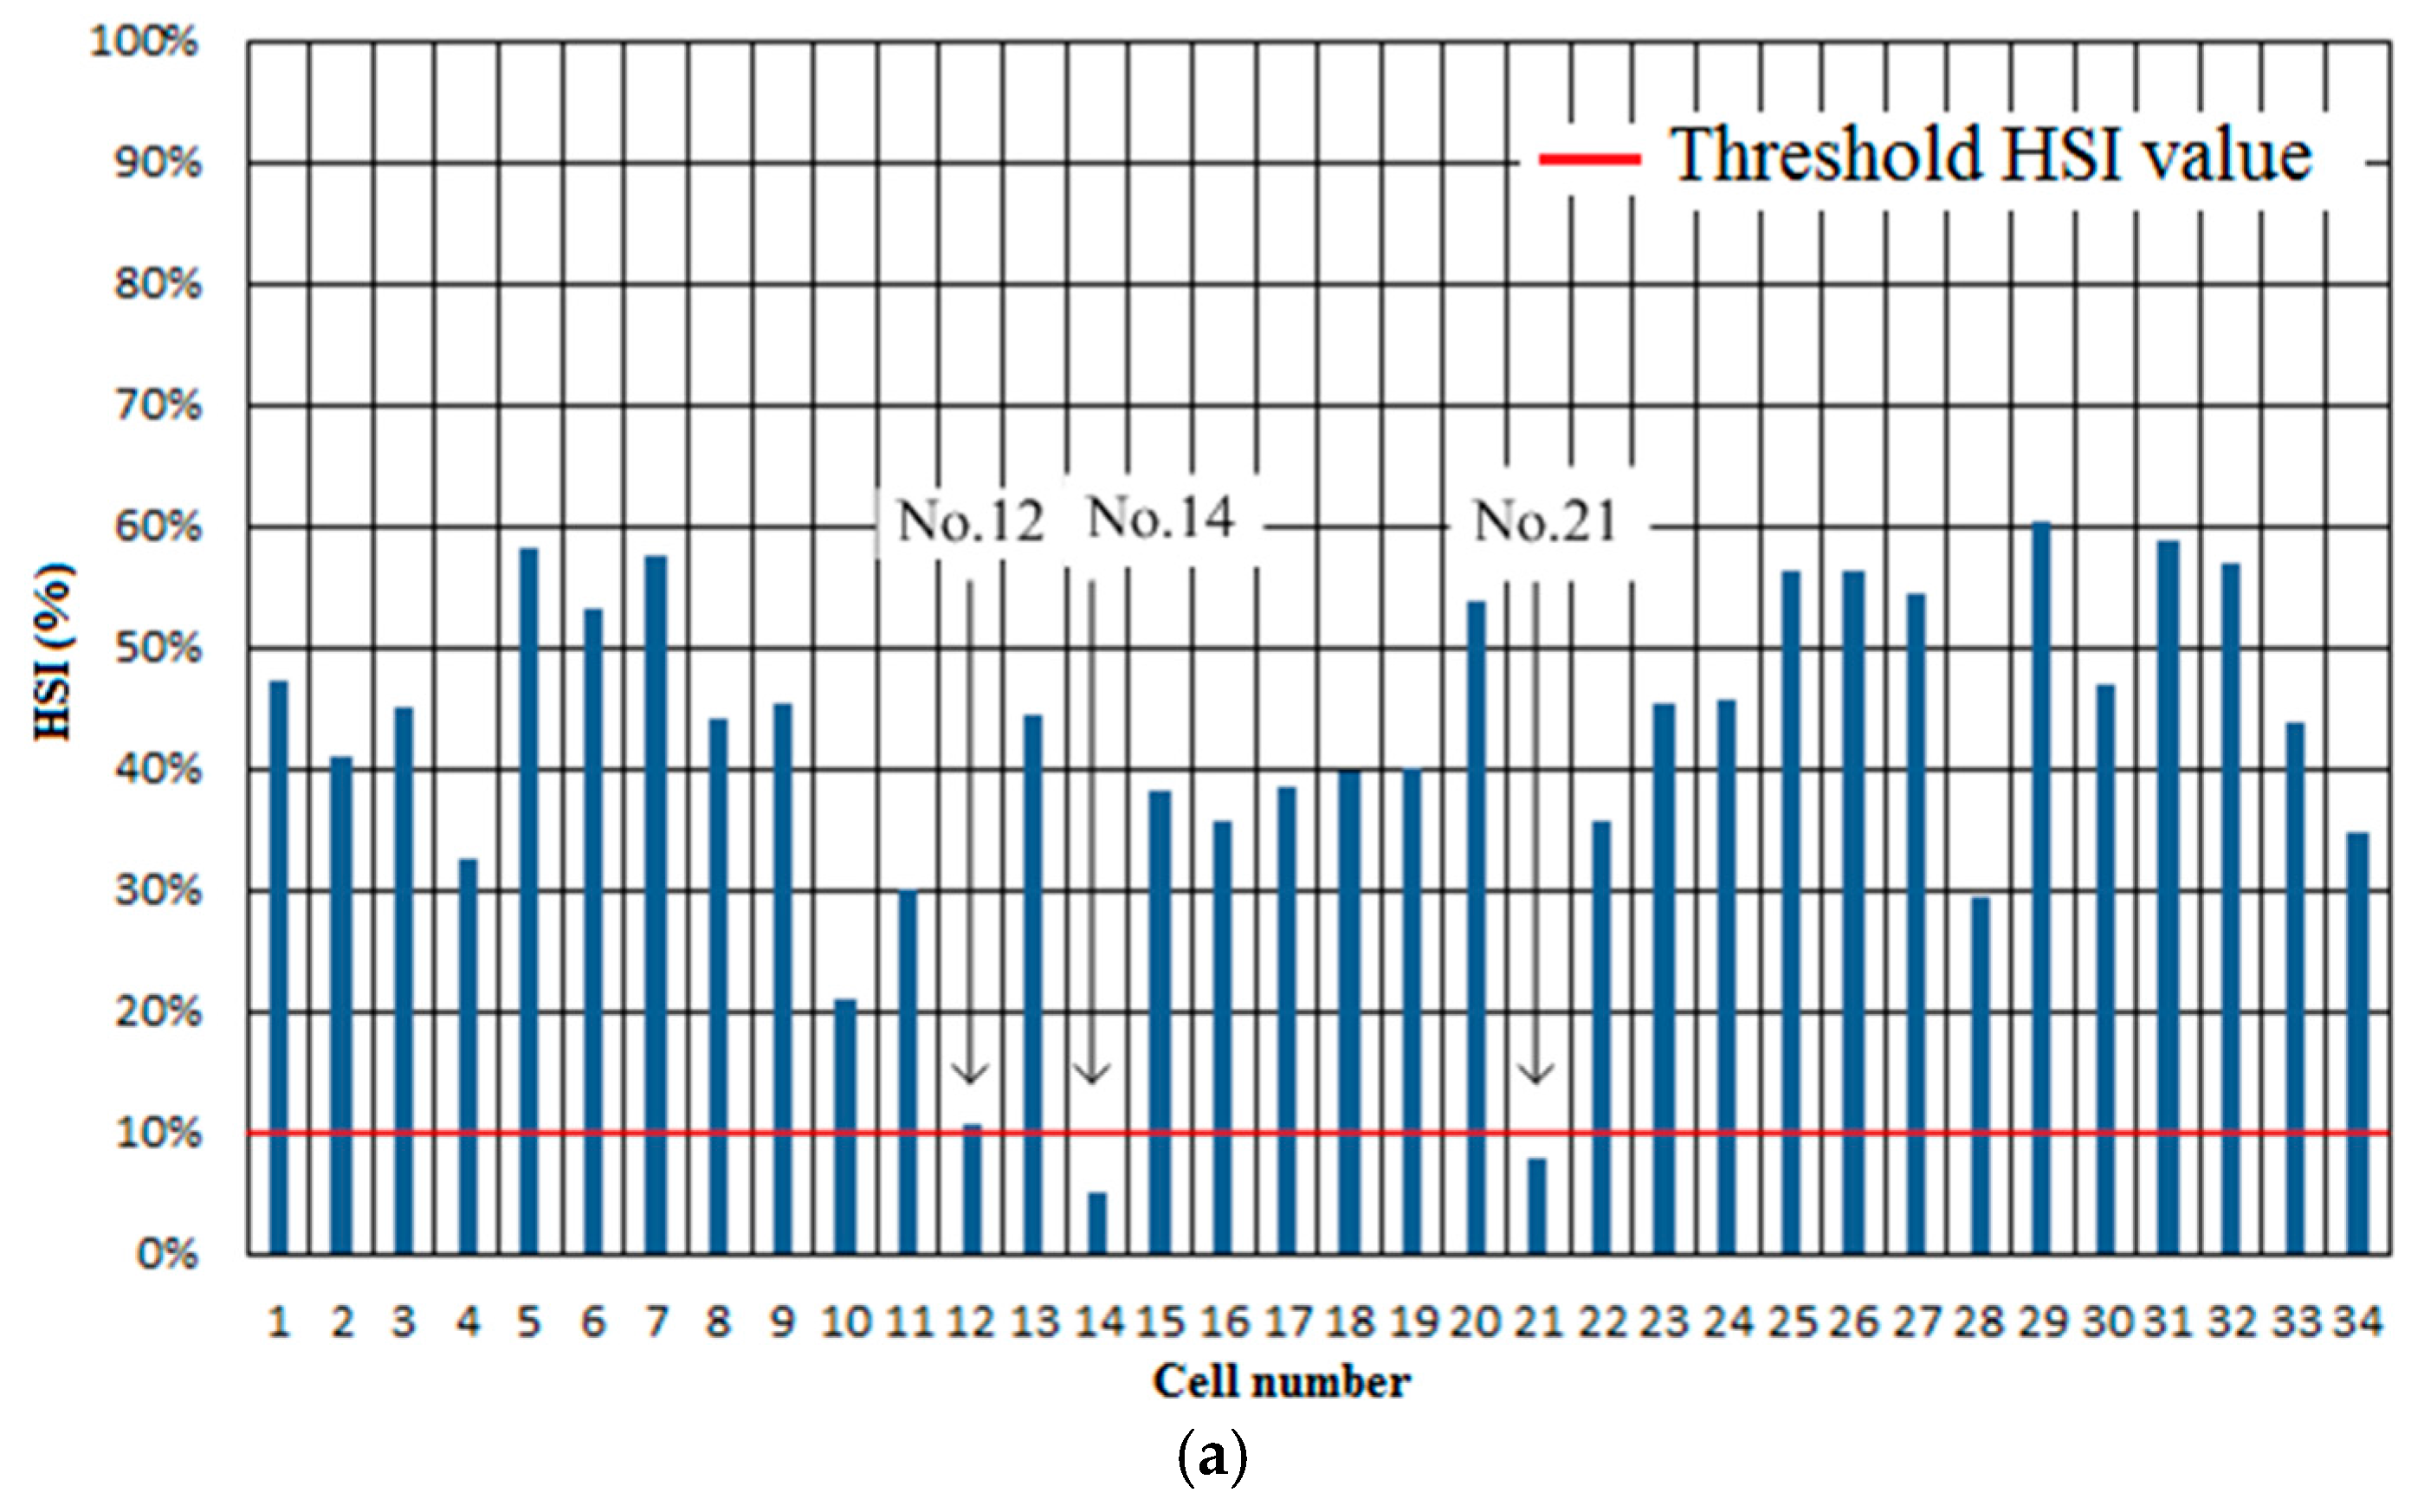
4.1. Resistance and Hot-Spot Index

As an important component of the system, the authors first investigated the influence of load resistor R on HSI. The characteristics of HSI for resistance R are indicated in Figure 15. It is obvious that differences of HSI between the normal and defective cells decrease with an increase in the resistance value. In order to distinguish defective cells from normal cells clearly while maintaining a relatedly high voltage across the resistance, R shall be set around 910 Ω.

4.2. Illuminance and Hot-Spot Index

The detailed conditions and parameters of the system are provided in Table 2. To investigate the correlation between HSI and illuminance, a same module is detected under the illuminance of 600 Lux and 6000 Lux respectively. The results are obtained in Figure 16. Although there is an overall decline in HSI, but the general trend of results is similar. It can be seen that HSIs of No. 12, No. 14 and No. 21 cell still remain extremely low even if the illuminance rises 10-fold. In other word, cells No. 12, No. 14 and No. 21 are high possibly crystal defective cells under the risk of hot-spot heating. This experiment shows that, as the theory described, the detection results of this method are relatively stable and less affected by the intensity of illuminance.

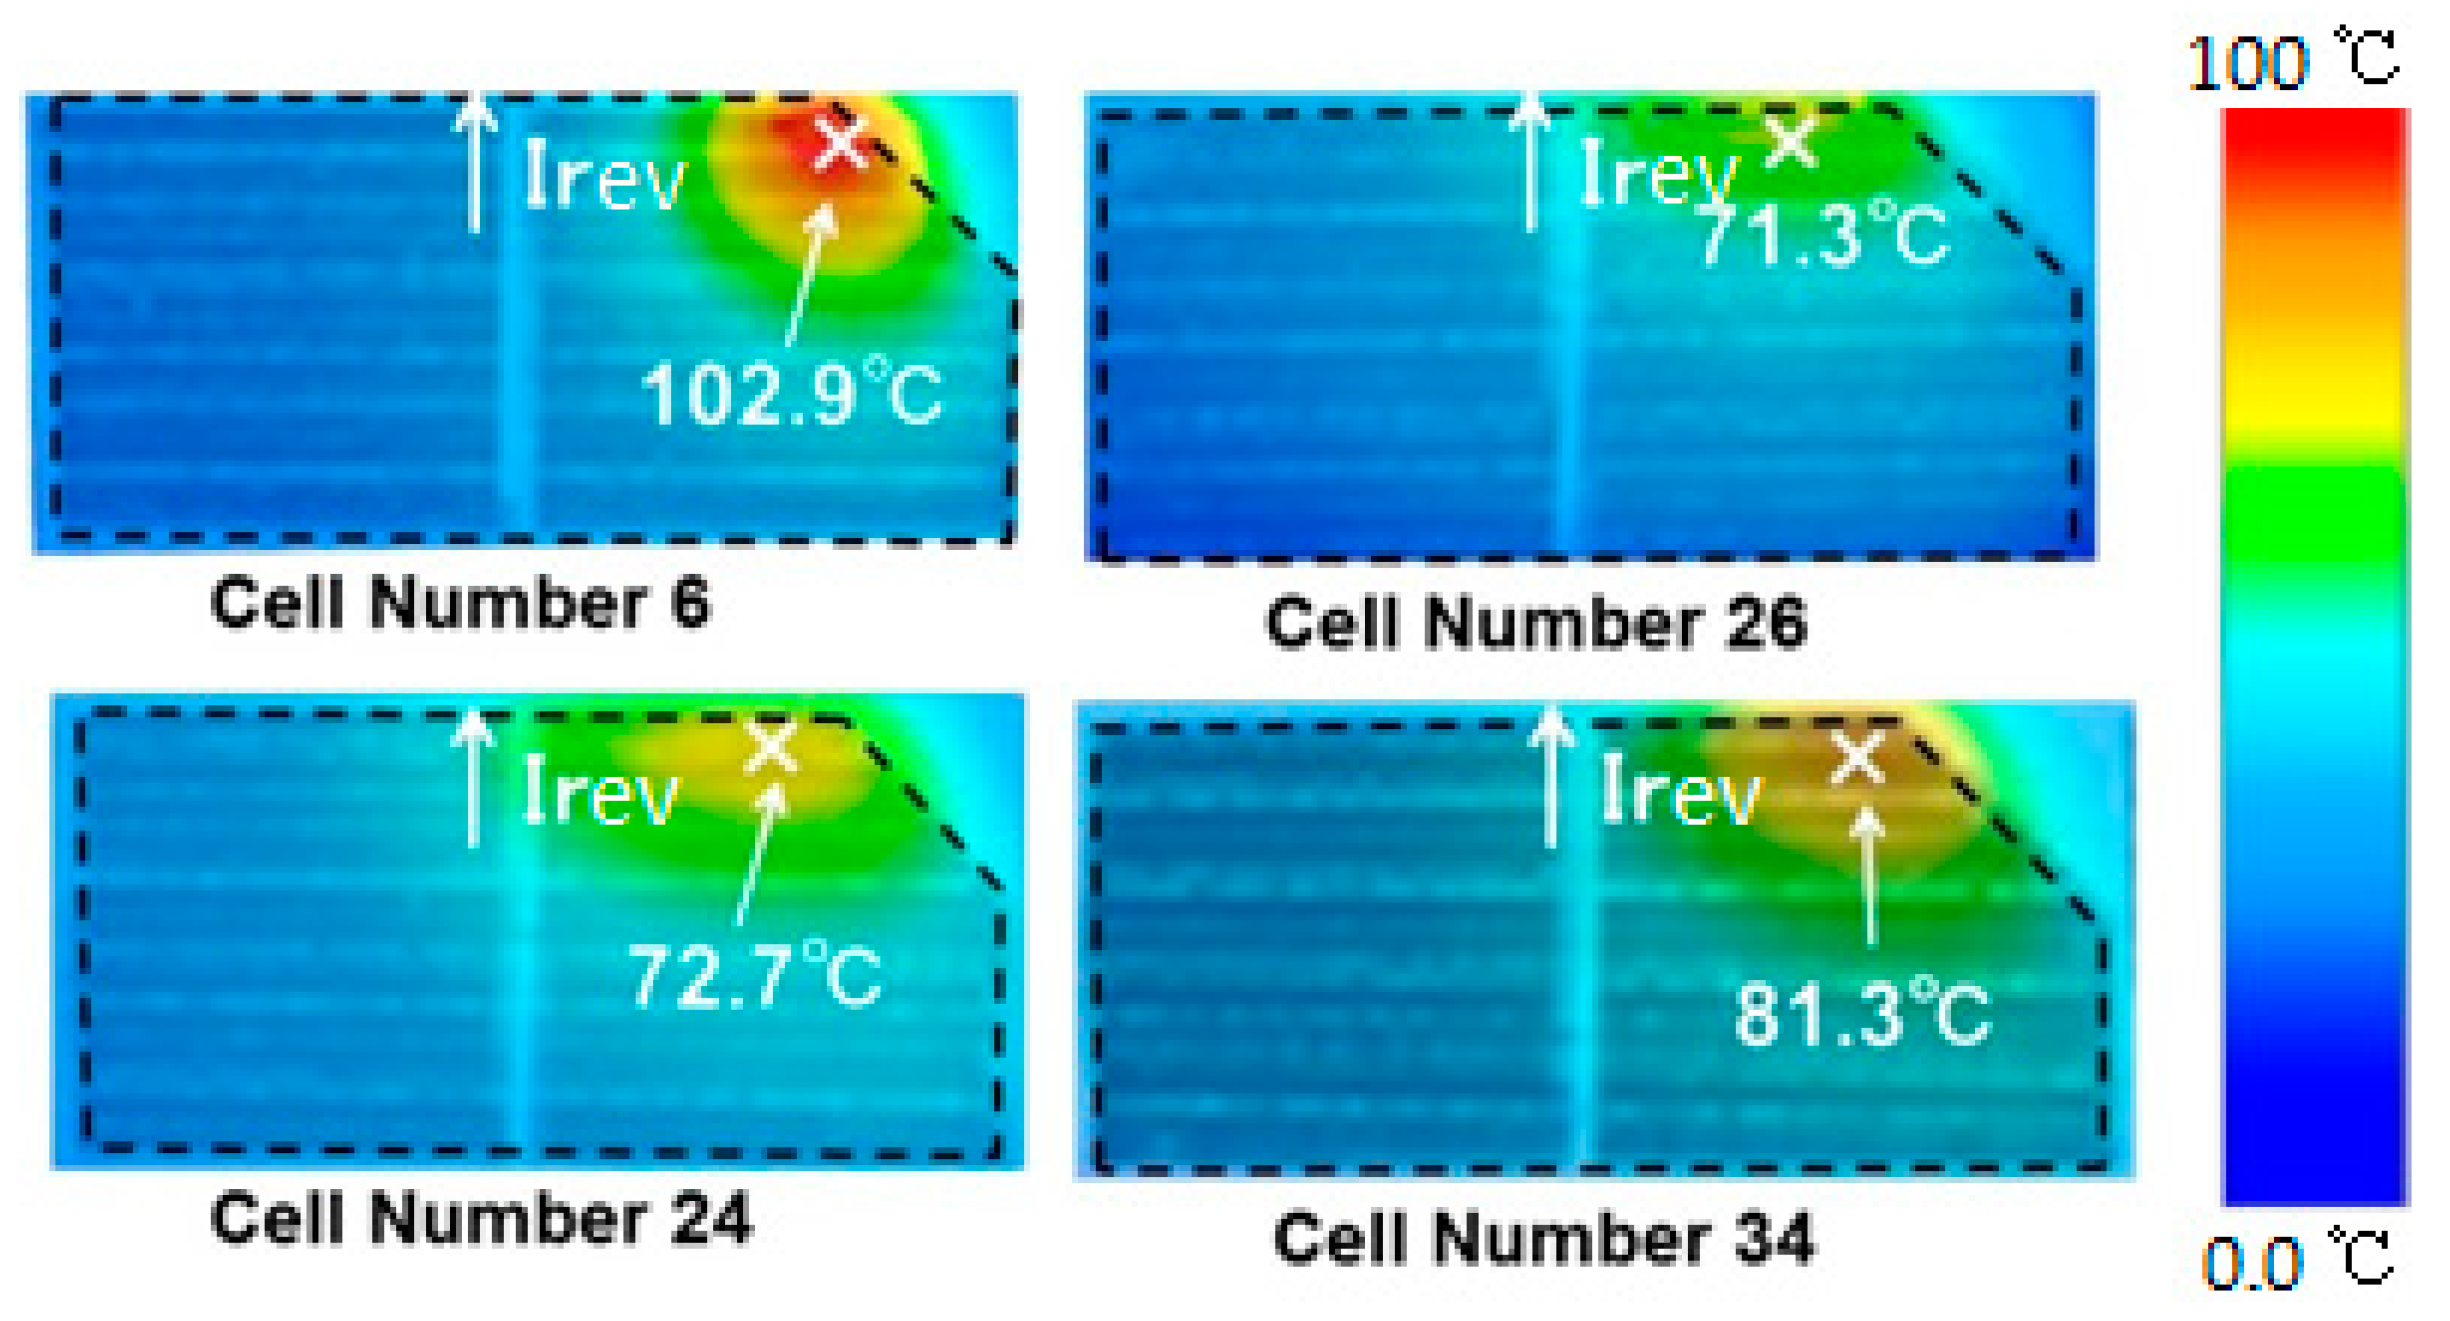
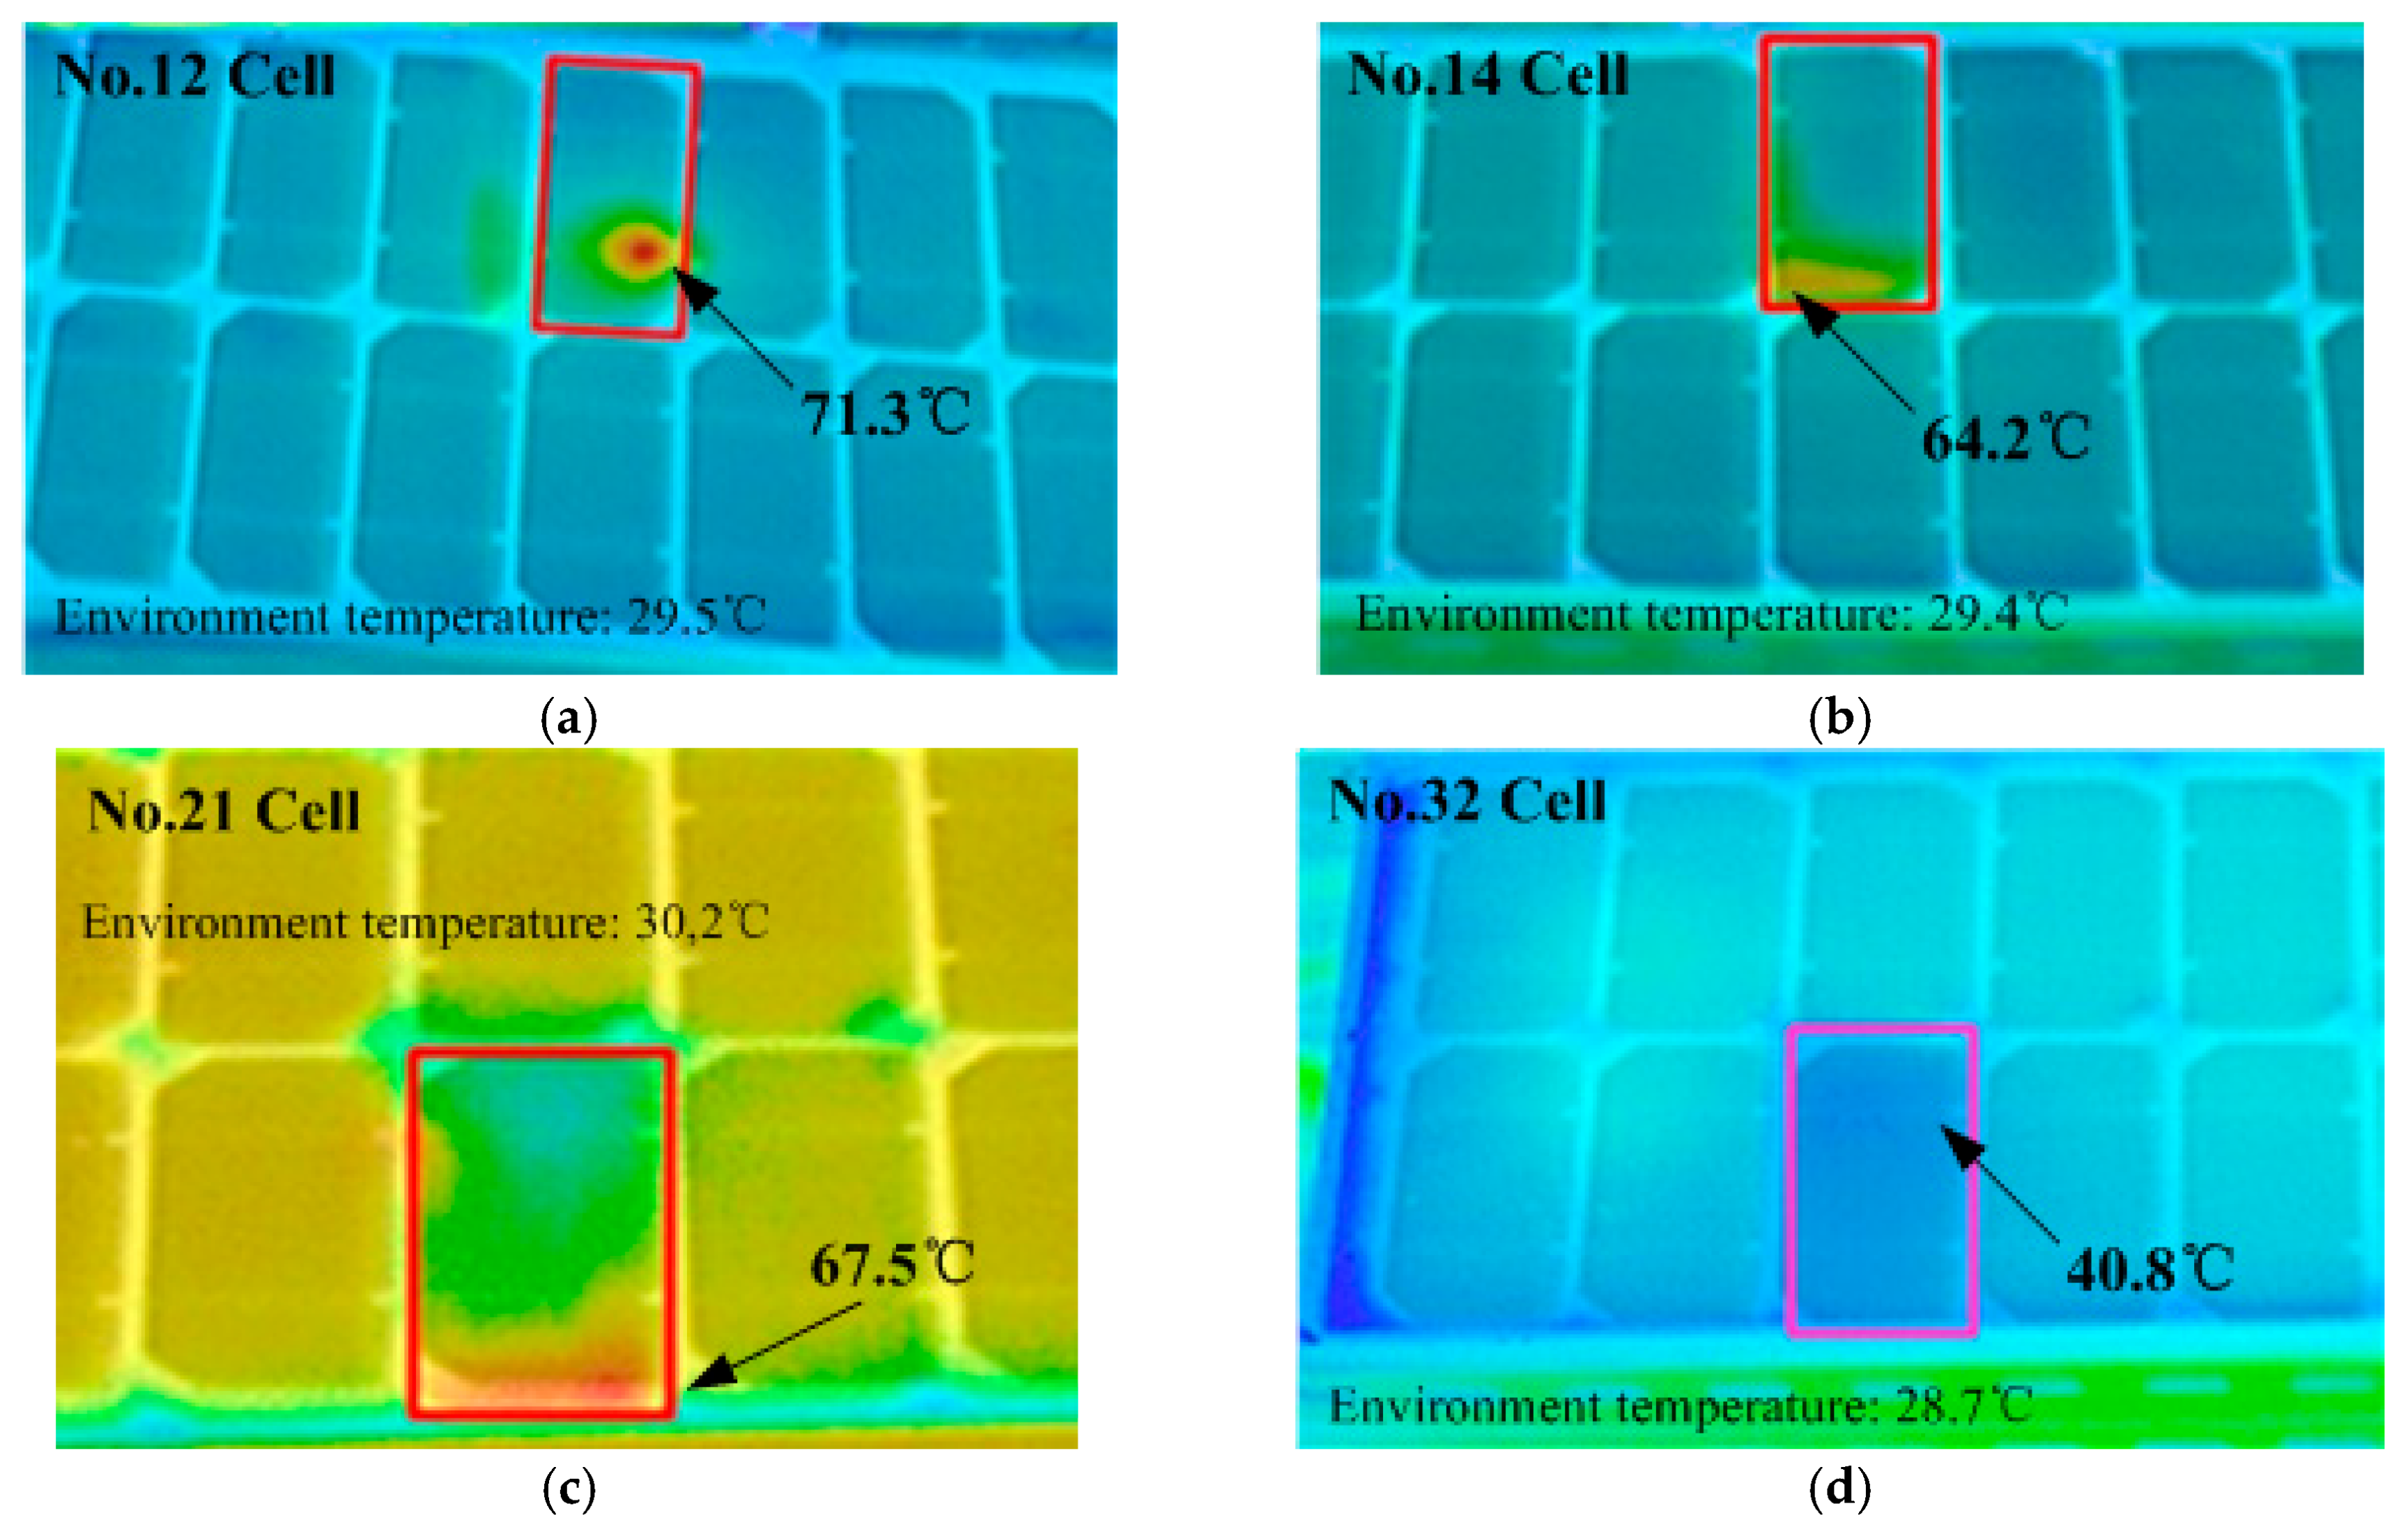
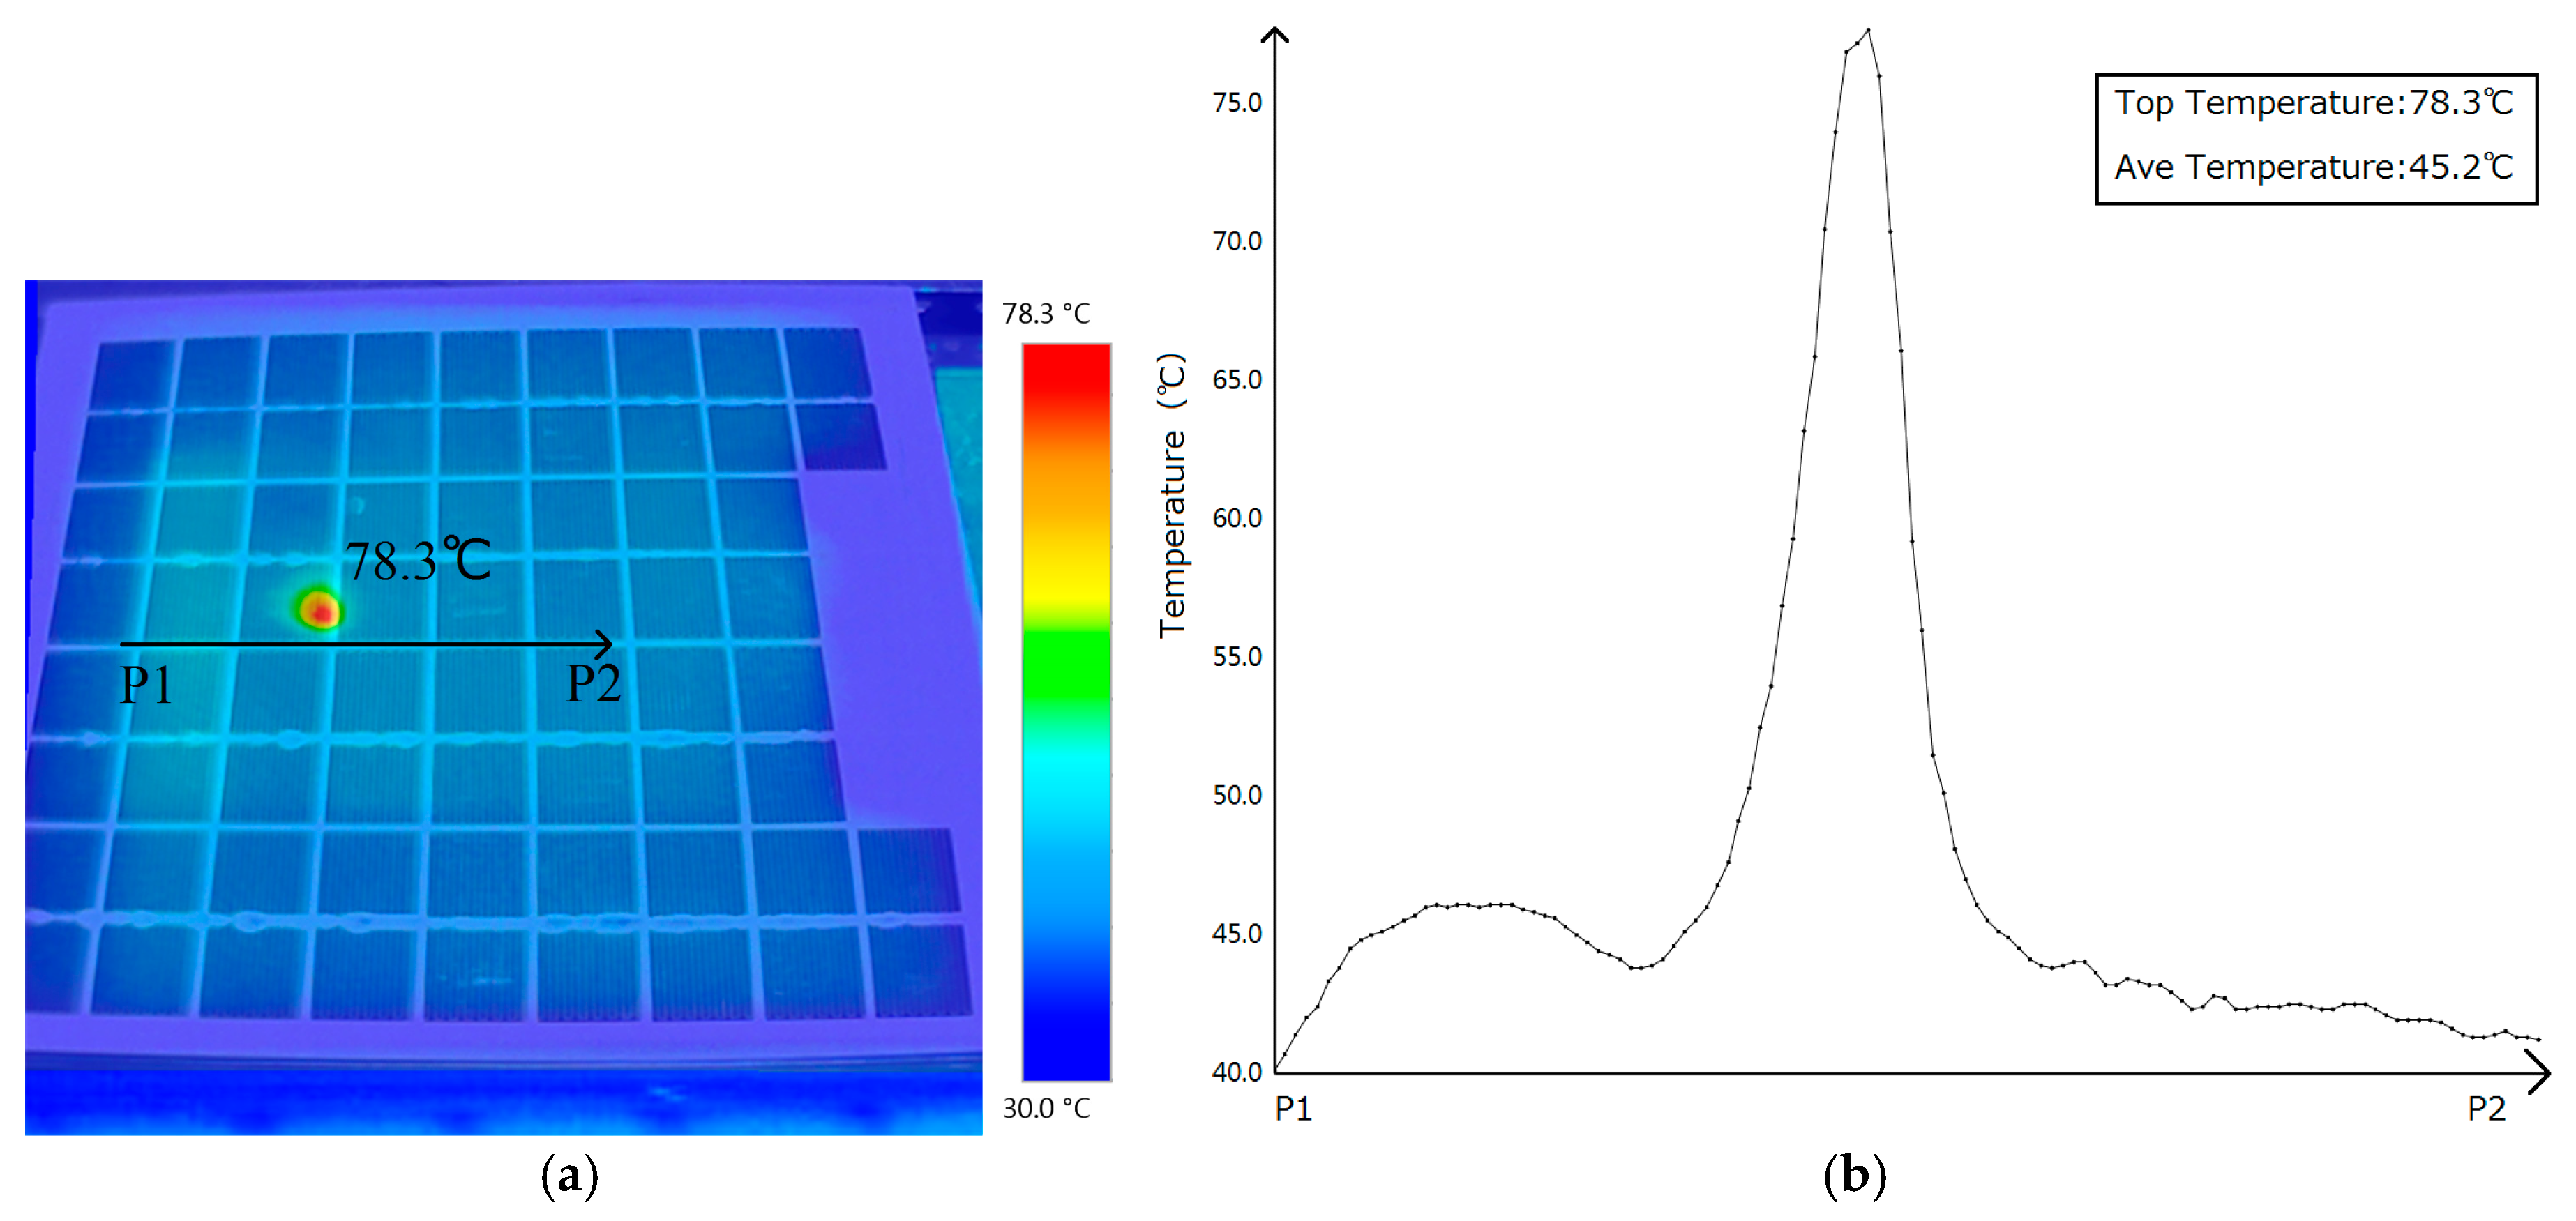
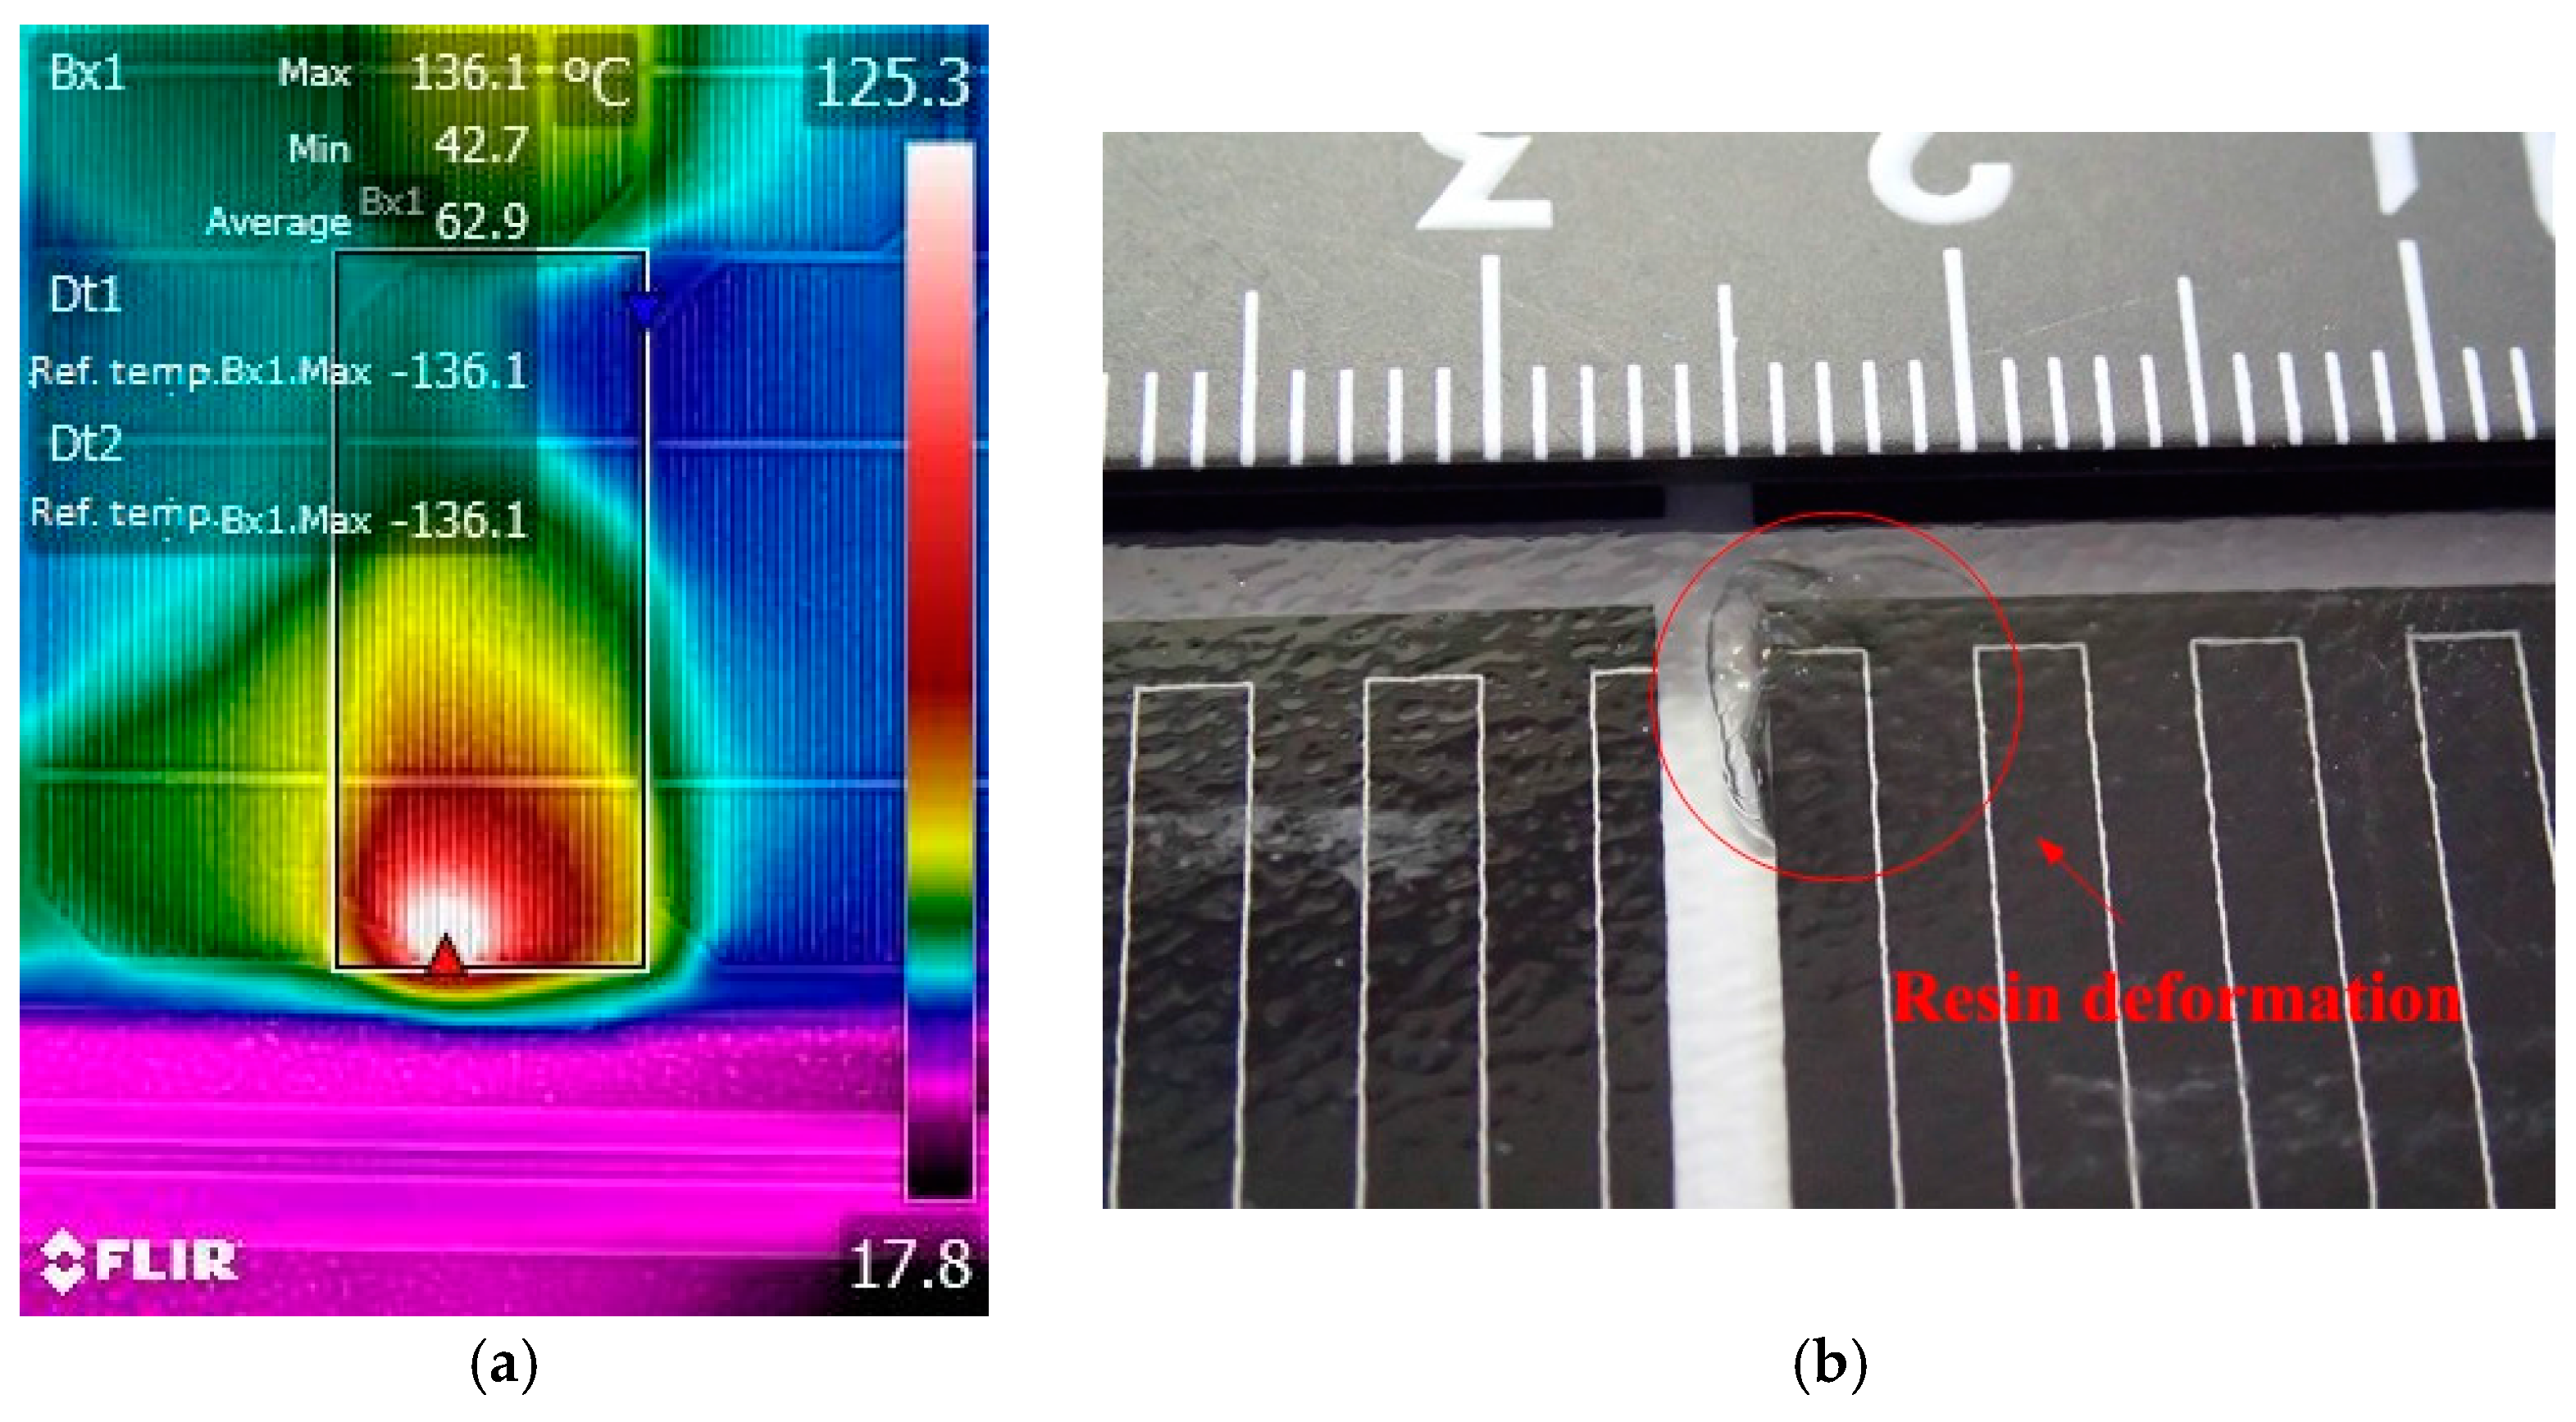
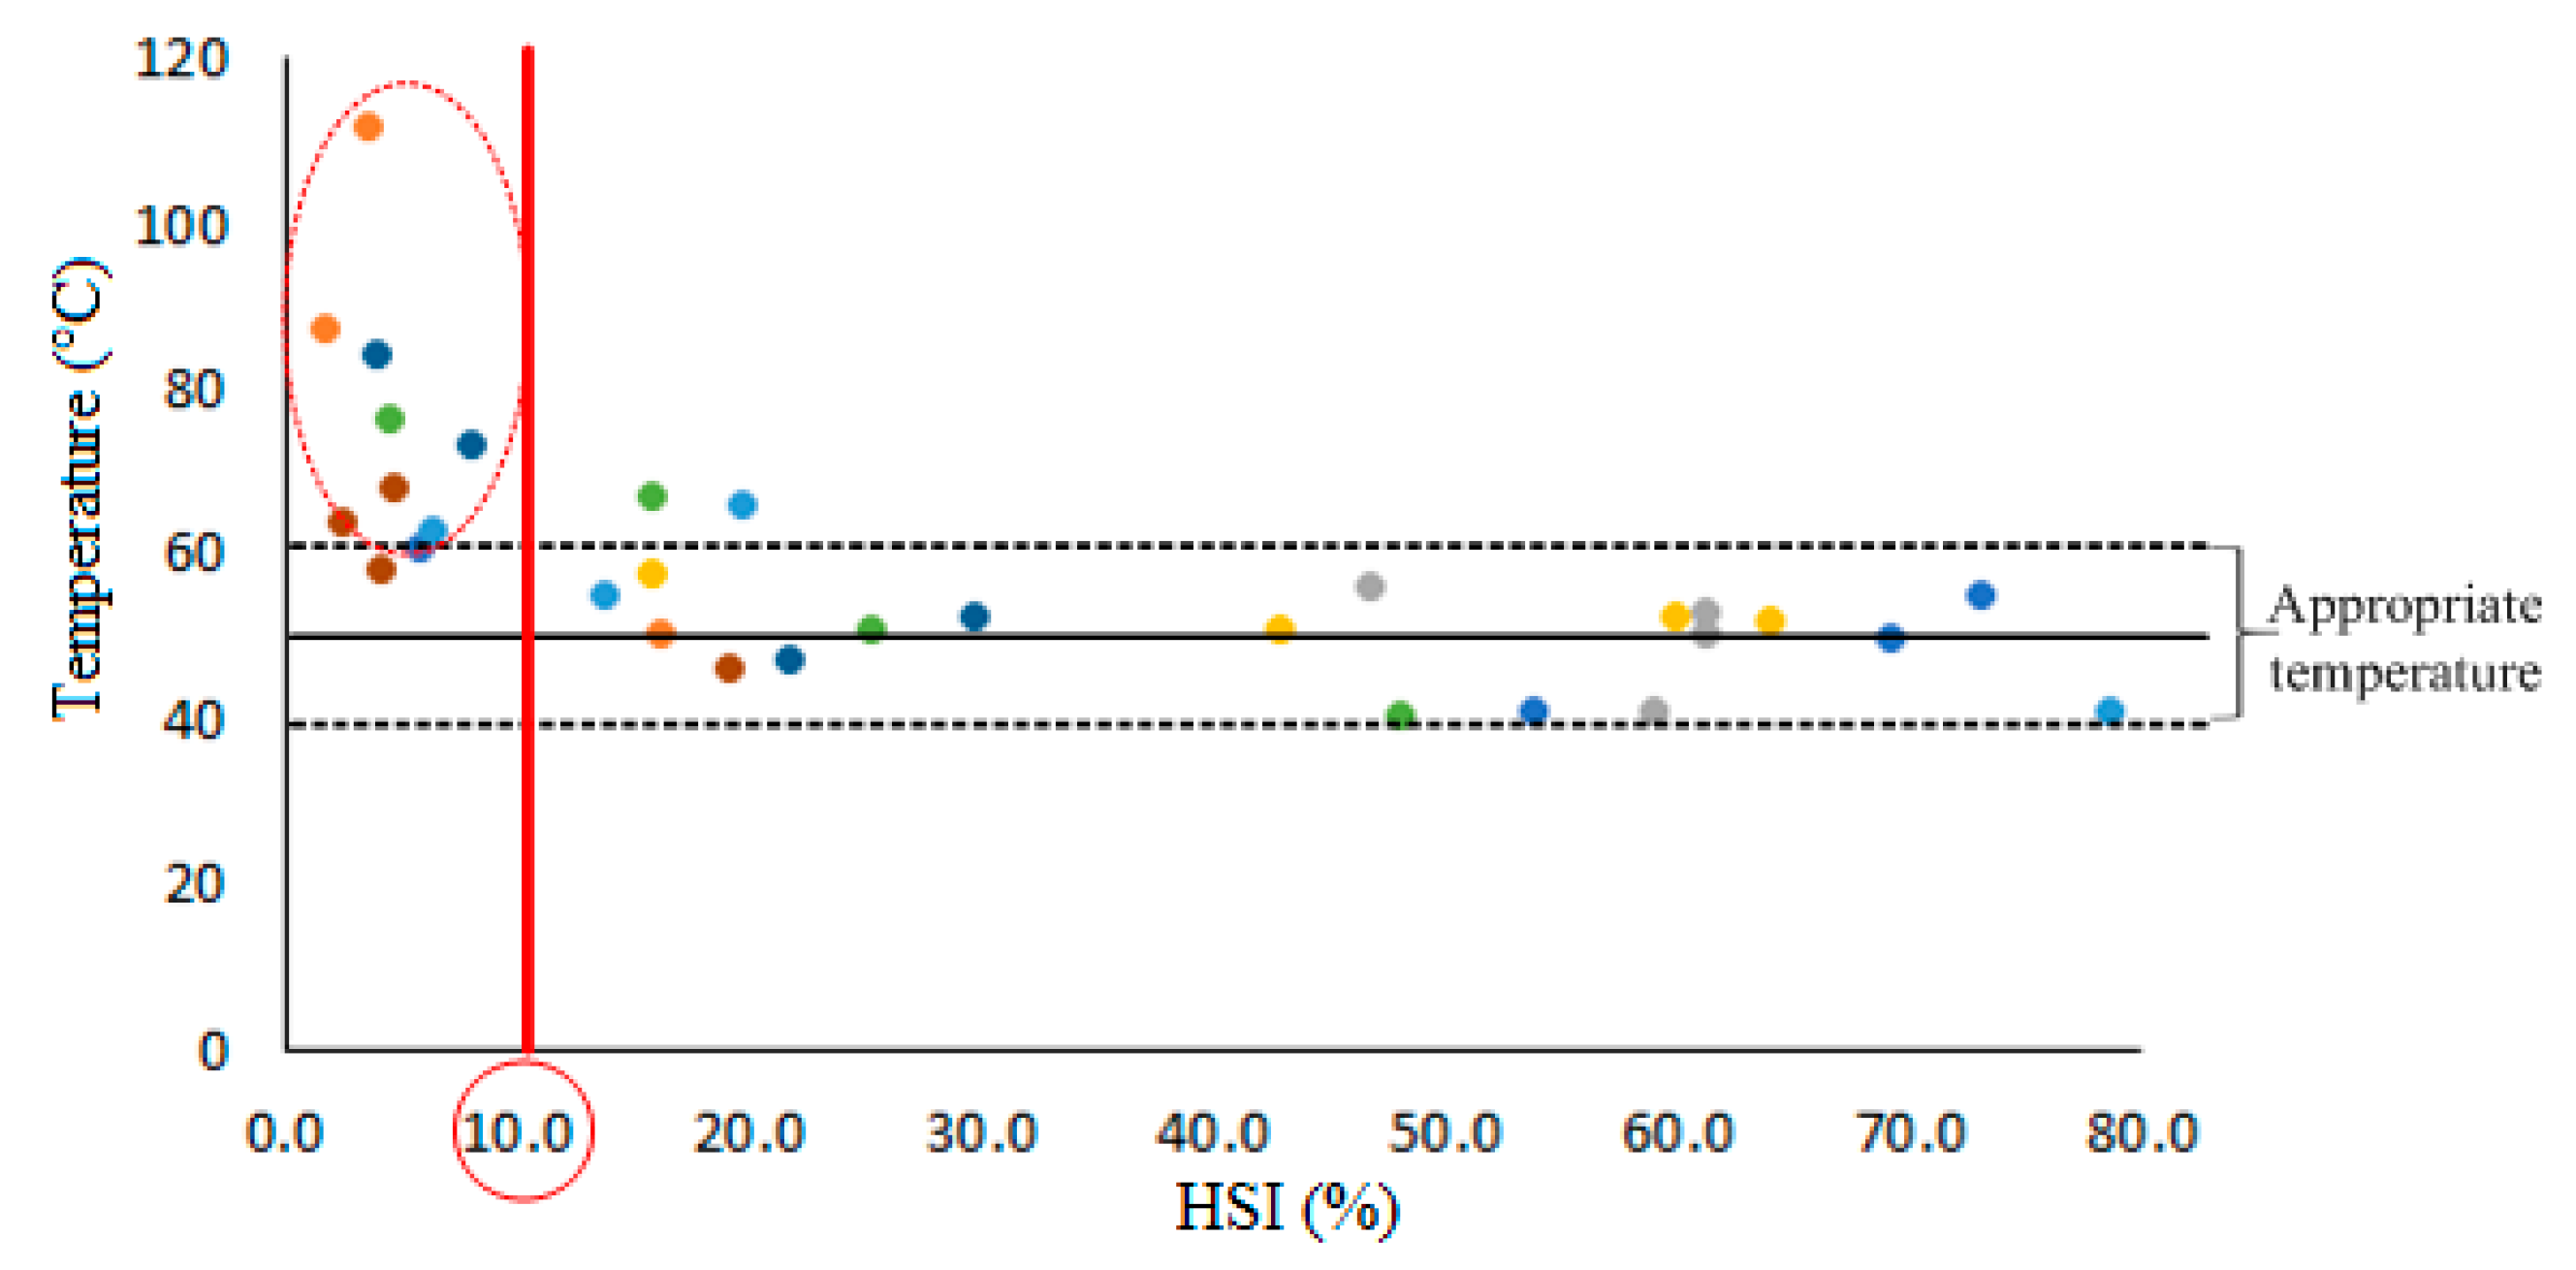
4.3. Thermal Analysis

In this section, the result of the thermal investigations are presented in order to further validate the presence of hot-spot in detected defective cell. As the detection results above, No. 12, No. 14 and No. 21 cell are recognized as risk cells. For comparison purposes, the No. 32 cell, whose HSI is relatively high, is also selected in this experiment. The sunlight intensity during the experiment is from 900 to 1050 W/m2. Each cell is shaded respectively under the sunlight for 10 min and switch to sunlight irradiation state, then the temperatures of two cells are observed by thermography. The results are indicated in Figure 17.
As can be clearly observed in the result, hot-spots occurring in cells No. 12, No. 14 and No. 21 versus No. 32 still maintained almost the same temperature as rest of the cell, Moreover, for safety purposes, we only added the shadow for 10 min. In some severe circumstances, HSIs of the cells are extremely low, approximately 0%, the temperature reaches about 140 °C even its only covered for 10 min, which leads to the resin deformation in the cell. Figure 18b gives an example cell of hot-spot caused resin deformation during the experiment. According to IEC 61215 [15] , cell shall maintain 50 °C ± 10 °C when it is shaded for 5 h or longer under natural sunlight or Class C or better steady-state sunlight simulator (irradiance 1000 W/m2 ± 10%). Based on experimental data, correlation between temperature and HSI is presented in Figure 19, when the HSI of the cell is 10% or less, the probability of temperature exceeding 60 °C is 90%. Therefore, it can be judged that a threshold value of 10% is appropriate for this method. In a word, the IR inspection experiment further confirmed the validity of proposed method for the PV string, meanwhile, the threshold value can also be verified, and initially identified as 10%. However, it is worth noting that this threshold is currently only applicable to single crystalline cells.

5. Conclusions

The aim of this research is to find a reasonable and sophisticated way to locate risky hot-spot cells. The experimental evidence accumulated during this research shows that defects cause hot-spot heating in reverse biased solar cells, and these defective cells can be detected by the proposed method. In addition, the real field experiment proved that the proposed method is also effective for the PV string. This provides the possibility of regular inspection by measuring voltage directly from the junction box of the solar generation system after installation.
The hot-spot testing methods required in IEC 61215 and ASTM E2481-12 typically take hours to identify risky cells, which are impractical to test individually (usually 8–10 samples) [15,16]. The proposed method is based on voltage rather than temperature, which only requires 2–3 min to identify risky hot-spot cells. With the risk factors of each cell, before installation, the hot-spot test can be conducted more representatively by using those identified defective cell as samples. During routine maintenance testing after installation, those modules with defective cells should consider being displaced and further confirmed. It is more accurate at locating hot-spot cells than conventional ways and greatly improve the testing efficient. Moreover, the proposed method applies a projector as an illumination light source instead of sunlight, which enables the inspection independent of the stable solar intensity conditions. By controlling the illumination, this method automatically generates a partial shadow on each cell instead of covering them manually. Consequently, it is possible to greatly reduce the failure rate of the solar array by eliminating module with defects using the proposed method before and after installation.
For further research, the authors will conduct further investigations of the relationship between temperature and hot-spot index on large-scale photovoltaic power generation plants, we will also verify the application of the voltage-based inspection method on polycrystalline PV modules from now on.

Acknowledgments

This work was supported by JSPS KAKENHI Grant No. 26420253.

Author Contributions

Yadong Wang and Kazutaka Itako conceived and designed the experiment; Yadong Wang performed the experiments; Yadong Wang, Kazutaka Itako and Qiang Ge carried out the analysis; Tsugutomo Kudoh, Keishin Koh and Kazutaka Itako contributed material/analysis tools; Yadong Wang wrote the paper.

Conflicts of Interest

The authors declare no conflict of interest.

References

  1. Yasushi, O.; Sanshiro, Y.; Daisuke, I. An investigation into hot-spot in PV module. In Proceedings of the Japan Solar Energy Society/Japan Wind Energy Association (JSES/JWEA) Joint Conference, Koriyama, Japan, 26–27 October 2010; pp. 535–538.
  2. Moreton, R.; Lorenzo, E.; Narvarte, L. Dealing in practice with hot-spots. In Proceedings of the 29th European Photovoltaic Solar Conference and Exhibition, Amsterdam, The Netherlands, 22–26 September 2014; pp. 1–6.
  3. Bishop, J.W. Microplasma Breakdown and Hot-Spots in Silicon Solar Cells. Solar Cell 1989, 26, 335–349. [Google Scholar] [CrossRef]
  4. Blake, F.A.; Hanson, K.L. The hot-spot failure mode for solar arrays. In Proceedings of the 4th Intersociety Energy Conversion Engineering Conference, Washington, DC, USA, 22–26 September 1969; pp. 575–581.
  5. Yang, H.; Hu, W.; Wang, H.; Narayanan, M. Investigation of reverse current for crystalline silicon solar cells-new concept for a test standard about the reverse current. In Proceedings of the 35th IEEE Photovoltaic Specialists Conference (PVSC), Honolulu, HI, USA, 20–25 June 2010; pp. 2806–2810.
  6. Bishop, J.W. Computer simulation of the effects of electrical mismatches in photovoltaic cell interconnection circuits. Solar Cell 1988, 25, 73–79. [Google Scholar] [CrossRef]
  7. Alonso García, M.C.; Herrmann, W.; Bohmer, W.; Proisy, B. Thermal and electrical effects caused by outdoor hot-spot testing in associations of photovoltaic cells. Prog. Photovolt. 2003, 11, 293–307. [Google Scholar] [CrossRef]
  8. Hoyer, U.; Burkert, A.; Auer, R.; Lutz, C.B. Analysis of PV modules by electroluminescence and IR thermography. In Proceedings of the 24th European Photovoltaic Solar Energy Conference and Exhibition, Hamburg, Germany, 21–25 September 2009; pp. 3262–3266.
  9. Herrmann, W.; Alonso, M.C.; Wambach, K. Effective hot-spot protection of PV modules characteristics of crystalline silicon cells and consequences for cell production. In Proceedings of the 17th European Photovoltaic Solar Energy Conference, Munich, Germany, 22–26 October 2001; pp. 1646–1649.
  10. Alonso-Garcia, M.; Ruiz, J.; Chenlo, F. Experimental study of mismatch and shading effects in the I–V characteristic of a photovoltaic module. Sol. Energy Mater. Sol. Cells 2006, 90, 329–340. [Google Scholar] [CrossRef]
  11. Kim, K.A.; Seo, G.S.; Cho, B.H.; Krein, P.T. Photovoltaic hot-spot detection for solar panel substrings using AC parameter characterization. IEEE Trans. Power Electron. 2016, 31, 1121–1130. [Google Scholar] [CrossRef]
  12. Watanabe, S.; Iijima, T.; Ohya, H.; Kudoh, T.; Itako, K. Study on temperature and fundamental characteristic of hot-spot of single-crystal photovoltaic cell by the amount of solar radiation. In Proceedings of the JSES/JWEA Joint Conference, Naha, Japan, 26–27 November 2013; pp. 315–318.
  13. Kudou, H.; Sugiyama, T.; Kudoh, T.; Itako, K. Prototype of the hot-spot rough-diagnosis equipment using projector for PV module. In Proceedings of the JSES/JWEA Joint Conference, Naha, Japan, 26–27 November 2013; pp. 49–52.
  14. Itako, K.; Kudoh, T. Study on hotspot of a single-crystal photovoltaic module. J. Inst. Electr. Install. Eng. Jpn. 2014, 34, 140–146. [Google Scholar]
  15. International Standard IEC 61215:2005, Crystalline Silicon Terrestrial Photovoltaic (PV) Modules—Design Qualification and Type Approval; International Electrotechnical Commission: Geneva, Switzerland, 2005.
  16. International Standard ASTM E2481–12, Standard Test Method for Hot Spot Protection Testing of Photovoltaic Modules; ASTM International: West Conshohocken, PA, USA, 2012.
Figure 1. Infrared (IR) image of a hot-spot cell: (a) Hot-spot in a photovoltaic (PV) module caused by crystal defects. The operating temperature at the hot-spot is 78.3 °C versus 45 °C of the rest of the module, which represents a temperature difference of 33.3 °C; (b) Temperature distribution of the hot-spot from P1 to P2, enormous power dissipation occurring in a relatively small area results in hot-spots, which in turn leads to destructive effects, such as cell or glass cracking, melting of solder, or degradation of the solar cell.
Energies 10 00230 g001
Figure 2. The current value in each cell energized at −10 V in dark conditions. It can be observed that No. 6, No. 24, No. 26 and No. 34 cells demonstrate severe reverse leakage currents.
Energies 10 00230 g002
Figure 3. Reverse bias I-V characteristics of different cells belonging to the test module in dark conditions. The great dispersion in second quadrant behavior is notorious.
Energies 10 00230 g003
Figure 4. IR images of fully shaded defective cells. It can be observed that hot-spots tend to occur near the edge of defective cells.
Energies 10 00230 g004
Figure 5. The reverse bias model of a crystalline silicon solar cell.
Energies 10 00230 g005
Figure 6. The equivalent circuit of a solar module, red dashed lines are operating current path: (a) Unshaded condition, IA = IB; (b) Partial shadow on hot-spot cell IA < IB, IAipv; (c) Partial shadow on normal cell, IA < IB, IA < ipv.
Energies 10 00230 g006
Figure 7. (a) Module constitution; (b) Layout of experimental PV string.
Energies 10 00230 g007
Figure 8. The equivalent circuit of the solar module: (a) Normal cell shaded condition; (b) Defective cell shaded condition.
Energies 10 00230 g008
Figure 9. I-V characteristics of normal cell shaded condition and Defective cell shaded condition.
Energies 10 00230 g009
Figure 10. Animation procedure of the detection.
Energies 10 00230 g010
Figure 11. Detection flow chart, which determines the risk factor of each cell inside a PV module.
Energies 10 00230 g011
Figure 12. Voltage-based detection system: (a) Configuration of voltage-based hot-spot detection system, which consists of a projector part and measurement part; (b) Prototype of the detection device.
Energies 10 00230 g012
Figure 13. Detection monitor interface, all parameters and data of the detection are gathered here.
Energies 10 00230 g013
Figure 14. Pictures of real-field detection. (a) An example of shaded cell; (b) Projector used in experiment, one crew member is operating the monitor software.
Energies 10 00230 g014
Figure 15. Correlation between HSI and Resistance at 1000 Lux, the X axis is resistance of insertion resistor and the Y axis is hot-spot risk factor HSI.
Energies 10 00230 g015
Figure 16. Correlation between HSI and illuminance: (a) Result of No. 2 module at 6000 Lux, the red horizontal line is the threshold HSI value; (b) Result of No. 2 module at 600 Lux.
Energies 10 00230 g016aEnergies 10 00230 g016b
Figure 17. IR inspection results: (a) Hot-spot in No. 12 cell caused by micro-defects, the operating temperature at the hot-spot is 71.3 °C while the mean temperature of the rest cell is 38.7 °C, which represents a temperature difference of 32.6 °C; (b) Hot-spot in No. 14 cell; (c) Hot-spot in No. 21 cell; and (d) Thermal image of No. 32 cell, the temperature is 40.8 °C only raises 2–3 °C after 10 min of shading.
Energies 10 00230 g017
Figure 18. Example of resin deformation of defect cell: (a) HSI of this cell is 0% and the temperature reached 136 °C; (b) Resin deformation occurred at the edge of the defective cell.
Energies 10 00230 g018
Figure 19. Relationship between HSI and temperature, each cell is covered under natural sunlight (over 900 W/m2, average environment temperature: 24.4 °C, average humidity: 79%) for 10 min, HSI is the state of 5000 Lux of illuminance and 1000 Ω of insertion resistor.
Energies 10 00230 g019
Table 1. PV solar module specifications.
ItemSpecification
PV solar panel model numberGT133
Maximum power (Pm)50 W
Maximum voltage (Voc)20.5 V
Maximum current (Isc)3.35 A
Operation voltage (Vpm)16.4 V
Operation current (Ipm)3.05 A
Table 2. Key parameters of comparison experiment.
Module NumberConnection StatusInsertion ResistorSurface IlluminanceInitial Voltage (V0)
No. 2String (8 in series)910 Ω6000 Lux (24.6 W/m2)18.61 V
No. 2String (8 in series)910 Ω600 Lux (2.49 W/m2)8.49 V

