
Effect of Injection Flow Rate on Product Gas Quality in Underground Coal Gasification (UCG) Based on Laboratory Scale Experiment: Development of Co-Axial UCG System

 ,
,
Abstract
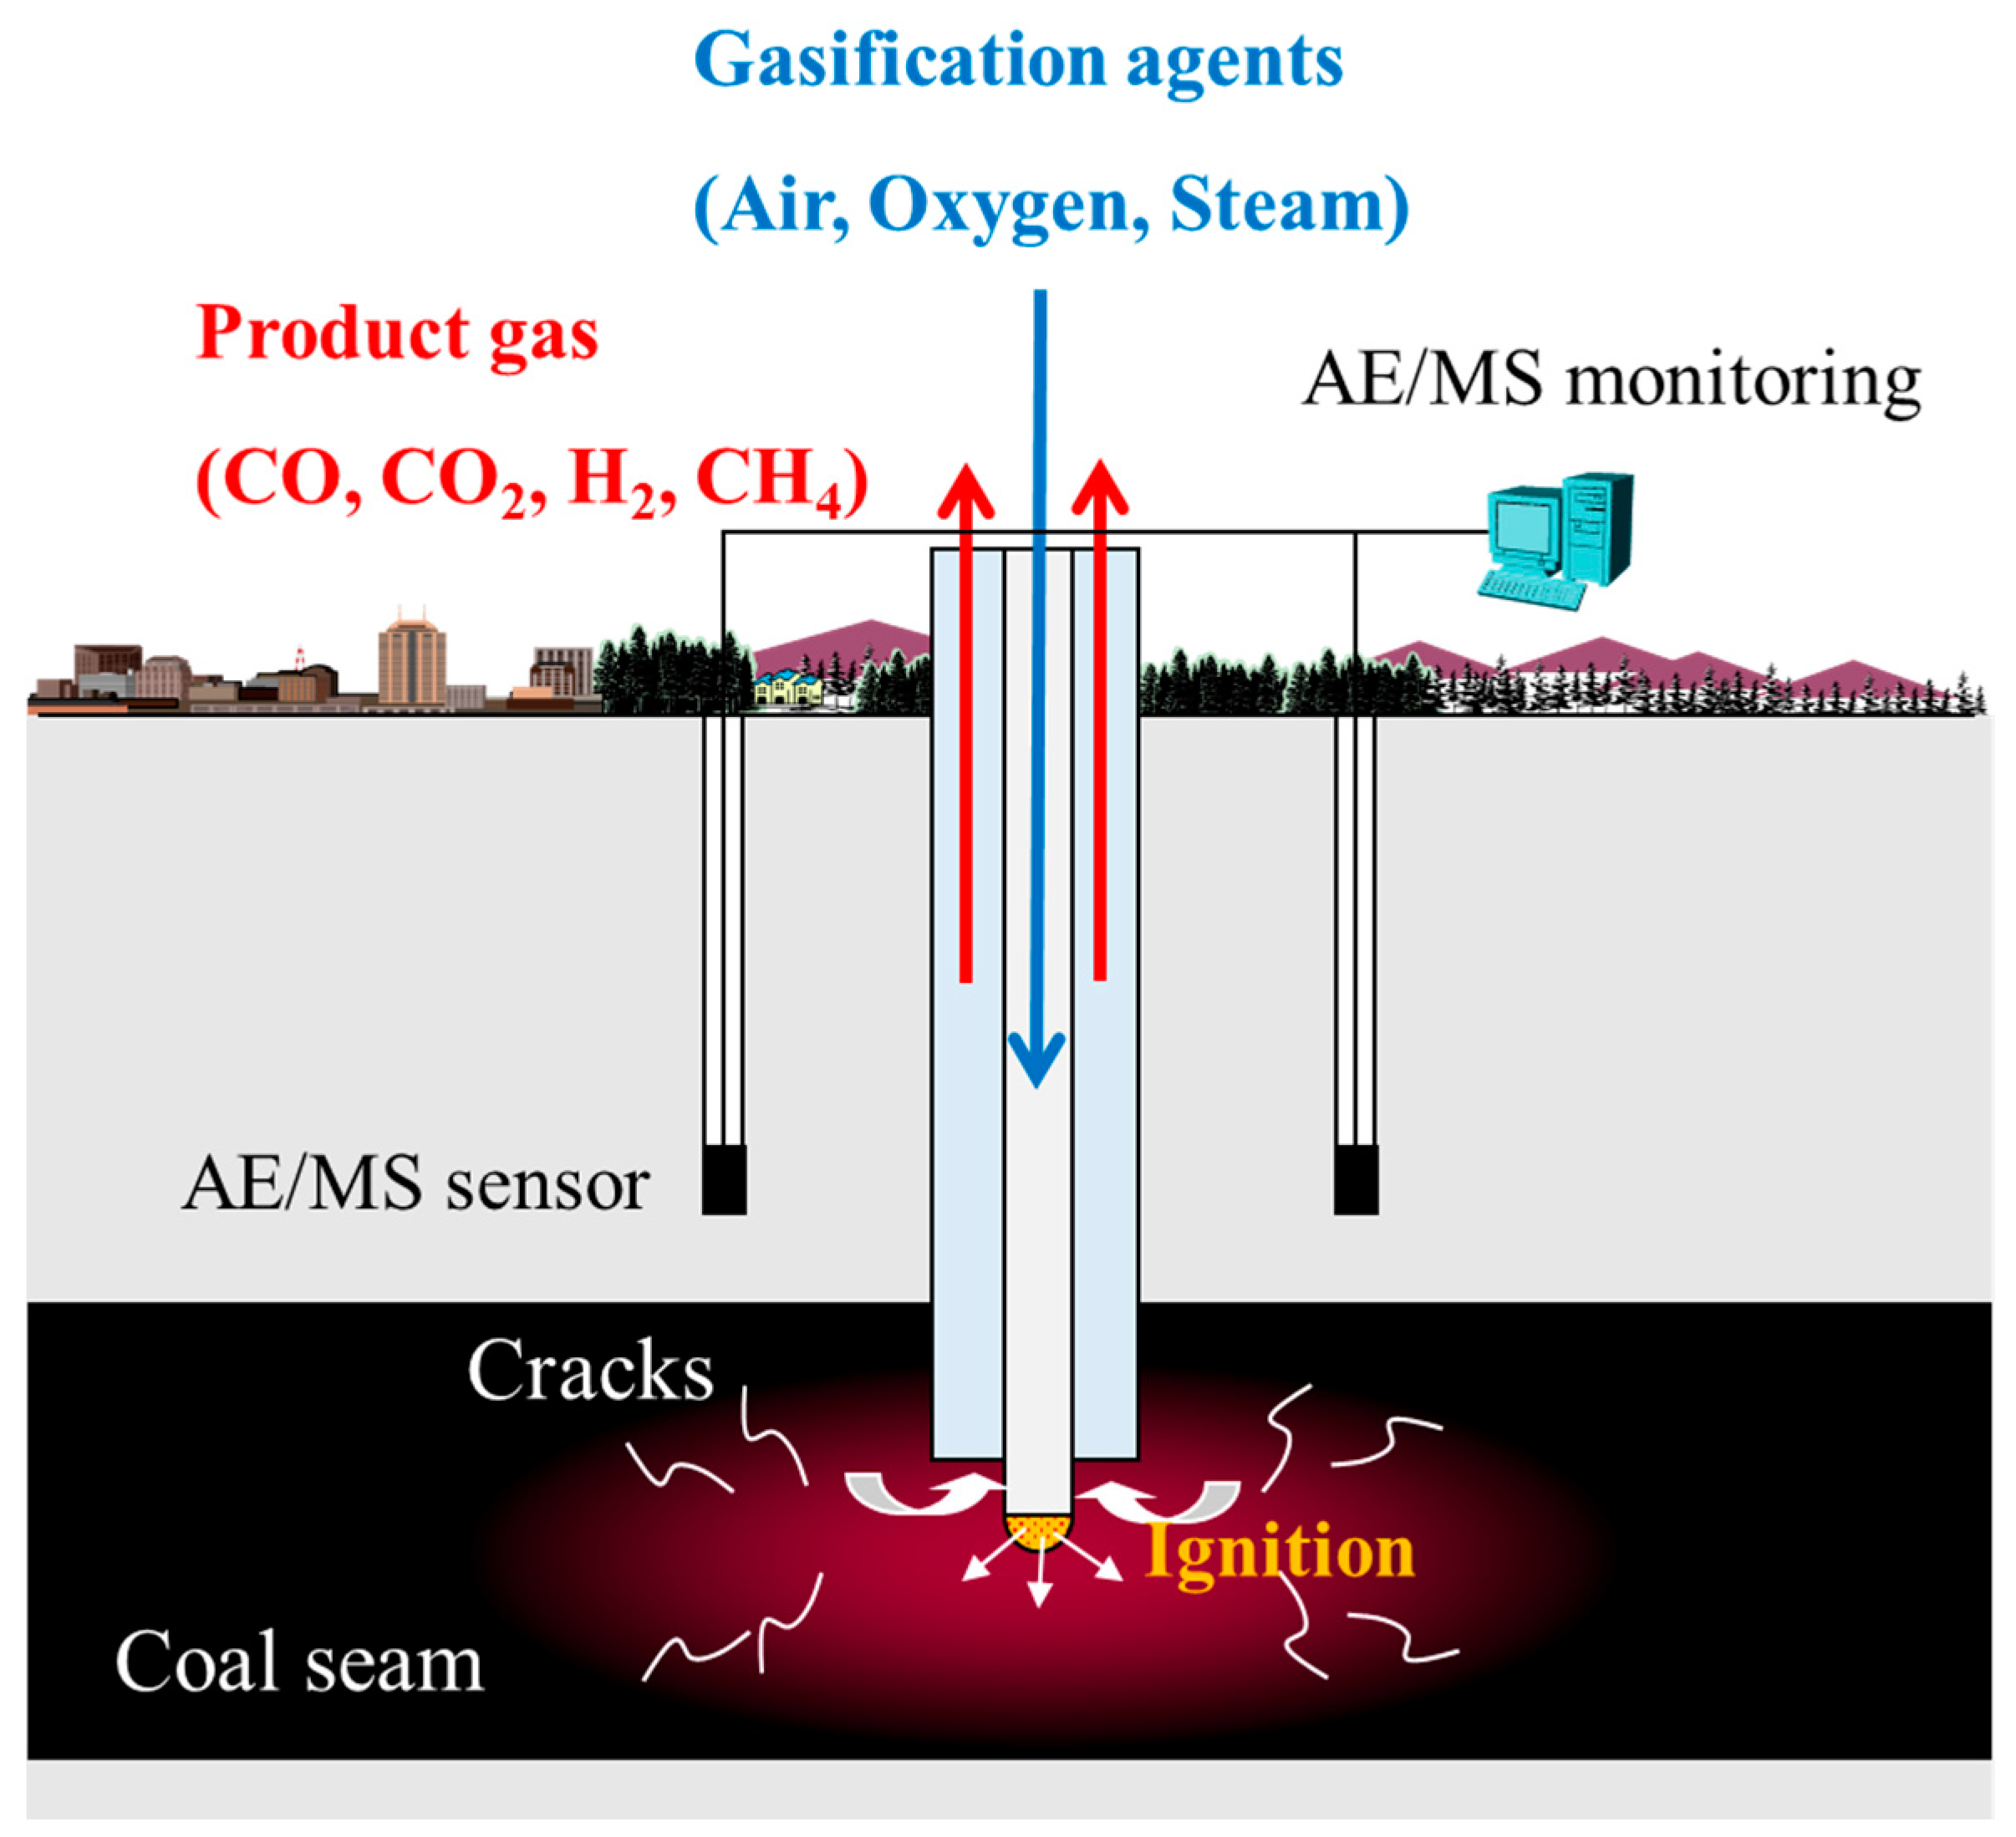
:1. Introduction
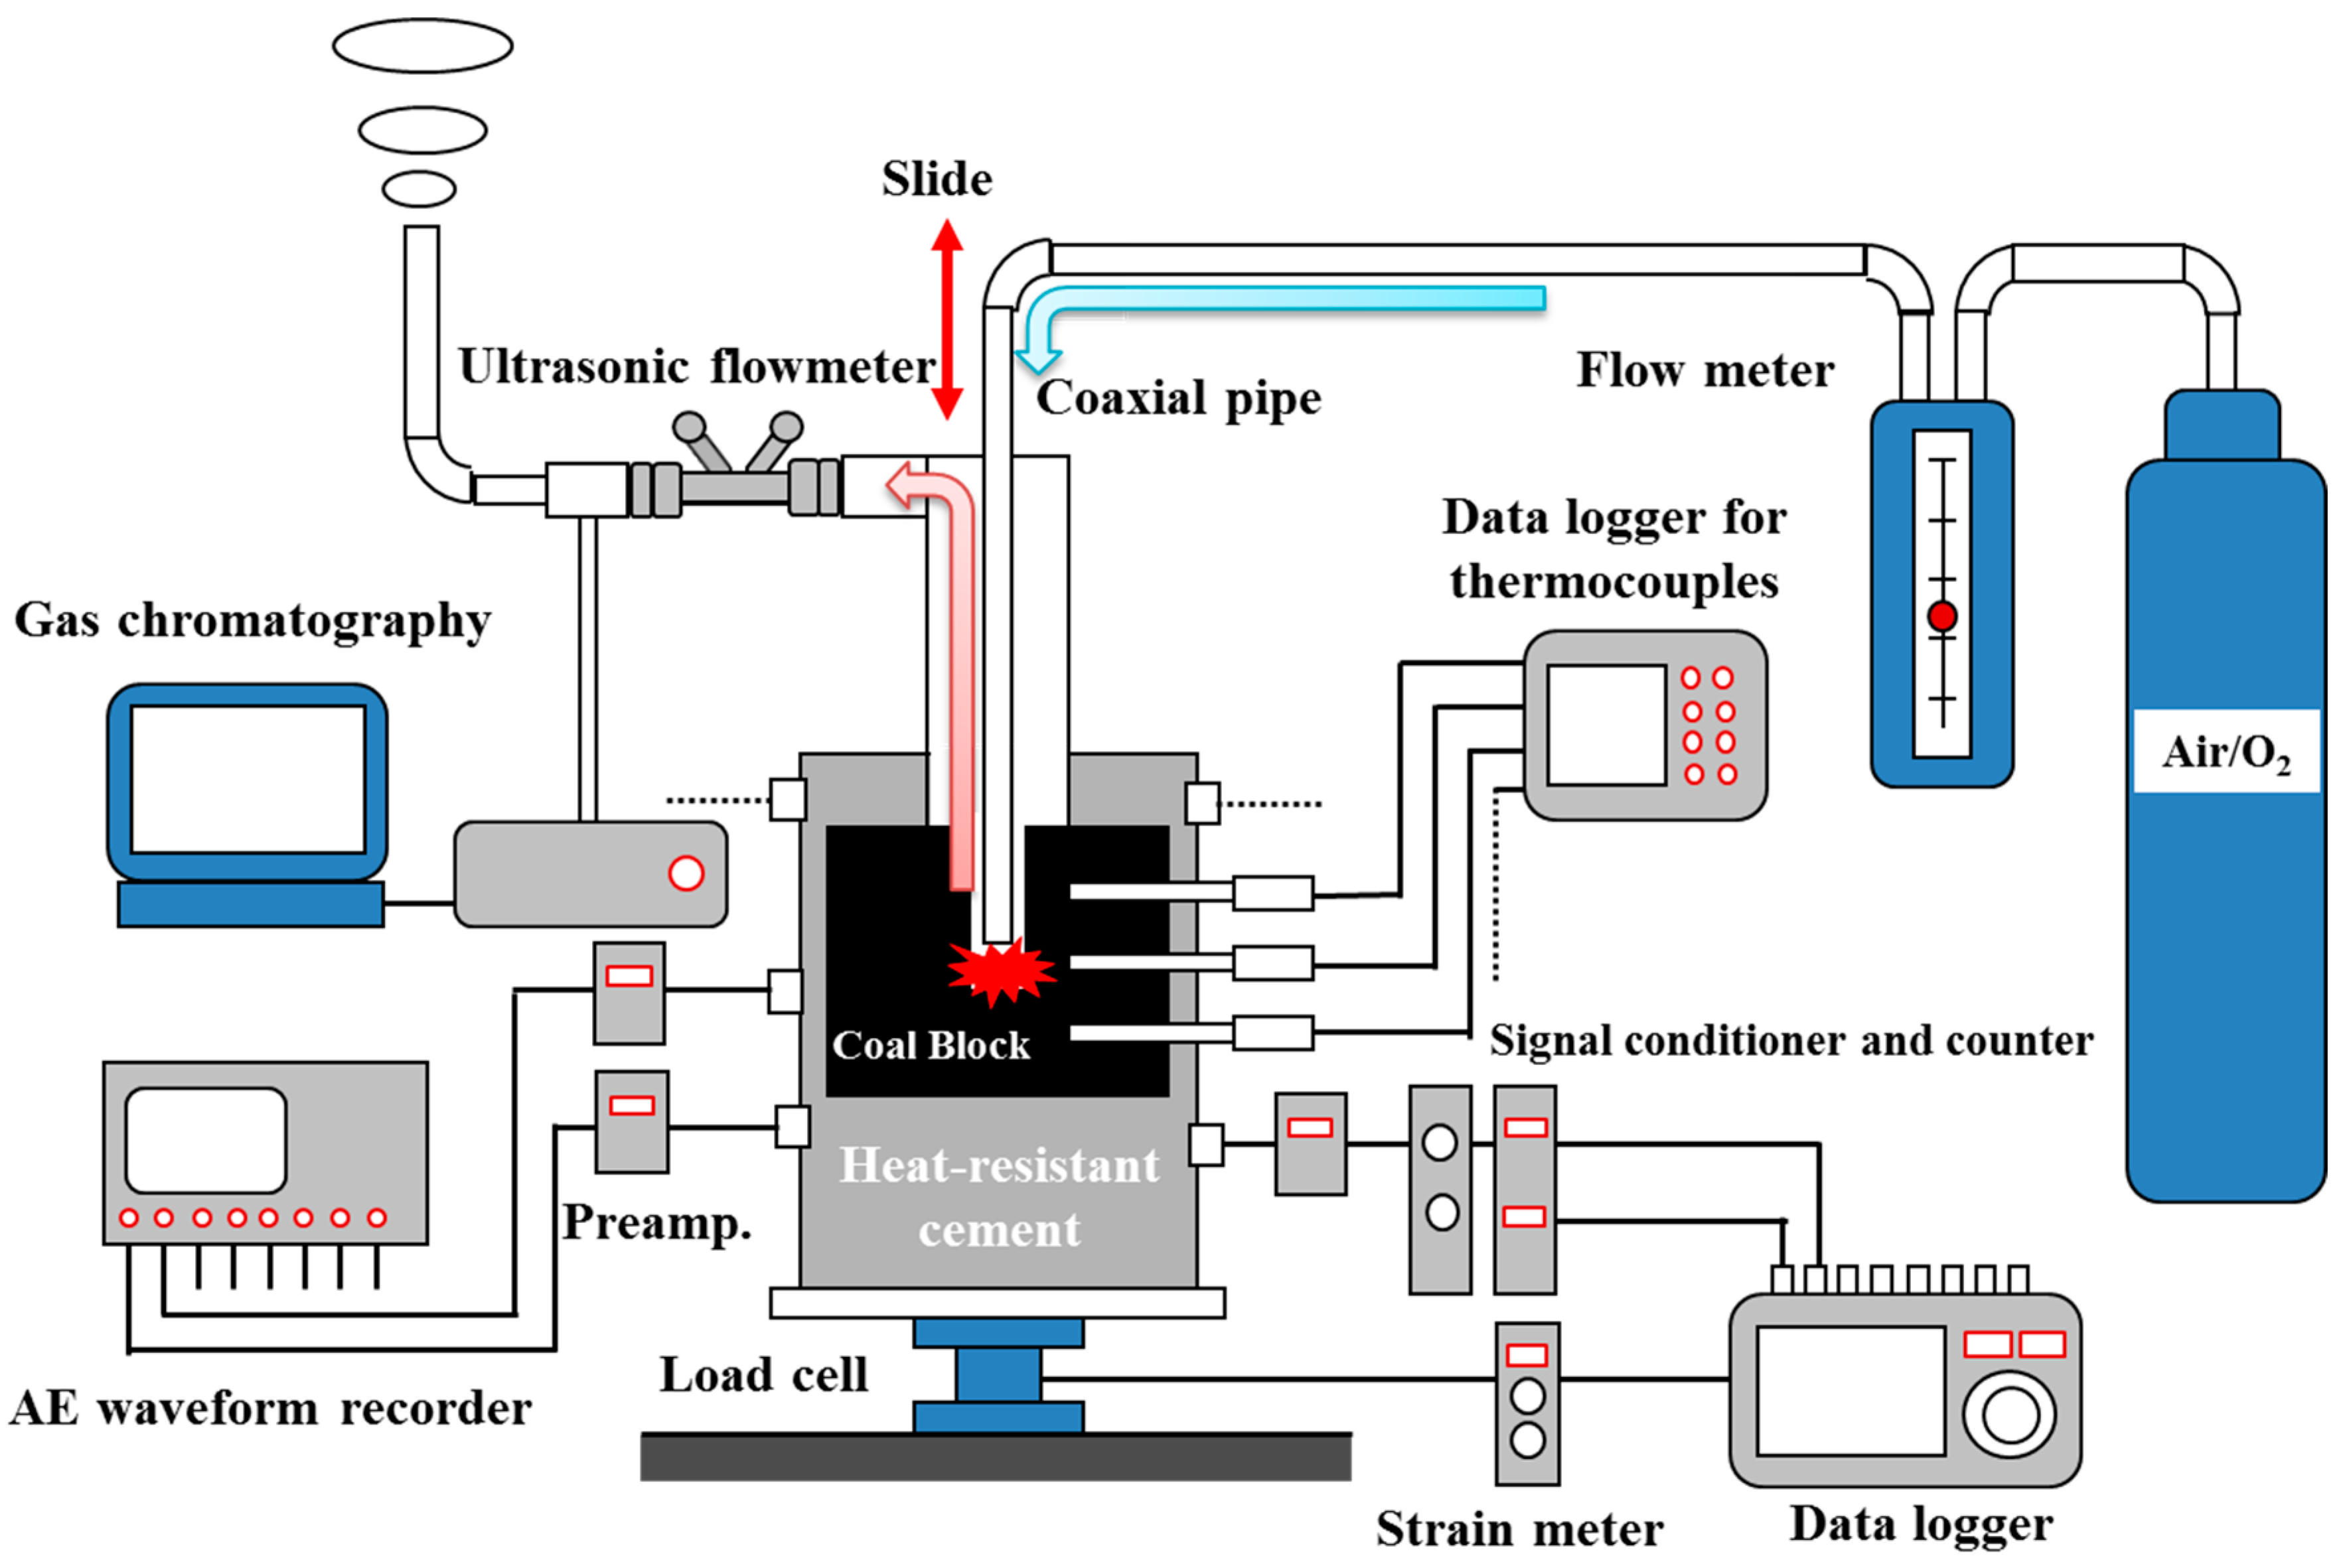
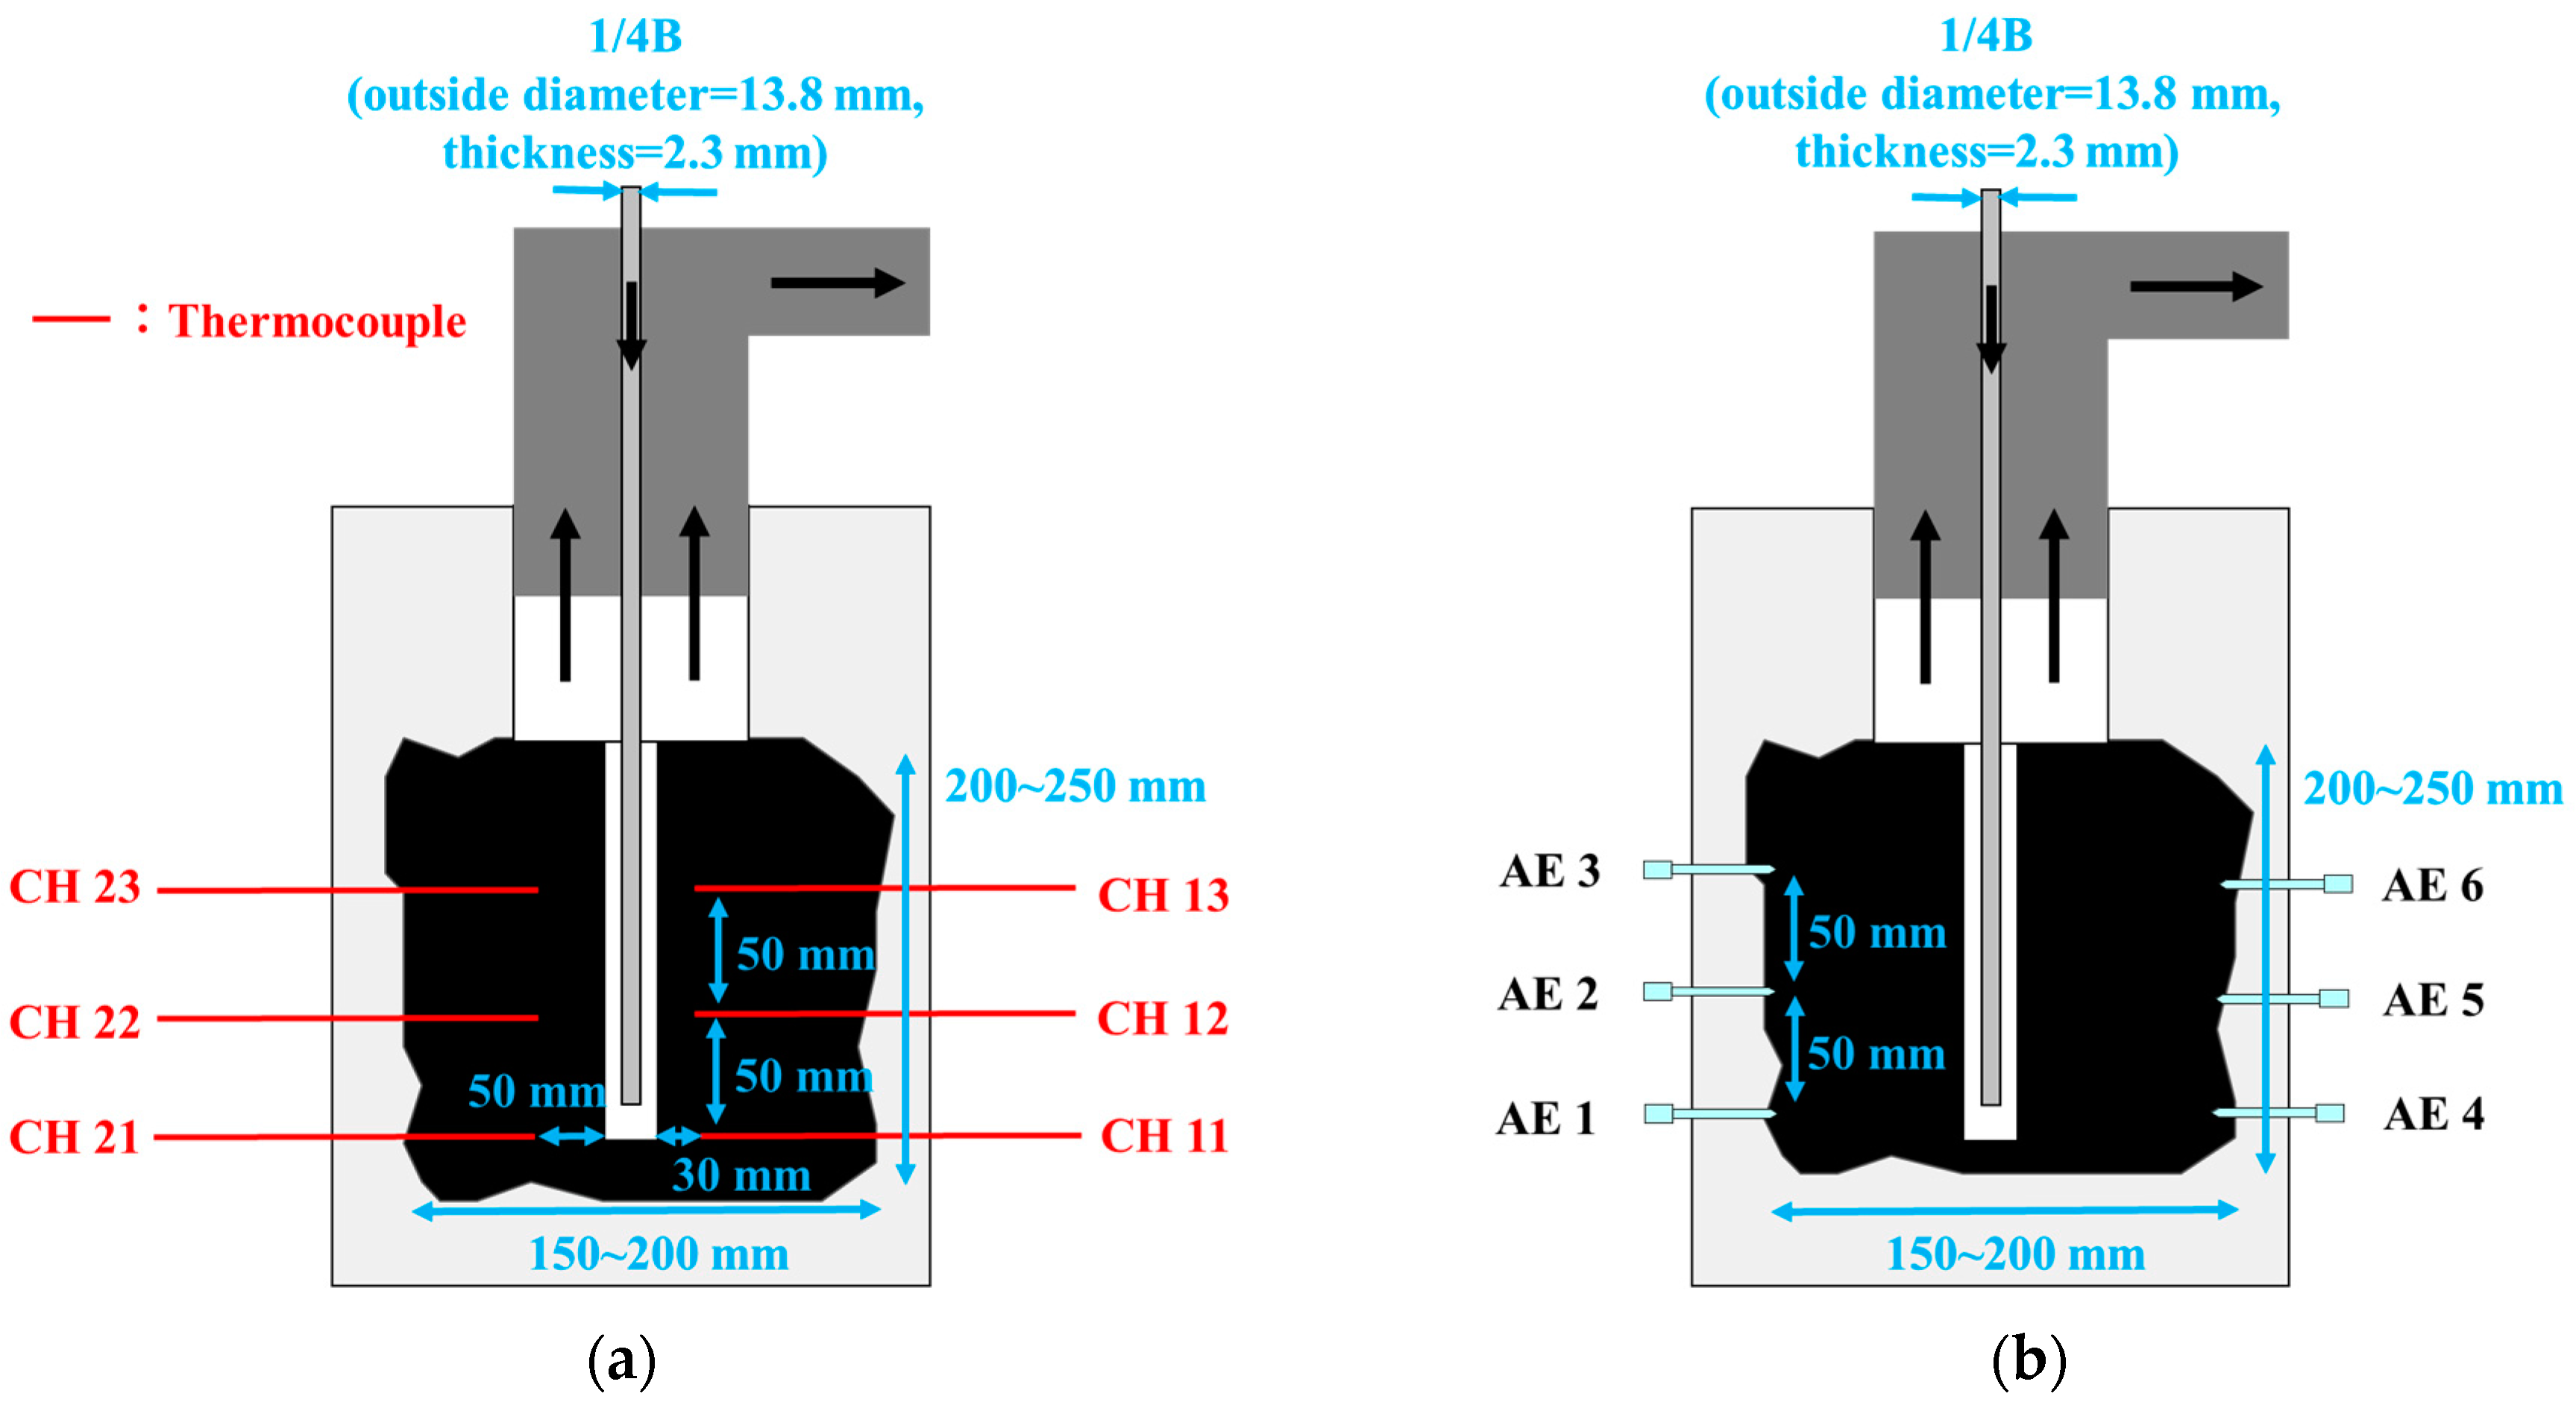
2. Materials and Methods
3. Results and Discussion
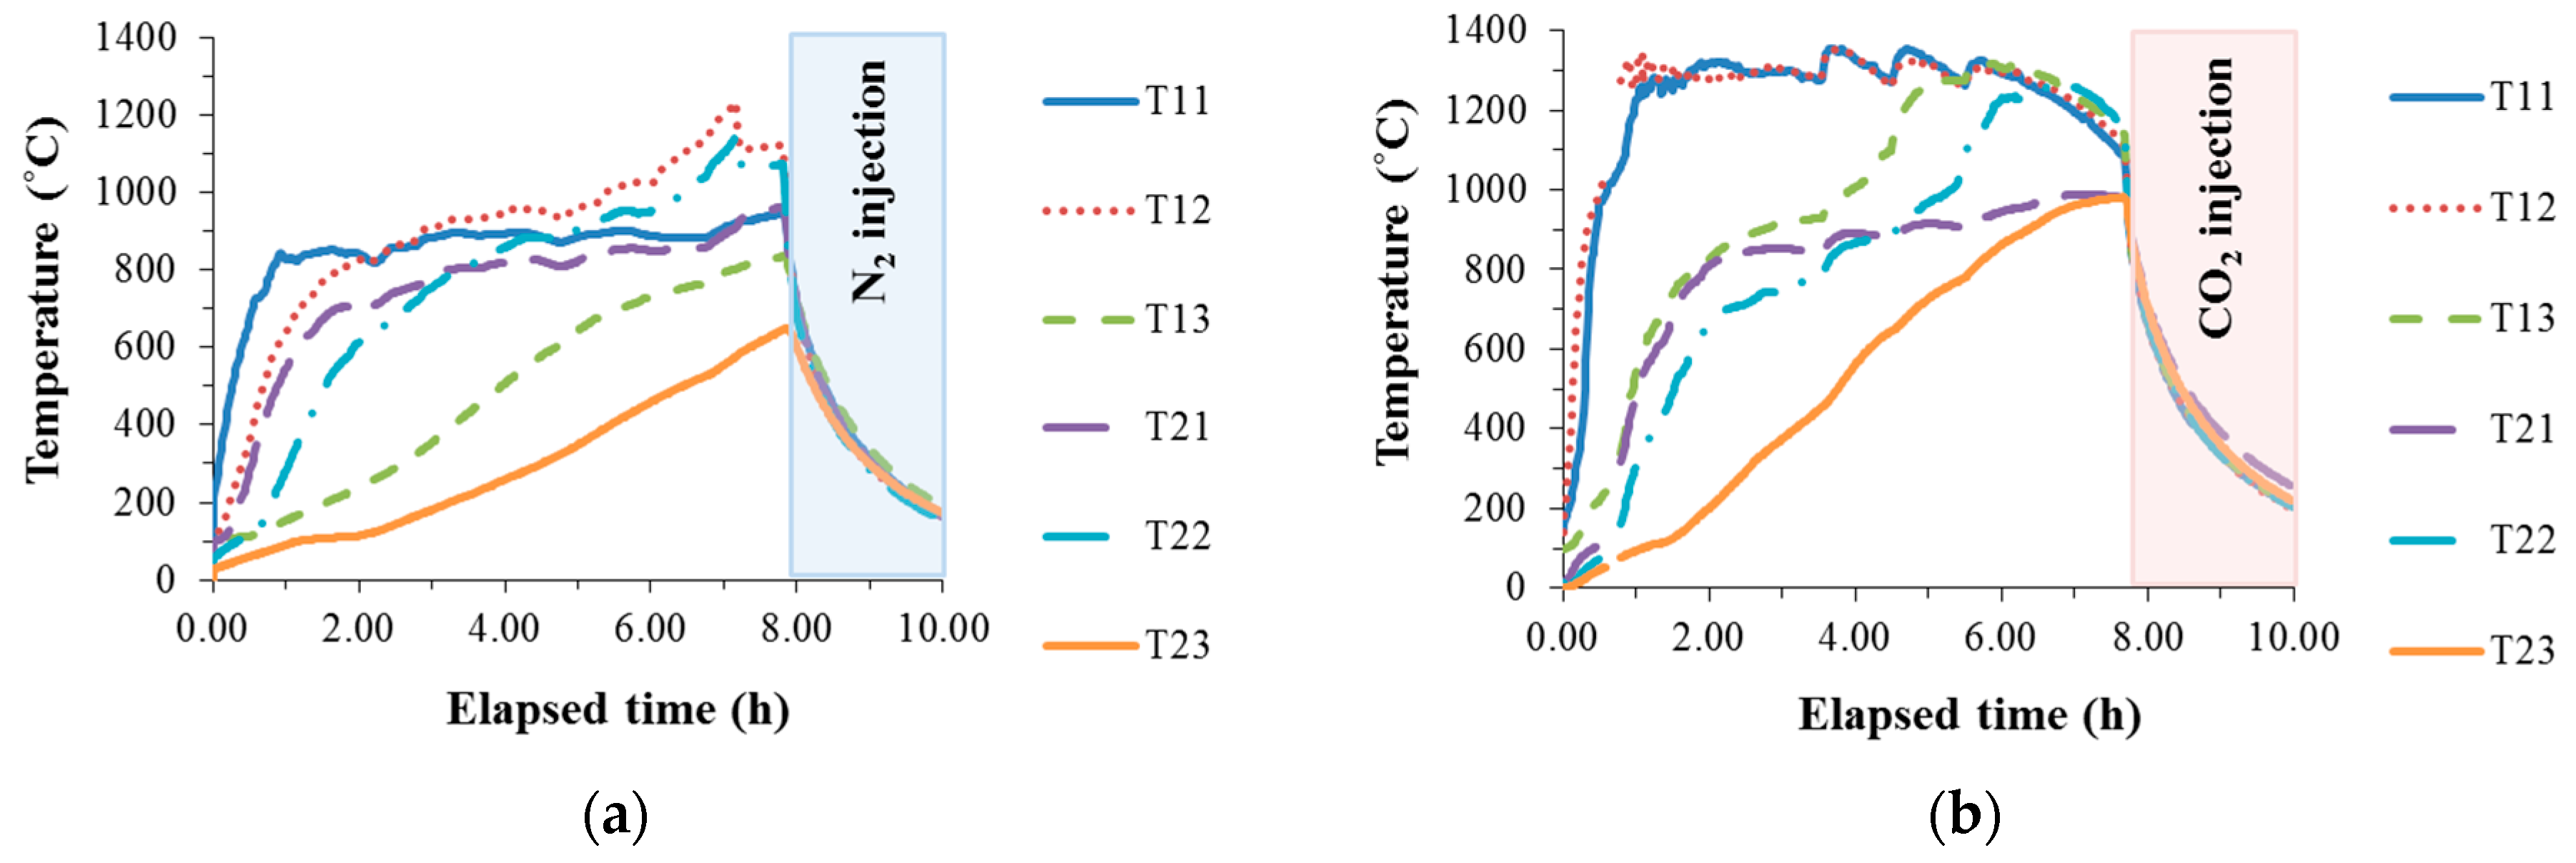
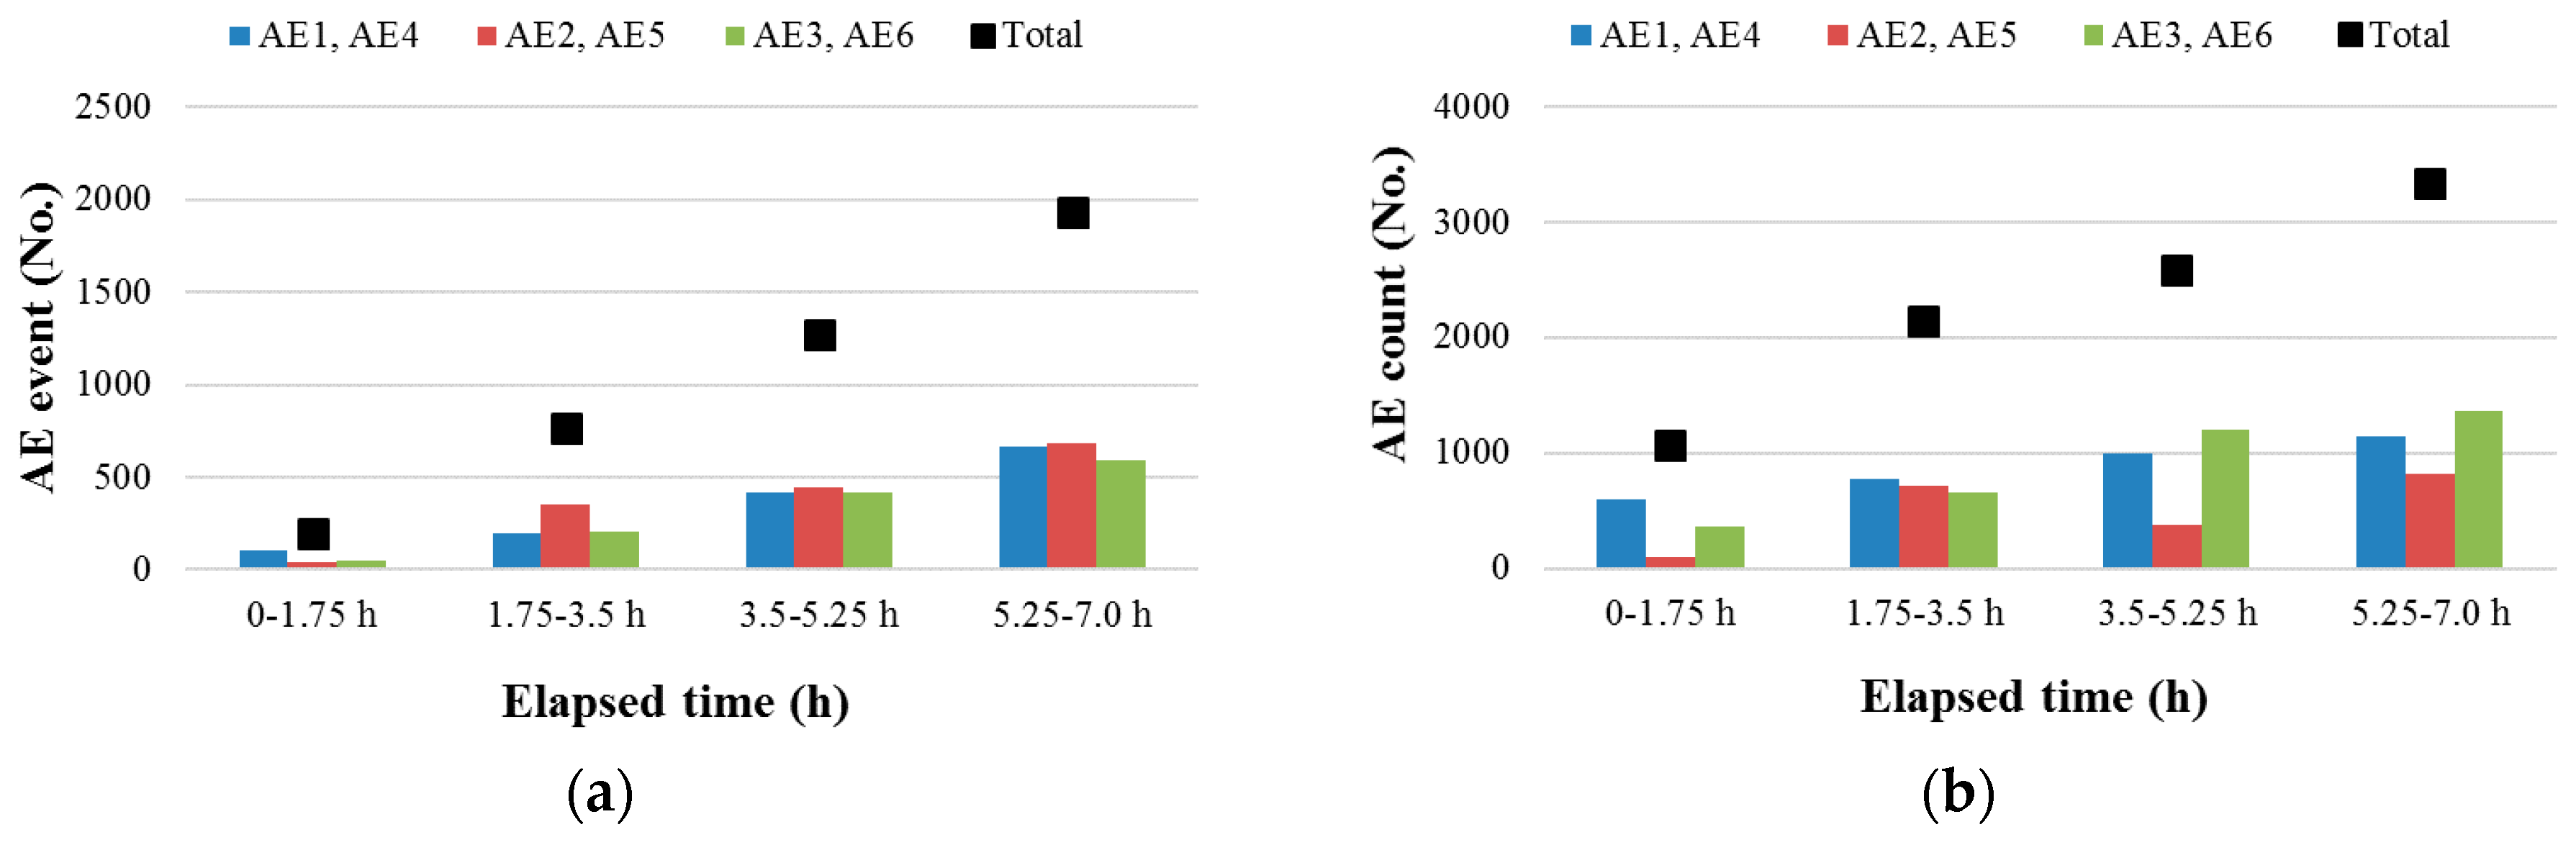
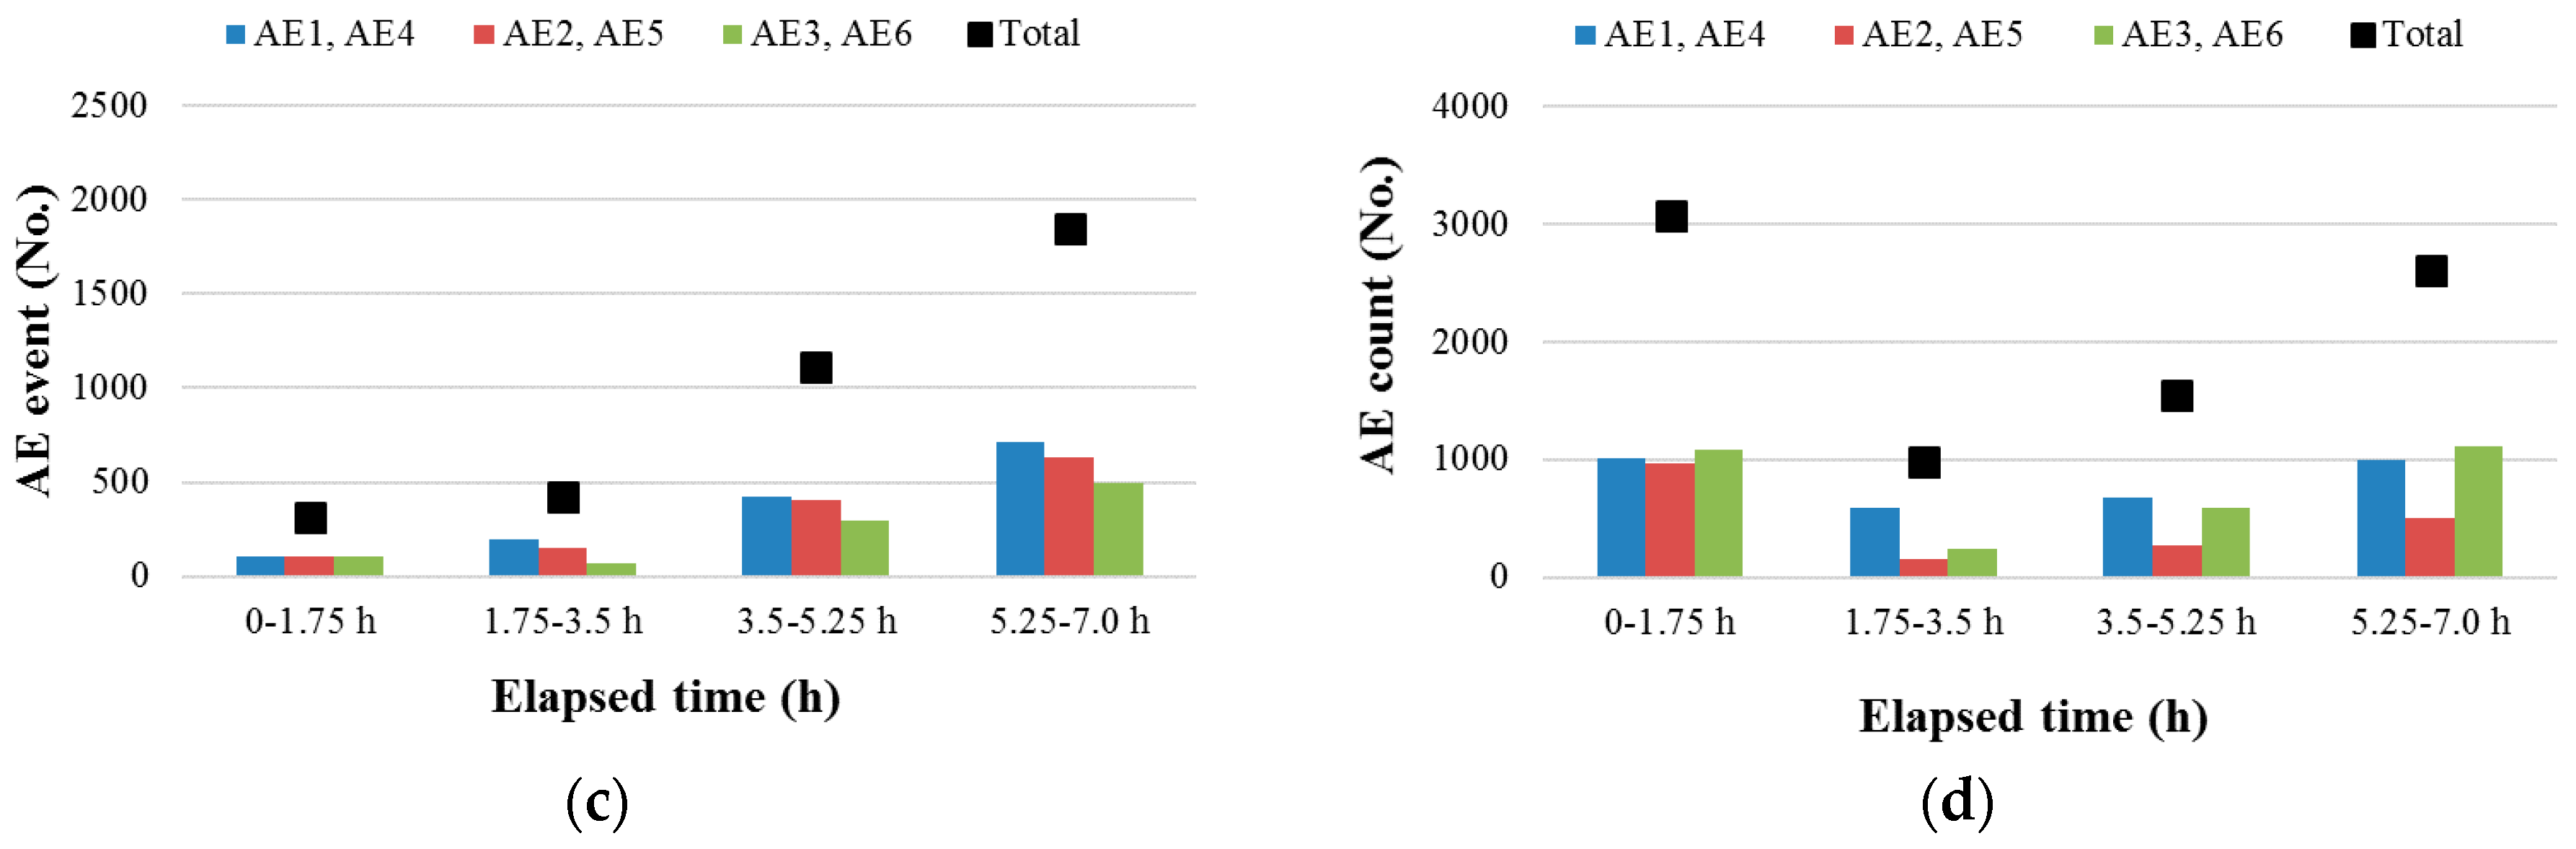
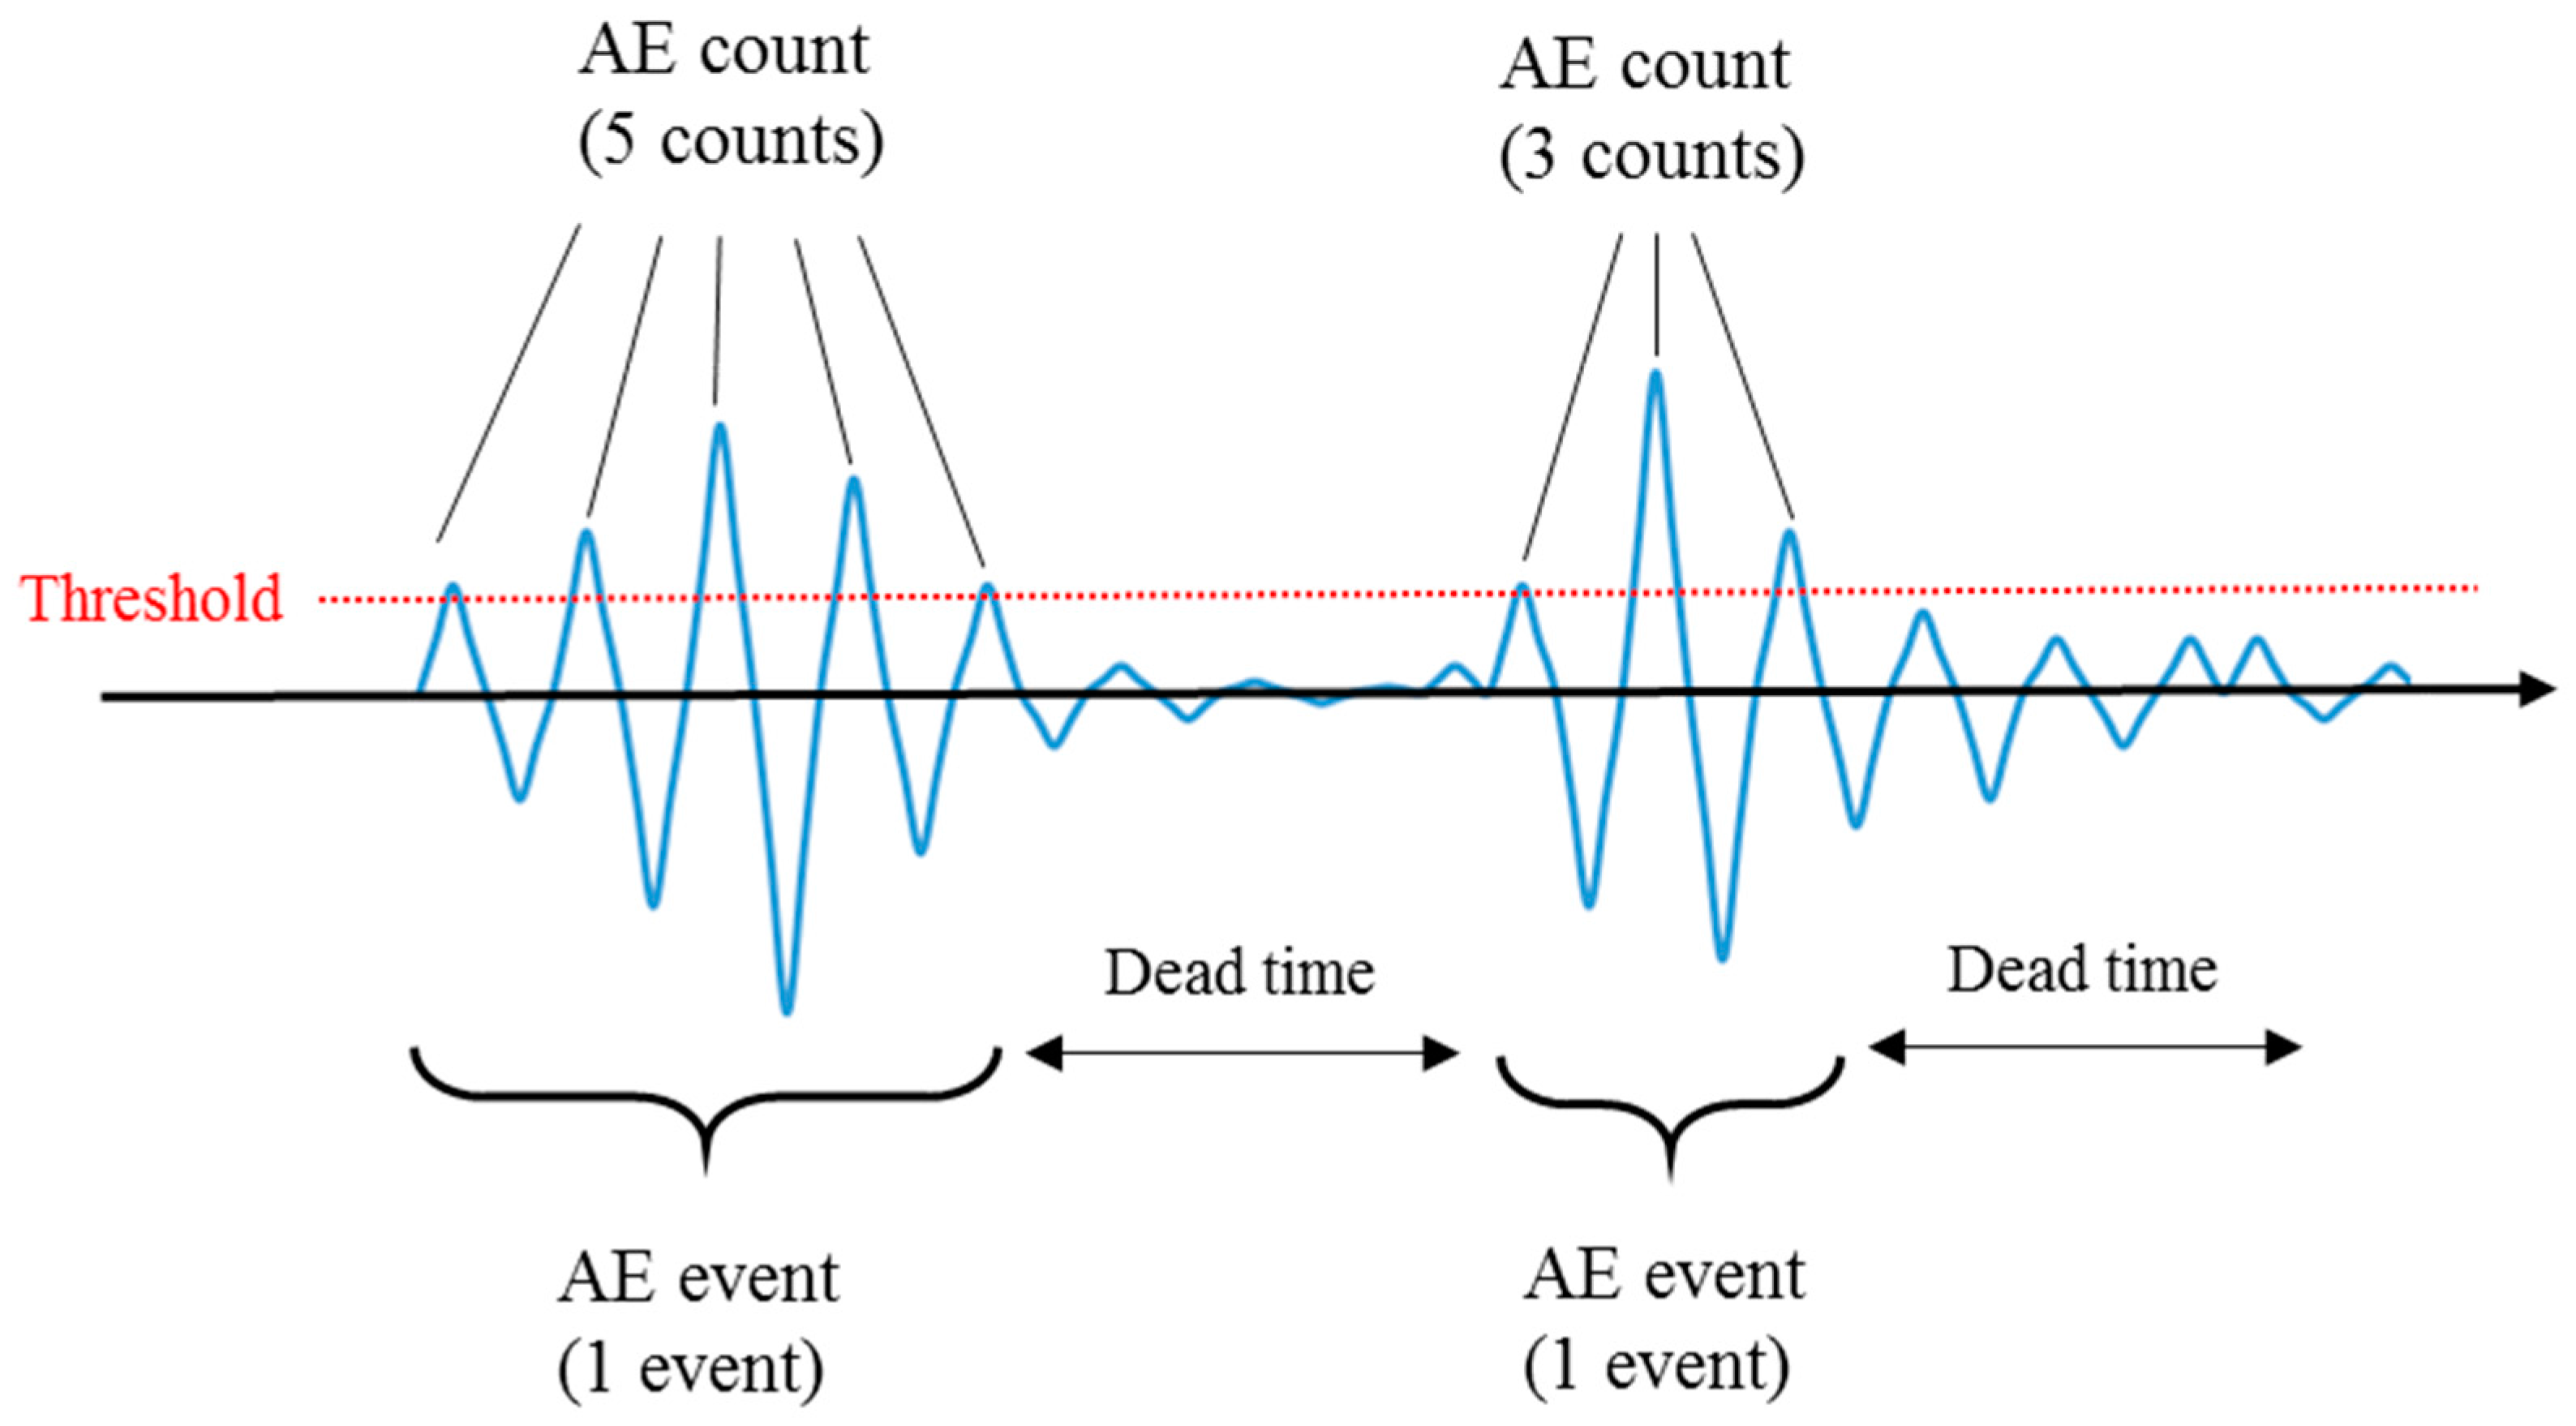
3.1. Temperature and AE
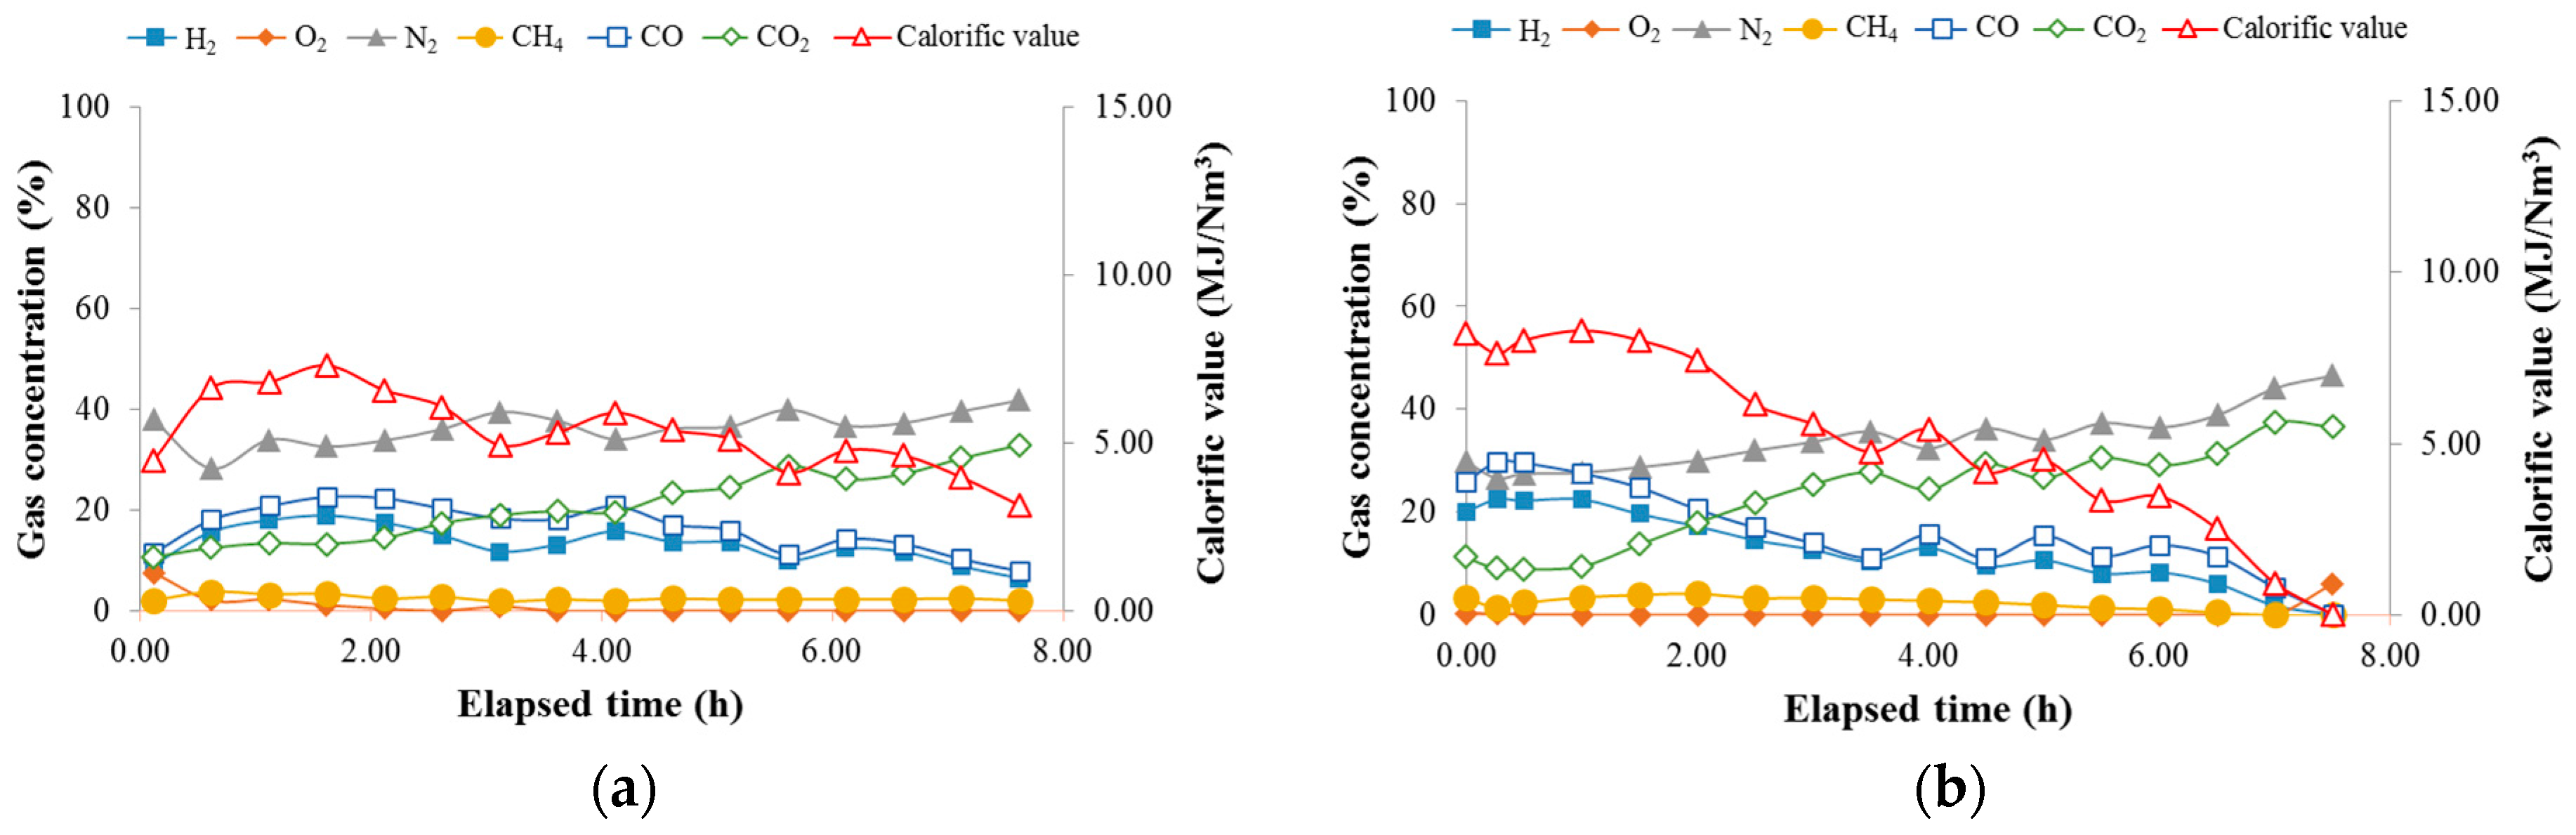
3.2. Product Gas Quality and Gasification Efficiency
4. Conclusions
Acknowledgments
Author Contributions
Conflicts of Interest
References
- Khadse, A.; Qayyumi, M.; Mahajani, S.; Aghalayam, P. Underground coal gasification: A new clean coal utilization technique for India. Energy 2007, 32, 2061–2071. [Google Scholar] [CrossRef]
- Porada, S.; Czerski, G.; Dziok, T.; Grzywacz, P.; Makowska, D. Kinetics of steam gasification of bituminous coals in terms of their use for underground coal gasification. Fuel Process. Technol. 2015, 130, 282–291. [Google Scholar] [CrossRef]
- Stańczyk, K.; Kapusta, K.; Wiatowski, M.; Świadrowski, J.; Smoliński, A.; Rogut, J.; Kotyrba, A. Experimental simulation of hard coal underground gasification for hydrogen production. Fuel 2012, 91, 40–50. [Google Scholar] [CrossRef]
- Yang, L.H.; Zhang, X.; Liu, S.Q.; Yu, L.; Zhang, W.L. Field test of large-scale hydrogen manufacturing from underground coal gasification (UCG). Int. J. Hydrogen Energy 2008, 33, 1275–1285. [Google Scholar] [CrossRef]
- Japan’s Energy White Paper 2016. Available online: http://www.enecho.meti.go.jp/about/whitepaper/2016pdf/whitepaper2016pdf_2_1.pdf (accessed on 28 December 2016).
- Yang, L.; Liang, J.; Yu, L. Clean coal technology—Study on the pilot project experiment of underground coal gasification. Energy 2013, 28, 1445–1460. [Google Scholar] [CrossRef]
- Nourozieh, H.; Kariznovi, M.; Chen, Z.; Abedi, J. Simulation Study of Underground Coal Gasification in Alberta Reservoirs: Geological Structure and Process Modeling. Energy Fuels 2010, 24, 3540–3550. [Google Scholar] [CrossRef]
- Luo, Y.; Coertzen, M.; Dumple, S. Comparison of UCG cavity growth with CFD model predictions. In Proceedings of the Seventh International Conference on CFD in the Minerals and Process Industries, Melbourne, Australia, 9–11 September 2009.
- Bhutto, A.W.; Bazmi, A.A.; Zahedi, G. Underground coal gasification: From fundamental to applications. Prog. Energy Combust. Sci. 2013, 39, 189–214. [Google Scholar] [CrossRef]
- Kaćur, J.; Durdán, M.; Laciak, M.; Flegner, P. Impact analysis of the oxidant in the process of underground coal gasification. Measurement 2014, 51, 147–155. [Google Scholar] [CrossRef]
- Stańczyk, K.; Howaniec, N.; Smoliński, A.; Świadrowski, J.; Kapusta, K.; Wiatowski, M.; Grabowski, J.; Rogut, J. Gasification of lignite and hard coal with air and oxygen enriched air in a pilot scale ex situ reactor for underground gasification. Fuel 2011, 90, 1953–1962. [Google Scholar] [CrossRef]
- Hongtao, L.; Feng, C.; Xia, P.; Kai, Y.; Shuqin, L. Method of oxygen-enriched two-stage underground coal gasification. Min. Sci. Technol. (China) 2011, 21, 191–196. [Google Scholar] [CrossRef]
- Su, F.Q.; Itakura, K.; Deguchi, G.; Ohga, K.; Goto, T. Laboratory Studies on Evaluation of Gasification Effect for Conversion of Coal Resources in Underground Coal Gasification (UCG) reactors. Adv. Mater. Res. 2012, 600, 111–115. [Google Scholar] [CrossRef]
- Su, F.Q.; Itakura, K.; Hamanaka, A.; Deguchi, G.; Ohga, K. Ex-situ UCG Model Experiments with Oxygen Enriched Air in an Artificial Coal Seam. In Proceedings of the International Conference on Material Science and Engineering Technology 2016, Phuket, Thailand, 14–16 October 2016.
- Su, F.Q.; Itakura, K.; Hamanaka, A.; Deguchi, G.; Ohga, K. Evaluation of gasification zone and energy recovery during UCG process with the Coaxial models. In Proceedings of the 5th Sustainable Energy and Environmental Sciences, Singapore, 22–23 February 2016.
- Hamanaka, A.; Itakura, K.; Su, F.Q.; Takahashi, K.; Satoh, K.; Deguchi, G.; Kodama, J. Model Experiment for Co-axial Underground Coal Gasification System Development. In Proceedings of the 24th World Mining Congress (Sustainability in Mining), Reo de Janeiro, Brazil, 18–21 October 2016.
- Hamanaka, A.; Itakura, K.; Su, F.Q.; Satoh, K.; Takahashi, K.; Deguchi, G.; Kodama, J.; Ohga, K. Development of Compact Underground Coal Gasification (UCG) System as a Local Energy Resource. In Proceedings of the International Symposium on Earth Science and Technology 2015, Fukuoka, Japan, 3–4 December 2015.
- Lokner, D. The Role of Acoustic Emission in the Study of Rock Fracture. Int. J. Rock Mech. Min. Sci. Geomech. Abstr. 1993, 30, 883–899. [Google Scholar] [CrossRef]
- Tang, C.A.; Liu, H.; Lee, P.K.K.; Tsui, Y.; Tham, L.G. Numerical studies of the influence of microstructure on rock failure in uniaxial compression—Part I: Effect of heterogeneity. Int. J. Rock Mech. Min. Sci. 2000, 37, 555–569. [Google Scholar] [CrossRef]
- Li, Y.P.; Chen, L.Z.; Wang, Y.H. Experimental research on pre-cracked marble under compression. Int. J. Solids Struct. 2005, 42, 2505–2516. [Google Scholar] [CrossRef]
- Zhang, M.; Shimada, H.; Sasaoka, T.; Matsui, K.; Dou, L. Seismic energy distribution and hazard assessment in underground coal mines using statistical energy analysis. Int. J. Rock Mech. Min. Sci. 2013, 64, 192–200. [Google Scholar] [CrossRef]
- Suzuki, T.; Ohtsu, M. Quantitative damage evaluation of structural concrete by a compression test based on AE rate process analysis. Constr. Build. Mater. 2004, 18, 197–202. [Google Scholar] [CrossRef]
- Su, F.Q.; Nakanowataru, T.; Itakura, K.; Ohga, K.; Deguchi, G. Evaluation of Structural Changes in the Coal Specimen Heating Process and UCG Model Experiments for Developing Efficient UCG Systems. Energies 2013, 6, 2386–2406. [Google Scholar] [CrossRef]
- Su, F.Q.; Itakura, K.; Deguchi, G.; Ohga, K.; Kaiho, M. Evaluation of Energy Recovery from Laboratory Experiments and Small-scale Field Tests of Underground Coal Gasification (UCG). J. MMIJ 2015, 131, 203–218. [Google Scholar] [CrossRef]
- Wiatowski, M.; Kapusta, K.; Świadrowski, J.; Cybulski, K.; Ludwik-Pardala, M.; Grabowski, J.; Stańczyk, K. Technological aspects of underground coal gasification in the Experimental ‘‘Barbara’’ Mine. Fuel 2015, 159, 454–462. [Google Scholar] [CrossRef]


| Calorific Value (MJ/kg) | Proximate Analysis (wt. %) | Ultimate Analysis (wt. %) | |||||||
|---|---|---|---|---|---|---|---|---|---|
| Moisture | Ash | Volatiles | Fixed Carbon | C | H | N | S | O | |
| 31.48 | 1.1 | 8.1 | 44.9 | 45.9 | 75.0 | 5.78 | 1.23 | 0.07 | 9.71 |
| Average Calorific Value (MJ/Nm3) | Total Product Flow (m3) | N2, O2 Free | ||||
|---|---|---|---|---|---|---|
| H2 (%) | CH4 (%) | CO (%) | CO2 (%) | |||
| Experiment 1 | 6.39 | 1.57 | 29.34 | 5.40 | 38.20 | 22.11 |
| Experiment 2 | 8.11 | 2.26 | 33.65 | 5.19 | 45.23 | 17.61 |
| Component | Experiment 1 | Experiment 2 | ||||
|---|---|---|---|---|---|---|
| Total Amount of Product Gas | Balance of C Element | Total Amount of Product Gas | Balance of C Element | |||
| mol | mol | kg | mol | mol | kg | |
| CH4 | 2.32 | 2.32 | 0.03 | 3.64 | 3.64 | 0.04 |
| CO | 15.87 | 15.87 | 0.19 | 30.11 | 30.11 | 0.36 |
| CO2 | 11.45 | 11.45 | 0.14 | 11.82 | 11.82 | 0.14 |
| C2H4 | 0.49 | 0.98 | 0.01 | 0.84 | 1.68 | 0.02 |
| C2H6 | 0.12 | 0.24 | 0 | 0.15 | 0.30 | 0.00 |
| C3H6 | 0.06 | 0.18 | 0 | 0.00 | 0.00 | 0.00 |
| C3H8 | 0.02 | 0.06 | 0 | 0.00 | 0.00 | 0.00 |
| Total | 30.33 | 31.1 | 0.37 | 46.56 | 47.55 | 0.57 |
| Coal Calorific Value (MJ/kg) | Energy of Product Gas (MJ) | Amount of C Element (kg) | Gasified Coal (kg) | Gasification Efficiency (%) | |
|---|---|---|---|---|---|
| Experiment 1 | 31.48 | 11.21 | 0.37 | 0.50 | 71.22 |
| Experiment 2 | 19.72 | 0.57 | 0.76 | 82.42 |
© 2017 by the authors. Licensee MDPI, Basel, Switzerland. This article is an open access article distributed under the terms and conditions of the Creative Commons Attribution (CC BY) license ( http://creativecommons.org/licenses/by/4.0/).
Share and Cite
Hamanaka, A.; Su, F.-q.; Itakura, K.-i.; Takahashi, K.; Kodama, J.-i.; Deguchi, G. Effect of Injection Flow Rate on Product Gas Quality in Underground Coal Gasification (UCG) Based on Laboratory Scale Experiment: Development of Co-Axial UCG System. Energies 2017, 10, 238. https://doi.org/10.3390/en10020238
Hamanaka A, Su F-q, Itakura K-i, Takahashi K, Kodama J-i, Deguchi G. Effect of Injection Flow Rate on Product Gas Quality in Underground Coal Gasification (UCG) Based on Laboratory Scale Experiment: Development of Co-Axial UCG System. Energies. 2017; 10(2):238. https://doi.org/10.3390/en10020238
Chicago/Turabian StyleHamanaka, Akihiro, Fa-qiang Su, Ken-ichi Itakura, Kazuhiro Takahashi, Jun-ichi Kodama, and Gota Deguchi. 2017. "Effect of Injection Flow Rate on Product Gas Quality in Underground Coal Gasification (UCG) Based on Laboratory Scale Experiment: Development of Co-Axial UCG System" Energies 10, no. 2: 238. https://doi.org/10.3390/en10020238