Article

An Optimized Energy Management Strategy for Preheating Vehicle-Mounted Li-ion Batteries at Subzero Temperatures

1
State Key Laboratory of Automotive Simulation and Control, Jilin University, Changchun 130022, China
2
FAW Bus and Coach Co., Ltd., Changchun 130033, China
*
Author to whom correspondence should be addressed.
Energies 2017, 10(2), 243; https://doi.org/10.3390/en10020243
Submission received: 5 December 2016 / Revised: 14 February 2017 / Accepted: 15 February 2017 / Published: 17 February 2017
(This article belongs to the Collection Electric and Hybrid Vehicles Collection)

Abstract

:
This paper presents an optimized energy management strategy for Li-ion power batteries used on electric vehicles (EVs) at low temperatures. In low-temperature environments, EVs suffer a sharp driving range loss resulting from the energy and power capability reduction of the battery. Simultaneously, because of Li plating, battery degradation becomes an increasing concern as the temperature drops. All these factors could greatly increase the total vehicle operation cost. Prior to battery charging and vehicle operating, preheating the battery to a battery-friendly temperature is an approach to promote energy utilization and reduce total cost. Based on the proposed LiFePO4 battery model, the total vehicle operation cost under certain driving cycles is quantified in the present paper. Then, given a certain ambient temperature, a target preheating temperature is optimized under the principle of minimizing total cost. As for the preheating method, a liquid heating system is also implemented on an electric bus. Simulation results show that the preheating process becomes increasingly necessary with decreasing ambient temperature, however, the preheating demand declines as driving range grows. Vehicle tests verify that the preheating management strategy proposed in this paper is able to save on total vehicle operation costs.

1. Introduction

Vehicle-mounted Li-ion power batteries are the only energy supply system of electric vehicles (EVs), with limited electricity stored inside. Unfortunately, the battery performance is pretty susceptible to the ambient temperature. Under extreme temperature conditions, the energy efficiency of a battery could be rather low. In addition, battery degradation is accelerated at extremely low temperatures. These factors not only greatly shorten the driving range of vehicles, but also cause great damage to batteries [1,2]. In other words, whether the working temperature of battery is appropriate concerns not only the safety of an EV, but also the efficiency and life of the battery. Unfortunately, conventional battery thermal management systems (BTMSs) generally focus on how to cool batteries at high temperatures. Existing research on preheating batteries at low temperatures is mainly confined to heating battery up to 0 °C before battery charging and vehicle operation, which just meets the basic requirements [3,4,5,6]. To the authors’ knowledge, few published papers have illustrated: (1) what the preheating target temperature should be; (2) how to implement the preheating system on a real EV. Therefore, it is crucial to study battery preheating methods from the perspective of energy utilization, with the aim of reducing total vehicle operation cost.
Research regarding vehicle-mounted batteries usually begins with battery modeling since it has been widely used to predict the electrochemical and thermal performance of batteries [7,8]. Generally two approaches are used in electrothermal modeling. The first approach involves calculating the heat generated in a battery based on an electrochemical model [9], and the other approach involves the use of a simplified lumped mass model based on an equivalent circuit model and certain assumptions [10]. However, because the former kind of models contain many dimensional and material parameters, which are difficult to obtain, and governing equations that make the computation complicated, this kind of models may not be practical for modeling the battery pack [7,8]. On the other hand, through the second approach, Agarwal et al. [11] developed a battery model for discharging and charging power control and lifetime estimation; Ahmed et al. [12] studied the effects of temperature on internal resistances on LiMnNiO and LiFePO4 batteries; By using electrochemical impedance spectroscopy tests, Samadani et al. [13] developed a real-time empirical model which demonstrates up to 6% improvement compared to Thevenin models. Based on a comprehensive battery model which takes battery performance, heat generation and degradation into consideration, vehicle all-electric range, fuel economy and battery life of a plug-in hybrid electric vehicle (PHEV) are studied under different usage scenarios [14]. Moreover, with no need to solve the complicated thermal-electrochemical equations, these proposed models directly calculate the heat generation rate from the internal resistance, improving its applicability in the battery management system (BMS) of electric vehicles due to its computationally efficiency.
On the other hand, battery aging has increasingly become a worrying concern when vehicles operate at subzero temperatures, resulting in battery capacity loss along with a decrease in voltage [14] and impedance increment and even internal short circuits of the cells [15]. According to Petzl et al. [16], increased battery current and state-of-charge (SOC) aggravate lithium plating and thus induce stronger degradation due to enhanced electrolyte degradation. Furthermore, evidences also show that battery degradation was aggravated by a higher charge cut-off voltage [17]. In most cases, the degradation rate for each ageing process is strongly related to certain operating conditions such as temperature, charge and discharge rate, depth-of-discharge (DOD) and SOC region [18]. In order to explore in-depth the degradation mechanisms, differential voltage analysis and cell opening investigation have been widely used by many scholars [16]. Generally, ageing can be categorized into three groups based on the symptoms: (1) loss of active electrode material, (2) loss of cyclable Li and (3) loss of conductivity in electrodes or electrolyte [19]. At subzero temperatures, battery degradation becomes much more severe with decreasing temperature because of the presence of a specific mechanism: Li plating [20]. Often, battery cycle life tests are performed under accelerated conditions such as elevated temperatures, high DOD or high current rates. Based on Arrhenius Law and a large number of test data, Wang et al. [21,22] established a semi-empirical life model to predict calendar-life loss. This model has been widely adopted and further developed, but for actual vehicle usage it should be modified because the battery is subjecteto complex load profiles.
Many different approaches and attaching management strategies for heating up batteries have been imagined in previous studies, including forced air, liquids, heat pipes, phase change materials (PCMs), thermoelectric and battery internal self-heating [18,23]. However, the studies show that neither natural nor forced air convection can efficiently dissipate the heat in large-scale batteries [24]. On the other hand, battery internal heating has engaged scholars’ interest. Ji et al. [25] evaluated several different heating strategies from the aspects of energy consumption, heating time, heating efficiency and system cost. When sinusoidal alternating current (AC) is used to achieve battery self-heating, Zhang et al. [26] pointed out that the heating rate increases with higher amplitude, lower frequency and better thermal insulation. Pesaran et al. [27] commented that compared with external heating, internal heating achieved not only a faster heating rate, but also a more uniform temperature distribution. However, internal heating with frequent AC may cause severe battery degradation. As for other candidates such as heat pipes and PCM, although simulation results may indicate that they are viable solutions for EVs [28], when it comes to real application on automobiles, some potential uncertainty may discourage their being used. For example, they may be faced with low heating efficiency or poor reliability in real use. In contrast, liquid heating is prefered in this paper because it is an optimal compromise between heating efficiency, device cost and system reliability.
A great variety of optimization methods have been applied successfully to various engineering problems in automotive applications, achieving good performance. Optimization tools such as fuzzy logic, neural networks, heuristic rules and deterministic methods are widely used in power management, component sizing and battery thermal performance optimization of EVs. Song et al. [29] used dynamic programing (DP) to optimize the energy management in a hybrid energy storage system, but the disadvantage is that a huge computational effort is required to find the optimal value. Bauer et al. [30] utilized Pontryagin’s maximum principle (PMP) to solve the thermal and energy battery management optimization problem, which undeniably provided a competent solution but made the optimization process complicated with too many state equations involved. In the present paper, a non-dominated sorting genetic algorithm II (NSGA-II) is used due to its convenience and efficiency.
In this paper, we manage to optimize the preheating process while answering the following questions: (1) how to establish a comprehensive battery model for automotive analysis; (2) how to quantify the cost of vehicle operation; (3) how to determine the target preheating temperature; (4) how to arrange the preheating system on a real electric bus. The remainder of this paper is structured as follows: Section 2 presents an integrated battery model which not only describes the electro-thermal characters of a battery, but also takes the variation of capacity caused by aging into consideration. Section 3 deduces the total vehicle operation cost under certain driving cycles, with total cost divided into electricity cost and battery fade cost. Section 4 determines the preheating target temperatures under different ambient temperatures by using NSGA-II algorithm. Section 5 introduces the organization and control strategies of the preheating system. The performance of the preheating system is also assessed in this section. Section 6 conducts a road test to verify the accuracy of proposed battery model, the rationality of proposed energy management strategy and the robustness of implemented preheating system. Section 7 draws some conclusions and presents some discussion.

2. Battery Model Consisting of Electro-Thermal and Degradation Models

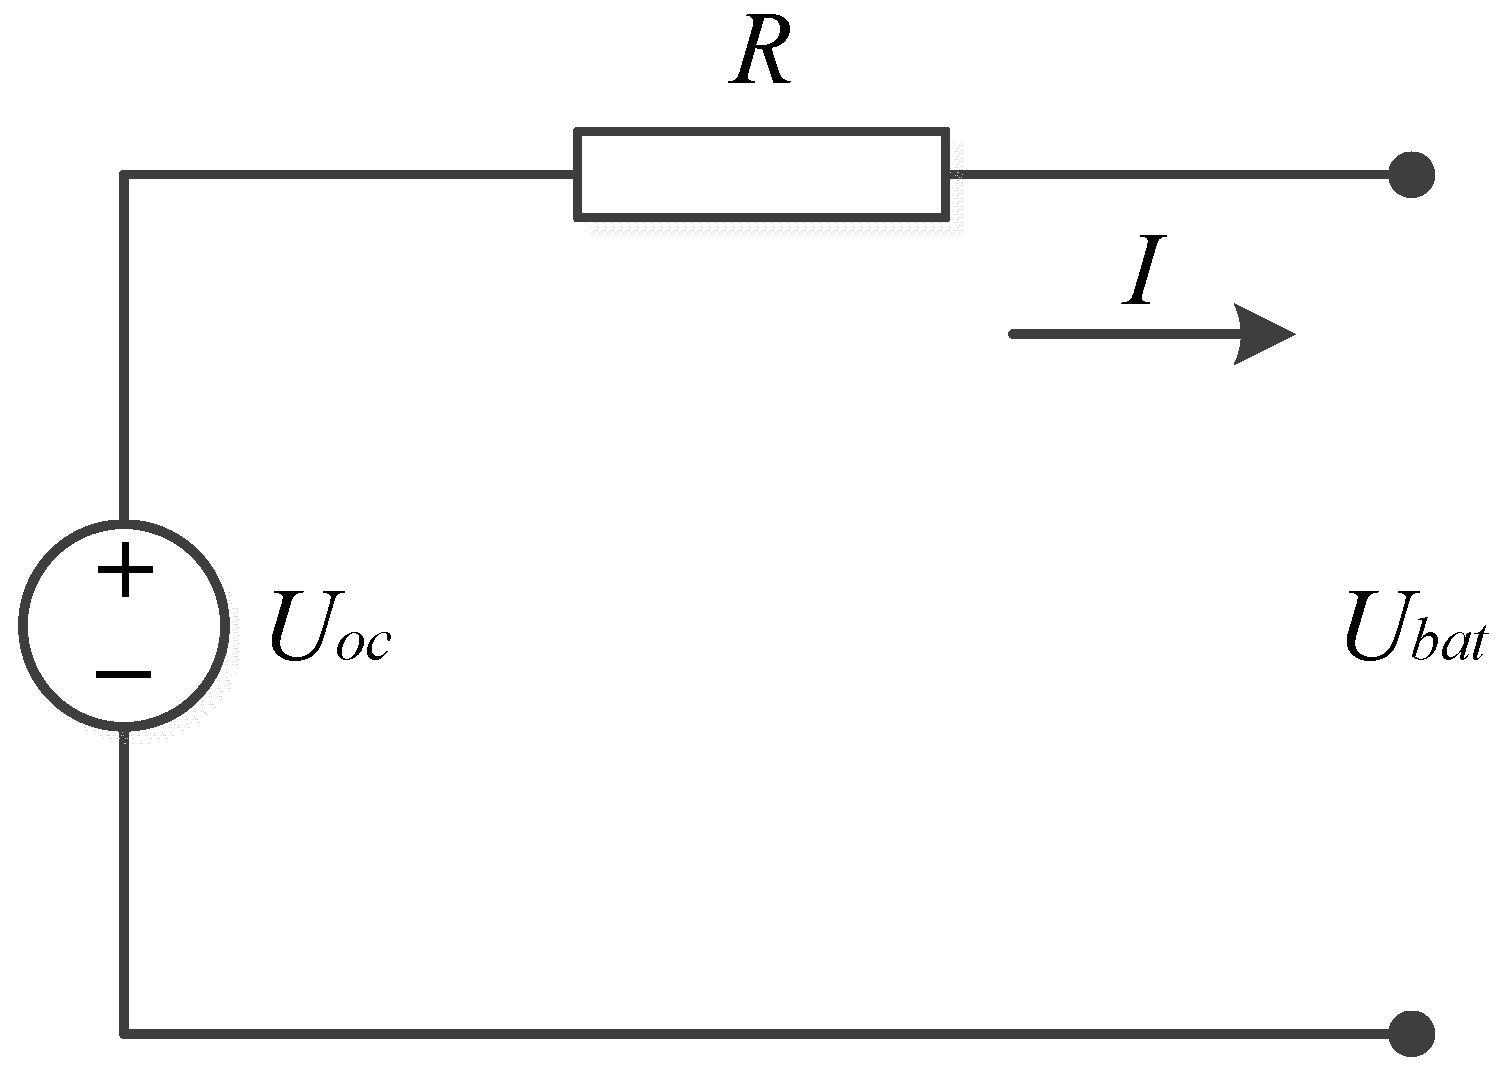
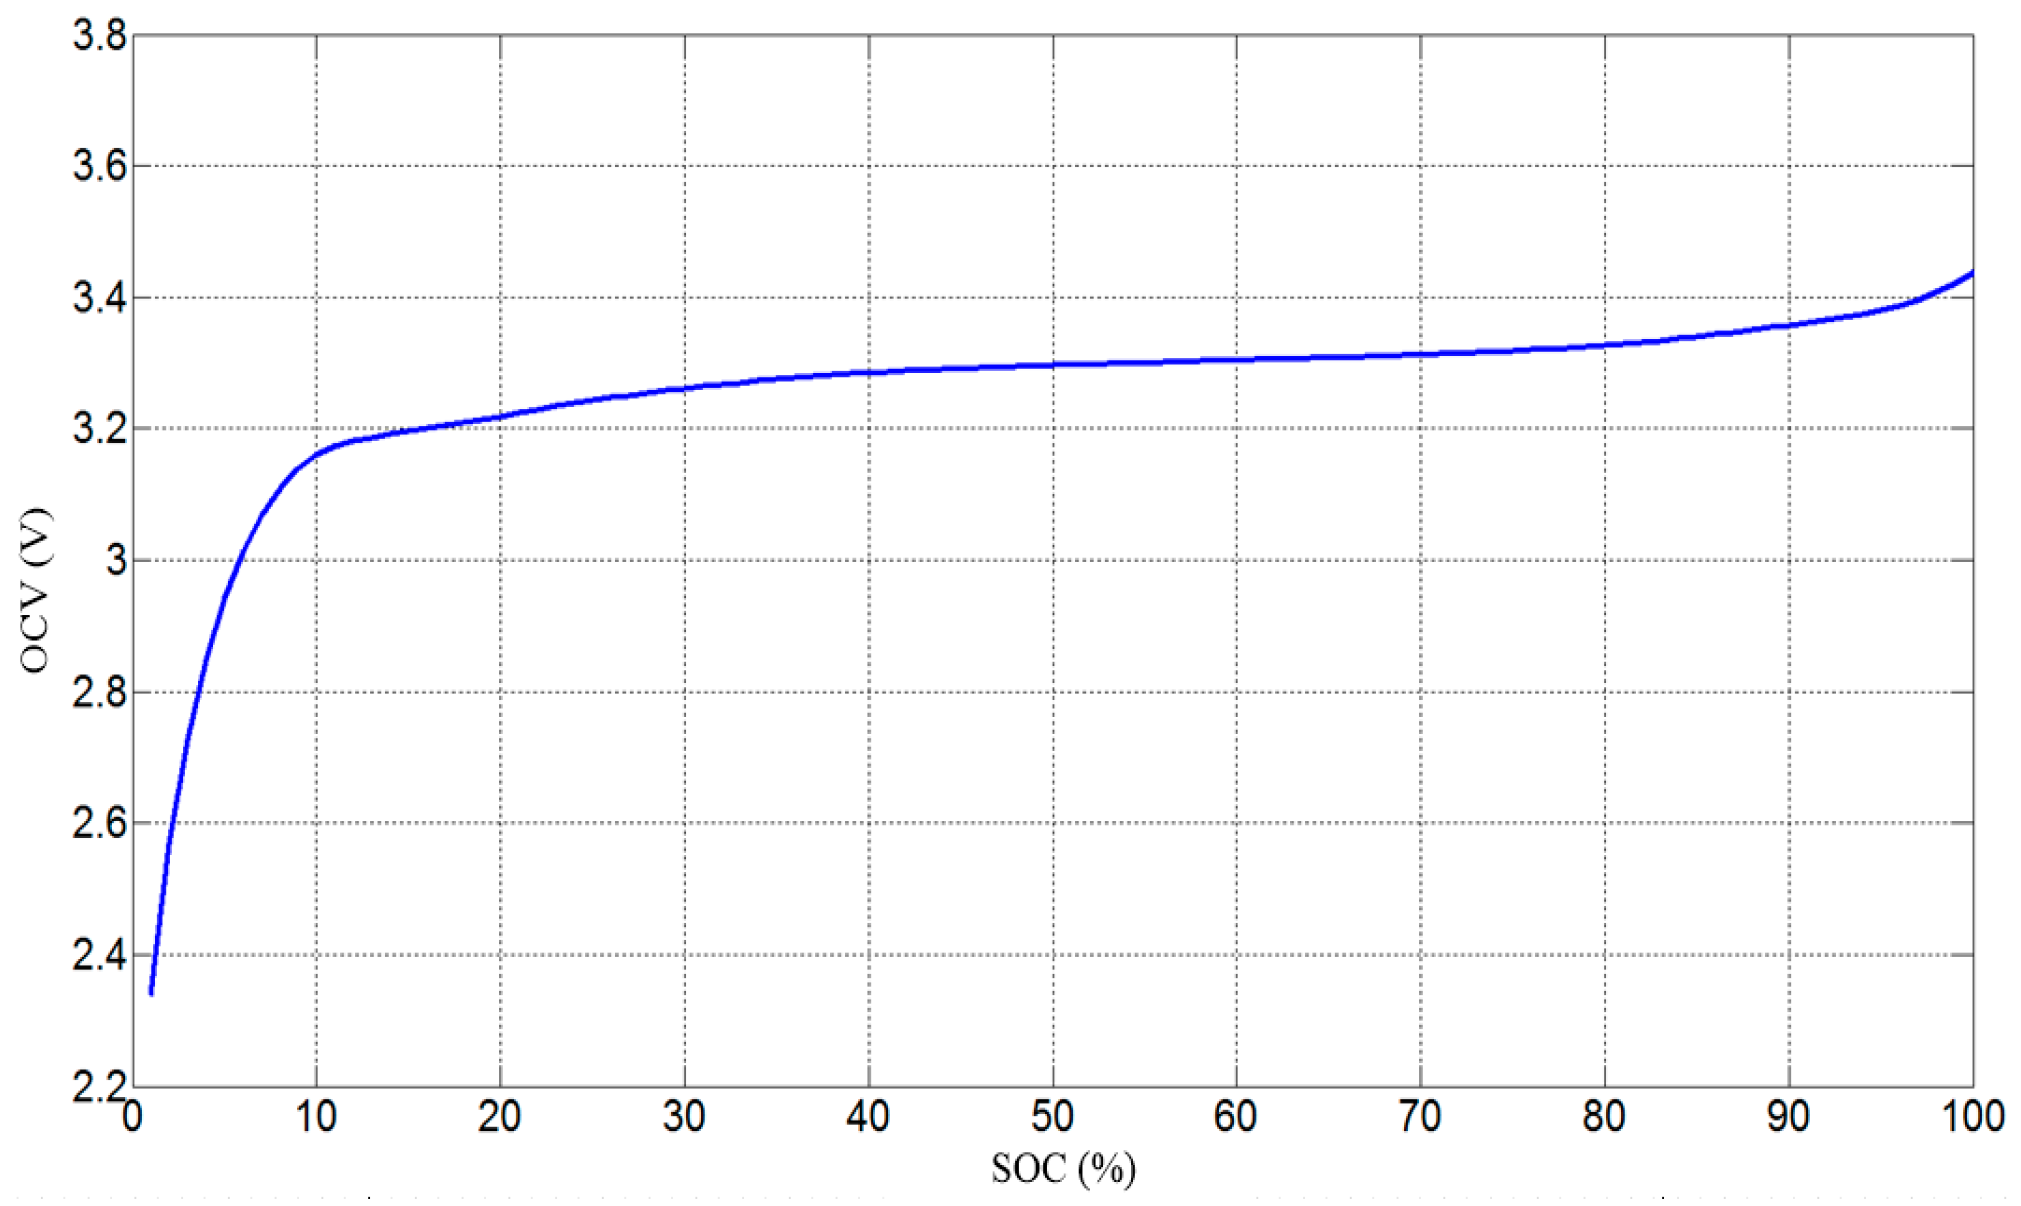
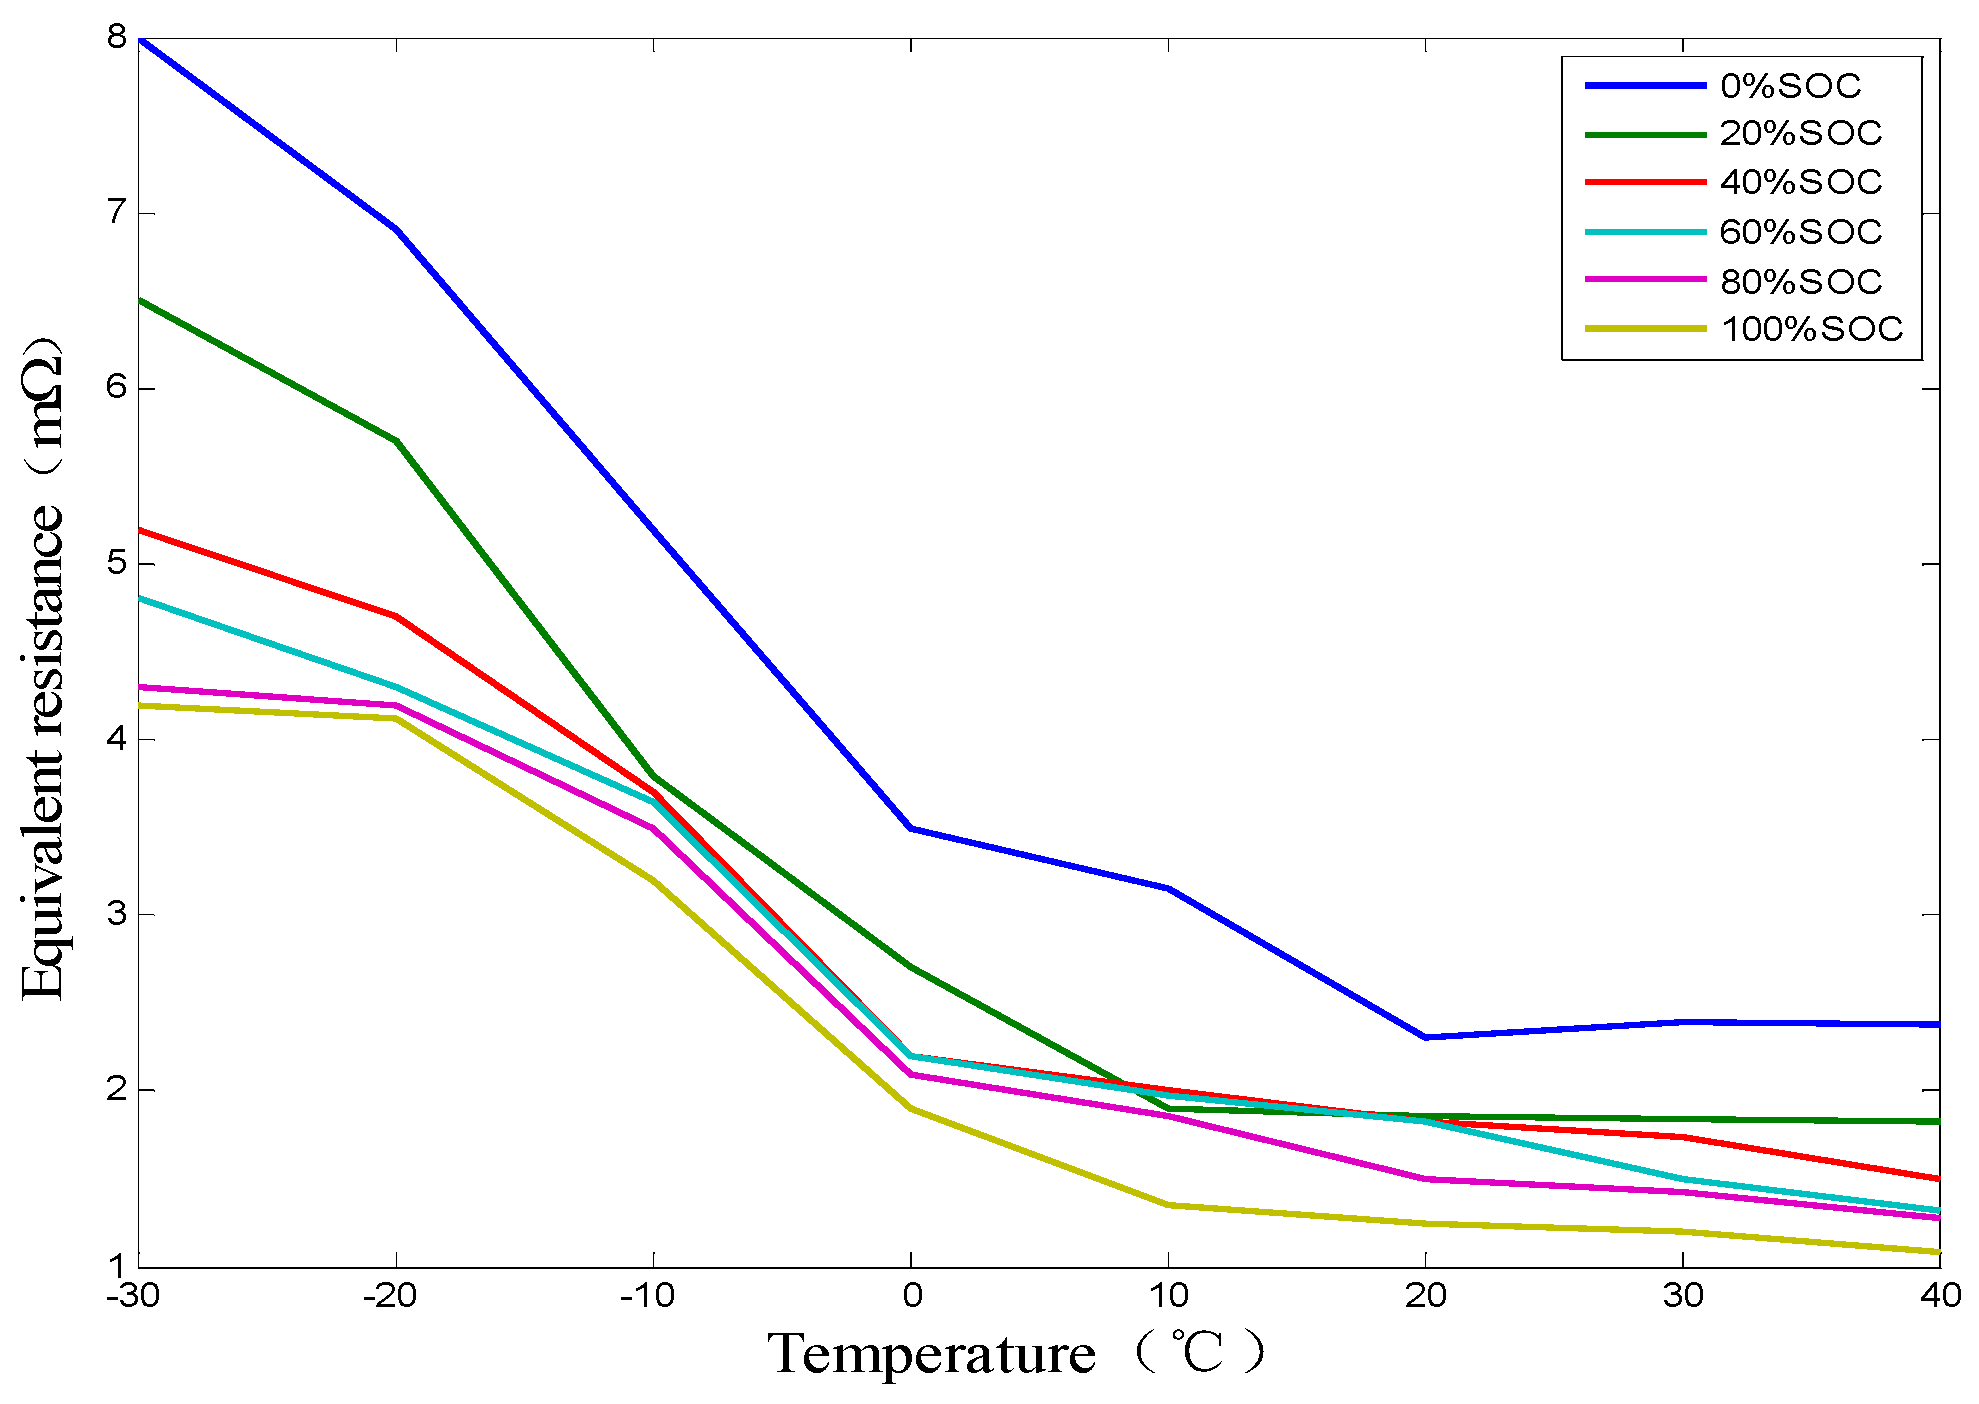
2.1. Battery Electrical Model and Parameters Characterization

There are plenty of battery models proposed by other scholars. Rao et al. [31] classified battery models as: (1) physical models; (2) empirical models; (3) abstract models; and (4) mixed models. Most models tend to be pretty complicated and can hardly be used in practical automotive applications. With regard to battery electrothermal analysis for automotive use, the complex chemical reactions inside the battery are of less concern. Instead we adopt the Rint model (Figure 1) due to its simplicity and sufficient accuracy in battery electrothermal modeling. The high-voltage battery packs used in this paper are composed of 180 cells that are connected in series. The basic parameters of the cells are listed in Table 1.
Six basic parameters are characterized in the battery electrical model: (1) SOC; (2)   U o c ; (3)   R ; (4)   η ; (5)   I ; (6)   U b a t . These parameters are acquired by either calculation or experiments. SOC is evaluated by Ampere hour integration. Battery open circuit voltage (OCV) U o c is acquired through a look-up SOC-OCV table and this table is obtained through experiments with a battery cycler (Digatron Firing Circuits, Changchun, China), thermostat chamber and other essential devices. Due to the hysteresis of LiFePO4 chemistry, the average value of charge and discharge voltage curve is taken as the open circuit voltage curve in this paper, as shown in Figure 2.
Equivalent resistance R is SOC and temperature dependent, and it is measured by experiments using a hybrid pulse power characterization (HPPC) method. The detailed measurement procedures can be found in [32]. Test results are shown in Figure 3. According to Figure 3, the value of R under specific SOC and temperature could be acquired through a look-up table.
Energy efficiency η is another parameter that is greatly influenced by temperature [33]. η is divided into discharge efficiency and charge efficiency. The expressions of discharge efficiency and charge efficiency are shown in Equations (1) and (2), respectively:
η d c h = U d c h I d c h d t U d c h I d c h d t + Q l o s s × 100 %
η c h a = U c h a I c h a d t Q l o s s U c h a I c h a d t × 100 %
Figure 4 illustrates the experimental results of relationship between discharge efficiency, charge efficiency and temperature at C/2 current rate.
Battery current I is calculated through Equation (3) [30]. In Equation (3), P b a t is the battery output power determined by specific driving cycles. Detailed deduction on P b a t is presented in Section 3.1. Finally the battery terminal voltage U b a t can be determined through Equation (4) after I is confirmed:
I = U o c U o c 2 4000 R P b a t 2 R
U b a t = U o c I R

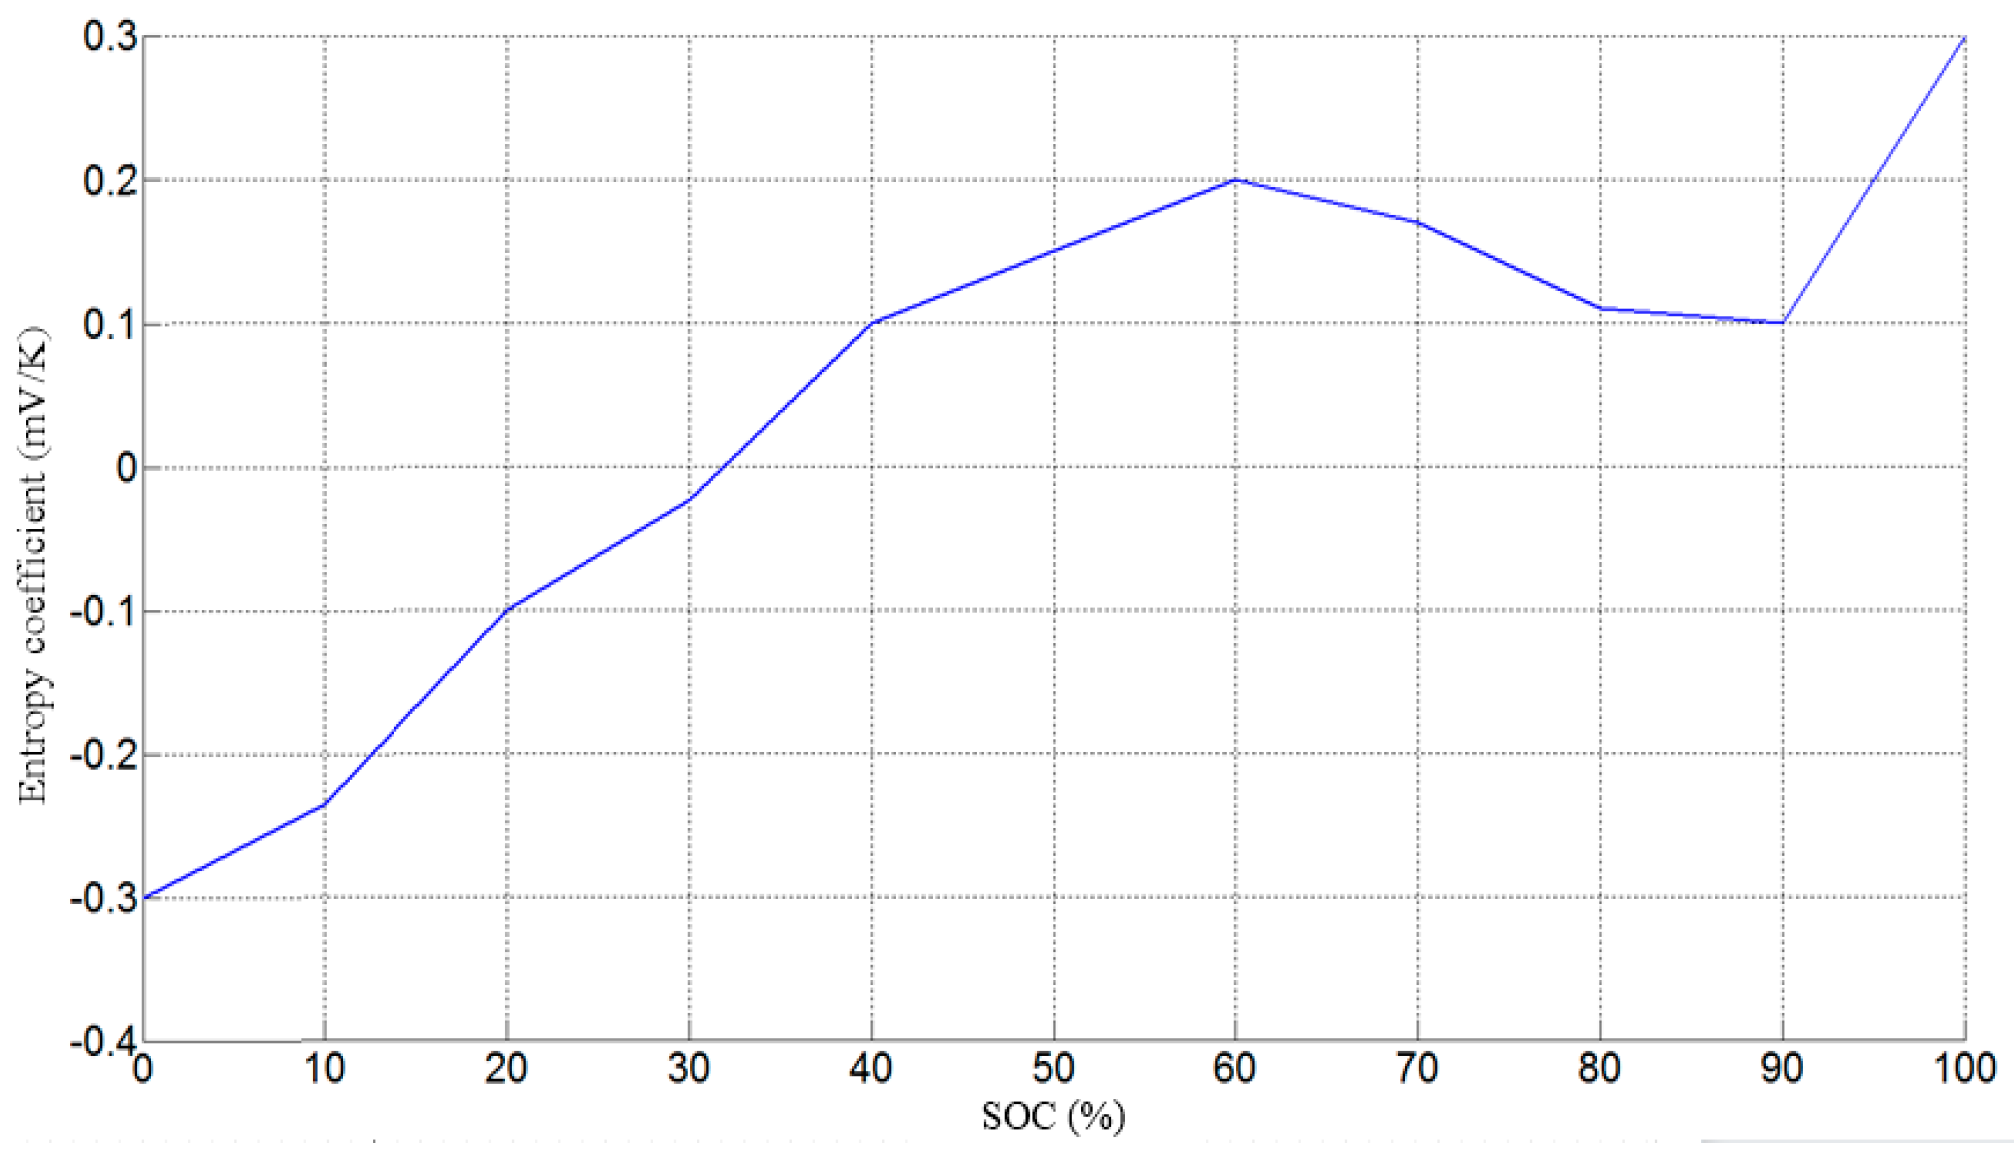
2.2. Battery Heat Generation Mechanism and Thermal Model

The main function of a battery thermal model is to obtain the heat generation ( Q t ) and temperature change ( Δ T ) of the battery dynamically during vehicle operation. Heat generated by the battery during its working process could be divided into four parts [34]: reaction heat ( Q r ), side reaction heat ( Q s ), polarization reaction heat ( Q p ) and Joule heat ( Q j ), as shown in Equation (5):
Q t = Q r + Q p + Q s + Q j
Actually, the side reaction heat is small enough that it could be neglected [35]. Besides, the sum of polarization reaction heat and Joule heat could be replaced by the heat produced by the equivalent resistance (including Ohmic and polarization resistance) [36]. As for the reaction heat, it is endothermic during charging and exothermic during discharging [37]. According to Bernardi, the reaction heat can be estimated by the entropy coefficient ( U o c T ). In summary, the heat generation rate of a Li-ion battery during its working process could be simplified as shown in Equation (6):
Q t = I 2 R + I T U o c T
In Equation (6), the entropy coefficient is obtained by calculating the open circuit voltage values as the temperature varies and detailed measurement methods can be found in [38]. Figure 5 shows the measured entropy coefficient values. According to Lin et al. [7,8], reaction heat is only approximately 6%–7% of the total heat generated. For large batteries used on electric vehicles, heat generation is mainly dominated by the Joule heat.
In addition to heat generation, the battery would also dissipate heat to the ambient since the battery pack is not adiabatic. Equation (7) accounts for the heat loss of the battery during the battery operation process [39]. The value of the heat transfer coefficient was determined by the experiments described in Section 5.1.
Q d i s = h · A b a t ( T T 0 )
The temperature change of the battery is the synthetic effect of heat generated by the battery [40] and the heat dissipated from the battery [41]. In combination of Equations (6) and (7), the temperature change can be expressed as shown in Equation (8):
Δ T = ( Q t Q d i s ) d t m b a t C p = ( I 2 R + I T U o c T h · A b a t ( T T 0 ) ) d t m b a t C p
Here the value of C p (854 J/ (kg·K)) is provided by the battery manufacturer. Actually there are two ways obtaining C p including: (1) by measurement based on Equation (9) where the temperature variation and heat absorbed by the test sample can be experimentally acquired and (2) calculation according to Equation (10) based on the average values of the mass-weighted specific heat of each component in the battery (e.g., electrode, separator and current collector) [9].
C p = Q m b a t ( T f T i )
C p = 1 n ( C p , i × ρ i × V i ) 1 n ( ρ i × V i )
C p was tested both ways and no significant difference was found between the two methods (860.3 J/(kg·K) and 858.6 J/(kg·K)). Finally the value given by the battery manufacturer was adopted because there may have been unavoidable error in our own measurements.

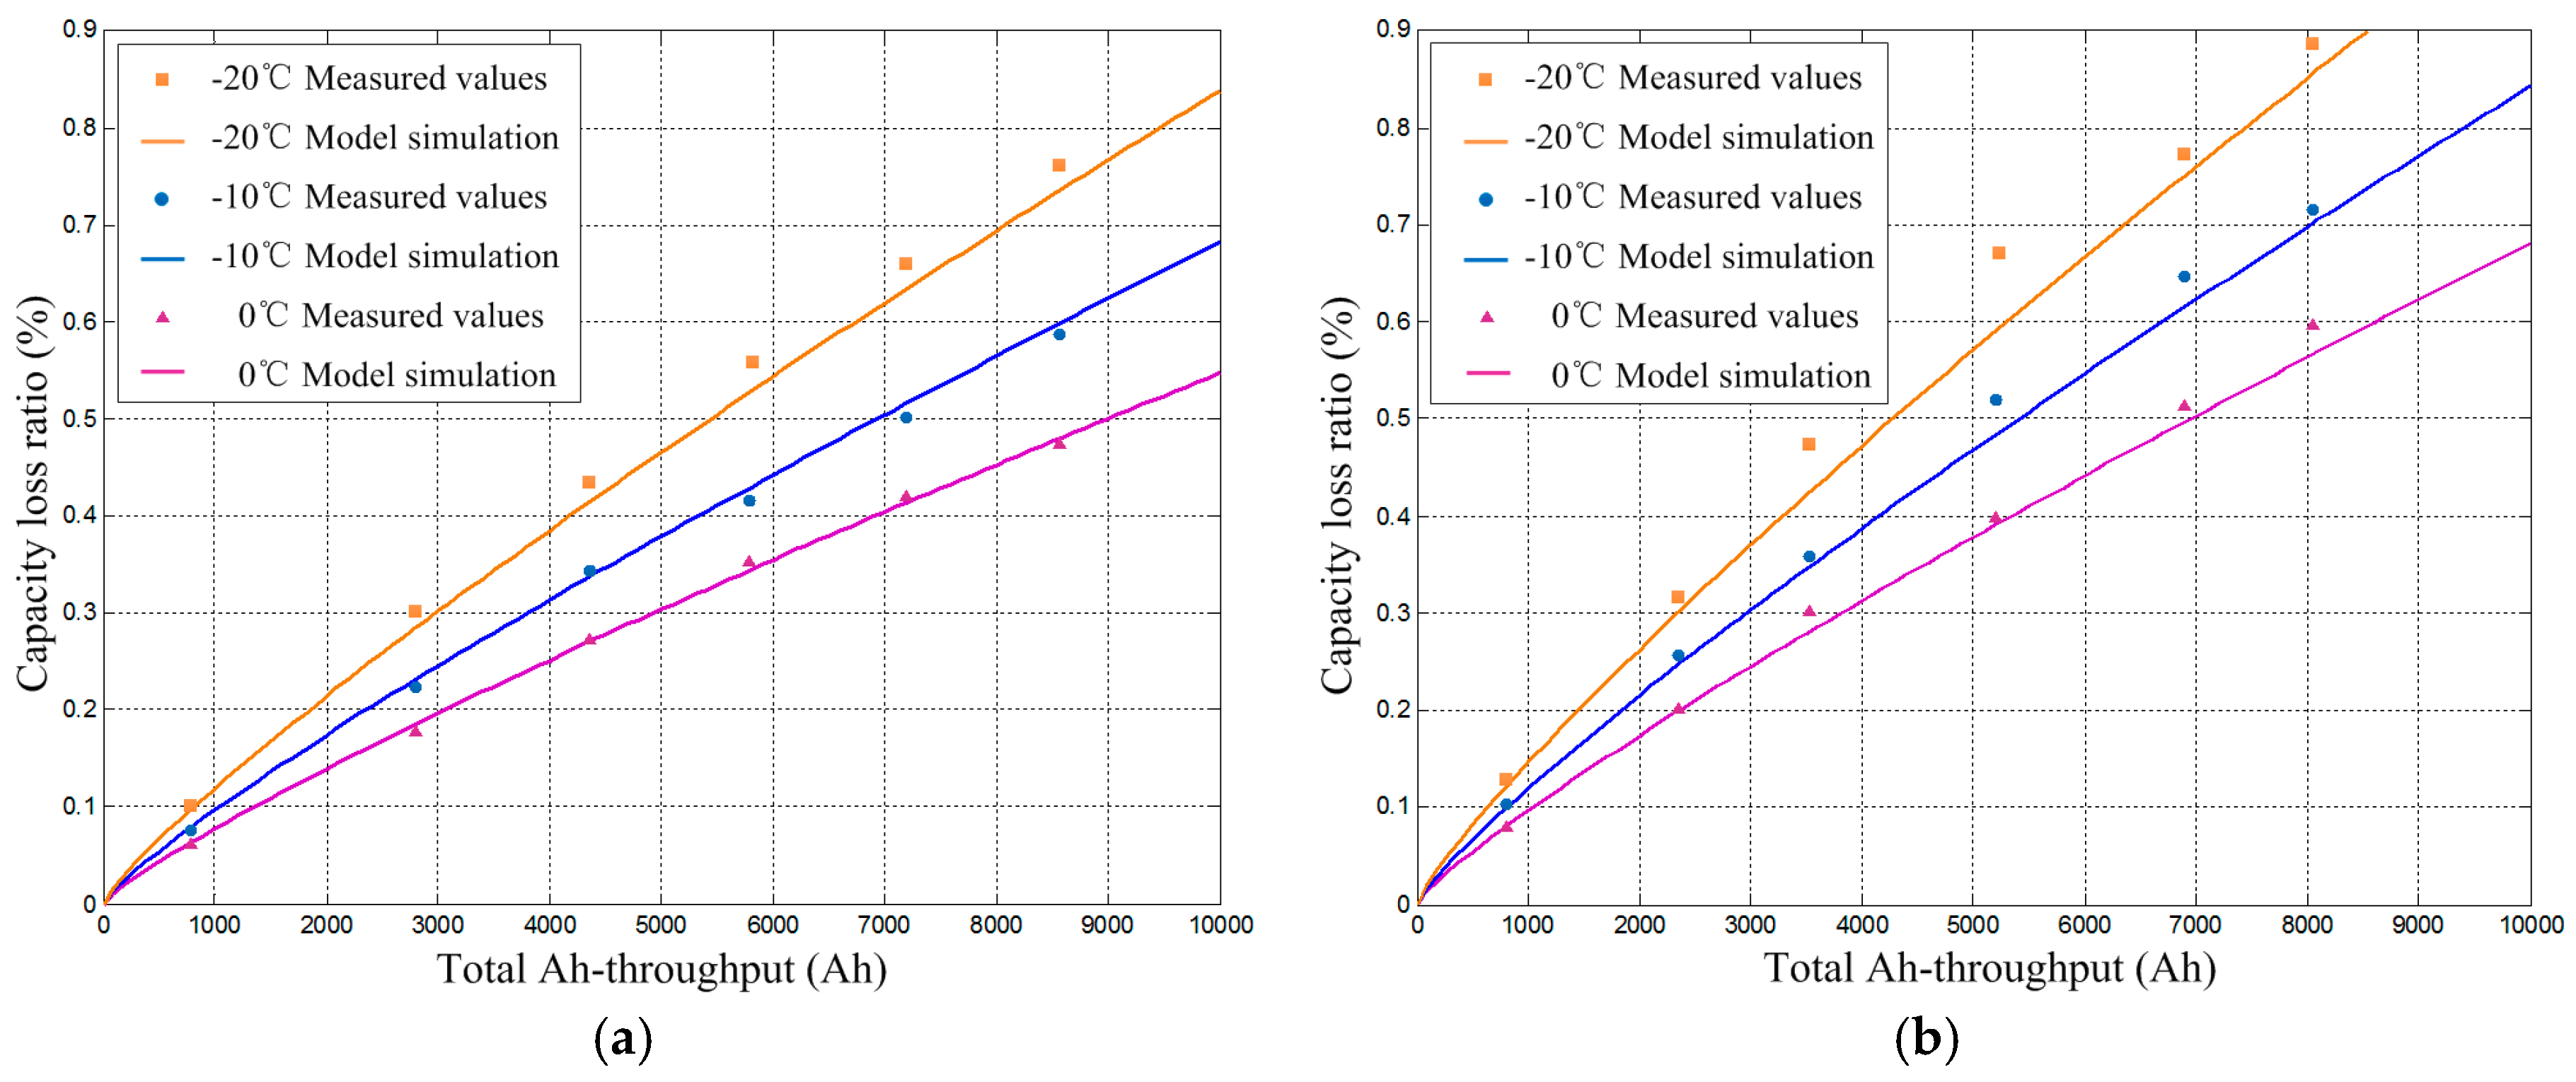
2.3. Battery Degradation Model

Battery aging can be categorized into cycle aging and calendar aging [42]. Both of them could result in capacity reduction. Here it must be highlighted that calendar aging is not involved in our battery model, because the battery model is used to assist optimization over the period of vehicle operation, which means the battery is considered working all the time during this process. As for battery cycle aging evaluation, Wang [21] proposed a fitting formula (Equation (11)) to describe capacity degradation ratios at different current rates and ambient temperatures:
C l o s s % = B · exp   ( 31700 + 370.3 × C r a t e 8.314 T ) ( A h ) 0.55
The disadvantage of this formula is that it cannot accurately describe battery degradation at subzero temperatures [20]. Based on Equation (11), Song [29] proposed a modified formula (Equation (12)) to predict the capacity loss of LiFePO4 battery, which has proved to be accurate over a wide temperature range, especially at subzero temperatures:
C l o s s % = 0.0032 · exp ( 15162 + 1516 × C r a t e 8.314 × ( | 285.75 T | + 265 ) ) ( A h ) 0.849
As aforementioned, vehicle-mounted batteries are subject to specific driving cycles. The current rate and temperature of a battery keeps changing during vehicle operation. For simulation purposes, some modification of Equation (12) is needed. Its derivative can be deduced as:
C l o s s % ˙ = Δ C l o s s % Δ A h = 0.0032 · 0.849 · exp ( 15162 + 1516 × C r a t e 8.314 × ( | 285.75 T | + 265 ) ) ( A h ) 0.849 1
Here the increment of battery Ah-throughput can be obtained by ampere hour integration. By discretization, Equation (13) can be further expressed as:
Δ C l o s s % , i = 2.7168 × 10 3 · exp ( 15162 + 1516 × C r a t e 8.314 × ( | 285.75 T | + 265 ) ) ( A h , i 1 ) 0.151 · Δ A h , i 1
The total capacity degradation ratio after simulation process can be expressed as:
C l o s s % = i = 1 n ( Δ C l o s s % , i )
Equations (14) and (15) are adopted as the battery aging model in our simulation process. Experiments are conducted to validate these two equations. In the experiments, the SOC region is 20%~100%; the temperatures of the thermostatic chamber are set as −20 °C, −10 °C and 0 °C to verify the accuracy of the aging model at subzero temperatures in particular; current rates of 1C and 2C are chosen, respectively, since they are commonly used as standard rates [19]. The test results are shown in Figure 6, where it can be seen that the measured values are very close to the model simulation values. Thus the proposed battery degradation model is capable of presenting the capacity loss character of the battery used in this paper.

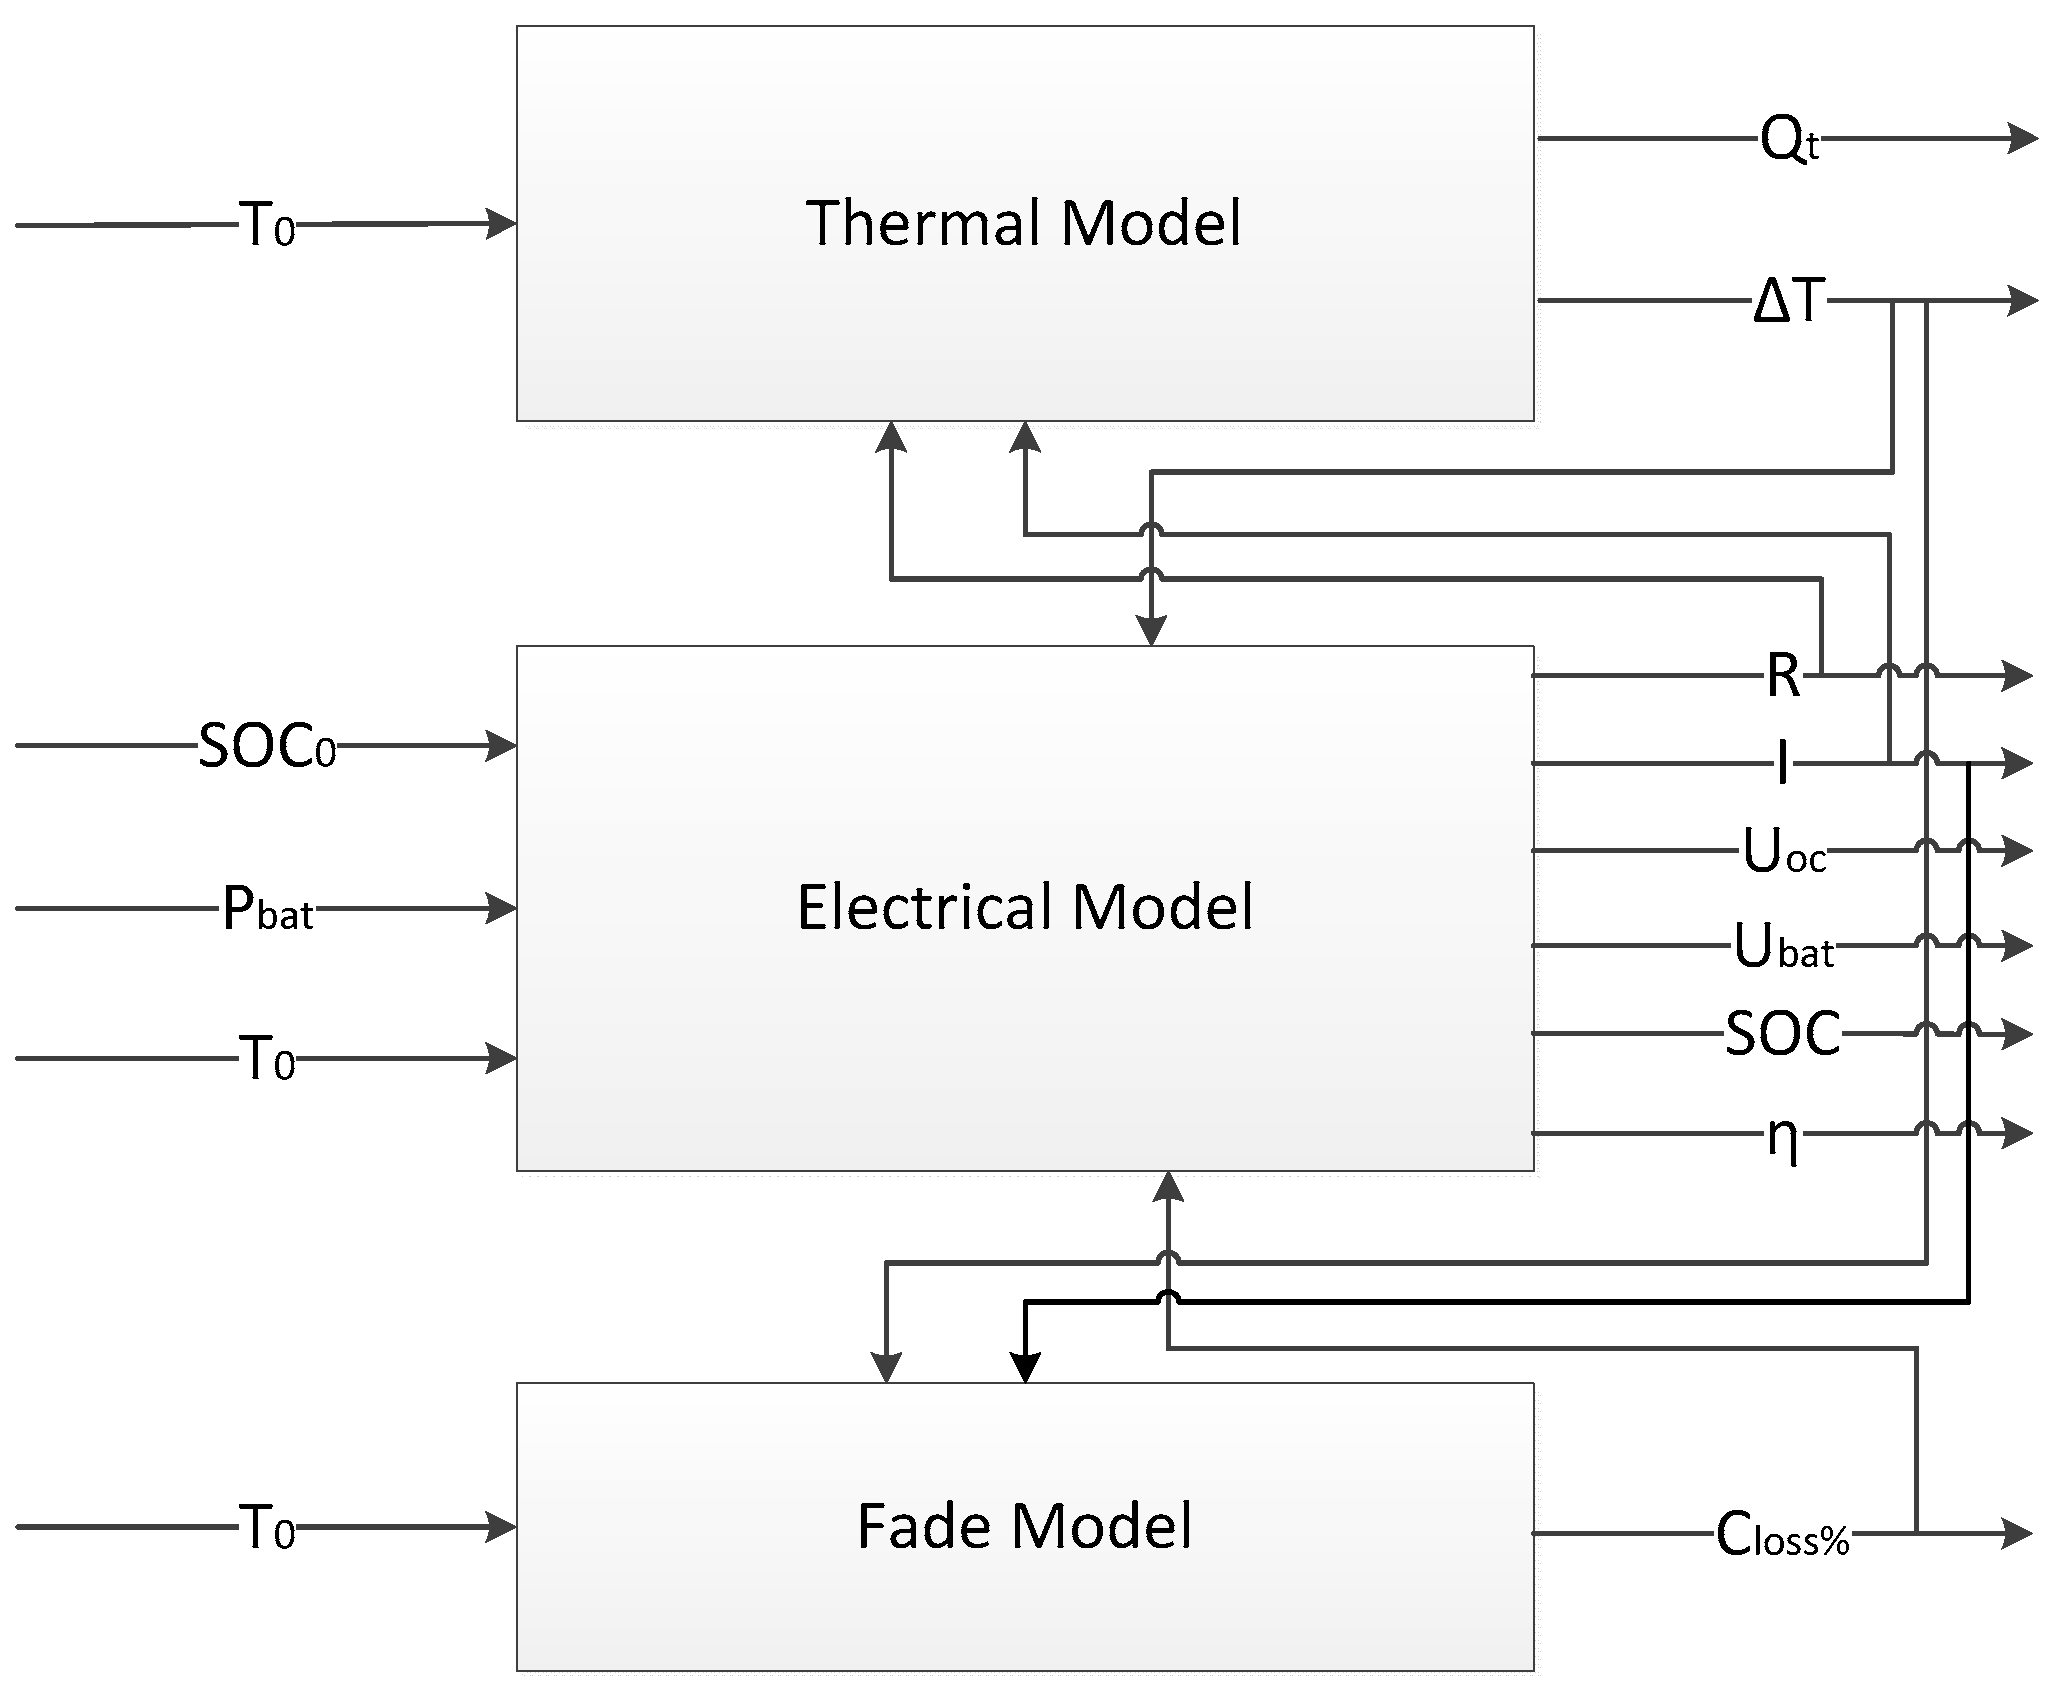
2.4. Battery Coupling Model Composed of Electro-Thermal and Degradation Models

The battery electrical model, thermal model and degradation model are defined in the sections above, respectively. These three sub-models have a close connection to each other. For example, in the electrical model, parameters such as equivalent resistance and energy efficiency are sensitively temperature dependent, thus the electrical model needs to communicate with the thermal model where temperatures are worked out; in the degradation model, parameters like current rate and temperature are indispensable but changing, and these two parameters could be extracted from the electrical model and thermal model, respectively. Thus the three sub-models are coupled together to dynamically present the real-time characteristics of vehicle-mounted battery. Figure 7 shows the structure of our coupled battery model.
In Figure 7 the parameter C l o s s % is inserted into the electrical model to help correct the value of SOC. The battery SOC could be directly acquired based on the basic Ampere hour integration method, however, Section 2.3 indicates that battery aging could lead to a non-negligible capacity loss, which means that as battery ages, the cumulative battery capacity error could result in an increasingly inaccurate SOC evaluation value. On the other hand, parameters such as equivalent resistance and open current voltage are highly temperature dependent. Thus, this factor is coupled into the electro-thermal model to make the entire battery model more accurate. After degradation was taken into consideration, the modified formula for SOC evaluation is shown in Equation (16):
S O C = S O C 0 1 3600 I C 0 ( 1 C l o s s % ) d t
This battery coupling model shows a comprehensive consideration for vehicle-mounted batteries whose working conditions are subject to the changing vehicle driving conditions. This integrated battery model also indicates enough accuracy in vehicle tests (Section 6).

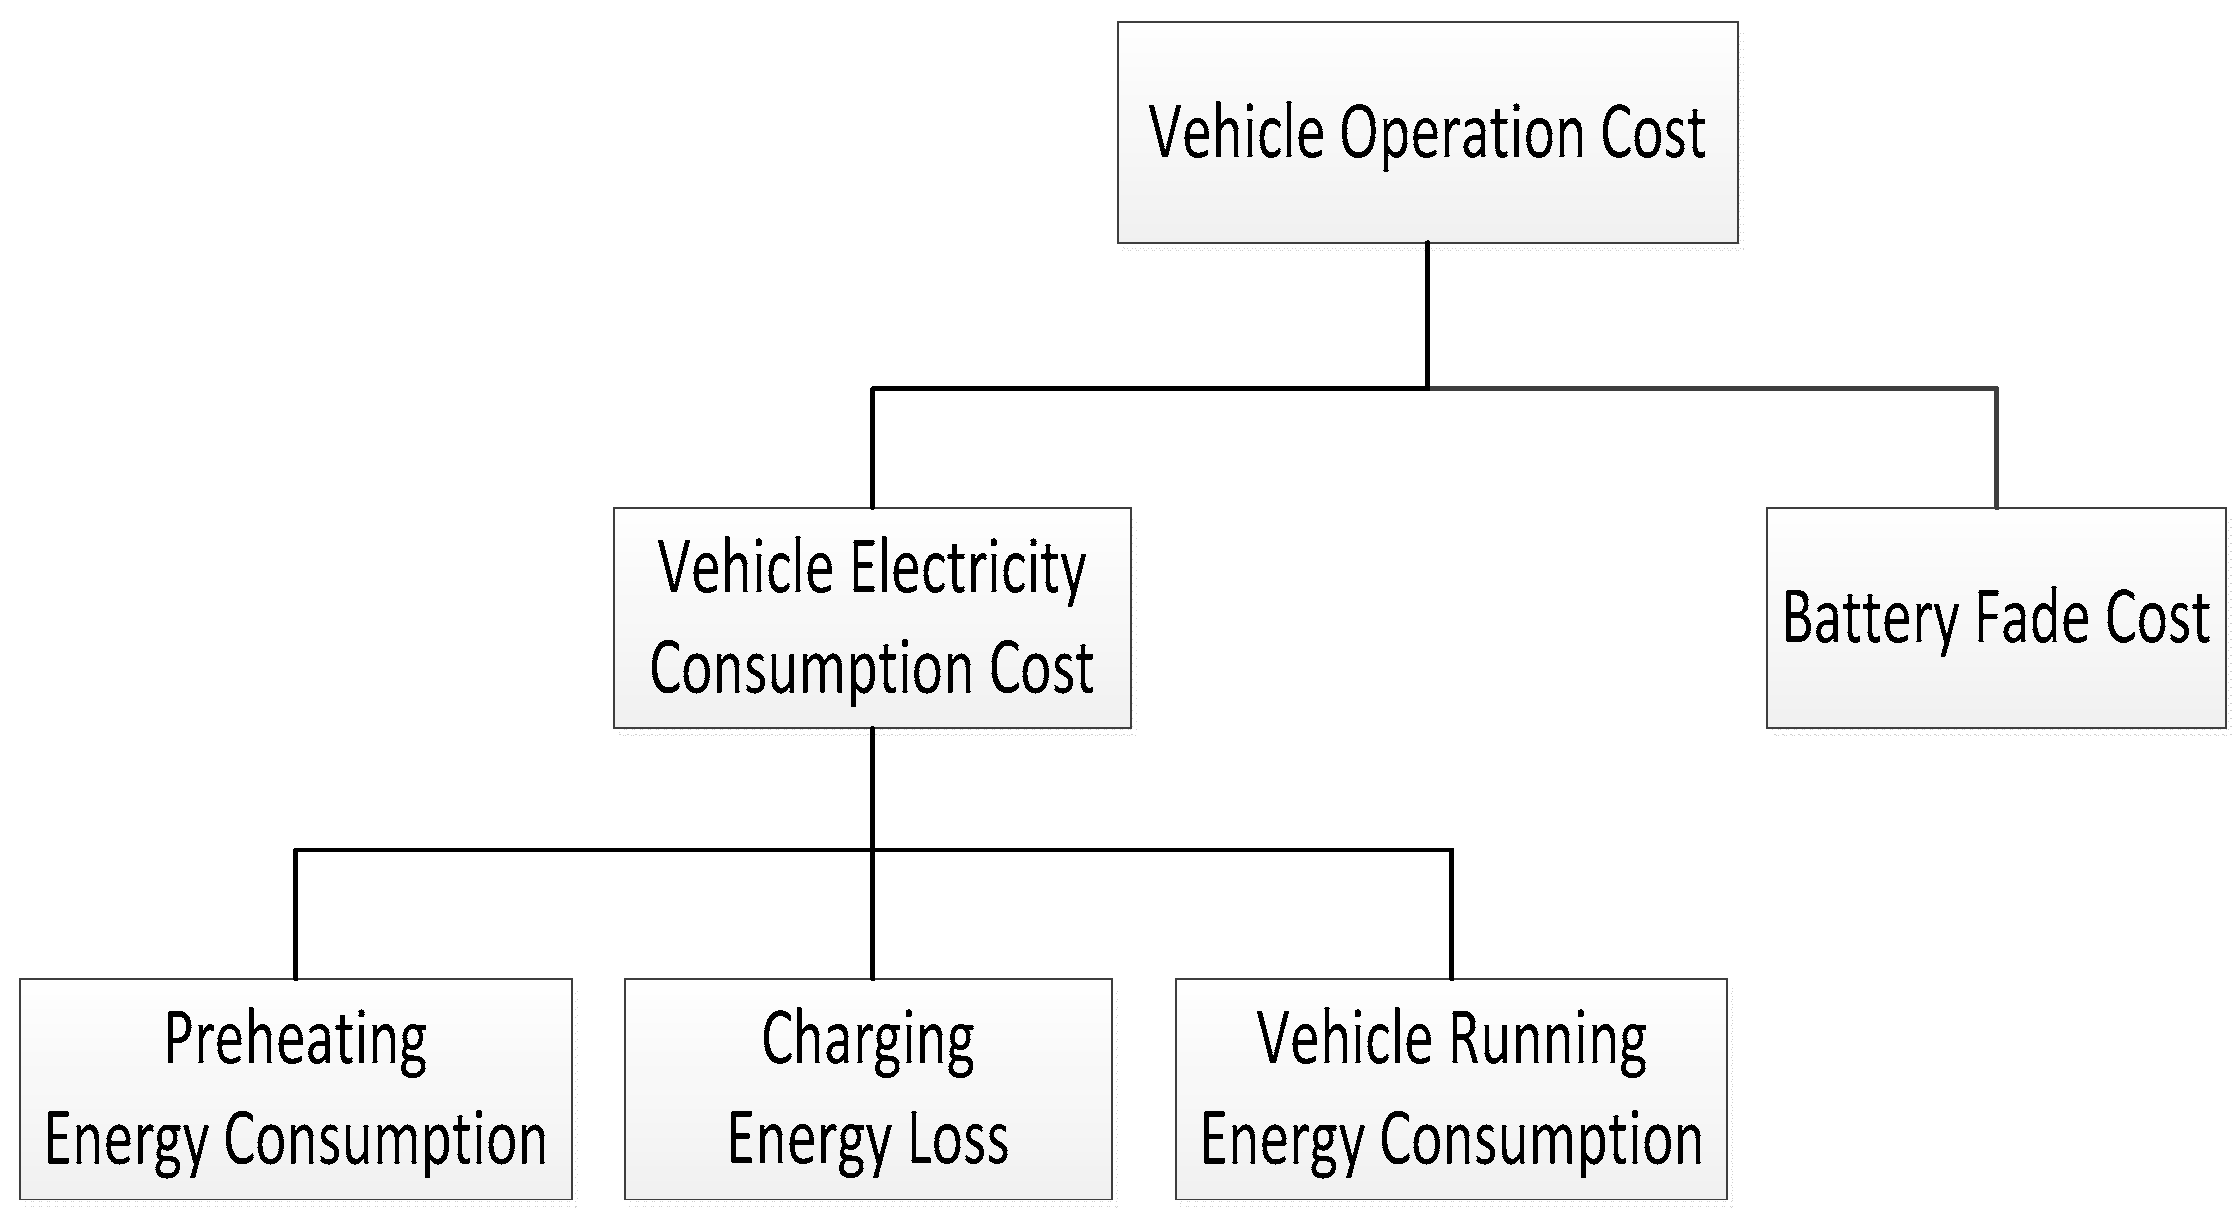
3. Deduction of Total Vehicle Operation Cost

It is assumed that vehicle-mounted battery is preheated to a target temperature firstly, and then charged. After charging, the vehicle starts to run. During the entire process, vehicle operation cost is considered as the sum of vehicle electricity consumption cost and battery fade cost (Figure 8). Table 2 shows the basic parameters of the electric city bus.

3.1. Vehicle Electricity Consumption Cost

Vehicle electricity consumption ( Q e l e ) originally comes from the charging pile, so Q e l e could be further divided into three parts (Equation (17)): energy consumption of preheating ( Q p h ), energy loss of charging ( Q c h a ) and energy consumption of vehicle running during driving cycles ( Q c y c ). It should be highlighted here that Q c h a is the energy lost in charging process, rather than the energy consumption during whole charging process. In other words, Q c h a is a part of the energy consumption of charging, while the other part is transmitted into chemical energy and stored in battery. Then the energy stored in battery is partially consumed during driving cycles, turned into Q c y c .
Q e l e = Q p h + Q c h a + Q c y c
The electricity cost is assumed to be 0.1 $/kWh, according to a report by the U.S. Energy Information Administration [29], so the vehicle electricity consumption cost ( C e l e ) is:
C e l e = Q e l e ·   0.1 $ / kWh

3.1.1. Preheating Energy Consumption ( Q p h )

Q p h is generated by the battery heating process. This part of the energy consumption could be acquired in terms of heat absorbed by the battery, which is mainly related to the target preheating temperature, ambient temperature and preheating efficiency, as shown in Equation (19):
Q p h = m b a t C p ( T 1 T 0 ) / η p h

3.1.2. Charging Energy Loss ( Q c h a )

Q c h a emerges during the battery charging process. A higher charging efficiency could result in a significantly lower charging energy loss. This part of the energy loss could be obtained with access to charging efficiency, charging voltage, and charging current during the charging process, as shown in Equation (20):
Q c h a = U c h a I c h a ( 100 % η c h a ) d t

3.1.3. Vehicle Running Energy Consumption ( Q c y c )

Q c y c is the energy consumption of vehicle during the running process period, which is provided by the battery pack, and the real-time battery power keeps changing with a specific driving cycle. The expression of Q c y c is shown in Equation (21):
Q c y c = 1000 P b a t d t = Q c y c , d r v   + Q c y c , b r a
Battery power varies with vehicle speed, which is determined by specific driving cycles. It should be noted that the battery power for driving and braking differ in the sign. When a vehicle is driving, the battery will provide power to drive the motor; while the vehicle is braking, since braking energy recovery is involved, the motor will charge the battery instead. Therefore battery power and vehicle running energy consumption should be solved in terms of driving and braking, respectively:
(1) Driving:
When the vehicle is driving, the battery power ( P b a t , d r v ) could be expressed as follows:
P b a t , d r v = P v e h η T × η m o t o r × η i × η d c h
where, P v e h is the power demand of vehicle and it could be further expressed as follows [43]:
P v e h = m v e h · g · f 3600 u + m v e h · g · i 3600 u + C D · A v e h 76140 u 3 + δ · m v e h 3600 u d u d t
P b a t , d r v could be acquired in combination with (22) and (23). The energy consumption of driving cycles when vehicle is driving ( Q c y c , d r v ) could be accessed in combination with Equations (21)–(23), as Equation (24) shows:
Q c y c , d r v = 1485 η d c h · ( m v e h · g · f 3600 u + m v e h · g · i 3600 u + C D · A b a t 76140 u 3 + δ · m v e h 3600 u d u d t ) d t
(2) Braking:
Braking energy recovery of driving wheels is involved when a vehicle is braking. At this time, the motor would charge the battery, and the braking force of the motor is related to the braking intensity. According to braking force distribution and Economic Commission of Europe (ECE) regulations [43], when:
F m o t o r = { m v e h · z · g , z 0.1 λ · m v e h , 0.1 < z 0.5 F b F r e a r , 0.5 < z 0.7 0 , z > 0.7
In addition, the relationship between the regenerative power of motor and could be expressed as shown below:
P m o t o r = F m o t o r · n · r 9549 i o · i g · η T
Then when vehicle is braking, the battery power ( P b a t , b r a ) could be expressed as:
P b a t , b r a = P m o t o r · η m o t o r · η i · η c h a
The energy consumption of driving cycles when a vehicle is braking ( Q c y c , b r a ) could be accessed in combination with Equations (21) and (25)–(27), as Equation (28) shows:
Q c y c , b r a = F m o t o r · n · r · η c h a 11 i o · i g d t
In summary, the energy consumption of the whole driving cycles, including both driving and braking, could be accessed as Equation (29) shows:
Q c y c = Q c y c , d r v + Q c y c , b r a = 1485 η d c h ( m v e h · g · f 3600 u + m v e h · g · i 3600 u + C D · A b a t 76140 u 3 + δ · m v e h 3600 u d u d t ) d t F m o t o r · n · r · η c h a 11 i o · i g d t

3.2. Battery Fade Cost

According to automotive standards, 80% capacity retention generally indicates the end of life (EOL) [16]. Besides, the price of the LiFePO4 battery we used is equal to 1200 $/kWh. The capacity of the whole battery is 103.68 kWh, so the battery fade cost ( C f a d e ) is:
C f a d e =   C l o s s % 1 0.8 × 1200 × 103.68   $

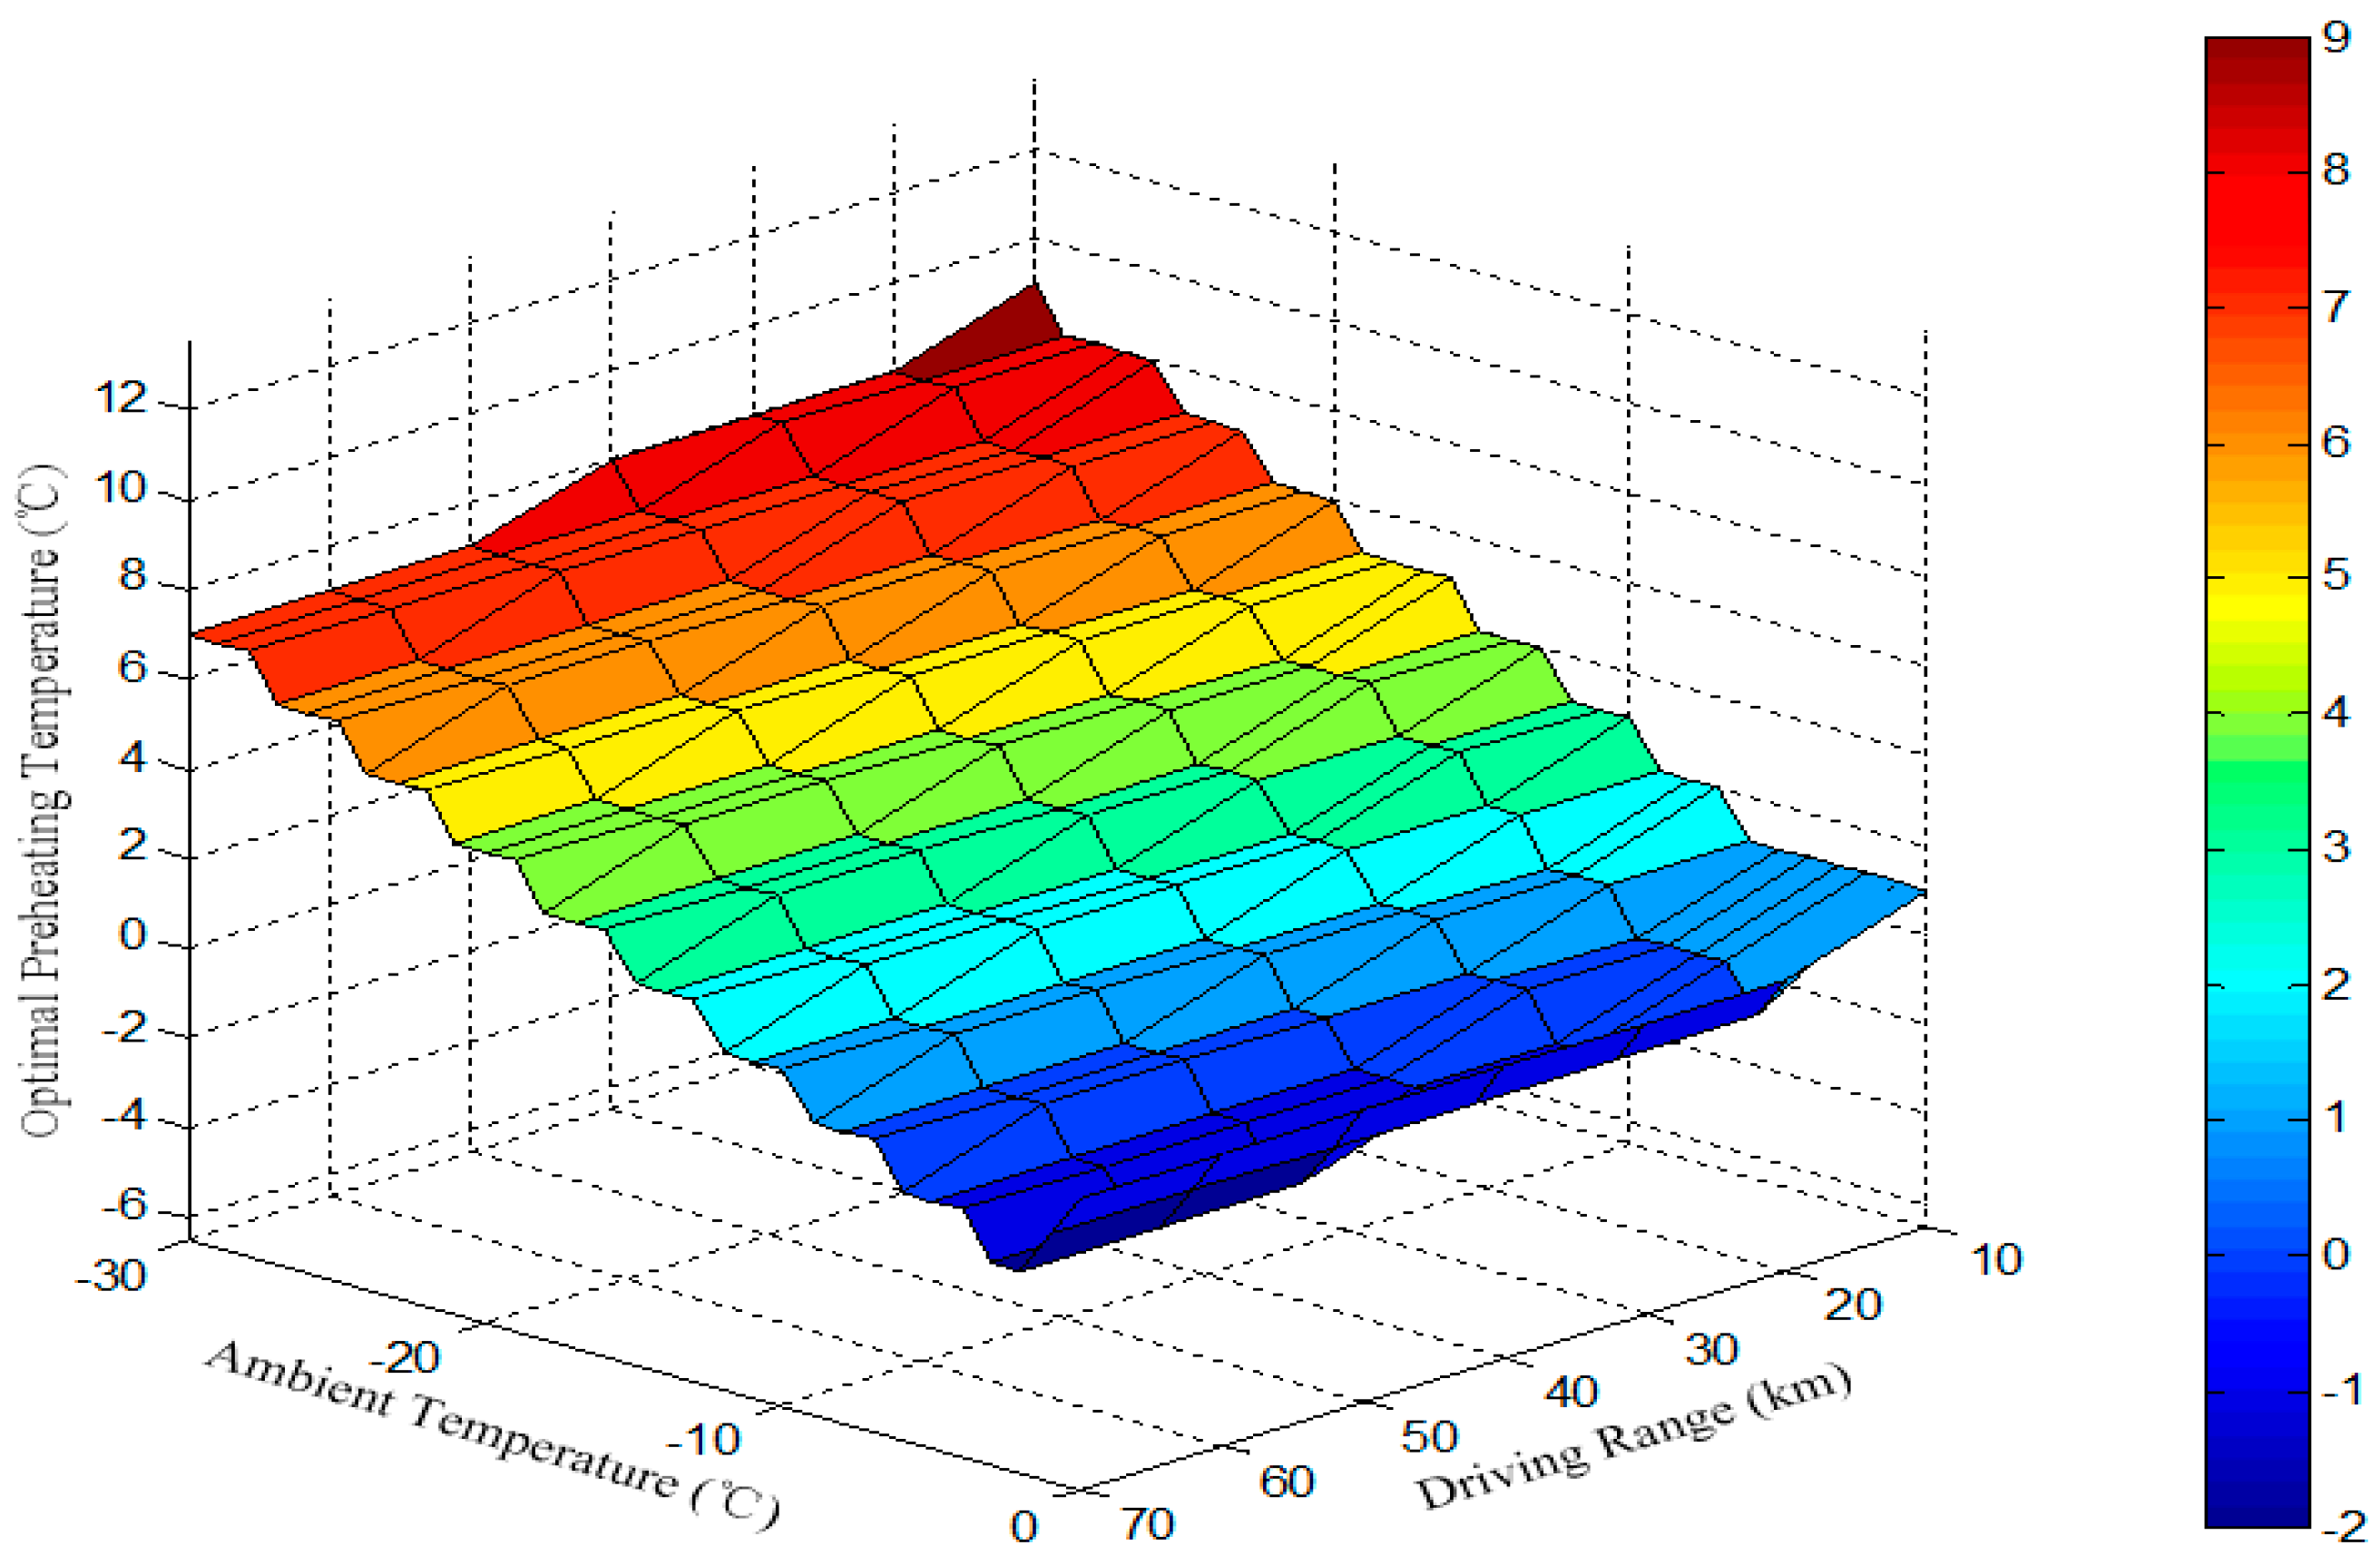
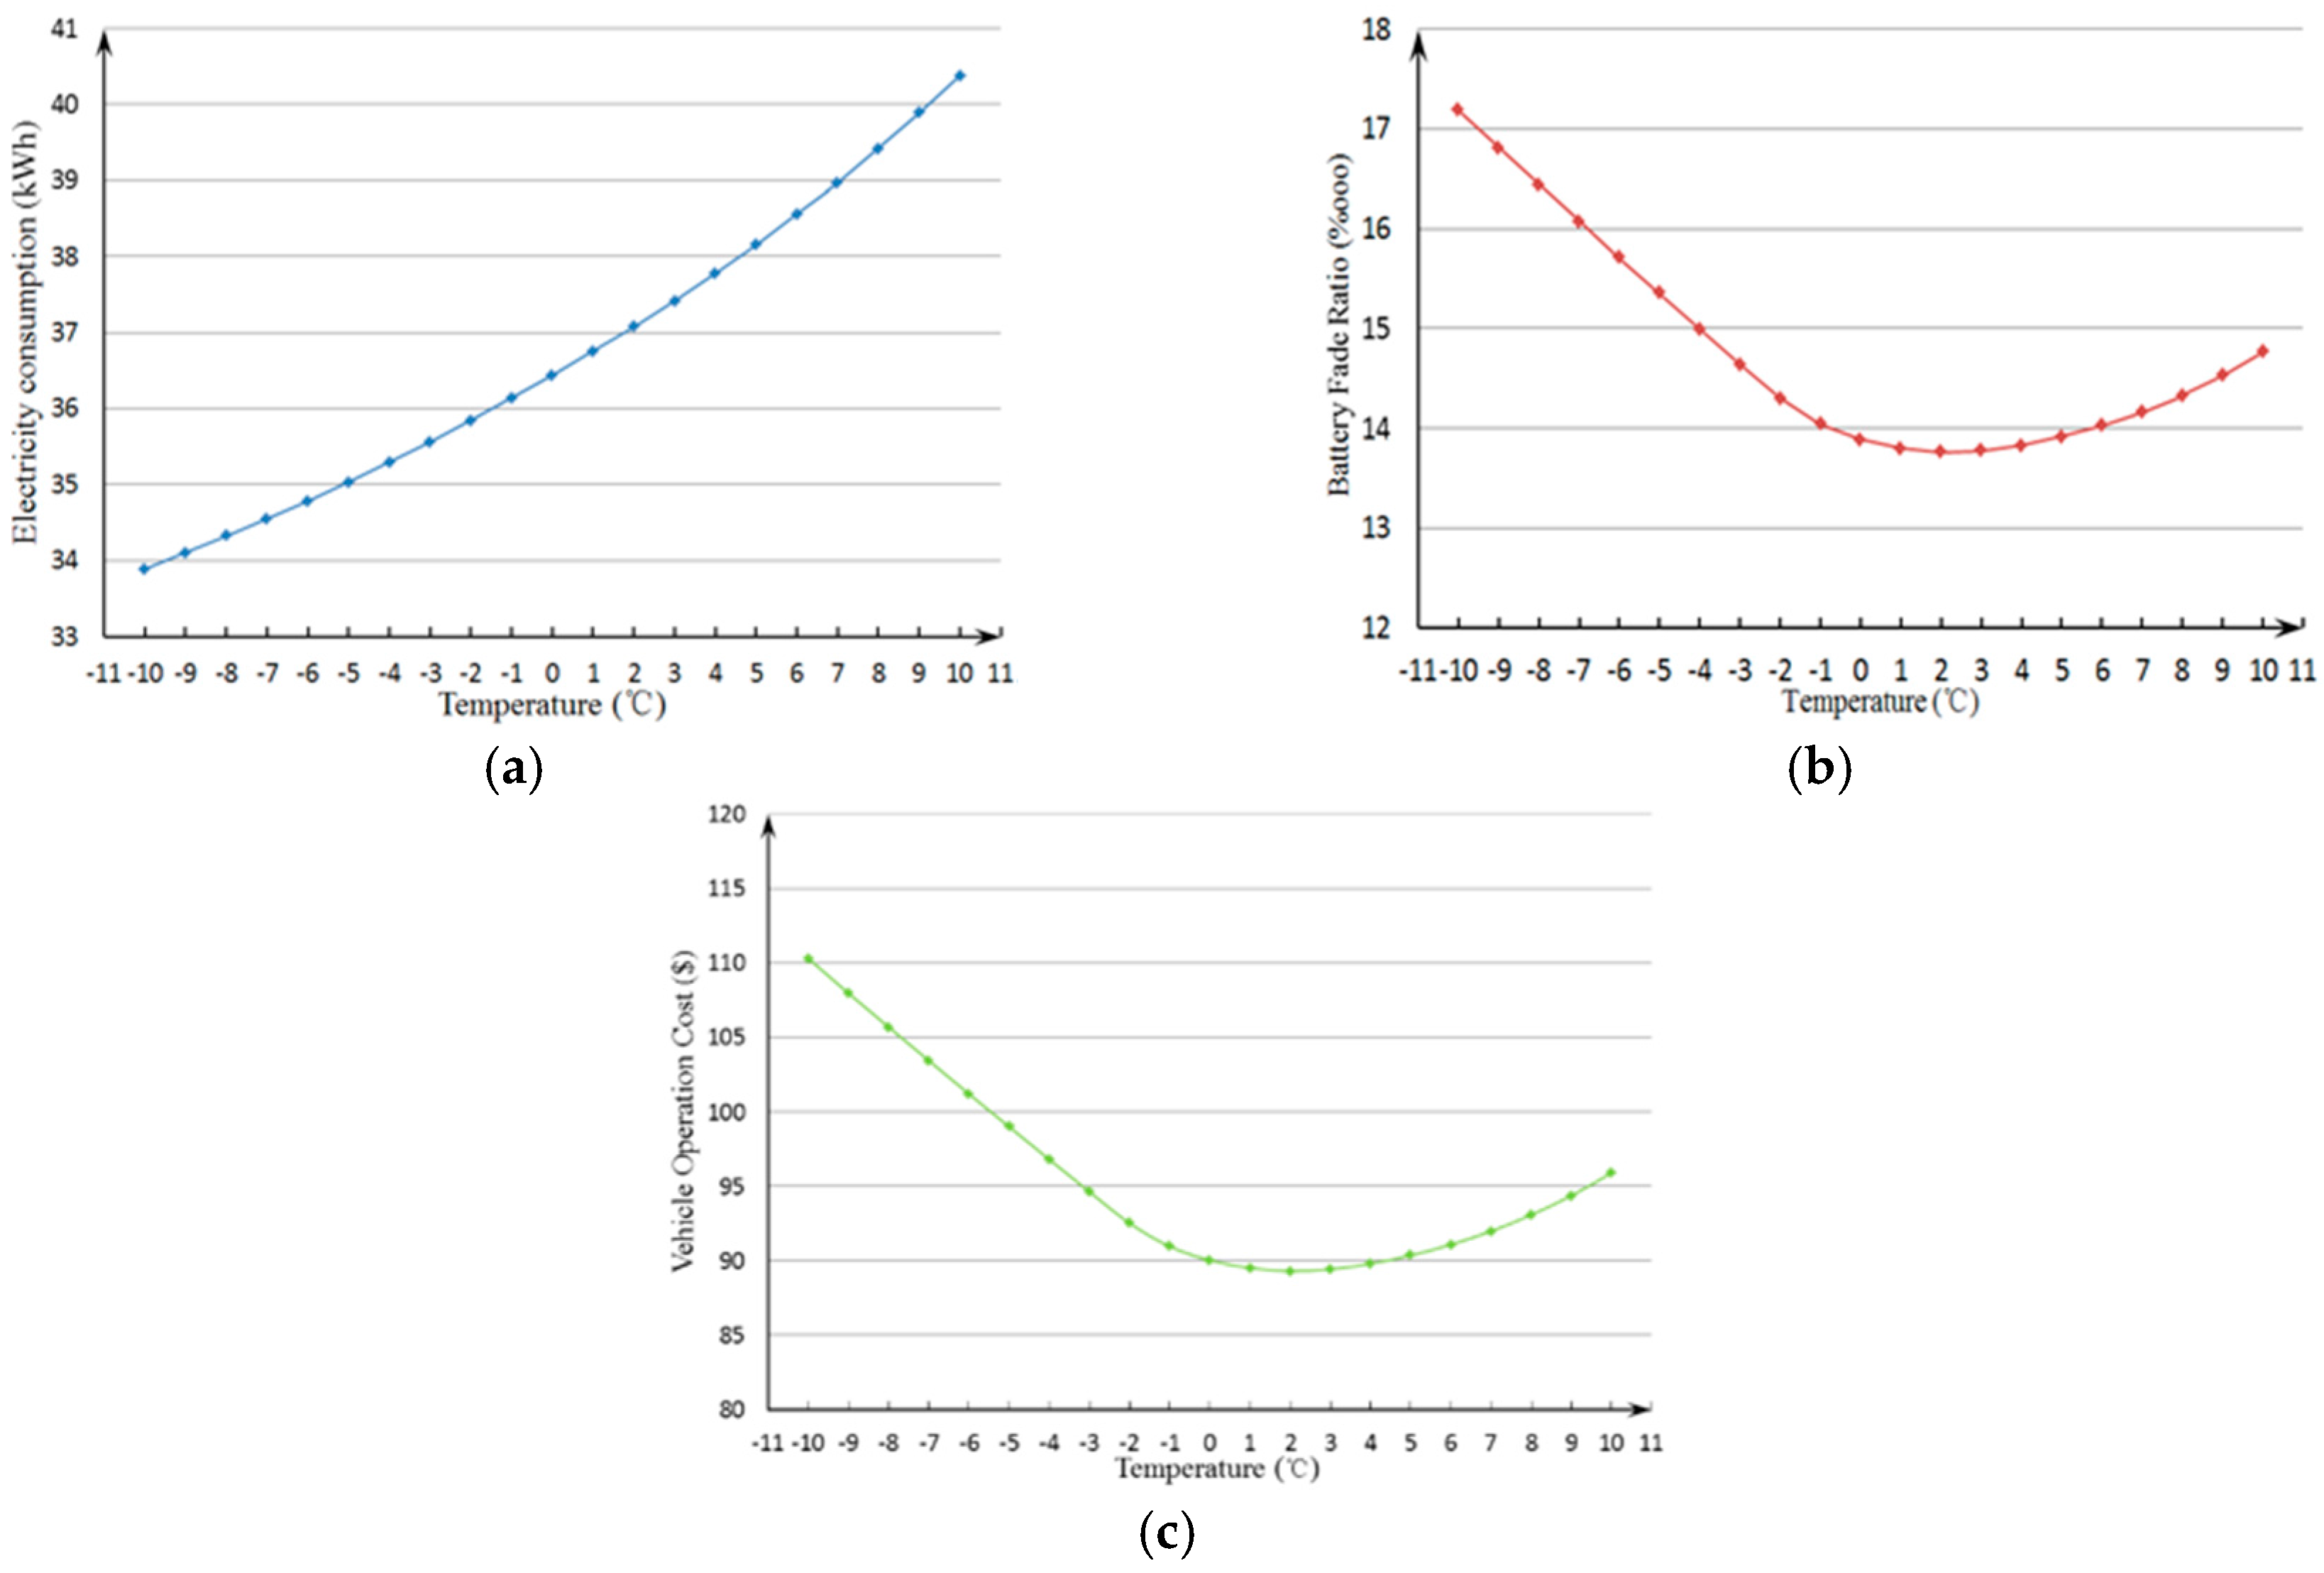
4. Determination of Preheating Target Temperatures

Preheating may improve battery energy efficiency and retard aging at subzero temperatures, consequently saving vehicle operation costs. However, preheating itself costs a large amount of energy; also if a battery were heated to an excessively high temperature, its degradation could be far more severe. As a consequence, a near-optimal preheating target temperature is needed so that the total vehicle operation cost could be the least. According to the analysis in the sections above, if given certain driving cycles, the total operation cost at any ambient temperature can be worked out. A 310 s-5 km driving cycle is used in this paper, which is shown in Figure 9. This driving cycle is repeated in the case of long driving ranges. Under the principle of minimizing total vehicle operation cost, the NSGA-II algorithm [44] is introduced into the simulation process to acquire the preheating target temperatures at different ambient temperatures and driving ranges. NSGA-II is usually used to solve multi-objective optimization problems. For single-objective global optimization, it also shows a rapid processing capacity with low computational complexity, and high reliability with elitist strategy.
In the present paper, the optimization objective is vehicle operation cost C s u m and the optimization variable is preheating target temperature T 1 (1 °C interval, 20 °C upper limit). Ambient temperature T 0 and driving range L are set as different constants in each simulation process, so the optimization problem could be expressed as:
{ min J = min { C s u m ( T 1 ) } T 0 T 1 20   ° C
For example, assuming that T 0 is −10 °C; L is 20 km; S O C 0 is 20% and then battery is fully charged to 100% SOC; after being charged, the vehicle operates according to Figure 9. The optimization results given by NSGA-II indicate that the optimal preheating target temperature is 2 °C, and the corresponding vehicle operation cost is 88.74 $ (electricity consumption cost and battery fade cost are 4.36 $ and 84.38 $, respectively). A 0.014% capacity loss is simultaneously observed, which may seem a little high compared to normal battery lifecycle. This is because the temperature and current rate of battery keep changing over a wide range in the driving cycle, which accelerates battery degradation compared with a constant current rate and appropriate temperature conditions. Another reason is that the battery has a faster degradation rate at the beginning of battery usage because of the special mechanism of Li plating [16]. The optimization results mean that if the battery were preheated to 2 °C before battery charging and vehicle operation, the vehicle could achieve the least cost. In order to further validate this, the electricity consumption, battery fade ratio and vehicle operation cost at different preheating target temperatures are calculated and the results are shown in Figure 10. It is clearly shown in Figure 10a that the electricity consumption grows with increasing preheating temperatures, which means that although preheating could improve the energy efficiency of the battery, the preheating process would consume far more electricity than it can save inside the battery. Figure 10b shows that there is an optimal preheating temperature at which the battery degradation could be minimal. This is because at both too high and too low temperatures, the battery always suffers severe degradation, so in terms of reducing the capacity loss, the battery would better work at intermediate temperatures. Figure 10c gives the optimal preheating target temperatures from the point of view of comprehensive consideration of electricity consumption and battery fade. From a comprehensive comparison of these three figures, it can also be seen that the determination of the optimal preheating target temperature mainly depends on the battery fade factor, rather than electricty consumption.
By using NSGA-II, every optimal preheating target temperature at different ambient temperatures and driving ranges are worked out. Based on these data, Figure 11 is plotted to present the optimal relationship between driving ranges, ambient temperatures and preheating target temperatures.
It is quite noticeable that as the ambient temperature gets lower, the optimal preheating target temperature gets higher. This is because battery needs to avoid low temperatures at which degradation could be rather serious. At this point, we reach a similar conclusion as Song et al. [29], but interestingly, the simulation results indicate that as the driving range gets longer, the optimal preheating target temperature should become lower, which means a smaller preheating demand is needed for long-distance running. This is different from Song’s conclusion. We think this is because in [29], battery internal heat generation (IHG) was neglected, but for the large batteries used in electric buses, IHG could be large, especially for long-distance driving. This IHG could result in a considerable temperature rise, leading the battery temperature to a high range, where the battery degradation becomes more severe, so in this case, a lower preheating target temperature is needed to avoid leading the battery to excessively high temperatures during vehicle operation.

5. Implementation and Control of Preheating System

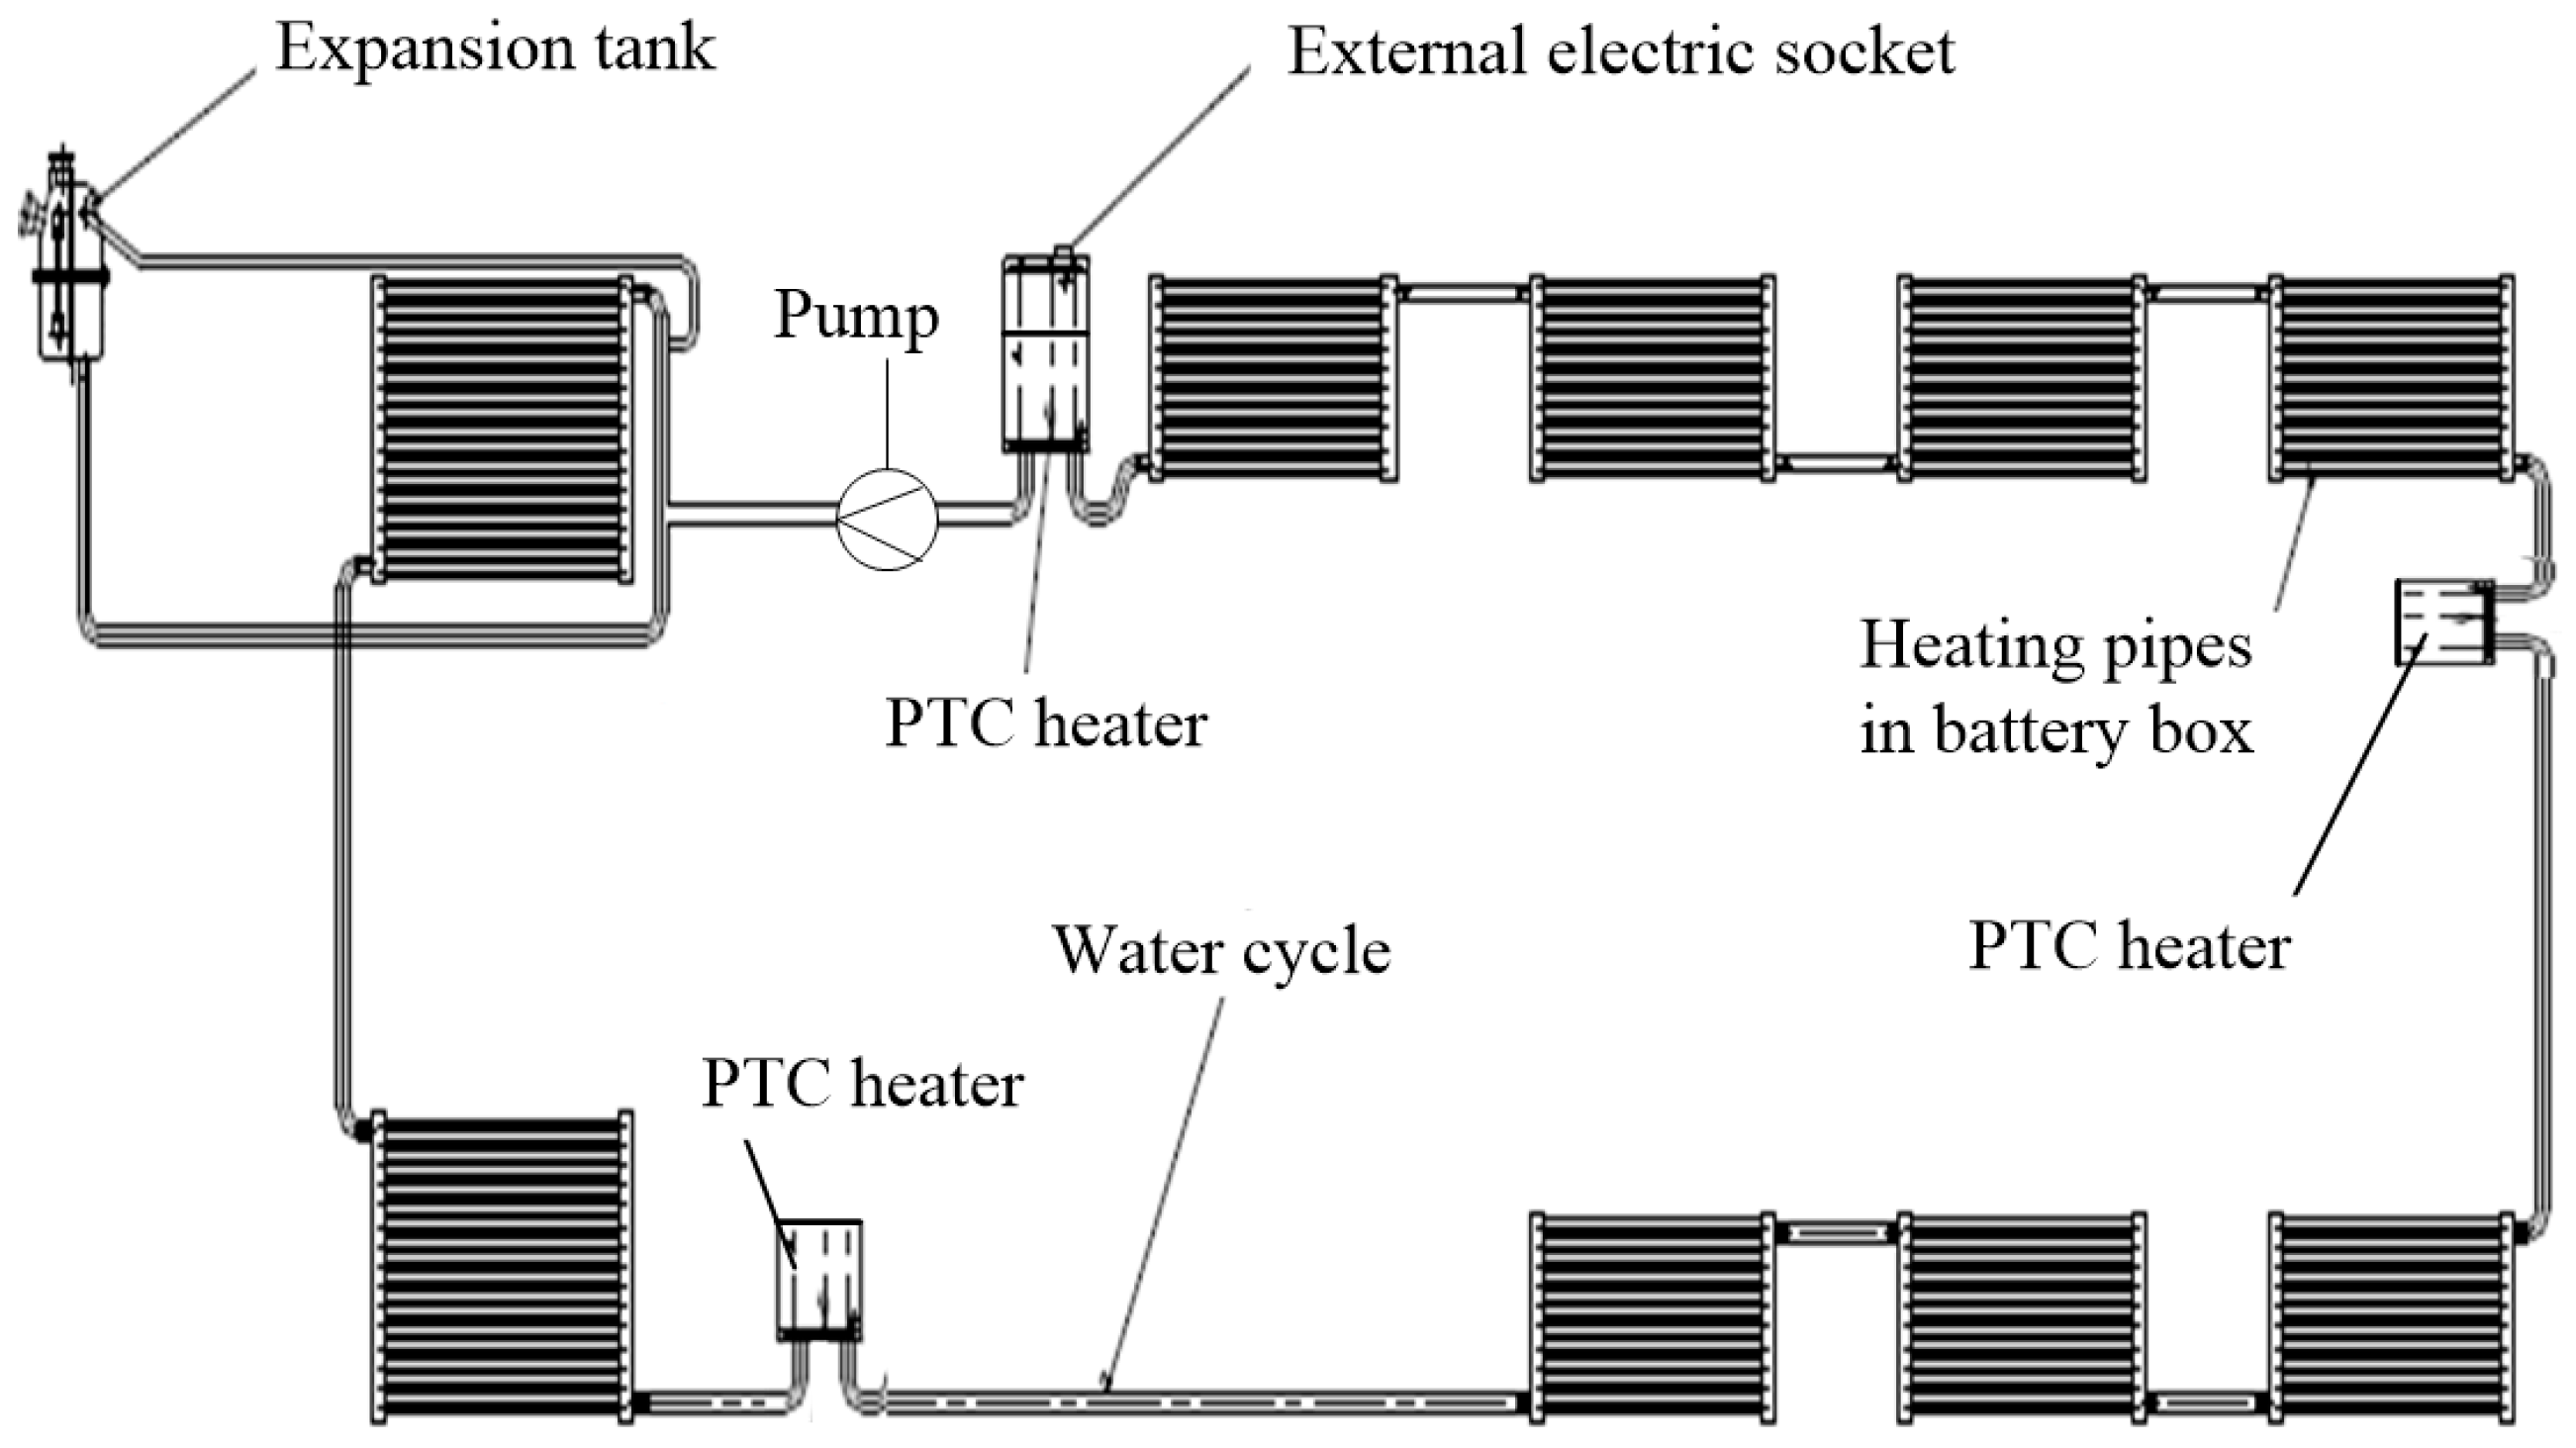
5.1. Selection and Implementation of Preheating System

The liquid heating method was selected to implement battery preheating. Compared to other heating methods, liquids provide better thermal conductivity and higher convective heat transfer rates [25]. Besides, another important reason is that there is a ready-made liquid cooling system on the electric bus used for cooling the battery in summer. From the perspectives of cost saving and minimum modification, it is advisable to adopt this way of preheating because only a minor modification to the original cooling system needs to be made [45]. Figure 12 shows the cell with circulating liquid inside. Figure 13 shows the structure of the modified preheating system. Compared to the original cooling system, the modified preheating system added three positive temperature coefficient (PTC) heaters and an external electric socket and disconnected the compressor, evaporators and condensers. The electric socket is used to connect a heating plug linking to the charging pile, so the charging pile could supply power to the heaters. Each heater, with a max power of 8 kW, is used to heat the heating medium (glycol-water mixture 2:3) in the cycle. The water circulation is driven by the pump, flowing and heating the battery. The electric bus and actual layout of the heating pipes in battery box is shown in Figure 14.
As aforementioned in Section 2.2, the value of the heat transfer coefficient h has a significant influence on the temperature rise of the battery. In other words, if the value of h were too large, the battery itself could dissipate too much heat, which leads to poor preheating system performance. As a consequence, we attached a thermal insulation blanket (made of asbestos) to the battery box. Experiments were conducted to measure the corresponding heat transfer coefficient. Since the space of a thermostat chamber is not able to contain a whole battery pack, experiments for a cell were carried out instead. Firstly the cell was covered by the thermal insulation blanket and stored under ambient temperature (−10 °C) for a quite long time, so its temperature could be considered equal to −10 °C. Then the cell was put into a thermostat chamber (held at 30 °C). The cell temperatures were measured during the process using one thermocouple attached to the core of the cell (Figure 15). According to Equation (32), the value of h could be calibrated from the heating curve of the cell:
m c e l l C p d T d t = h · A c e l l ( T T c )
After several repeated experiments (where different temperature ranges were set), the average value 15.86   w / ( m 2 · K ) was adopted for h and this value was used in Section 4 for our simulation.

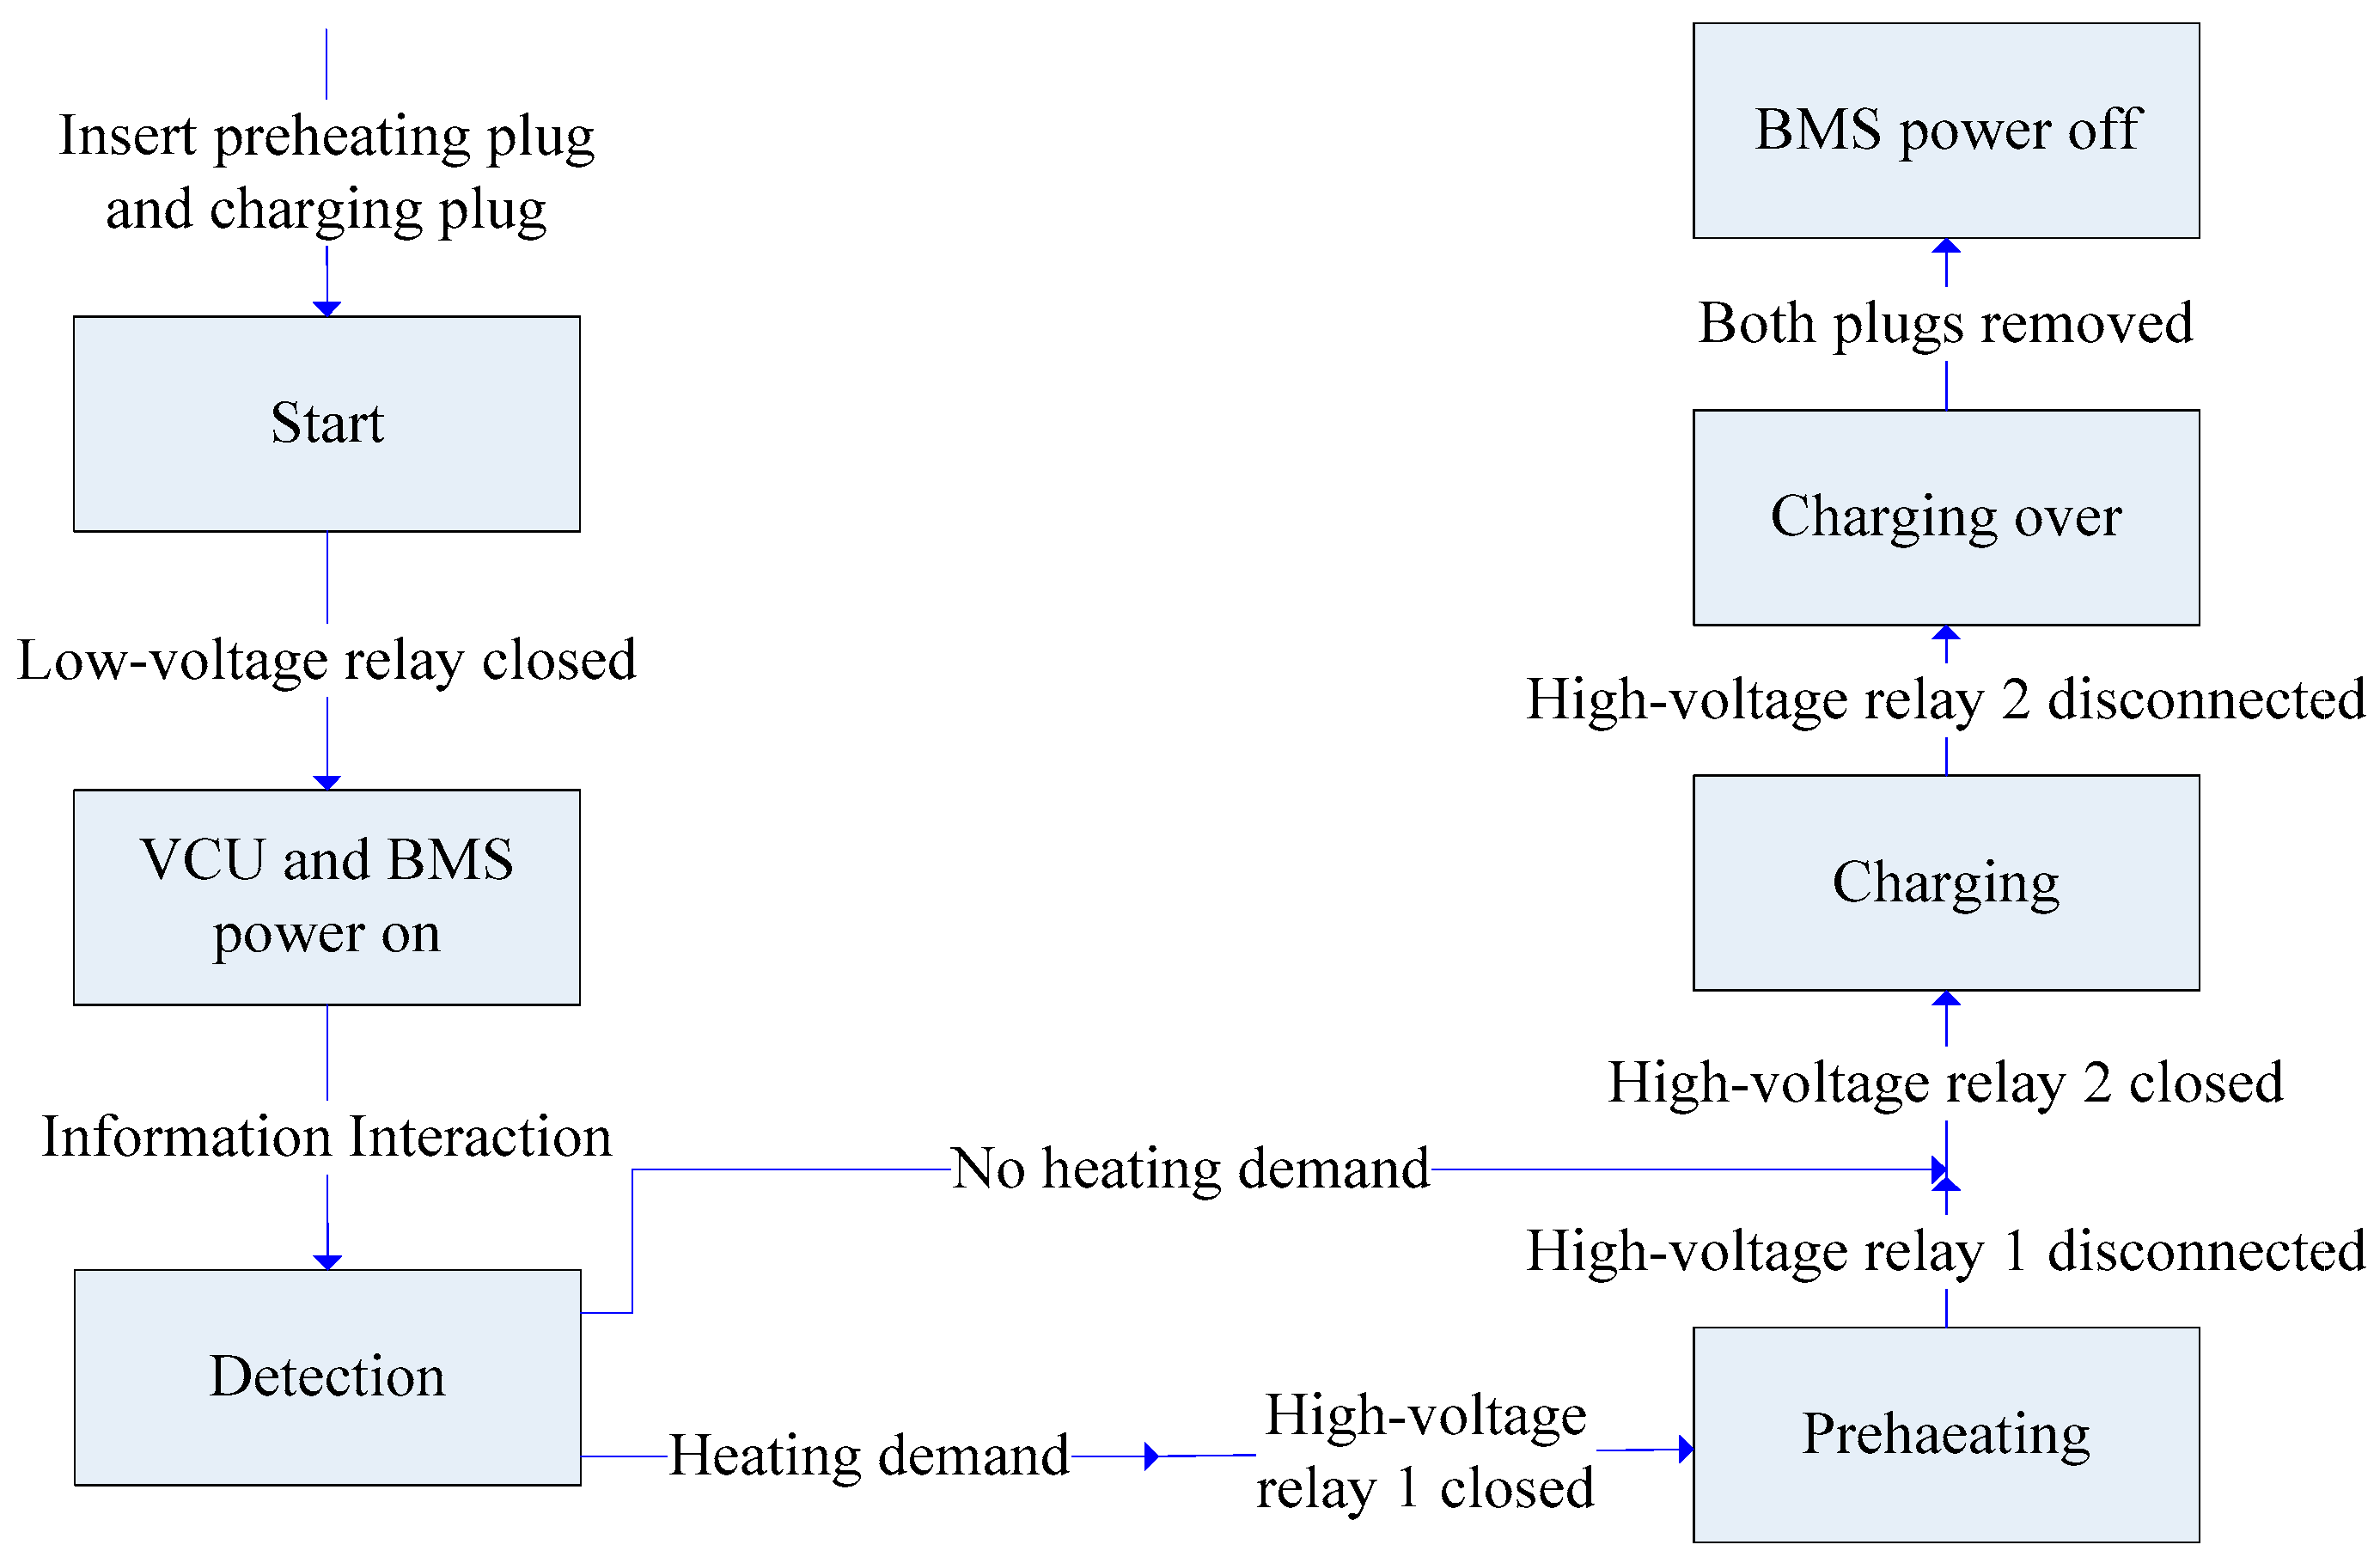
5.2. Control Strategy for Coordinating the Process of Preheating and Charging

The workflow of the corresponding control strategy is shown in Figure 16. Although the preheating process is prior to the charging process, preheating will only start with both the preheating plug and charging plug (Figure 17) inserted into the corresponding sockets on the battery. When both plugs are connected to their sockets, the low-voltage relay of the battery will be closed by the 24 V electric supply from the charging pile. As a consequence, the battery management system (BMS) will power on [46]. The vehicle control unit (VCU) also needs to be awakened because it is supposed to control the preheating process. The VCU and BMS will exchange information with the charging pile through controller area network (CAN) communications. The purpose of this information interaction is to check whether the status of VCU and battery is healthy or not. If not, neither preheating nor charging is permitted so as to avoid undesirable danger. After detection is passed, the VCU will judge whether there is the need for preheating based on the ambient temperature and the given driving range. If the battery does need heating, the VCU will close high-voltage relay 1 (for preheating) and then the charging pile could supply power to the PTC heaters. The heaters will keep working until the battery reaches the target temperature. At that time, high-voltage relay 1 will be disconnected and the preheating process is completed.
After the VCU detects that high-voltage relay 1 is reliably disconnected, the high-voltage relay 2 (for charging) will be closed by the BMS, which means that battery enters charging mode. When charging is finished, the high-voltage relay 2 will be disconnected by the BMS. When both plugs are pulled out, the BMS powers off. Finally the electric bus is ready to drive.

5.3. Performance of the Preheating System

The performance of the preheating system is assessed through five items:
(1)
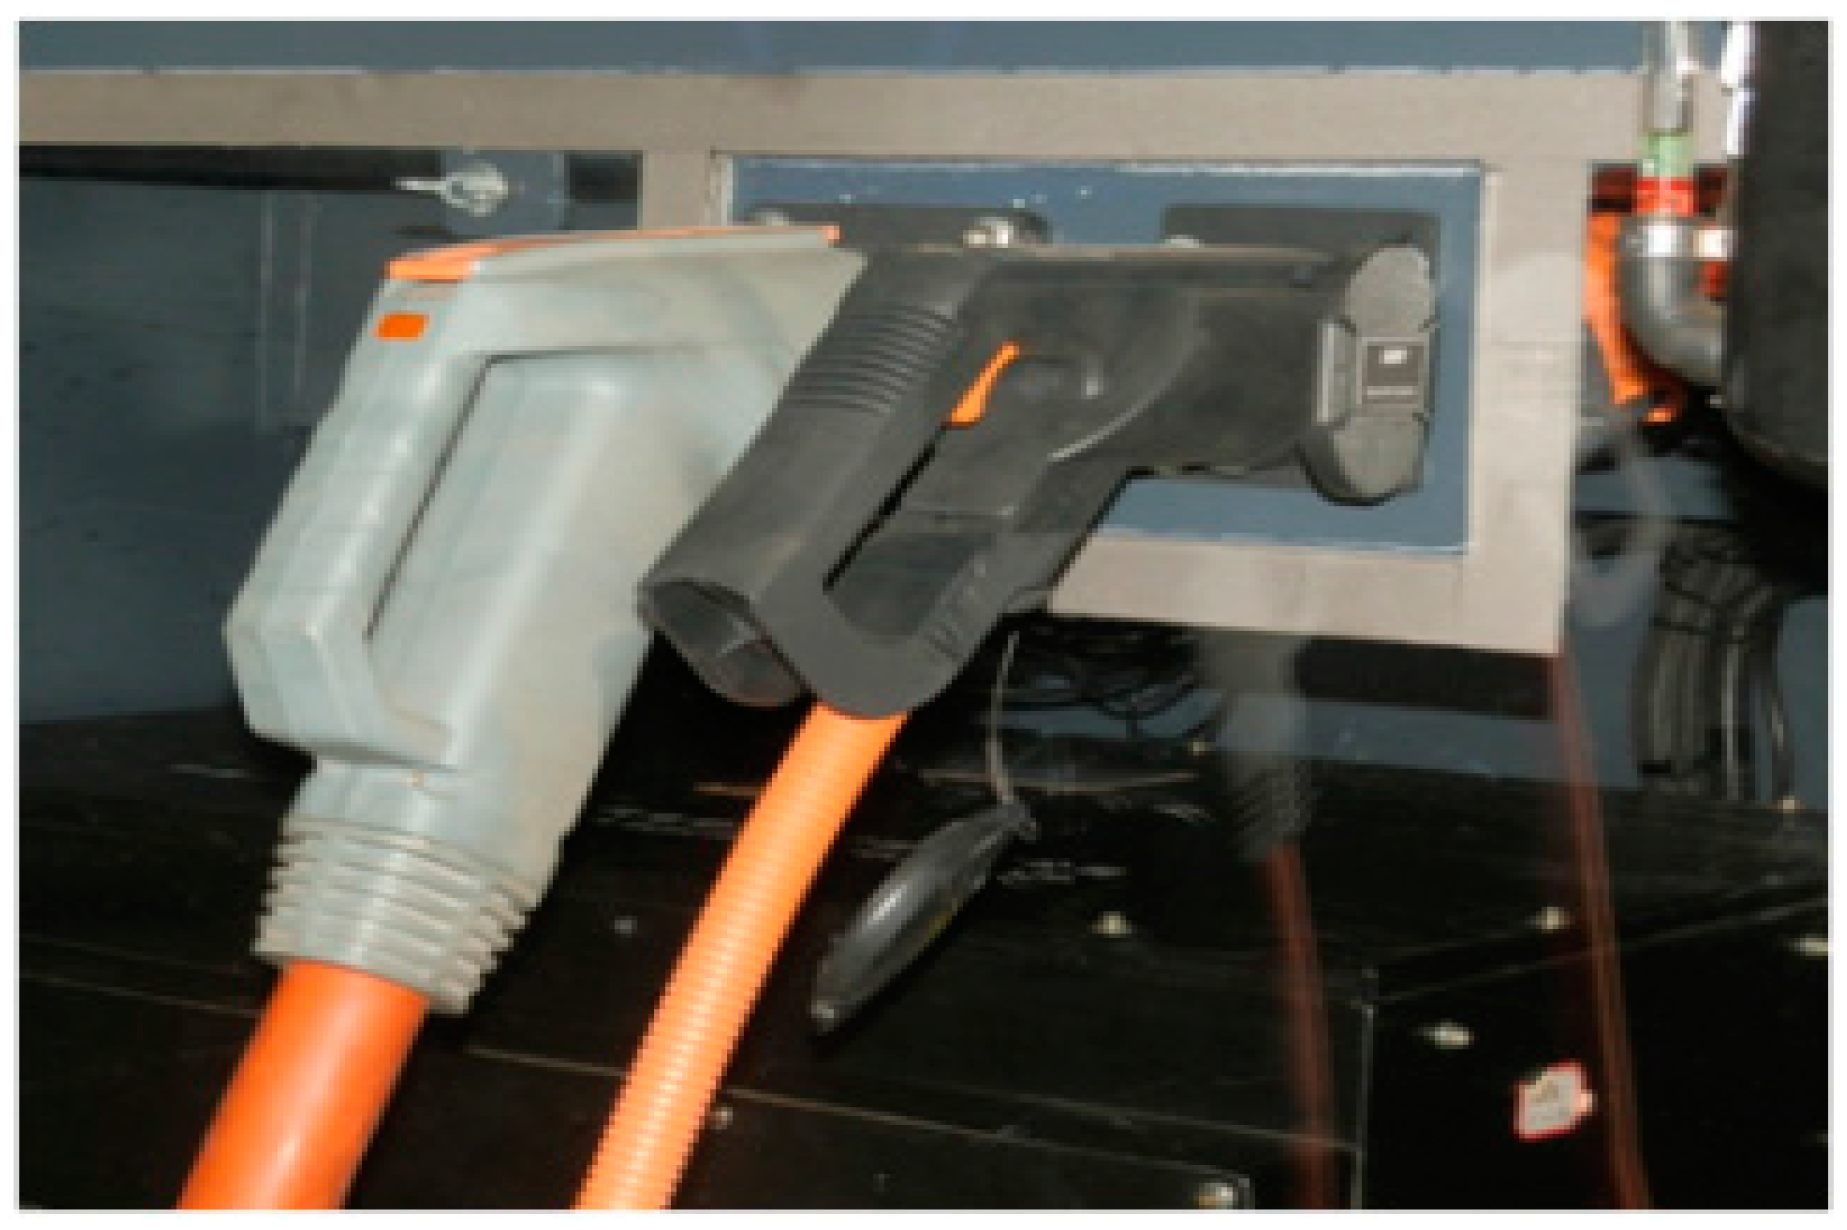
Power source: The preheating system is powered by charging piles. Compared with battery self-heating whose power supply is the battery itself, this preheating system could save the energy inside the battery, which indirectly prolongs the vehicle’s driving range;
(2)
System cost: Three PTC heaters, an external electric socket and several relays were added on the basis of original cooling system, so it is very cost-saving;
(3)
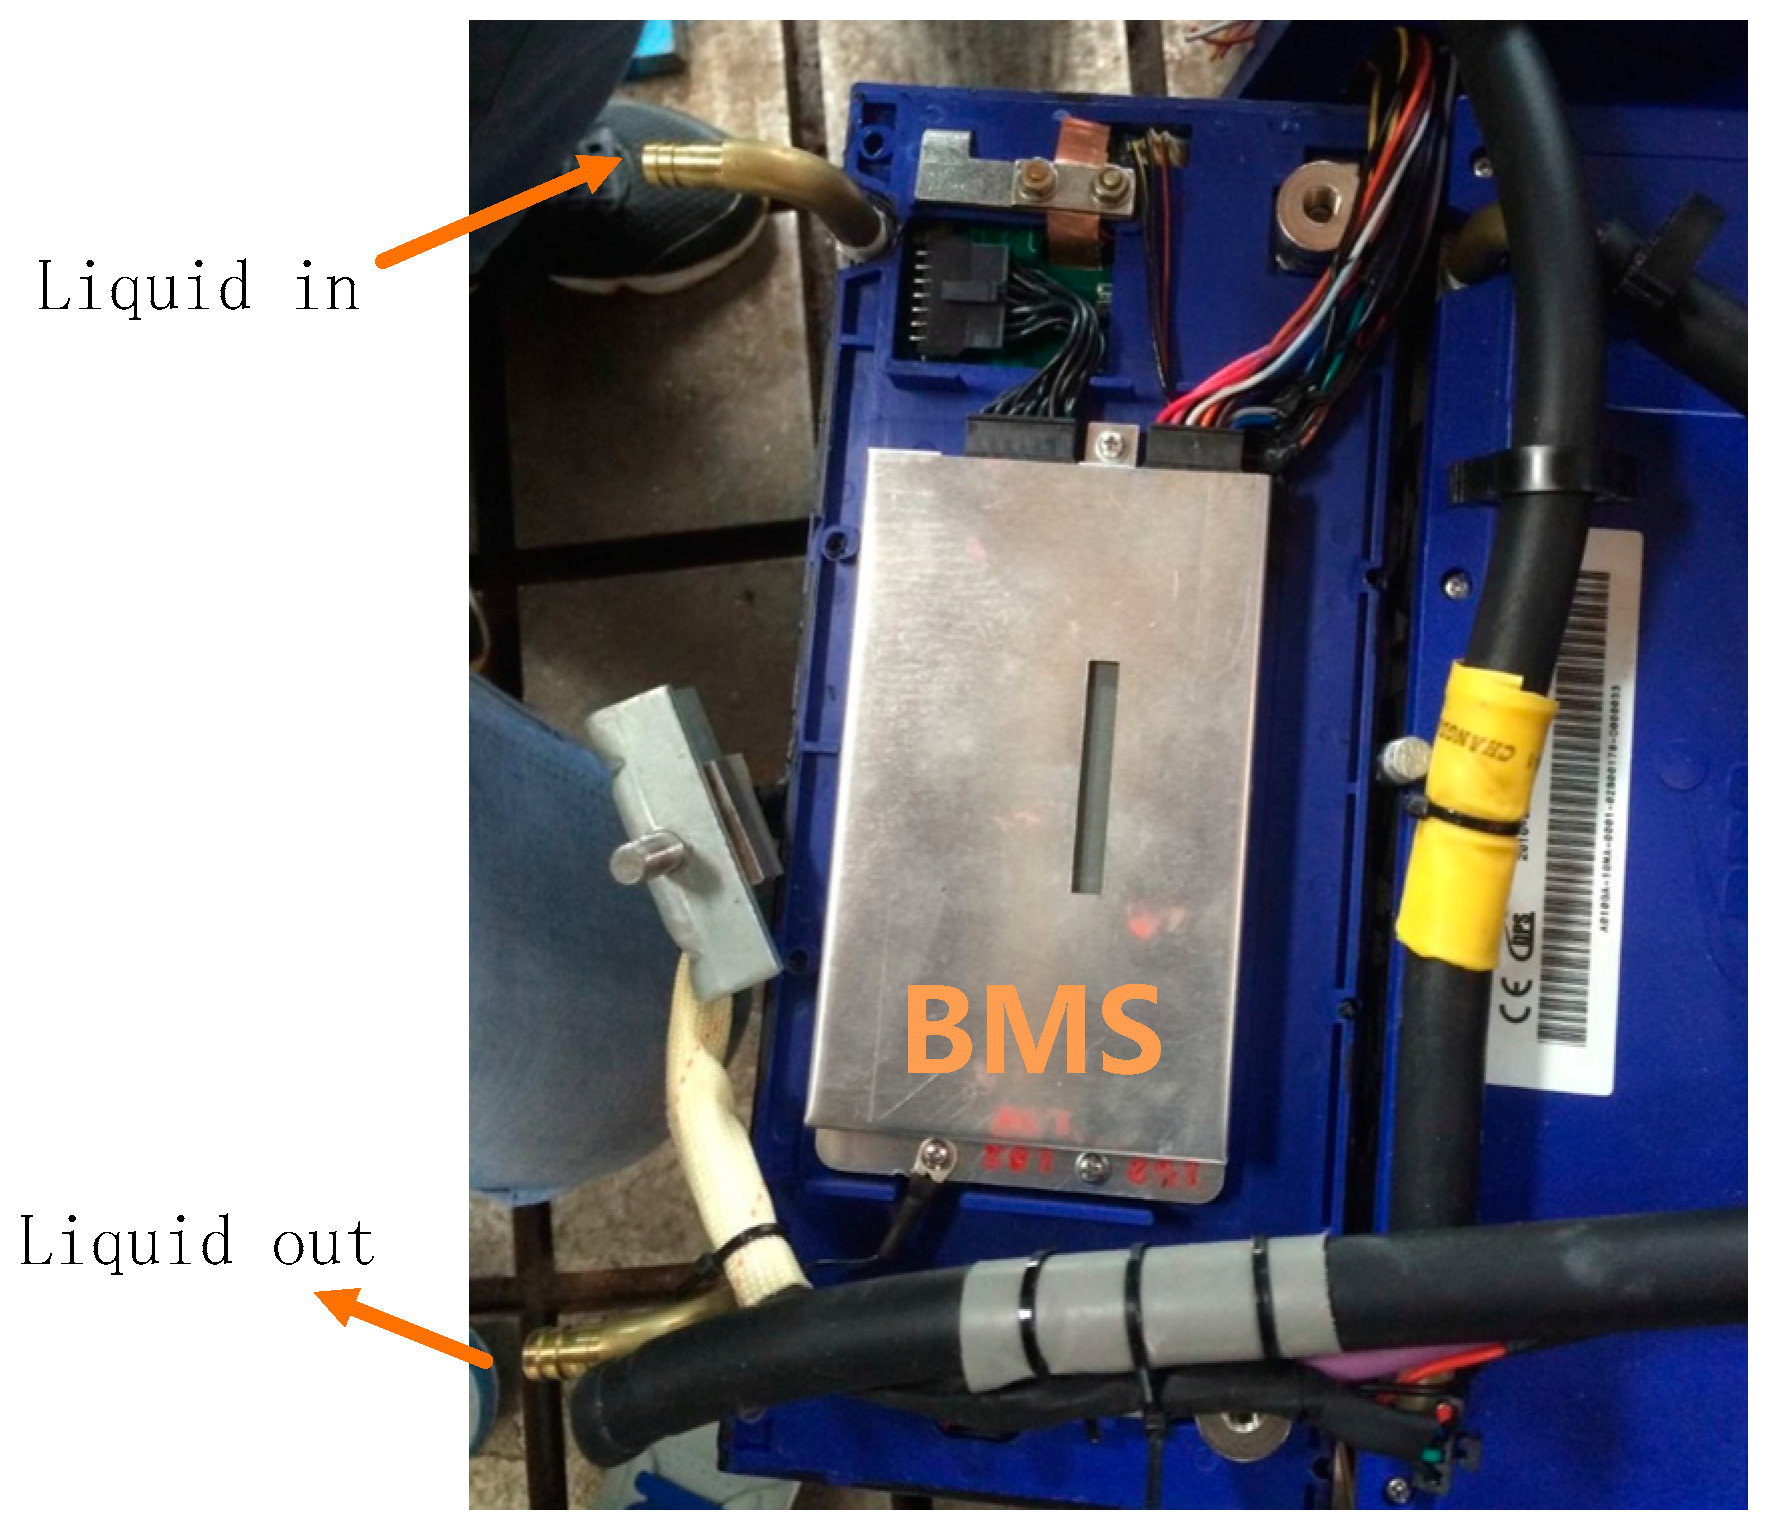
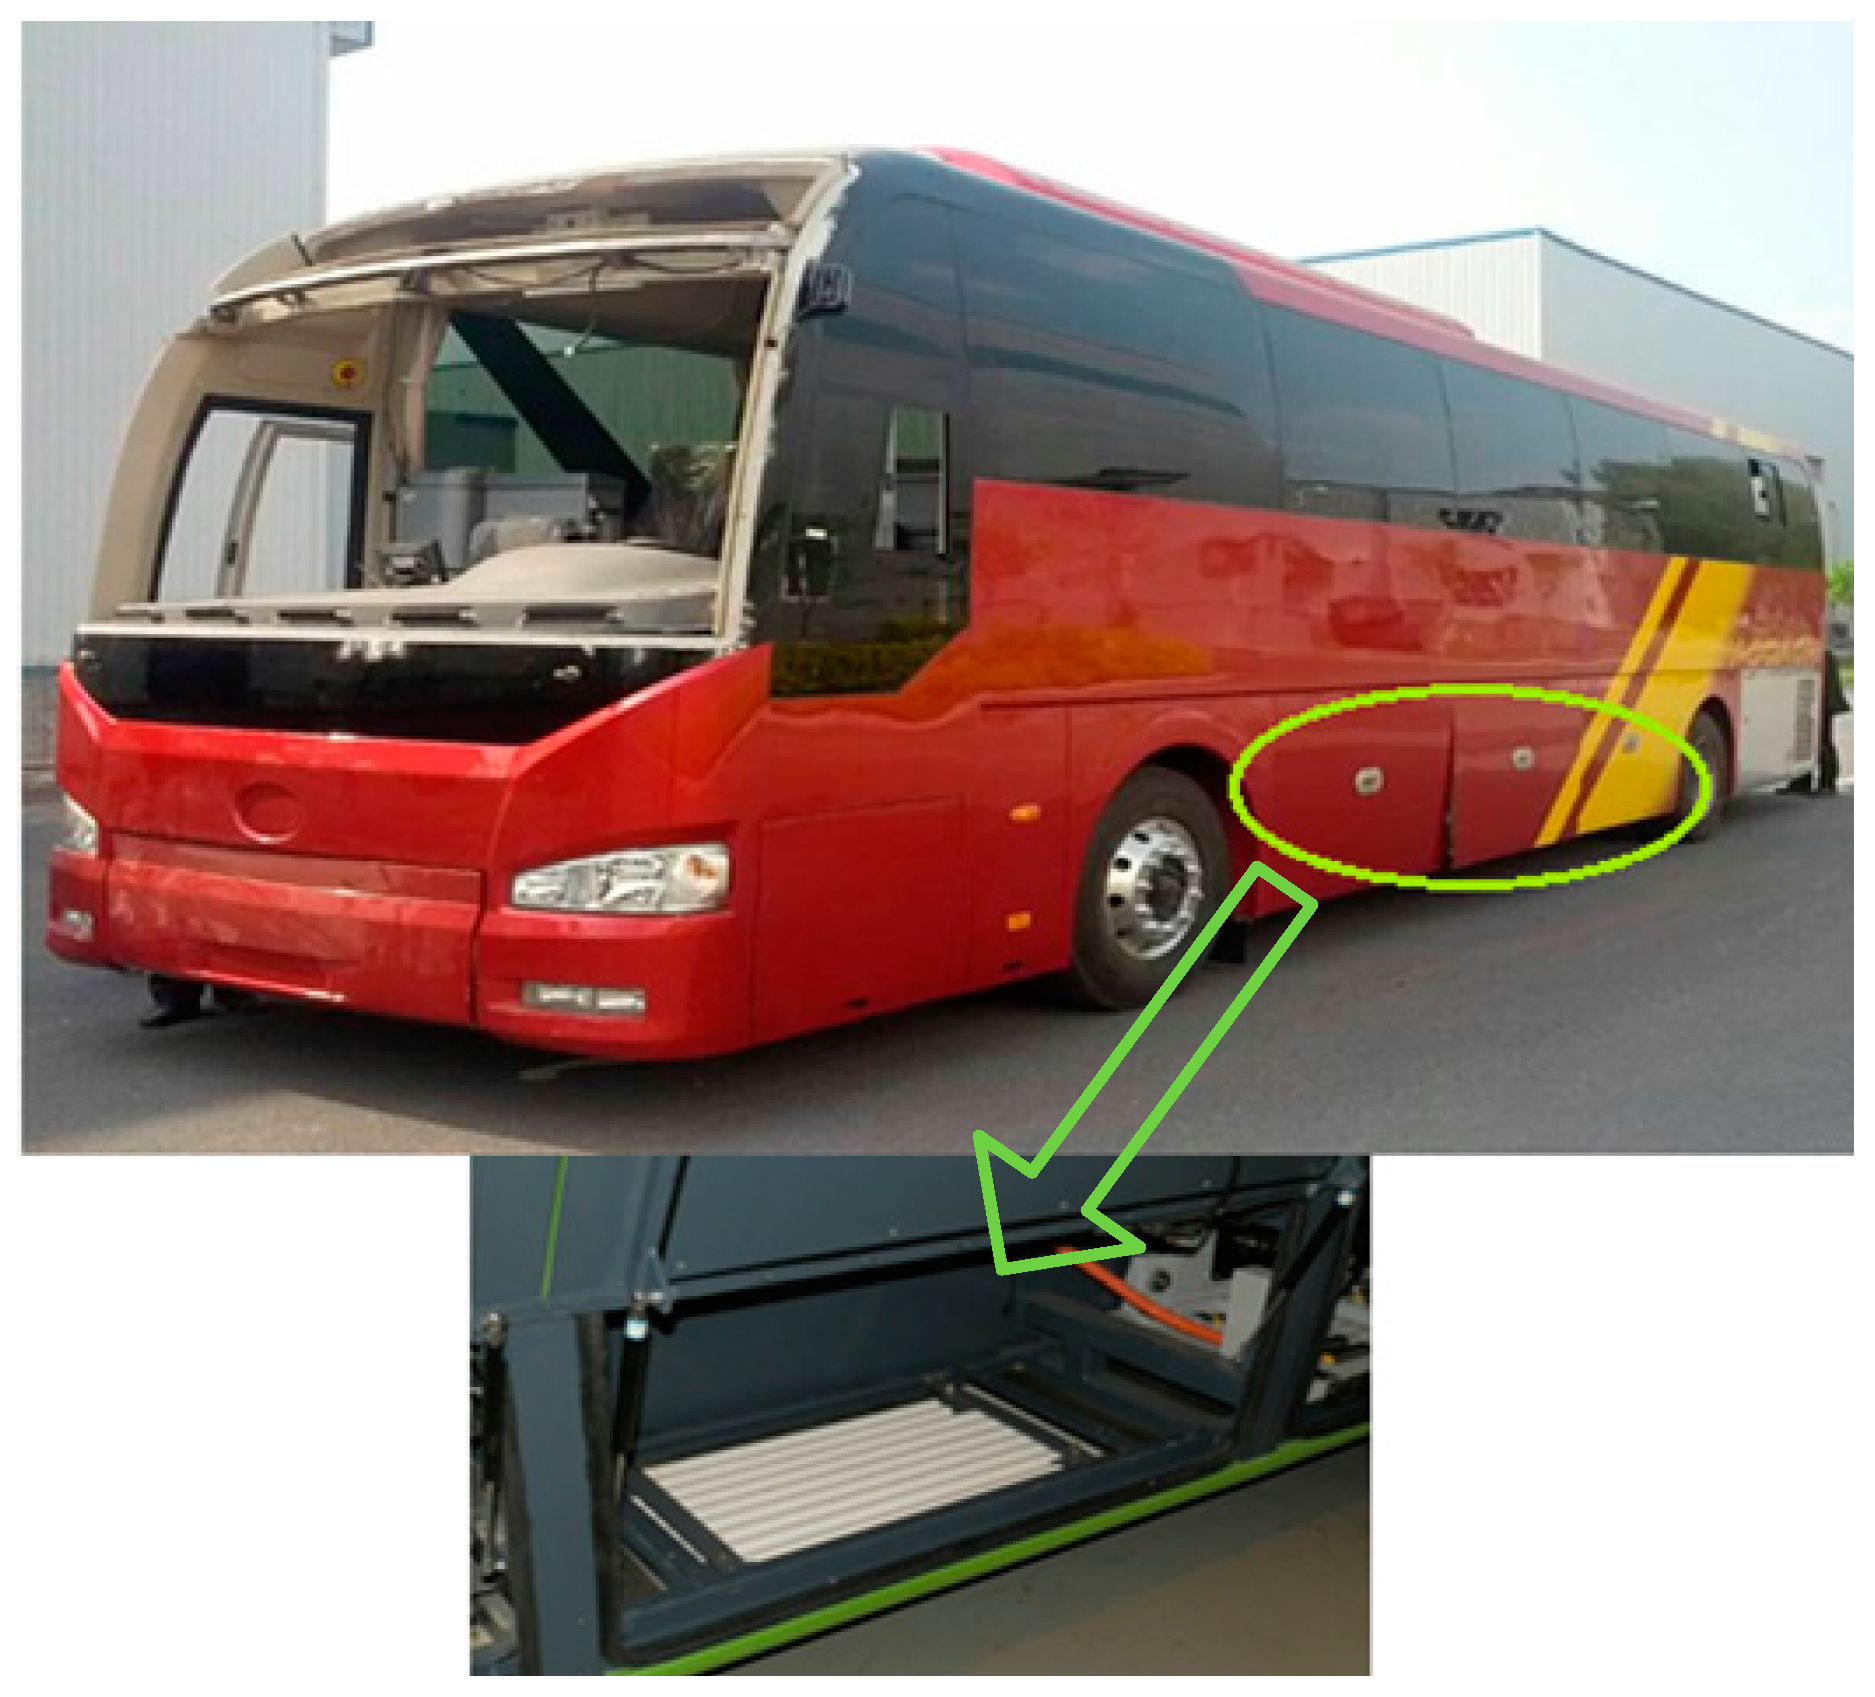
Temperature uniformity: To some extent, temperature imbalance among different cells is unavoidable because the water circulation loop is too long. However, exactly because of this reason, three distributive PTC heaters were arranged at different positions in the water cycle (Figure 13) to reverse this trend. According to the information collected by BMS, if these three heaters were given same power, the biggest temperature difference among different cells is 3.1 °C.
(4)
System efficiency: Here the heating efficiency is defined as:
η p h = m b a t C p Δ T U c p I c p d t × 100 %
The heating efficiency was calculated with the ambient temperature being −10 °C and the results showed an average efficiency of 78%.
(5)
Heating time: The heating time was tested with the ambient temperature being −10 °C, the target temperature being 2 °C and the power of each heater being 8 kW (max power). The tested preheating time is 1157 s. Compared with other preheating methods such as self-heating, this preheating time is much longer. As a consequence, the utilization of the electric bus should be scheduled carefully. The long heating time is a serious disadvantage of liquid heating.
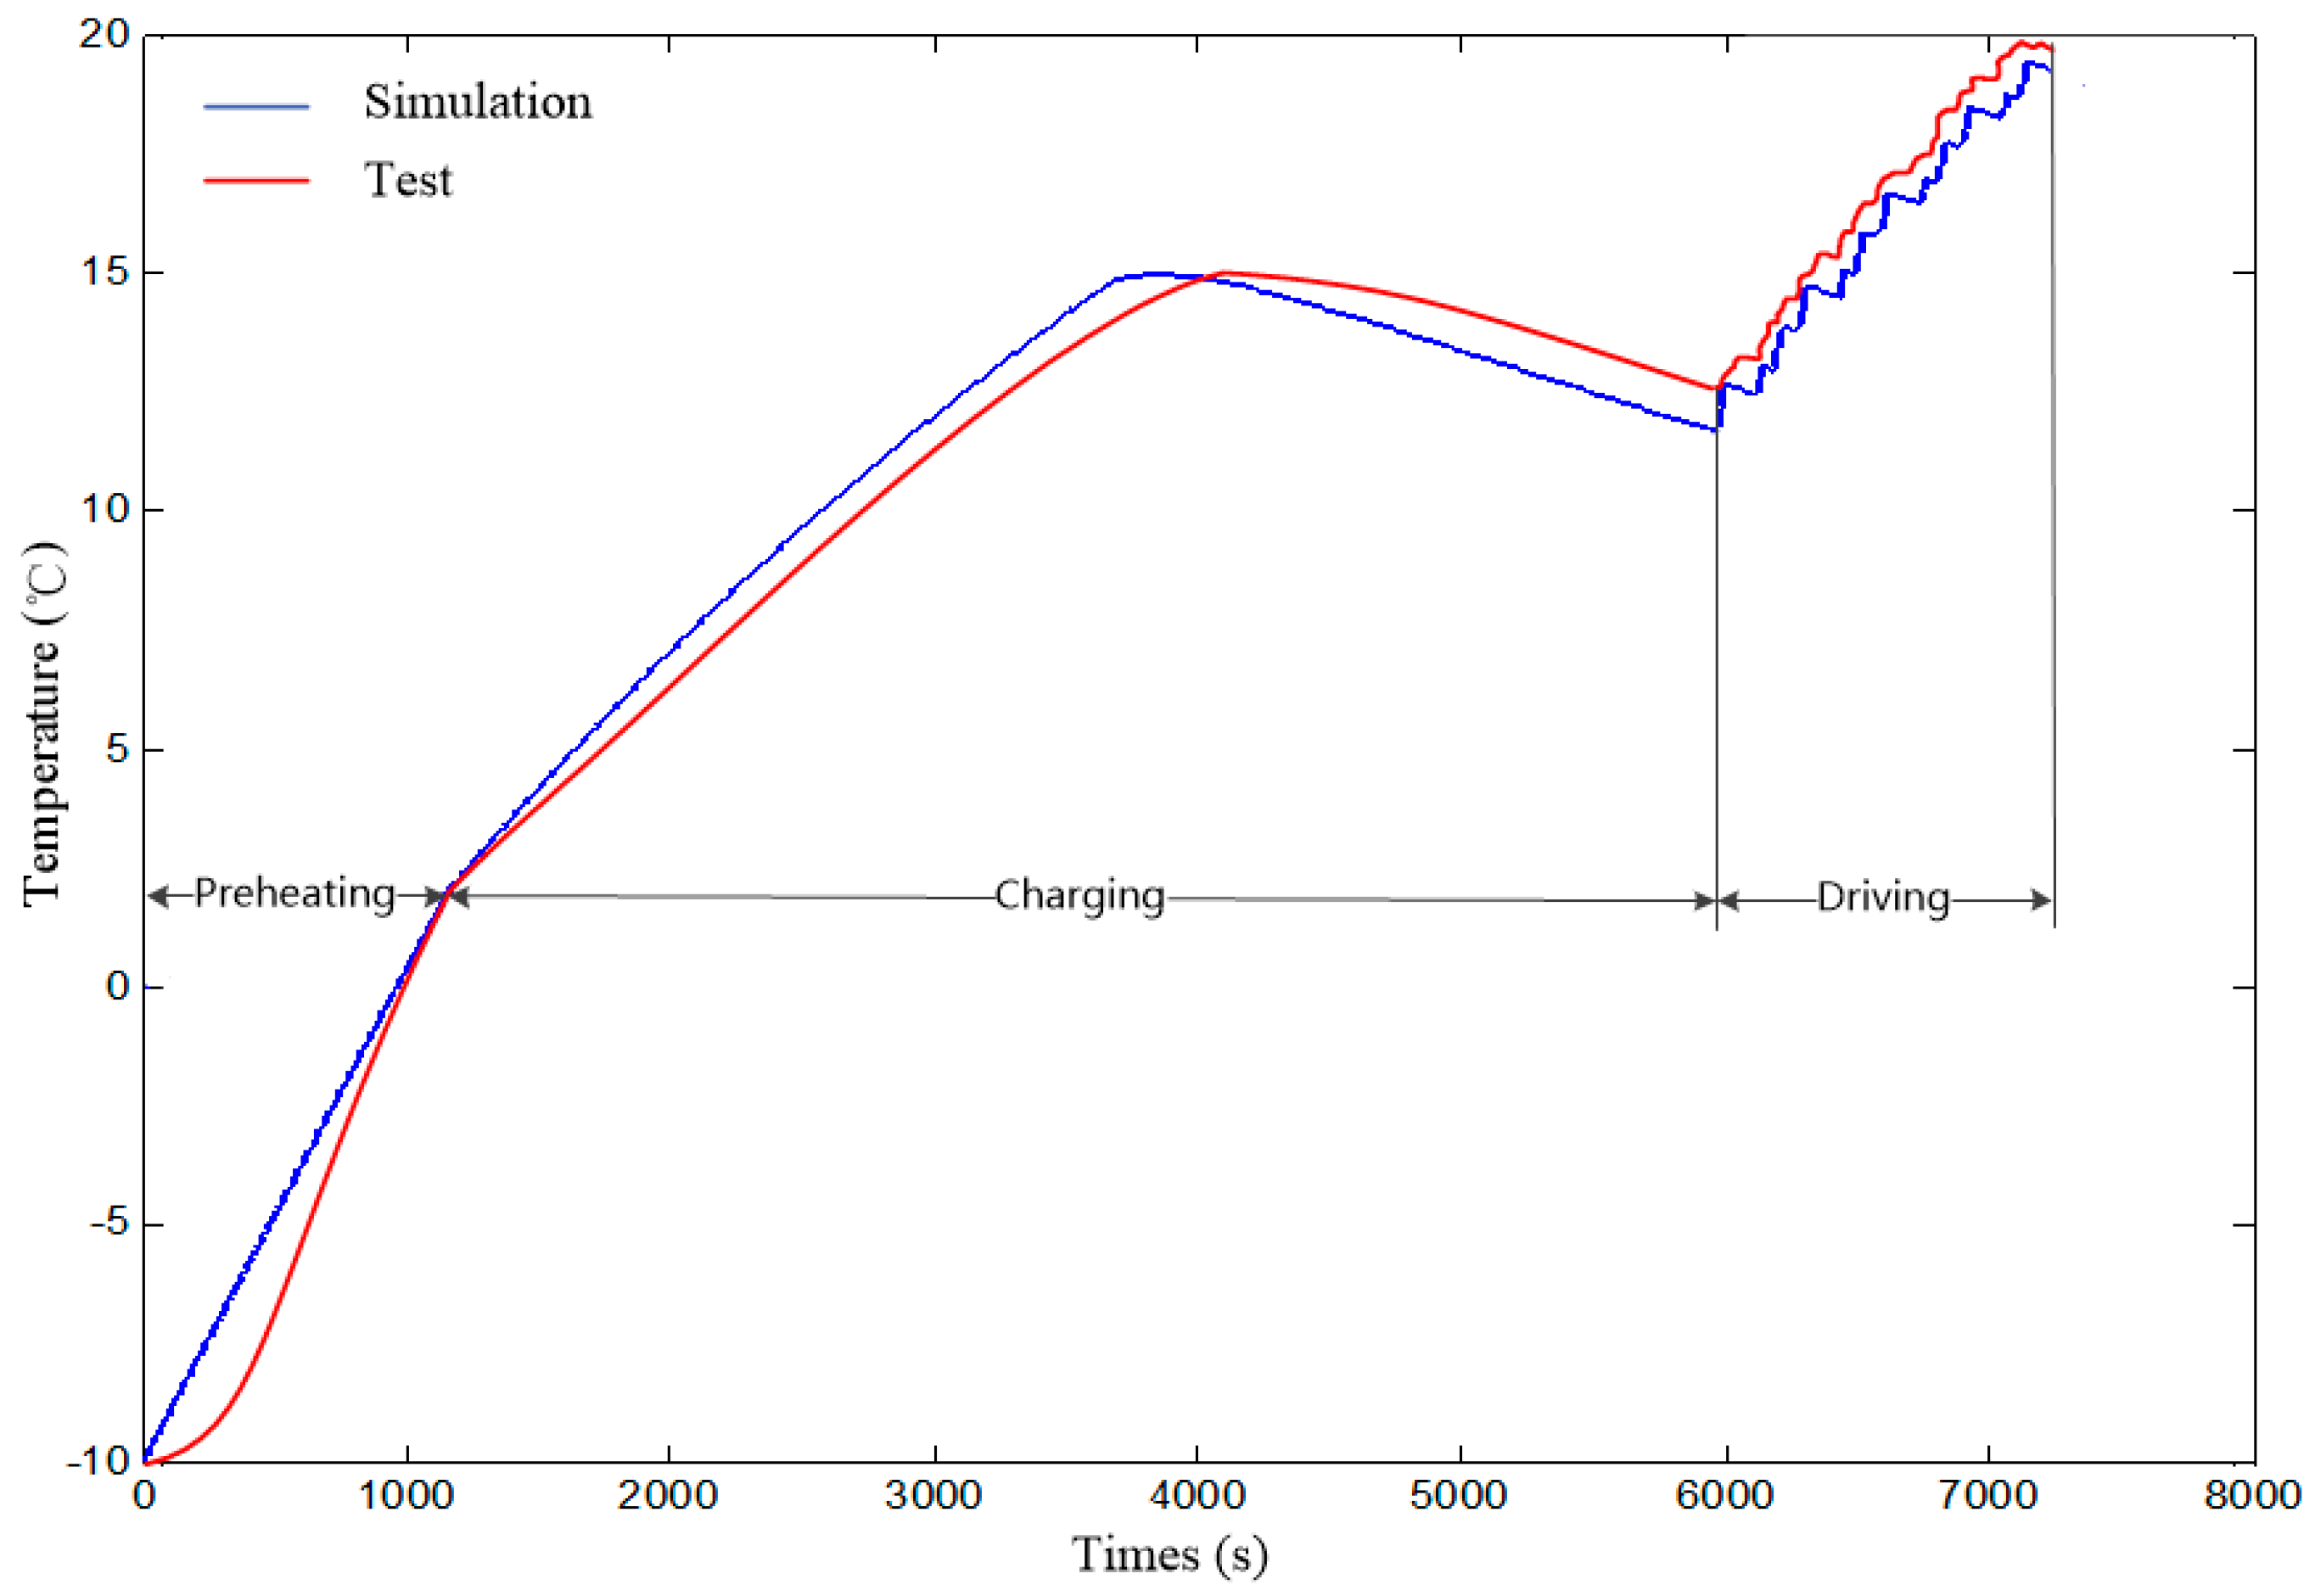
6. Vehicle Test

Vehicle tests were conducted at: (1) ambient temperature of −10 °C, which was the outdoor temperature during our tests; (2) driving range of 20 km. Long-distance driving was not preferable because of the cumulative errors; (3) 20% SOC before charging and 100% SOC after charging. This is because it is often the case that SOC window for vehicle-mounted battery is 20%~100%. Two tests were conducted with different preheating strategies:
(1)
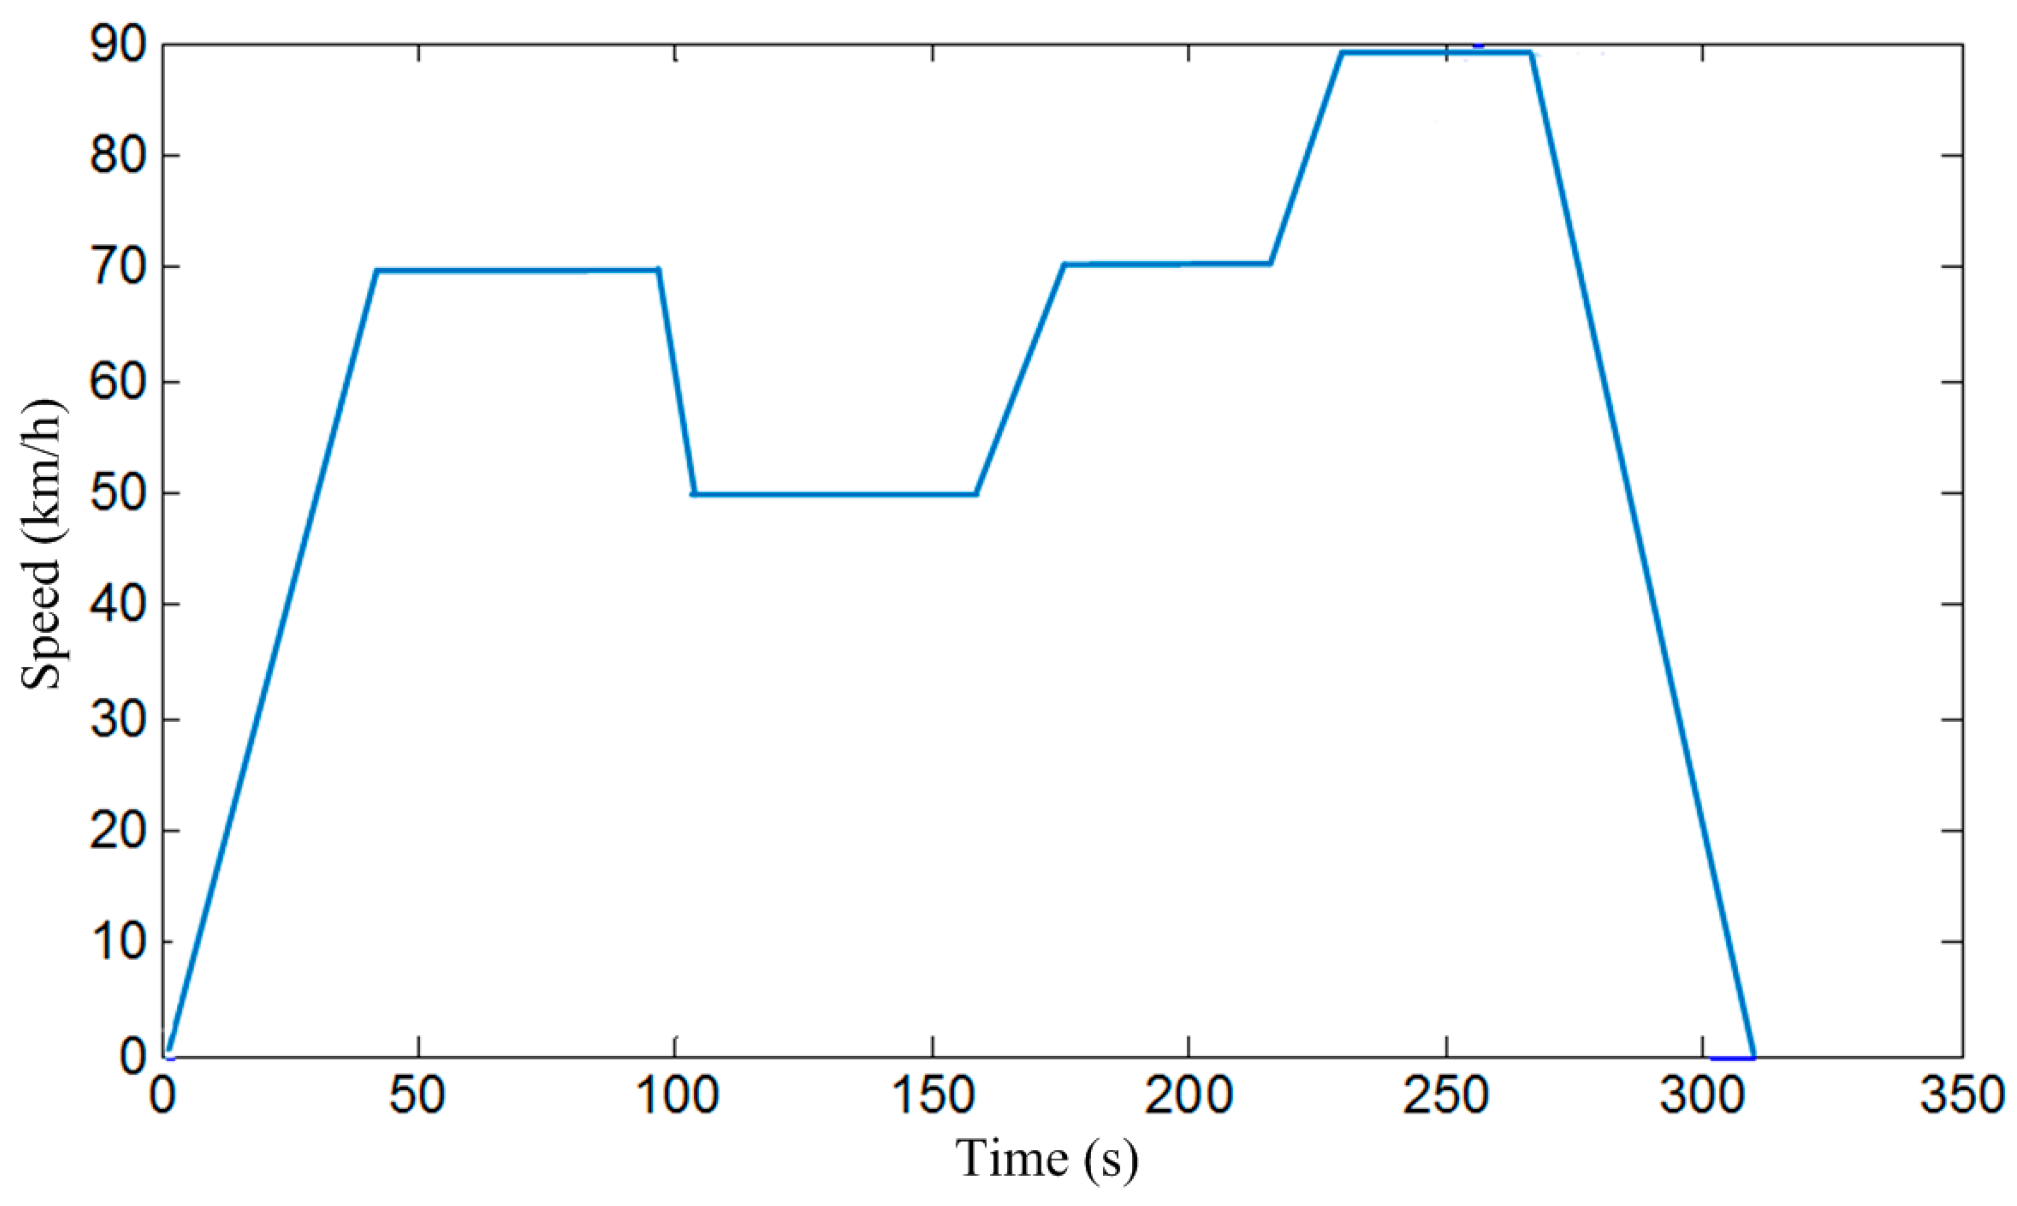
Battery without preheating. Keep battery SOC at 20% through charging or discharging, and then cool the battery to ambient temperature. After this, fully charge the battery without preheating. Then drive the electric bus for 20 km in accordance with the driving cycles in Figure 9.
(2)
Battery heated to 2 °C (optimal target temperature given by the simulation). Keep SOC of battery at 20% through charging or discharging, and then cool the battery to ambient temperature. After this, preheat the battery to 20 °C before charging. Then fully charge battery and drive the electric bus for 20 km in accordance with the driving cycles in Figure 9.
During the charging process, the conventional CC-CV (first constant current, and then constant voltage) was not utilized in the tests. Instead, a two-stage constant current charging method was used [47]. This is because a pack with cells in series is not suitable for constant voltage charging. During vehicle operation process, test data such as battery temperature were collected by computers, which are linked to the BMS and VCU through CAN open environment (CANoe), as Figure 18 shows.
Test results and comparison with simulation results are shown in Table 3. It is clearly shown in this table that if the battery was heated to 2 °C before charging, after vehicle operation, nearly 50 $ could be saved compared to that without preheating.
This represents a considerable cost savings, which proves the necessity of the preheating management strategy. Preheating made more SOC remain in the battery after the driving cycles, which was because a higher energy efficiency leads to lower energy consumption in the charging process and driving cycles. What is more, after being heated, the battery capacity degradation became less severe, which is the uppermost contribution of preheating to reducing total vehicle operation cost. Besides, no significant difference between test and simulation values was found. The difference for items such as SOC may be reasonable, because in real vehicle operation many accessories on vehicle also consume electricity, which resulted in a lower SOC value compared with the simulation value. During Test 2, the battery temperature is shown in Figure 19. At the beginning of the preheating process, the battery temperature failed to rise promptly. This is because the liquid in the water circulation system needs some time to be heated first, and then the battery could be heated by the liquid. In the charging process, the real battery temperature was a little lower than the simulated temperature at first, which was because the temperature was measured on the surface of the battery. In the simulation, battery was considered as a lumped mass, but the truth was that the heat conduction inside battery was not that fast. In the second half of charging process, the battery temperature went down due to the fact that as the charging current fell, the battery IHG was not able to compensate the heat dissipated to the ambient. Finally, during the driving process, both the test and the simulation showed a similar rising trend with fluctuation. The increase in battery temperature during driving was approximately 8 °C, which also indicated that battery IHG cannot be neglected, even for a short-distance driving range.

7. Conclusions

In conclusion, this paper presents a novel preheating management strategy aimed at lowering the total operation cost of an electric vehicle. Based on analysis of the electrothermal performance and aging model of the LiFePO4 battery, a coupled battery model is proposed. For automotive analysis, the vehicle operation cost of an electric bus is deduced from two perspectives: electricity consumption cost and battery fade cost. Under the principle of least vehicle operation cost, an optimal preheating target temperature was determined. A liquid-heating preheating system has also been implemented on an electric bus. Comprehensive simulation results suggest that as the ambient temperature declines, the preheating process becomes increasingly important to avoid severe battery capacity degradation at low temperatures, thus the optimal preheating target temperatures increase with decreasing ambient temperature. On the other hand, rising the driving range calls for a descending preheating target temperature, because during vehicle operation the battery can heat itself and a longer distance running leads to a higher temperature at which battery also suffers a more severe degradation. The rationality of this preheating management strategy has been verified by vehicle tests.
For the application of this strategy in other situations, it must be highlighted here that the optimal preheating target temperatures may shift with different driving cycles, battery types, battery price and efficiency of the preheating system. A deficiency in this paper is that the battery is always considered as brand new, but the truth is that battery degradation speed slows down as total Ah-throughput increases, so for aged batteries, the degradation speed is slower than that of brand new batteries under the same working conditions, consequently lowering the optimal preheating target temperature because of less severe capacity degradation. Fortunately, the optimal preheating target temperatures of used batteries can also be determined by using the methods proposed in this paper, but the precondition is that the total Ah-throughput can be known before optimization.
The SOC region of the battery is invariable in this paper, but it is also known to have an influence on the battery lifecycle. Future work may take the SOC region into battery degradation consideration. The long heating time of the implemented heating system also needs amelioration, and because of this, the utilization of the vehicle should be well-planned in advance. On the other hand, a good heating high efficiency system can significantly improve the driving economy. Future work will also try to improve the heating system with other approaches.

Acknowledgments

The authors gratefully acknowledge the financial support from the National Natural Science Foundation of China (51107052) and the Key Science and Technology Projects of Science and Technology Department of Jilin Province (20150204016GX). The eighth author of this paper is funded by China Scholarship Council.

Author Contributions

Tao Zhu and Haitao Min were responsible for total article structure design and writing; Yuanbin Yu contributed the literature review and the funding support; Zhongmin Zhao and Tao Xu contributed the implementation of preheating system and vehicle test; Yang Chen and Xinyong Li conducted experiments regarding batteries and helped rearranged the paper structure; Cong Zhang reviewed this paper and gave some advice about revision.

Conflicts of Interest

The authors declare no conflict of interest.

Nomenclature

Δ A h Increment of battery Ah-throughput (Ah)
Δ C l o s s % Increment of battery capacity loss ratio
Δ T Battery temperature change (K)
U o c T Battery entropy coefficient
A b a t Surface area of battery ( m 2 )
A c e l l Surface area of cell ( m 2 )
AhBattery Ah-throughput, Ah= (cycle number) × (DOD) × (full battery capacity) (Ah)
A v e h Vehicle front area ( m 2 )
BPre-exponential factor
C l o s s % Battery capacity loss ratio
C p , i Special heat capacity of battery component i (J/(kg·K))
C 0 Battery initial capacity (Ah)
C D Air drag coefficient
C e l e Vehicle electricity consumption cost ($)
C f a d e Battery fade cost ($)
C p Battery specific heat capacity (J/(kg·K))
C r a t e Battery current rate (C)
fRolling resistance coefficient
F b Total braking force of vehicle (N)
F m e c Vehicle mechanical braking force (N)
F m o t o r Braking force of motor (N)
F r e a r Braking force of rear axle (N)
gGravity acceleration ( m · s 2 )
hCoefficient of heat transfer between battery and outside air ( w / ( m 2 K ) )
IBattery current (A)
I c h a Battery current during charge (A)
I c p Battery current of the charging pile during preheating process (A)
I d c h Battery current during discharge (A)
i g Gearbox ratio
i 0 Final drive ratio
m b a t Battery mass (kg)
m c e l l Cell mass (kg)
m v e h Vehicle mass (kg)
nRotational speed of motor (r/min)
P b a t Battery output power (kW)
P b a t , b r a Battery power when vehicle is braking (kW)
P b a t , d r v Battery power when vehicle is driving (kW)
P m o t o r Motor power (kW)
P v e h Power demand of vehicle (kW)
Q c Battery heat generated during charge (J)
Q c h a Energy loss of charging (J)
Q c y c Energy consumption of driving cycles (J)
Q c y c , b r a Energy consumption of driving cycles when vehicle is braking (J)
Q c y c , d r v Energy consumption of driving cycles when vehicle is driving (J)
Q d Battery heat generated during discharge (J)
Q d i s Battery heat dissipated (W)
Q e l e Vehicle electricity consumption (J)
Q j Battery Joule heat generation (W)
Q l o s s Energy loss during discharge or charge (J)
Q p Battery polarization reaction heat generation (W)
Q p h Energy consumption of preheating (J)
Q r Battery reaction heat generation (W)
Q s Battery side reaction heat generation (W)
Q t Battery heat generation (W)
rWheel radius (m)
RBattery equivalent resistance (Ω)
tTime (s)
T Battery surface temperature (K)
T 0 Battery ambient temperature (K)
T 1 Battery preheating target temperature (K)
T c Temperature of thermostat chamber (K)
T f Battery finial temperature in C p measurement process (K)
T i Battery initial temperature in C p measurement process (K)
uVehicle speed (km/h)
U b a t Battery terminal voltage (V)
U c h a Battery terminal voltage during charge (V)
U c p Voltage of the charging pile during preheating process (V)
U o c Battery open circuit voltage (OCV) (V)
V i Volume of battery component i ( m 3 )
zVehicle braking intensity
δ Correction coefficient of rotating mass
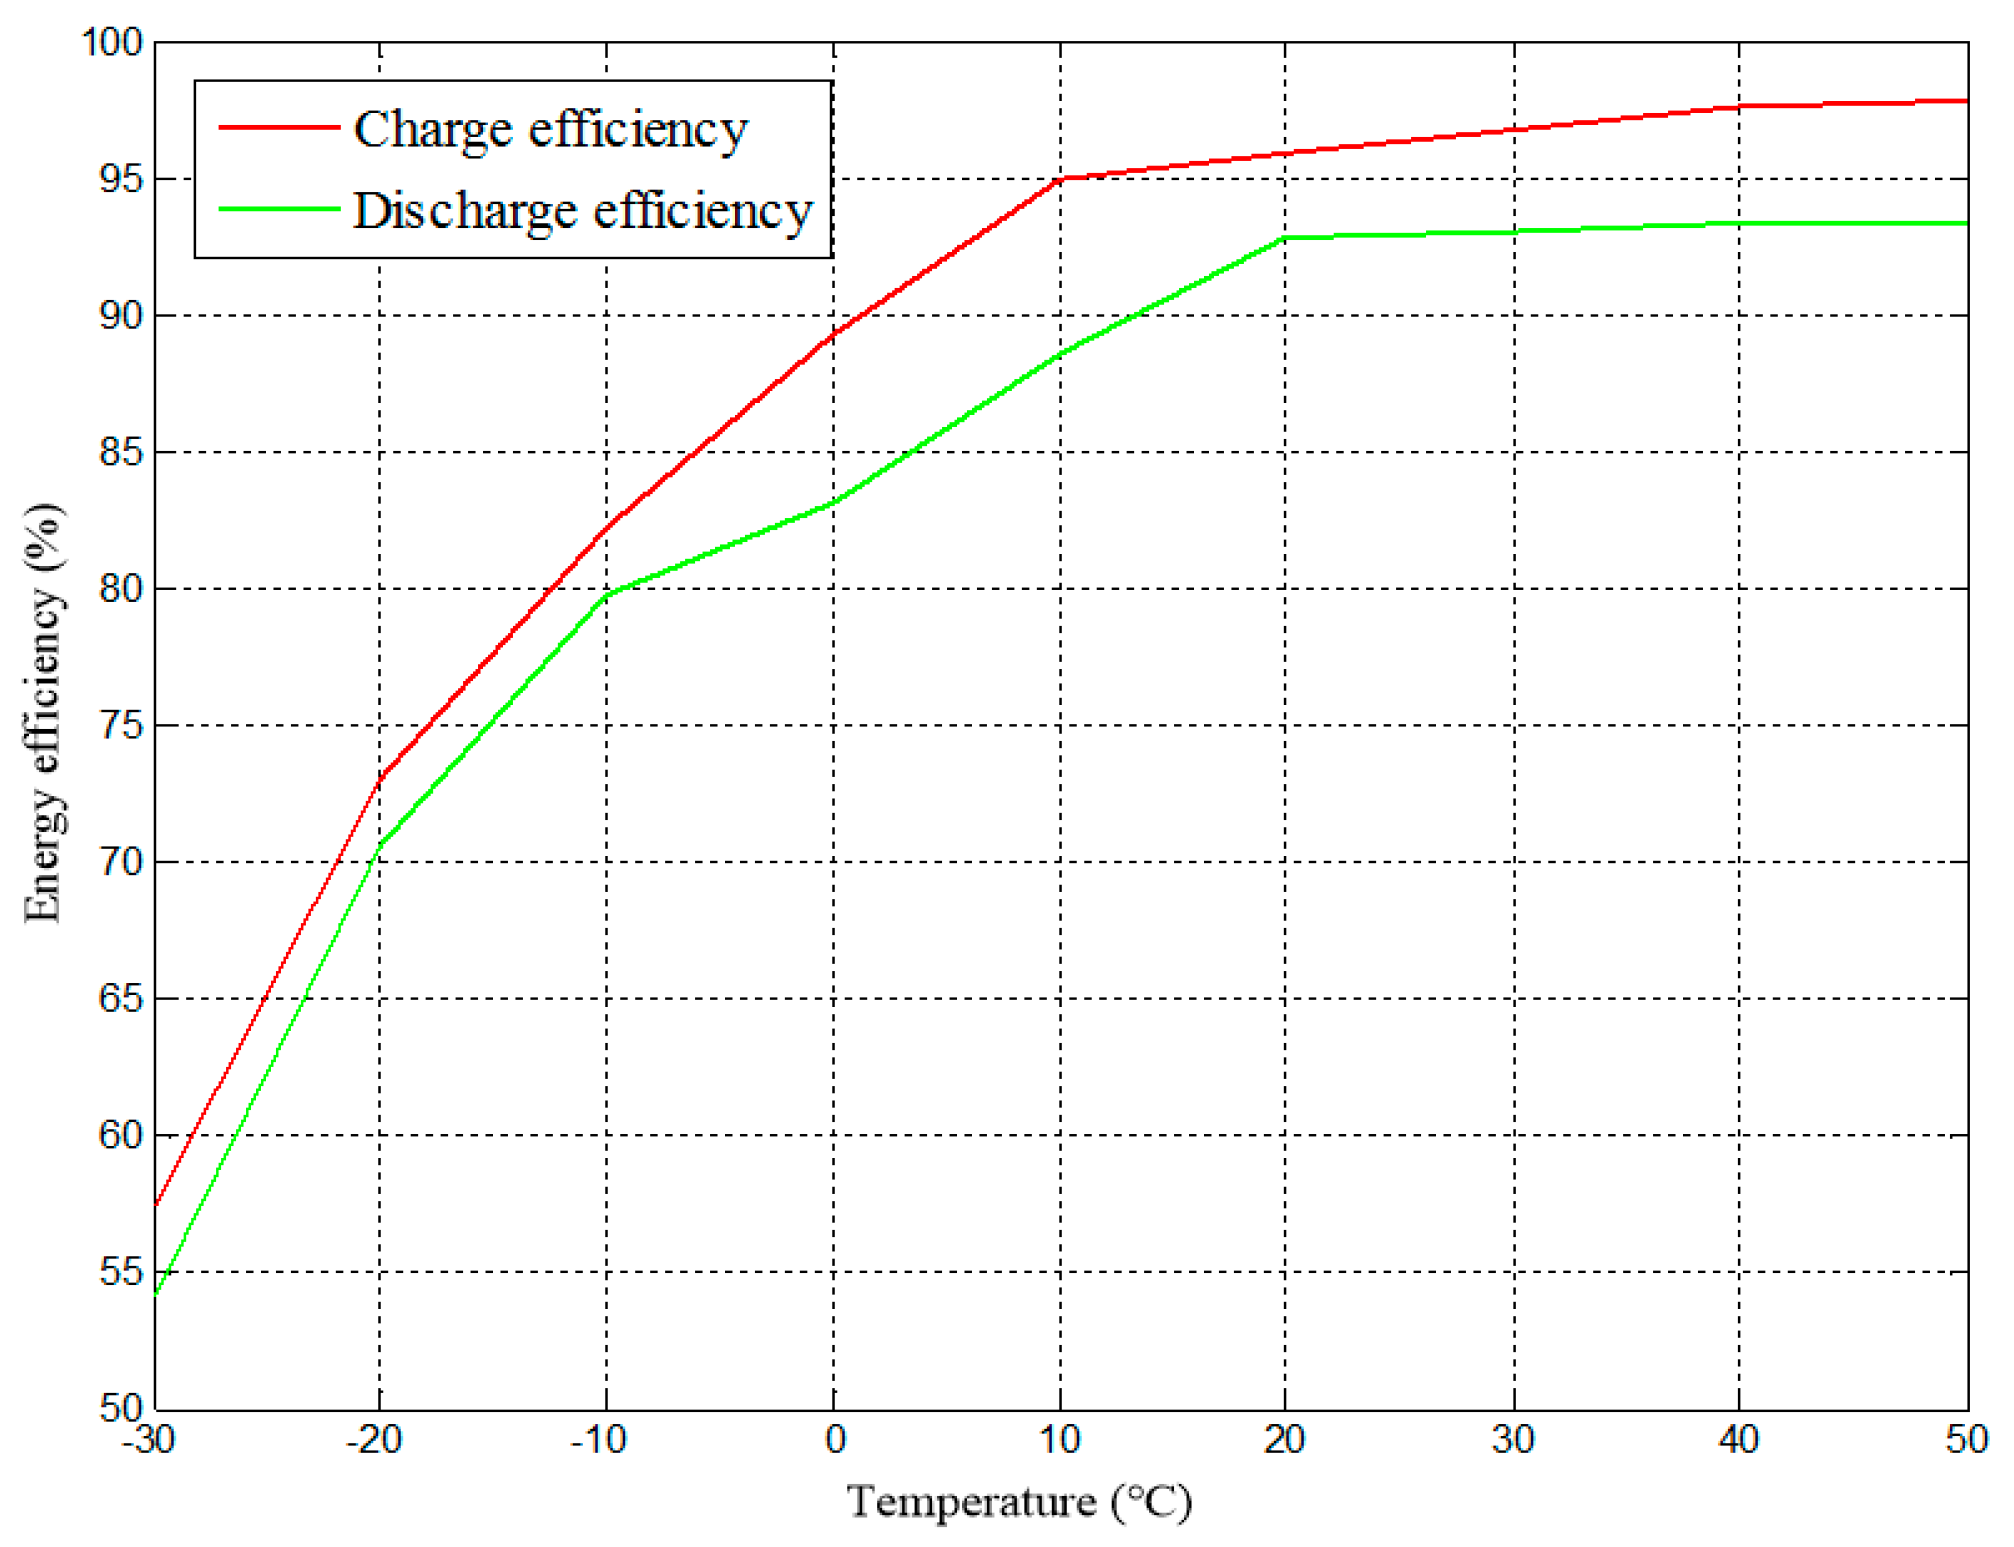
ηBattery energy efficiency
η c h a Battery charge efficiency
η d c h Battery discharge efficiency
η i Motor inverter efficiency
η m o t o r Motor efficiency
η p h Preheating system efficiency
η T Transmission efficiency
λCoefficient between F m e c and F m o t o r
ρ i Density of battery component i (kg/ m 3 )

References

  1. Doughty, D.H.; Butler, P.C.; Jungst, R.G.; Roth, E.P. Lithium battery thermal models. J. Power Sources 2002, 110, 357–363. [Google Scholar] [CrossRef]
  2. Lee, S.; Kim, J.; Lee, J.; Cho, B.H. State-of-charge and capacity estimation of lithium-ion battery using a new open-circuit voltage versus state-of-charge. J. Power Sources 2008, 185, 1367–1373. [Google Scholar] [CrossRef]
  3. Yang, J.; Cai, S. Battery Pack Thermal Management System and Method. U.S. Patent 865,829,9, 25 February 2011. [Google Scholar]
  4. Lake, B.J.; Ziehr, L.; Tagliapietra, L.C. Controller for Heating in Reversible Air Conditioning and Heat Pump HVAC System for Electric Vehicles. U.S. Patent 611,809,9, 12 Sepetember 2000. [Google Scholar]
  5. Chakib, A. Electric Vehicle Energy Management System. Ph.D. Thesis, University of Massachusetts Lowell, Lowell, MA, USA, 2001. [Google Scholar]
  6. Apfelbeck, R.; Barthel, F. Heating comfort and range perfectly combined-heating systems for vehicles with alternative drive system. Prospects and challenges of biofuel-operated water and air heaters. In Proceedings of the Society of Automotive Engineers (SAE) 2013 World Congress & Exhibition, Detroit, MI, USA, 16–18 April 2013.
  7. Lin, C.; Xu, S.; Li, Z.; Li, B.; Chang, G.; Liu, J. Thermal analysis of large-capacity LiFePO4 power batteries for electric vehicles. J. Power Sources 2015, 294, 633–642. [Google Scholar] [CrossRef]
  8. Jaguemont, J.; Boulon, L.; Dubé, Y. A comprehensive review of lithium-ion batteries used in hybrid and electric vehicles at cold temperatures. Appl. Energy 2016, 164, 99–114. [Google Scholar] [CrossRef]
  9. Xu, M.; Zhang, Z.; Wang, X.; Jia, L.; Yang, L. A pseudo three-dimensional electrochemical–thermal model of a prismatic LiFePO4 battery during discharge process. Energy 2015, 80, 303–317. [Google Scholar] [CrossRef]
  10. Kang, J.; Rizzoni, G. Study of relationship between temperature and thermal energy, operating conditions as well as environmental factors in large-scale lithium-ion batteries. Energy Res. 2014, 38, 1994–2002. [Google Scholar] [CrossRef]
  11. Agarwal, V.; Uthaichana, K.; Decarlo, R.A.; Tsoukalas, L.H. Development and validation of a battery model useful for discharging and charging power control and lifetime estimation. IEEE Trans. Energy Convers. 2010, 25, 821–835. [Google Scholar] [CrossRef]
  12. Ahmed, S.H.; Kang, X.; Shrestha, S.O.B. Effects of temperature on internal resistances of lithium-ion batteries. J. Energy Resour. Technol. 2015, 137. [Google Scholar] [CrossRef]
  13. Samadani, E.; Farhad, S.; Scott, W.; Mastali, M.; Gimenez, L.E.; Fowler, M.; Fraser, R.A. Empirical modeling of lithium-ion batteries based on electrochemical impedance spectroscopy tests. Electrochim. Acta 2015, 160, 169–177. [Google Scholar] [CrossRef]
  14. Samadani, E.; Mastali, M.; Farhad, S.; Fraser, R.A.; Fowler, M. Li-ion battery performance and degradation in electric vehicles under different usage scenarios. Int. J. Energy Res. 2016, 40, 379–392. [Google Scholar] [CrossRef]
  15. Bhattacharyya, R.; Key, B.; Chen, H.; Best, A.S.; Hollenkamp, A.F.; Grey, C.P. In situ NMR observation of the formation of metallic lithium microstructures in lithium batteries. Nat. Mater. 2010, 9, 504–510. [Google Scholar] [CrossRef]
  16. Petzl, M.; Kasper, M.; Danzer, M.A. Lithium plating in a commercial lithium-ion battery—A low-temperature aging study. J. Power Sources 2015, 275, 799–807. [Google Scholar] [CrossRef]
  17. Kwon, O.J.; Fang, W.; Wang, C. Lithium deposition in the anode of an automotive Li-ion battery: Experiments and modeling. In Proceedings of the 15th International Meeting on Lithium Batteries, Montreal, QC, Canada, 27 June–2 July 2010.
  18. Sarasketa-Zabala, E.; Gandiaga, I.; Martinez-Laserna, E.; Rodriguez-Martinez, L.M.; Villarreal, I. Calendar ageing analysis of a LiFePO4/graphite cell with dynamic model validations: Towards realistic lifetime predictions. J. Power Sources 2014, 275, 573–587. [Google Scholar] [CrossRef]
  19. Groot, J.; Swierczynski, M.; Stan, A.I.; Kær, S.K. On the complex ageing characteristics of high-power LiFePO4/graphite battery cells cycled with high charge and discharge currents. J. Power Sources 2015, 286, 475–487. [Google Scholar] [CrossRef]
  20. Waldmann, T.; Wilka, M.; Kasper, M.; Fleischhammer, M.; Wohlfahrt-Mehrens, M. Temperature dependent ageing mechanisms in lithium-ion batteries—A post-mortem study. J. Power Sources 2014, 262, 129–135. [Google Scholar] [CrossRef]
  21. Wang, J.; Liu, P.; Hicks-Garner, J.; Sherman, E.; Soukiazian, S.; Verbrugge, M.; Tataria, H.; Musser, J.; Finamore, P. Cycle-life model for graphite-LiFePO4 cells. J. Power Sources 2011, 196, 3942–3948. [Google Scholar] [CrossRef]
  22. Wang, J.; Purewal, J.; Liu, P.; Hicks-Garner, J.; Soukazian, S.; Sherman, E.; Sorenson, A.; Vu, L.; Tataria, H.; Verbrugge, M.W. Degradation of lithium ion batteries employing graphite negatives and nickel-cobalt- manganese oxide + spinel manganese oxide positives: Part 1, aging mechanisms and life estimation. J. Power Sources 2014, 269, 937–948. [Google Scholar] [CrossRef]
  23. Rao, Z.; Wang, S. A review of power battery thermal energy management. Renew. Sustain. Energy Rev. 2011, 15, 4554–4571. [Google Scholar] [CrossRef]
  24. Chen, Y.; Evans, J.W. Heat transfer phenomena in lithium/polymer-electrolyte batteries for electric vehicle application. J. Electrochem. Soc. 1993, 140, 1833–1837. [Google Scholar] [CrossRef]
  25. Ji, Y.; Wang, C. Heating strategies for Li-ion batteries operated from subzero temperatures. Electrochim. Acta 2013, 107, 664–674. [Google Scholar] [CrossRef]
  26. Zhang, J.; Ge, H.; Li, Z.; Ding, Z. Internal heating of lithium-ion batteries using alternating current based on the heat generation model in frequency domain. J. Power Sources 2015, 273, 1030–1037. [Google Scholar] [CrossRef]
  27. Pesaran, A.A.; Vlahinos, A.; Stuart, T.A. Cooling and preheating of batteries in hybrid electric vehicles. In Proceedings of the 6th ASME-JSME Thermal Engineering Joint Conference, Honolulu, HI, USA, 13–17 March 2003.
  28. Wang, Q.; Jiang, B.; Xue, Q.; Sun, H.; Li, B.; Zou, H.; Yan, Y. Experimental investigation on EV battery cooling and heating by heat Pipes. Appl. Therm. Eng. 2015, 88, 54–60. [Google Scholar] [CrossRef]
  29. Song, Z.; Hofmann, H.; Li, J.; Hou, J.; Zhang, X.; Ouyang, M. The optimization of a hybrid energy storage system at subzero temperatures: Energy management strategy design and battery heating requirement analysis. Appl. Energy 2015, 159, 576–588. [Google Scholar] [CrossRef]
  30. Bauer, S.; Suchaneck, A.; León, F.P. Thermal and energy battery management optimization in electric vehicles using Pontryagin’s maximum principle. J. Power Sources 2014, 246, 808–818. [Google Scholar] [CrossRef]
  31. Rao, R.; Virudhula, S.; Rakhmatov, D. Battery models for energy aware system design. Computer 2003, 36, 77–87. [Google Scholar]
  32. Zhe, L.; Han, X.; Lu, L.; Ouyang, M. Temperature characteristics of power LiFePO4 batteries. J. Mech. Eng. 2011, 47, 115–120. [Google Scholar]
  33. Gao, H.; Lv, F.; Wei, X.; Dai, H. Research of Li-ion battery’s energy efficiency. Chin. J. Power Sources 2013, 12, 2132–2134. [Google Scholar]
  34. Bernardi, D.; Pawlikowski, E.; Newman, J. A general energy balance for battery systems. J. Electrochem. Soc. 1985, 132, 5–12. [Google Scholar] [CrossRef]
  35. Damay, N.; Forgez, C.; Bichat, M.P.; Friedrich, G. Thermal modeling of large prismatic LiFePO4/graphite battery. Coupled thermal and heat generation models for characterization and simulation. J. Power Sources 2015, 283, 37–45. [Google Scholar] [CrossRef]
  36. Johnson, V.H. Battery performance models in ADVISOR. J. Power Sources 2002, 110, 321–329. [Google Scholar] [CrossRef]
  37. Bandhauer, T.M.; Garimella, S.; Fuller, T. A critical review of thermal issues in lithium-ion batteries. J. Electrochem. Soc. 2011, 158, 1–25. [Google Scholar] [CrossRef]
  38. Zhang, J.; Huang, J.; Li, Z.; Wu, B.; Nie, Z.; Sun, Y.; An, F.; Wu, N. Comparison and validation of methods for estimating heat generation rate of large-format lithium-ion batteries. J. Therm. Anal. Calorim. 2014, 117, 447–461. [Google Scholar] [CrossRef]
  39. Steffke, K.W.; Spigno, C.; Bezzina, C. Li-ion air-cooled battery system interactions with the vehicle HVAC system. In Proceedings of the SAE 2013 World Congress & Exhibition, Detroit, MI, USA, 16–18 April 2013.
  40. Pesaran, A.; Keyser, M.; Burch, S. An approach for designing thermal management systems for electric and hybrid vehicle battery packs. In Proceedings of the 1999 Vehicle Thermal Management Systems Conference, London, UK, 24–27 May 1999.
  41. Hallaj, S.A.; Maleki, H.; Hong, J.S.; Selman, J.R. Thermal modeling and design considerations of lithium-ion batteries. J. Power Sources 1999, 83, 1–8. [Google Scholar] [CrossRef]
  42. Jaguemont, J.; Boulon, L.; Venet, P.; Dube, Y. Lithium-ion battery aging experiments at subzero temperatures and model development for capacity fade estimation. IEEE Trans. Vehar. Technol. 2016, 65, 4328–4343. [Google Scholar] [CrossRef]
  43. Ehsani, M.; Gao, Y.; Emadi, A. Modern Electric, Hybrid Electric, and Fuel Cell Vehicles Fundamentals, Theory, and Design, 2nd ed.; CRC Press: Boca Raton, FL, USA, 2010; pp. 89–362. [Google Scholar]
  44. Deb, K.; Pratap, A.; Agarwal, S.; Meyarivan, T. A fast and elitist multi-objective genetic algorithm: NSGA-II. IEEE Trans. Evol. Comput. 2002, 6, 182–197. [Google Scholar] [CrossRef]
  45. Qin, Z.; Wang, J.; Li, J. Study on the special thermal management system of extended-range EV. Auto Electr. Parts 2013, 12, 5–8. [Google Scholar]
  46. Yokoyama, A.; Osaka, T.; Imanishi, Y.; Sekiya, S. Thermal management system for electric vehicles. SAE Int. J. Mater. Manuf. 2011, 4, 1277–1285. [Google Scholar] [CrossRef]
  47. Zheng, Y.; Ouyang, M.; Lu, L.; Li, J. Understanding aging mechanisms in lithium-ion battery packs: From cell capacity loss to pack capacity evolution. J. Power Sources 2015, 278, 287–295. [Google Scholar] [CrossRef]
Figure 1. Equivalent circuit of battery Rint model.
Energies 10 00243 g001
Figure 2. Cell SOC-OCV curve. SOC: state-of-charge. OCV: open circuit voltage.
Energies 10 00243 g002
Figure 3. Cell equivalent resistance as a function of SOC and temperature.
Energies 10 00243 g003
Figure 4. Discharge and charge efficiency as a function of temperature.
Energies 10 00243 g004
Figure 5. Entropy coefficient as a function of SOC.
Energies 10 00243 g005
Figure 6. Experiments results of battery capacity loss ratio along with simulation results given by the degradation model at (a) 1C current rate and (b) 2C current rate.
Energies 10 00243 g006
Figure 7. Coupled battery model.
Energies 10 00243 g007
Figure 8. Components of vehicle operation cost.
Energies 10 00243 g008
Figure 9. Driving cycle of a city bus in Changchun.
Energies 10 00243 g009
Figure 10. When ambient temperature T 0 is −10 °C, driving range L is 20 km, SOC range of charging is 20%~80%, and vehicle is preheated to different temperatures, after vehicle operation, corresponding (a) electricity consumption, (b) battery fade ratio and (c) vehicle operation cost.
Energies 10 00243 g010
Figure 11. Optimal preheating target temperatures at different ambient temperatures and driving ranges.
Energies 10 00243 g011
Figure 12. Cell with circulating liquid inside.
Energies 10 00243 g012
Figure 13. Structure of the preheating system.
Energies 10 00243 g013
Figure 14. Electric bus and actual layout of the heating pipes in the battery box.
Energies 10 00243 g014
Figure 15. Experimental setup for measuring heat transfer coefficient h .
Energies 10 00243 g015
Figure 16. The control strategy for coordinating the processes of preheating and charging.
Energies 10 00243 g016
Figure 17. Charging plug (left) and heating plug (right).
Energies 10 00243 g017
Figure 18. Data collection in vehicle tests.
Energies 10 00243 g018
Figure 19. Battery temperature curve during Test 2.
Energies 10 00243 g019
Table 1. Basic parameters of the cell.
ParametersValue or Specification
Nominal voltage3.2 V
Cathode materialLiFePO4
Anode materialGraphite
Nominal capacity180 Ah, 576 Wh
Size282 mm × 182 mm × 71 mm
Mass5.8 kg
Charge cut-off voltage3.8 V
Discharge cut-off voltage2.8 V
Operating temperature−30~60 ℃
Specific heat capacity854 J/(kg·K)
Table 2. Basic parameters of the electric bus.
ParametersValue
Vehicle mass, m v e h 13,946 kg
Vehicle size11983 mm × 2250 mm × 3720 mm
Final drive ratio, i o 3.7
Gearbox ratio, i g 3.757/1.969
Wheel radius, r 0.506 m
Gravity acceleration, g 9.8 m · s 2
Rolling resistance coefficient, f 0.013
Air drag coefficient, C D 0.7
Front area, A v e h 9.5 m 2
Motor efficiency, η m o t o r 85%
Transmission efficiency, η T 88%
Motor inverter efficiency η i 90%
Table 3. Vehicle test results.
Test ItemsTest 1
Battery without Heating
(Test/Simulation)
Test 2
Battery Heated to 2 °C
(Test/Simulation)
Initial SOC20%/20%20%/20%
SOC after charging100%/100%100%/100%
SOC after driving72.07%/74.75%73.71%/75.75%
Energy consumption of preheating ( Q p h )0/014.38/13.29 kWh
Energy loss of charging ( Q c h a )12.67/12.55 kWh5.31/5.24 kWh
Energy consumption of driving cycles ( Q c y c )28.96/26.18 kWh27.26/25.14 kWh
Battery fade ratio ( C l o s s % )0.023%/0.022%0.015%/0.014%
Vehicle operation cost ( C s u m ) 143.49/141.00 $93.78/88.74 $

