3. Results and Discussions
By applying the methodology described in
Section 2, we aim to emphasize, on the one hand, the way the 30 states have migrated from one group to another in terms of the values of the four indicators (total environmental taxes as a percentage of GDP, energy taxes as a percentage of GDP, transport taxes as a percentage of GDP, pollution taxes as a percentage of GDP) and, on the other hand, the way the mean values recorded at groups of states level in 2012 by comparison with 2002 have evolved.
The application of the methodology has imposed the classifications of EU-28 Member States, as well as Iceland and Norway in clusters on the basis of the described research criteria. Thus, based on the shares of the environmental, energy, transport and pollution taxes in GDP [
22],
Figure 1 presents the dendrogram for 2002 obtained using Euclidian distance (3) and Ward’s method. This suggests solutions with a number of 3 to 10 clusters (or even more).
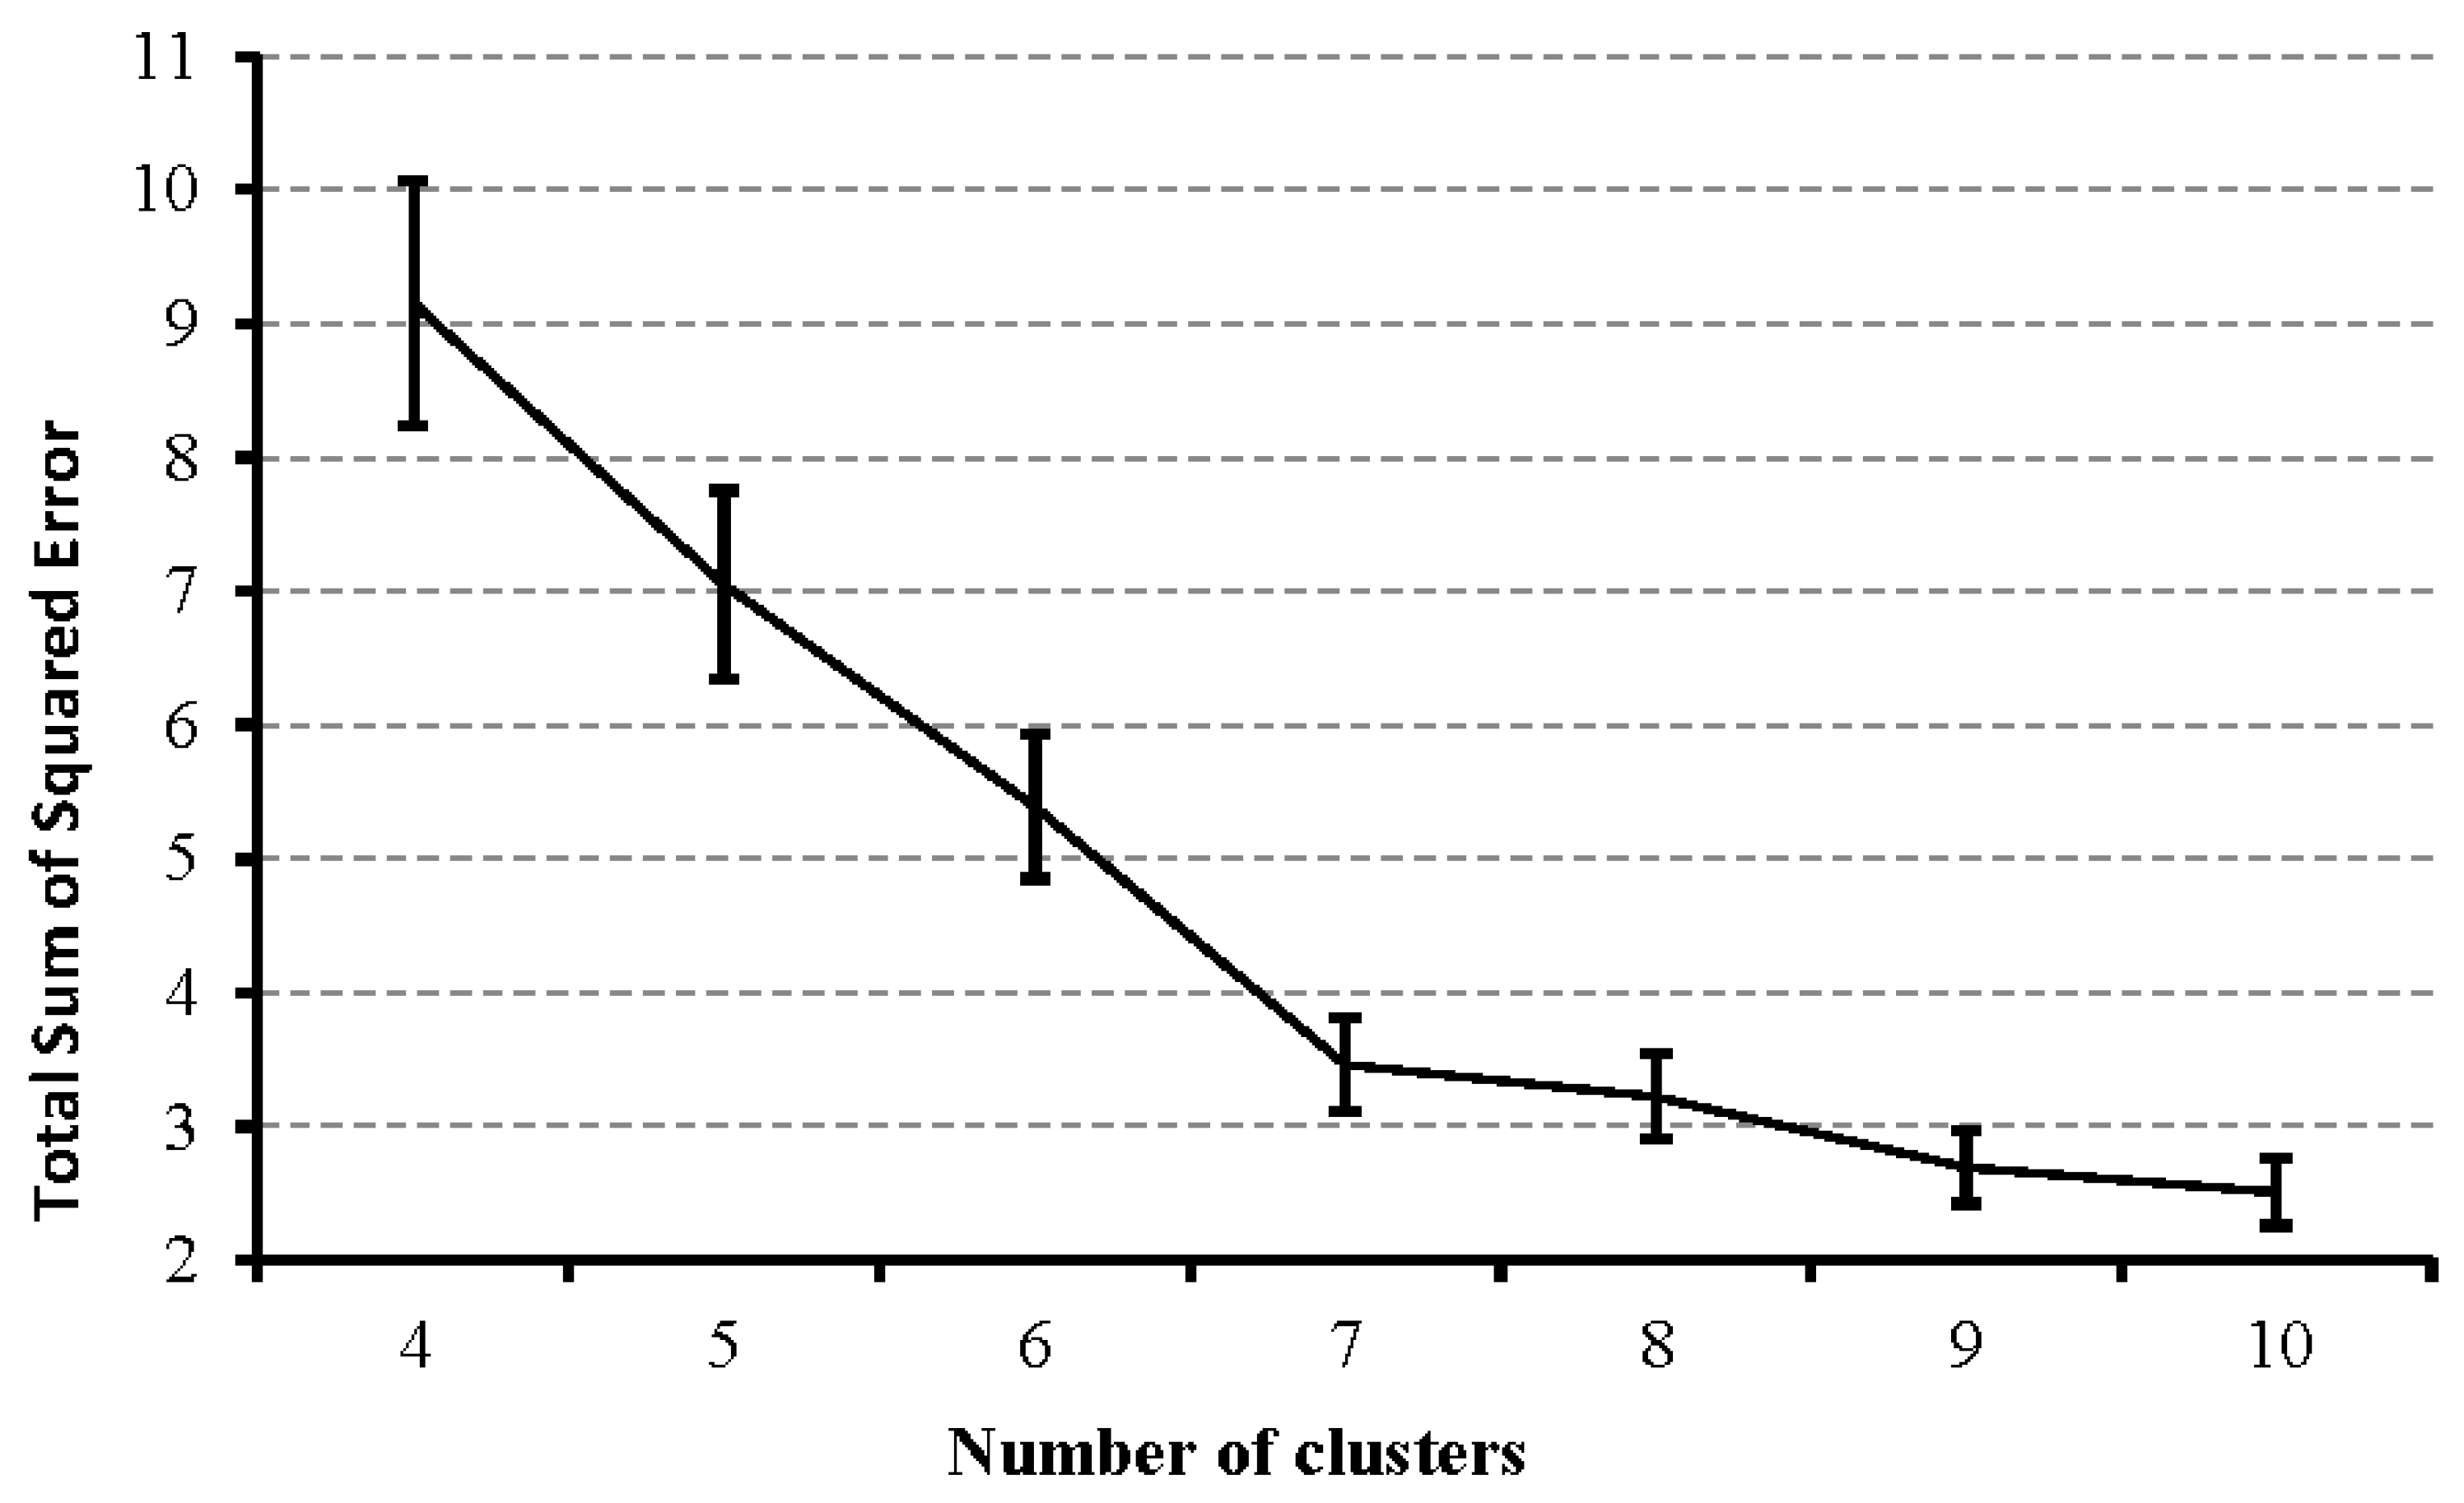
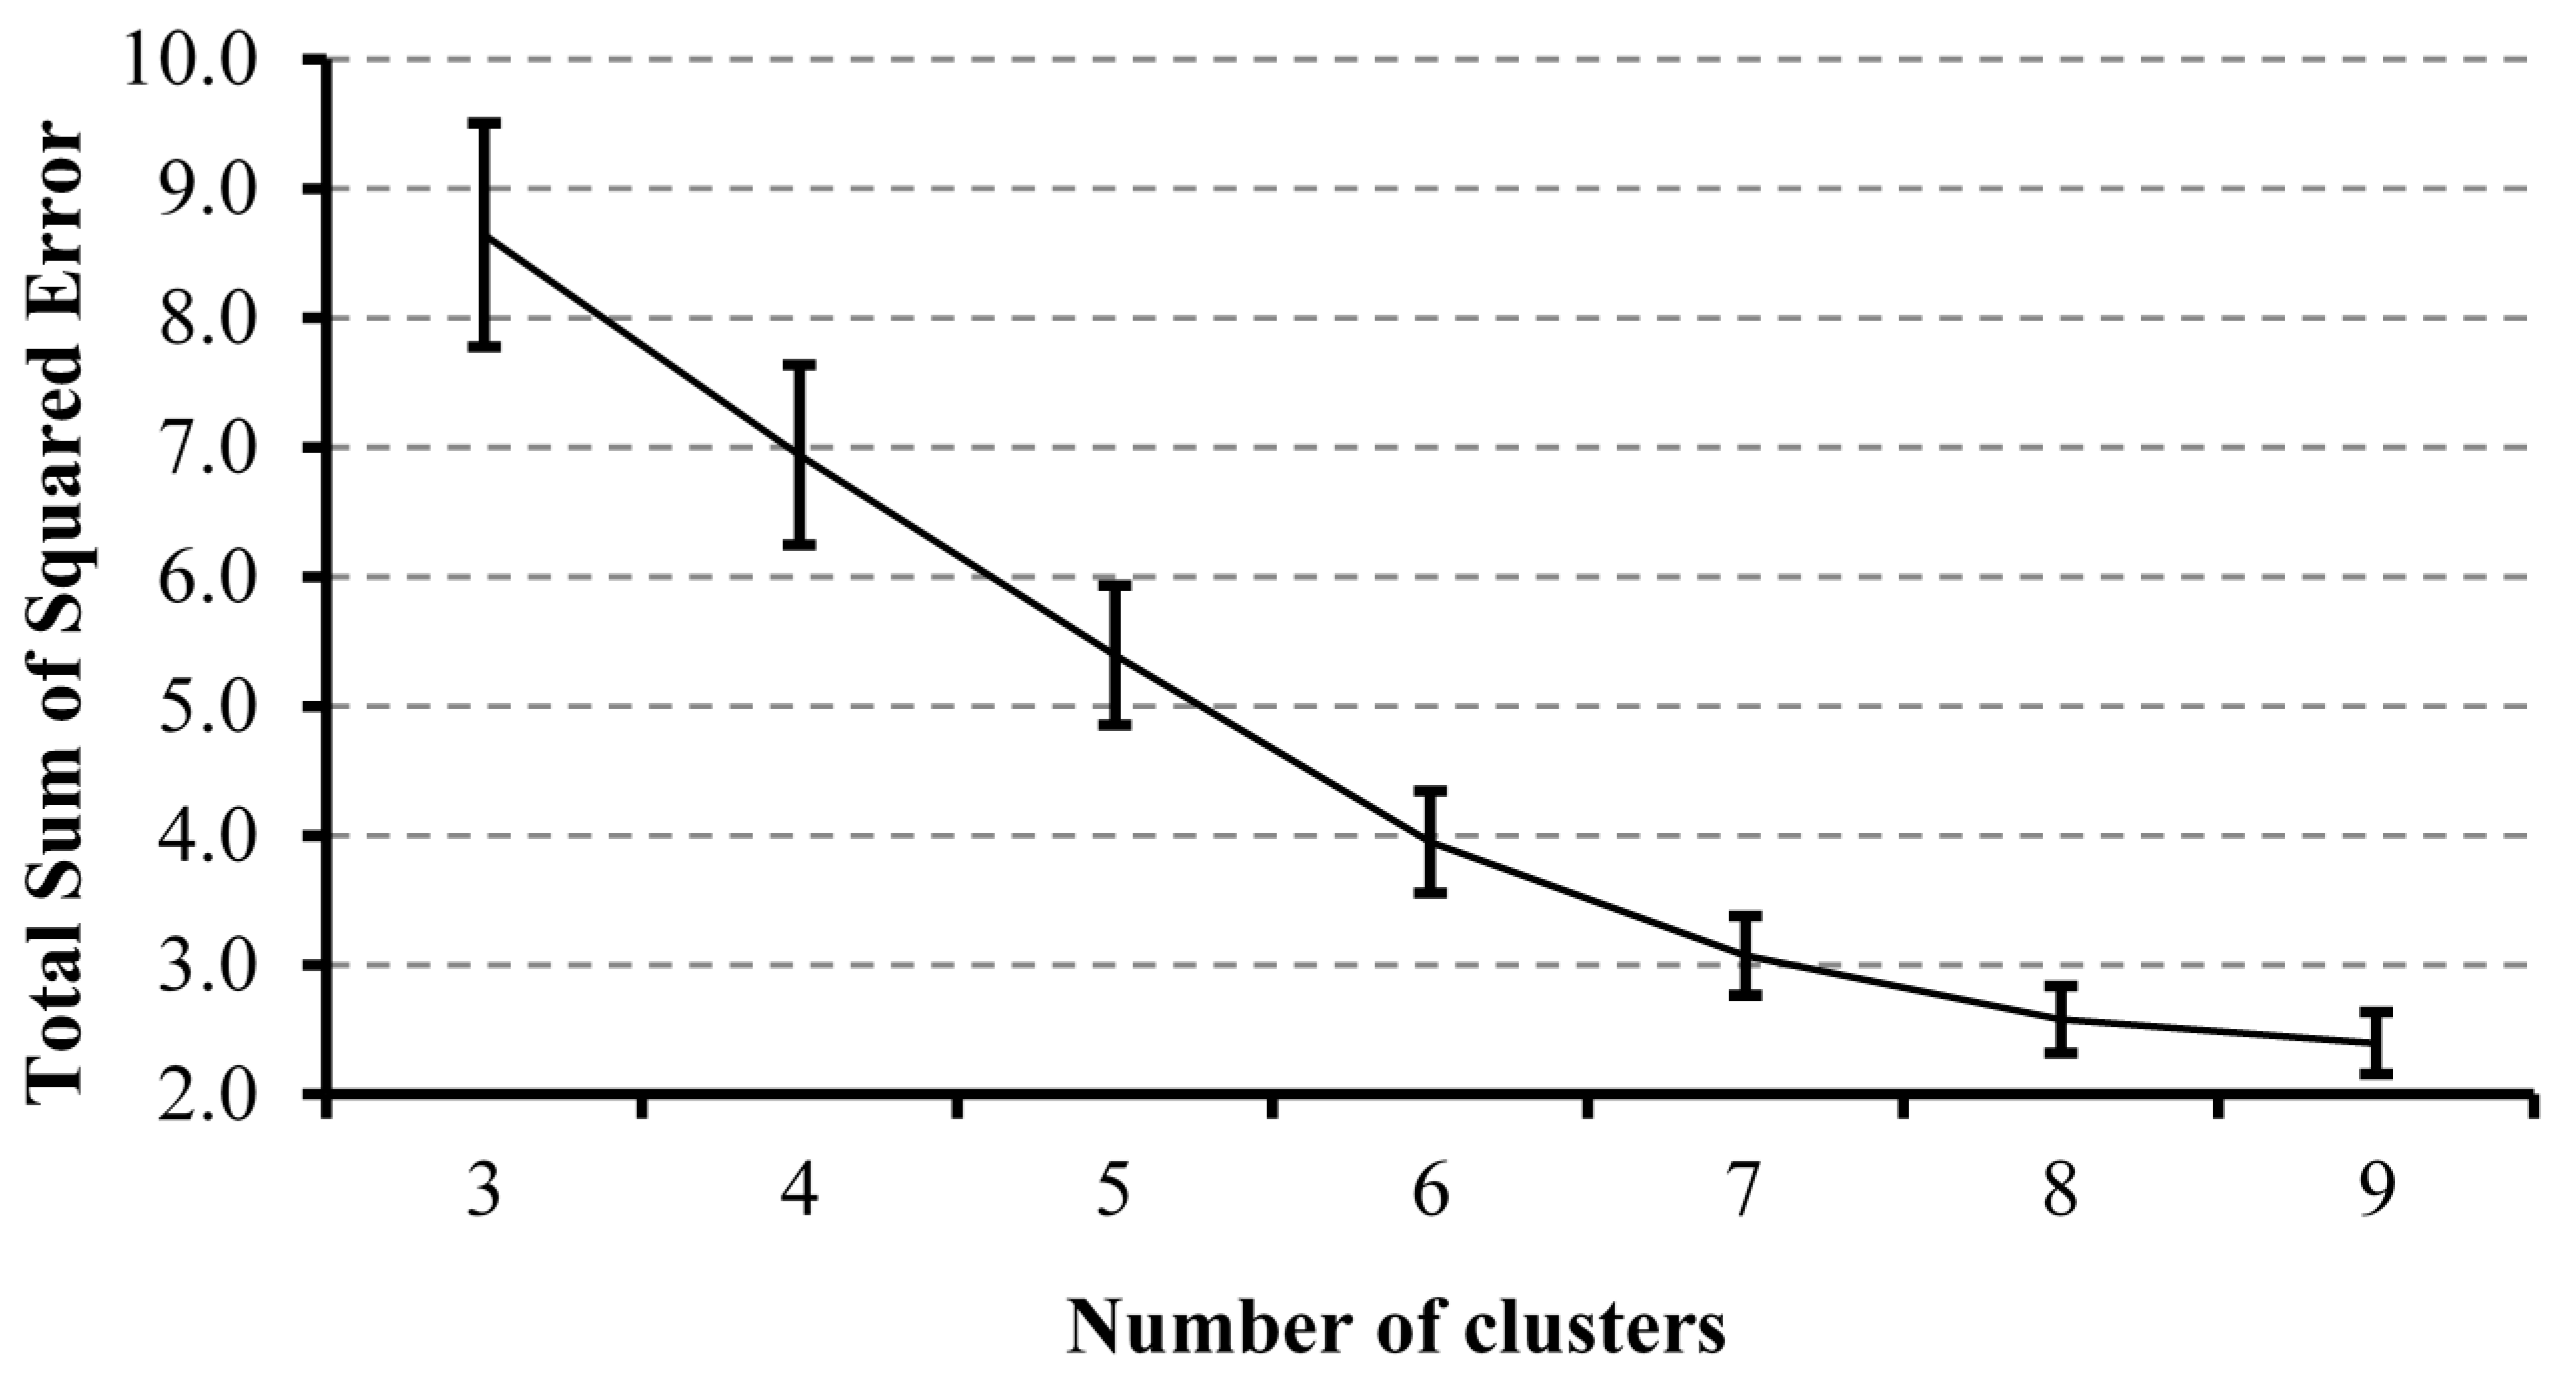
Considering the evolutions of values of TSSE based on the number of clusters, presented in
Figure 2, an optimal solution can be the one with seven clusters. Of the seven clusters (
Table 2), clusters C4 and C5 contain eight states, cluster C3 includes five states, clusters C1 and C6 have three states, cluster C2 contains two states and cluster C7 includes one state (Denmark). The cluster C7 presents certain particularities at this level of confidence that separate it from the rest of the clusters.
A first step of testing the statistical validity of the chosen solution is testing the hypothesis (H0_2) regarding the inexistence of some significant differences between the variances of data series for the six clusters that contain more than one element.
The results of the Test for Homogeneity of Variance are presented in
Table 3. As it can be observed, all Levene Statistic values are lower than the critical value F
0.05,5,23 = 2.64. This observation leads to accepting the null hypothesis (H
0_2): there is no significant difference between the variances values of the data series corresponding to the clusters.
Considering that the condition (H
0_2) regarding the application of the ANOVA methodology is satisfied, this was used to verify the statistical significance of those four analysed variables’ belonging to the clusters. The results are presented in
Table 4. The values of F statistics (12) are higher than the critical value F
0.05,6,23 = 2.53. As a consequence, the null hypothesis (H
0_3) is rejected for all four variables, while the alternative hypothesis is accepted (H
1_3): the analysed variables are statistically significant considering the belonging to clusters.
The values of the means for the analysed variables and their 95% Confidence Interval for Mean are presented in
Table 5. The parameters LB and UB are Lower Bound and Upper Bound of 95% Confidence Interval for Mean.
The detailed analysis of the results presented in
Table 5 was achieved for the year 2002 and treats all the countries composing the clusters for which the evolution levels of the four variables are studied and compared: ENV_GDP, ENG_GDP, TRS_GDP, POL_GDP.
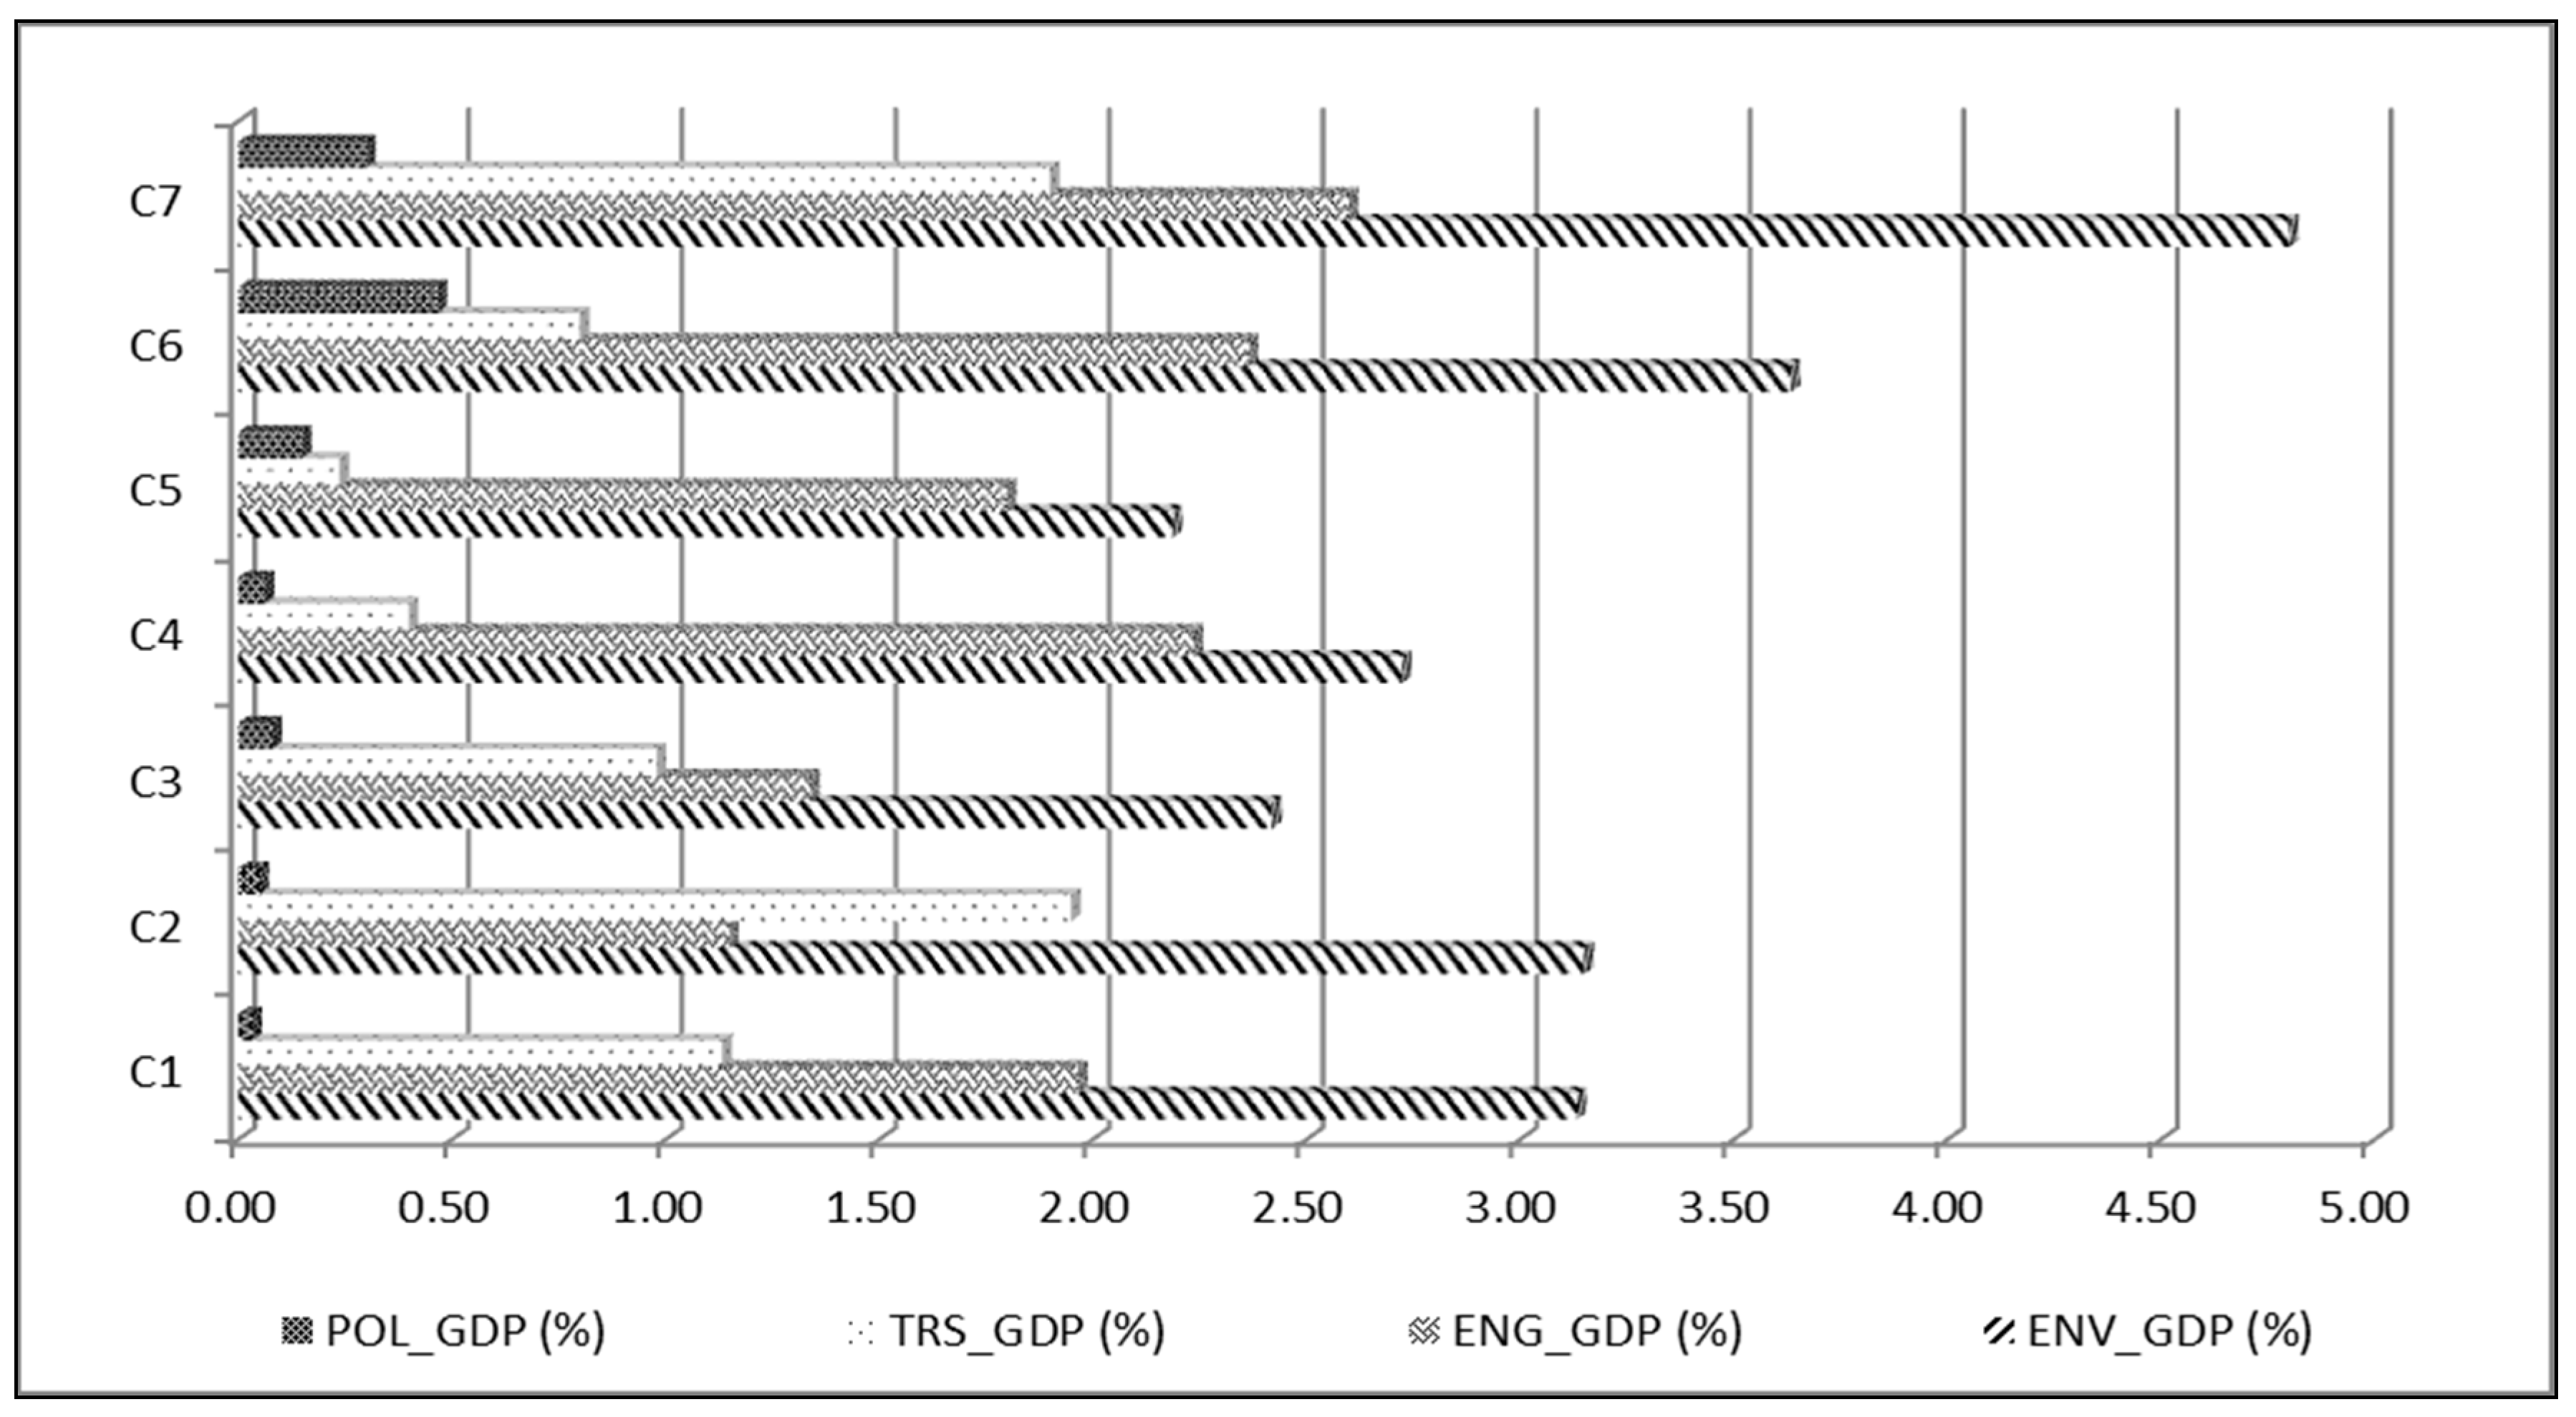
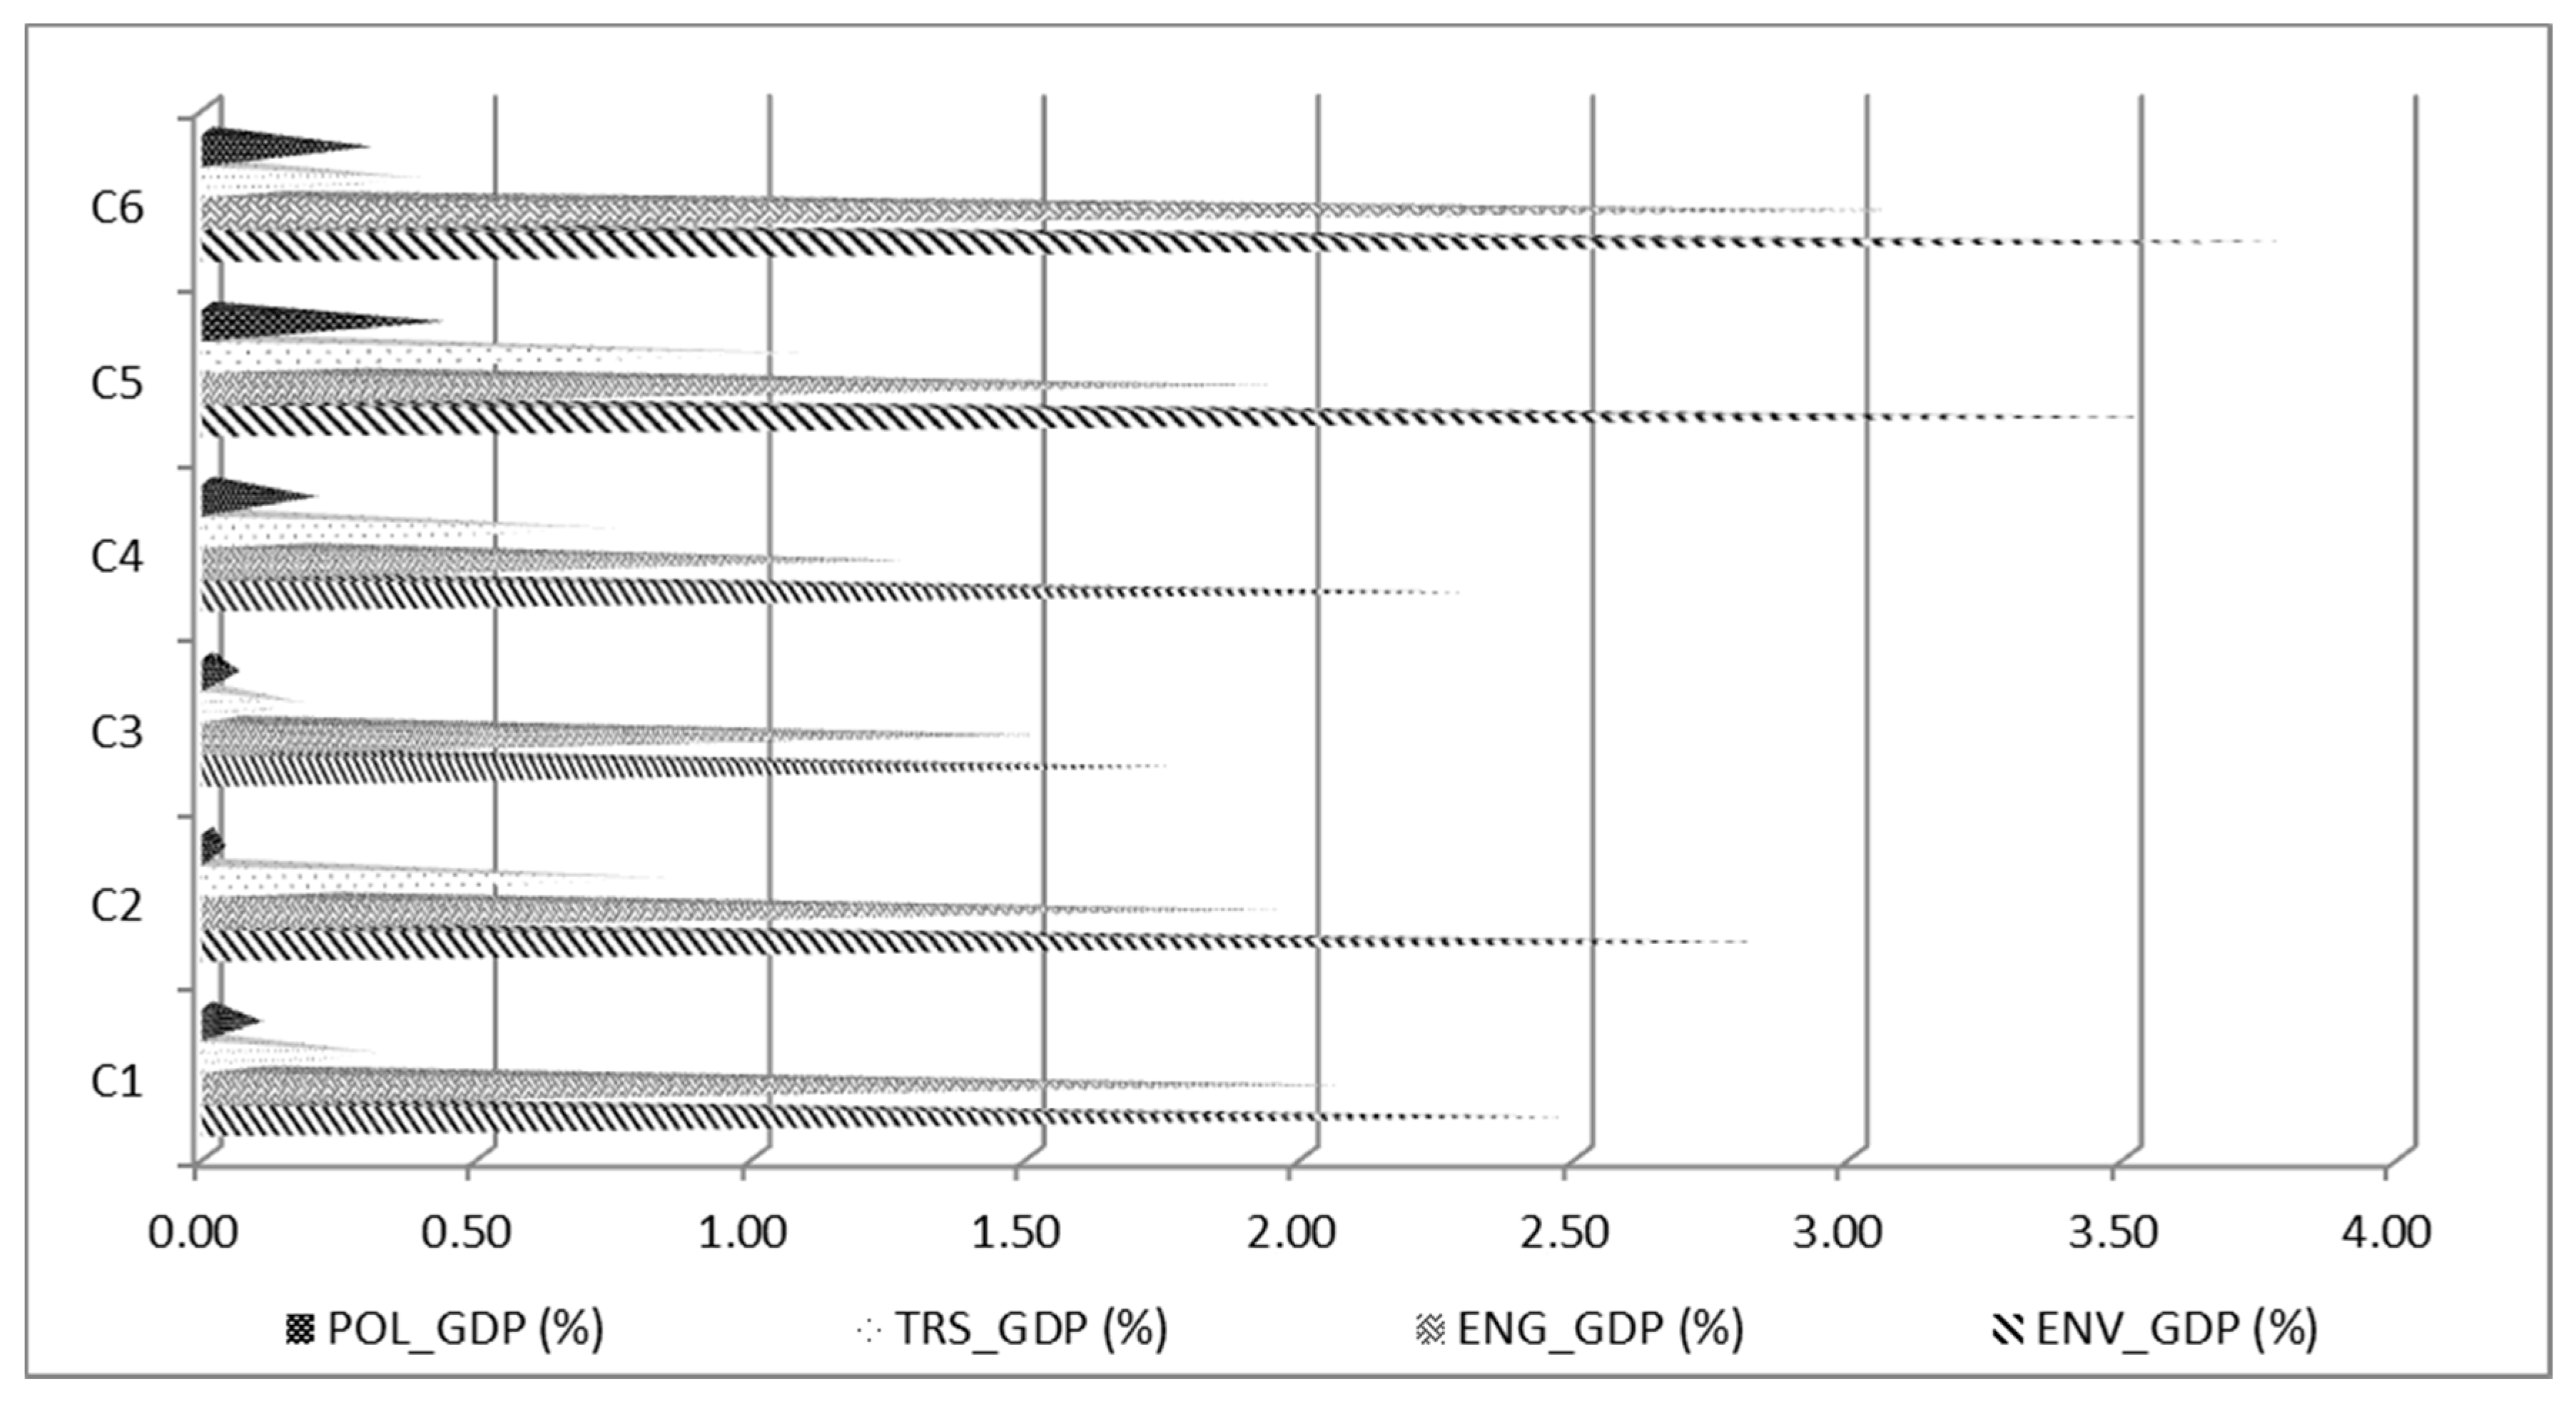
Considering the means of the variables ENV_GDP, ENG_GDP, TRS_GDP and POL_GDP, a graphic representation (
Figure 3) was made for a clearer emphasizing of their evolution on clusters.
During the analysed period, all the EU-28 member states experienced, to a greater or lesser extent, the challenges generated by the economic crisis, domestic economic instability and increased dependence on energy imports to which was added a serious slowdown in economic growth. The evolution of the energy taxation is the result of both domestic and EU-28 economic paradigm changes. This paradigm change has contributed to “green” the economy and to support the economic recovery. Cluster 1 (C12002), in 2002, comprises three countries: Portugal, Finland and Norway. Thus, for that year, the mean percentage value of 3.13% per country of ENV_GDP for this cluster is the highest compared to the other three variables (ENG_GDP, TRS_GDP, POL_GDP). The percentage value is between a minimum of 3.00% for Portugal and a maximum of 3.3% in Norway, while Finland has a value of 3.1%. In this case, the confidence probability of the results is 95% for a confidence interval that is between 2.75% and 3.51%.
There is a reversing of the hierarchy between Portugal and Norway regarding variable ENG_GDP. The minimum percentage is 1.80% in Norway and the maximum is 3.10% for Portugal. The mean percentage value of ENG_GDP is registered in 2002, for cluster 1, at 1.97% per country.
The hierarchy of the three countries is identical for the last two variables (TRS_GDP, POL_GDP). Portugal and Finland have minimum percentage values (1.0% at TRS_GDP and 0.00 at POL_GDP, indicating their inexistence), while Norway has a maximum percentage value of 1.4% for TRS_GDP and for POL_GDP the maximum percentage value is 0.1%. The mean percentages for cluster 1, in 2002, for these two variables are 1.13% per country for TRS_GDP and 0.03% per country for POL_GDP.
The application of the Hierarchical Clustering methodology shows us that the states could be grouped as components of traditional economic models. Both the energy fiscal policy and the environmental policy could be considered tools that can be used to design a convergence model for the EU-28 Member States. The efficiency of the energy taxation policy has represented, in 2002, a major discussion topic imposed by the necessity of increasing of the energy security and, also, by the necessity of decreasing of the supplementary costs associated to energy consumption. The energy taxation system has dramatically modelled the future economic development of the EU, by influencing the economic competitiveness.
In 2002, cluster 2 (C22002) includes two countries: Cyprus and Malta. For these two countries, the mean percentage values of the four analysed variables are quite similar to the ones presented in cluster 1. Thus, compared to the first cluster, the mean percentage is higher with 0.02 percentage points per country for ENV_GDP and POL_GDP and with 0.82 percentage points per country for TRS_GDP. The same difference of 0.82 percentage points was established between the mean percentage value for variable ENG_GDP from the first cluster (1.97% per country) and the mean percentage value from the second cluster (1.15% per country), however, the trend is opposite, as the value is decreasing.
The hierarchy of the five countries (Belgium, Ireland, Greece, Austria, Iceland) included in cluster 3 (C3
2002), for the year 2002, compared to the extreme percentage values, modifies from a variable to another, such as:
- -
ENV_GDP is the most significant with 2.7% in Austria (first place), followed by 2.4% for Ireland and Belgium (second place) and 2.3% Greece and Iceland (third place), the mean percentage value being 2.42% per country;
- -
ENG_GDP has a mean percentage value ranging in a 95% confidence interval with parameters LB and UP of 0.98% and 1.7% per country; Austria remains on the first place with 1.7%, followed on the second place by Belgium and Greece with 1.4% and on the third place by Ireland with 1.3%, Iceland being on the last place with 0.9%;
- -
TRS_GDP has a mean percentage value of 0.98% per country placed between the minimum percentage value of 0.8% for Belgium, followed by Greece and Austria with 0.9%, then by Ireland with 1.1% and the maximum percentage value of 1.2% belonging to Iceland; The 95% confidence interval for mean for this analysed variable is between 0.78% and 1.18%.
- -
POL_GDP does not exist for Ireland, Greece and Austria; if Belgium and Iceland have a percentage value of 0.2%, the mean percentage value for these five countries that are included in the third cluster is 0.08% per country.
For cluster 4 (C42002) and cluster 5 (C52002), composed of eight countries, for the mean percentages of all four analysed variables, the null hypothesis is rejected and the alternative hypothesis is accepted, according to which the means of the variables ENV_GDP, ENG_GDP, TRS_GDP, POL_GDP are significant in terms of the belonging to the cluster.
The mean percentage values of the analysed variables, established for cluster 4 composed of the Czech Republic, Germany, Italy, Lithuania, Luxembourg, Hungary, Sweden, United Kingdom and for cluster 5 that includes Bulgaria, Estonia, Spain, France, Latvia, Poland, Romania, Slovakia are comparable, having quite similar percentage values.
The highest mean percentage values belong to cluster 4 compared to cluster 5, regarding the first three variables included in the analysis (ENV_GDP, ENG_GDP, TRS_GDP). The most significant difference of 0.54 percentage points is established for ENV_GDP. The mean percentages for ENV_GDP belong to a 95% confidence interval for mean established between 2.57% and 2.88% per country for cluster 4, respectively between 2.07% and 2.30% per country for cluster 5. The extreme percentage values can be observed at cluster 4 for the Czech Republic (2.40%) and Sweden (2.90%) and at cluster 5 for Estonia (2.00%) and Poland (2.40%).
A high level of the energy taxation, as a component of the general tax policy, is noted in the cluster of countries where the energy consumption is quite high and the state uses taxation as a Pigouvian instrument. Taking into consideration that the energy taxation tends to be higher in countries that promote green technologies and investments, the fiscal weight ratio on energy consumption affects the economic competitiveness and forces the investors to move their production capacities in countries with a more competitive cost structure.
Regarding the analysis of the evolution of variable ENG_GDP from the two clusters, the mean percentages belong to a 95% confidence interval for mean for cluster 4 ranging between 2.08% and 2.40% per country, respectively for cluster 5 ranging between 1.64% and 1.96% per country. The results and context emphasize establishing of a mean percentage value lower with 0.44 percentage points for cluster 5 compared to cluster 4. The percentages established for variable ENG_GDP range between the minimum of 2.00% (Lithuania) and maximum of 2.60% (Luxembourg) for cluster 4 and between 1.50% (Estonia) and 2.10% (Bulgaria) for cluster 5.
The variable TRS_GDP records a mean percentage of 0.40% per country for cluster 4 which is slightly higher than that of cluster 5 (with only 0.16 percentage points). Minor differences are also emphasized between the extreme maximum established limits: minimum of 0.10% for Luxembourg which corresponds to both clusters and maximum of 0.70% for Lithuania (cluster 4) and 0.40% for Latvia (cluster 5). For cluster 4, the mean percentage value ranges between 0.23% and 0.57% per country and for cluster 5 between 0.15% and 0.33% per country, at 95% confidence.
For the variable POL_GDP, the mean percentage value for cluster 4 is lower with 0.09 percentage points compared to the mean percentage value for cluster 5. The 95% confidence interval for cluster 4 is between 0.00% and 0.12% and for cluster 5 is between 0.06% and 0.24%.
Like the first cluster, cluster 6 (C62002) included only three states in 2002: Croatia, Netherlands and Slovenia. Compared to the first cluster, in this cluster a similar trend of the countries regarding the four variables included in the analysis was established.
The context emphasizes the highest mean percentage value for variable ENV_GDP (of 3.63% per country) compared to the other three variables (ENG_GDP, TRS_GDP, POL_GDP), as in the first cluster. This mean percentage value is included in a 95% confidence interval for mean of 2.60% per country and 4.67% per country. At the same time, there is a hierarchy of the countries related to the percentage values of the variable ENV_GDP in 2002, as follows: Croatia with 4.1%, Netherlands with 3.5% and Slovenia with 3.3%.
Regarding the variable ENG_GDP, it can be observed that Netherlands and Slovenia interchange their places. The oscillation of this variable leads to Slovenia occupying the second place with 2.6% and the Netherlands occupying the third place, with 1.80%. In 2002, for cluster 6, in a 95% confidence interval for mean of 1.14% per country and 3.59% per country, the mean percentage value for ENG_GDP is 2.37% per country.
In the year 2002, The Netherlands has the highest percentage value for variable TRS_GDP (1.20%), followed by Croatia with 0.80% and Slovenia with the lowest percentage value of 0.40%. The mean percentage value of TRS_GDP is 0.80 per country for cluster 6, in the analysed year.
Regarding the variable POL_GDP, the maximum of 0.60% corresponds to Croatia and the minimum of 0.30% to Slovenia. For cluster 6, the mean percentage in 2002, for this variable, is 0.47% per country, in a 95% confidence interval for mean of 0.09% per country and 0.85% per country.
Cluster 7 (C72002) is represented by only one country: Denmark. The characterization variables of the energy evolution for Denmark are as follows: 4.80% ENV_GDP, 2.6% ENG_GDP, 1.90% TRS_GDP and 0.30% POL_GDP.
The period 2002–2012 was marked by a series of economic and social events that trigger an environmental tax reform. This reform was manifested on two levels:
- -
the unilateral plan that mainly generated negative effects [
34];
- -
the collaboration plan between states.
In 2014, revenues from environmental taxation were 343.6 billion euros, which is 2.5% of GDP and about 6.3% of the total taxes and social contributions.
In the period 2002-2014 environmental tax revenues in the EU increased by approximately 2.2% per year, while GDP grew at an annual average of 2.5%. Compared to 2002, average income in 2014 increased by approximately 79 billion. The effect of the crisis from 2008 caused a reduction in economic activity in the EU, which led to a decrease in tax income in 2008 and 2009. From 2010, there was ascending trend for environmental tax revenues [
28].
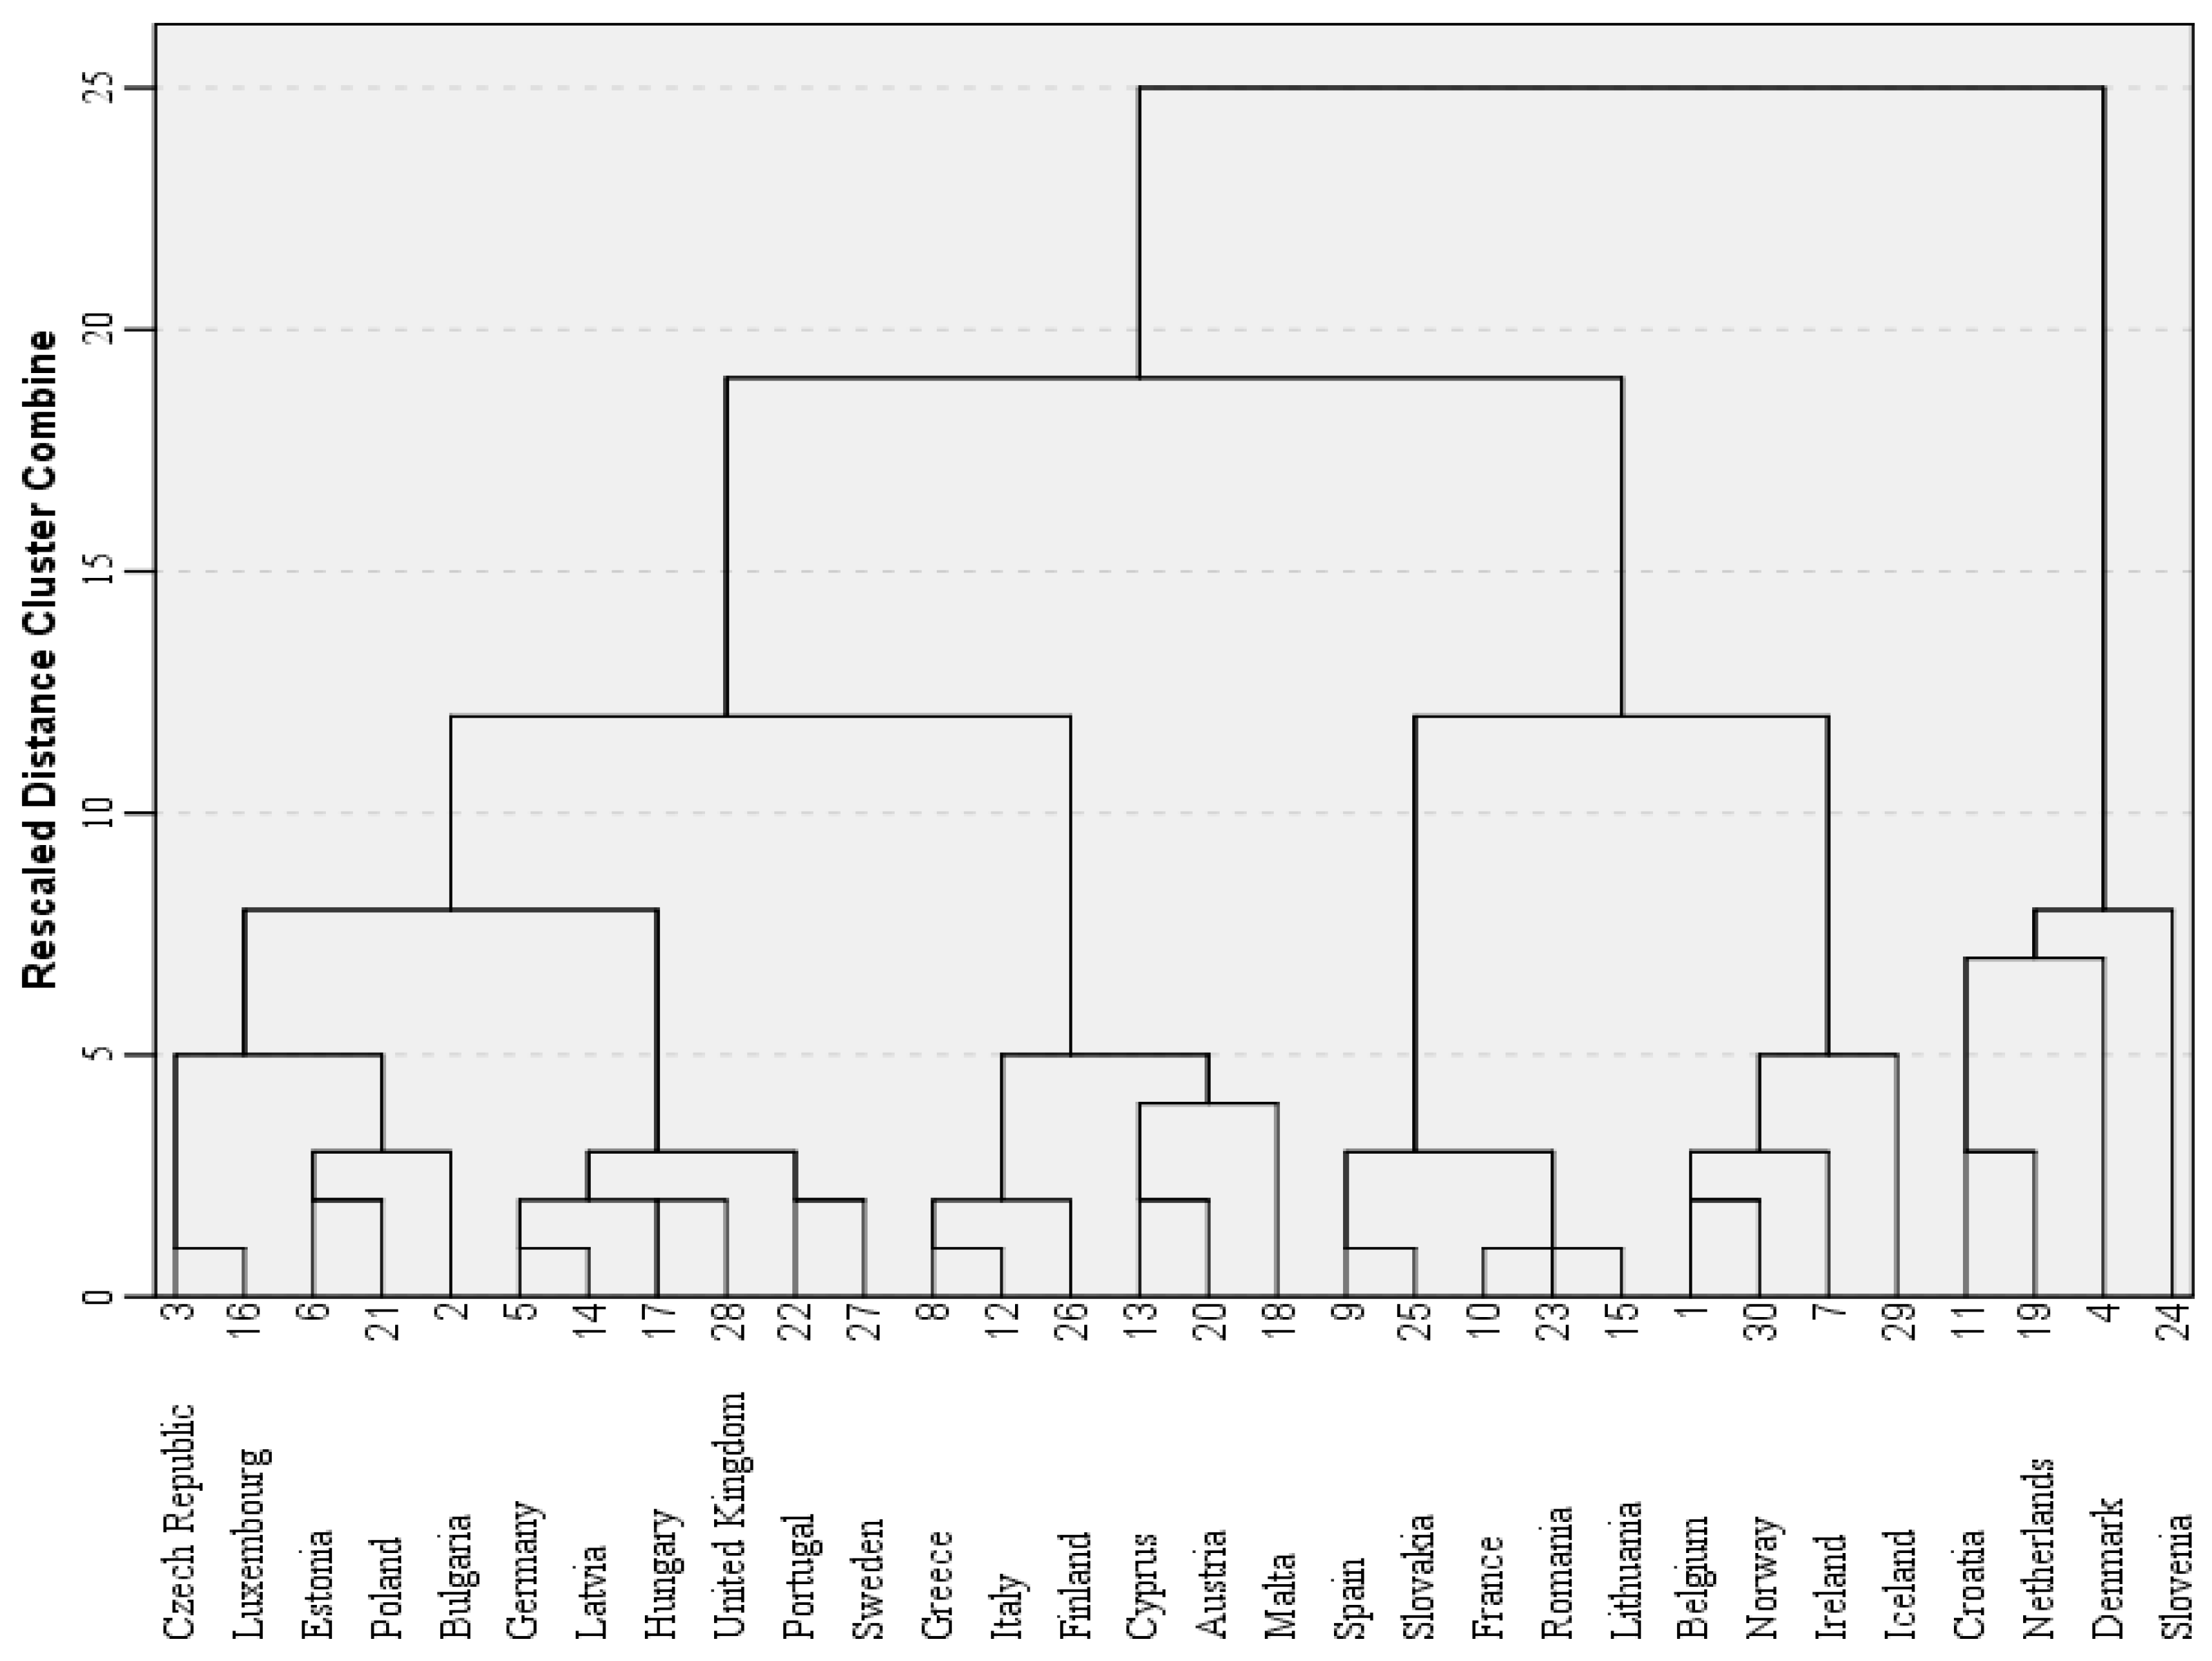
On the background of developments established during the period 2002 and 2012, the grouping and analysis process of the states, in the year 2012, based on the four environmental taxes indicators (ENV_GDP, ENG_GDP, TRS_GDP and POL_GDP) has continued.
The dendrogram that synthesizes the grouping for 2012 of the 28 EU Member States, as well as Norway and Iceland, is presented in
Figure 4.
It has a relatively similar structure to the one corresponding to 2002, suggesting solutions with a number of 3 to 10 or 12 clusters. However, there are certain particularities that set them apart.
Analysing the evolution of Total Sum of Squared Error based on the number of clusters (
Figure 5), potential optimal solutions regarding the number of clusters would be 6, 7 or 8. However, taking into account that the Levene Statistic values for Test for Homogeneity of Variance (
Table 6) are higher for variables ENG_GDP and POL_GDP from solutions with eight and seven clusters, respectively, than the corresponding critical values (F
0.05,5,22 = 2.66, for eight clusters and F
0.05,5,23 = 2.64 respectively, for seven clusters), the null hypothesis is rejected (H
0_3) and the alternative hypothesis is accepted (H
0_3): the corresponding variances of the data series are significantly different. In these circumstances, the ANOVA methodology cannot be used to test the statistical significance of these two variables belonging to the two solutions’ clusters.
Taking into account the fact that for the solution of grouping into six clusters, the results of applying the Test for Homogeneity of Variance leads to rejecting the null hypothesis only for variable POL_GDP from the three variables, this solution was chosen.
From the six clusters (
Table 7), cluster C1 includes 11 states, cluster C2 is composed of six states, cluster C3 contains five states, cluster 4 has four states, cluster C5 includes three states and C6 has only one state (Slovenia).
In order to check the significance of the belonging of the variable POL_GDP to the clusters and due to the fact that the ANOVA methodology cannot be applied, Welch’s Test was used. In this case, the F statistics is F = 3.653 < F0.05,4,7.31, respectively p-value = 0.058 > α = 0.05 and, thus, the null hypothesis is accepted (H0_3): the mean values of variable POL_GDP in the six clusters does not significantly differ. Therefore, the variable POL_GDP is not statistically significant in the achieved analysis, as it does not contribute significantly to the dissimilarity of clusters.
For the other three considered variables, taking into the account that they satisfy the Test for Homogeneity of Variance (the data series variances corresponding to them do not significantly differ), the ANOVA methodology was used to analyse the significance of their belonging to the chosen solution’s clusters (
Table 8).
Because the values of F statistics are significantly higher than the critical value F
0.05,5,24 = 2.62, the null hypothesis is rejected (H
0_1) and, thus, their values are significant in terms of their belonging to the clusters. The values of the means for analysed variables and their 95% Confidence Interval for Mean are presented in
Table 9.
The same detailed analysis type of the results from
Table 9 was achieved for all the countries included in the clusters, by studying and comparing the evolution levels of the four variables (ENV_GDP, ENG_GDP, TRS_GDP, POL_GDP), for the year 2012.
A clearer emphasizing of evolution of variables ENV_GDP, ENG_GDP, TRS_GDP and POL_GDP on clusters has taken into account their mean values and has provided a suggestive graphical representation (
Figure 6).
The economic crisis has brought to the fore the effects of the energy taxation on modelling the domestic economic structures. The energy taxation is to be considered, in this case, both one of the political and economic instruments and, in the same time, a market instrument used for promoting sustainable development. Thus, in 2012, cluster 1 (C1
2012) includes the most countries compared to the other clusters: Bulgaria, the Czech Republic, Germany, Estonia, Latvia, Luxembourg, Hungary, Poland, Portugal, Sweden, United Kingdom. For the countries from C1
2012, the mean percentage value is established in relation to the variables, as follows:
- -
in the case of ENV_GDP, between a minimum percentage of 2.20% (Germany and Portugal) and a maximum percentage of 2.80% (Bulgaria), the mean percentage value is 2.48%, in a 95% confidence interval for mean of 2.35% per country and 2.62% per country;
- -
for ENG_GDP the mean percentage value is 2.07% per country, belonging to a 95% confidence interval for mean of 1.90% per country and 2.52% per country; as in the case of the previous analysed variable, the same countries (except Germany) form the extreme limits, but with different percentage values: minimum of 1.70% and maximum of 2.50%;
- -
for TRS_GDP, in a 95% confidence interval for mean of 0.20% per country and 0.43% per country, the mean percentage value of 0.32% per country is established between the minimum percentage value of 0.10% for Estonia, respectively Luxembourg and the maximum percentage value of 0.60% for the United Kingdom;
- -
at 0.10% per country, in a 95% confidence interval for mean of 0.03% per country and 0.17% per country, for variable POL_GDP. The limits of interval in setting the mean for this variable are: 0.00% (Czech Republic, Luxembourg, Portugal, Sweden) and 0.30% (Estonia).
The implicit energy taxation policy could correct the market dysfunctionalities and improve economic efficiency by using the market instruments in order to approach the negative economic externalities due to the energy resources usage. As shown in
Figure 6, the energy taxation policy instruments are not used homogeneously and coherently among the states in the clusters. Some of the EU-28 Member States have used energy taxation as an instrument for promoting low-carbon economy, as well as for promoting innovative and less polluting industries and, not the least, for increasing the domestic competitiveness through ensuring a high level of employment.
The main characteristic of cluster 2 (C22012) is that it includes six countries (Greece, Italy, Cyprus, Malta, Austria, Finland) with a significant mean percentage value for variable ENV_GDP of 2.85% per country, taking into account the large number of countries included in the cluster, compared to C32012, C42012, C52012 and C62012. The mean percentage value placed between the minimum of 2.40% from Austria and the maximum of 3.10% from Finland is assigned to a 95% confidence interval for mean of 2.58% per country and 3.12% per country.
In C22012, it is established, for Austria and Malta, the lowest percentage value of 1.60% for variable ENG_GDP, while the maximum of 2.30% corresponds to Italy. Besides these extreme percentage values, the others of 1.90% (Cyprus), 2.10% (Finland) and 2.20% (Greece) contribute to the mean percentage value of 1.95% per country and a 95% confidence interval for mean of 1.63% per country and 2.27% per country. Thus, a reform of the energy taxation policy may encourage a modification of the tax burden from wage income to resource usage and creation of a sustainable economic growth pattern.
The variable TRS_GDP in C22012 is characterized by an interval for mean, of 0.60% per country and 1.10% per country, at 95% confidence for a mean percentage value of 0.85%, while for ENG_GDP, Italy represents the upper limit by the recorded percentage value, for TRS_GDP this country represents, through its value of 0.60%, the lower limit in determining the mean percentage value. Between the minimum limit represented by Italy and the maximum limit in Malta (1.30%), there are the following countries: Greece 0.70%, Cyprus and Austria 0.80%, respectively Finland 0.90%.
In C22012, the mean percentage value of 0.03% for POL_GDP is the result established between two countries with insignificant share (0.10%) of the pollution in GDP (Malta, Finland) and other four countries that do not have such contributions in GDP (Greece, Italy, Cyprus, Austria).
As the results shows, the energy taxation is considered, in this situation, a factor that prevents economic development rather than promotes it. The energy taxation policy, used as a market instrument, should contribute in a higher manner to the transition process to a more eco-efficient and eco-friendly economy. The share of the indicators proves that for the most EU-28 Member States, energy taxation was used more to mitigate the effects of the economic crisis than to develop and promote green investments, as well as to design a new economic paradigm by changing the energy consumption patterns.
For the year 2012, the hierarchy of the countries (Spain, France, Lithuania, Romania, Slovakia) included in cluster 3 (C32012), on each studied variable, is analysed taking into account the extreme percentage values but also the confidence intervals.
ENV_GDP has a mean percentage value of 1.76% per country, established in a 95% confidence interval for mean of 1.62% and 1.90% per country. Romania is on the first place from the countries in C32012 with 1.90%, followed on the second place by France and Slovakia with 1.80% and on the third place by Lithuania with 1.70%, while on the last place is Spain with 1.60%.
Spain and Romania maintain their places in the ranking of variable ENG_GDP for cluster C32012. Between the two countries, with a minimum percentage value of 1.30% and a maximum percentage value of 1.70%, are the following countries: Lithuania with 1.60%, France and Slovakia with 1.50%. In this context, the mean percentage value of the variable ENG_GDP for C32012 is 1.52% per country with a 95% confidence interval for mean of 1.34% per country and 1.70% per country.
Regarding the variable TRS_GDP, there is a mean percentage value of 0.18% per country, ranging between the minimum percentage value of 0.0% for Lithuania, followed by France, Romania and Slovakia with 0.20% and the maximum percentage value of 0.30% for Spain. For cluster C32012 and variable TRS_GDP there is a 95% confidence interval for mean between 0.04% and 0.32%.
The variable POL_GDP is inexistent for Spain and Slovakia. For the other three countries (France, Lithuania, Romania), POL_GDP is 0.10% and, at the general level, for the five countries that compose cluster C3
2012, there is a mean percentage value of 0.06% per country. So, as it is shown by the results and it is argued in the literature [
35], the implicit tax rates on energy are only significantly inversely related to the efficiency measure.
The analysis of cluster 4 in 2012 (C42012) regards only four countries: Belgium, Ireland, Iceland and Norway, for which the evolution levels of the four variables: ENV_GDP, ENG_GDP, TRS_GDP, POL_GDP are studied and compared.
The research starts with variable ENV_GDP. The mean percentage value of this variable, compared to the other three variables (ENG_GDP, TRS_GDP, POL_GDP), is the highest, namely 2.30% per country. This mean percentage value is included in a 95% confidence interval for mean of 2.01% per country and 2.59% per country. Iceland with 2.50%, Norway with 2.40%, Belgium with 2.20% and Ireland with 2.10% represent the hierarchy of the countries, based on the percentage values of variable ENV_GDP, in 2012, for C42012.
For variable ENG_GDP, the hierarchy pyramid of the countries is reversed. The maximum percentage value belongs to Iceland with 1.40%, followed by Belgium and Ireland with 1.30% and the minimum percentage of 1.10% belongs to Norway for C42012. In the year 2012, for cluster 4, the mean percentage of ENG_GDP is 1.28%, for a 95% confidence interval for mean of 1.07% per country and 1.48% per country.
In C42012, Norway is on the first place for variable TRS_GDP with 1.10% and Iceland is on the last place with 0.30%. In between, there are Ireland with 0.90% and Belgium with 0.70%. These percentage values led to a mean percentage of TRS_GDP for cluster C42012 of 0.75% per country in a 95% confidence interval for mean of 0.21% per country and 1.29% per country. As it can be remarked, despite the fact that the EU-28 Member States have chosen, for a long period of time, during 2002-2008, to decrease the energy taxation in order to promote extensive economic growth, after the economic crisis the energy taxation has become an efficient tool for mobilizing financial revenues to the national budgets.
Considering variable POL_GDP, the maximum of 0.30% belongs to Ireland and Iceland and the minimum of 0.10% belongs to Belgium and Norway. For C42012, the mean percentage is 0.20% per country for this variable in a 95% confidence interval for mean of 0.02% per country and 0.38% per country.
In 2012, cluster 5 (C52012) is composed of three countries: Denmark, Croatia and Netherlands. Compared to the other three variables included in the analysis (ENG_GDP, TRS_GDP, POL_GDP), in 2012, the mean percentage value of 3.57% per country of ENV_GDP for C52012 is the highest. This established mean percentage value is included between a minimum of 3.20% for Croatia and a maximum of 3.90% for Denmark, while Netherlands has 3.60%. This evolution of variable in C52012 has led to a 95% confidence interval for mean of 2.69% per country and 4.44% per country.
The analysis of the next two variables (ENG_GDP, TRS_GDP) includes a hierarchy of the three countries identical to the one corresponding to variable ENV_GDP for C52012. In this cluster, Croatia is the country with the lowest percentage values of 1.70% for ENG_GDP and 0.80% for TRS_GDP, and Denmark has maximum values of 2.20% and 1.40% for the two analysed variables. Based on the percentages of variables ENG_GDP and TRS_GDP for Netherlands, the mean percentages for C52012, in 2012, were established as 1.93% per country for ENG_GDP and 1.10% per country for TRS_GDP.
The variable POL_GDP reverses the places in hierarchy between Croatia and Denmark. For 2012, in the cluster C52012, the minimum percentage is 0.20% for Denmark and the maximum of 0.60% for Croatia. The mean percentage of POL_GDP, for cluster 5, is 0.43% per country, in 2012.
Regarding cluster 6 (C62012), the main characteristic is that it consists of only one country: Slovenia. For Slovenia, the variables that characterize the energy evolution are: 3.80% ENV_GDP, 3.1% ENG_GDP, 0.40% TRS_GDP and 0.30% POL_GDP.
In conclusion, significant changes regarding the values of those four taxes took place as a result of the economic and social transformations that were recorded between 2002 and 2012, in those 30 states. These changes have led to the migrations of the states included in clusters C32002, C42002, C52002, C62002 and C72002, especially, to clusters C12012 and C22012. Thus, if in 2002, the clusters C12002, C22002 and C32002 included only 10 states (33.34%), in 2012 their number has increased to 22 (73.34%). The common features of those 22 states that in 2012 were included in clusters C12012, C22012 and C32012 are represented by the decreasing of total environmental taxes as % to GDP (from 3.13%, 3.15% and 2.42%, in 2002, to 2.48%, 2.85% and, respectively, 1.76% in 2012), decreasing of transport taxes as % to GDP (from 1.13%, 1.85% and 0.98%, in 2002, to 0.32%, 0.85% and, respectively 0.18%, in 2012), as well as by slight increases of energy taxes as % to GDP (from 1.97%, 1.15% and 1.34%, in 2002, to 2.07%, 1.95% and, respectively 1.52%, in 2012). Regarding the pollution taxes as % to GDP, the mean values of this indicator for the states from clusters C22012 and C32012 have maintained approximately constant. The exception is represented by the states from cluster C12012 where the mean value of this indicator has increased from 0.03% in 2002, to 0.10% in 2012.
In Croatia, Denmark, Netherlands and Slovenia a relatively different situation is recorded, where, although the shares of those four taxes in GDP in 2012 are lower than the ones recorded in 2002, their values continue to be quite high. This fact maintains these states on different positions in comparison with the other analysed states.
The environmental taxation, including energy, has different levels among the EU-28 Member States and shows the interest of the state in promoting environment friendly technologies and reducing the dependence on energy imports [
36]. If it is taken into consideration the contribution of the environmental taxation, including energy, on creating GDP, as it is shown in literature [
22], “the ratio of environmental tax revenues to GDP differs between Member States, with Denmark (4.1%), Slovenia and Croatia (both 3.9%) having the highest ratios and Lithuania (1.7%), Slovakia and Spain (both 1.8%) registering the lowest” [
22].
4. Conclusions
In Europe, environmental taxation, including energy taxation, has led to a genuine environmental tax reform, during the analysed period of 2002–2012. Changes in the grouping of the states in 2012 compared to 2002, in different environmental tax categories, reflect, to some extent, the behaviour of economic operators.
In 2012, compared to 2002, ENV_GDP records significant fluctuations in time, from one cluster to another and, implicitly, from one country to another. The fluctuations are emphasized through the increase of mean percentage values established in 2012 compared to 2002 for clusters 5 (C52012) and 6 (C62012) and the decrease for the other four clusters (C12012, C22012, C32012, C42012). At the same time, the overall analysis of variable ENV_GDP, in 2012 compared to 2002, has synthesized two evolution directions: mean percentage increase and decrease.
The evolution, in the sense of mean percentage increase for ENV_GDP in 2012 compared to 2002, was established for a small part of the countries included in the analysis. Thus, C12012 recorded an increase with 2.19 percentage points per country of ENV_GDP through Bulgaria, Estonia, Latvia, Poland which transfer from C52002, while C22012 with 0.66 percentage points per country through Greece and Austria from C32002, respectively with 0.12 percentage points per country through Italy from C42002. Although Slovenia does not change its cluster that is cluster 6, it shows a change in the sense of a mean percentage increase with 0.17 percentage points per country in C62012 compared to C62002.
The mean percentage decreases for ENV_GDP have led to a descending trend for most of the countries included in the research. Thus, it can be observed that there are significant changes of the clusters’ components in 2012 compared to 2002. Portugal, element of C12002, stays loyal to this cluster in 2012, although, overall, C12012 records a mean percentage decrease of ENV_GDP with 0.65% percentage points per country. This significant difference is also the result of the percentage values established in 2012 for Germany, Hungary, Sweden, Luxembourg, Czech Republic and United Kingdom, which moved from the cluster C42002. A similar situation is established with Cyprus and Malta, elements of clusters C22002 and C22012, the difference between clusters being 0.30 percentage points per country.
For cluster C22012, the mean percentage value of ENV_GDP is lower with 0.28 percentage points per country compared to the one of C12002 from which Finland has come. The same decreasing process can be seen for C32012 through Lithuania from C42002 with 0.97 percentage points per country, respectively through Spain, France, Romania, Slovakia from C52002 with 0.43 percentage points per country. Cluster C42012 includes Norway from C12002, with a decrease of 0.83 percentage points per country and three countries from C32002 (Belgium, Ireland and Iceland) which led to a decreasing trend of the analysed variable average with 0.12 percentage points per country. The same trend is reported for Croatia and the Netherlands from C62002, respectively Denmark from C72002, which will become elements of C52012, causing decreases of 0.06 percentage points per country, respectively 1.23 percentage points per country.
The mean percentage fluctuations of the variable ENG_GDP recorded in time, on each country and from one cluster to another, are similar to the fluctuations of the previously analysed variable (ENV_GDP). The notified exceptions are as follows:
- -
C12012 for which there is an increase of the mean percentage of ENG_GDP from 1.97% per country to 2.07% per country, represented, in part, by Portugal from C12002;
- -
C22012, with Cyprus and Malta which lead to an increasing process of the mean percentage value with 0.8 percentage points in 2012 compared to 2002.
The variation trends of the mean percentage values for variable TRS_GDP are similar to variable ENV_GDP. For this analysed variable, there are different observed situations as follows:
- -
C22012 where, for TRS_GDP, there is a mean percentage decrease from 0.98% per country from C32002 to 0.85%, represented by Greece and Austria, respectively a mean percentage increase with 0.45 percentage points from C42002 represented by Italy.
- -
C52012, for which there is a mean percentage increase, compared to 2002 with 0.30% percentage points per country for C62002 through Croatia and Netherlands.
- -
C62012 is represented by Slovenia with a mean percentage of 0.40% per country, lower than that of cluster 6 in 2002 that belonged to in that year.
The variable POL_GDP is nearly in the opposite direction as ENV_GDP. The increases of mean percentage values for variable POL_GDP determined an ascending trend for many countries included in the research and significant changes of the clusters’ components in 2012 compared to 2002. The insignificant mean percentage increase from C12012 with 0.04 percentage points per country is based on Germany, Hungary, Sweden, Luxembourg, Czech Republic, United Kingdom which represented C42002. The same situation is established for Portugal in C12002 which does not modify its cluster in 2012 although, overall, there is a mean percentage increase of variable POL_GDP with 0.07 percentage points per country. Norway from C12002 will be transferred in cluster C42012, the increase between clusters being 0.17 percentage points per country. Three countries from C32002 (Belgium, Ireland and Iceland) also determines an increasing trend of the analysed variable mean with 0.12 percentage points per country. Denmark, element of C72002, will become a component of C52012, leading to an increase of the mean percentage value between clusters of 0.13 percentage points per country.
At the same time, the variable POL_GDP also recorded decreases of the mean percentage values between the clusters from 2012 compared to the clusters from 2002. For C1
2012 there is a decrease of 0.05 percentage points per country of the variable through Bulgaria, Estonia, Latvia and Poland which are transferred from C5
2002. A similar situation is identified for C2
2012, where there is a decrease of 0.05 percentage points per country through Greece and Austria from C3
2002, respectively with 0.03 percentage points per country through Italy from C4
2002. Components of cluster C2
2002, Cyprus and Malta, also are components for C2
2012, the difference between them being 0.02 percentage points per country. The same decreasing process can also be seen for C3
2012 through Spain, France, Romania and Slovakia from C5
2002 with 0.12 percentage points per country, but also for C5
2012 through Croatia and Netherlands from C6
2002, with a difference of 0.04 percentage points per country. An identical trend is notified for Slovenia which records a change in the direction of mean percentage decrease with 0.17 percentage points per country in C6
2012 compared to C6
2002. This variable POL_GDP is the only variable that does not change its mean percentage value of 0.06% per country from cluster C4
2002 to cluster C3
2012. Taking into account these observations, we can determine that at UE-28 Member States level an uniformity process (a relative convergence) of the values of the four indicators (total environmental taxes as a percentage of GDP, energy taxes as a percentage of GDP, transport taxes as a percentage of GDP, pollution taxes as a percentage of GDP) has been carried out. Initiatives and plans undertaken by various countries regarding the environmental taxation, including energy taxation, aimed at:
- -
reducing negative effects on the environment;
- -
promoting good environmental behaviour;
- -
obtaining incomes for environmental protection;
Countries’ efforts have been reported and visible as a response to the financial and economic crisis, from 2008. Changes occurred in the economic models of behaviour can be assigned to incomes that are reduced as a result of using higher tax rates, or using some low environmental tax rates.
In conclusion, it can be stated that in the EU-28 Member States, the environmental policy is oriented primarily towards pollution control and natural resources. In this end, they have used economic instruments such as environmental taxes, tradable permits, royalties and taxes, deposit-refund systems, as well as subsidies.
Environmental taxation, including energy taxation, has taken into account both supporting economic operator behaviour and fulfilling environmental objectives. The application of these taxes, in different fields and the impact in the countries included in the analysis represent references for emphasizing the economic models of behaviour and in the process of grouping them by various criteria.
The EU-28 energy taxation system could be considered as a global standard in terms of energy taxation and greenhouse gases reduction. Also, it is solidly built on sustainable principles and, at the same time, is effective. Thus, the revenues obtained from the implementation of fiscal regulations in the field of energy must be used and, also, targeted, in a much higher manner, to support the financing of projects and measures aimed to protect the environment, to promote and to reward manufacturers that choose to introduce new eco-efficient technologies of production, as well as to adapt to climate changes.
Taking into the consideration the results obtained in the analysis, it could be appreciated that the main objectives of this study were achieved. During the analysis, clusters were designed on the basis of the influence of energy taxation in developing an EU-28 economic paradigm and also there possible convergences and causalities between GDP growth and energy taxation among the EU-28 Member States were identified and marked. The results obtained during the research led to the conclusion that the environmental policy and, especially energy policy, could be considered instruments that can be used to design a convergence model among the EU-28 Member States.


 and
and 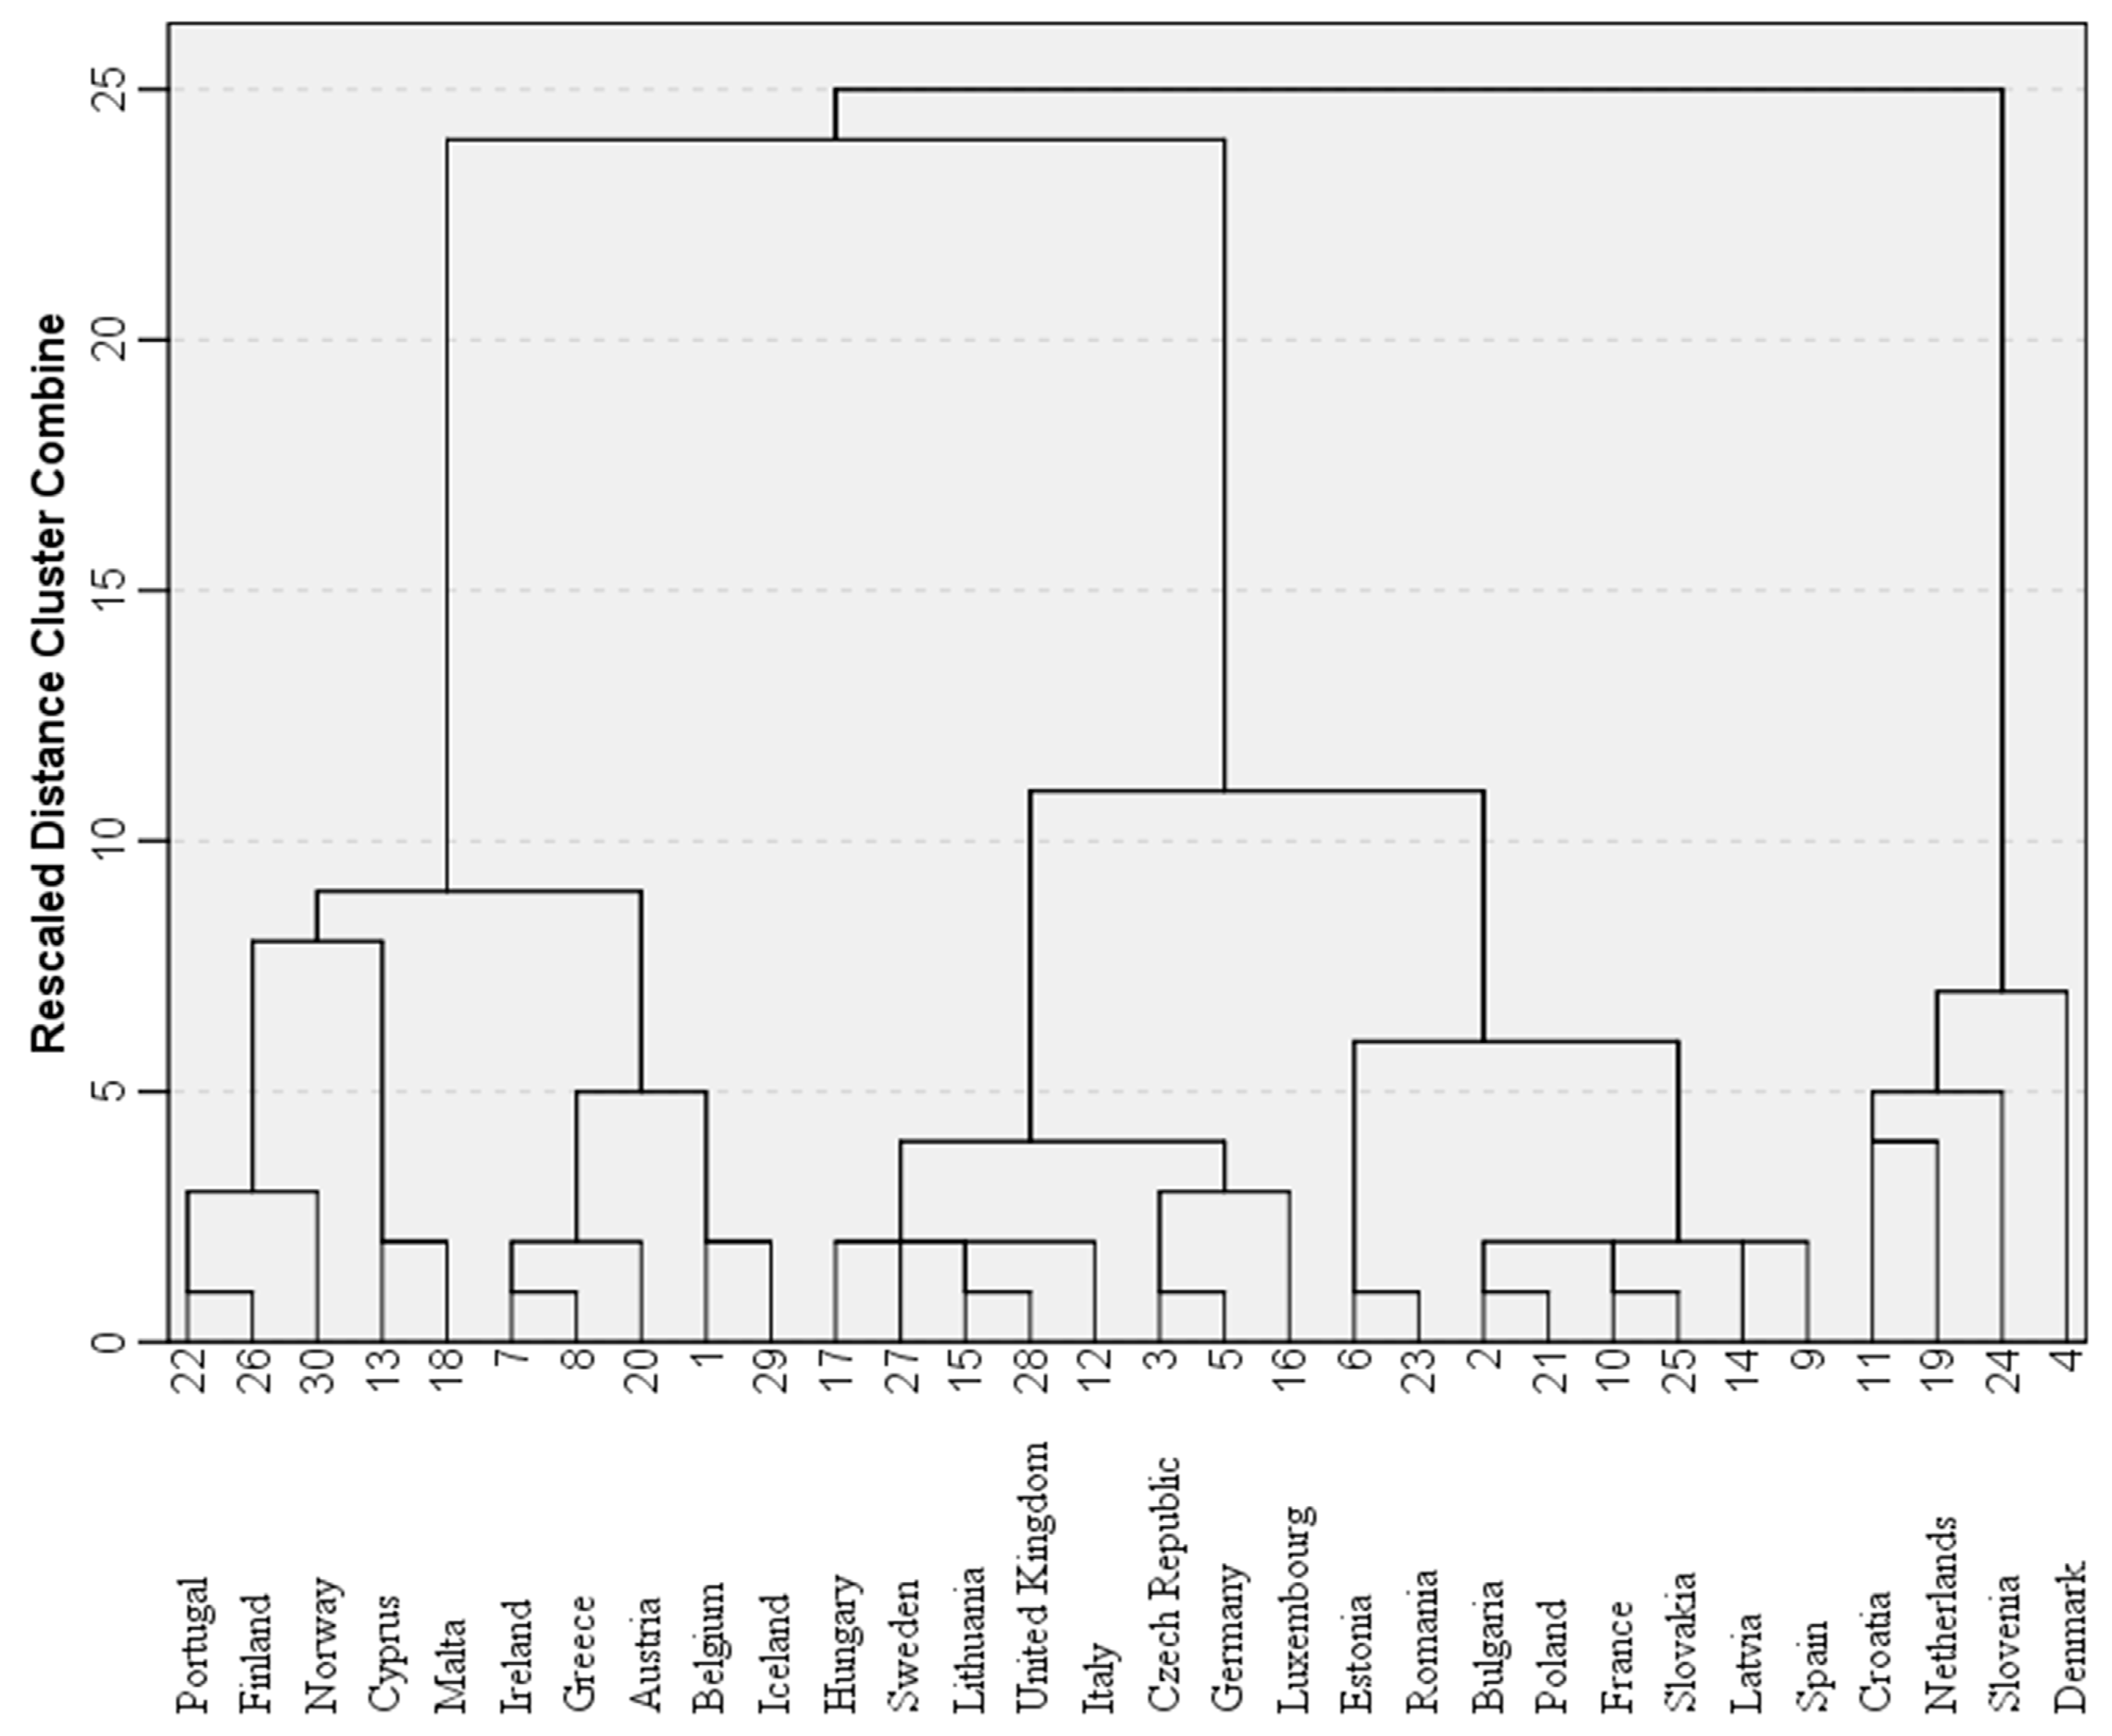


