Article

The Influence of Micro-Oxygen Addition on Desulfurization Performance and Microbial Communities during Waste-Activated Sludge Digestion in a Rusty Scrap Iron-Loaded Anaerobic Digester

1
Key Laboratory of Integrated Regulation and Resource Development on Shallow Lakes, Ministry of Education, Hohai University, Nanjing 210098, China
2
College of Environment, Hohai University, Nanjing 210098, China
*
Author to whom correspondence should be addressed.
Energies 2017, 10(2), 258; https://doi.org/10.3390/en10020258
Submission received: 23 November 2016 / Revised: 14 February 2017 / Accepted: 16 February 2017 / Published: 21 February 2017

Abstract

:
In this study, micro-oxygen was integrated into a rusty scrap iron (RSI)-loaded anaerobic digester. Under an optimal RSI dosage of 20 g/L, increasing O2 levels were added stepwise in seven stages in a semi-continuous experiment. Results showed the average methane yield was 306 mL/g COD (chemical oxygen demand), and the hydrogen sulphide (H2S) concentration was 1933 ppmv with RSI addition. O2 addition induced the microbial oxidation of sulphide by stimulating sulfur-oxidizing bacteria and chemical corrosion of iron, which promoted the generation of FeS and Fe2S3. In the 6th phase of the semi-continuous test, deep desulfurization was achieved without negatively impacting system performance. Average methane yield was 301.1 mL/g COD, and H2S concentration was 75 ppmv. Sulfur mass balance was described, with 84.0%, 11.90% and 0.21% of sulfur present in solid, liquid and gaseous phases, respectively. The Polymerase Chain Reaction-Denaturing Gradient Gel Electrophoresis (PCR-DGGE) analysis revealed that RSI addition could enrich the diversity of hydrogenotrophic methanogens and iron-reducing bacteria to benefit methanogenesis and organic mineralization, and impoverish the methanotroph (Methylocella silvestris) to reduce the consumption of methane. Micro-oxygen supplementation could enhance the diversity of iron-oxidizing bacteria arising from the improvement of Fe(II) release rate and enrich the sulphur-oxidising bacteria to achieved desulfurization. These results demonstrated that RSI addition in combination with micro-oxygenation represents a promising method for simultaneously controlling biogas H2S concentration and improving digestion performance.

Graphical Abstract

1. Introduction

As the by-product of wastewater treatment plants (WWTPs) the output of waste activated sludge generated in biological wastewater treatment processes has increased continuously in the recent decade. Wet sludge production in China was estimated to reach 33.59 million tons (based on a moisture content of 80%) by the end of 2015. Activated sludge has a complex composition, containing a variety of bacteria and organic materials, and its improper disposal and accumulation is bound to cause secondary pollution.
Anaerobic treatment processes have been widely applied to the treatment of organic solid waste due to their low operational costs and high solids reduction efficiency [1,2,3]. Under anaerobic conditions, organic matter is initially hydrolyzed and then fermented into volatile fatty acids (VFAs) such as acetic acid, as well as hydrogen, which represent substrates for methanogenic archaea for methane production [4]. However, the application of anaerobic digestion of sludge is often limited by low methane yield and sludge reduction rates [5], and the limiting factors are generally associated with the slow hydrolysis of sludge [6]. To accelerate the sludge digestion, various pre-treatments have been used to improve the hydrolysis of the sludge, including thermal [7], chemical [8] and mechanical methods [9]. The operating cost of the present pretreatment is high and often unattractive for practical application.
Zero-valent iron (ZVI), which is a cheap reductant, has been widely applied to accelerate hydrolysis-acidification of the anaerobic digestion of sludge [10,11]. ZVI addition is associated with a resulting decline in oxidation-reduction potential (ORP) when added into anaerobic systems, enabling a more favorable environment for anaerobic biological processes [12]. Rusty scrap iron (RSI) is an abandoned iron material covered by a layer of iron oxide (rust) on its surface, which may represent an economic alternative. However, in previous work, little research has investigated the effect of RSI on the anaerobic digestion of activated sludge.
The issue of the quality and quantity of biogas is equally important. Biogas contains several pollutants formed during the anaerobic digestion of sludge, predominantly in the form of toxic hydrogen sulphide (H2S), with concentrations ranging from 0.1% to 1.0% v/v (1000–10,000 ppmv) [13]. H2S can be released during the anaerobic digestion process by specific microorganisms such as sulfate-reducing bacteria (SRB), due to the existence of sulfur-containing compounds in substrates [14]. This leads to many problems, such as inhibited anaerobic digestion process, reduced biogas production, and poor biogas quality [15]. Consequently, H2S production must be prevented, or H2S must be removed from the biogas.
Recently, biological treatment processes to eliminate hydrogen sulphide have been shown to lower operational costs compared to traditional physico-chemical processes and lower chemical utilization or eliminate it altogether [16]. The application of micro-oxygenation technology is a key step to achieve biological treatment of hydrogen sulphide. Biological removal is based on the utilization of sulphur-oxidising bacteria (SOB) able to metabolize hydrogen sulphide to obtain energy when oxygen is present as an electron acceptor. The biological oxidation takes place in stages, through several redox intermediates as shown in Equation (1) [17]. The main reactions carried out by SOB are shown below:
HS → S0 → S2O32− → S4O62− → SO42−
H2S + 0.5O2 → S0 + H2O; ΔG0 = −209.4 kJ/reaction
S0 + 1.5O2 + H2O → SO42− + 2H+; ΔG0 = −587.41 kJ/reaction
H2S + 2O2 → SO42− + 2H+; ΔG0 = −798.2 kJ/reaction
S2O32− + H2O + 2O2 → 2SO42− + 2H+; ΔG0 = −818.3 kJ/reaction
At this point, it should be noted that H2S oxidation in biological systems occurs concurrently with chemical reactions [18]. Currently, the study of biological technologies on hydrogen sulphide remove mainly focused on biotrickling filters [19,20] and bioscrubbers [21] that employ pure cultures developed in the presence of hydrogen sulphide, oxygen and nutrients.
An additive that could increase anaerobic digestion methane yields would be important for a transition to renewable energies [22]. In previous study, RSI as an additive to enhance the performance of anaerobic digestion. In this study, the effect of the limited oxygen supply to the RSI-loaded anaerobic digester on the anaerobic digestion performance and biogas desulfurization was explored. The possible control mechanism of H2S in biogas by the coupling of RSI with micro-oxygen was proposed. Additional studies have described the shifts in microbial communities in response to ambient temperature change [23], but did not assess micro-oxygenation in combination with RSI. In this work, providing more comprehensive insights into the digester ecosystem and the changes in microbial community structure under this circumstances.

2. Materials and Methods

2.1. Substrates, Inoculant and Rusty Scrap Iron

The waste-activated sludge (WAS) used in this study originated from the Jianning Economic Development Zone WWPT in Nanjing, China. The sludge was stored in the freezer at −20 °C until use. In order to strengthen the hydrolysis step, the sludge was pretreated using alkaline method before the anaerobic fermentation [24]. In brief, the pH of sludge was adjusted to 12 using 4 M of sodium hydroxide, and then the sludge was stirred at 80 rpm for 6 h. After pretreatment, the pH of sludge was adjusted to 7 using 4 M of hydrochloric acid for anaerobic digestion. The characteristics of WAS and alkaline-pretreated sludge (APS) are compared in Table 1.
Inoculated anaerobic microorganisms were at the concentration of total solids (TS) = 34.7 g/L (volatile solids (VS) = 24.1 g/L), which were collected from the expanded granular sludge bed (EGSB) treating the distillery wastewater in Jiangsu Yanghe Brewery Joint-Stock Co., Ltd. (Suqian, China). Prior to use, the inocula were starved for 1 week and incubated at 35 °C.
RSI was used for addition of ferro-oxidative material for this study. The RSI tailings (approximately 10 mm × 10 mm × 0.3 mm) used in this study were obtained from a machine processing factory workshop. RSI was be covered by a layer of rust on inner ZVI surface which was mainly consisted of different iron oxides (Fe2O3, Fe3O4, FeO, FeOOH). The surface rust accounts for about 17.1% ± 2.4% of the RSI weight. The inner part of RSI is elemental iron (zero-valent iron, ZVI). It was soaked in 0.1 M of NaOH solution for 24 h to remove oil residue and then washed with deionized water.

2.2. Semi-Continuous Microaerobic Digestion

In the previous study, we have examined the effects of varying concentrations of RSI additions (i.e., 0, 1, 5, 10, 20, 30 g/L) on anaerobic digestion performance from WAS, and obtained the optimal dosage of 20 g-RSI/L. The anaerobic digester with RSI dosage of 20 g/L is the RSI-loaded anaerobic digester in this study. The RSI was added to the reactor only at the beginning of the experiment. At the end of every period, the residual RSI was removed by using a magnet and replaced by new RSI for the next period.
To investigate the effects of a limited oxygen supply on SOB in a RSI-loaded anaerobic digester’s performance and desulfurization, lab-scale bioreactors were operated with a working volume of 4 L and a headspace of 0.5 L under varying oxygen dosages and the optimal dosage of RSI as determined above over a span of 210 days. Digestion was performed in the mesophilic range (35 ± 1 °C) with a hydraulic retention time (HRT) of approximately 20 days. The volumetric organic loading rate of the reactors was 1.54 kgCOD/m3·day. To increase the amount of hydrogen sulphide produced during digestion, sodium sulphate was added to the feed at a concentration of 2 g/L. The bioreactor was fed with WAS through a peristaltic pump on a semi-continuous basis, with feeding and discharge once a day (200 mL). The reactor was mixed with biogas recirculation provided by a miniature electroadcompressor (1 L/min). Oxygen was supplied with a 820 Top-Trak mass flow controller (Sierra Instruments, Sierra, CA, USA) from an oxygen cylinder. The oxygen was introduced into the headspace of the reactor once a day. The study was divided into seven operational periods with systematically increased dosages of oxygen. According to the relationship 5.0 NLoxygen/Nm3 biogas and the biogas production in P2 to determine the dosage of oxygen (about 0.6–12.0 NLoxygen/Nm3 biogas). The first period (P1) represented a control, without RSI added in the absence of oxygen to establish performance of conventional anaerobic digestion of WAS, as determined by chemical oxygen demand (COD) removal and methane yield. The second period (P2) investigated the effect of addition of the optimally determined rusty scrap iron (RSI) concentration on anaerobic digestion performance in comparison to P1. The five additional periods (i.e., P3–P7) were carried out to evaluate the effect of the varying dosages of oxygen supply on the RSI-loaded anaerobic digester’s performance and desulfurization in this system. Table 2 summarizes the experimental arrangement of the study, and a lab-scale bioreactor diagram is shown in Figure 1. Reactor contents were sampled every day and conserved at 4 °C. Biogas generated was collected in a 5 L Tedlar gas bag (CEL Scientific, Santa Fe Springs, CA, USA). Considering the amount of biogas yet to be treated, a biogas residence time (BRT) of more than 7 h would be maintained, which was sufficient to obtain an efficient hydrogen sulphide removal in a microaerobic reactor [25]. The biogas residence time is a value that reflects mean residence time of produced biogas in the headspace of the reactor which could be calculated by the following equation:
BRT = 24 × Vheadspace/ABPR
where BRT is biogas residence time; Vheadspace is the headspace volume of reactor (0.5 L in this study); and ABPR is average biogas production rate (L/day).

2.3. Analysis

Prior to daily sampling, pH and ORP values were quantified by a HQ30d meter (HACH, Loveland, CO, USA) equipped with a standard electrode (PHC101, HACH) and a standard electrode (MTC101, HACH), respectively. TS, VS, total suspended solids (TSS), volatile suspended solids (VSS), total chemical oxygen demand (TCOD) and soluble chemical oxygen demand (SCOD) were measured according to the standard methods [26]. For analysis of the soluble fraction, the samples were centrifuged at 8000 rpm for 10 min and then the supernatant was passed through a 0.45 mm nitrocellulose filter.
Fe(II) and Fe(T) [Fe(II) + Fe(III)] were examined according to standard methods [26]. Samples for Fe(II) analysis were acidified by 0.1 M HCl and measured immediately to minimize its oxidation. Aqueous concentrations were determined after filtering water samples through 0.22 um glass-fiber filter papers (Gelman A/E, Ann Arbor, MI, USA).
Sulphate and thiosulphate were measured by high performance liquid chromatography (HPLC) according to the method described by van der Zee et al. [18]. Total sulfide in the effluent was analyzed by the potentiometric titration method (Leici PHS-3C, Shanghai, China), which included H2S, HS, and S2. The sulphur content in the sludge was estimated from an elemental analysis of sulphur. Samples were dried at 95 °C, cooled and analysed in a SC32 oven (LECO, Joseph, UT, USA). Analysis was carried out by combustion of the samples at 1350 °C, as a result, the sulphur was completely oxidized to SO2 and evaluated in the detection cell. The sulphur estimation was the result of subtracting the content of the other analyzed sulphur species (sulphate, thiosulphate) of the sample from the total sulphur content.
Biogas composition (CH4, CO2, H2S, and O2) was measured daily using a portable biogas analyzer (Biogas 5000, Geotech, Denver, CO, USA). The gas bag was emptied at the end of each working day, with biogas accumulated over 24 h, with biogas samples taken for analysis at the beginning of the following day. The volume was measured by displacement of water then converted to standard temperature and pressure (STP).

2.4. DNA Extraction, Amplification by Polymerase Chain Reaction, Denaturing Gradient Gel Electrophoresis and Sequencing

In this study, in order to evaluate how the presence of RSI and O2 affected the microbial community, three samples were collected on the last day of P1, P2 and P6 and stored at −20 °C. The genomic DNA of the samples were extracted using an extraction kit (Bioteke Corporation, Beijing, China) according to the manufacturer’s instructions. A primer combination of 341F (5′-CCTACGGGAGGCAGCAG-3′) and 907R (5′-CCGTCAATTCCTTTGAGTTT-3′) was used to selectively amplify the 16S rRNA sequences of bacteria [27]. Another primer combination of 787F (5′-ATTAGA TACCCTGGTAGTCC-3′) and 1059R (5′-GGACTACCAGGGTATCTAAT-3′) was used to selectively amplify the 16S rRNA sequences of archaea [28]. A 40 base pair GC clamp was added to the forward primer at the 5′-end to improve detection of the sequence variation in DNA fragments by subsequent denaturing gradient gel electrophoresis (DGGE) [27]. The 16S rDNA fragment was amplified using a polymerase chain reaction (PCR) thermal cycler Dice (BioRad Laboratories, Inc., Hercules, CA, USA) with a touchdown PCR method [29]. The PCR products obtained were applied in the DGGE analysis using a BioRad Dcode system (BioRad Laboratories, Inc.). A DGGE gel of 6% polyacrylamide with a linear denaturing gradient ranging from 30% to 60% (100% denaturing gradient contains 7 M urea and 40% formamide) was applied. Electrophoresis was conducted at a constant voltage of 180 V in 1 × TAE (tris-acetate-edta) buffer and 60 °C for 6 h. The gels were then stained with SYBR Gold (Dalian TaKaRa, Dalian, China) in 1 × TAE buffer for 40 min, after which the UV transillumination image of the gel was photographed using the Gel Doc 2000 System (BioRad Laboratories, Inc.).
Selected DGGE bands were excised and re-amplified by PCR with the aforementioned primers without the GC clamp. The PCR products were sequenced at TaKaRa Biotechnology Co. Ltd., (Dalian, China). The obtained sequences were then compared to the reference microorganisms in the GenBank database using the BLAST (Basic Local Alignment Search Tool) program.

3. Results and Discussion

3.1. Sludge Digestion System with Rusty Scrap Iron Amendments during Semi-Continuous Anaerobic and Microaerobic Digestion

3.1.1. The Variation of pH and Oxidation-Reduction Potential

To investigate the effects of the limited oxygen supply to the RSI anaerobic system on steady-state performance in this study, the variation of pH and ORP were characterized during semi-continuous digestion experiments (Figure 2). During P1, which involved neither addition RSI nor supply O2, the pH decreased from near neutral values to 6.33 over the initial 3 days (Figure 2). This can be attributed to the build-up of VFAs during APS digestion because methanogens grow more slowly than acidogens in the degradative process [30]. Afterwards, pH increased slightly, fluctuating from 6.5 to 6.8 over the remainder of P1. During P2, the RSI (20 g/L) was added into reactor. As expected, the pH in the reactor quickly returned to 7.0 and remained in the near-optimal pH range (6.8–7.2) [31], due to the previously described mechanism of pH regulation through corrosion process. On the 61st day (period P3), 1 mL pure O2 was introduced into the reactor headspace, and as shown in Figure 2, the pH was maintained at ideal levels (6.8–7.2)., with similar effects observed at P4, P5 and P6. Supplying limited O2 could have increased the chemical corrosion of ZVI, as the common consensus is that the principal site of cathodic oxygen reduction, (Equation (6)), and anodic metal dissolution according to Equation (7) occurs close to RSI edges [32]:
O2 + 2H2O + 4e → 4OH
Fe (s) → Fe2+ (aq) + 2e
2H2O + 4Fe2+ (aq) + O2 → 4Fe3+ (aq) + 4OH (aq)
When Fe(III) enters liquid phase it will rapidly be converted into Fe(II) by iron-reducing bacteria (IRB) [33,34]. By looking at the fast Fe(III) reduction at the time, two possible reasons could be proposed for the observed pH stabilization: (1) the electrons generated during the degradation of the sludge organics were, to a large extent, utilized for Fe(III) reduction, decreasing the amount of electrons flowing to the intermediates to form fermentation end products, mainly in the form of VFAs; (2) much of the resultant VFAs from the sludge digestion were consumed as the electron donors for Fe(III) reduction. In both the above ways, the supplemented RSI acted as an electron sink to alleviate the accumulation of reducing equivalents for VFAs formation, thus preventing the pH from decreasing. However, slight pH drops were observed in P7, mainly fluctuating from 6.6 to 6.9. This can be ascribed to excess oxygen because the system reductive environment was destroyed, which restrained the methanogens activity but did not inhibit acidogenic facultative anaerobes [35].
In the first stage (P1), reactor ORP generally ranged from −410 to −350 mV, which is suitable for anaerobic digestion normal operation. Because of the rapid dissolution of iron oxide and release of ferric ions, the ORP level in P2 was noticeably higher than in P1 in the first two day (Figure 2) and which consequently decreased to a lower lever (about −450~−500 mV), which should be attributed to the reducing ability of inner ZVI. Previous research indicated that ORP in anaerobic environment can be decreased by as much as 100 mV through addition of ZVI [36]. In P3, micro-oxygenation (1 mL O2) was started (Table 3), and a slight increase in ORP was observed, fluctuating from −450 to −480 mV. The ORP is a measure of the redox potential and is sensitive to the presence of O2 in an aqueous solution. In the remaining four stages (P4, P5, P6 and P7), the system ORP increased with stepwise increasing O2 dosage with fluctuations of −410 to −440 mV, −350 to −400 mV, −300 to −340 mV and −200 to −230 mV, respectively. With respect to P4–P6, although the system ORP levels were increased from −440 to −300 mV, any negative impact on methanogenic activity was non-existent. Instead of decreasing, the average COD removal and average methane yield increased slightly (Table 3). This is consistent with the fact that ZVI created a favorable environment for the growth of methanogens by lowering the ORP (−270 to −370 mV) and increasing the buffer capacity of the system [37]. In comparison, in P7, excess oxygen disrupted the system reductive environment that is necessary for methanogens growth, followed by the reduction of average COD removal and average methane yield (Table 3).

3.1.2. The Anaerobic and Microaerobic Digestion Performance

The variation of daily COD removal and daily methane yield for entire duration of the semi-continuous digestion are illustrated in Figure 3. The variation trend of COD removal is similar to methane yield. It is possible that methane production is the predominant way of COD removal in anaerobic digestion systems with low hydrogen production. The COD removal and methane yield in P1 (neither RSI supplementation nor O2 supply), which were considered data for the baseline period, were 38.2% and 218.75 mL/g COD on average (Table 3). After RSI supplementation in P2 COD removal and CH4 yield increased noticeably in the initial four days, with subsequent fluctuation within a narrow range. A 1.50-fold increase in average COD removal and a 1.41-fold increase in average methane yield were achieved compared with P1. This is attributed to the reduction of the Fe(III) oxides on the RSI surface, which promoted microbial hydrolysis-acidification of complex matter, providing more organic matter for methanogenesis [1]. In addition, a previous study has suggested that RSI could enhance decomposition of propionate and created further improvements on the propionate conversion [29]. While propionate could not be utilized directly by methanogens, its biotransformation products could, ultimately enhancing methane yield. In P3–P6 (i.e., stepwise increase in oxygen concentration), the COD removal and the methane yield were almost equal to that of P2 (Figure 3), which fluctuated in small scope arising from the variability of feeding composition.
The COD removal during P2–P6 was on average 57.4%, 56.3%, 54.2%, 55.5% and 54.8%, respectively. And P2–P6 achieved average methane yields of 306.00, 300.59, 298.54, 298.90 and 301.13 mL/g COD, respectively. In P7, the COD removal and methane yield declined simultaneously due to system reductive environment destruction (Figure 2). As noted above, these results are consistent with those reported in literature, even on an industrial scale, it has been broadly demonstrated that the presence of limited amounts (not exceeding 15 mL in this study) of O2 in digesters does not negatively affect digestion performance [38,39].

3.1.3. H2S and O2 Concentration in Biogas

The H2S content in biogas produced in P1 (under anaerobic conditions) had a larger fluctuation range (Figure 4) and was on average 12504 ppmv (Table 2). In P2, RSI supplementation could drastically reduce the H2S content in biogas to achieve an average of 1933 ppmv, representing an overwhelming 84.5% reduction compared with P1. The result shows that RSI addition had a positive effect on both H2S control in biogas production. The commonly accepted mechanism of electron transfer from RSI to microorganisms is via microbial corrosion and surface oxidation of RSI. RSI was initially observed to be covered by a layer of rust on inner ZVI surface, and this rust consisted of different iron oxides (Fe2O3, Fe3O4, FeO, FeOOH) [40]. These oxides are understood to react with H+ (corrosion process), inducing the release of Fe(II) and Fe(III). When Fe(III) enters the liquid phase it is rapidly converted into Fe(II) by IRB [33,34]. Under anaerobic conditions, inner ZVI is oxidized to Fe(II), producing cathodic hydrogen (H2/[H]) via Equation (9) [41]. The corrosion process of iron oxide and ZVI exerts a beneficial effect on pH control for the digestion system. Subsequently, the produced Fe(II) by IRB can precipitate with sulfide by forming FeS (Equation (10)), which is the proposed mechanism through which RSI addition reduces H2S concentrations in biogas:
Fe0 + 2H2O → Fe2+ + H2 +2OH ΔG0’ = −5.02 kJ/mol
Fe2+ + S2− → FeS
Microaerobic conditions were applied in the following 5 periods (P3–P7) and gradually the O2 concentration was increased stepwise (Table 2). The result showed that the content of H2S in biogas was decreased with increasing of O2 dose, and, but naturally the O2 content in the resulting biogas was higher. Specifically, from P3 to P7, the average H2S concentration in biogas was 776, 484, 234, 75 and 68 ppmv, respectively, while O2 concentrations were on average 158, 759, 1230, 2083 and 8438 ppmv, respectively. It is worth noting that at even the highest micro-oxygenation level (P7), the surplus O2 content greatly increased by 305.1% compared with P6, while the biogas H2S content was almost equal to that in P6, indicating diminishing returns past this concentration. The considerable increase in biogas O2 concentration also accompanied by a decrease of methane production in P7 and decreased O2 consumption. Regarding the biogas H2S content, it hardly changed in comparison to P6, which could be related to two possibilities: (1) the biogas desulphurization took place predominantly in the gas-liquid interface [42]. Although sufficient O2 was supplied, it is hard to accommodate excessive SOB in this limited space due to the unavailability of H2S; (2) the precision of the gas analyzer to detect H2S could be also be limited at lower values. In P6, the average methane yield increased by 37.65% comparing with P1. What’s more, the H2S removal efficiency in biogas decreased by 99.40% in this case, and a concentration below 100 ppmv was reached, guaranteeing levels adequate for combined heat and power (CHP) (100–300 ppmv), which represents a major use of biogas, thus avoiding high costs associated with desulfurization.

3.2. Sulfur Balance

Microaeration had a significant and rapid effect on the sulfur distribution in reactor, as did RSI supplementation. All sulfur species (i.e., H2S, S2−, HS, S0, S2O32−, SO42−) exist in three states: solid, liquid and gas. The mass of all relevant species were measured and are summarized in Table 4, while 
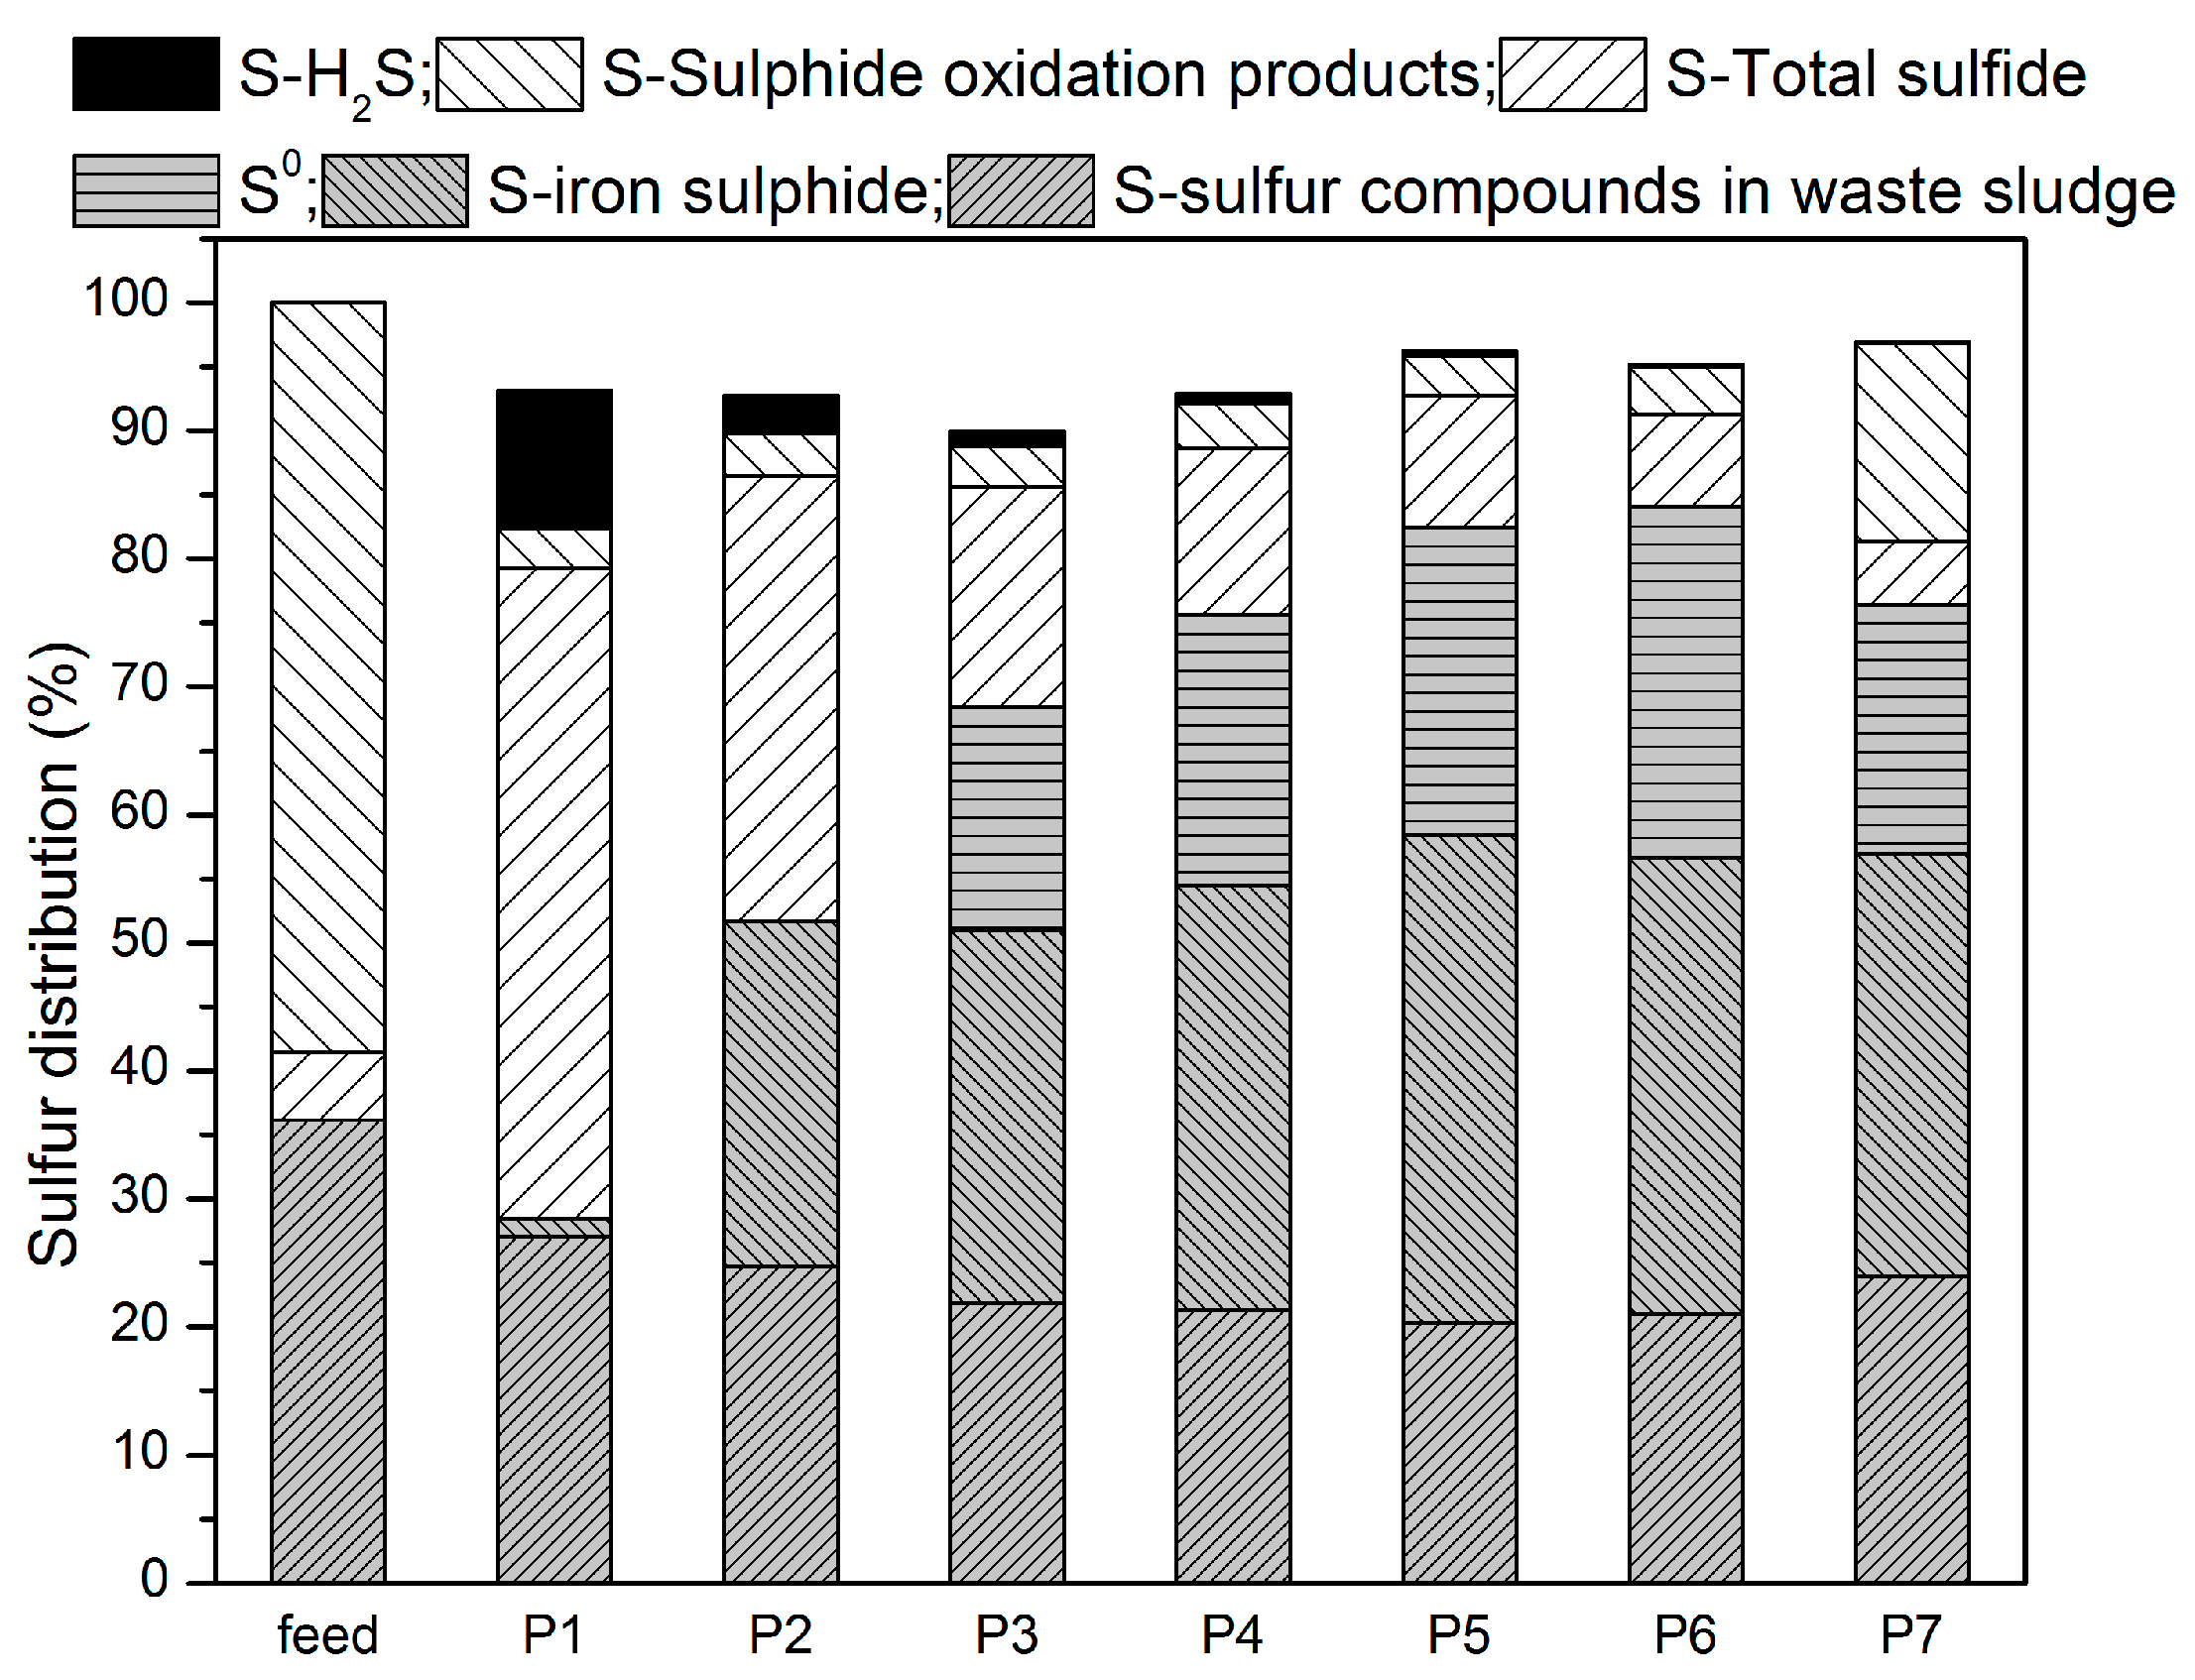
Figure 5 shows species distribution before and after the experiment.
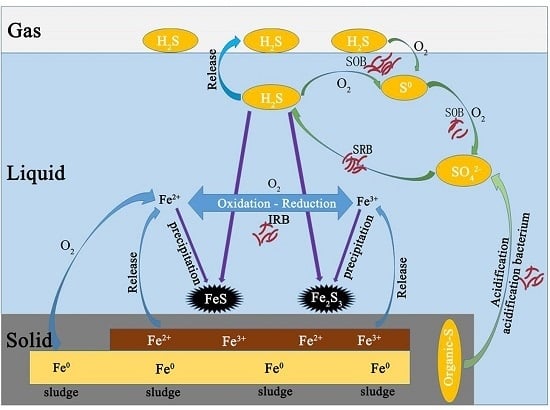
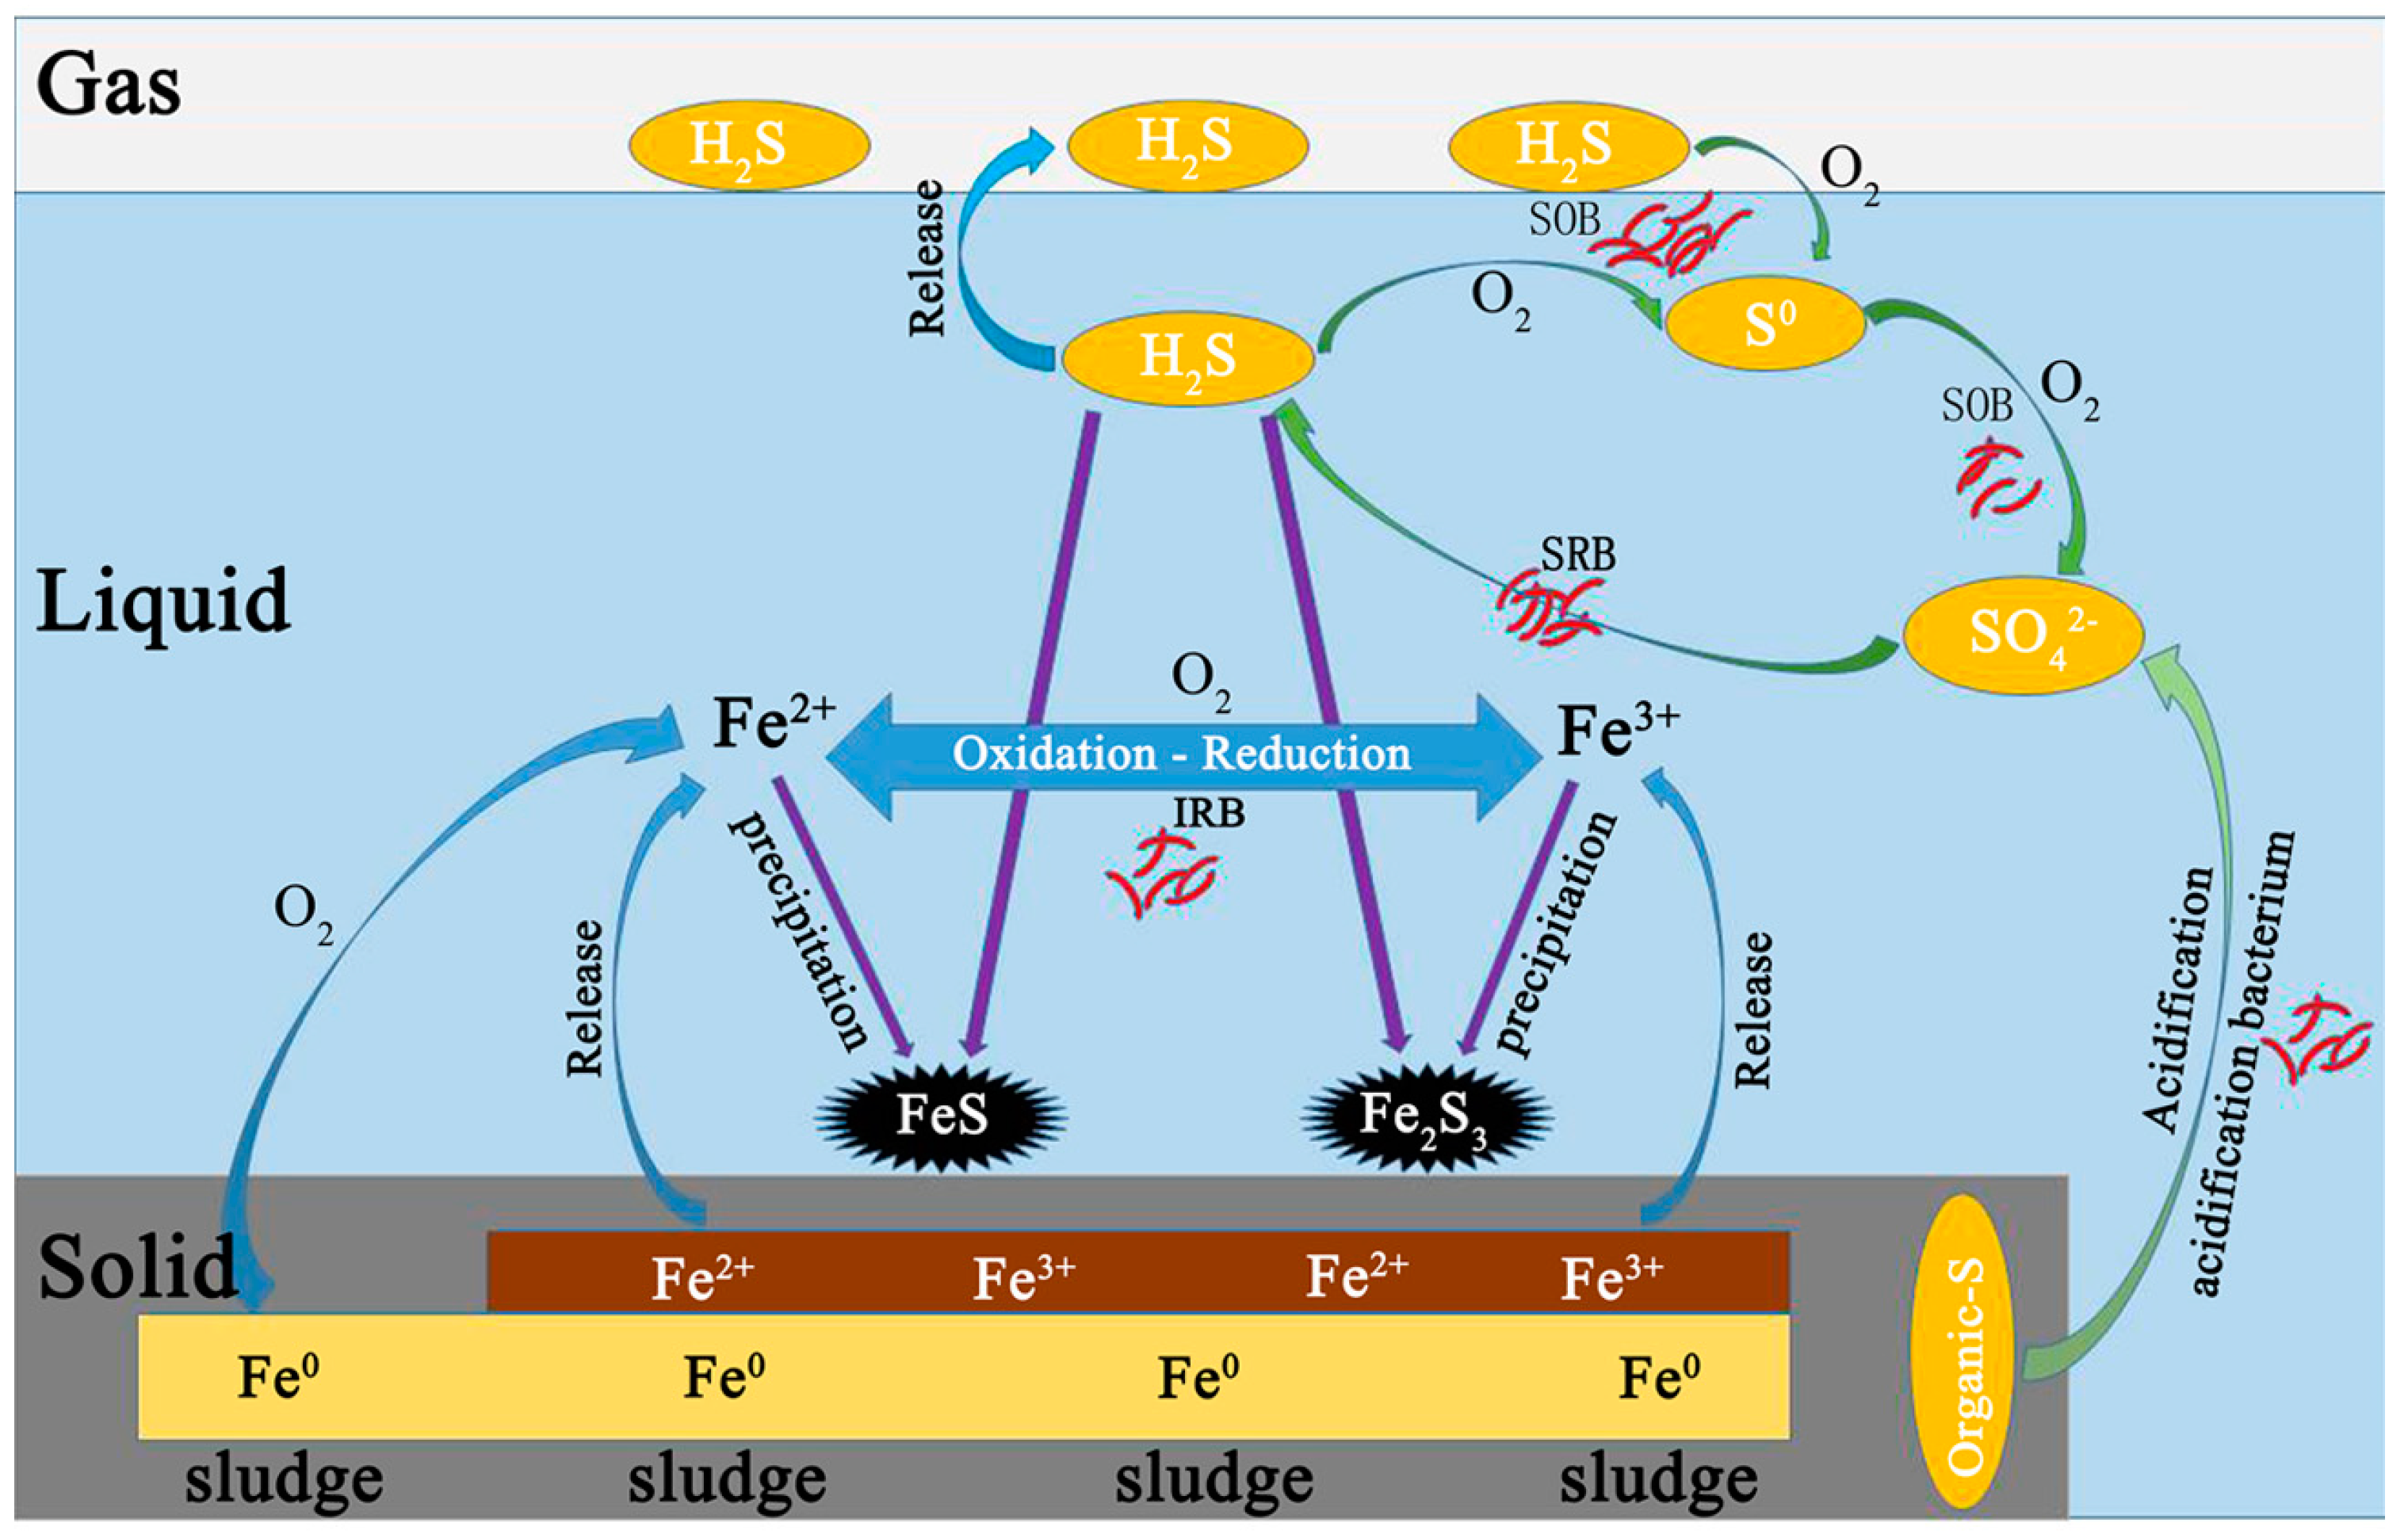
Before anaerobic and microaerobic digestion, the sulfur species in the digester included organic sulfur-containing compounds in the waste sludge and added sulfate. The dissolved sulfur compounds obtained from the waste sludge were mainly sulfate and sulfide, while the thiosulfate were negligible. After anaerobic/microaerobic digestion, six major streams of sulfur species in the digester were identified: (1) sulfur compounds in waste sludge; (2) iron sulphide precipitation; (3) elemental sulfur S0 (deposition in the headspace of the reactors); (4) sulfide in liquid phase; (5) sulphide oxidation products (S2O32−, SO42−); and (6) sulfur in biogas (as hydrogen sulfide).
The solid form of sulphur in this system mainly consisted of sulfur compounds in waste sludge, precipitated iron sulphide and elemental sulfur S0 (deposition in the headspace of the reactors). It can be seen that after anaerobic and microaerobic digestion, the amount of sulfur compounds in sludge decreased across all the periods, which resulted from the biological reduction of both sulfate and organic sulfur compounds by SRB. In P1, sulfur compounds in sludge decreased by 25.29%, while percent reduction of more than 40% was achieved in the later periods. Combining RSI with O2 can enhance cell lysis, which released more organic sulfur compounds which can be reduced to sulfide by SRB [43,44,45]. Only 1.44% of the sulfur dosed was present in the solid phase of the iron sulphide precipitation in P1, while over 26% was in P2 due to the addition of RSI. Starting from P3, supply of micro-oxygen promoted the generation of Fe(II) and Fe(III), which further increased the mass of iron sulphide precipitate, which ranged from 45 to 60 mg. In addition, oxygen can also directly to react with sulphide as an electron acceptor. Furthermore, sulfide was transformed into elemental sulfur through SOB activity as an electron donor. In P3 through P6, 26.94%, 32.70%, 37.24% and 42.39% of the sulfur dosed was transformed into elemental sulfur, respectively, while in P7 a 30.07% reduction was achieved. The possible reason could be that excess oxygen was supplied, leading to part of sulphide being oxidized to thiosulfate or sulphate [46].
The dissolved forms of sulphur in this system are mainly sulfide (S2−, HS, H2S) and sulphide oxidation products (S2O32−, SO42−). The sulfide detected in the liquid from P1 to P7 accounted for 50.82%, 34.81%, 17.18%, 13.02%, 10.30%, 7.25% and 4.89% of the sulfur dosed, respectively. Thus, the addition of RSI into the reactor decreased not only the concentration of hydrogen sulfide in biogas, but also the concentration of sulfide in the liquid, and combining limited amounts of O2 with RSI achieved this more effectively. During the first six periods, only negligible amounts (stabilized at around 5 mg) of sulphide oxidation products (S2O32−, SO42−), were found in the liquid. Díaz et al. [
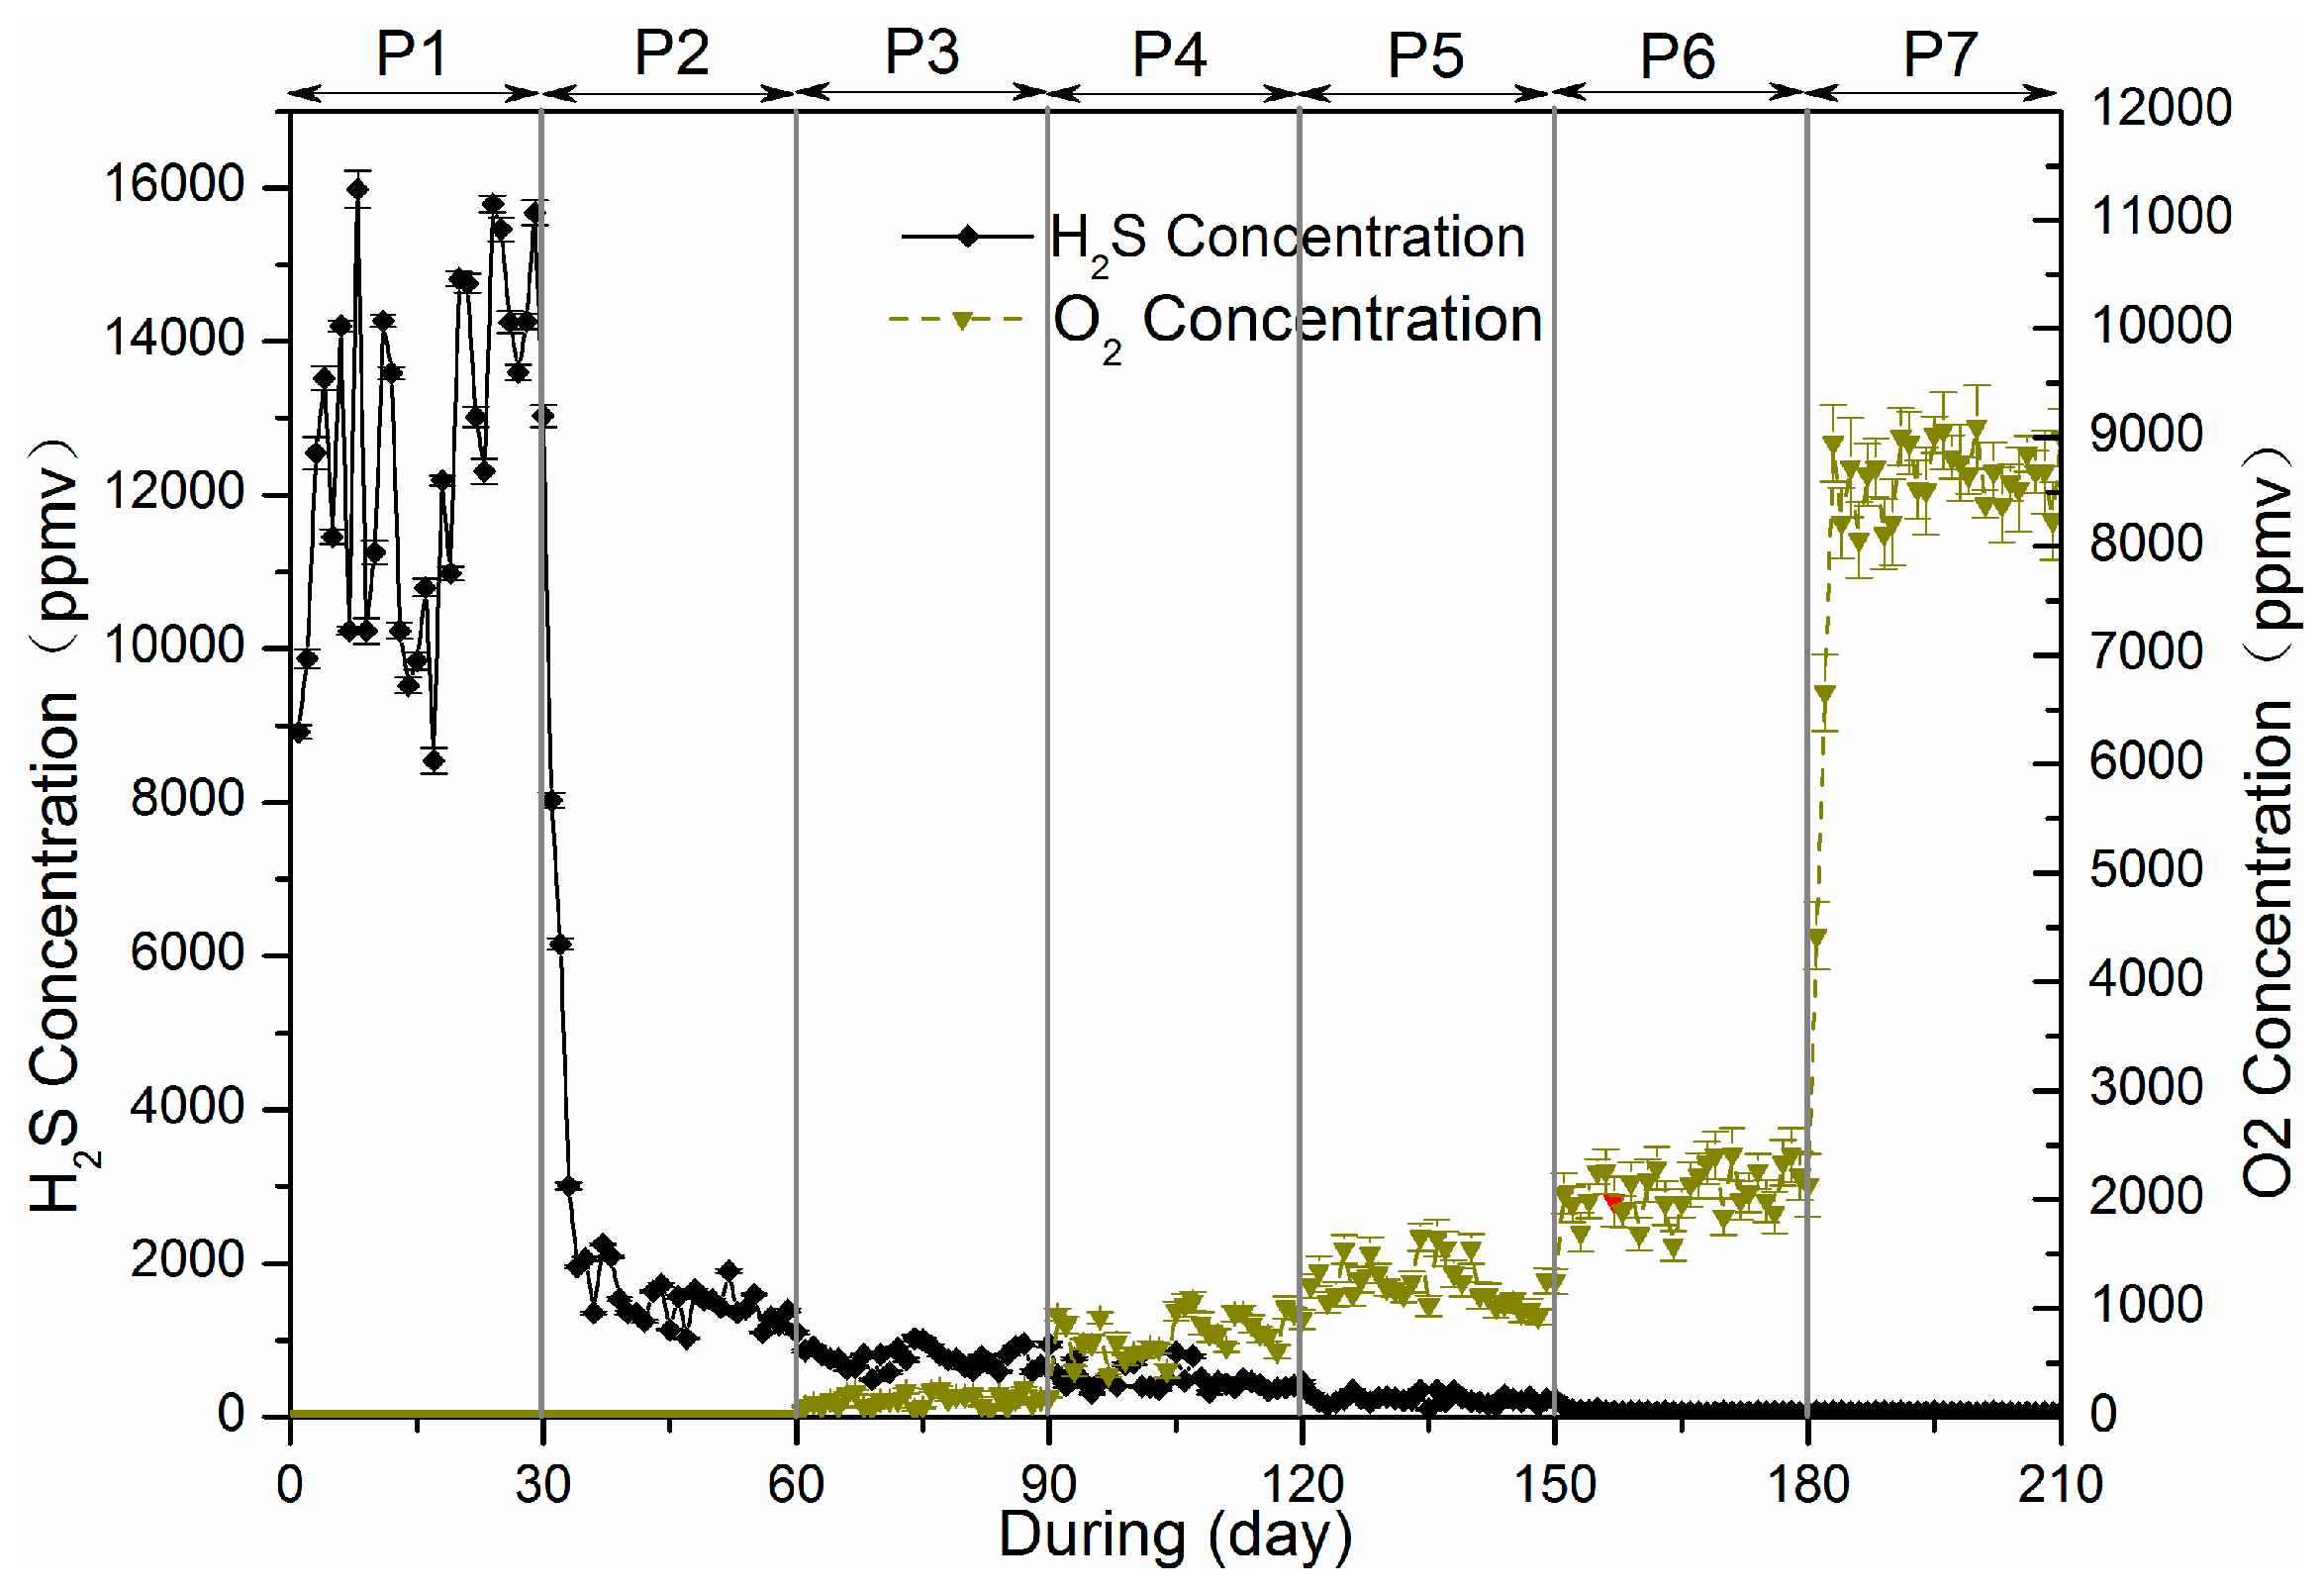
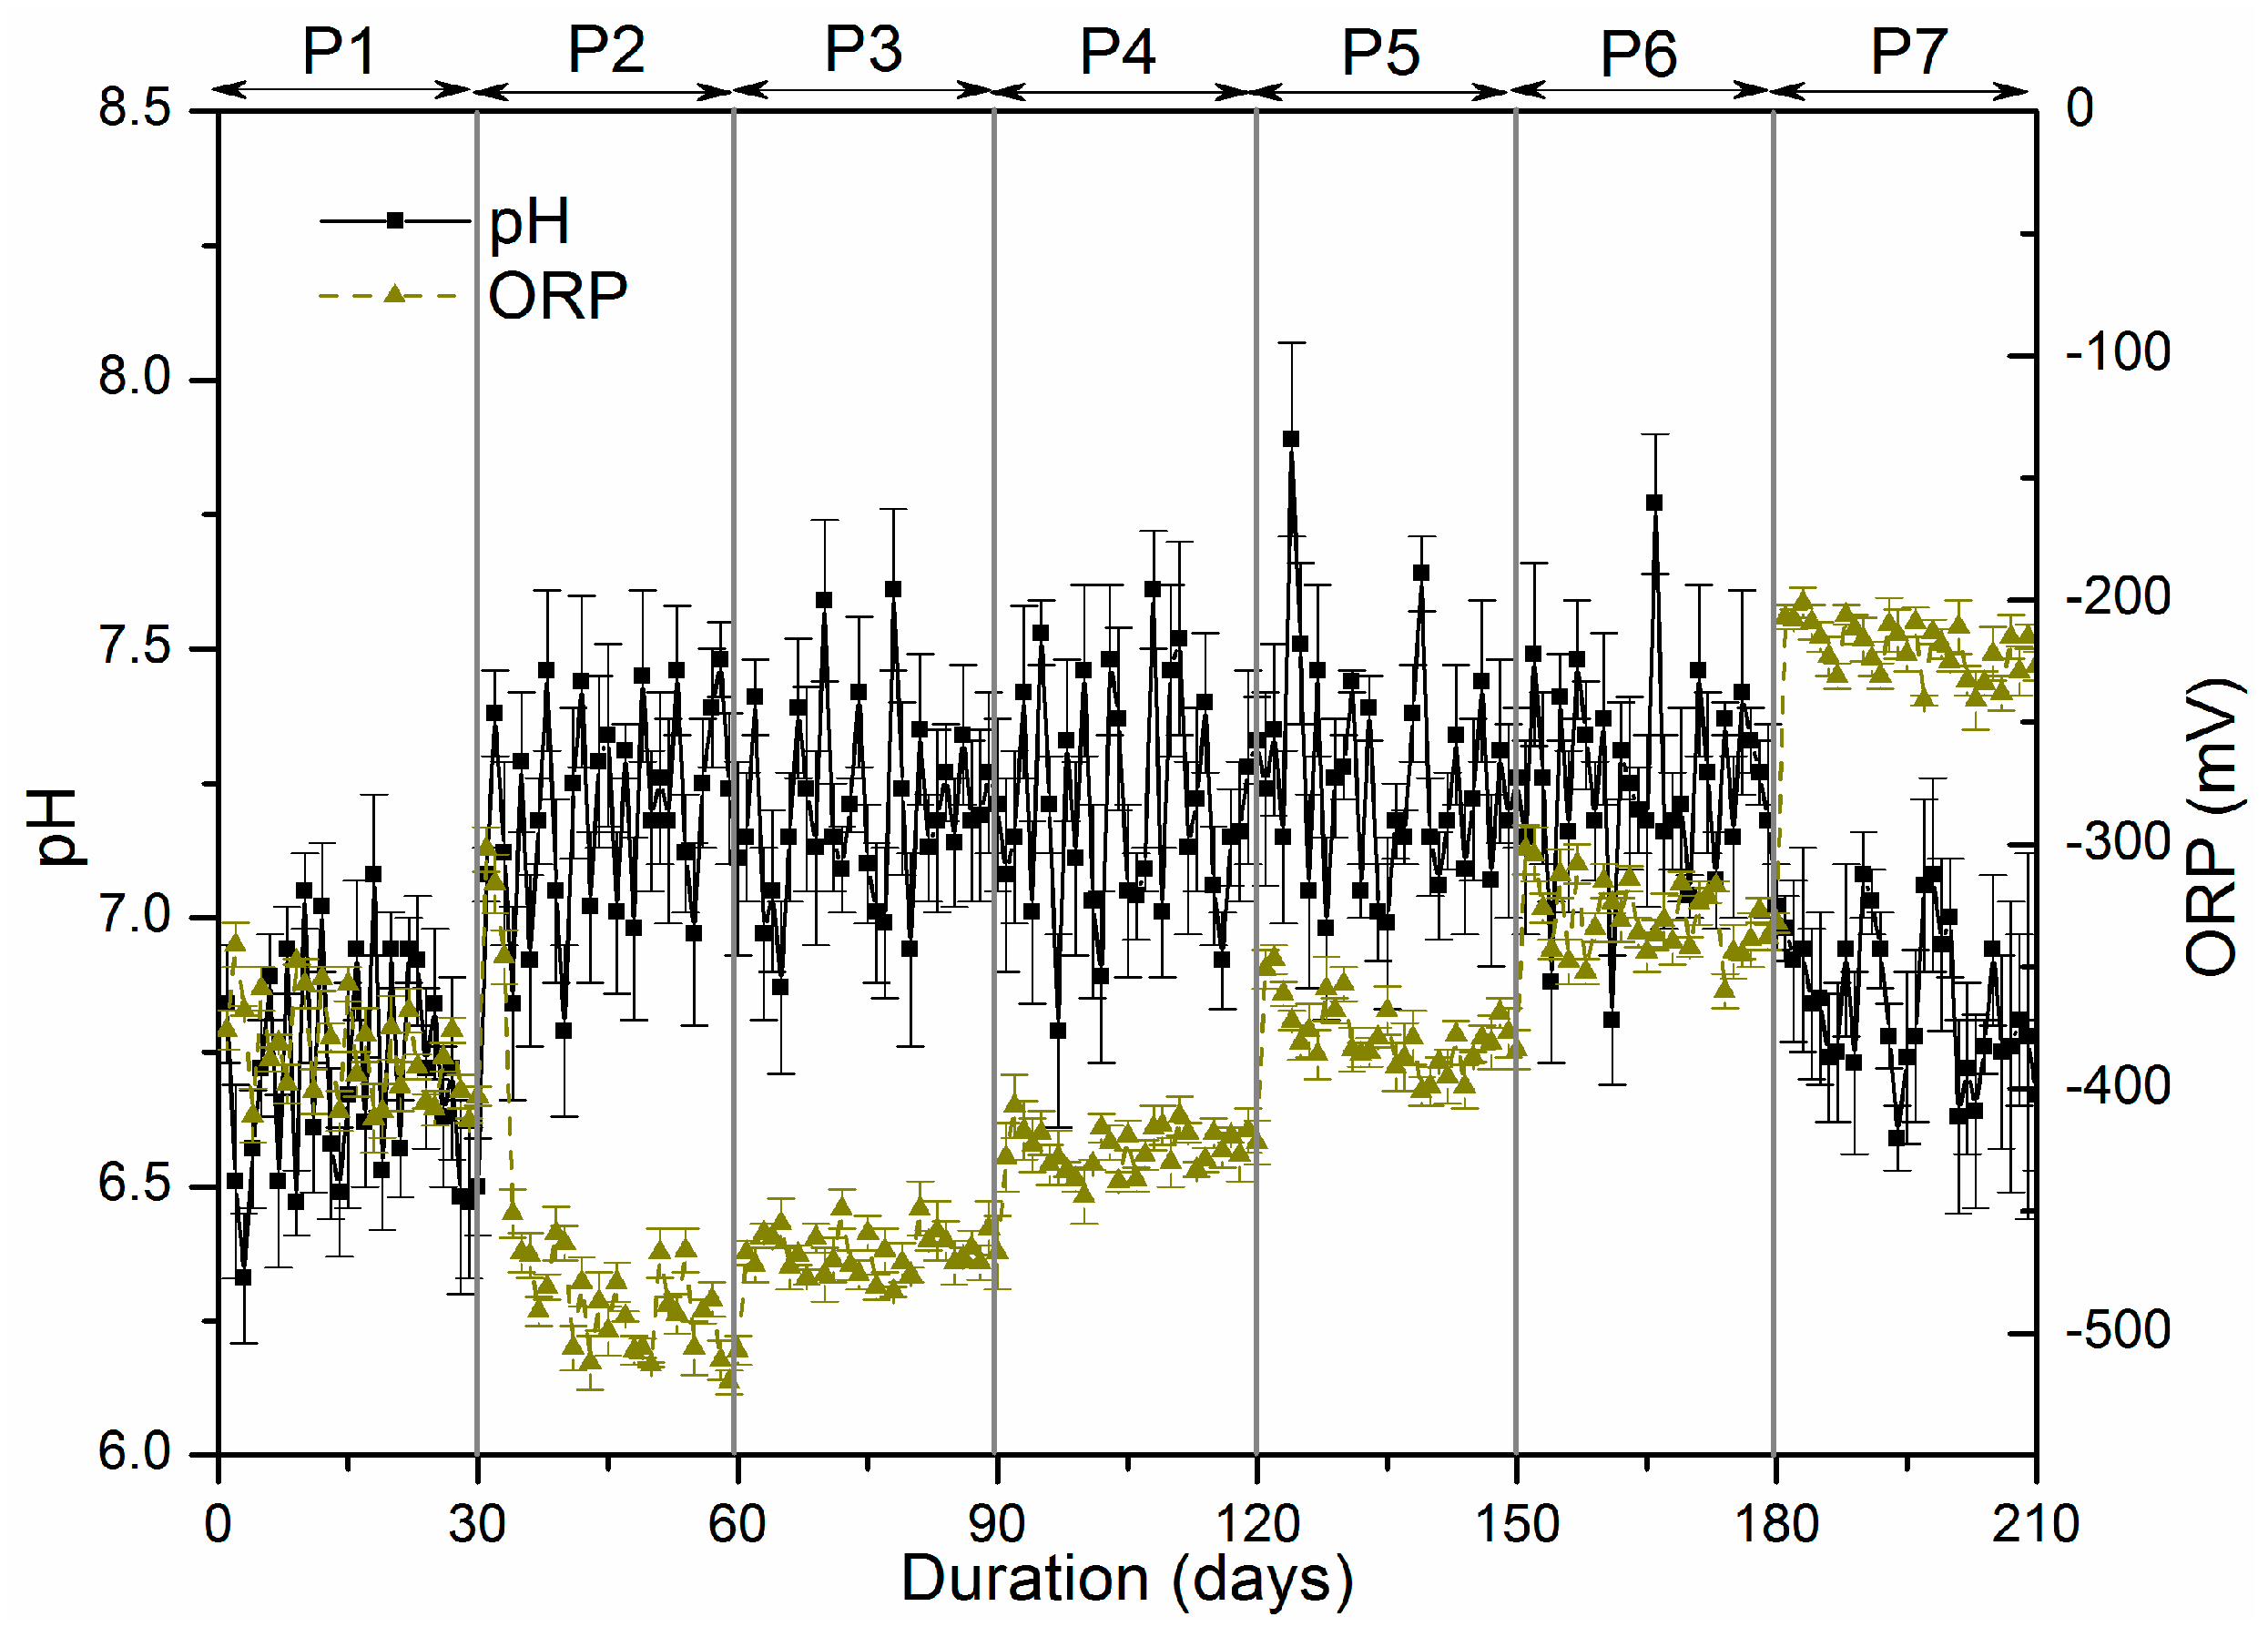
47] discovered that sulphate was found to be easily accessible for sulphate-reducing microorganisms, while organic sulphur in the form of proteins, or cell constituents, was only partly reduced, and a large portion left the bioreactor unchanged. However in P7, the amounts of sulphide oxidation products significantly improved to 23.97 mg. Indeed, the optimum ORP for methane reducing bacteria is below −230 mV while an ORP value above −280 mV is inhibitory to sulphate reducing bacteria [48,49]. In P7, the reactor ORP already exceeded the value (Figure 2).
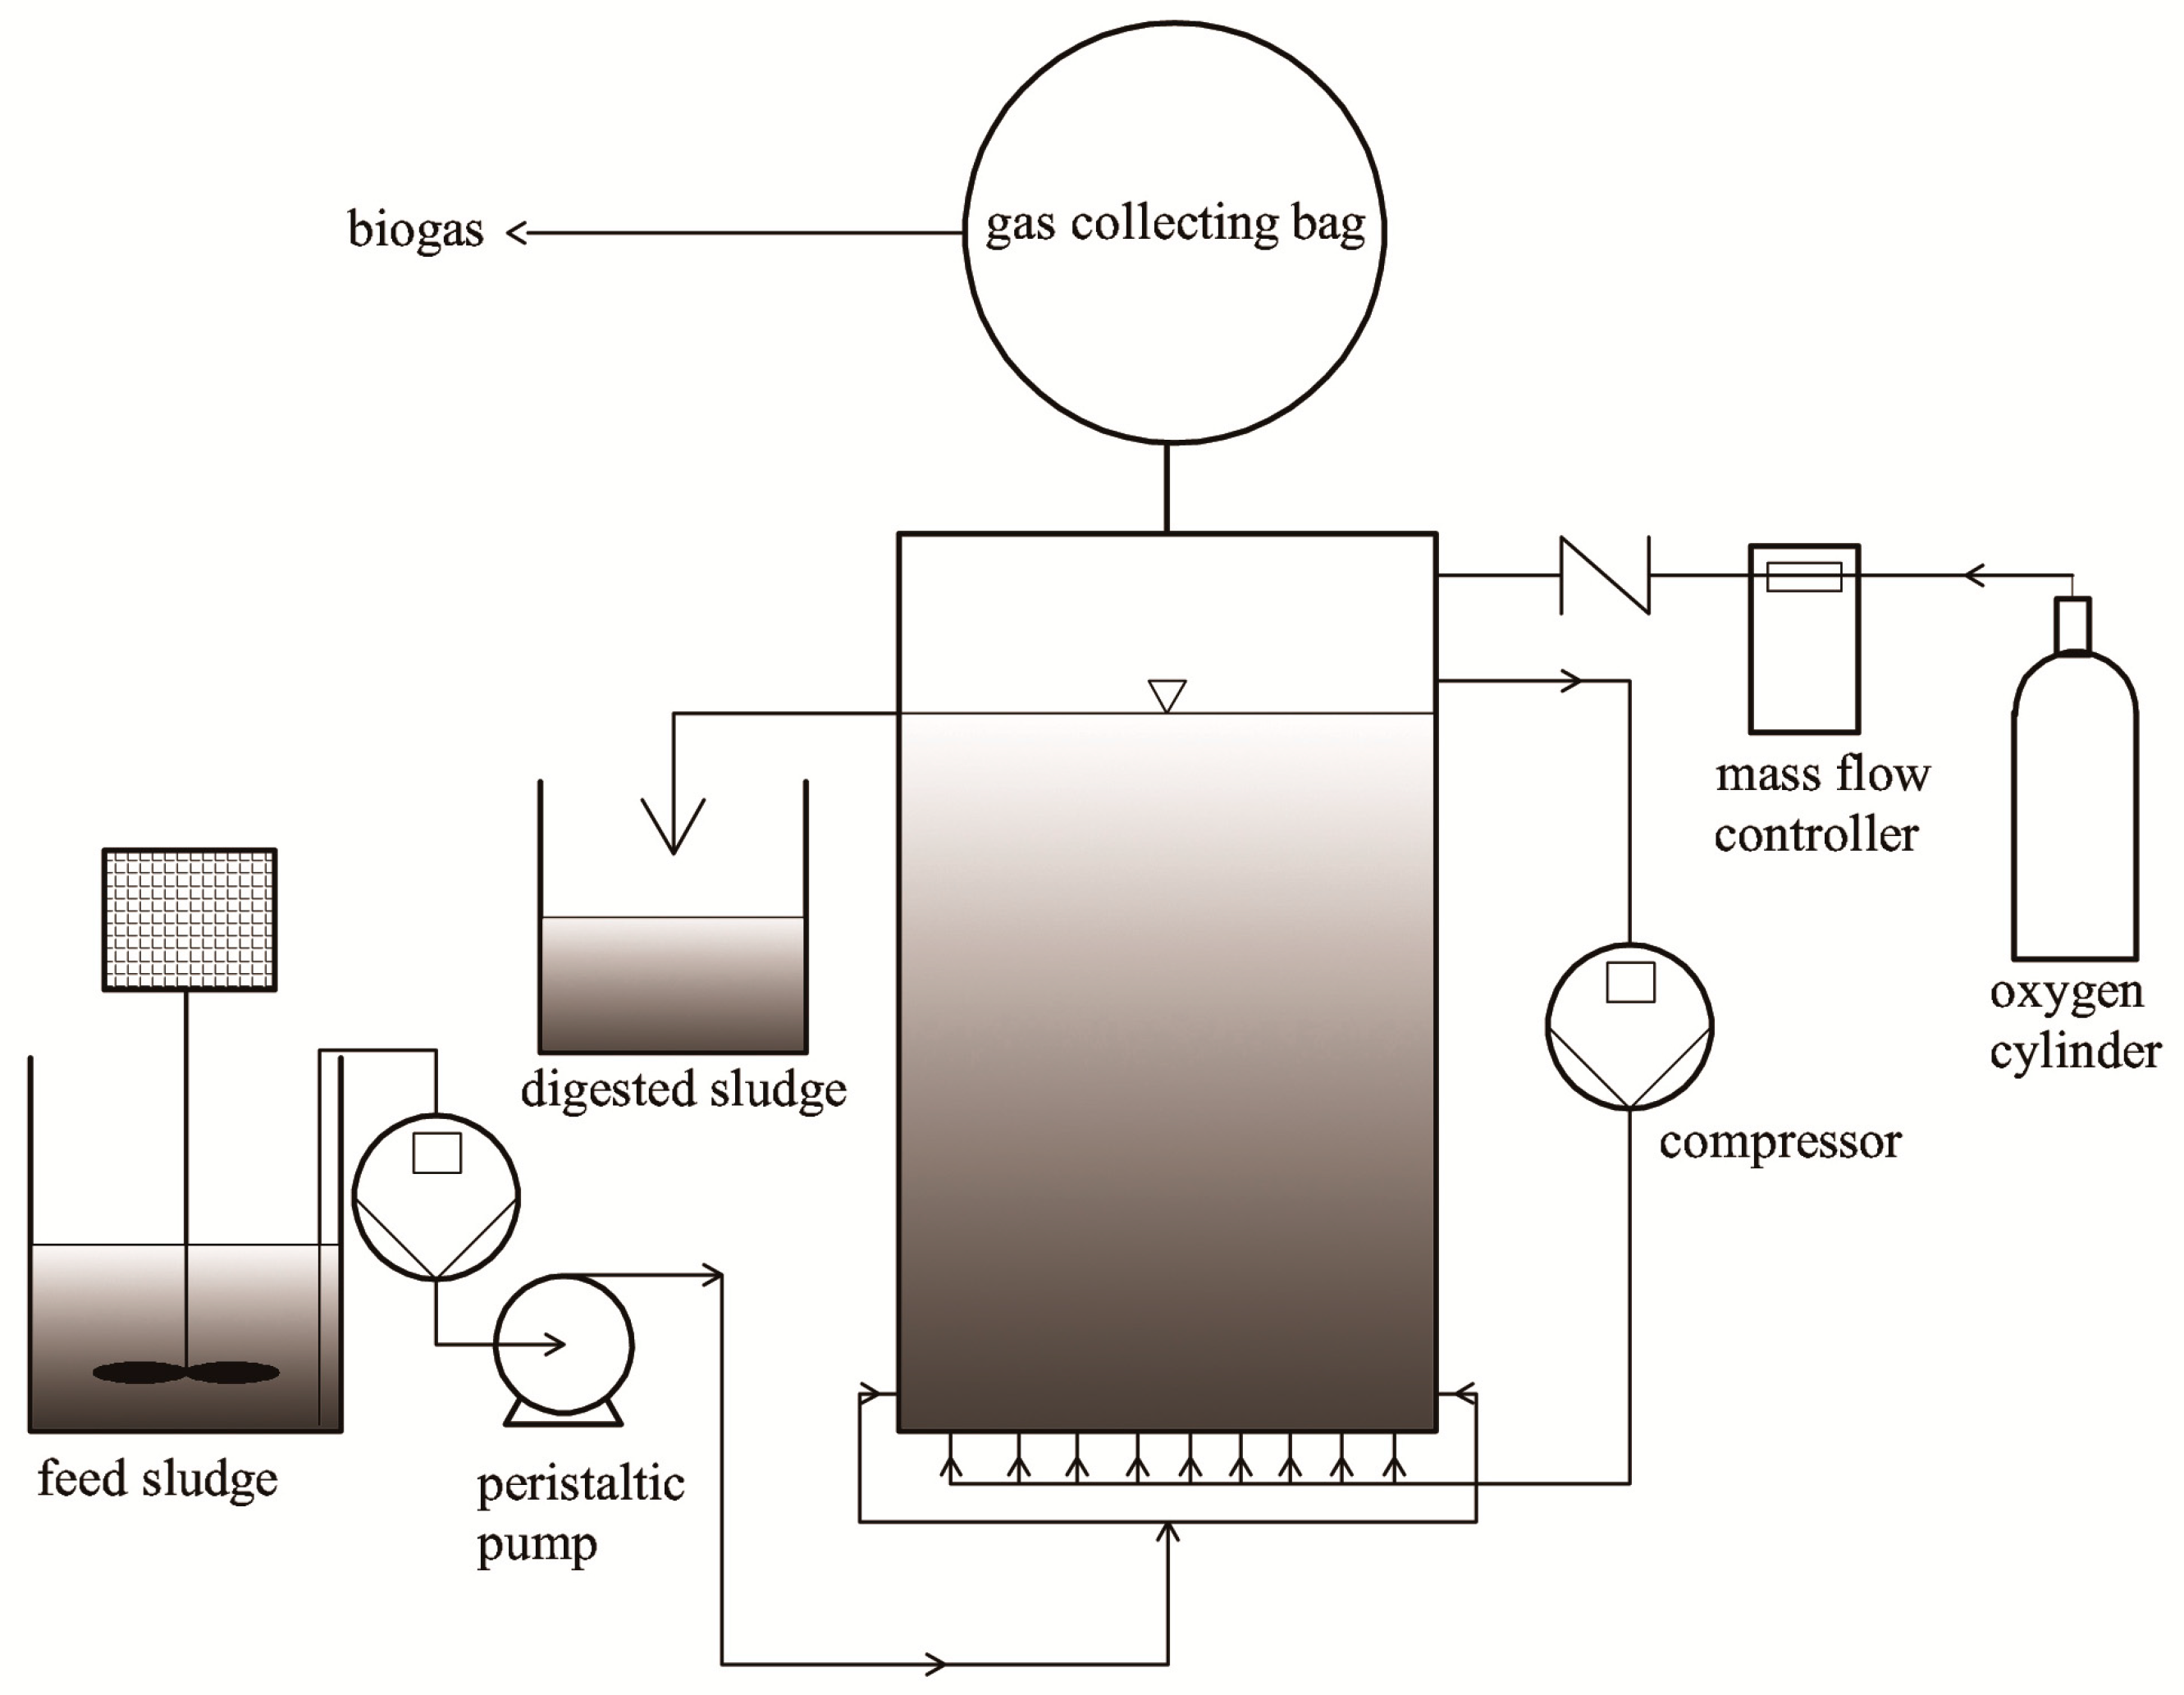
The gaseous form of sulphur in this system was mainly H2S. The digester was fed with 154.69 mg/day of sulphur, 10.82% was found in biogas during P1, while only 2.99% of sulfur was detected in biogas during P2 resulting from addition of RSI (Fe2+ + S2− → FeS). Starting from P3, O2 was added into the reactor to enhance the biogas desulphurization. A fraction of O2 acting electron acceptor directly reacting with sulphides, and another fraction of O2 corroded iron producing Fe(II) and Fe(III), which then also reacted with sulphide. Of all sulphur dosed into reactor, 2.99%, 1.18%, 0.71%, 0.36%, 0.21% and 0.11% was found in biogas respectively for P3, P4, P5, P6 and P7.
The outputs of sulphur accounted for 93.12%, 92.76%, 89.95%, 92.84%, 96.21%, 95.19% and 96.93% of inputs, respectively. This ‘lost’ sulphur, comparing inputs and outputs, was not analysed in this research. There are several possible explanations for this lack of sulphur in the balance. Firstly, sulphur emission in the biogas may not be limited to H2S but other possible S-containing gaseous forms emitted in the biogas but were not taken into account in our balance. These include dimethyl sulphide, carbon disulphide, mercaptans, etc. Secondly, total sulphur determination may have been biased by the high total dissolved sulphide content, which could have volatilized during the drying procedure before elemental analysis [50].

3.3. The Possible Control Mechanism of H2S in Biogas

Based on previous studies and the results obtained in this study, the possible control mechanism of H2S in biogas by the couple of RSI with micro-oxygen can be proposed, as shown in Figure 6. These biotic/abiotic factors all eventually led to the observed decrease in biogas H2S content. O2 addition induced the microbial oxidation of sulphide by stimulating SOB and chemical corrosion of iron, which promoted the release of Fe(II) and Fe(III). They combined with sulphide and formed deposits of FeS and Fe2S3, which will decrease the sulphide concentration in the liquid. And part of oxygen was used as electron acceptor to oxidize sulphide existed in the liquid through the action of SOB. According to the law of gas solubility (Henry’s Lay), the lowered sulphide concentration in the liquid would decrease the amount of H2S coming out of the liquid. Of course, neither pathway excludes the other, such as the H2S near the top of gas-liquid interface also can be oxidized through the action of SOB. This work builds solid support for the potential applicability of RSI for WAS digestion and provides an additional route for enhancing biogas desulphurization accompanied with micro-oxygen.

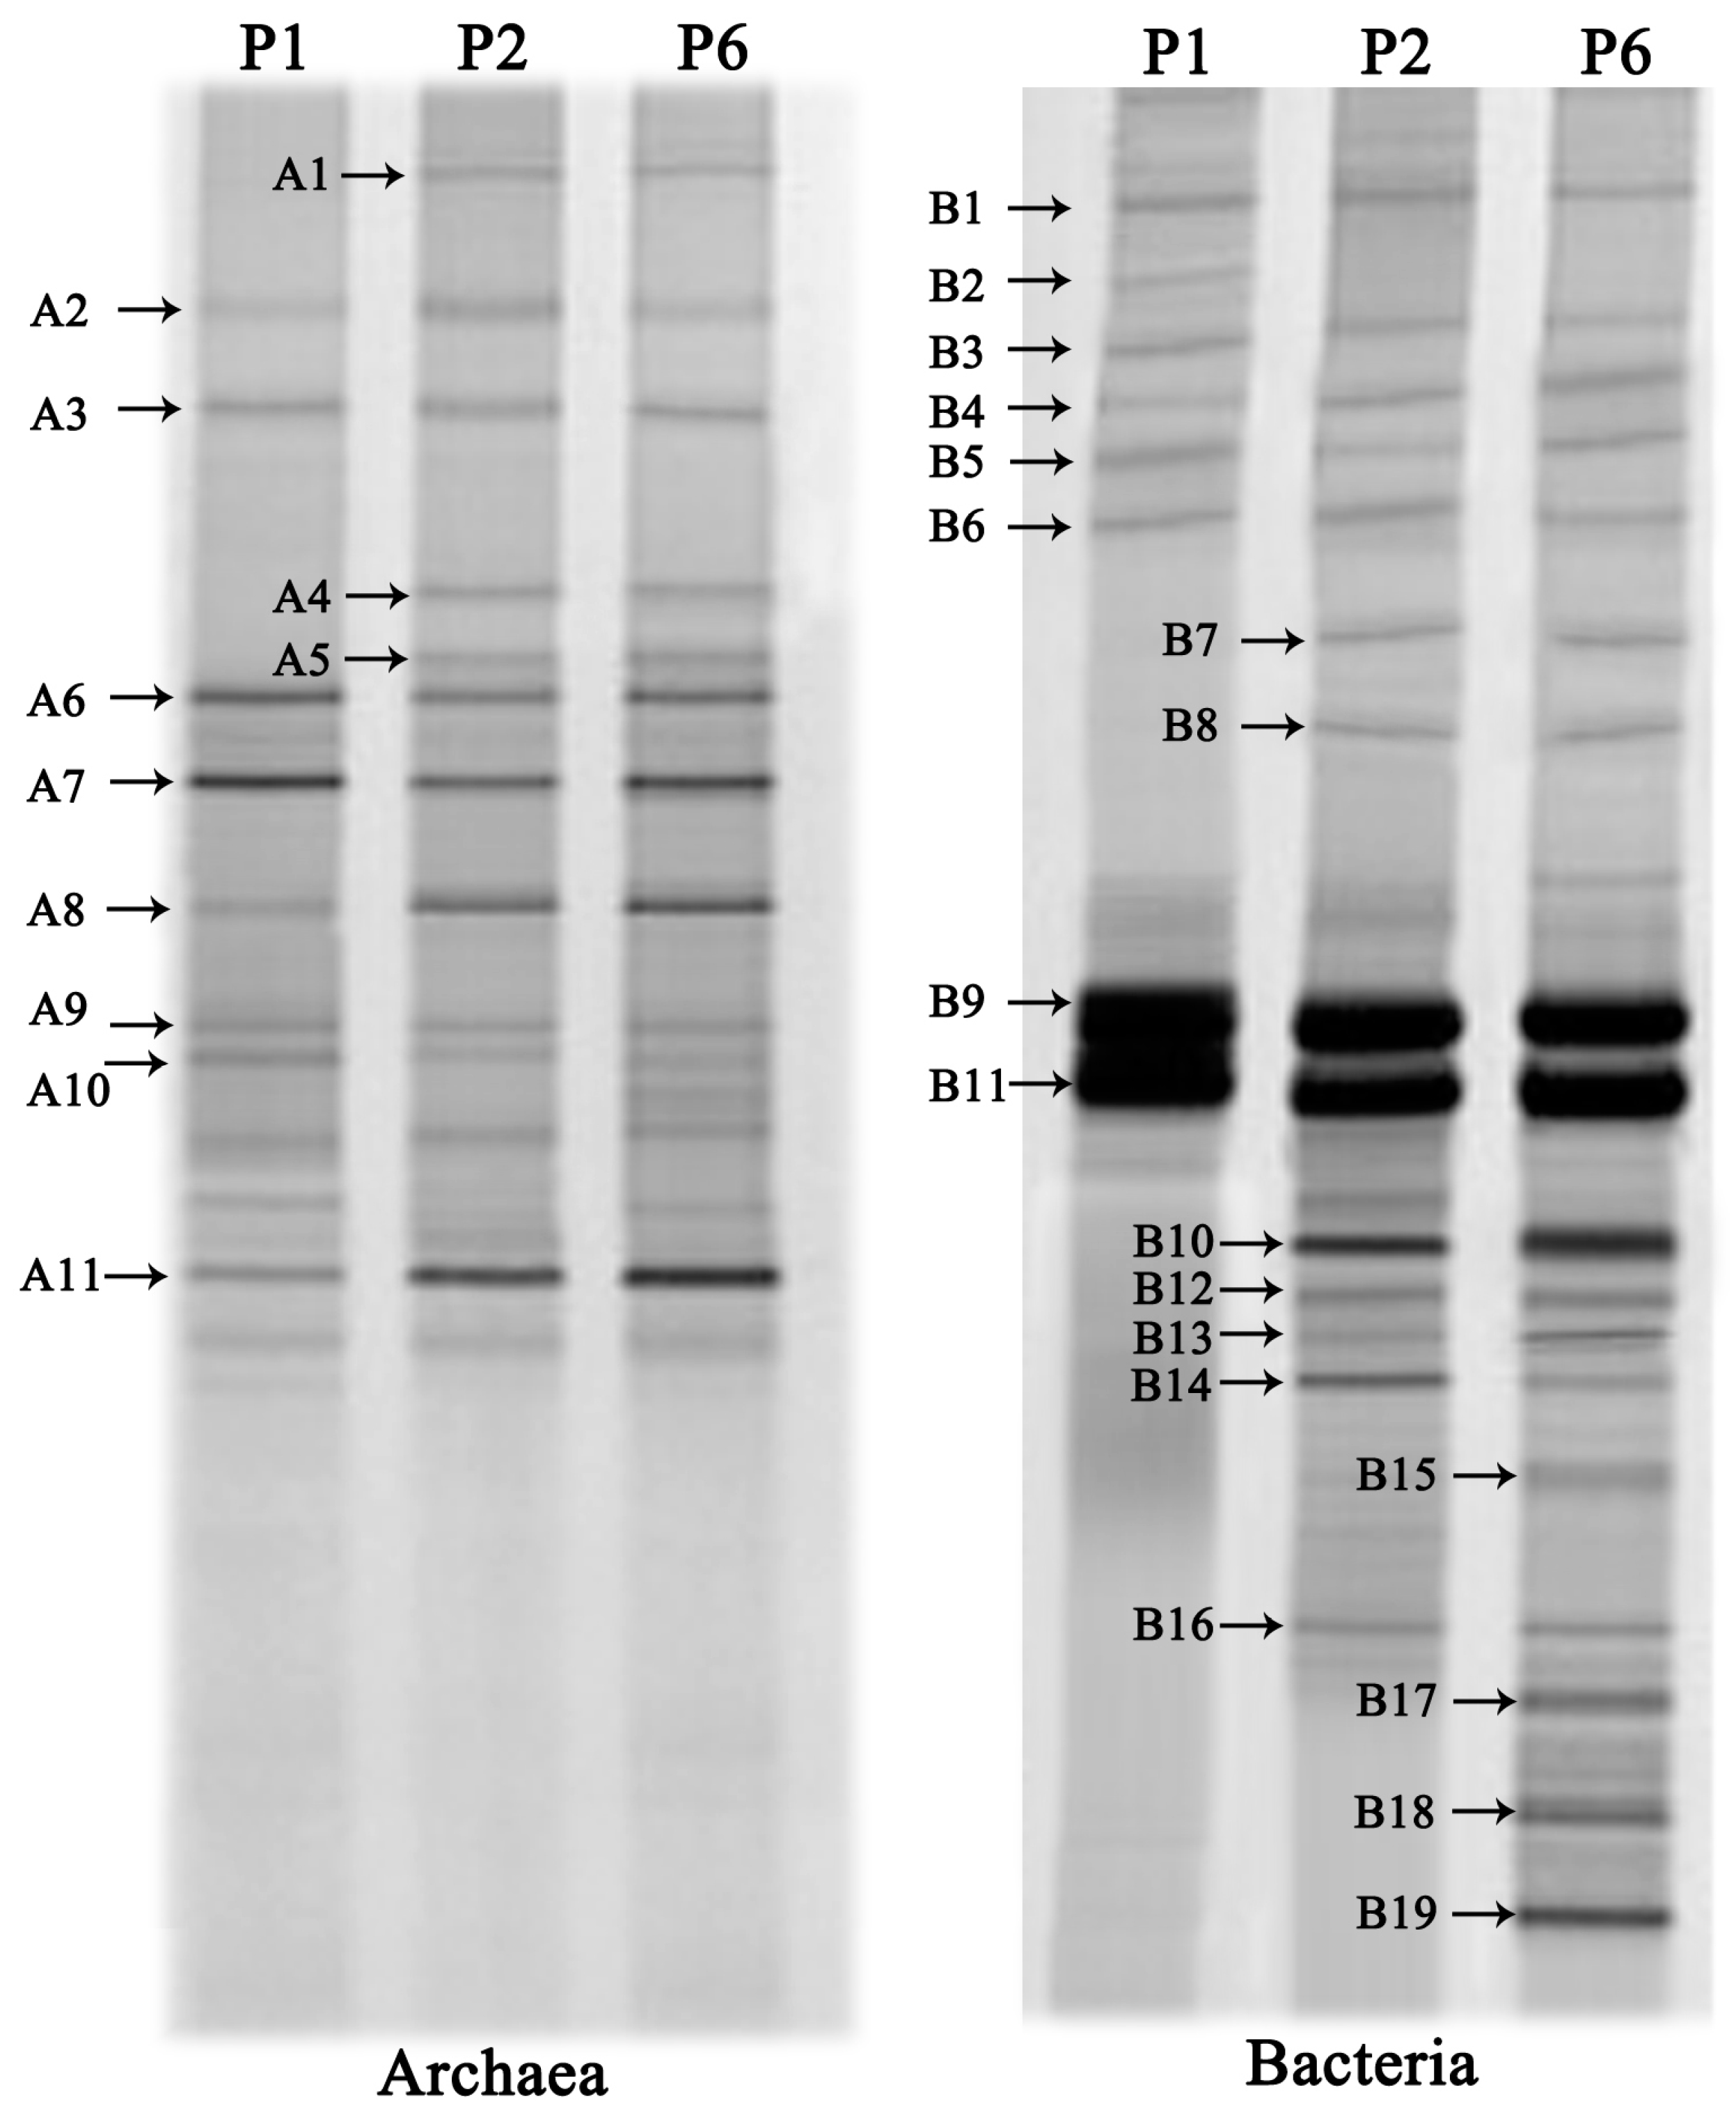
3.4. DGGE Analysis of the Microbial Communities

Archaea and bacterial community structure after the anaerobic digestion was studied by the DGGE analysis of PCR amplified 16S rRNA gene fragments (Figure 7). Representative bands were selected from the DGGE gel for sequencing in order to identify the species presented in the digester and the results are shown in Table 5. A total of 11 and 19 discernible DGGE bands were respectively observed in the two DGGE profiles for archaea and bacteria.
In this study, the archaea species could be divided into two different classes: Methanomicrobia (band A1–A10), and Methanococci (band A11). This result revealed that Methanomicrobia species were the prevalent methanogens in the archaeal community. Most species were highly coupled with aceticlastic methanogens (band A8–A11) and hydrogenotrophic methanogens (band A1–A7). With RIS addition, the diversity of methanogens was enhanced, particularly hydrogenotrophic methanogens. Band A1, A4 and A5 detected in P2 and P6 only, were closely related to Methanoculleus palmolei, Methanolinea tarda and Methanosarcina mazei, hydrogenotrophic. [51]. Given the band intensity, the aceticlastic methanogens populations corresponding to band A8–A11 likely formed the dominant methanogen group in all periods. The band intensity of A8 and A11 were enhanced obviously (Figure 7). In P6, the diversity of methanogens didn’t decreased in the reactor. Therefore, micro-oxygenation did not seem to cause a harmful impact on the archaeal diversity.
Bands B1 and B2 were most closely related to Methylovirgula ligni and Methylocella silvestris, respectively. These two species were known as facultative methanotrophs that could attenuate methane emissions [52]. Both microorganisms were found in P1, while only Methylovirgula ligni was found in P2 and P6, which indicated that addition of RSI could remove Methylocella silvestris to weak the consumption of methane biologically [5]. Some detected microorganisms are capable of degrading complex organic matters to form organic acid, i.e., bands B3 (Uncultured bacterium), B4 (Sphingopyxis witflariensis), B5 (Novosphingobium indicum), B6 (Clostridium orbiscindens), B7 (Clostridium populeti) and B8 (Caloramator proteoclasticus). Band B7 was an anaerobic cellulolytic microorganism and band B8 had strong ability to degrade proteins and amino acids [53]. These two microorganisms have been found in P2 and P6 indicating that iron can enhance the ability of cellulose and protein hydrolysis.
Hydrogen-producing bacteria and acetobacteria may play important roles in anaerobic fermentation since hydrogen and acetate can be directly utilized by methanogenesis [54]. Band 9 was closest to Clostridium species belonging to the H2-producing bacteria, which had been found in the three periods. Syntrophobacter fumaroxidans (band 10) was enriched in the digester with the RSI (P2 and P6) which was capable of producing both hydrogen and formate by propionate oxidation. Band B11, B12 and B13 showed high sequence similarity to acetobacteria, belonging to Acetobacter tropicalis, Roseomonas lacus and Sporomusa silvacetica, respectively. Acetobacter tropicalis had been found in the three periods but the other two microorganisms were only generated in P2 and P6 indicating that the iron enhanced the diversity of acetobacteria in the digesters so as to increase acetate production.
Band B14, only found in P6, showed high sequence similarity to Geobacter bemidjiensis Bem which had the ability to reduce Fe(III) and oxidize acetate and other multi-carbon organic substrates to carbon dioxide [55]. IRB was only found in the digester with RSI (P2 and P6), which further proved that RSI could enrich IRB to enhance degradation of complex substrates, which contributed higher sludge reduction. Band B15 and B16 showed high sequence similarity to Acidimicrobium ferrooxidans and Ferrimicrobium acidiphilum, respectively, which had the ability to oxidize Fe(II) [56]. Both of them were found in P6, while only band B16 was found in P2. It could be because O2 supplementation improved the Fe(II) releasing rate and enhanced the diversity of Iron-Oxidizing Bacteria.
In this study, SOB microoganisms were only found in P6. The bands B17, B18 and B19 affiliated to the Epsilonproteobacteria class, Epsilonproteobacteria class and Gammaproteobacteria class were assigned to the Uncultured Arcobacter species, Uncultured Epsilonproteobacterium and Uncultured Acinetobacter species (Table 5), which are capable of oxidizing sulphide. Band B17 was found in the headspace of microaerobic digesters treating sewage sludge [57]. Band B18 was described by Kodama and Watanabe [58] as a chemolithoautotrophic SOB capable of oxidizing H2S, S0 and S2O32− under microaerobic conditions. And band B19 was partially responsible for H2S removal in the bioscrubber system developed by Potivichayanon et al. [59].

3.5. Economic Analysis

The economic assessment mainly included the consumption of RSI, sodium hydroxide, hydrochloric acid and oxygen in this study while the operational costs were not considered as they were the same for all the anaerobic digestion experiment. The consumption of additional materials as well as their price during the sixth period which was the optimal condition was shown in Table 6. It can be calculated that the total cost in sixth period is 0.11$. Considering the average biogas production rate and average methane content in biogas (Table 2 and Table 3), the increment of methane enhancement can be calculated as follows: ΔV(mL CH4) = 1.591 × 30 × 64.9% − 0.937 × 30 × 55.8% = 15.29 L. Currently, the market price of methane is about $0.015/L. It meant that a profit of about $0.23 could be obtained when the sludge digestion were operating under the optimal condition, more than two folds of its cost. Besides, the RSI added in each period could be reused in real applicability for about 10 periods which can further reduce the cost.
Therefore, it is economical and applicable to employ RSI and micro-oxygen technology to enhance the methane production during sludge digestion which could simultaneously dispose the sludge and recover energy effectively.

4. Conclusions and Outlook

The combination of microaerobic desulphurization with RIS amendment during waste activated sludge digestion was investigated to develop a cost-effective and environment-friendly technology for H2S removal and energy recovery. The optimal condition is combining a dosage of 20 g/L RSI with supply of 15 mL O2 (9.43 NLoxygen/Nm3 biogas) to the digestion system. In this case, the negative influence of micro-oxygen on digestion performance was found to be negligible. DGGE analysis revealed that the relatively high transfer rate of O2 to the liquid maintained by biogas recirculation caused an apparent change in the structure and a considerable increase in the richness of the microbial communities in the long run. An average methane yield of 301.13 mL/g COD was reached and biogas H2S content remained steady below 100 ppmv. Under optimal dosing conditions, H2S content in the biogas could fulfill the quality standards required for subsequent application of the produced biogas and obviating the need for any desulphurization processes. Next, relevant research on how to put the technique into practice in a large-scale digester for simultaneous controlling biogas H2S concentration and improving digestion performance with low cost and high efficiency should be done. If this technology could be developed as a mature and widely used technology, it could be adopted to treat high sulfur-containing wastewater.

Acknowledgments

The authors would like to thank Oleyiblo Oloche James grammar guidance during the preparation of this paper. This work was supported financially by the National Water Pollution Control and Treatment Science and Technology Major Project (No. 2014ZX07305-002-02).

Author Contributions

Jiashun Cao (corresponding author) conceived the experiment and obtained the financial support; Renjun Ruan (first author), Di Zheng (co-author), Jingyang Luo (co-author) performed and designed the experimental study; Renjun Ruan and Chao Li (co-author) analyzed the experimental data; Renjun Ruan wrote the paper. Jingyang Luo (co-author) provides a lot of useful guidances and constructive suggestions in later the improvement of revised manuscript.

Conflicts of Interest

The authors declare no conflict of interest.

References

  1. Zhang, C.; Su, H.; Baeyens, J.; Tan, T. Reviewing the anaerobic digestion of food waste for biogas production. Renew. Sustain. Energy Rev. 2014, 38, 383–392. [Google Scholar] [CrossRef]
  2. Agostini, A.; Battini, F.; Giuntoli, J.; Tabaglio, V.; Padella, M.; Baxter, D.; Marelli, L.; Amaducci, S. Environmentally sustainable biogas? The key role of manure co-digestion with energy crops. Energies 2015, 8, 5234–5265. [Google Scholar] [CrossRef] [Green Version]
  3. Dai, X.H.; Li, X.S.; Zhang, D.; Chen, Y.G.; Dai, L.L. Simultaneous enhancement of methane production and methane content in biogas from waste activated sludge and perennial ryegrass anaerobic co-digestion: The effects of pH and C/N ratio. Bioresour. Technol. 2016, 216, 323–330. [Google Scholar] [CrossRef] [PubMed]
  4. Chen, Y.L.; Rößler, B.; Zielonka, S.; Wonneberger, A.M.; Lemmer, A. Effects of organic loading rate on the performance of a pressurized anaerobic filter in two-phase anaerobic digestion. Energies 2014, 7, 736–750. [Google Scholar] [CrossRef]
  5. Dunfield, P.F.; Khmelenina, V.N.; Suzina, N.E.; Trotsenko, Y.A.; Dedysh, S.N. Methylocella silvestris sp. nov., a novel methanotroph isolated from an acidic forest cambisol. Int. J. Syst. Evol. Microbiol. 2003, 53, 1231–1239. [Google Scholar] [CrossRef] [PubMed]
  6. Appels, L.; Baeyens, J.; Degrève, J.; Dewil, R. Principles and potential of the anaerobic digestion of waste-activated sludge. Prog. Energy. Combust. Sci. 2008, 34, 755–781. [Google Scholar] [CrossRef]
  7. Imbierowicz, M.; Chacuk, A. Kinetic model of excess activated sludge thermohydrolysis. Water Res. 2012, 46, 5747–5755. [Google Scholar] [CrossRef] [PubMed]
  8. Ibeid, S.; Elektorowicz, M.; Oleszkiewicz, J. Modification of activated sludge properties caused by application of continuous and intermittent current. Water Res. 2013, 47, 903–910. [Google Scholar] [CrossRef] [PubMed]
  9. Nah, I.W.; Kang, Y.W.; Hwang, K.Y.; Song, W.K. Mechanical pretreatment of waste activated sludge for anaerobic digestion process. Water Res. 2000, 34, 2362–2368. [Google Scholar] [CrossRef]
  10. Wu, D.L.; Shen, Y.H.; Ding, A.Q.; Mahmood, Q.; Liu, S.; Tu, Q.P. Effects of nanoscale zero-valent iron particles on biological nitrogen and phosphorus removal and microorganisms in activated sludge. J. Hazard. Mater. 2013, 262, 649–655. [Google Scholar] [CrossRef] [PubMed]
  11. Suanon, F.; Sun, Q.; Li, M.Y.; Cai, X.; Zhang, Y.C.; Yan, Y.J.; Yu, C.P. Application of nanoscale zero valent iron and iron powder during sludge anaerobic digestion: Impact on methane yield and pharmaceutical and personal care products degradation. J. Hazard. Mater. 2016, 321, 47–53. [Google Scholar] [CrossRef] [PubMed]
  12. Liu, Y.; Zhang, Y.; Quan, X.; Li, Y.; Zhao, Z.; Meng, X.; Chen, S. Optimization of anaerobic acidogenesis by adding Fe0 powder to enhance anaerobic wastewater treatment. Chem. Eng. J. 2012, 192, 179–185. [Google Scholar] [CrossRef]
  13. Rasi, S.; Läntelä, J.; Rintala, J. Trace compounds affecting biogas energy utilization-a review. Energy Convers. Manag. 2011, 52, 3369–3375. [Google Scholar] [CrossRef]
  14. Yang, S.; Tang, Y.; Gou, M.; Jiang, X. Effect of sulfate addition on methane production and sulfate reduction in a mesophilic acetatefed anaerobic reactor. Appl. Microbiol. Biotechnol. 2015, 99, 3269–3277. [Google Scholar] [CrossRef] [PubMed]
  15. Lar, J.S.; Li, X. Removal of H2S during anaerobic bioconversion of dairy manure. Chin. J. Chem. Eng. 2009, 17, 273–277. [Google Scholar] [CrossRef]
  16. Syed, M.; Soreanu, G.; Faletta, P.; Béland, M. Removal of hydrogen sulfide from gas streams using biological processes—A review. Can. Biosyst. Eng. 2006, 48, 2.1–2.14. [Google Scholar]
  17. Kelly, D.P.; Shergill, J.K.; Lu, W.P.; Wood, A.P. Oxidative metabolism of inorganic sulfur compounds by bacteria. Antonie Van Leeuwenhoek 1997, 71, 95–107. [Google Scholar] [CrossRef] [PubMed]
  18. Van der Zee, F.P.; Villaverde, S.; García-Encina, P.A.; Fdz-Polanco, F. Sulphide removal by moderate oxygenation of anaerobic sludge environments. Bioresour. Technol. 2007, 98, 518–524. [Google Scholar] [CrossRef] [PubMed]
  19. Goncalves, J.J.; Govind, R. Enhanced biofiltration using cell attachment promotors. Environ. Sci. Technol. 2009, 43, 1049–1054. [Google Scholar] [CrossRef] [PubMed]
  20. Ramirez, M.; Gomez, J.M.; Aroca, G.; Cantero, D. Removal of hydrogen sulfide by immobilized Thiobacillus thioparus in a biotrickling filter packed with polyurethane foam. Bioresour. Technol. 2009, 100, 4989–4995. [Google Scholar] [CrossRef] [PubMed]
  21. Janssen, A.J.H.; Ruitenberg, R.; Buisman, C.J.N. Industrial applications of new sulphur biotechnology. Water Sci. Technol. 2001, 44, 85–90. [Google Scholar] [PubMed]
  22. Meyer-Kohlstock, D.; Haupt, T.; Heldt, E.; Heldt, N.; Kraft, E. Biochar as additive in biogas-production from bio-waste. Energies 2016, 9, 247–256. [Google Scholar] [CrossRef]
  23. Ciotola, R.J.; Martin, J.F.; Tamkin, A.; Castańo, J.M.; Rosenblum, J.; Bisesi, M.S.; Lee, J. The influence of loading rate and variable temperatures on microbial communities in anaerobic digesters. Energies 2014, 7, 785–803. [Google Scholar] [CrossRef]
  24. Chu, L.; Yan, S.; Xing, X.H.; Sun, X.; Jurcik, B. Progress and perspectives of sludge ozonation as a powerful pretreatment method for minimization of excess sludge production. Water Res. 2009, 43, 1811–1822. [Google Scholar] [CrossRef] [PubMed]
  25. Ramos, I.; Díaz, I.; Fdz-Polanco, M. The role of the headspace in hydrogen sulfide removal during microaerobic digestion of sludge. Water Sci. Technol. 2012, 66, 2258–2264. [Google Scholar] [CrossRef] [PubMed]
  26. American Public Health Association (APHA). Standard Methods for the Examination of Water and Wastewater, 20th ed.; Clescerl, L.S., Greenberg, A.E., Eaton, A.D., Eds.; APHA: Washington, DC, USA, 1998. [Google Scholar]
  27. Buchholz-Cleven, B.E.; Rattunde, B.; Straub, K.L. Screening for genetic diversity of isolates of anaerobic Fe (II)-oxidizing bacteria using DGGE and whole-cell hybridization. Syst. Appl. Microbiol. 1997, 20, 301–309. [Google Scholar] [CrossRef]
  28. O’Reilly, J.; Lee, C.; Chinalia, F.; Collins, G.; Mahony, T.; O’Flaherty, V. Microbial community dynamics associated with biomass granulation in low temperature (15 °C) anaerobic wastewater treatment bioreactors. Bioresour. Technol. 2010, 101, 6336–6344. [Google Scholar] [CrossRef] [PubMed]
  29. Zhang, Y.B.; Feng, Y.H.; Yu, Q.L.; Xu, Z.B.; Quan, X. Enhanced high-solids anaerobic digestion of waste activated sludge by the addition of scrap iron. Bioresour. Technol. 2014, 159, 297–304. [Google Scholar] [CrossRef] [PubMed]
  30. Murto, M.; Björnsson, L.; Mattiasson, B. Impact of food industrial waste on anaerobic co-digestion of sewage sludge and pig manure. J. Environ. Manag. 2004, 70, 101–107. [Google Scholar] [CrossRef]
  31. Ogejo, J.A.; Wen, Z.; Ignosh, J.; Bendfeldt, E.; Collins, E.R. Biomethane Technology; Virginia Cooperative Extension: Blacksburg, VA, USA, 2009; pp. 442–881. [Google Scholar]
  32. Watson, T.M.; Coleman, A.J.; Williams, G.; McMurray, H.N. The effect of oxygen partial pressure on the filiform corrosion of organic coated iron. Corros. Sci. 2014, 89, 46–58. [Google Scholar] [CrossRef]
  33. Mamais, D.; Pitt, P.A.; Cheng, Y.W.; Loiacono, J.; Jenkins, D. Determination of ferric chloride dose to control struvite precipitation in anaerobic sludge digesters. Water Environ. Res. 1994, 66, 912–918. [Google Scholar] [CrossRef]
  34. Batstone, D.J.; Puyol, D.; Flores-Alsina, X.; Rodriguez, J. Mathematical modelling of anaerobic digestion processes: Applications and future needs. Rev. Environ. Sci. Biotechnol. 2015, 14, 595–613. [Google Scholar] [CrossRef]
  35. Kwietniewska, E.; Tys, J. Process characteristics, inhibition factors and methane yields of anaerobic digestion process, with particular focus on microalgal biomass fermentation. Renew. Sustain. Energy Rev. 2014, 34, 491–500. [Google Scholar] [CrossRef]
  36. Zhang, Y.B.; Jing, Y.W.; Zhang, J.X.; Sun, L.F.; Quan, X. Performance of a ZVI-UASB reactor for azo dye wastewater treatment. J. Chem. Technol. Biotechnol. 2011, 86, 199–204. [Google Scholar] [CrossRef]
  37. Liu, Y.; Zhang, Y.; Quan, X.; Chen, S.; Zhao, H. Applying an electric field in a built-in zero valent iron—Anaerobic reactor for enhancement of sludge granulation. Water Res. 2011, 45, 1258–1266. [Google Scholar] [CrossRef] [PubMed]
  38. Jenicek, P.; Keclik, F.; Maca, J.; Bindzar, J. Use of microaerobic conditions for the improvement of anaerobic digestion of solid wastes. Water Sci. Technol. 2008, 58, 1491–1496. [Google Scholar] [CrossRef] [PubMed]
  39. Jenicek, P.; Koubova, J.; Bindzar, J.; Zabranska, J. Advantages of anaerobic digestion of sludge in microaerobic conditions. Water Sci. Technol. 2010, 62, 427–434. [Google Scholar] [CrossRef] [PubMed]
  40. Yuan, J.T.; Wang, W.; Zhu, S.L.; Wang, F.H. Comparison between the oxidation of iron in oxygen and in steam at 650–750 °C. Corros. Sci. 2013, 75, 309–317. [Google Scholar] [CrossRef]
  41. Karri, S.; Sierra-Alvarez, R.; Field, J.A. Zero valent iron as an electron-donor for methanogenesis and sulfate reduction in anaerobic sludge. Biotechnol. Bioeng. 2005, 92, 810–819. [Google Scholar] [CrossRef] [PubMed]
  42. Ramos, I.; Pérez, R.; Reinoso, M.; Torio, R.; Fdz-Polanco, M. Microaerobic digestion of sewage sludge on an industrial-pilot scale: The efficiency of biogas desulphurisation under different configurations and the impact of O2 on the microbial communities. Bioresour. Technol. 2014, 164, 338–346. [Google Scholar] [CrossRef] [PubMed]
  43. Feng, Y.H.; Zhang, Y.B.; Quan, X.; Chen, S. Enhanced anaerobic digestion of waste activated sludge digestion by the addition of zero valent iron. Water Res. 2014, 52, 242–250. [Google Scholar] [CrossRef] [PubMed]
  44. Botheju, D.; Samarakoon, G.; Chen, C.; Bakke, R. An experimental study on the effects of oxygen in bio-gasification: Part 1. In Proceedings of the International Conference on Renewable Energies and Power Quality, Granada, Spain, 23–25 March 2010.
  45. Lim, J.W.; Wang, J.Y. Enhanced hydrolysis and methane yield by applying microaeration pretreatment to the anaerobic co-digestion of brown water and food waste. Waste Manag. 2013, 33, 813–819. [Google Scholar] [CrossRef] [PubMed]
  46. Annachhatre, A.P.; Suktrakoolvait, S. Biological sulfide oxidation in a fluidized bed reactor. Environ. Technol. 2001, 22, 661–672. [Google Scholar] [CrossRef] [PubMed]
  47. Díaz, I.; Lopes, A.C.; Pérez, S.I.; Fdz-Polanco, M. Performance evaluation of oxygen, air and nitrate for the microaerobic removal of hydrogen sulphide in biogas from sludge digestion. Bioresour. Technol. 2010, 101, 7724–7730. [Google Scholar] [CrossRef] [PubMed]
  48. Duangmanee, T. Micro-Aeration for Hydrogen Sulfide Removal from Biogas. Ph.D. Thesis, Iowa State University, Ames, IA, USA, 2009. [Google Scholar]
  49. Hungate, R.E. Chapter IV a roll tube method for cultivation of strict anaerobes. In Methods in Microbiology; Norris, J.R., Ribbons, D.W., Eds.; Academic Press: Millbrae, CA, USA, 1969; Volume 3, Part B; pp. 117–132. [Google Scholar]
  50. Peu, P.; Sassi, J.F.; Girault, R.; Picard, S.; Saint-Cast, P.; Béline, F.; Dabert, P. Sulphur fate and anaerobic biodegradation potential during co-digestion of seaweed biomass (Ulva sp.) with pig slurry. Bioresour. Technol. 2011, 102, 10794–10802. [Google Scholar] [CrossRef] [PubMed]
  51. Cadillo-Quiroz, H.; Yavitt, J.B.; Zinder, S.H. Methanosphaerula palustris gen. nov., sp. nov., a hydrogenotrophic methanogen isolated from a minerotrophic fen peatland. Int. J. Syst. Evol. Microbiol. 2009, 59, 928–935. [Google Scholar] [CrossRef] [PubMed]
  52. Feng, Y.H.; Zhang, Y.B.; Chen, S.; Quan, X. Enhanced production of methane from waste activated sludge by the combination of high-solid anaerobic digestion and microbial electrolysis cell with iron–graphite electrode. Chem. Eng. J. 2015, 259, 787–794. [Google Scholar] [CrossRef]
  53. Tarlera, S.; Stams, A.J.M. Degradation of proteins and amino acids by Caloramator proteoclasticus in pure culture and in coculture with Methanobacterium thermoformicicum Z245. Appl. Microbiol. Biotechnol. 1999, 53, 133–138. [Google Scholar] [CrossRef]
  54. Zeikus, J.; Weimer, P.; Nelson, D.; Daniels, L. Bacterial methanogenesis: Acetate as a methane precursor in pure culture. Arch. Microbiol. 1975, 104, 129–134. [Google Scholar] [CrossRef]
  55. Nevin, K.P.; Holmes, D.E.; Woodard, T.L.; Hinlein, E.S.; Ostendorf, D.W.; Lovley, D.R. Geobacter bemidjiensis sp. nov. and Geobacter psychrophilus sp. nov., two novel Fe (III)-reducing subsurface isolates. Int. J. Syst. Evol. Microbiol. 2005, 55, 1667–1674. [Google Scholar] [CrossRef] [PubMed]
  56. Johnson, D.B.; Bacelar-Nicolau, P.; Okibe, N.; Thomas, A.; Hallberg, K.B. Ferrimicrobium acidiphilum gen. nov., sp. nov. and Ferrithrix thermotolerans gen. nov., sp. nov.: Heterotrophic, iron-oxidizing, extremely acidophilic actinobacteria. Int. J. Syst. Evol. Microbiol. 2009, 59, 1082–1089. [Google Scholar] [CrossRef] [PubMed]
  57. Díaz, I.; Pérez, S.I.; Ferrero, E.M.; Fdz-Polanco, M. Effect of oxygen dosing point and mixing on the microaerobic removal of hydrogen sulphide in sludge digesters. Bioresour. Technol. 2010, 102, 3768–3775. [Google Scholar] [CrossRef] [PubMed]
  58. Kodama, Y.; Watanabe, K. Sulfuricurvum kujiense gen. nov., sp. nov., a facultatively anaerobic, chemolithoautotrophic, sulfur-oxidizing bacterium isolated from an underground crude-oil storage cavity. Int. J. Syst. Evol. Microbiol. 2004, 54, 2297–2300. [Google Scholar] [CrossRef] [PubMed]
  59. Potivichayanon, S.; Pokethitiyook, M.; Kruatrachue, M. Hydrogen sulfide removal by a novel fixed-film bioscrubber system. Process Biochem. 2006, 41, 708–715. [Google Scholar] [CrossRef]
Figure 1. Lab-scale bioreactor diagram for the semicontinuous anaerobic and microaerobic digestion of activated sludge supplemented with rusty scrap iron (RSI).
Energies 10 00258 g001
Figure 2. Variation of pH (■) and oxidation-reduction potential (ORP, ▲) under anaerobic and microaerobic conditions during semi-continuous digestion of activated sludge supplemented with RSI (error bars represent standard deviation, n = 3).
Energies 10 00258 g002
Figure 3. Daily COD removal (■) and daily methane yield (▼) under anaerobic and microaerobic conditions during the digestion of sludge (error bars represent standard deviation, n = 3).
Energies 10 00258 g003
Figure 4. Hydrogen sulphide (◆) and oxygen (▼) concentrations under anaerobic and microaerobic conditions during semi-continuous digestion of activated sludge supplemented with RSI (error bars represent standard deviation, n = 3).
Energies 10 00258 g004
Figure 5. Calculated sulfur balance during semicontinuous anaerobic and microaerobic digestion of activated sludge supplemented with RSI over seven periods of operation associated with stepwise increases in oxygen concentration: (1) sulfur compounds in waste sludge; (2) iron sulphide precipitation; (3) elemental sulfur S0; (4) sulfide in liquid phase; (5) sulphide oxidation products; and (6) sulfur in biogas.
Energies 10 00258 g005
Figure 6. The possible desulfurization mechanisms by combination of RSI and micro-oxygen during digestion system.
Energies 10 00258 g006
Figure 7. The DGGE profiles of archaea and bacterial 16S rRNA genes from the samples of digestion reactor in the last day of P1, P2 and P6. The gels with band were collected from the DGGE gel and labeled as bands A1–A11 (for archaea) and B1–B19 (for bacteria). The sequencing results of each band are shown in Table 5.
Energies 10 00258 g007
Table 1. The Characteristics of WAS and APS. WAS: waste-activated sludge; APS: alkaline-pretreated sludge; TCOD: total chemical oxygen demand; SCOD; soluble chemical oxygen demand; TS; total solids; VS: volatile solids; TSS: total suspended solids; and VSS: volatile suspended solids.
ParametersUnitsWASAPS
TCODmg/L31,253 ± 410730,854 ± 4494
SCODmg/L121 ± 25721 ± 28
TSg/L33.6 ± 4.932.9 ± 4.2
VSg/L20.7 ± 2.720.3 ± 2.4
TSSg/L32.4 ± 4.331.5 ± 3.9
VSSg/L19.8 ± 2.119.2 ± 1.8
pH/7.16 ± 0.117.06 ± 0.04
Total Femg/L31.2 ± 0.9731.2 ± 0.94
Soluble Femg/L8.7 ± 0.159.4 ± 0.16
Soluble Sulphidemg/L34.7 ± 1.543.9 ± 1.8
SO42−mg/L3.4 ± 0.185.5 ± 0.22
Total Elemental sulphurmg/L279.6 ± 13.1279.6 ± 11.8
Table 2. Experimental parameters and results during semi-continuous anaerobic and microaerobic digestion of activated sludge supplemented with RSI over seven periods of operation associated with stepwise increases in oxygen concentration. RSI: rusty scrap iron; ABPR: Average biogas production rate; and BRT: biogas residence time.
PeriodP1P2P3P4P5P6P7
ConditionAn aAnMa bMaMaMaMa
Day1–3031–6061–9091–120121–150151–180181–210
Duration (day)30303030303030
RSI dosages (g/L)0202020202020
ABPR (mL/day)937167116451592164415911197
O2 supply (mL)0015101520
O2/biogas c000.613.146.089.4316.71
BRT (h)12.87.17.27.57.27.510.0
a An: anaerobic; b Ma: microaerobic; c O2/biogas: ratio of supply of oxygen to biogas produced from anaerobic digestion at standard condition, (NLoxygen/Nm3 biogas).
Table 3. Reactor performance during semi-continuous anaerobic and microaerobic digestion of activated sludge supplemented with RSI over seven periods of operation associated with stepwise increases in oxygen concentration.
ParameterP1P2P3P4P5P6P7
COD in (mg/L)31,25331,25331,25331,25331,25331,25331,253
Average COD out (mg/L)19,31413,31413,65814,31413,90814,12617,189
Average COD removal (%)38.257.456.354.255.554.845.0
VS in (g/L)20.320.320.320.320.320.320.3
Average VS out (g/L)12.78.98.99.59.59.411.1
Average VS removal (%)37.656.456.154.254.253.545.3
Average Methane Yield (mL/g COD)218.76306.00300.59298.54298.90301.13261.39
Average Methane Yield (mL/gVSfed)342.3484.6465.3457.2465.7486.4406.8
Average H2S concentration (ppmv)1250419337764842347568
Average O2 concentration (ppmv)/ a/158759123020838438
Average CH4 concentration (ppmv)557,964656,972642,738634,655630,789648,816614,308
Average CO2 concentration (ppmv)419,672332,948346,459356,842356,129341,027372,648
a: undetectable.
Table 4. The mass distribution of sulfur compounds (mg) in the system before and after semi-continuous anaerobic and microaerobic digestion of activated sludge supplemented with RSI over seven periods of operation associated with stepwise increases in oxygen concentration.
PhaseSulfur SpeciesFeedP1P2P3P4P5P6P7
S in solid phase (mg)S-sulfur compounds in waste sludge55.941.838.333.833.131.432.537.1
S-iron sulphide/2.241.745.151.258.955.151.1
S0///26.932.737.242.430.1
S in liquid phase (mg)S-Total sulfide (S2−, HS, H2S)8.378.653.826.620.115.911.27.6
S-Sulphide oxidation products (S2O32−, SO42−)90.54.75.14.95.44.85.723.9
S in gaseous phase (mg)S-H2S/16.74.61.81.10.60.30.2
Total Elemental Sulphur (mg)154.7144143.5139.1143.6148.8147.2150
/: not detected.
Table 5. Phylogenetic affiliation of archaeal and bacterial 16S rRNA gene sequences retrieved from DGGE bands.
Band No.Closest RelativesSimilarity (%)Classification
A1Methanoculleus palmolei (NR028253)99Methanomicrobia
A2Methanosphaerula palustris (NR074167)92Methanomicrobia
A3Methanoculleus marisnigri (NR074174)98Methanomicrobia
A4Methanolinea tarda (NR028163)97Methanomicrobia
A5Methanosarcina mazei (NR041956)100Methanomicrobia
A6Methanoculleus bourgensis (NR042786)98Methanomicrobia
A7Methanosarcina mazei (NR074221)93Methanomicrobia
A8Methanosaeta concilii (NR102903)99Methanomicrobia
A9Methanosarcina siciliae (NR104757)99Methanomicrobia
A10Methanosarcina barkeri (NR025303)97Methanomicrobia
A11Methanococcus aeolicus (NR029140)93Methanococci
B1Methylovirgula ligni (NR044611)98Alphaproteobacteria
B2Methylocella silvestris (NR074237)98Alphaproteobacteria
B3Uncultured bacterium (JQ726674)98Alphaproteobacteria
B4Sphingopyxis witflariensis (NR028010)99Alphaproteobacteria
B5Novosphingobium indicum (NR044277)99Alphaproteobacteria
B6Clostridium orbiscindens DSM 6740 (NR029356)99Clostridia
B7Clostridium populeti (NR026103)93Clostridia
B8Caloramator proteoclasticus (NR026265)95Clostridia
B9Clostridium sp. (JQ670700)94Clostridia
B10Syntrophobacter fumaroxidans (NR027598)94Deltaproteobacteria
B11Acetobacter tropicalis (NR036881)95Alphaproteobacteria
B12Roseomonas lacus (NR042318)98Alphaproteobacteria
B13Sporomusa silvacetica (NR026378)98Alphaproteobacteria
B14Geobacter bemidjiensis Bem (NR042769)97Deltaproteobacteria
B15Acidimicrobium ferrooxidans (NR074390)92Acidimicrobidae
B16Ferrimicrobium acidiphilum (NR041798)93Acidimicrobidae
B17Uncultured Arcobacter sp. (HQ392839)99Epsilonproteobacteria
B18Uncultured Epsilonproteobacterium (DQ295695)99Epsilonproteobacteria
B19Uncultured Acinetobacter sp. (EU567041)95Gammaproteobacteria
Table 6. The consumption and price of additional materials in the sixth period of sludge digestion.
ConsumptionPrice
RSISodium HydroxideHydrochloric AcidOxygenRSISodium HydroxideHydrochloric AcidOxygen
g/periodg/periodmL/periodL/period$/kg$/kg$/L$/m3
8.47.217.80.451.6202057.7

