Article

Optimization of External Envelope Insulation Thickness: A Parametric Study

by
Eleftheria Touloupaki
* and
Theodoros Theodosiou
Laboratory of Building Construction and Building Physics, Department of Civil Engineering, Aristotle University of Thessaloniki, 54124 Thessaloniki, Greece
*
Author to whom correspondence should be addressed.
Energies 2017, 10(3), 270; https://doi.org/10.3390/en10030270
Submission received: 11 January 2017 / Revised: 16 February 2017 / Accepted: 20 February 2017 / Published: 24 February 2017

Abstract

:
Almost four years after the implementation deadline of the energy performance of buildings Directive recast (2010/31/EU) and after being referred to the Court of Justice of the EU by the European Commission, Greece has not yet proceeded with the necessary calculations and legislative measures on the minimum, cost-optimal energy performance requirements for buildings. This paper aims to identify the optimal thickness of insulation that is cost-effective to apply in urban multi-family domestic buildings in the four climate zones of Greece. A reference building is selected in order to perform calculations over ten scenarios of external insulation thickness for each climate zone on a basic and three sensitivity analysis calculations according to the EU comparative methodology framework. The resulting energy savings for each insulation scenario are calculated, and then the cost-effectiveness of the measure is examined in financial and macroeconomic perspective for an economic lifecycle of 30 years. The results demonstrate the inadequacy of the national regulation’s current insulation limits and the externalities (funding gaps) that need to be addressed in order to achieve the effective improvement of energy efficiency in Greek homes.

1. Introduction

The European Parliament and Council Directive on the energy performance of buildings—EPBD (recast) [1] represents a strong commitment for reducing the energy consumption and improving the energy efficiency of the European building stock. The Directive set minimum requirements of energy performance for buildings and building components and furthermore established clearly nearly zero energy buildings (nZEBs) as a political target for all Member States. To guide Member States in the definition of minimum energy performance requirements, the European Commission issued a Comparative Methodology Framework provided in Articles 3, 4 and 5 and Annex III of the Directive, the Delegated Regulation (EU) No 244/2012 [2] and its accompanying guidelines [3].
The task of setting minimum energy performance requirements translates to the exploration of a huge number of design solutions so approaches aiming to reduce the analysis efforts soon emerged with many attempts utilizing simulation-based optimization [4,5]. Even though the nZEB target seems to be still quite far off when taking into account cost-optimality [6,7], minimum energy performance requirements can be seen as a first step towards the achievement of this target.
Almost four years after the EPBD recast implementation deadline (21st of March, 2013) and after being referred to the Court of Justice of the EU by the European Commission, Greece has not yet provided the required reports on cost-optimality to the European Commission while all other Member States have done so. According to the Hellenic Statistical Authority [8], “2,903,594 Greek dwellings (45.6%) have no insulation at all”. Under the current circumstances of economic and social crisis in Greece energy efficiency measures—starting with a well-insulated envelope—are pivotal for the alleviation of fuel poverty, the improvement of health and productivity, as well as the creation of new local jobs to boost the economy.
Greek legislation on energy efficiency of buildings was firstly introduced in 1979 with the Thermal Insulation of Buildings Regulation—TIBR [9], which set targets for the U-Values of the building and its components, as well as the door/window frames used on the construction. TIBR also recommended measures for the effective installation of the insulating material on the building’s envelope emphasizing on the occupants’ comfort, the rational consumption of energy for heating and air-conditioning and the reduction of air pollution. However, it did not introduce measures on buildings constructed before 1980, which account for about 45%–46% of the national building stock in terms of floor area [10]. The TIBR was to be replaced by the Regulation on the rational use and energy conservation in buildings (KOXEE in Greek) which was introduced in 1998 by a Common Ministerial Decision [11]. KOXEE was completed in 2002 by The Ministry of Growth and the Center for Renewable Energy Sources (CRES) and received public review in 2004, but was never implemented. Instead, it changed its name and was used as a draft for the current Regulation on the energy performance of buildings (KENAK in Greek) [12] which was issued in 2010 [13].
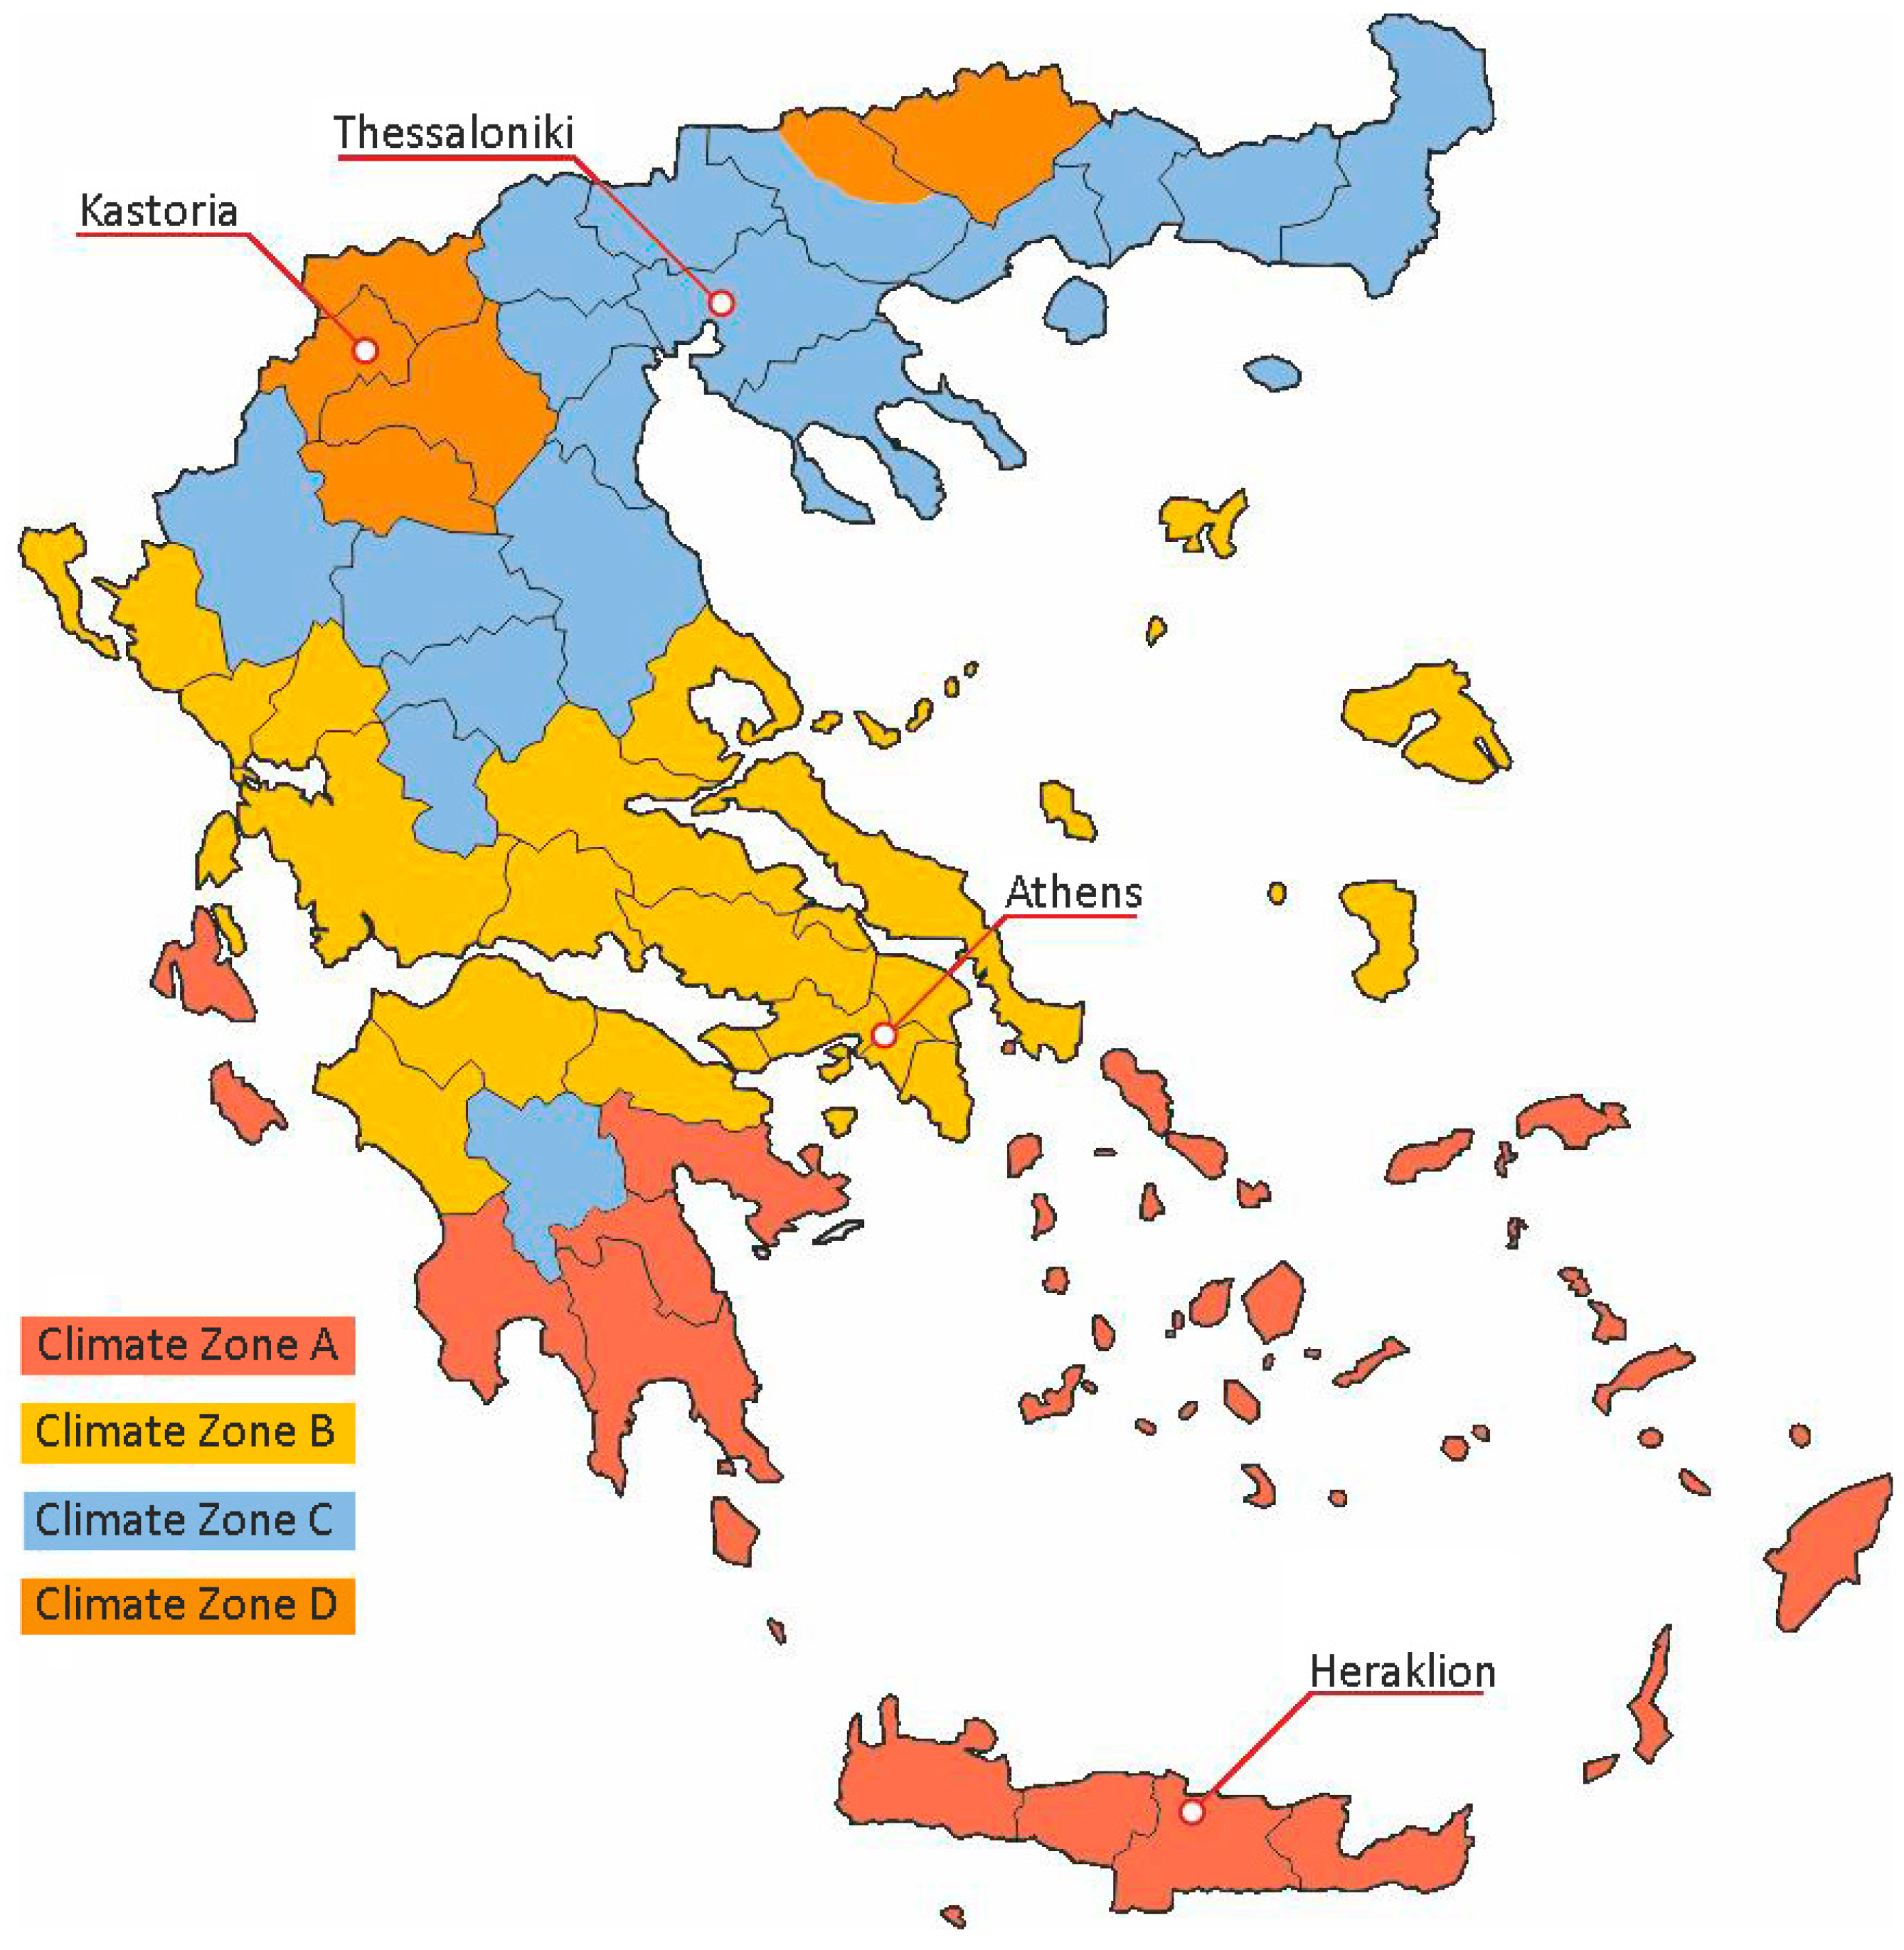
KENAK acknowledged for the first time—and proposed—the integrated energy design of buildings in an attempt to increase their energy efficiency, save energy and protect the environment. The regulation also sets requirements on Energy Certification and divides the country into four climate zones (Figure 1) depending on prevailing climate conditions (Table 1). The methodology applied for the calculation of the energy performance of buildings was supposed to be revised on a regular basis with the first revision to be made on April 2012. However, such revision has not occurred yet. To facilitate the implementation of KENAK, four technical guidelines were issued by the Technical Chamber of Greece (TEE) [814-17], in addition to the development of a national software tool called TEE-KENAK.
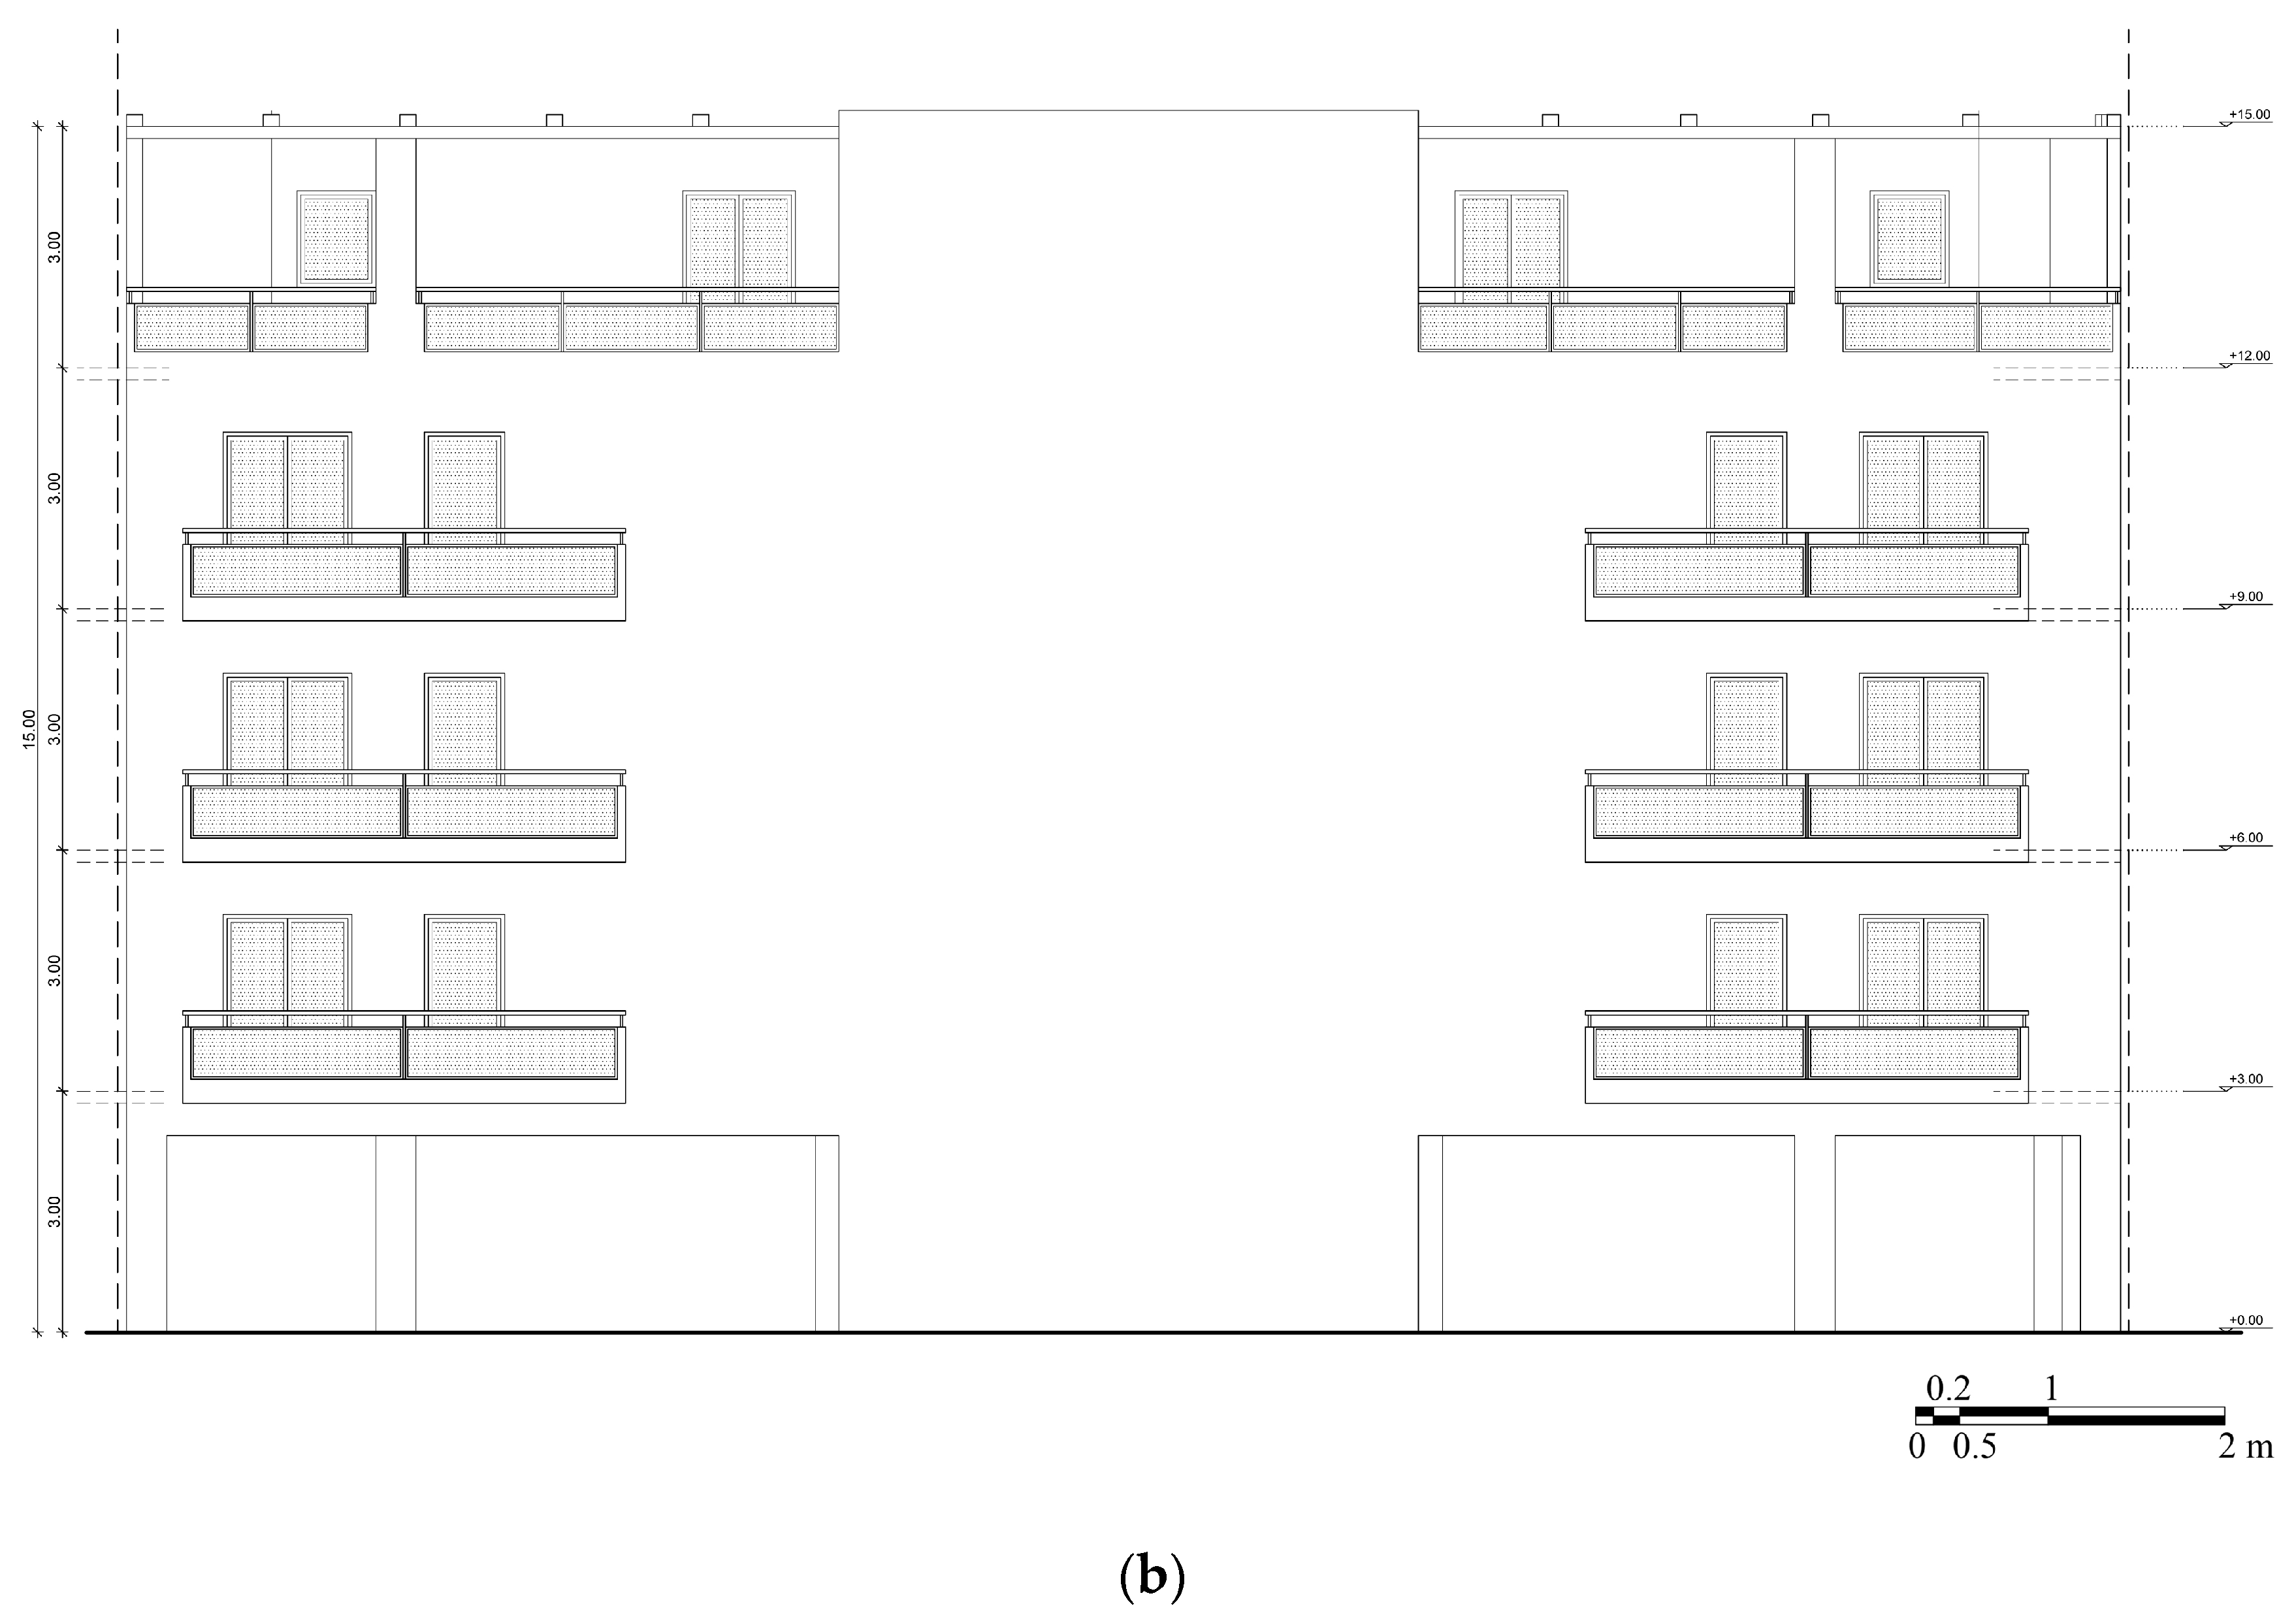
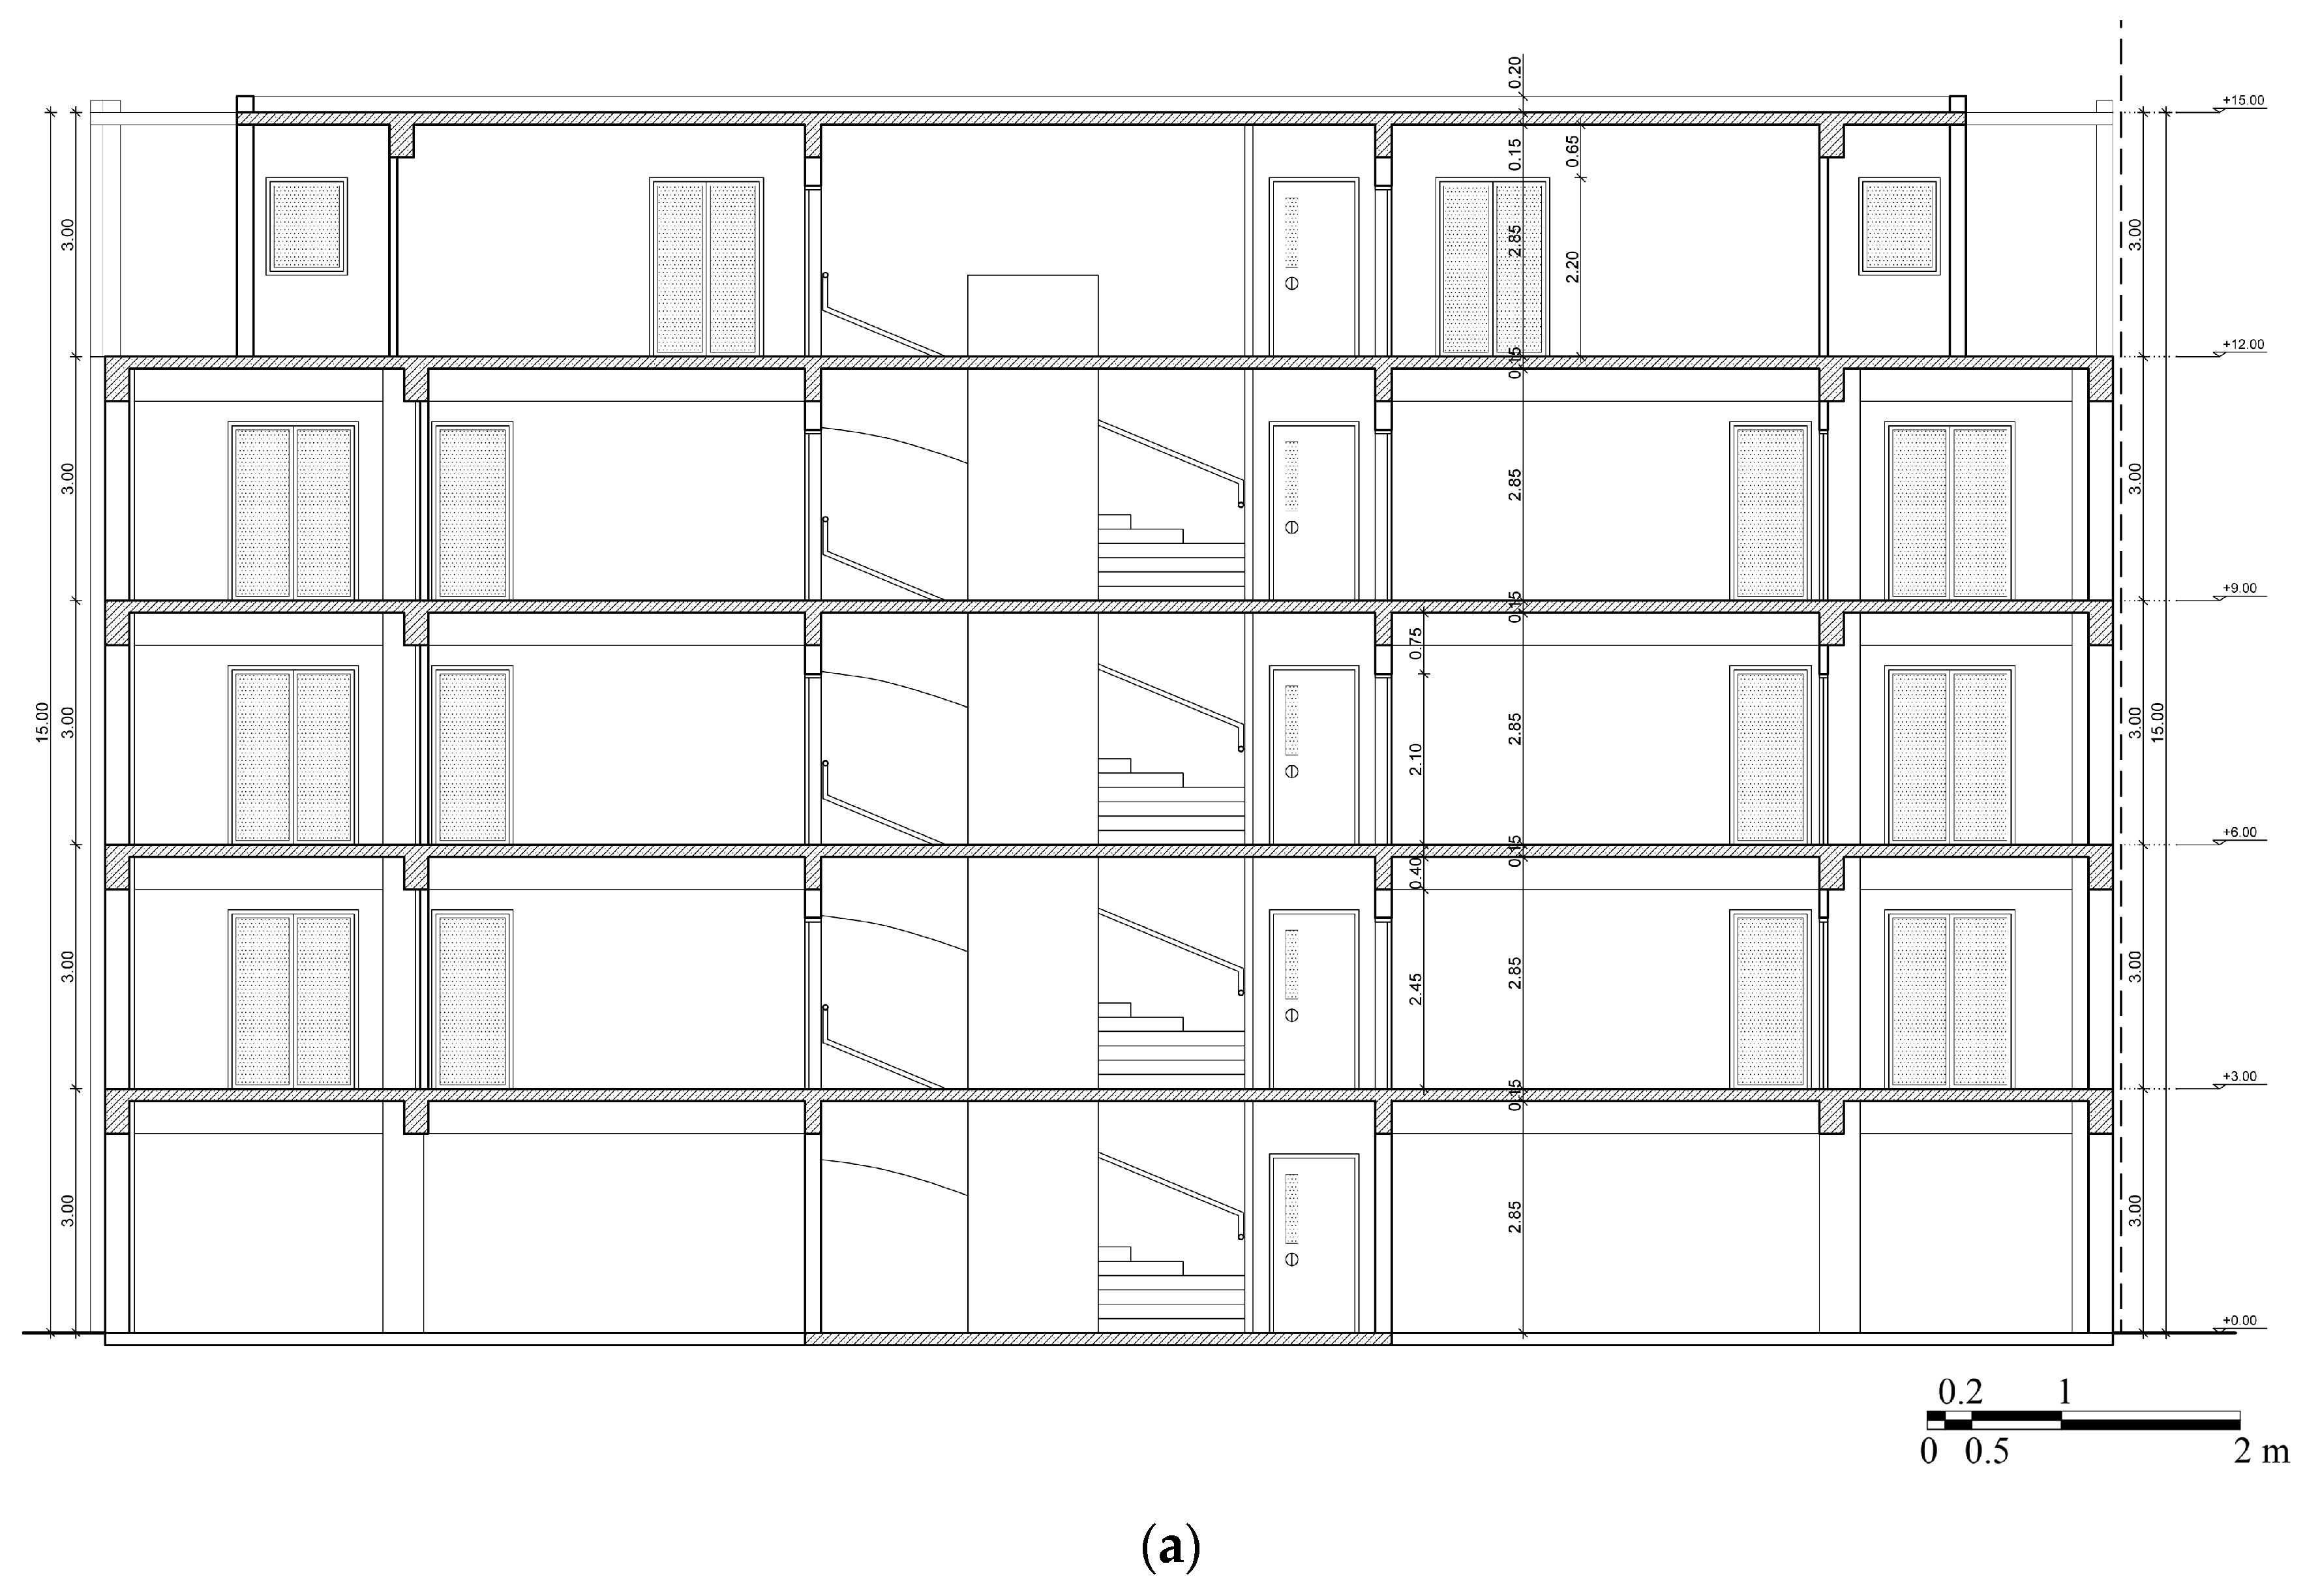
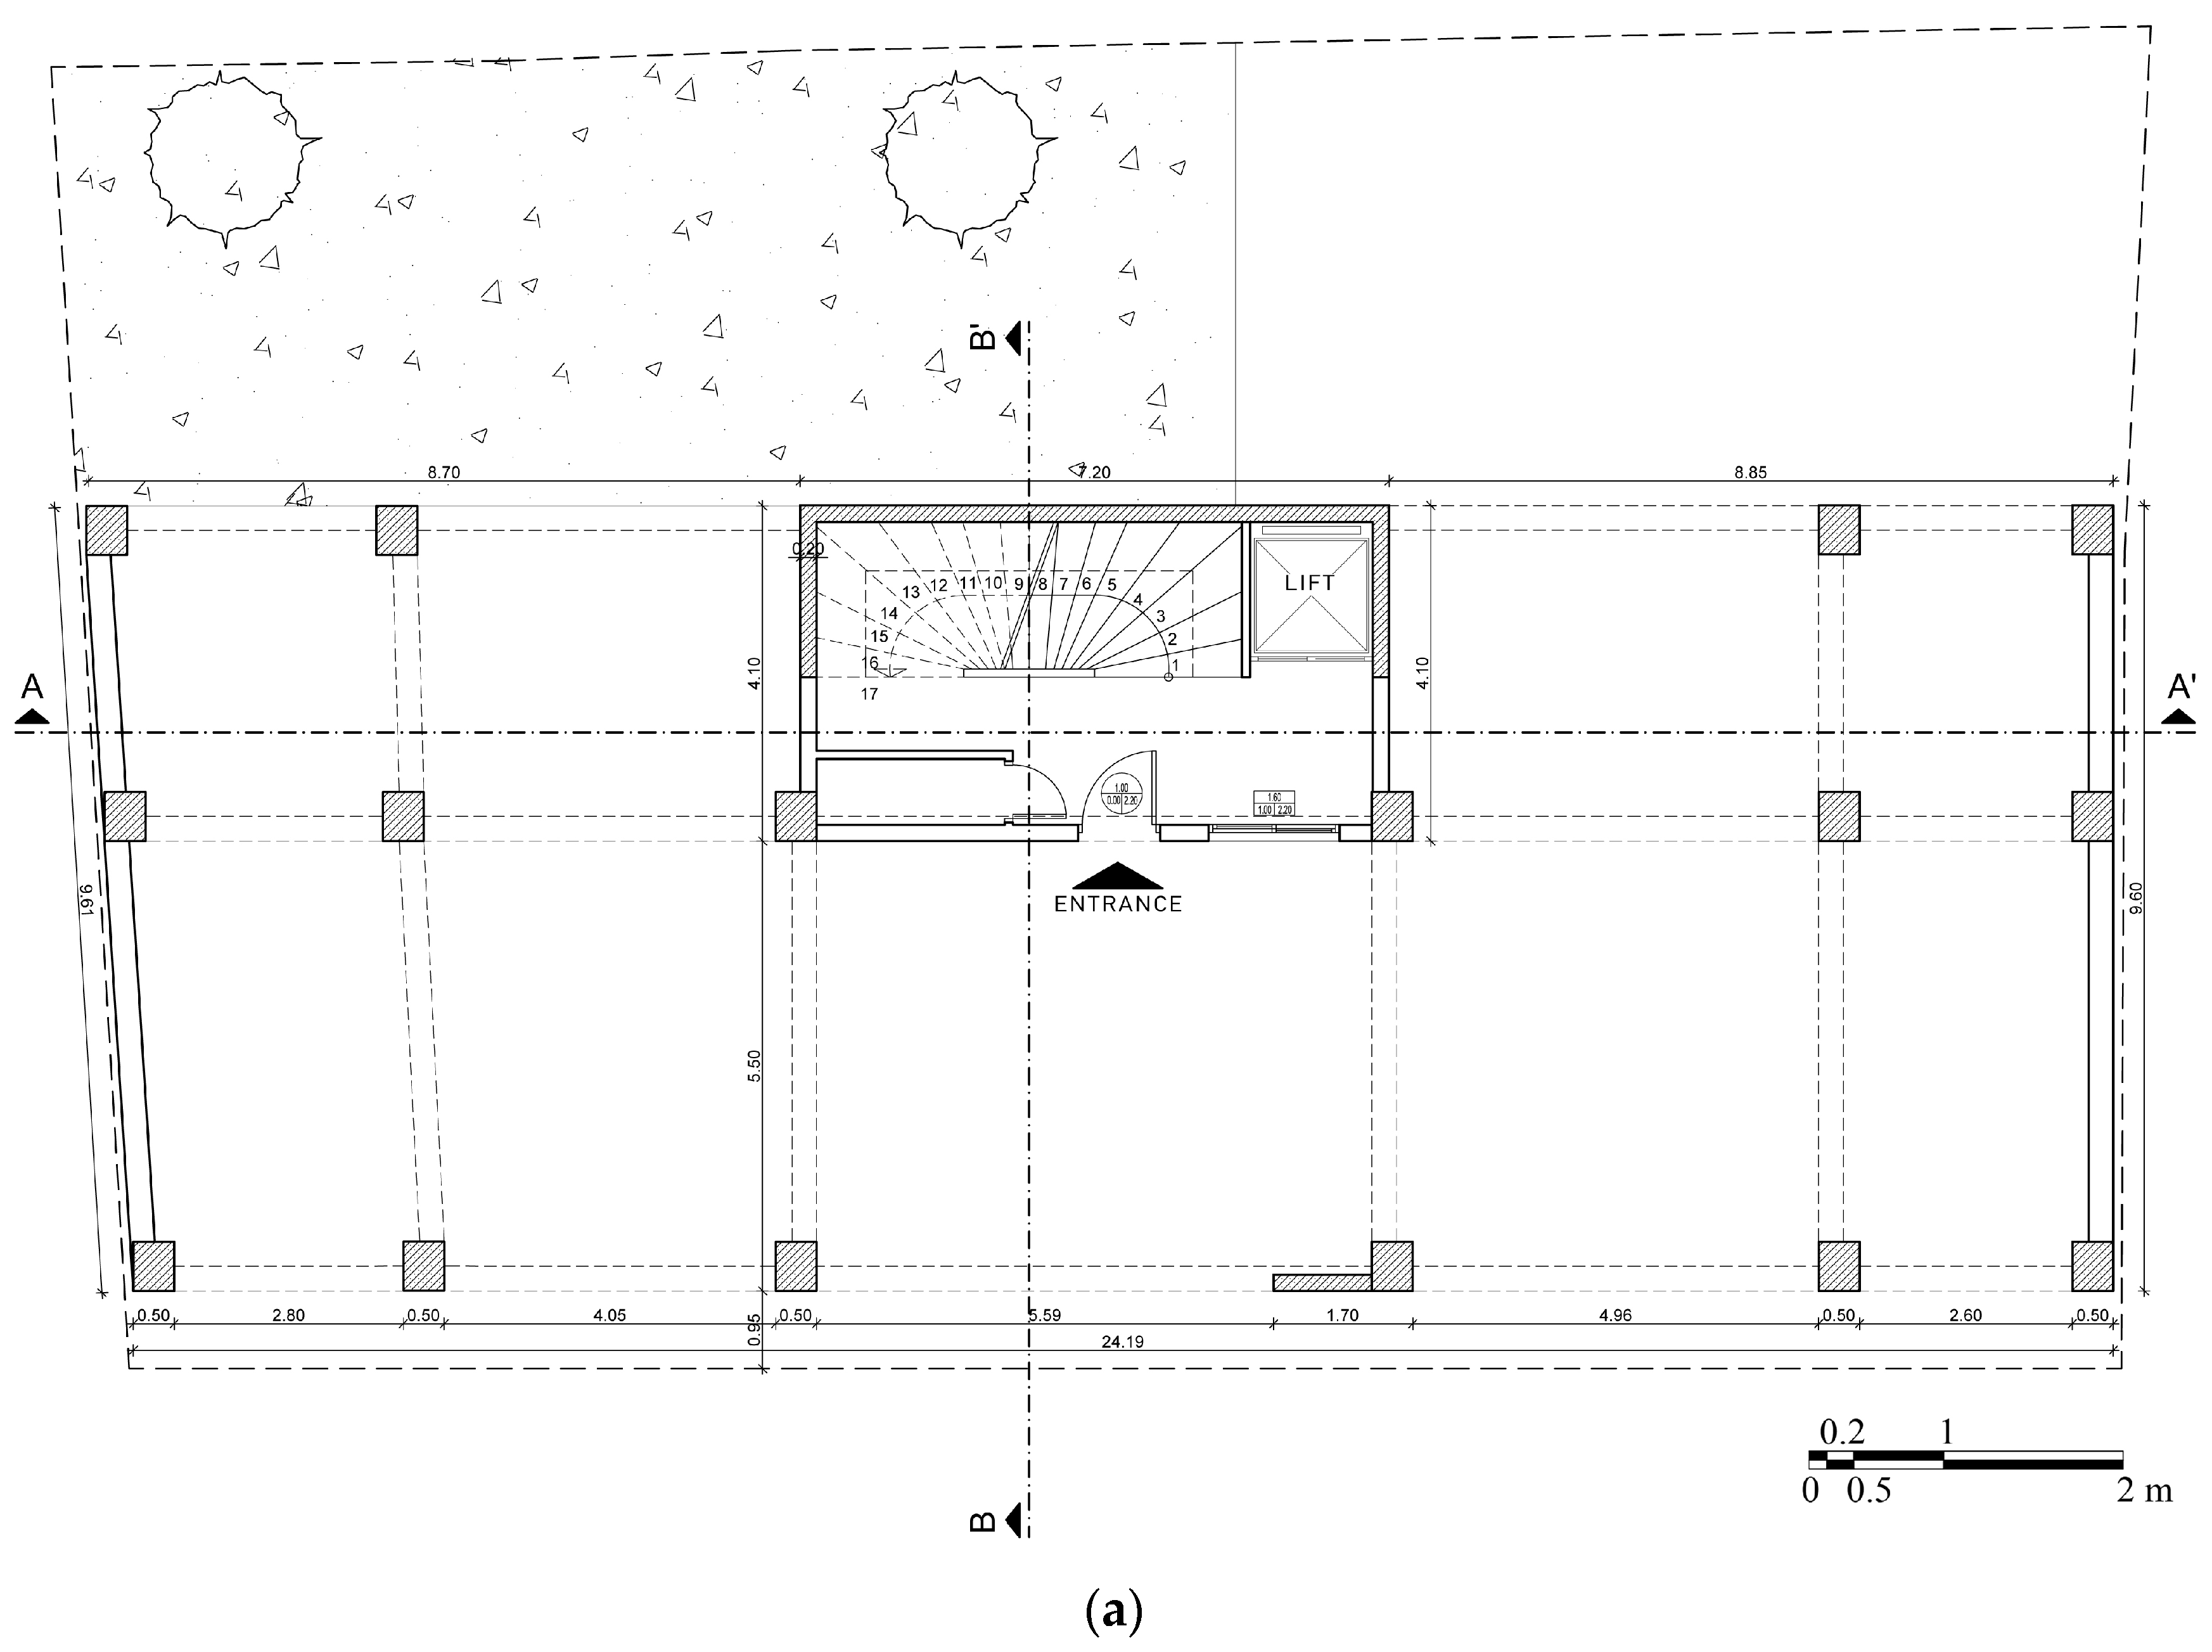
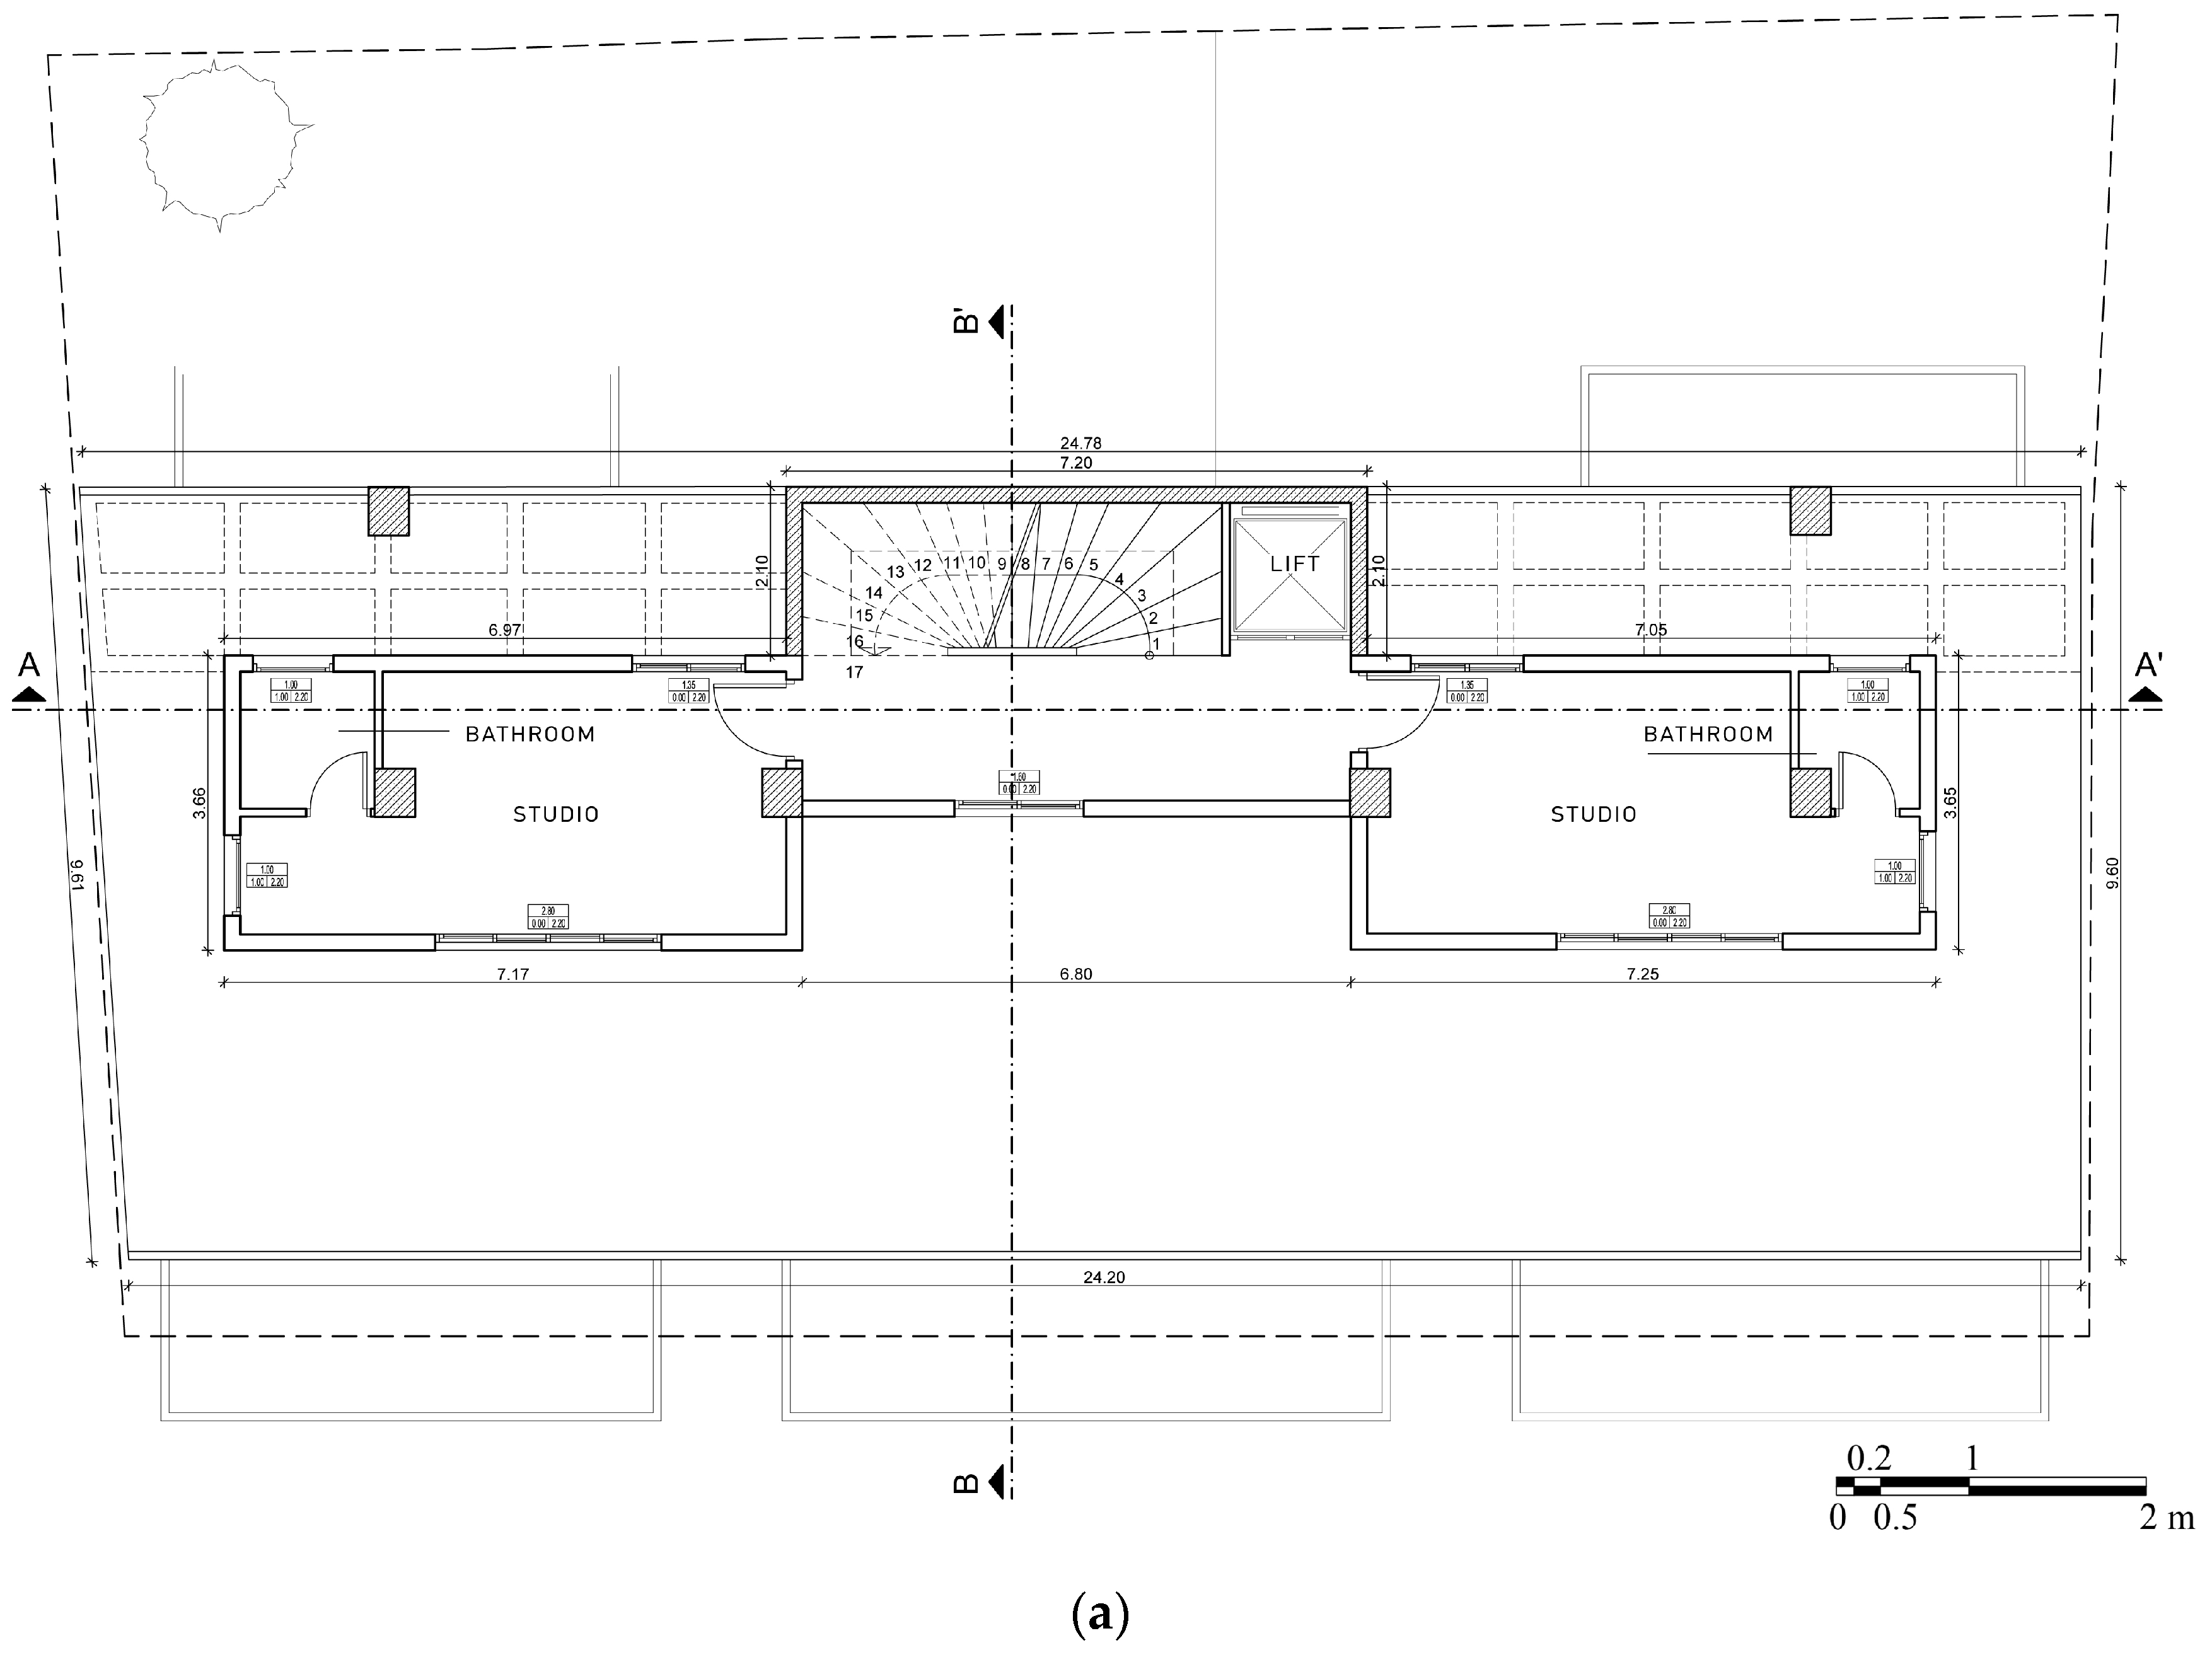
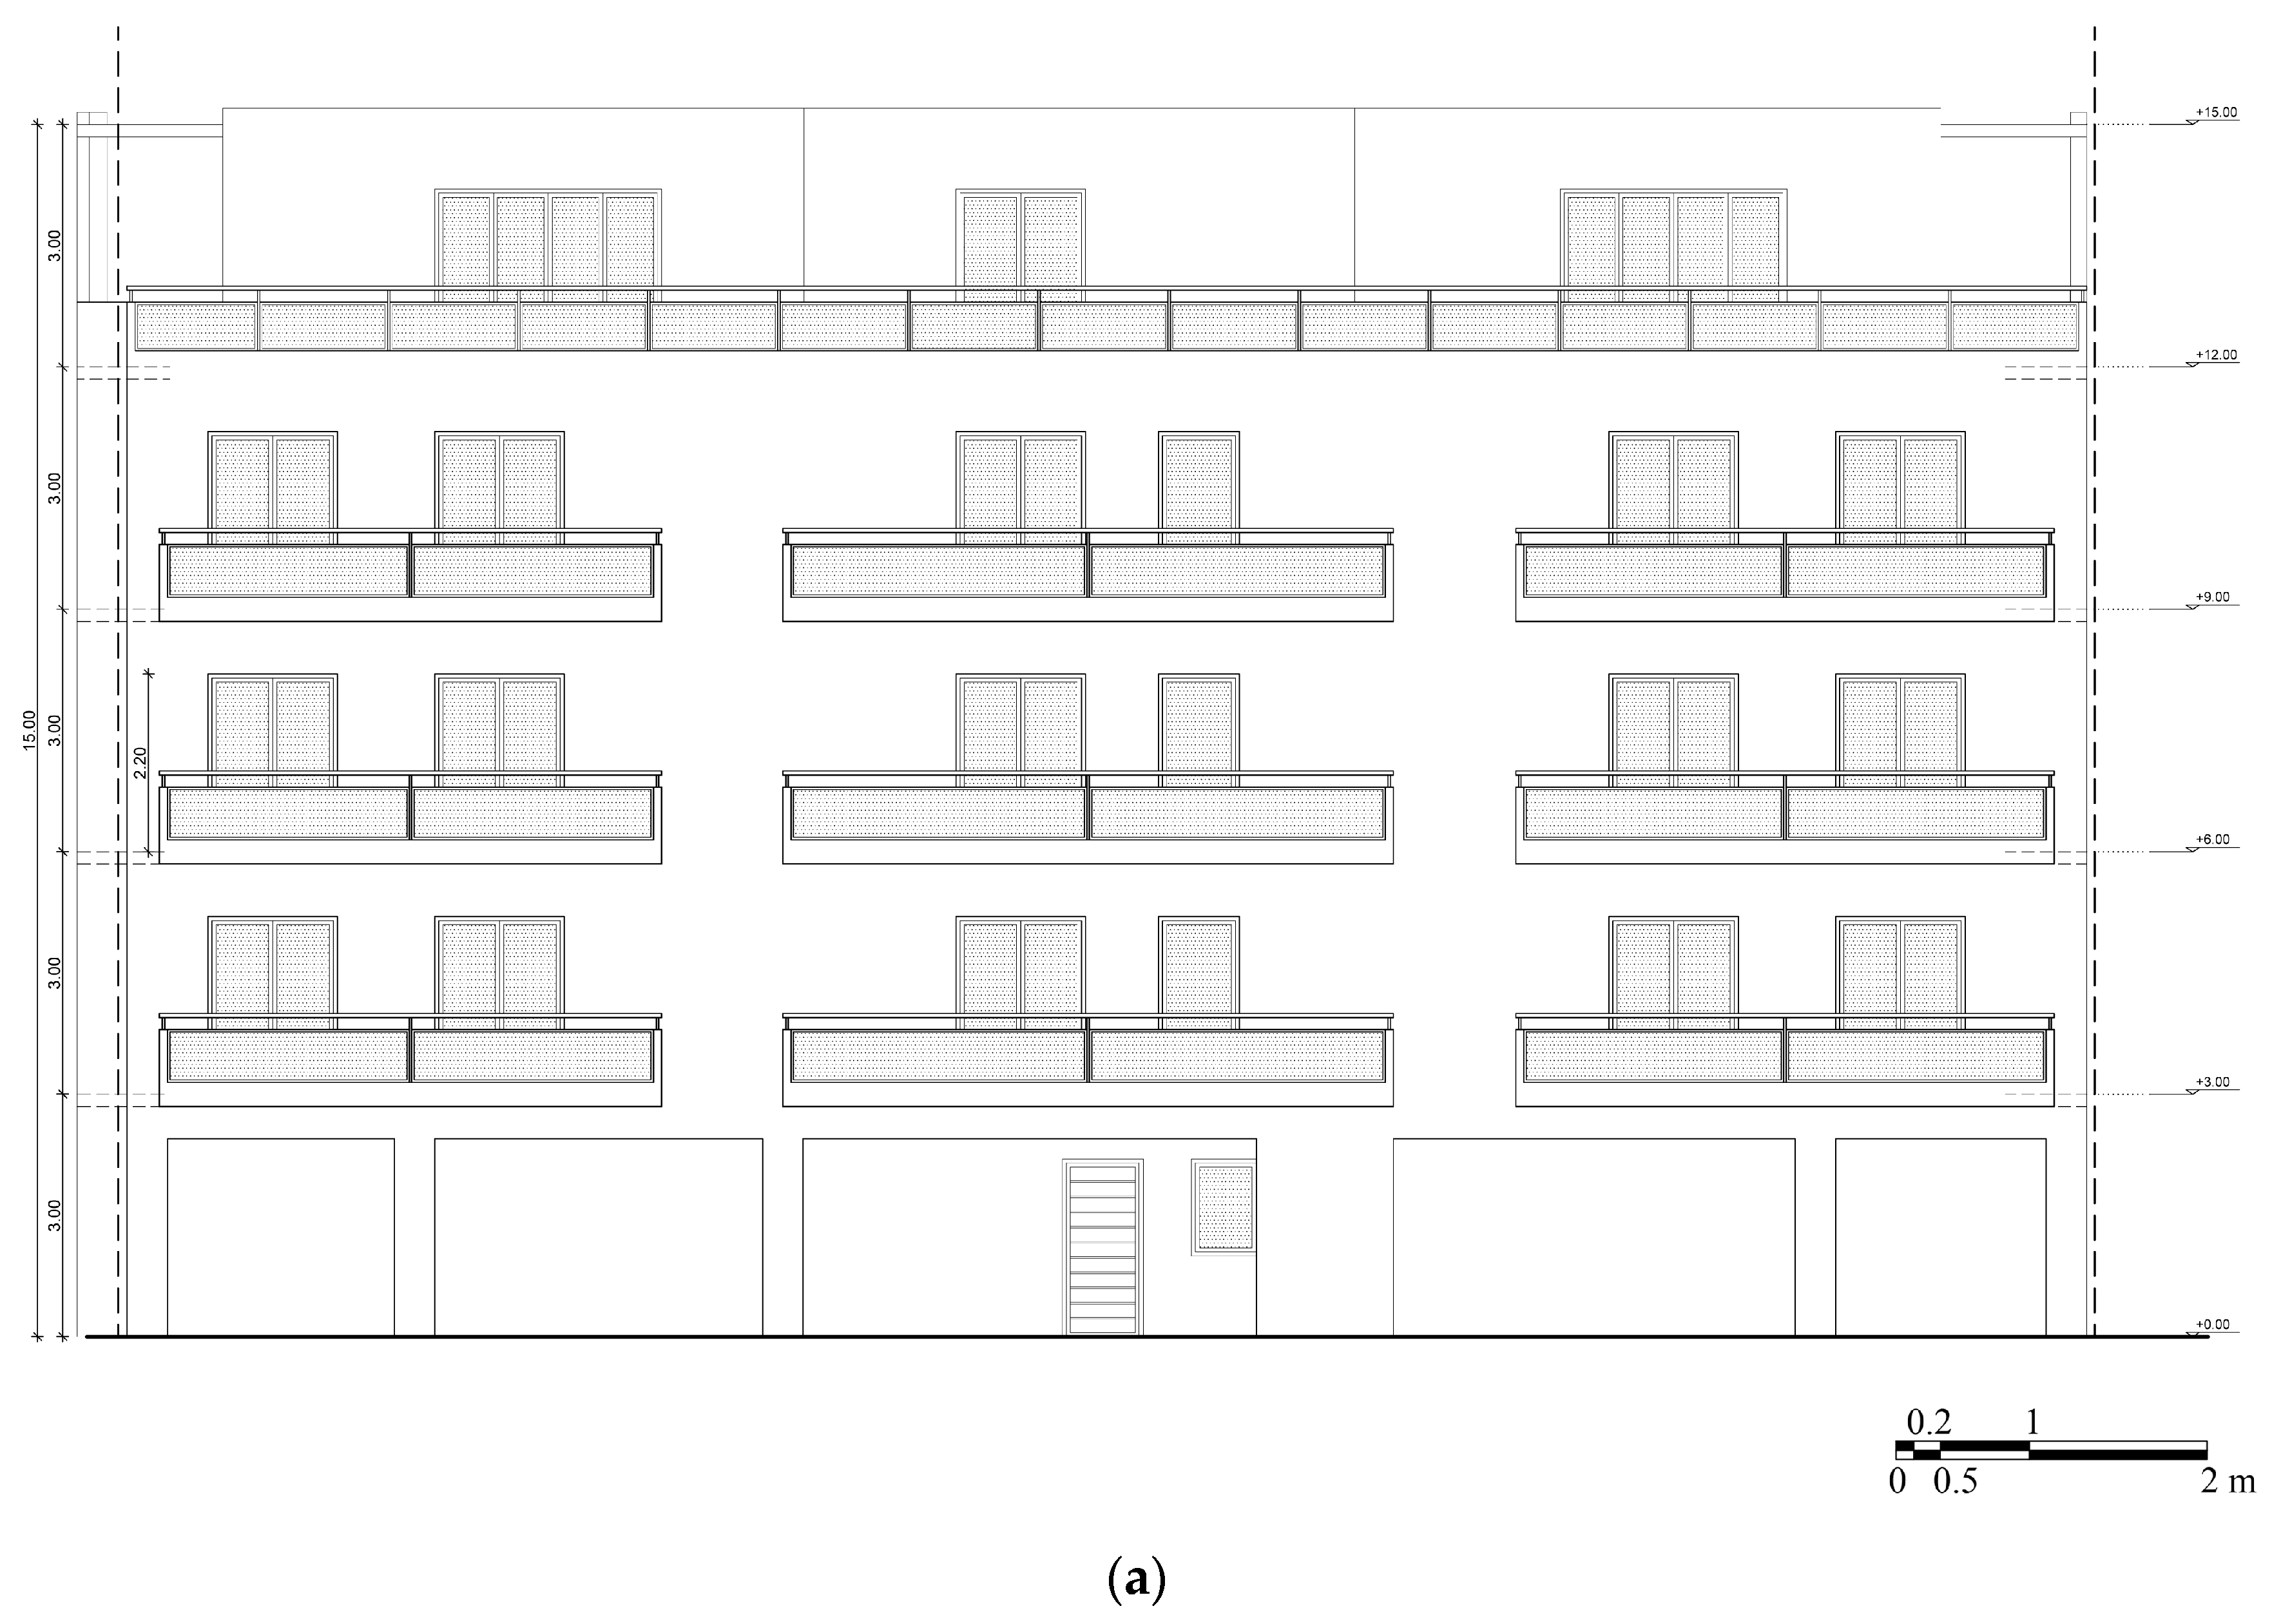
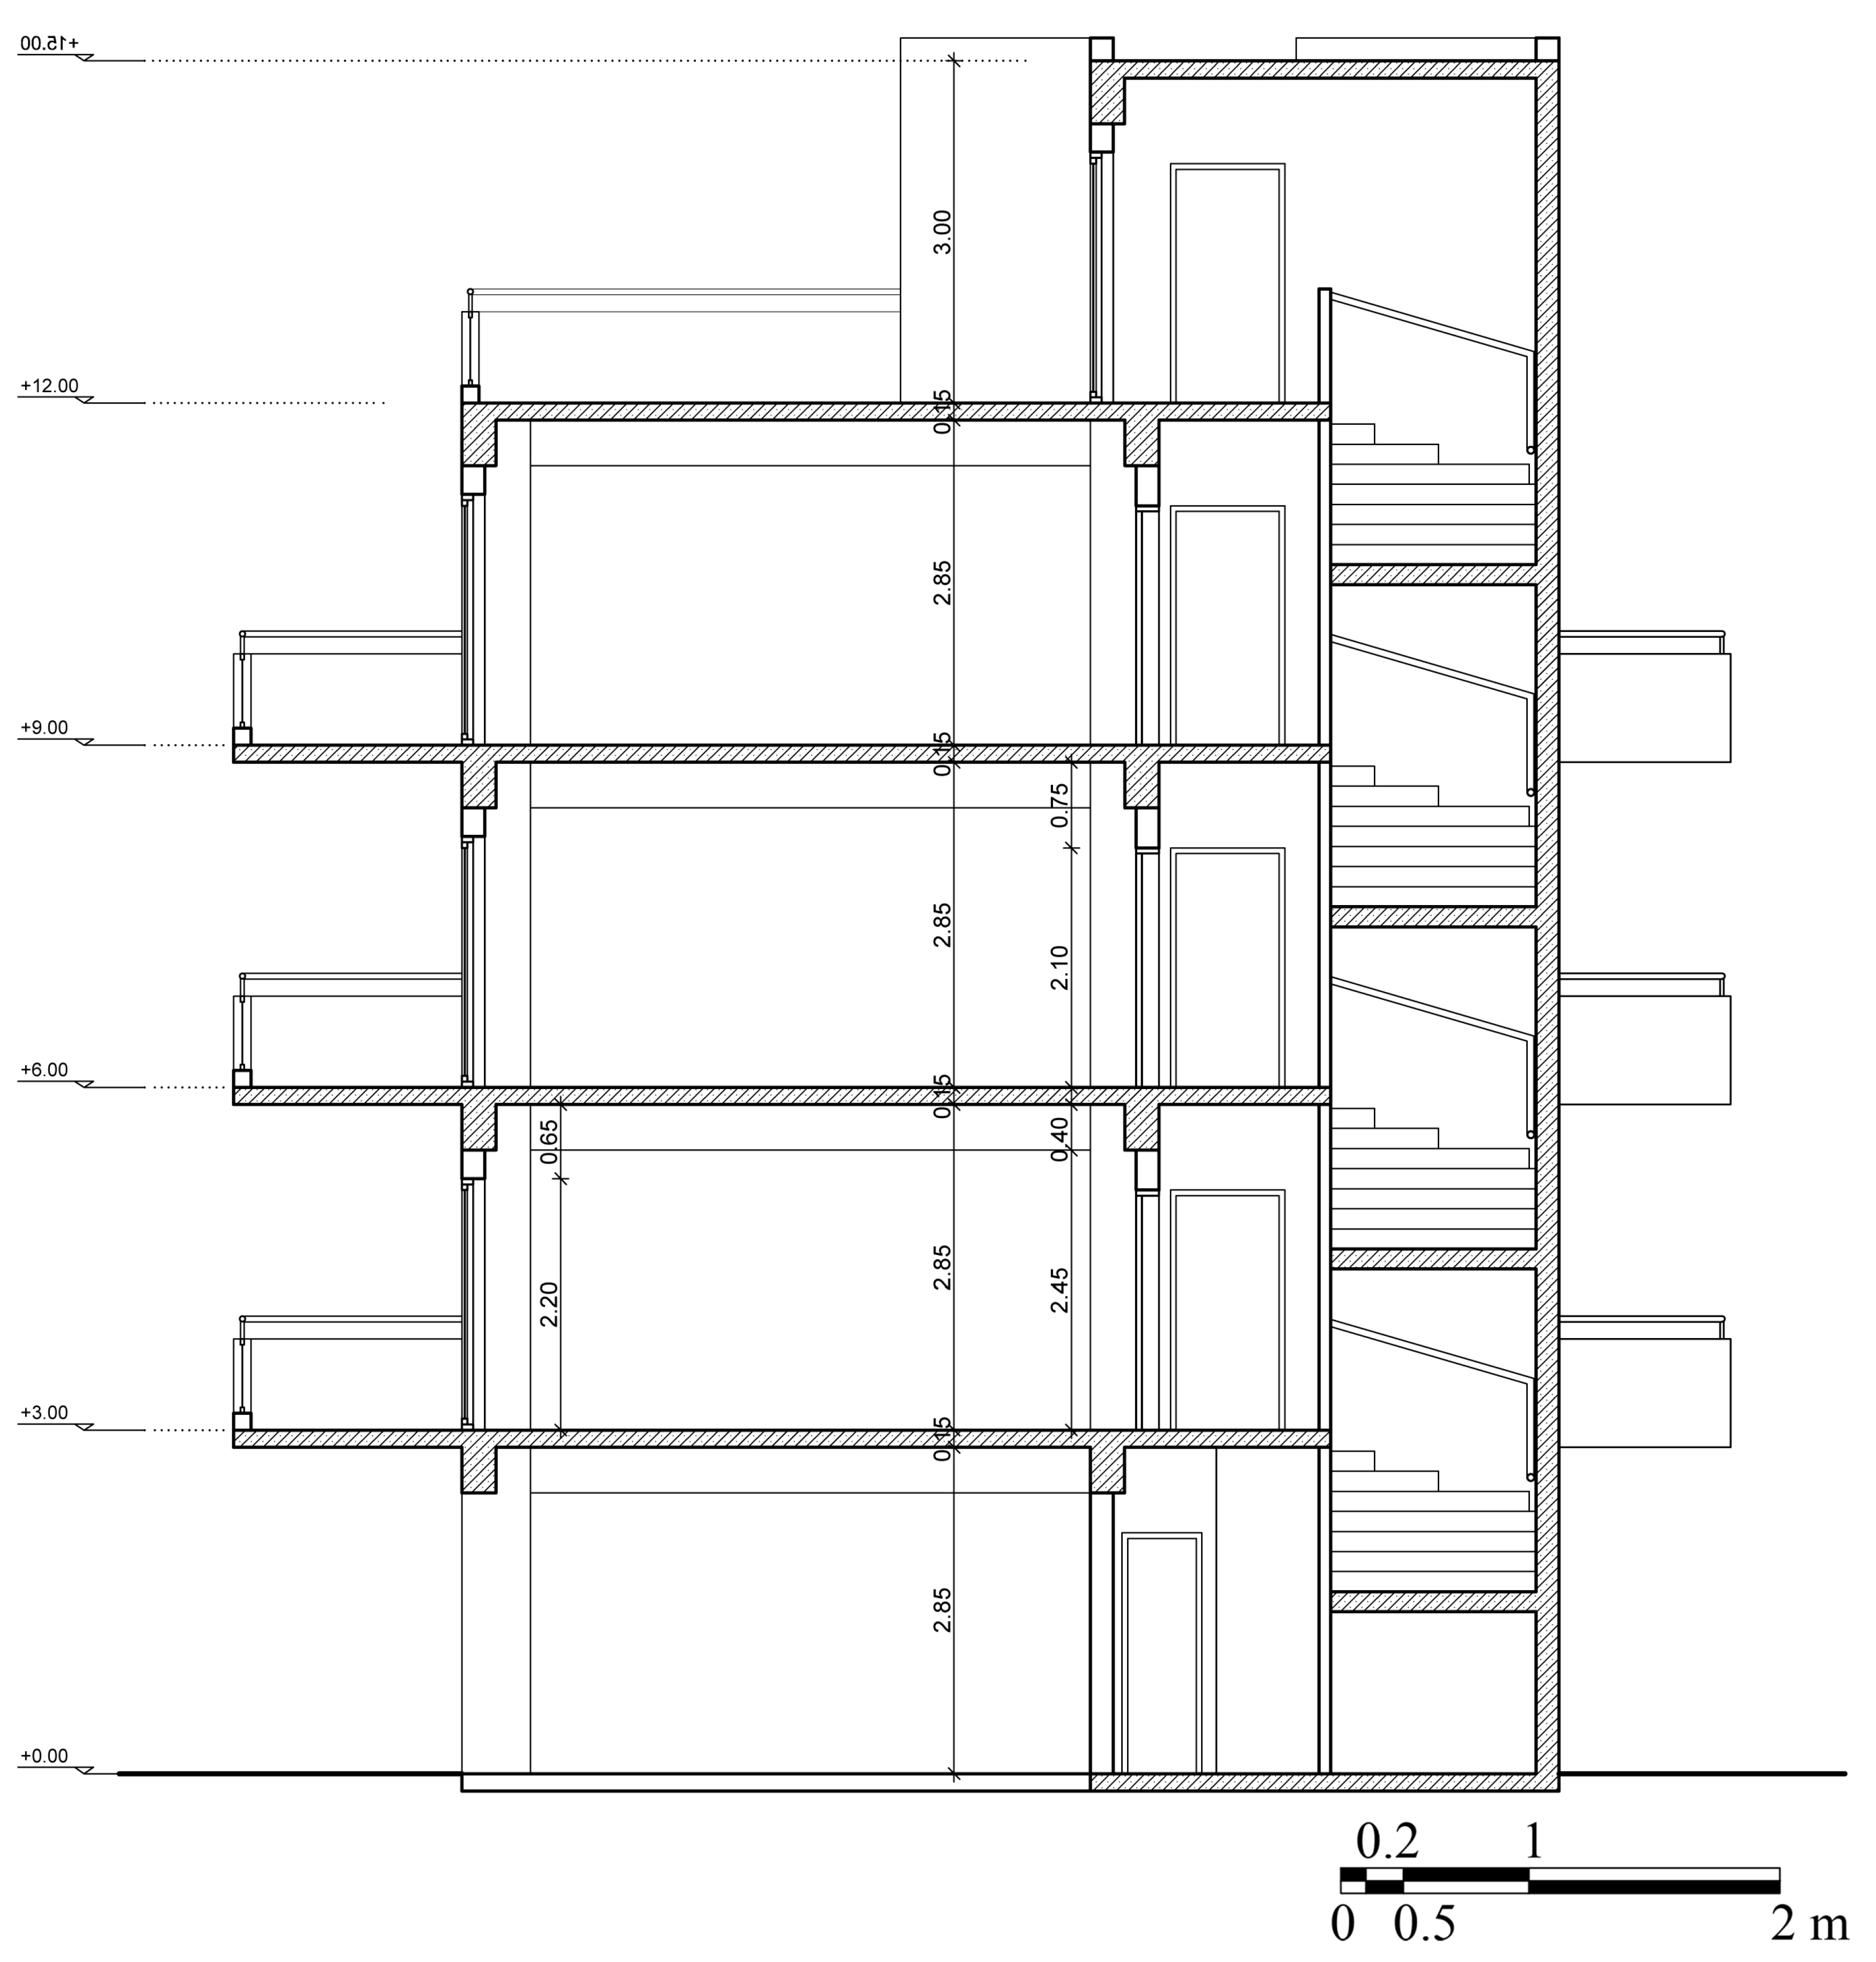
This paper aims to define the optimal thickness of insulating protection that is cost-effective to apply in typical Greek, urban, multi-family buildings, based on a parametric study conducted using the European Commission’s proposed guidelines, as described in the following sections.

2. Methodology

2.1. EU Official Comparative Methodology Framework

Articles 3, 4 and 5 of the EPBD recast [1] outline the general methodology framework for the calculation of the cost-optimal minimum energy performance requirements for buildings and building components. Annex I provides additional information, while Annex III specifies the following necessary steps:
  • define reference buildings,
  • define energy efficiency measures to be assessed for the reference buildings,
  • assess the final and primary energy need of the reference buildings with the defined energy efficiency measures applied and
  • calculate the costs (i.e., the net present value) of the energy efficiency measures during the expected economic lifecycle applied to the reference buildings by applying the comparative methodology framework principles.
Finally, Commission Delegated Regulation (EU) No 244/2012 [2] and its accompanying guidelines [3] clarify the following issues:
  • the energy performance of the applied measures will be calculated by the energy needed for heating, cooling, ventilation, domestic hot water and lighting systems
  • the resulting primary energy use will be calculated using primary energy conversion factors established at national levels
  • energy performance results shall be expressed in square meters of useful floor area of the reference building and refer to primary energy demand
  • both macroeconomic and financial calculations shall be executed
  • the discount rates to be used shall be determined after the performance of at least two sensitivity analyses with different rates
  • the cost categories to be included in the calculations are initial investment costs, running costs, energy costs, disposal costs and cost of greenhouse gas emissions (macroeconomic calculation only)
  • in projecting energy costs developments, the energy price development forecasts of annex II shall be used
  • cost data shall be market-based and coherent as regards location and time, expressed in real terms (excluding inflation)
  • a calculation period of 30 years for residential buildings shall be used
For the purpose of this research the above factors have been customized to the Greek conditions and standards and also limited to new residential multi-family buildings in urban areas. The costs of the materials used (which also include application and not only the cost of supply) were defined after an extensive analysis of the Greek market to match the conventional Greek construction techniques. Their thermal/physical characteristics (Table A2) were in line with the TEE technical guidelines [14,15,16,17]. For the energy consumption calculations, the official asset rating software TEE KENAK was used, which follows the ISO 13790 standard [18].
Except for the gradual increase of the insulation thickness and its likely additional costs, any other cost regarding the building materials, electromechanical systems, door/window frames etc. is not taken into account to emphasize on the insulation’s impact on overall energy expenditure and consecutive savings. Technological advances that could lead in a reduction of wall insulation purchase and placement costs are also ignored since in the 30 years of the considered economic lifecycle, typically, a cost of replacement for wall insulation materials doesn’t exist. Furthermore, the residual value of the insulating material at the end of the calculation period is considered to be zero. Finally, future energy prices were based on EU’s Reference scenario on energy, transport and GHG emissions [19] and the cost of greenhouse gas emissions was defined according to the Table provided in Annex II of the Commission Delegated Regulation (EU) No 244/2012 [2,20]. In order for this study to be comparable with existing and future publications in the same field (optimal characteristics of the building’s energy consumption related factors) the official methodological approach of cost-optimality required by the European community’s norms is followed and consequently, cost-effectiveness of the measures by BCR, IRR, ROI and TOI calculations is not examined in this paper.

2.2. Reference Building

The Reference Building used for the energy simulation and cost calculations is a four storey multi-family residential building on pilotis (Figure A1a), representative for the Greek building standards [21] according to statistical information. It houses nine medium-size apartments on the first, second and third floor (Figure A1b) and two small studios on an open terrace at the fourth floor (Figure A2a). The building’s main façade (Figure A3a) is on an 11 m wide street (typical for Greek cities) and its orientation is South. The building is attached to neighboring ones of the same height (15 m) on its two smaller sides and its back façade (Figure A3b) faces the open space of the city block. All apartments have balconies on the front and the back and there is a central non-heated staircase and lift compartment for entrance access to them. Table 2 and Table 3 summarize the main characteristics and measurements of the reference building, as described above. Detailed drawings of the reference building can be found on Appendix A (Figure A1, Figure A2, Figure A3 and Figure A4).

2.3. Insulation Scenarios

Current KENAK requirements regarding U-Values of building elements [15] (p. 44) are translated to minimum insulation thicknesses of about 5 (climate zone A) to 8 cm (climate zone D) for standard reinforced concrete-masonry constructions such as the reference building described in the previous section. To support the validity of this study, a wide range of insulation thickness levels was examined, to support the validity of this study. For each one of the four climate zones of Greece (Figure 1) ten scenarios of insulation thickness were set, starting from 3 cm (a step below the requirements of KENAK for climate zone A) with a gradual increase step of 2 cm. This led to the following (nine plus one) figures—insulation scenarios: 3, 5, 7, 9, 11, 13, 15, 17, 19 cm of insulation and an additional 25 cm scenario, to ensure that U-values at the level of Passive House requirement (0.15 W/m2·K for walls) or in line with other North-European countries are also considered. It should be noted that for Greek building techniques a figure over 9 cm of wall insulation is currently considered exaggerated. However, given the EU targets on Energy Efficiency and nearly Zero Energy Buildings (nZEBs) and current practices on other European countries it is considered useful to include higher thicknesses in the parametric study. The insulation material used is Extruded Polystyrene Foam (XPS)—most commonly used on the Greek construction industry—and it is placed externally on the building envelope to minimize the appearance of thermal bridges.

3. Energy Requirement Calculation

The U values of the building elements (as provided in Table A1) were calculated according to the insulation thickness of the ten scenarios and the thermal/physical characteristics of building materials (Table A2). Then, the above values and other parameters (e.g., thermal bridges, undesired ventilation through openings, reference heating, cooling and domestic hot water systems) were inserted to the official national energy calculation tool TEE KENAK, in order to define the annual final energy consumption per fuel for heating, cooling and domestic hot water of the whole building for each Climate Zone, for each scenario (Table 4).
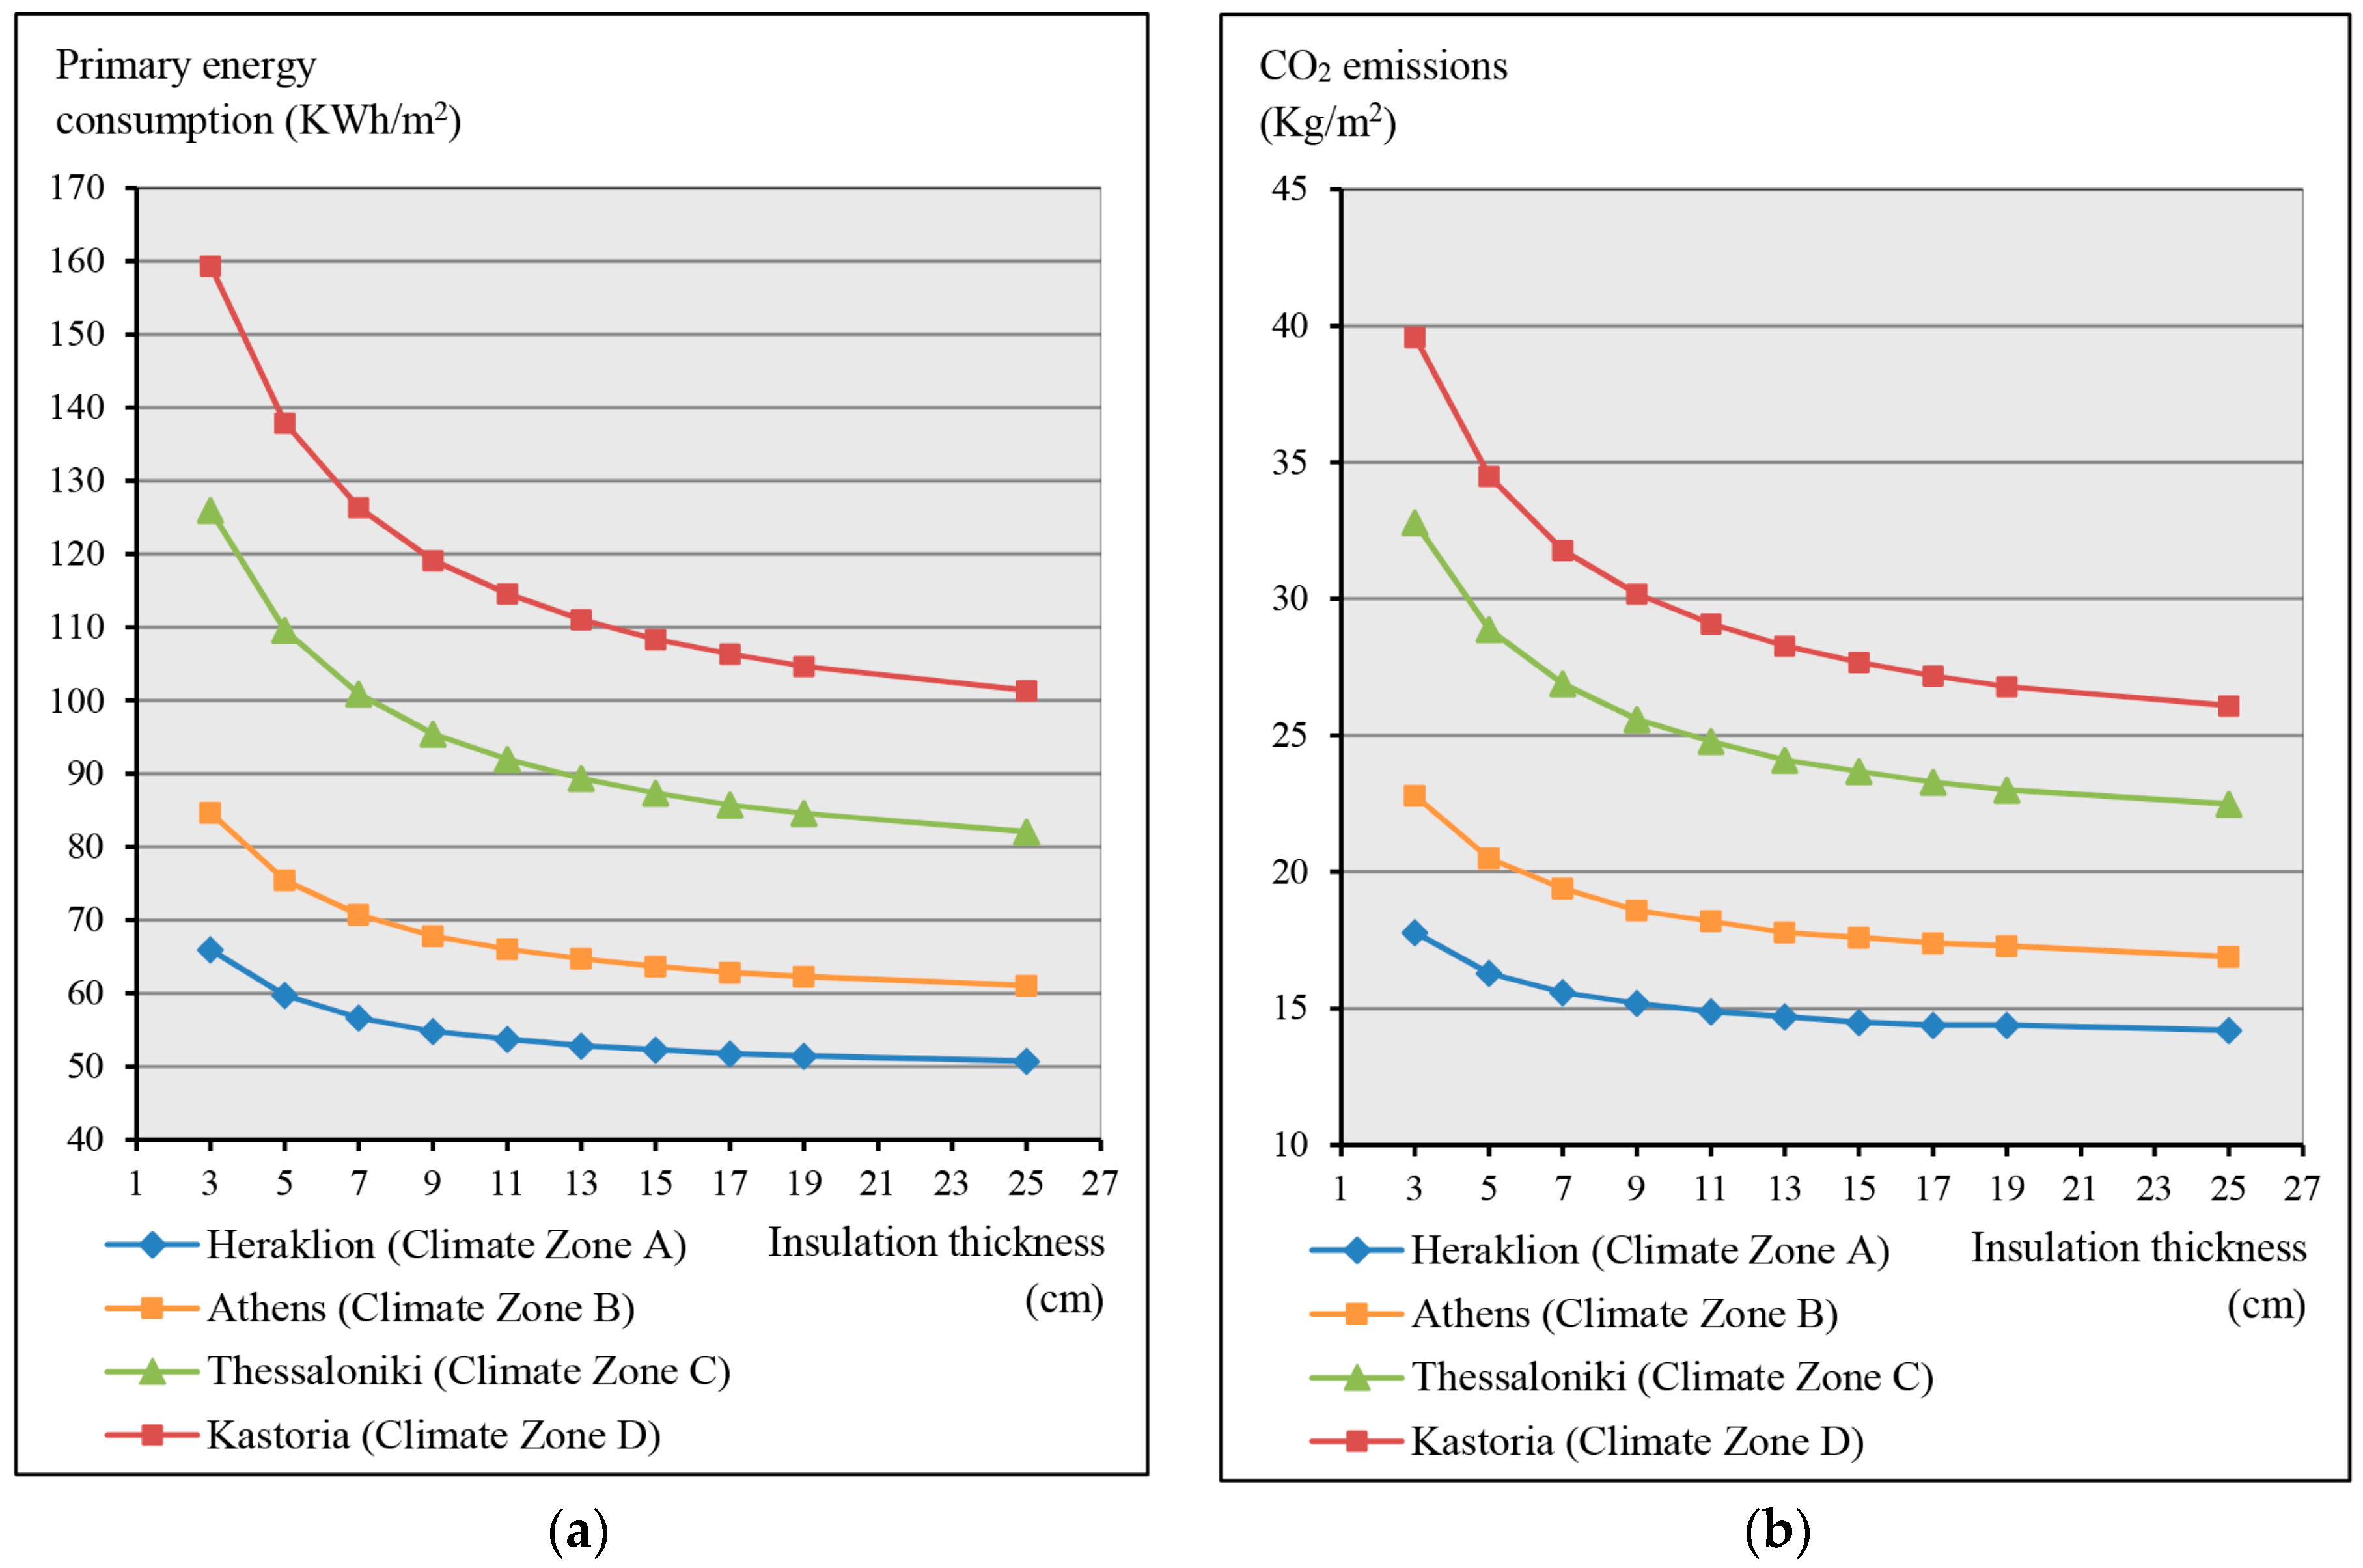
To internalize environmental benefits, the final energy consumption per fuel as shown in Table 4 had to be converted to primary energy requirements, using the appropriate factors from the TEE technical guidelines [15] (p. 12). Therefore, final electricity consumption was multiplied by 2.9 and final heating oil consumption by 1.1 to produce primary energy requirement figures per fuel. Results of the total energy requirements of the reference building in annual primary energy (KWh/m2) and CO2 emissions (Kg/m2) are represented in Figure 2.

4. Cost-Optimal Calculations

4.1. Interest Rates

Cost-optimal level is specified in Article 2.14 of the EPBD recast [1] as “The energy performance level which leads to the lowest cost during the estimated economic lifecycle”. In Article 2 of the European Commission Delegated Regulation (EU) No 244/2012 [2] it is stated that “Global cost means the sum of the present value of the initial investment costs, sum of running costs, and replacement costs (referred to the starting year), as well as disposal costs if applicable.
For the macroeconomic calculation, an additional cost category of greenhouse gas emissions is introduced”. Therefore, Global Cost represents the Total Cost of the above cost categories in present value. Starting from 2016, a 30-year reference period is set (typical renovation cycle for domestic buildings with relatively stable bank interest rates). Sensitivity analyses are performed for different interest rates and energy prices.
According to economic theory, the discount rate should be equal to the opportunity cost of this investment compared to other investment plans or funds. A low interest rate of around 2%–4% (in real terms) reflects more accurately the benefits of the investment throughout its economic lifecycle and in a society scale. On the other side, a highest discount rate reflects a purely commercial short-term approach to investment appraisal. For the basic scenario of the financial calculations the interest rate used was that of Greek 30-year bonds, thought to be the most profitable investment, which was 6.5% in July 2016 [22]. For the sensitivity analyses an interest rate of 13% (double of 6.5%) was used, in line with other Member States choices for cost-optimal calculations [23]. For the macroeconomic calculations, in addition to the mandatory 3% for the basic scenario, the second value used was 4% as a socially accepted interest rate in line with the European Commission’s guidelines on impact assessment [24]. This value corresponds to the average real return of macroeconomic debt in the European Union since the early 1980s. For the annual increase rate of future energy prices the values 2.8% and 4% were used [20].

4.2. Financial Calculation

The financial calculation will demonstrate the limitations of the investment to the private investor. Therefore, the values taken into account are those paid by the customer including all applicable taxes (VAT and taxes). Subsidies are ignored, since they do not remain the same over time. As stated before, interest rates of 6.5% and 13% (in real terms) are combined with an annual increase of 2.8% and 4% for the energy prices to create one basic and three sensitivity analysis scenarios, in order to investigate the influence of interest rates and future energy prices on the conclusions (Table 5).
The Global Cost of the investment is calculated as [2]:
C t =   C I + j [ i = 1 t ( C a , i ( j ) * R d ( i ) )   V f , t ( j ) ]
where:
  • t means the calculation period
  • C t means global cost referred to the starting year over the calculation period
  • C I means initial investment cost for measure j
  • C a , i   ( j ) means annual cost during year i for measure j
  • V f , τ   ( j ) means residual value of measure j
  • R d   ( i ) means discount factor for year i based on discount rate r to be calculated as:
R d   ( p ) =   ( 1 1 + r / 100 ) p
where:
  • p means the number of years from the starting period and
  • r means the real discount rate

4.3. Macroeconomic Calculation

The macroeconomic calculation aims to assist in the preparation and documentation of the definition of generally applicable minimum energy performance requirements from the broader perspective of the public interest according to which the investment in energy efficiency and its associated costs and benefits are assessed in relation to other alternative policies, also taking into account the externalities which may exist. The values used for the calculations (e.g., cost of materials) exclude all applicable taxes (VAT and taxes) and an additional cost category of carbon emissions is added to the equation [20]. Other externalities which may exist could be market barriers-conditions (costs) and increased value of property, energy security, employment creation, improved indoor climate, health and comfort (benefits). The official methodology leaves on Member States the flexibility to include or not such externalities in the macroeconomic perspective via e.g., lower interest rates (for co-benefits). Therefore, interest rates of 3% and 4% (in real terms) are combined with an annual increase of 2.8% and 4% for the energy prices to create one basic and three sensitivity analysis scenarios (Table 6).
The Global Cost of the investment is now calculated using the following equation [12]:
C t =   C I + j [ i = 1 t ( C a , i ( j ) * R d ( i ) + C c , i ( j ) )   V f , t ( j ) ]
where:
  • C c , i   ( j ) means carbon cost for measure or set of measures j during year i

4.4. Initial and Annual Running Costs

For the Global cost calculations according to Equations (1) and (3), the initial investment cost per square meter was defined for each insulation scenario based on construction practices and market research on available prices (Table 7). The annual operating costs which consist of the energy cost for heating, cooling and hot water use, where defined using official prices of the electricity and heating oil (Table 8) per KWh of primary energy use as analyzed per fuel source on energy consumption calculations. For the electricity, the price stands for a single phase supply for residential use in the 0–800 KWh scale (four months period) [25]. For the heating oil, taking into account its calorific value of 11.9 kWh/lt and assuming a typical 90% COP for boilers, it is estimated that 0,093 liters account for 1 KWh of thermal energy. The heating oil allowance and social Public Power Corporation tariffs are not taken into account in the calculations, since they do not apply to all households and can vary significantly for a reference period of 30 years that is set.

5. Results

For the financial calculations the prices (initial cost of materials and application, as well as energy costs for electricity and heating oil) were used including taxes and the annual operating costs of the reference building were then reduced to their present value according to the interest rates for the Basic Calculation and the three sensitivity analyses (Table 5), as presented in Section 4.2. The sum of the above amounts represents the Global Cost of the Investment in present value for a 30-year time of investigation. For the macroeconomic calculations the prices were used without taxes and the additional cost category of CO2 emissions was taken into account using prices defined by the European Commission [20] (p. 117). The cost-optimal minimum insulation requirements for each Climate Zone are shown in Table 9 and Table 10.

6. Discussion

The U values of the building elements decrease by around 75% before the 5th insulation scenario (11 cm XPS). Respectively, proportionally highest energy savings of the Reference Building in all Climate Zones occur before the 5th–7th insulation thickness scenario as shown in Figure 2a. Thus, the potential of large energy savings even with small thicknesses of insulating material is clearly visible, considering that almost half of the existing buildings in Greece have no insulating protection at all.
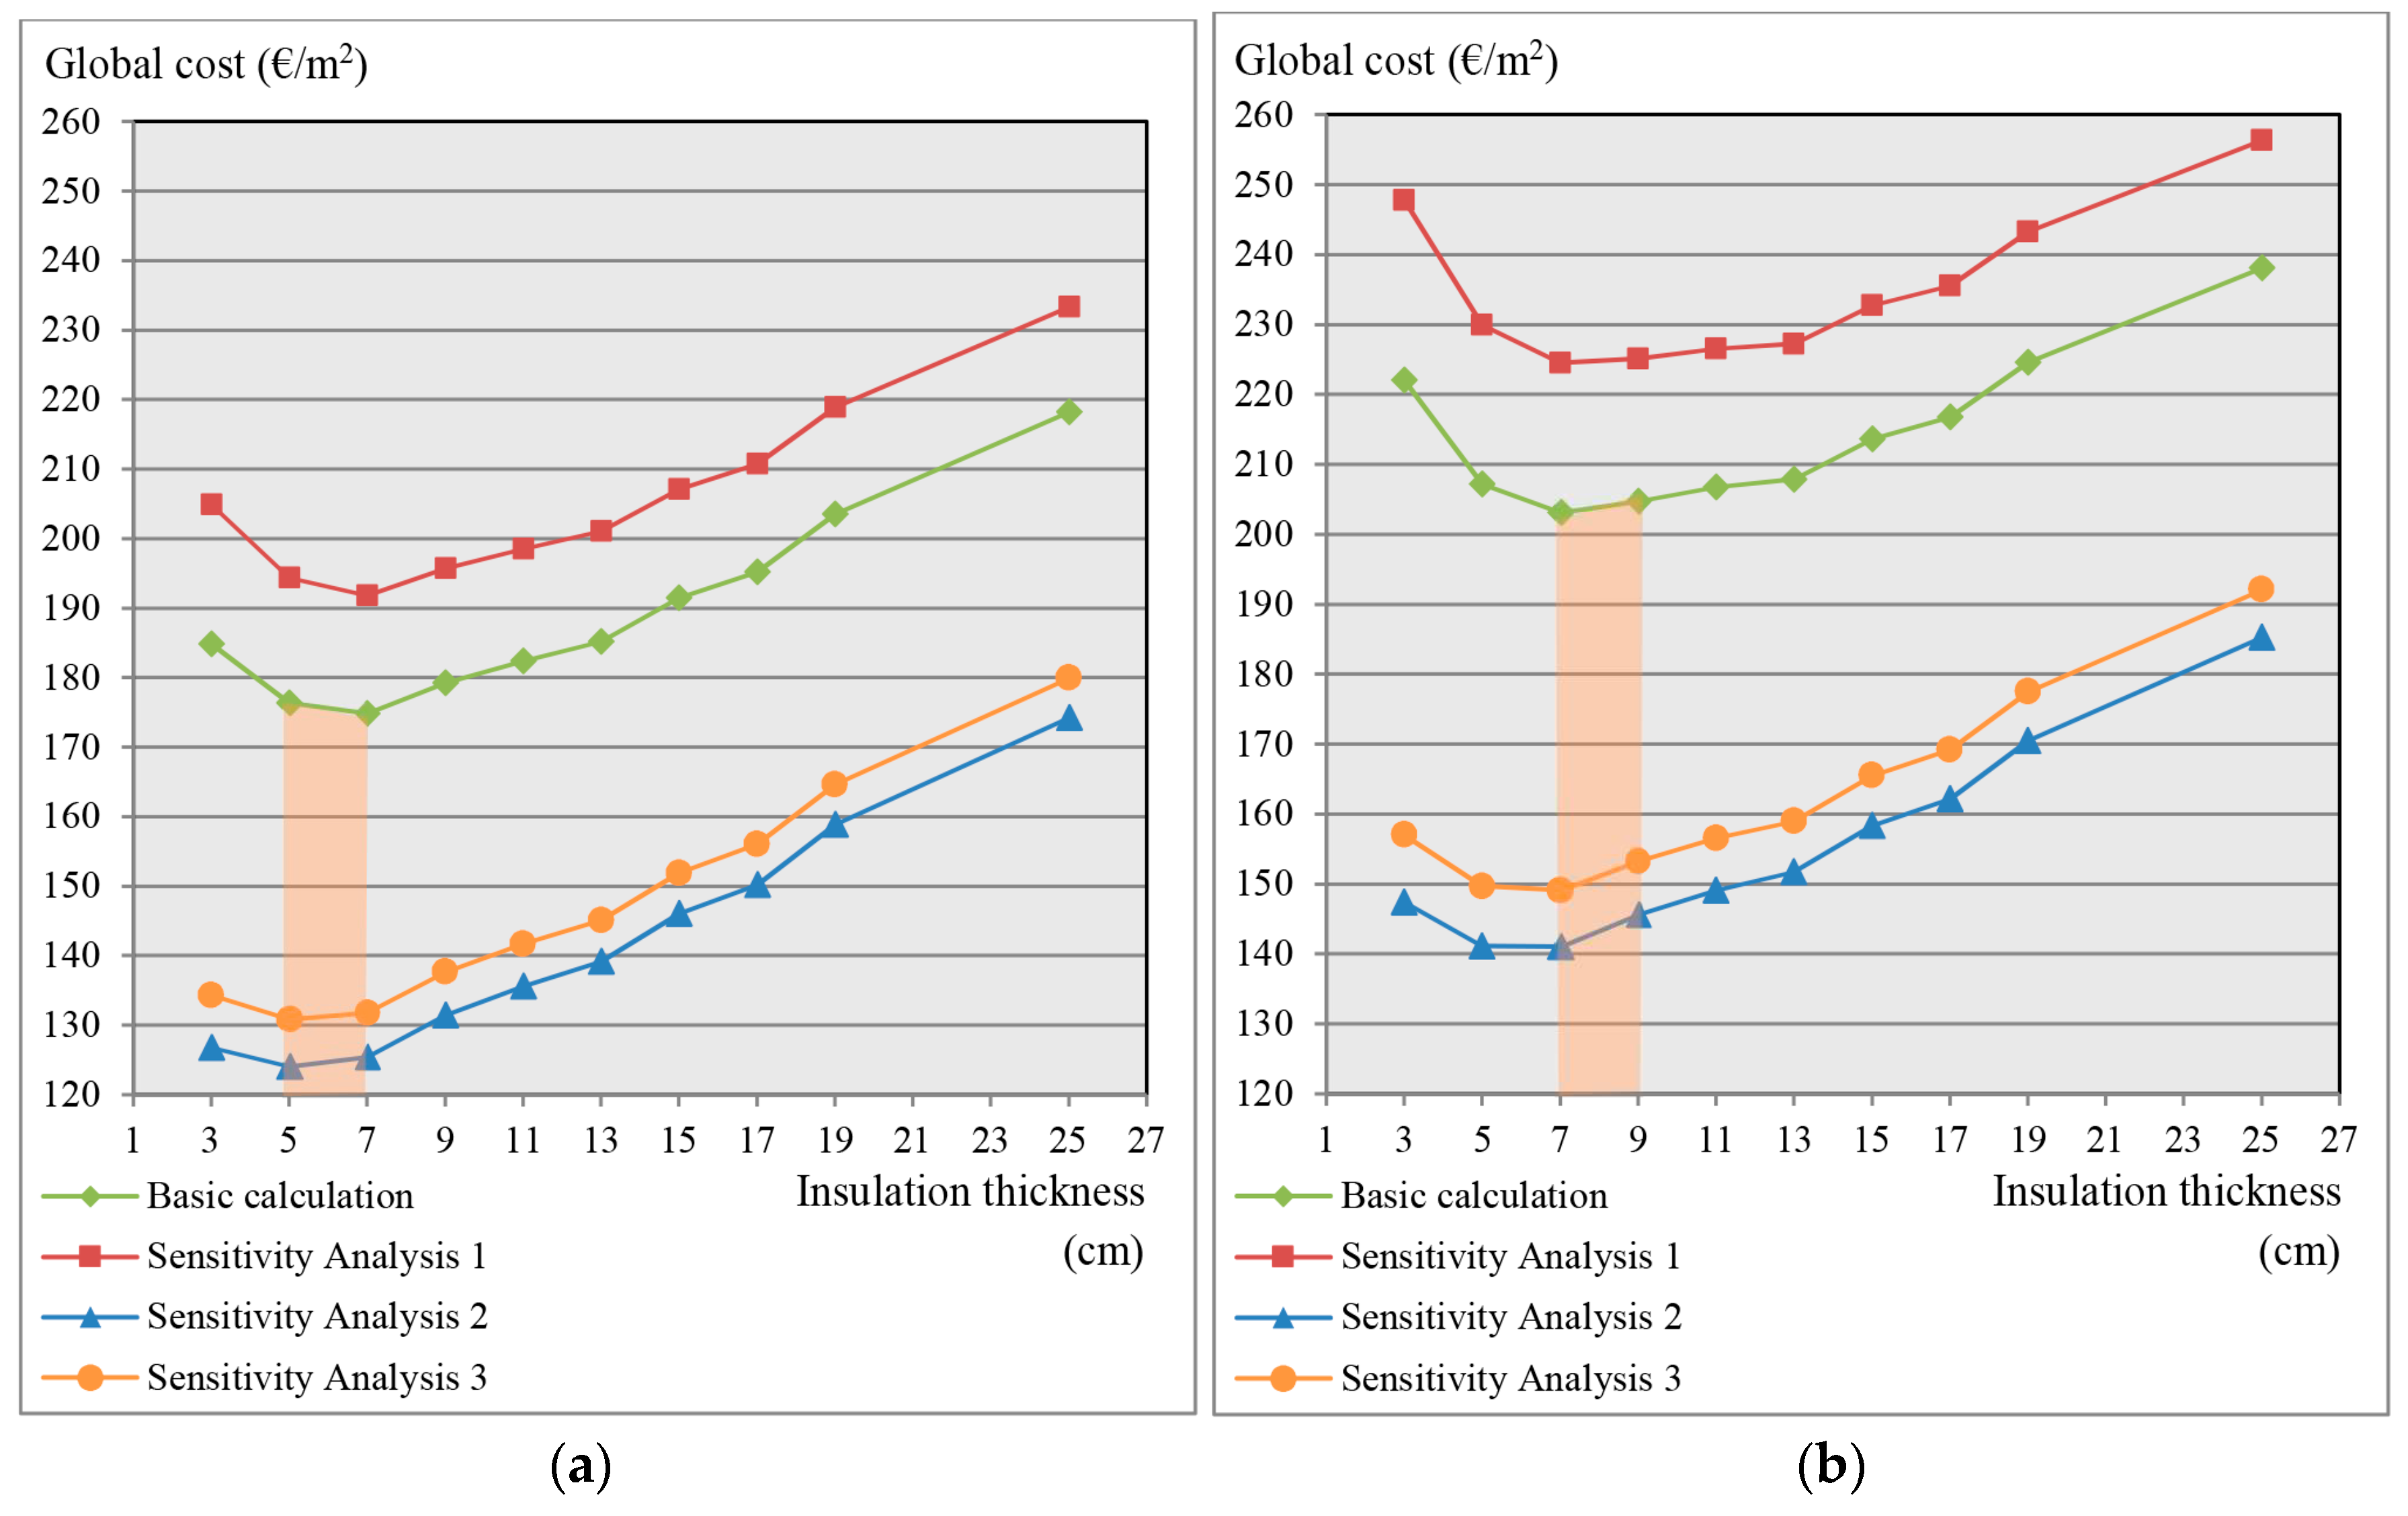
Regarding the cost-optimal calculations, Figure A5 and Figure A6 (
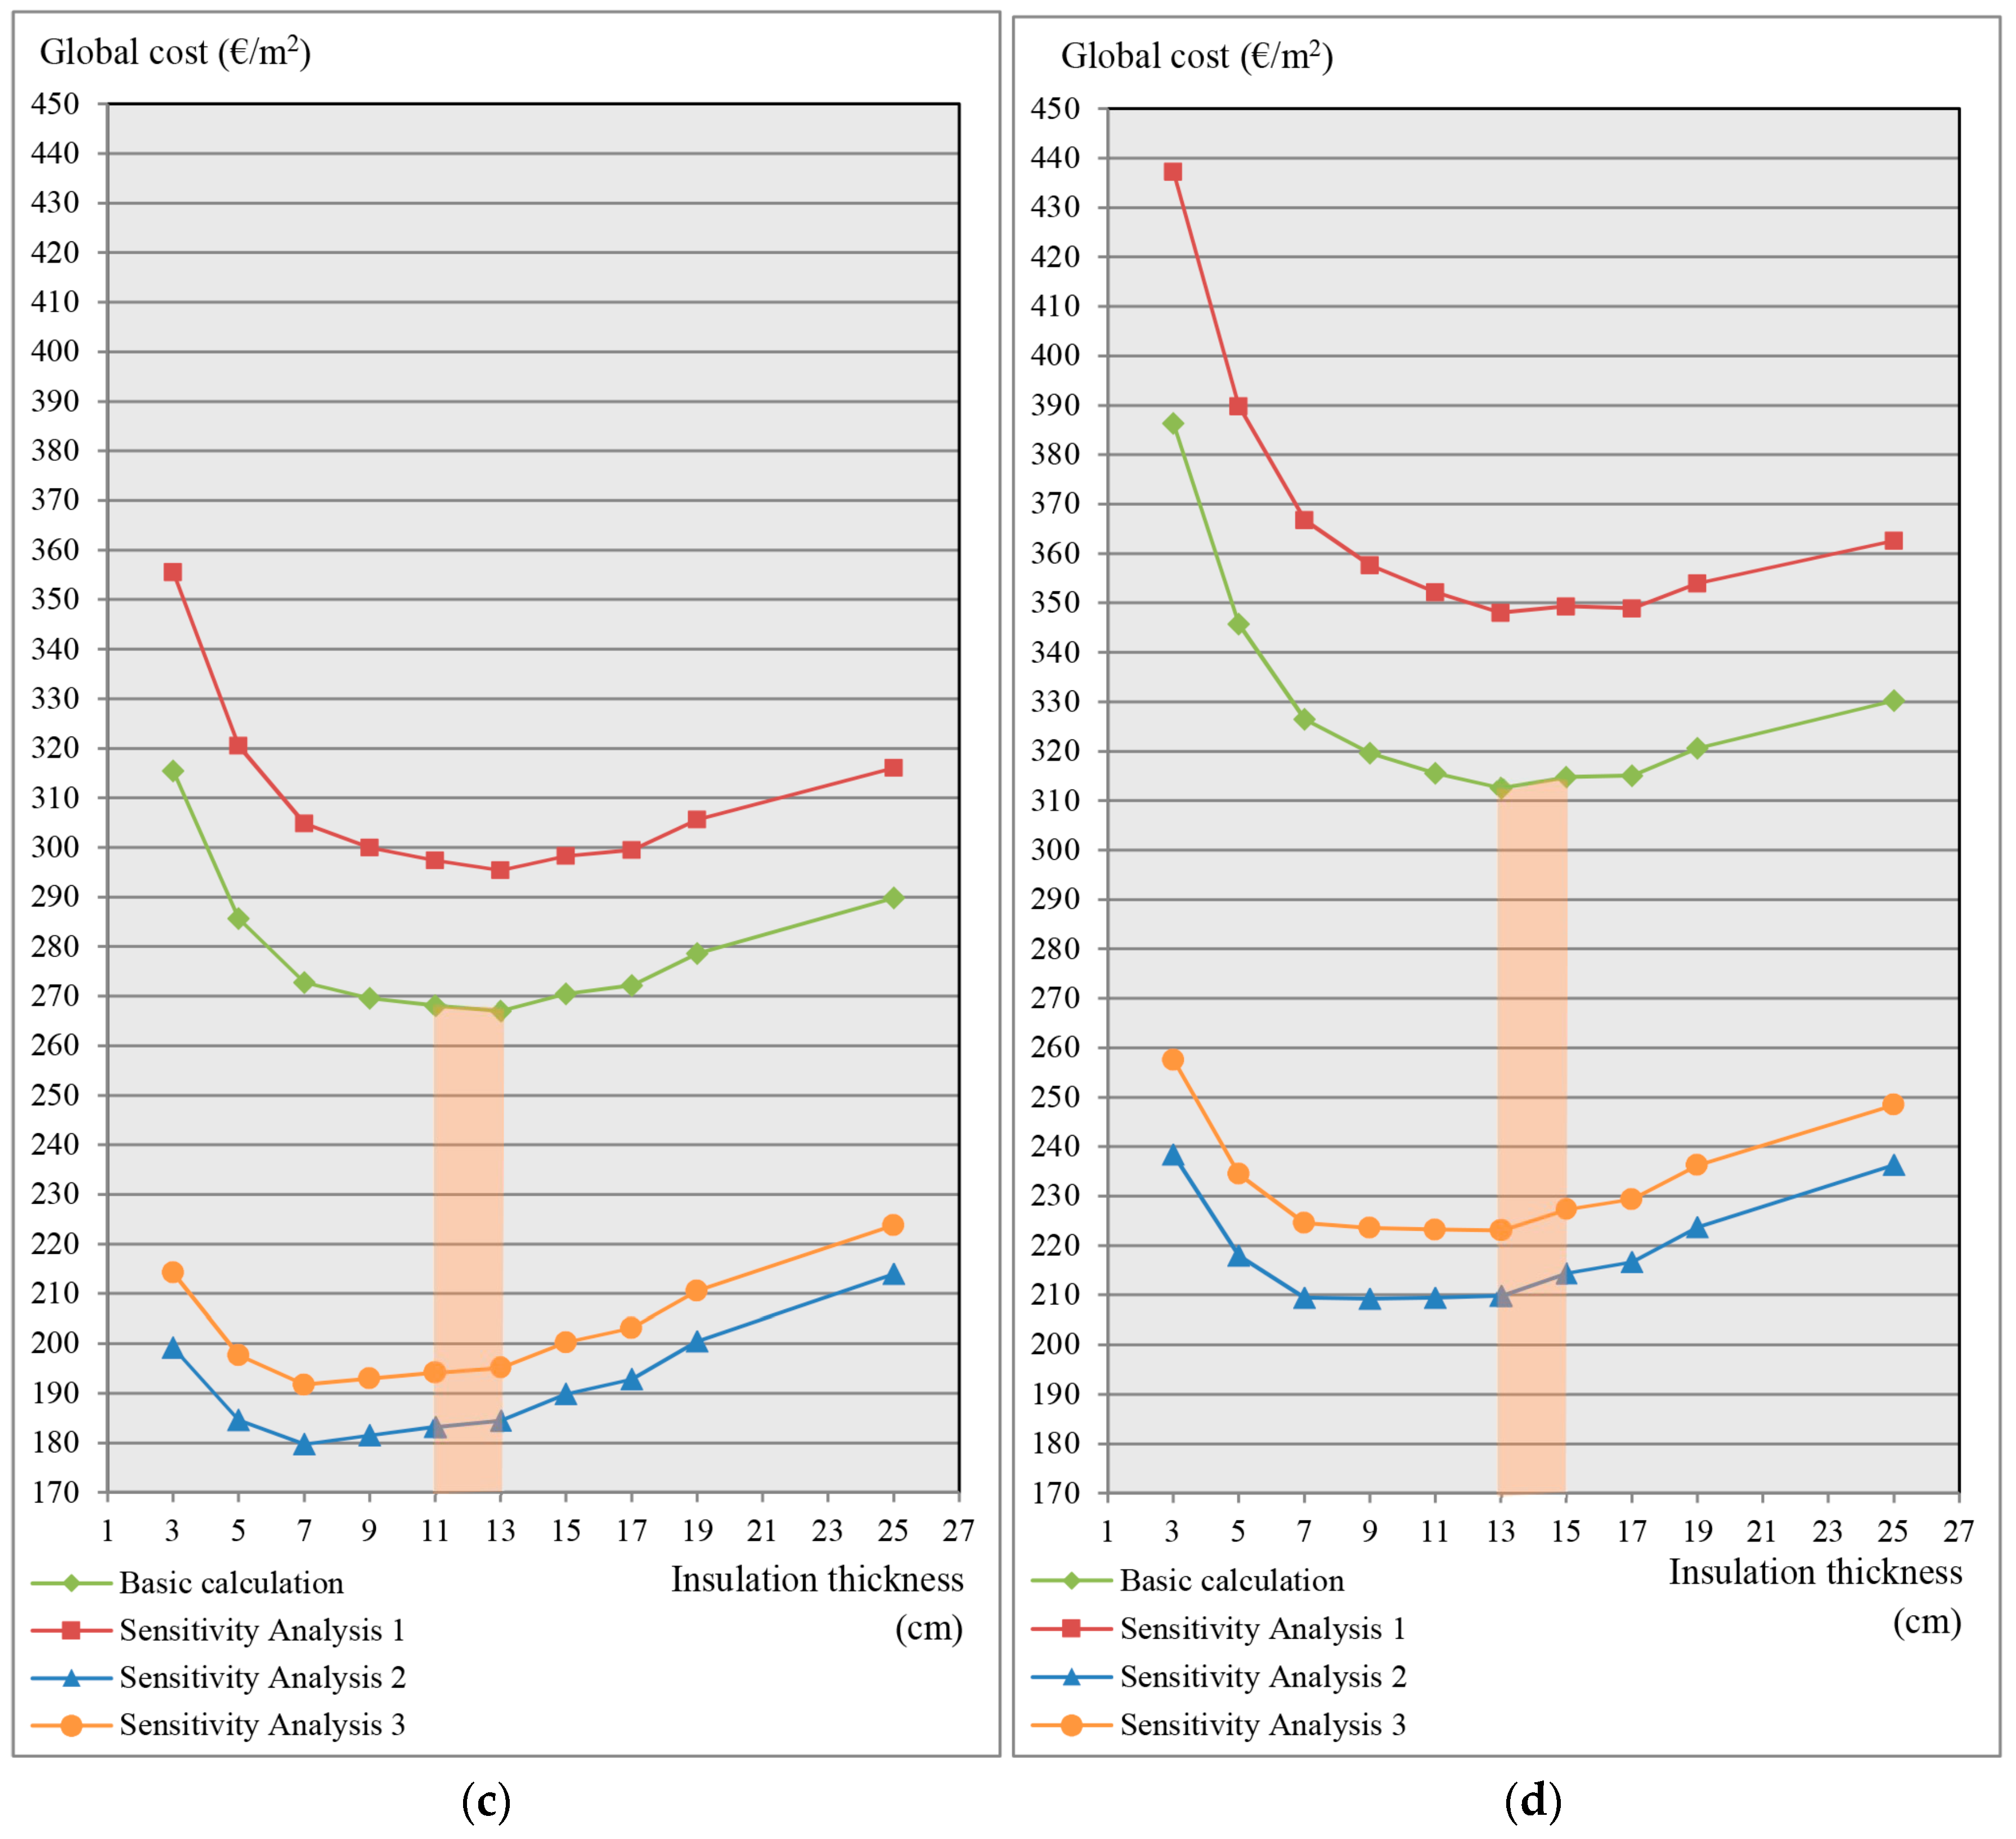
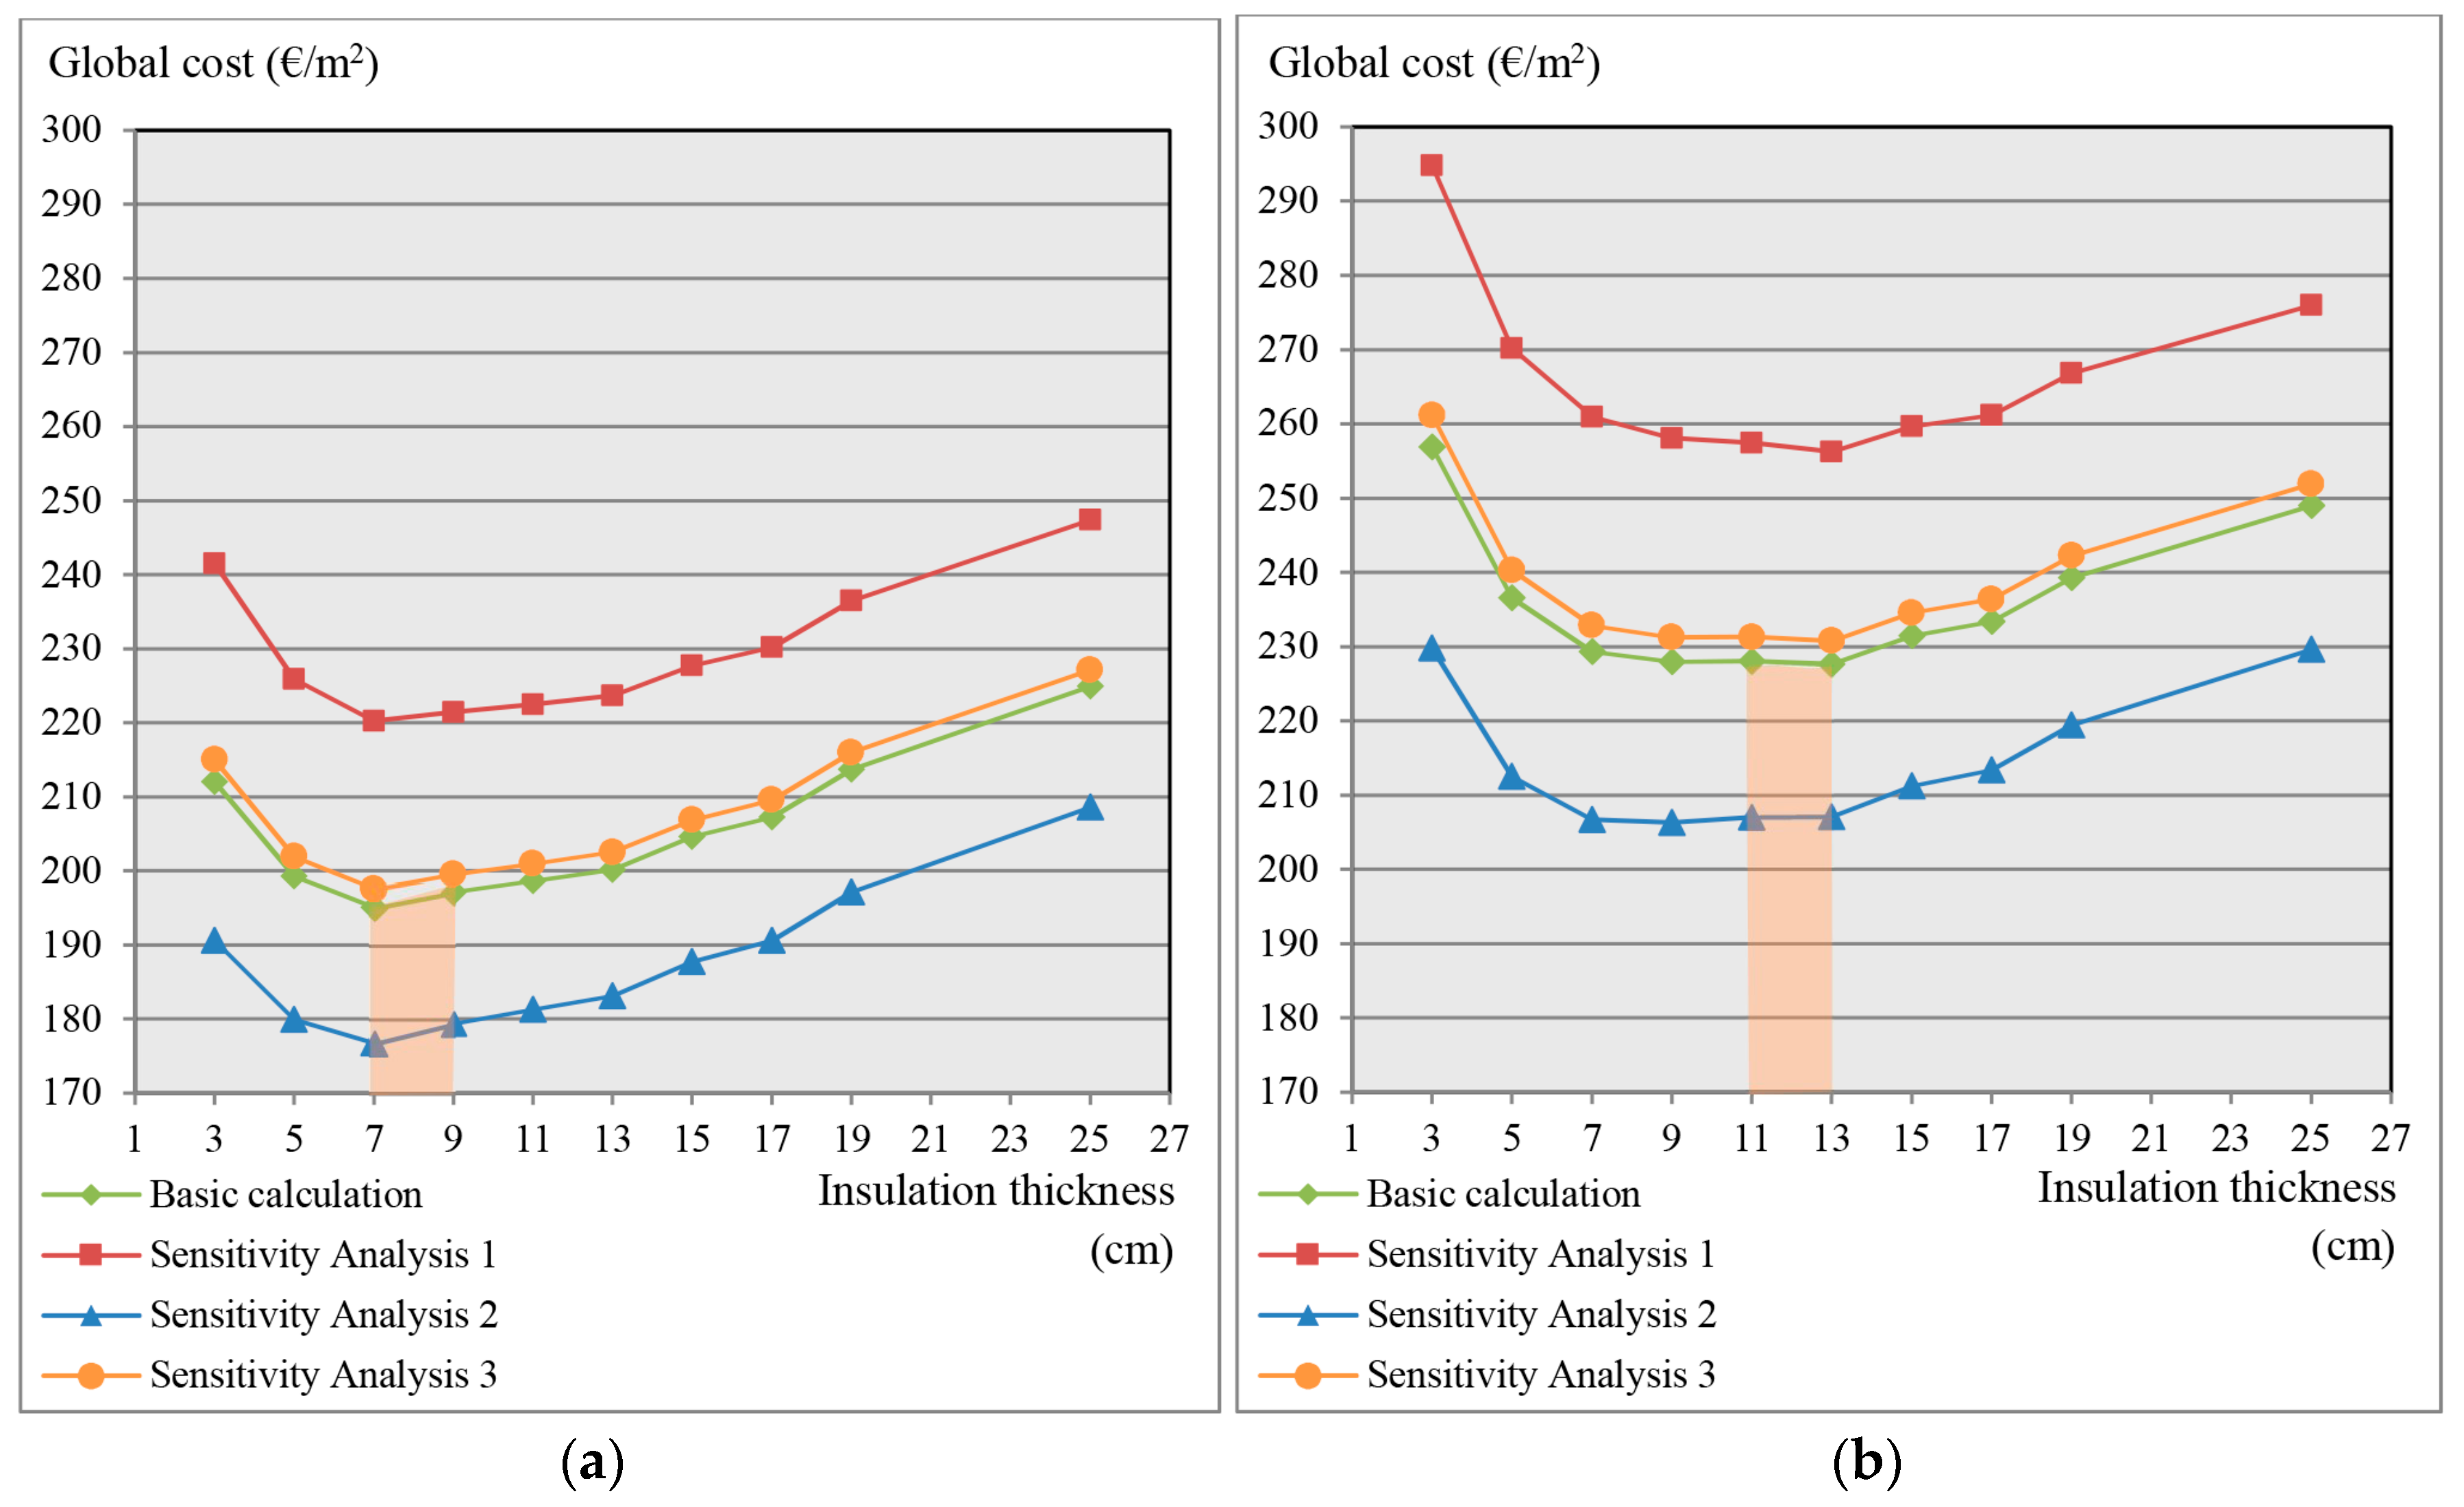
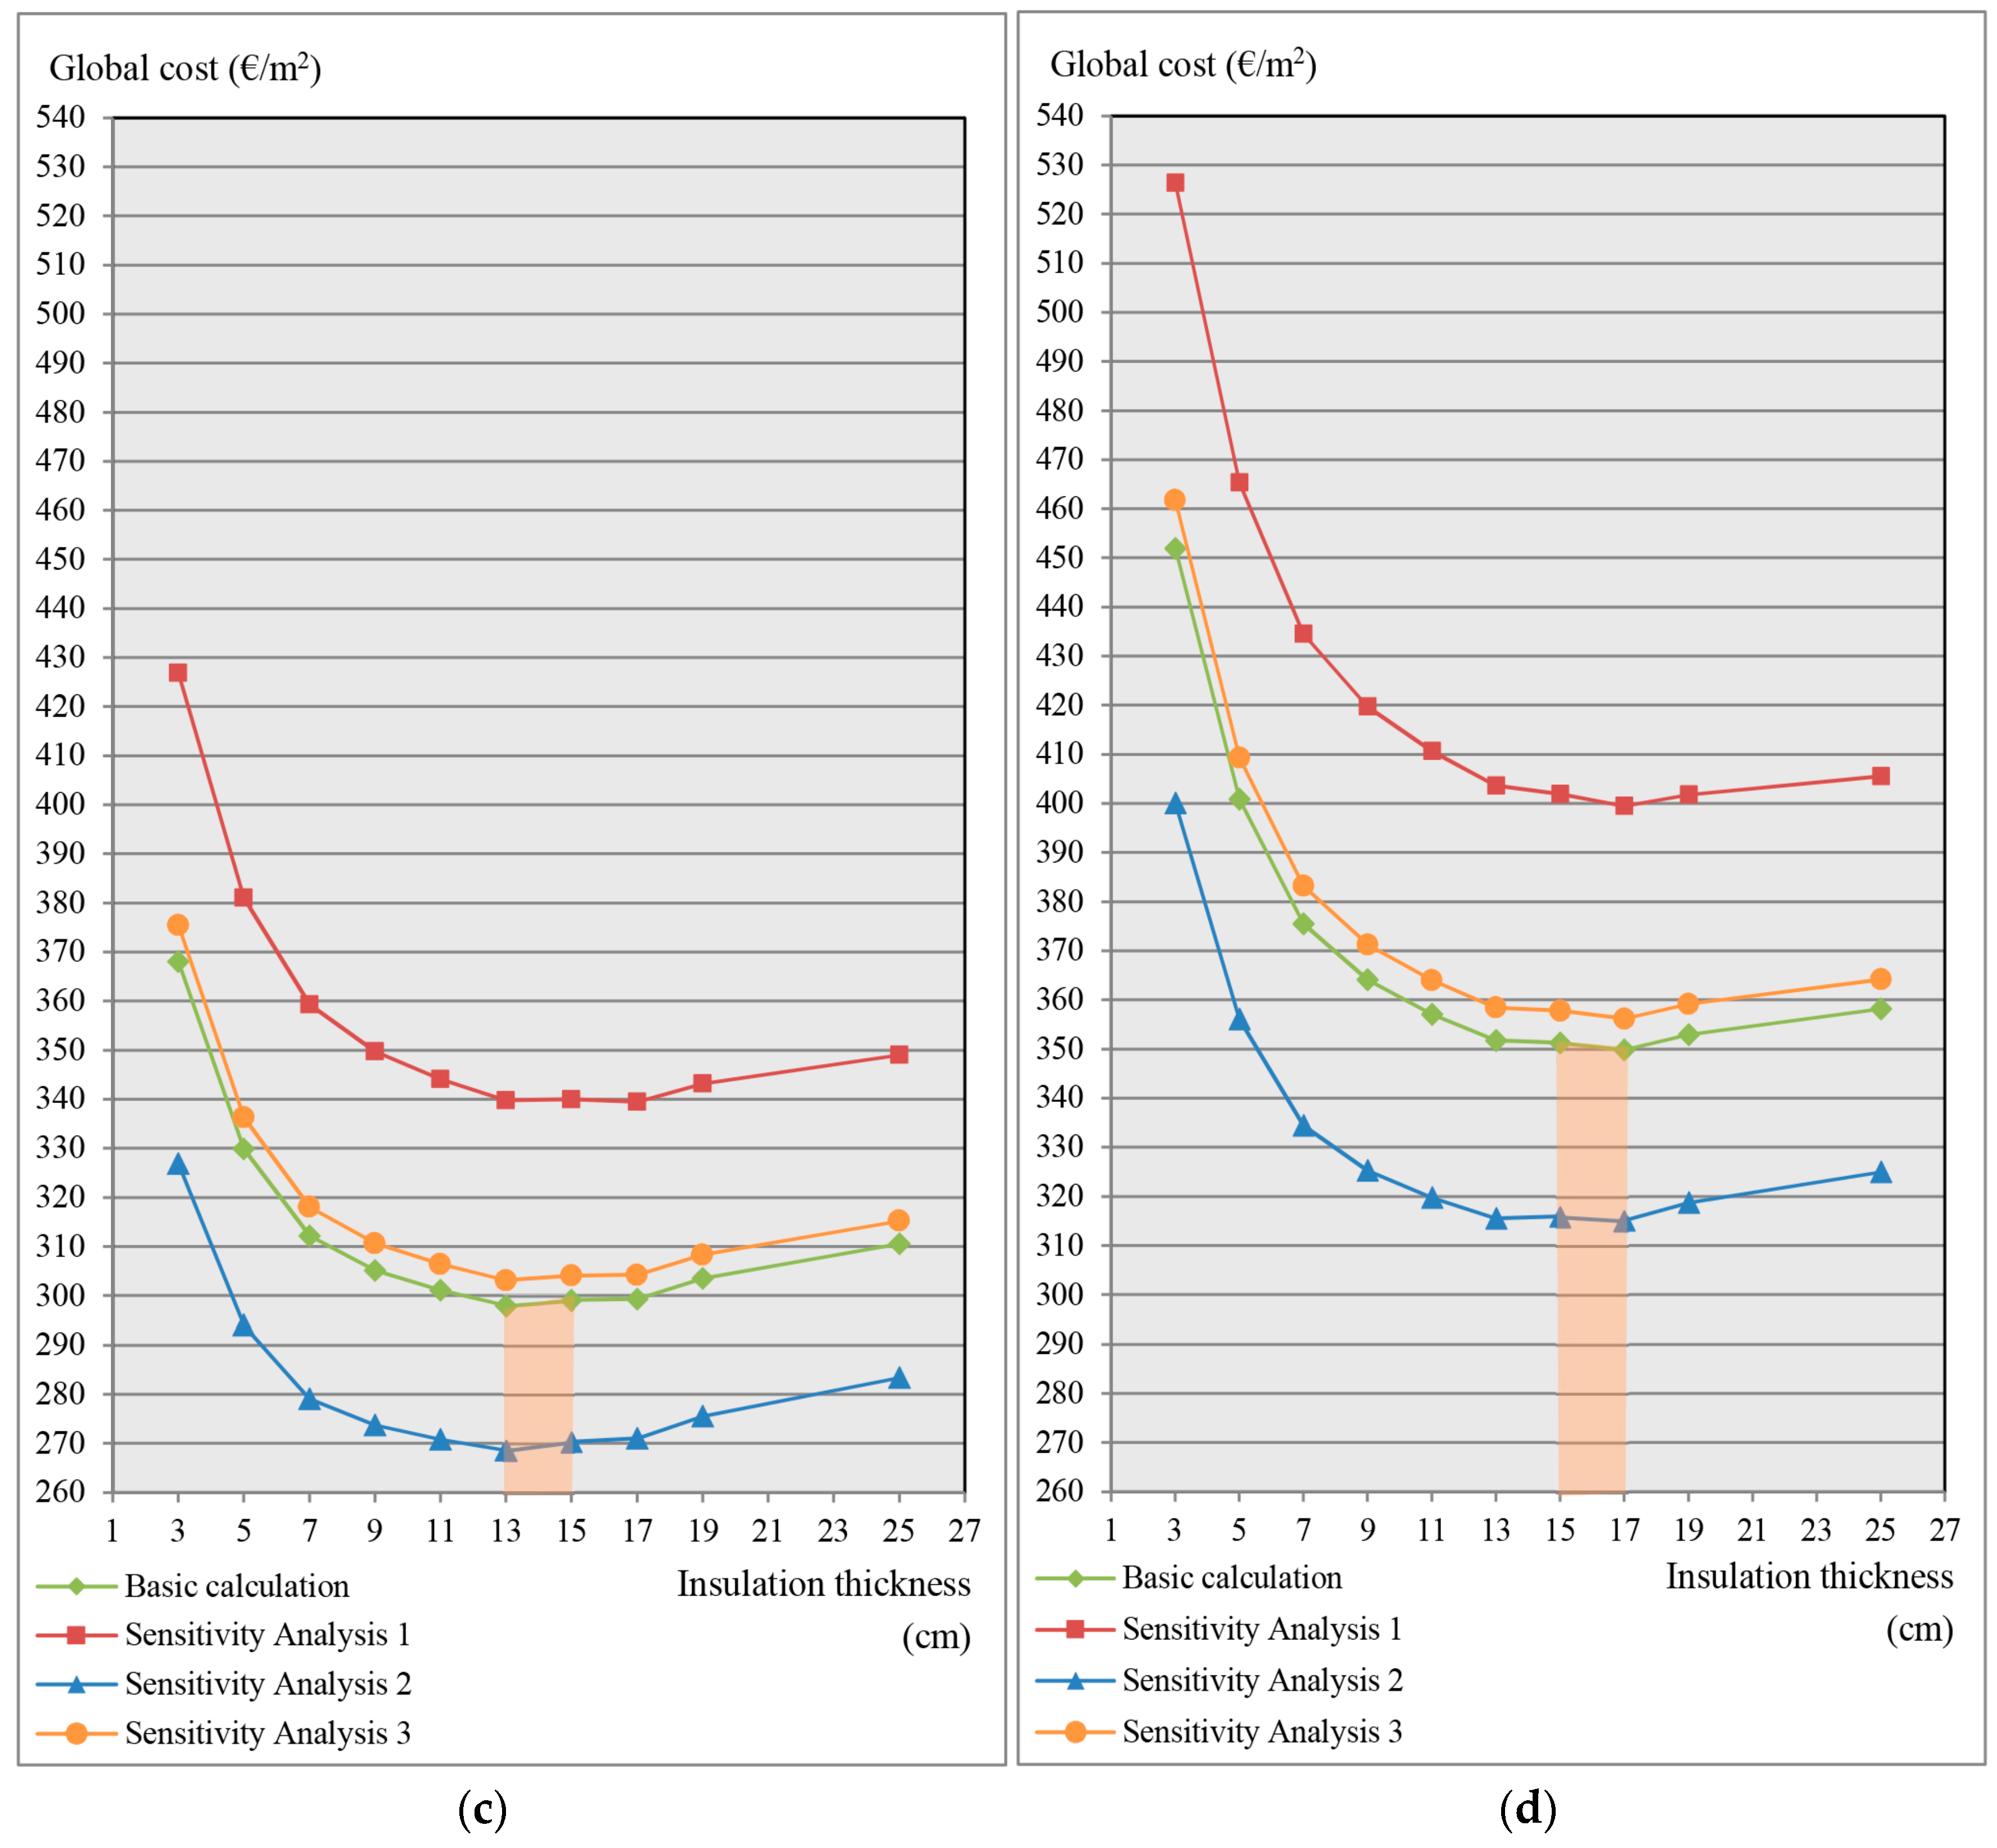
Appendix C) show that the general form and turning points of the Global Investment Cost curves are not affected much by the different rates applied on the Basic and Sensitivity analysis calculations. However, these rates (interest rates, energy prices increase rates) determine the curve’s shift upwards or downwards because they represent the factors that affect future annual costs, while the initial cost of the investment remains the same on all calculations of the same Climate Zone.
The comparative analysis of the results of the cost-optimal calculations reveals several important trends worth mentioning. In Sensitivity Analysis 3, increases on future energy prices are compensated by the higher interest rate and the Global Cost of the investment in present value remains, cumulatively, low. On the other hand, expensive energy prices combined with low interest rates (Sensitivity Analysis 1) skyrocket the Global Cost and cost-optimum levels are found in higher thicknesses of insulation that will provide higher energy savings and will minimize future operating costs. On Sensitivity Analysis 2 a favorable investment environment is presented: a higher interest rate is combined with reasonable future energy prices. In that case, cost-optimum levels are found earlier on the insulation scenarios since the initial cost of the investment matters more.
Cost-optimal levels of insulation differ between the financial and the macroeconomic calculation by as much as two insulation scenarios in the case of Climate Zone B (Table 9 and Table 10). These results indicate the need for financial support, essential to cover existing funding gaps to make the energy efficiency of Greek buildings a competitive market sector. The fact that both the optimal insulation thickness levels, as well as the Global Cost of the investment divagate so much between the financial and the macroeconomic calculations, is a proof that the existing externalities are very important and should be seriously considered.
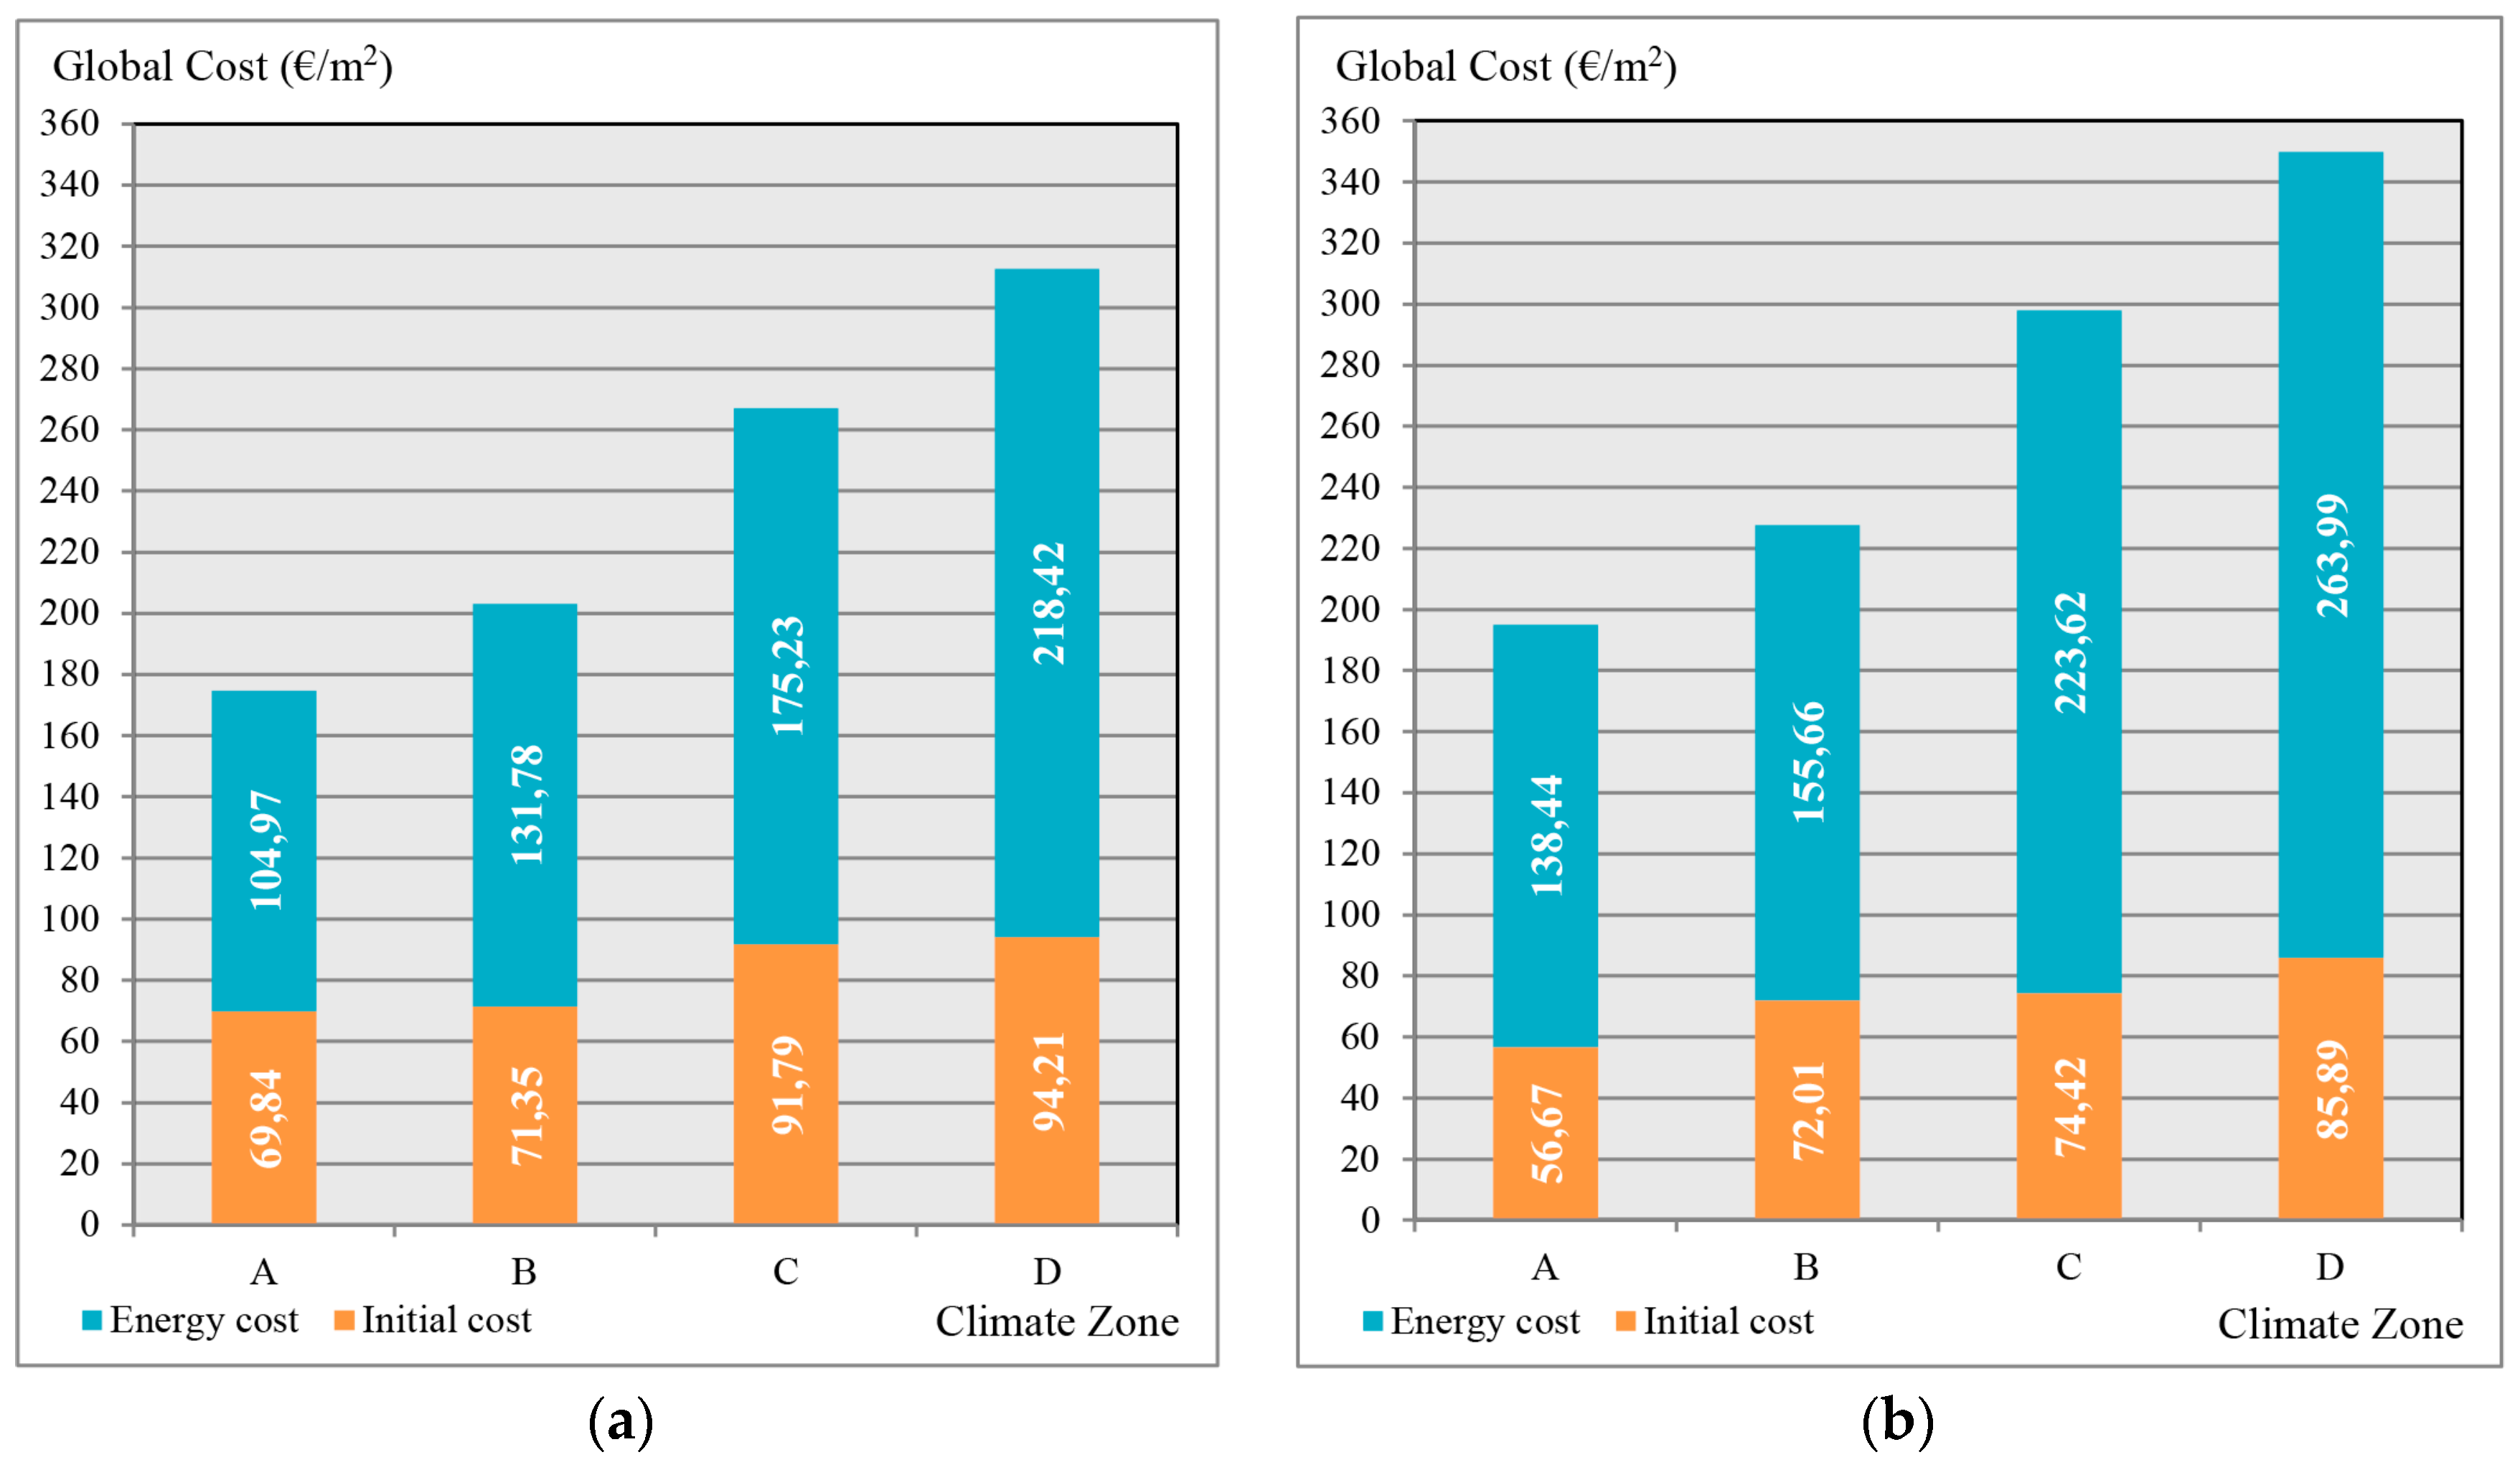
The results of the cost-optimal calculations also demonstrate the existing differences between the four Climate Zones. These are observed, not only on the cost-optimal levels of insulation, but also on the Global Investment Cost and its composition from the initial investment cost and the annual energy costs. In Figure 3, the composition of the total investment cost (initial and sum of annual energy costs) is demonstrated for the four climate zones. It is easily observed that for climate zones A and B, the initial cost of the investment is much more important, in comparison with climate zones C and D, where future annual energy savings play the leading role.
Finally, results show that even though on climate zone D cost-optimum insulation levels seem to approximate the “nZEB” insulation scenario (25 cm XPS), on climate zones A, B and C, where weather conditions are milder (Table 1), the need for excessive thermal protection and future energy savings is limited and higher insulation thickness increases a lot the initial cost of the investment without delivering significant results.
Future research should concentrate on the cost-optimality of other energy efficiency measures, such as the replacement of doors and windows, heating boilers, installation of solar thermal systems etc. Moreover, further sensitivity analyses should be performed, variating financial data according to future economic situations. Finally, new dynamic methods for the assessment of energy efficiency measures should be considered, such as optimization coupled with dynamic simulation, to avoid extensive parametric studies and find solutions adapted to the building’s specific characteristics [27].

7. Conclusions

Based on the above, several conclusions can be drawn and are summarized in the following points:
  • Proportionally, U values of the building elements decrease and cause highest energy savings (~75%) before the 5th–7th scenario (11–15 cm of insulation). This fact indicates that buildings could save a very large amount of energy even with small thicknesses of insulating material.
  • In each climate zone, the Global Cost of the investment -which is expressed by the curve’s shift upwards or downwards—depends largely on the interest rates and future energy prices, whereas its cost-optimal levels of insulation—that are expressed by the curve’s form and turning points—are not affected much by these factors.
  • On all four climate zones, cost-optimal level is observed between the third and eighth insulation scenarios (7–17 cm), higher than the current regulation’s requirements. Thus, more rigorous national energy efficiency requirements are needed in order to create much needed local jobs, healthier indoor environment and happier people, instead of obstructing the recovery of the Greek economy as believed.
  • The comparison between financial and macroeconomic results demonstrates funding gaps and other externalities/barriers on the market, necessary to be tackled in order to increase competitiveness of energy efficiency measures in Greek buildings.
  • The approach on the buildings’ energy efficiency measures to be implemented should vary between the four climate zones considering their differences in prevailing climate conditions. In climate zones C and D, nZEBs seem to be much easier to implement using a well-insulated envelope, rather than on climate zones A and B, where weather conditions are milder and other energy efficiency measures could result in being more effective.

Supplementary Materials

The following are available online at www.mdpi.com/1996-1073/10/3/270/s1, .xml files used for the energy consumption calculations using the TEE KENAK software and spreadsheets of the financial and macroeconomic calculations.

Acknowledgments

This research, including the costs for open access publication, is funded by the Greek State Scholarships Foundation (IKY) under the program “Research Projects for Excellence IKY/SIEMENS”. We would also like to express our gratitude to Dr. Katerina Tsikaloudaki, Assistant Professor in the Laboratory of Building Construction and Building Physics in the Department of Civil Engineering, Aristotle University of Thessaloniki, for providing valuable insight and expertise.

Author Contributions

Theodoros Theodosiou contributed in the preparation of the study and the analysis of the results. Eleftheria Touloupaki performed the calculations, analyzed the results and wrote the paper.

Conflicts of Interest

The authors declare no conflict of interest.

Appendix A

Figure A1. Reference building drawings of (a) the pilotis—ground floor level plan and (b) the typical floor plan (1st, 2nd and 3rd floor).
Energies 10 00270 g004aEnergies 10 00270 g004b
Figure A2. Reference building drawings of (a) the 4th floor plan and (b) the terrace floor plan.
Energies 10 00270 g005aEnergies 10 00270 g005b
Figure A3. Reference building drawings of (a) front (South) elevation and (b) back (North) elevation.
Energies 10 00270 g006aEnergies 10 00270 g006b
Figure A4. Reference building drawings of (a) section plane A-A’ and (b) section plane B-B’.
Energies 10 00270 g007aEnergies 10 00270 g007b

Appendix B

Table A1. U values of the reference building’s elements for each insulation scenario (W/m2K).
XPS ThicknessBeamColumnWallFloor above PilotisFloor above GroundRooftop
3 cm0.8130.7630.6780.8140.8100.676
5 cm0.5450.5220.4810.5450.4980.480
7 cm0.4100.3970.3720.4160.3820.372
9 cm0.3280.3200.3040.3280.3100.303
11 cm0.2740.2680.2570.2740.2610.256
13 cm0.2350.2300.2230.2350.2260.222
15 cm0.2060.2020.1960.2060.1980.196
17 cm0.1830.1800.1750.1830.1770.175
19 cm0.1650.1620.1580.1650.1600.158
25 cm0.1270.1250.1230.1270.1240.129
Table A2. Thermal/physical characteristics of building materials used on the reference building [14].
MaterialPhenomenal Specific Weight ρ (kg/m3)Value of Insulating Capacity λ (W/mK)Thickness of Application d (m)
Organic coating18000.8700.007
Extruded polystyrene foam30–450.033varies
Reinforced concrete24002.500varies
Lime-cement plaster/mortar18000.8700.02
Hollow ceramic bricks12000.5220.19
Cement20001.4000.03
Ceramic tiles20001.8400.01
Concrete19001.1000.05
Marble tiles28003.5000.02
Asphalt membrane11000.2300.01
Foamed concrete for terrace weathering500varies0.05
Table A3. Example of initial cost calculation for the 7 cm insulation scenario, with and without taxes.
Building ElementMaterials (€/m2)Application (€/m2)Total Area of Application (m)Total Cost excl. VAT (€)Total Cost incl. VAT (€)
Walls23.1015.00876.3633,389.3241,101.28
Pilotis
Terrace7.709.50264.722038.342514.84
Floor on the ground
Total:35,427.6643,616.12
Per m2 of useful floor area:51.9563.95

Appendix C

Figure A5. Results of the financial calculation presented graphically for (a) Heraklion (climate zone A); (b) Athens (climate zone B); (c) Thessaloniki (climate zone C) and (d) Kastoria (climate zone D).
Energies 10 00270 g008aEnergies 10 00270 g008b
Figure A6. Results of the macroeconomic calculation presented graphically for (a) Heraklion (climate zone A); (b) Athens (climate zone B); (c) Thessaloniki (climate zone C) and (d) Kastoria (climate zone D).
Energies 10 00270 g009aEnergies 10 00270 g009b

References

  1. European Parliament. Directive 2010/31/EU of the European Parliament and of the Council of 19 May 2010 on the Energy Performance of Buildings (Recast). Off. J. Eur. Union 2010, 153, 13–35. [Google Scholar]
  2. European Parliament. Commission Delegated Regulation (EU) No 244/2012. Off. J. Eur. Union 2012, 81, 18–36. [Google Scholar]
  3. European Commission. Guidelines Accompanying Commission Delegated Regulation (EU) No 244/2012 of 16 January 2012 Supplementing Directive 2010/31/EU of the European Parliament and of the Council on the Energy Performance of Buildings by Establishing a Comparative Methodology Framework for Calculating Cost-Optimal Levels of Minimum Energy Performance Requirements for Buildings and building elements. Available online: https://goo.gl/jxIFos (accessed on 14 February 2017).
  4. Hamdy, M.; Hasan, A.; Siren, K. A multi-stage optimization method for cost-optimal and nearly-zero-energy building solutions in line with the EPBD-recast 2010. Energy Build. 2013, 56, 189–203. [Google Scholar] [CrossRef]
  5. Ferrara, M.; Fabrizio, E.; Virgone, J.; Filippi, M. A simulation-based optimization method for cost-optimal analysis of nearly Zero Energy Buildings. Energy Build. 2014, 84, 442–457. [Google Scholar] [CrossRef]
  6. Congedo, P.M.; Baglivo, C.; D’Agostino, D.; Zacà, I. Cost-optimal design for nearly zero energy office buildings located in warm climates. Energy 2015, 91, 967–982. [Google Scholar] [CrossRef]
  7. Becchio, C.; Corgnati, S.P.; Orlietti, L.; Spigliantini, G. Proposal for a Modified Cost-optimal Approach by Introducing Benefits Evaluation. Energy Procedia 2015, 82, 445–451. [Google Scholar] [CrossRef]
  8. Hellenic Statistical Authority. Hellenic Statistical Authority 2011 Population and Housing Census. Available online: https://goo.gl/mw3qSL (accessed on 11 January 2017).
  9. Presidential Decree. Thermal Insulation of Buildings Regulation. Off. Gaz. Hell. Repub. 1979, 362, 3960–4035. [Google Scholar]
  10. Ministry of Energy and Climate Change. Report on the Long Term Strategy for the Attraction of Investments on the Renovation of the Greek National Building Stock. Available online: https://goo.gl/9oMUPw (accessed on 11 January 2017).
  11. National Ministerial Decree. Regulation of Rational Use of Energy and Conservation Measurements. Off. Gaz. Hell. Repub. 1998, 880, 10071–10078. [Google Scholar]
  12. Greek Parliament. Regulation for the Energy Performance of Buildings (K.EN.A.K.). Off. Gaz. Hell. Repub. 2010, 407, 5333–5356. [Google Scholar]
  13. Dascalaki, E.G.; Balaras, C.A.; Gaglia, A.G.; Droutsa, K.G.; Kontoyiannidis, S. Energy performance of buildings—EPBD in Greece. Energy Policy 2012, 45, 469–477. [Google Scholar] [CrossRef]
  14. Technical Chamber of Greece. Energy Performance of Buildings Directive—Technical Guidelines—T.O.T.E.E. 20701-2/2010—Guidelines on the Thermal Properties of Construction Materials. Available online: https://goo.gl/DJZqdr (accessed on 11 January 2017).
  15. Technical Chamber of Greece. Energy Performance of Buildings Directive—Technical Guidelines—T.O.T.E.E. 20701-1/2010—Guidelines on the Evaluation of the Energy Performance of Buildings. Available online: https://goo.gl/Nq6PJY (accessed on 11 January 2017).
  16. Technical Chamber of Greece. Energy Performance of Buildings Directive—Technical Guidelines—T.O.T.E.E. 20701-3/2010—Guidelines on the Greek Climatic Data. Available online: https://goo.gl/hRYBij (accessed on 11 January 2017).
  17. Technical Chamber of Greece. Energy Performance of Buildings Directive—Technical Guidelines—T.O.T.E.E. 20701–4/2010—Guidelines on the Energy Audit Pocedure and the Energy Performance Certificate. Available online: https://goo.gl/XWXPCX (accessed on 11 January 2017).
  18. International Organization for Standardization. ISO 13790:2008 Energy Performance of Buildings—Calculation of Energy Use for Space Heating and Cooling. Available online: https://goo.gl/Crr91W (accessed on 11 January 2017).
  19. Capros, P.; De Vita, A.; Tasios, N.; Papadopoulos, D.; Siskos, P.; Apostolaki, E.; Zampara, M.; Paroussos, L.; Fragiadakis, K.; Kouvaritakis, N.; et al. EU Energy, Transport and GHG Emissions—Trends to 2050. Available online: https://goo.gl/SkTzK0 (accessed on 11 January 2017).
  20. European Commission. Impact Assessment Accompanying Document to the Communication from the Commission to the European Parliament, the Council, the European Economic and Social Committee and the Committee of the Regions: A Roadmap for Moving to a Competitive Low Carbon Economy. Available online: https://goo.gl/DEVGLW (accessed on 11 January 2017).
  21. Corgnati, S.P.; Fabrizio, E.; Filippi, M.; Monetti, V. Reference buildings for cost optimal analysis: Method of definition and application. Appl. Energy 2013, 102, 983–993. [Google Scholar] [CrossRef]
  22. Bank of Greece Eurosystem. Bulletin of Conjuctural Indicators. 2014. Available online: http://www.bankofgreece.gr/BogEkdoseis/sdos201407-08.pdf (accessed on 11 January 2017).
  23. European Commission Website. National Reports on Energy Performance Requirements. Available online: https://ec.europa.eu/energy/en/topics/energy-efficiency/buildings (accessed on 13 February 2017).
  24. European Commission. Part III: Annexes to Impact Assessment Guidelines. Available online: http://ec.europa.eu/smart-regulation/impact/commission_guidelines/docs/iag_2009_annex_en.pdf (accessed on 11 January 2017).
  25. Public Power Corporation S.A. Available online: https://www.dei.gr/en (accessed on 6 November 2015).
  26. Panhellenic Federation of Fuel Station Owners and Oil Traders Website. Available online: http://www.popek.gr/index.php/el/times-kafsimon/home (accessed on 11 January 2017).
  27. Touloupaki, E.; Theodosiou, T. Energy performance optimization as a generative design tool for nearly Zero Energy Buildings. In Proceedings of the International High Performance Built Environment Conference 2016 (SBE16 Series), Sydney, Australia, 17–18 November 2016.
Figure 1. The four climate zones of Greece according to the KENAK regulation.
Energies 10 00270 g001
Figure 2. Results of (a) primary energy consumption in Kwh/m2 and (b) CO2 emissions in Kg/m2 of the reference building for the 10 insulation scenarios on each climate zone.
Energies 10 00270 g002
Figure 3. Global cost composition in present value for the Basic (a) financial and (b) macroeconomic calculation in the four climate zones of Greece.
Energies 10 00270 g003
Table 1. Annual Heating Degree Days (HDD) and Cooling Degree Days (CDD) for the representative cities of the four Greek climatic zones 1.
CityHDDCDD
Heraklion70256
Athens947206
Thessaloniki1677117
Kastoria242039
1 Base temperatures used are 18 °C for HDD and 26 °C for CDD.
Table 2. Area distribution of the reference building per floor.
FloorUseArea
Ground floorpilotis—building entrance—staircase and lift29.8 m2
1st–3rd floor3 apartments—staircase and lift (per floor)235 m2
4th floor2 small studios—staircase and lift81.4 m2
Table 3. Main characteristics of the Reference Building.
DescriptionValue
Floor plan dimensions9.5 m × 24.6 m
Total height15 m (storey height 3 m)
Total sarea711.2 m2
Volume2487 m3 (2044 m3—apartments and 442.5 m3—central compartment)
Balconies area171.9 m2
Openings on envelope124.6 m2
Table 4. Final energy consumption in electricity/heating oil of the reference building (in KWh/m2) 1.
XPS ThicknessHeraklionAthensThessalonikiKastoria
(Climate Zone A)(Climate Zone B)(Climate Zone C)(Climate Zone D)
3 cm6.8/42.18.5/54.67.0/98.23.9/135.4
5 cm6.7/36.78.2/46.96.9/83.64.1/115.5
7 cm6.7/33.98.2/43.06.9/75.94.2/104.8
9 cm6.7/32.38.0/40.66.9/71.04.3/98.1
11 cm6.7/31.38.0/39.16.9/68.04.4/93.8
13 cm6.7/30.67.9/37.96.9/65.64.4/90.6
15 cm6.7/30.07.9/37.16.9/63.84.5/88.0
17 cm6.7/29.67.9/36.46.9/62.54.5/86.1
19 cm6.7/29.37.9/35.96.9/61.44.5/84.6
25 cm6.7/28.67.8/34.96.9/59.24.6/81.5
1 The U values of each building element, as well as the thermal/physical characteristics of the materials used can be found in Appendix B (Table A1 and Table A2).
Table 5. Financial calculation scenarios based on influence factors.
Scenario (Influence Factor)Interest RateEnergy Prices Increase Rate
Basic6.5%2.8%
Sensitivity Analysis 1 (Energy Prices)6.5%4%
Sensitivity Analysis 2 (Interest Rate)13%2.8%
Sensitivity Analysis 3 (Both Interest Rate and Energy Prices)13%4%
Table 6. Macroeconomic calculation scenarios based on influence factors.
Scenario (Influence Factor)Interest RateEnergy Prices Increase Rate
Basic3%2.8%
Sensitivity Analysis 1 (Energy Prices)3%4%
Sensitivity Analysis 2 (Interest Rate)4%2.8%
Sensιtivity Analysis 3 (Both Interest Rate and Energy Prices)4%4%
Table 7. Initial investment cost in €/m2 for each insulation scenario 1.
XPS ThicknessInitial Cost without VATInitial Cost including VAT
3 cm44.4154.61
5 cm48.0159.05
7 cm51.9563.95
9 cm58.6272.11
11 cm63.0677.55
13 cm66.6781.95
15 cm72.8489.60
17 cm76.7094.30
19 cm83.97103.30
25 cm97.22119.62
1 Initial investment cost per square meter was calculated using prices for materials and application on walls, pilotis, terrace and floors according to the surfaces of the reference building. An example of the calculation for the 7 cm scenario can be found on Appendix B (Table A3).
Table 8. Price of energy fuels (€/KWh) with and without taxes [25,26].
Energy SourcePrice without VATPrice with VAT
Electricity0.0720.089
Oil0.9251.200
Table 9. Cost-optimal levels of insulation thickness (in cm) for the financial calculations 1.
CalculationClimate Zone AClimate Zone BClimate Zone CClimate Zone D
Basic5–77–911–1313–15
Sens. Analysis 15–77–911–1313–15
Sens. Analysis 25–75–77–97–9
Sens. Analysis 35–75–77–911–13
1 Financial and macroeconomic Global Cost calculations are also presented graphically in Appendix C.
Table 10. Cost-optimal levels of insulation thickness (in cm) for the macroeconomic calculations 1.
CalculationClimate Zone AClimate Zone BClimate Zone CClimate Zone D
Basic7–911–1313–1515–17
Sens. Analysis 17–911–1315–1717–19
Sens. Analysis 25–77–913–1515–17
Sens. Analysis 37–911–1313–1515–17
1 Financial and macroeconomic Global Cost calculations are also presented graphically in Appendix C.

