Article

Comparison Study of Two Semi-Active Hybrid Energy Storage Systems for Hybrid Electric Vehicle Applications and Their Experimental Validation

State Key Laboratory of Automotive Simulation and Control, Jilin University, Changchun 130022, China
*
Author to whom correspondence should be addressed.
Energies 2017, 10(3), 279; https://doi.org/10.3390/en10030279
Submission received: 5 December 2016 / Revised: 18 February 2017 / Accepted: 21 February 2017 / Published: 28 February 2017
(This article belongs to the Collection Electric and Hybrid Vehicles Collection)

Abstract

:
Both the battery/supercapacitor (SC) and SC/battery are two common semi-active configurations of hybrid energy storage systems (HESSs) in hybrid electric vehicles, which can take advantage of the battery’s and supercapacitor’s respective characteristics, including the energy ability, power ability and the long lifetime. To explore in depth the characteristics and applicability of the two kinds of HESS, an analysis and comparison study is proposed in this paper. Based on the data collected from public transit hybrid electric bus (PTHEB) with battery-only on-board energy storage, the range and distribution probability of electric power/energy demand is comprehensively statistically analyzed with the decomposing and normalizing methods. Accordingly, the performance of each topology under different parameter matching conditions but same mass, volume and cost values with battery-only energy storage, are presented and compared quantitatively. The results show that both HESS configurations can meet the electric power demand of the hybrid electric vehicle (HEV) through reasonable design. In particular, the SC/battery can make better use of the SC features resulting in high efficiency and long life cycles compared with the battery/SC. Equally, it proves that the SC/battery topology is a better choice for the HEV. Finally, an experimental validation of a real HEV is carried out, which indicated that a 7% fuel economy improvement can be achieved by a SC/battery system compared with battery-only topology.

1. Introduction

Currently lithium-ion batteries are widely used as auxiliary energy storage system (ESS) for hybrid electric vehicles (HEVs), owing to their high energy density, reliable safety and competitive low cost [1,2]. However, the HEV will work in exhaustive ways and the frequent charging/discharging during cycling will seriously affect the lifetime of batteries used on board [3]. Hybrid energy storage systems (HESSs) which are composed of a battery and a supercapacitor (SC), can enjoy the advantages of high energy and power ability, as well as long lifecycle in battery and SC simultaneously, which could be a solution for electric vehicles (EVs), hybrid electric vehicles, and even fuel cell vehicle applications [4,5].
Many literatures have studied the HESS design, configuration and control. Cao and Emadi [6] concluded that the semi-active HESS is a popular topology, which only employs one DC/DC converter, and it is a good compromise between performance, cost and complexity, while most control strategies can be implemented in this topology. Jimenez et al. [7] presented a co-design philosophy to get the optimal solution, in which cost and size ratios are selected as two factors to determine the HESS with maximum energy storage capacity. Song et al. [8] utilized the dynamic programming (DP) approach to deal with the integrated optimization problem for deriving the best configuration and energy split strategies of a HESS on an electric city bus. It is shown that the life cycle cost of the HESS initially decreases rapidly with the addition of SC, though the rate of this reduction decreases as the number of SCs increases. Hung and Wu [9] developed a simple but innovative integrated optimization approach (IOA) for deriving the best solutions of component sizing and control strategy of a HESS. Simulation results show that 6% of the total energy can be saved in the IOA case compared with the original system in two driving cycles: ECE and UDDS with two different vehicle weights. In [10], a new topology which just adopts an unidirectional DC/DC converter to improve the battery efficiency is presented for electric vehicles; furthermore, the simulated relationship between the SC size and battery degradation ratio is illustrated. Qu et al. [11] proposed the power-energy function to illustrate the requirements of power and energy of HESS, which is standardized in the form of PE matrix and applied to the design process. With this method, large scale driving cycle data could be dealt with. Shen et al. [12] configured the SC size based on specific cycles, and a two-objective function consisting of cost and battery degradation is proposed in the paper, which could be used to evaluate the configuration results.
In the case of a public transit hybrid electric bus (PTHEB) with its needs of high efficiency and longevity of the energy storage system (ESS), the convincing statistical analysis, the real vehicle verification and comparisons in engineering practice remain to be solved [4]. This paper provides a detailed comparative analysis of the HESS that is responsible for meeting the power requirements of a parallel PTHEB. Two different semi-active HESS configurations, i.e., battery/SC, SC/battery, are analyzed in the following content. The efficiency performance of the two configurations under different parameter matching conditions but with the same mass, volume and cost values with battery-only topology, is presented and compared quantitatively. Experimental validation of real vehicles is carried out to explore the actual performance of the HESS chosen in this paper.

2. The Energy Storage Requirements of Public Transit Hybrid Electric Bus

In this paper, the configurations and parameters of the PTHEB with battery-only topology are shown in Figure 1 and Table 1. The engine, with an integrated starter/generator (ISG), electric motor (EM), clutch and automatic transmission (AMT) forms the power-train of the PTHEB. In this paper, the accessories such as air conditioning and vacuum booster are electrically driven. The 20 kW ISG is only used to quickly start the engine, and generate electricity to balance the state of charge (SOC) of ESS. In the control strategy, the vehicle driving process is divided into two parts: the charge depleting (CD) mode and the charge sustaining (CS) mode. In the CD mode, the ESS coordinates with the engine until the battery SOC reaches the lower limit. In the CS mode, the engine continuously works to sustain the battery SOC. EM parallel charging and EM assisting envelopes separate the engine’s brake specific fuel consumption (BSFC), showed in Figure 2, into three regions, including engine only, EM parallel charging and EM assisting regions [13]. Through EM assisted, the engine could work in its comparatively high-efficiency region in most of the time [14].
At a certain engine speed, if the demanded engine torque is lower than the EM parallel charging envelope, the ISG would charge the ESS to make engine torque higher than the envelope. If the demanded engine torque locates in the range between the EM assistant envelop and EM parallel charging envelope, the engine would drive the PTHEB individually. If the demanded engine torque exceeds the EM assistant envelope, in addition to the engine, the inadequate torque is supplemented by the EM. When the SOC of ESS is below the average value, the engine will work with active power generation strategy to counterpoise the ESS charge.
The engine begins to work for driving the bus and charging the ESS when in the CS mode. The engine torque is divided into two parts, some of which overcome the resistance to drive the bus; the other part is the additional torque for balancing the battery SOC. The calculation of the engine torque is shown in Figure 3.
The calculation strategy is divided into two parts: charge balance calculation and torque calculation. There is a factor K in charge balancing calculation:
K = ( cs _ hi _ S O C + cs _ low _ S O C ) 2 S O C ( cs _ hi _ S O C cs _ low _ S O C ) 2
In Equation (1), SOC is the state of charge of ESS, cs _ hi _ S O C is the high setting value of SOC, and cs _ low _ S O C is the low setting value of SOC. In the additional torque calculation, the factor is multiplied by the fixed torque value to obtain the extra torque for the launch output. This fixed torque value is set to make the SOC quickly return to the average level. Of course, when the factor is less than zero, the engine power will drop and the EM will provide the additional power [15].

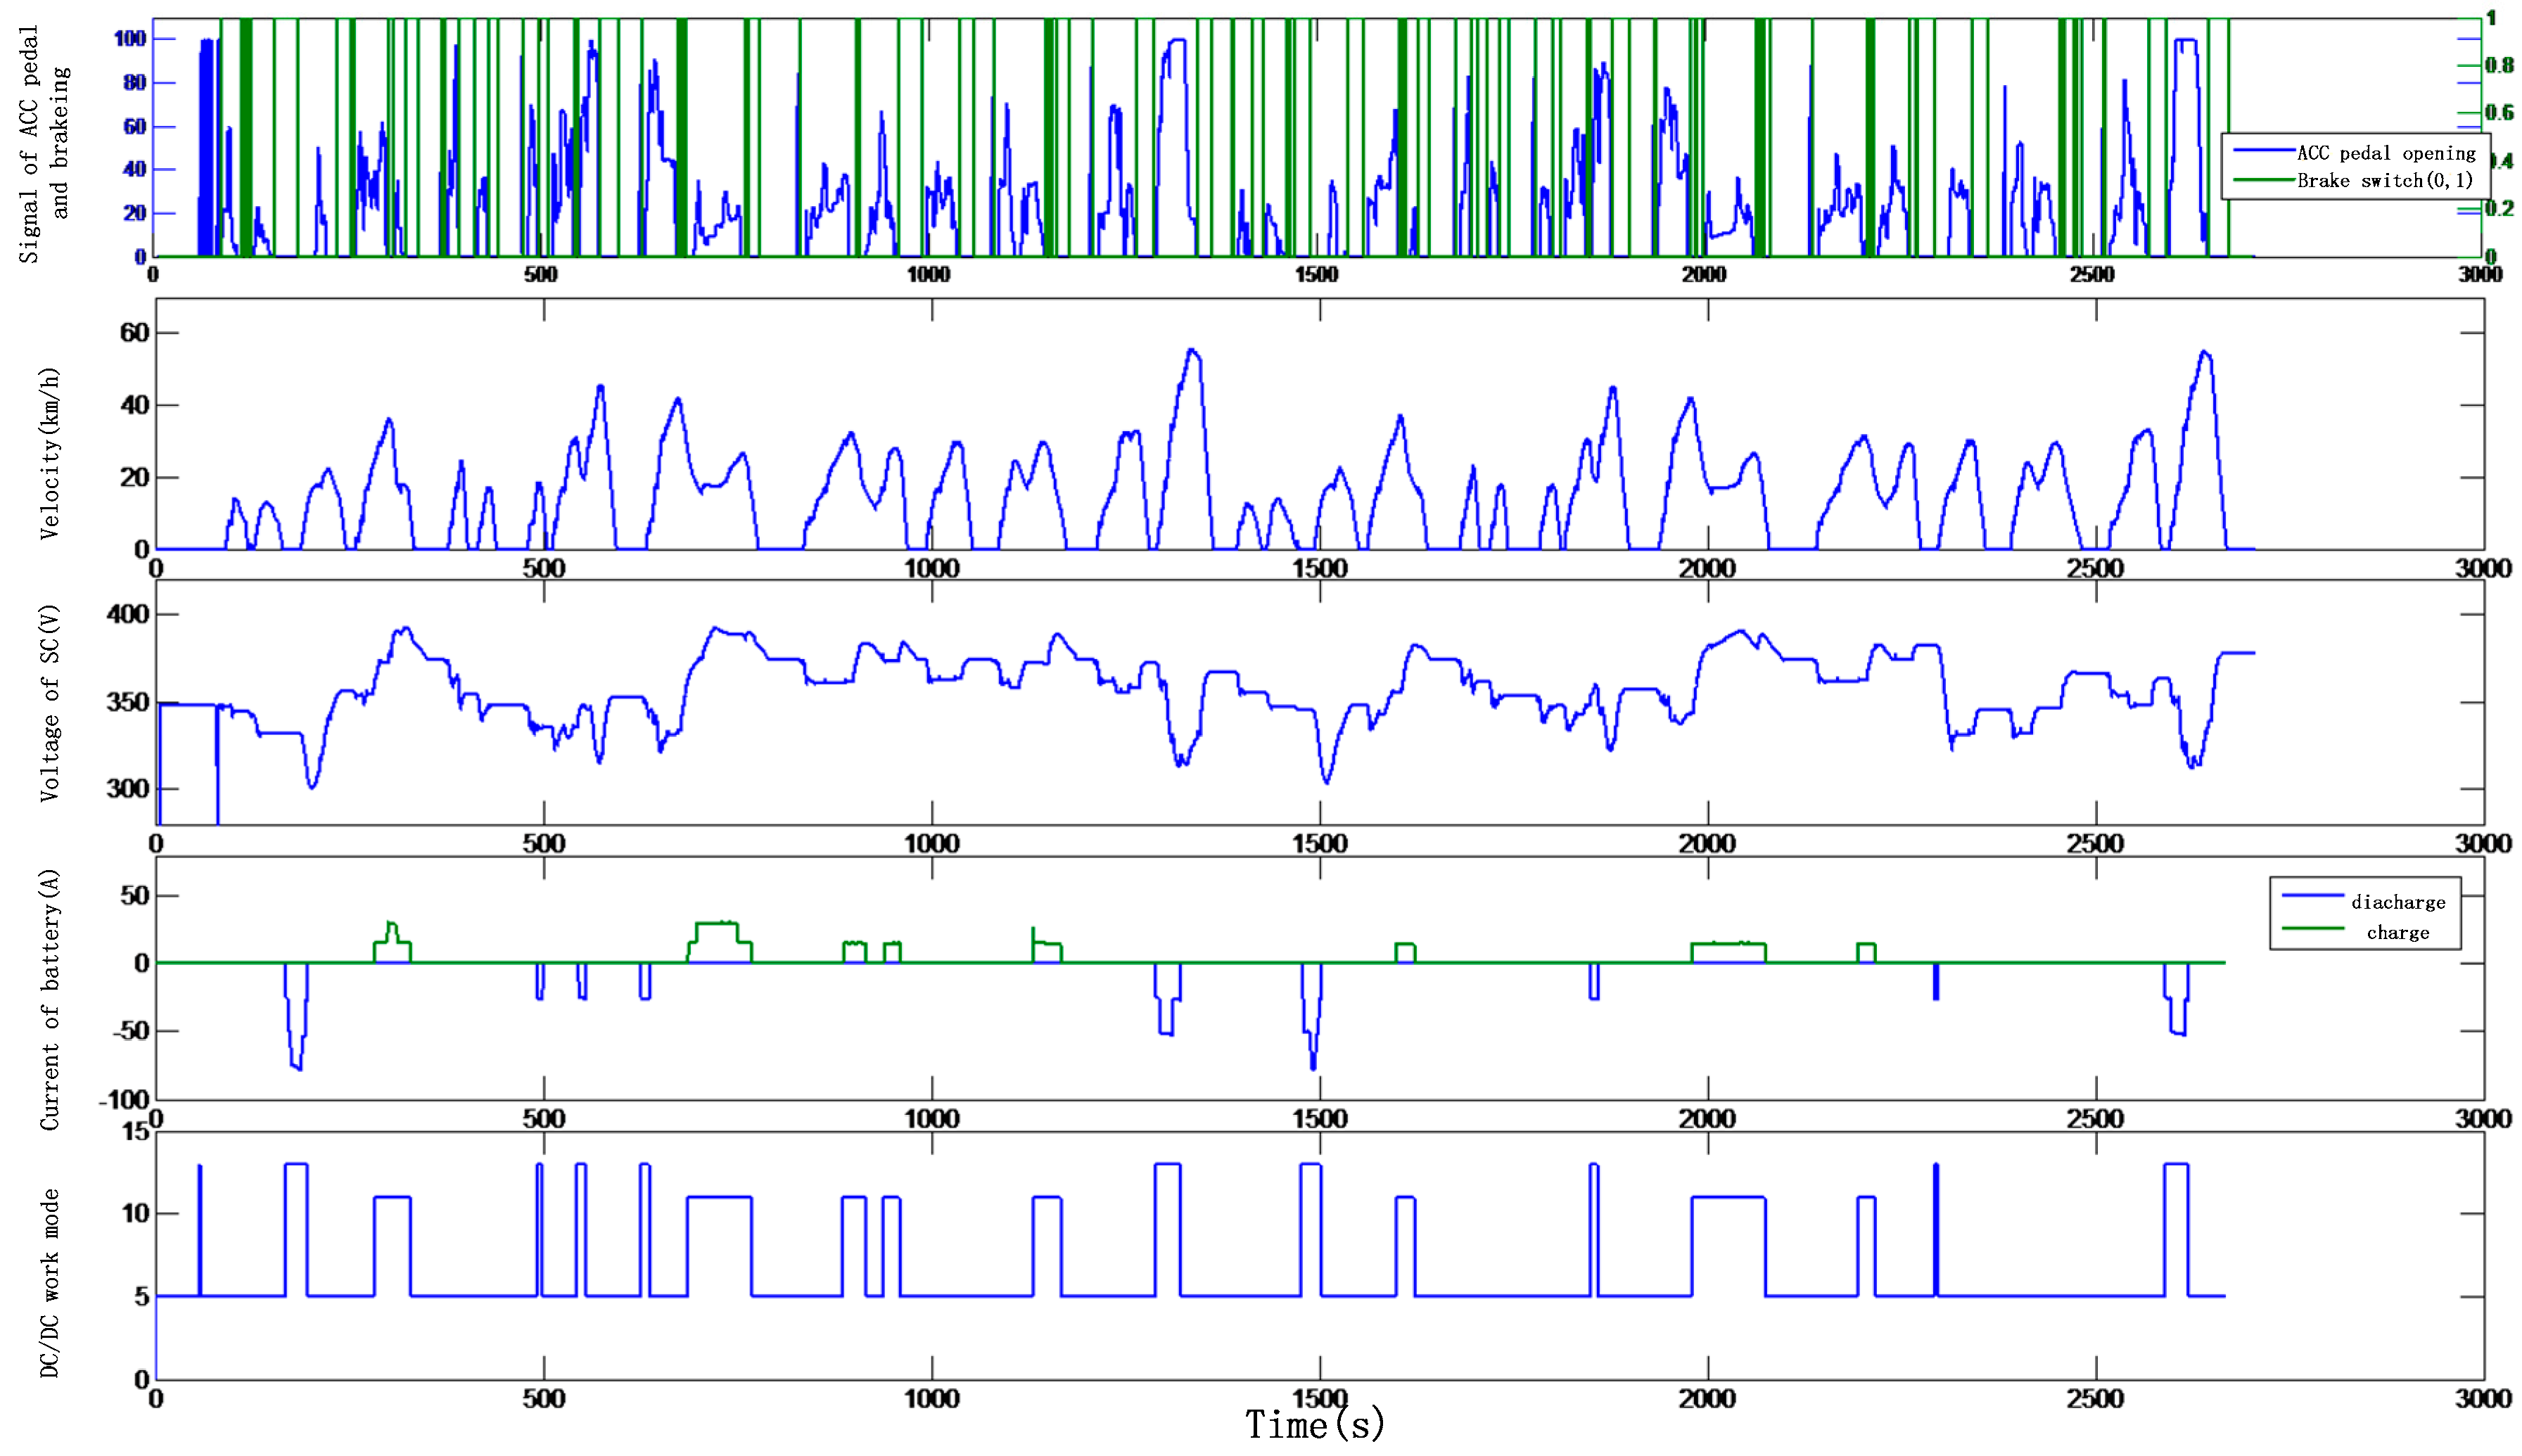
2.1. ESS Operating Data

In this paper, by recording and analyzing the data of voltage and current of ESS on the PTHEB, which works on a bus route in Changchun, China [11], three working days’ and two weekend days’ ESS operating data are acquired, as shown in Figure 1.
The power demands of the charging/discharging fragments in the whole driving cycle are recorded through collecting the ESS voltage and current. From the viewpoint of electric power demand, the operation modes of vehicle drivetrain can be divided into discharging, charging and idle modes.
We collected five days’ round-trip data, a total of 10 sets of data, of the transit bus and analyzed the data to get the ESS energy and power demand. In this paper, the data is divided into charging/discharging fragments representing the ESS charging/discharging power demand during a period of time, as shown in Table 2, which is used as the basis for analyzing the HESS configuration and parameters [11].

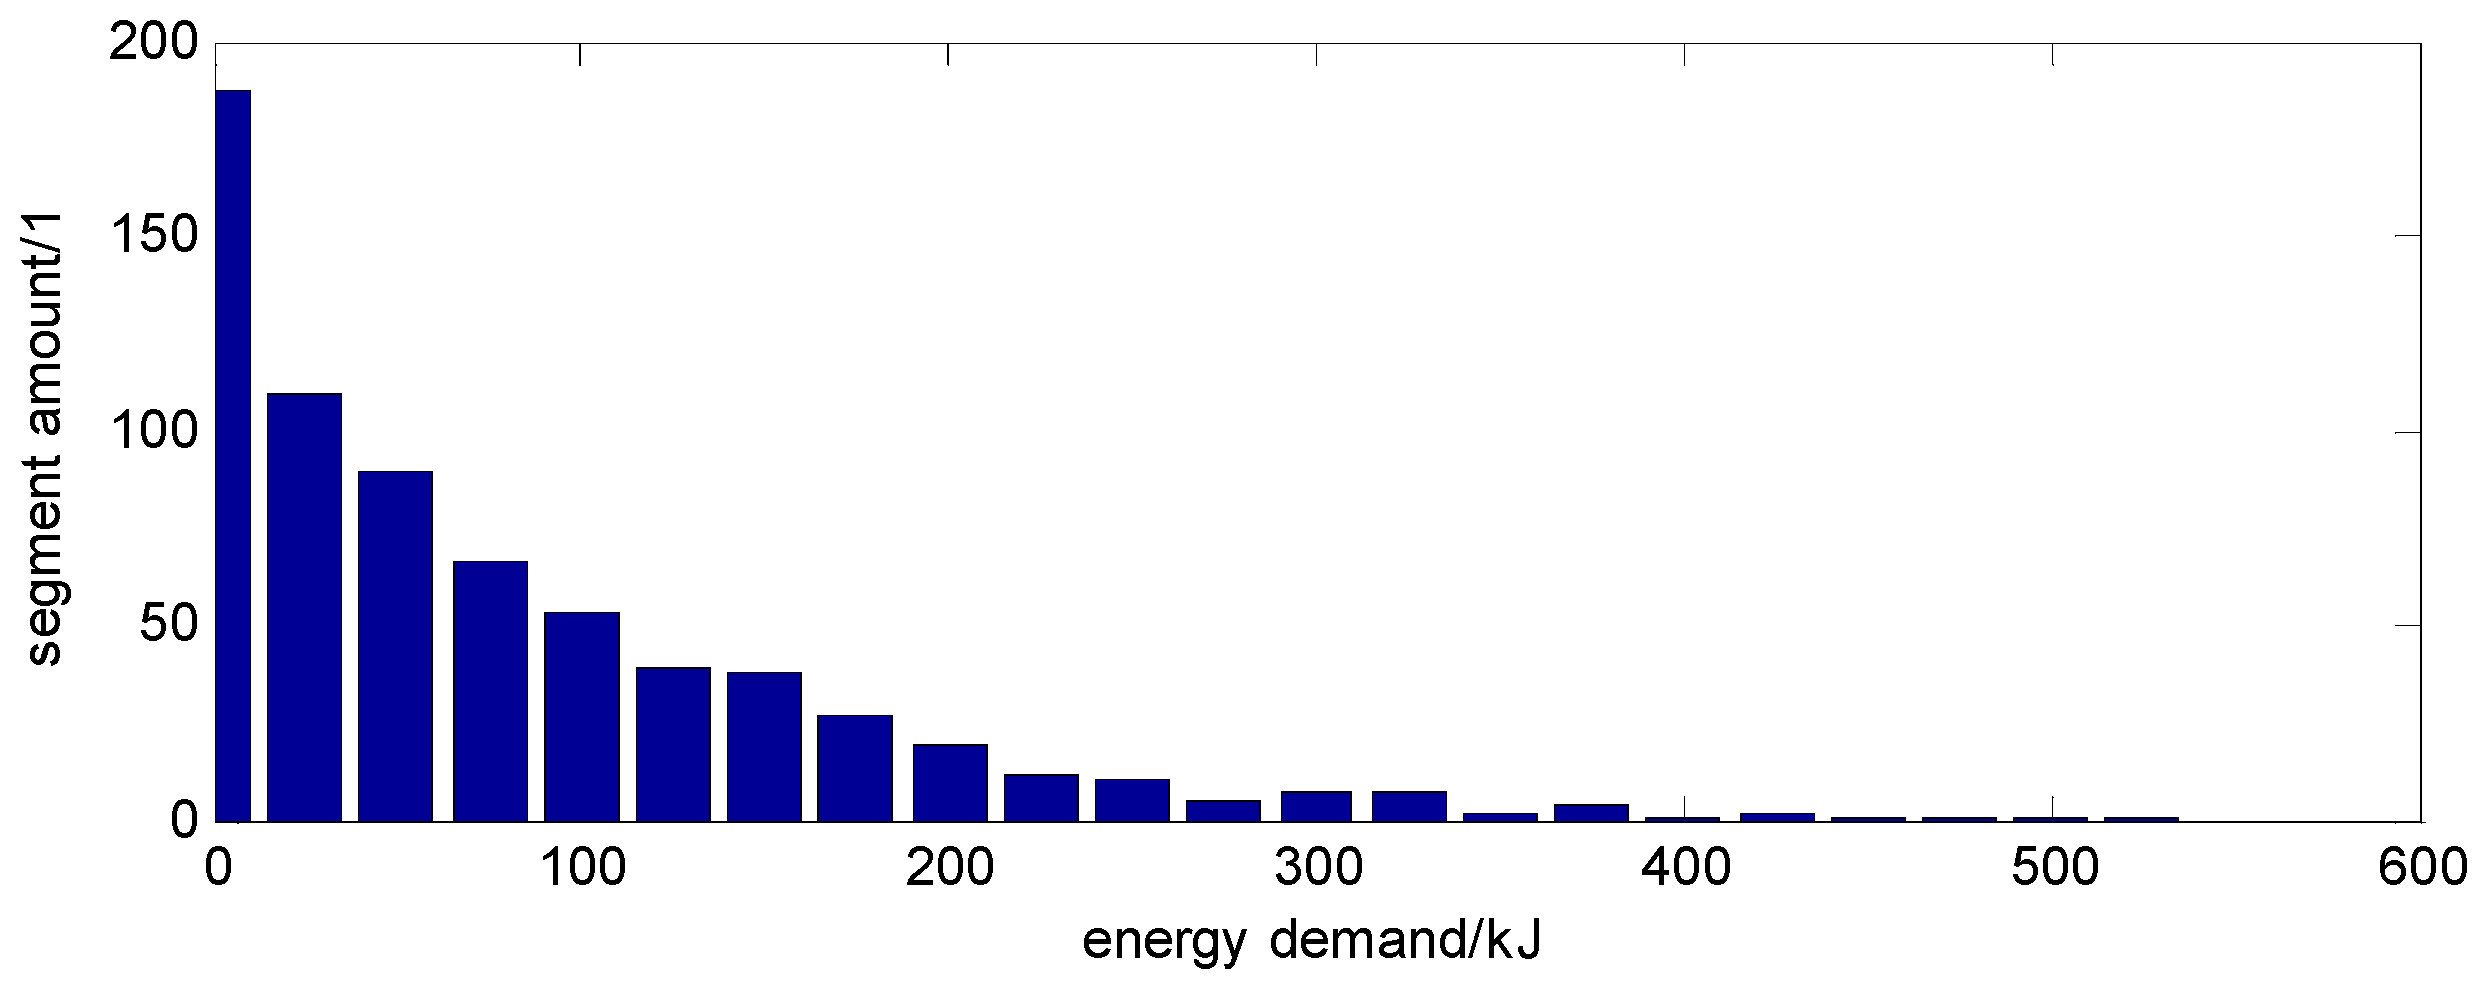
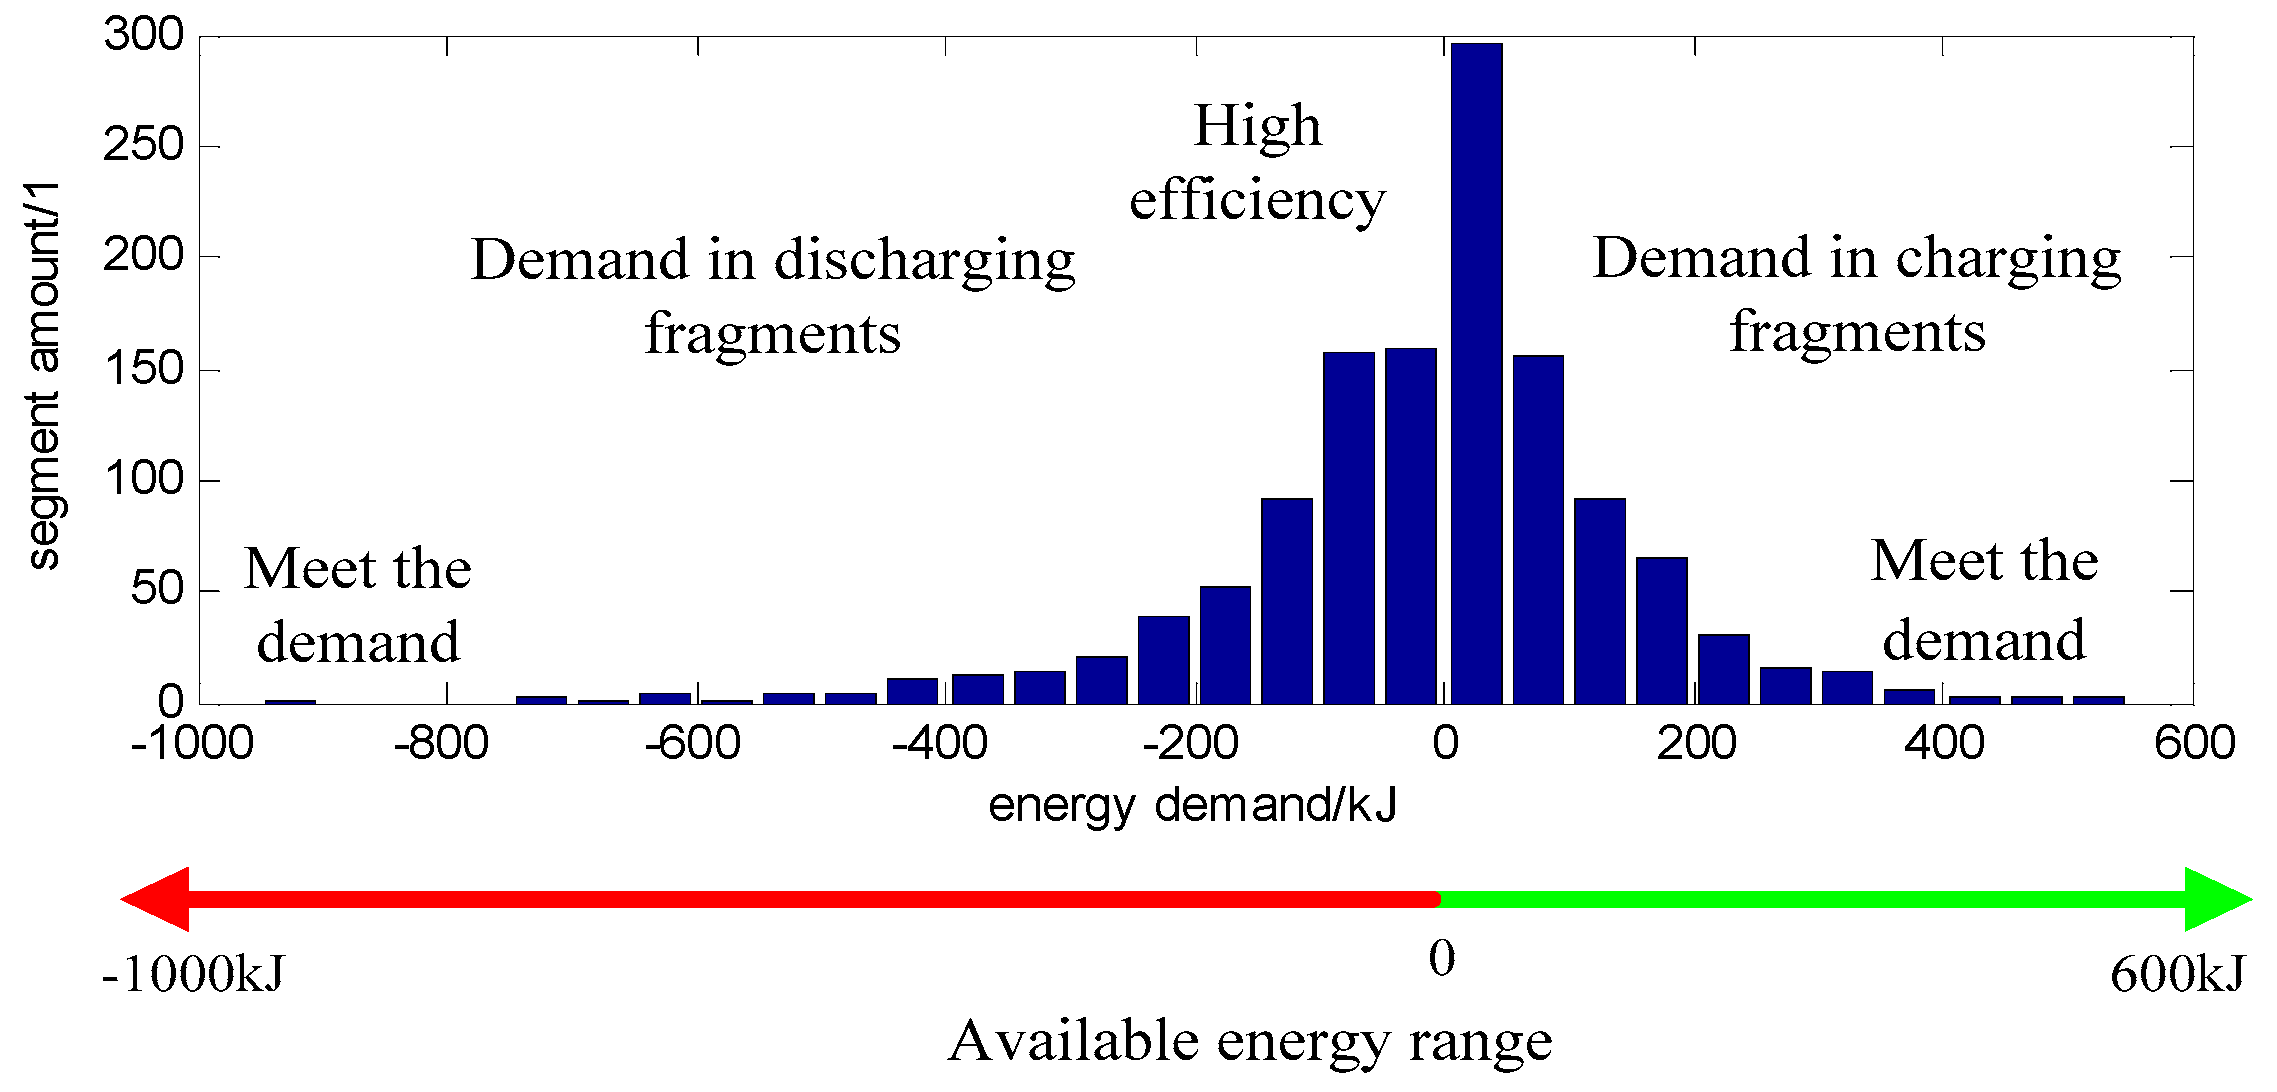
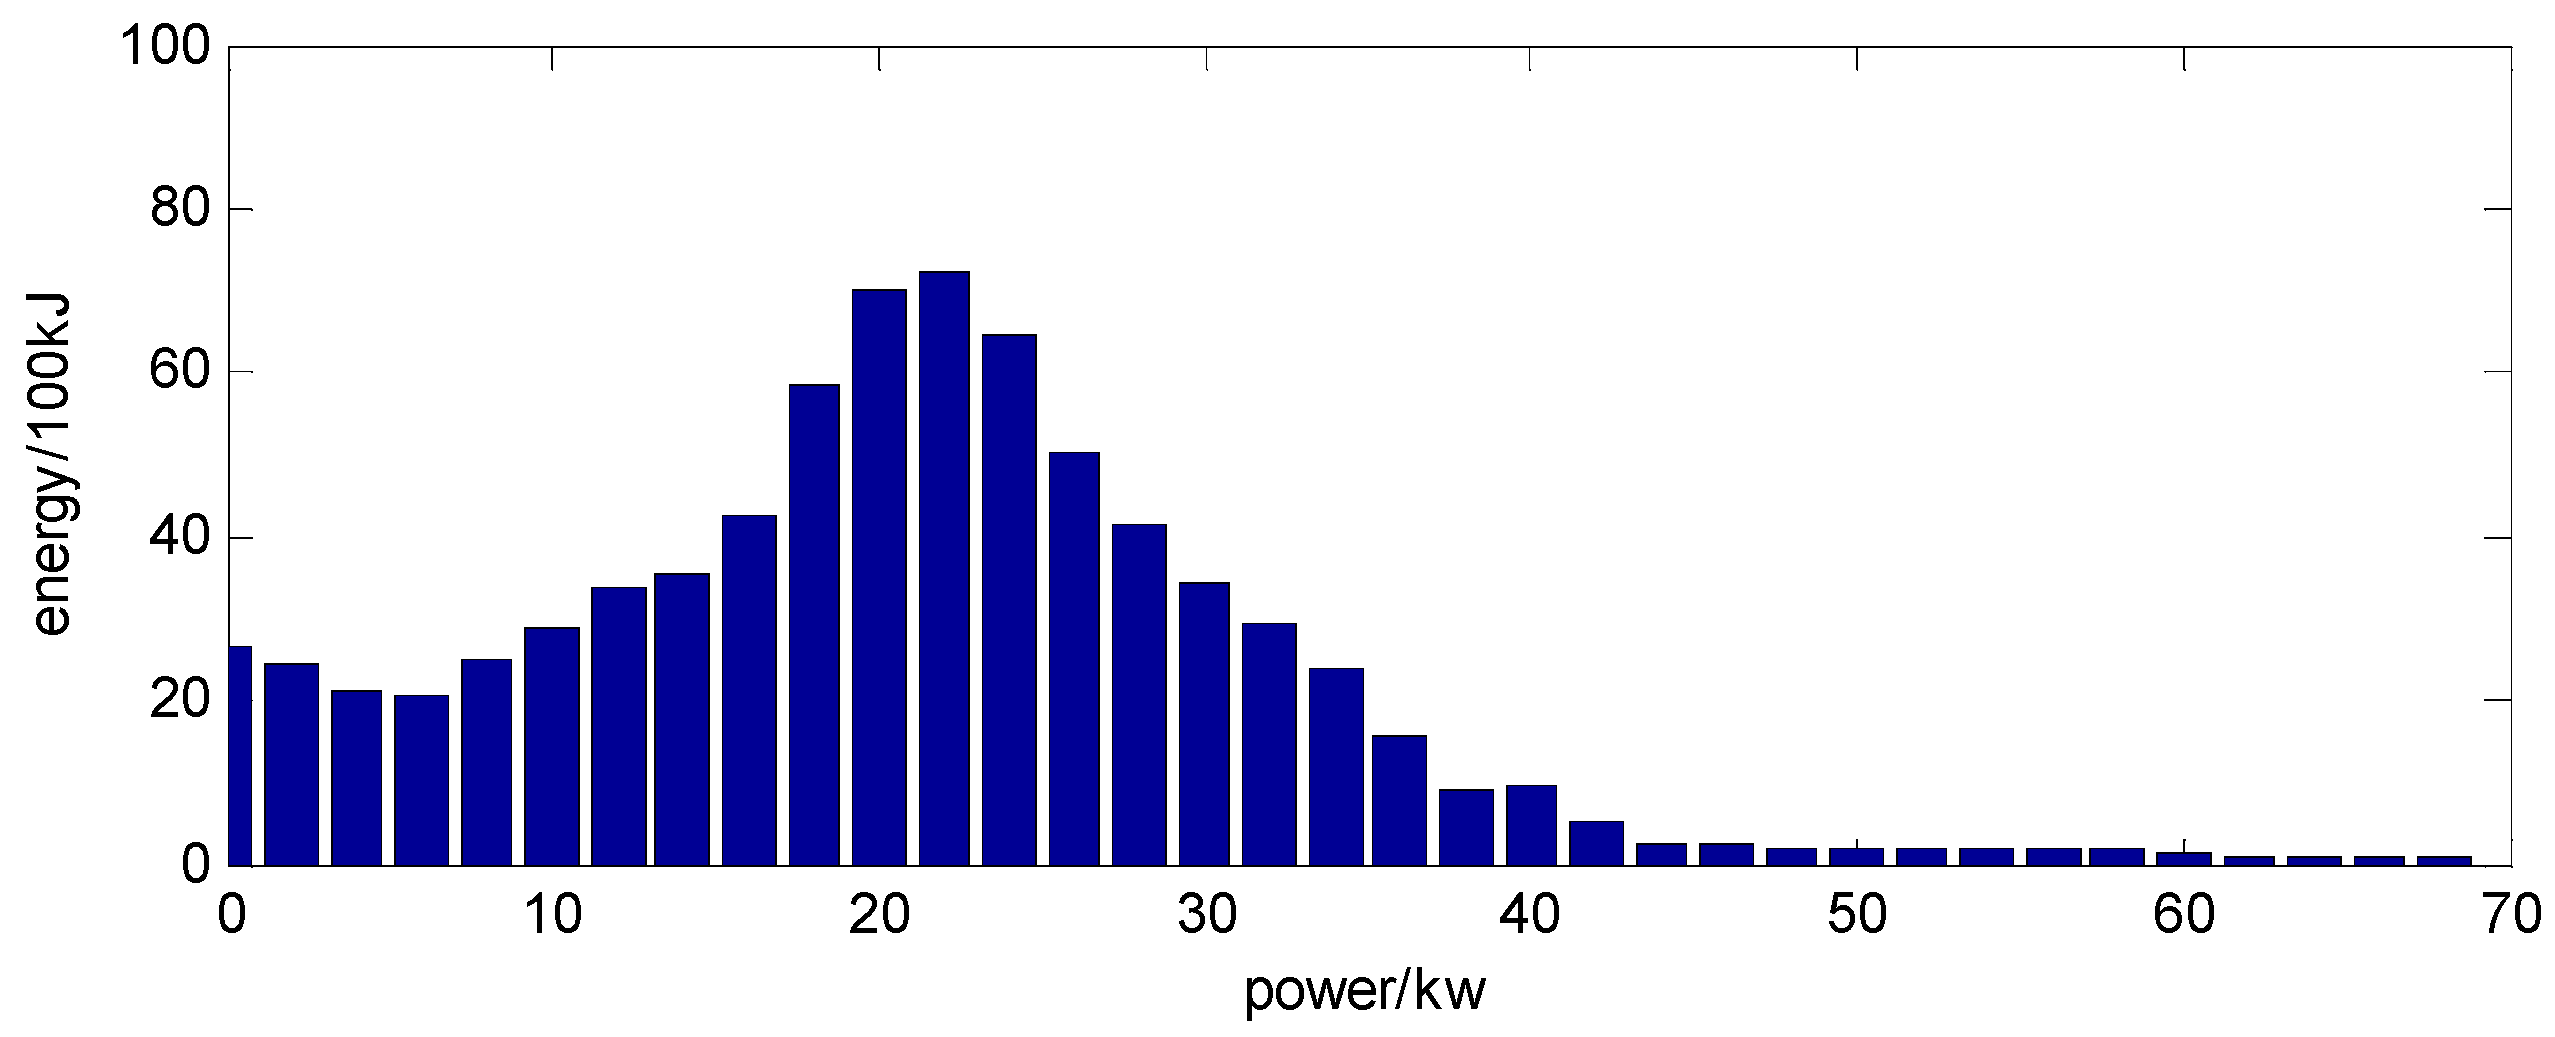
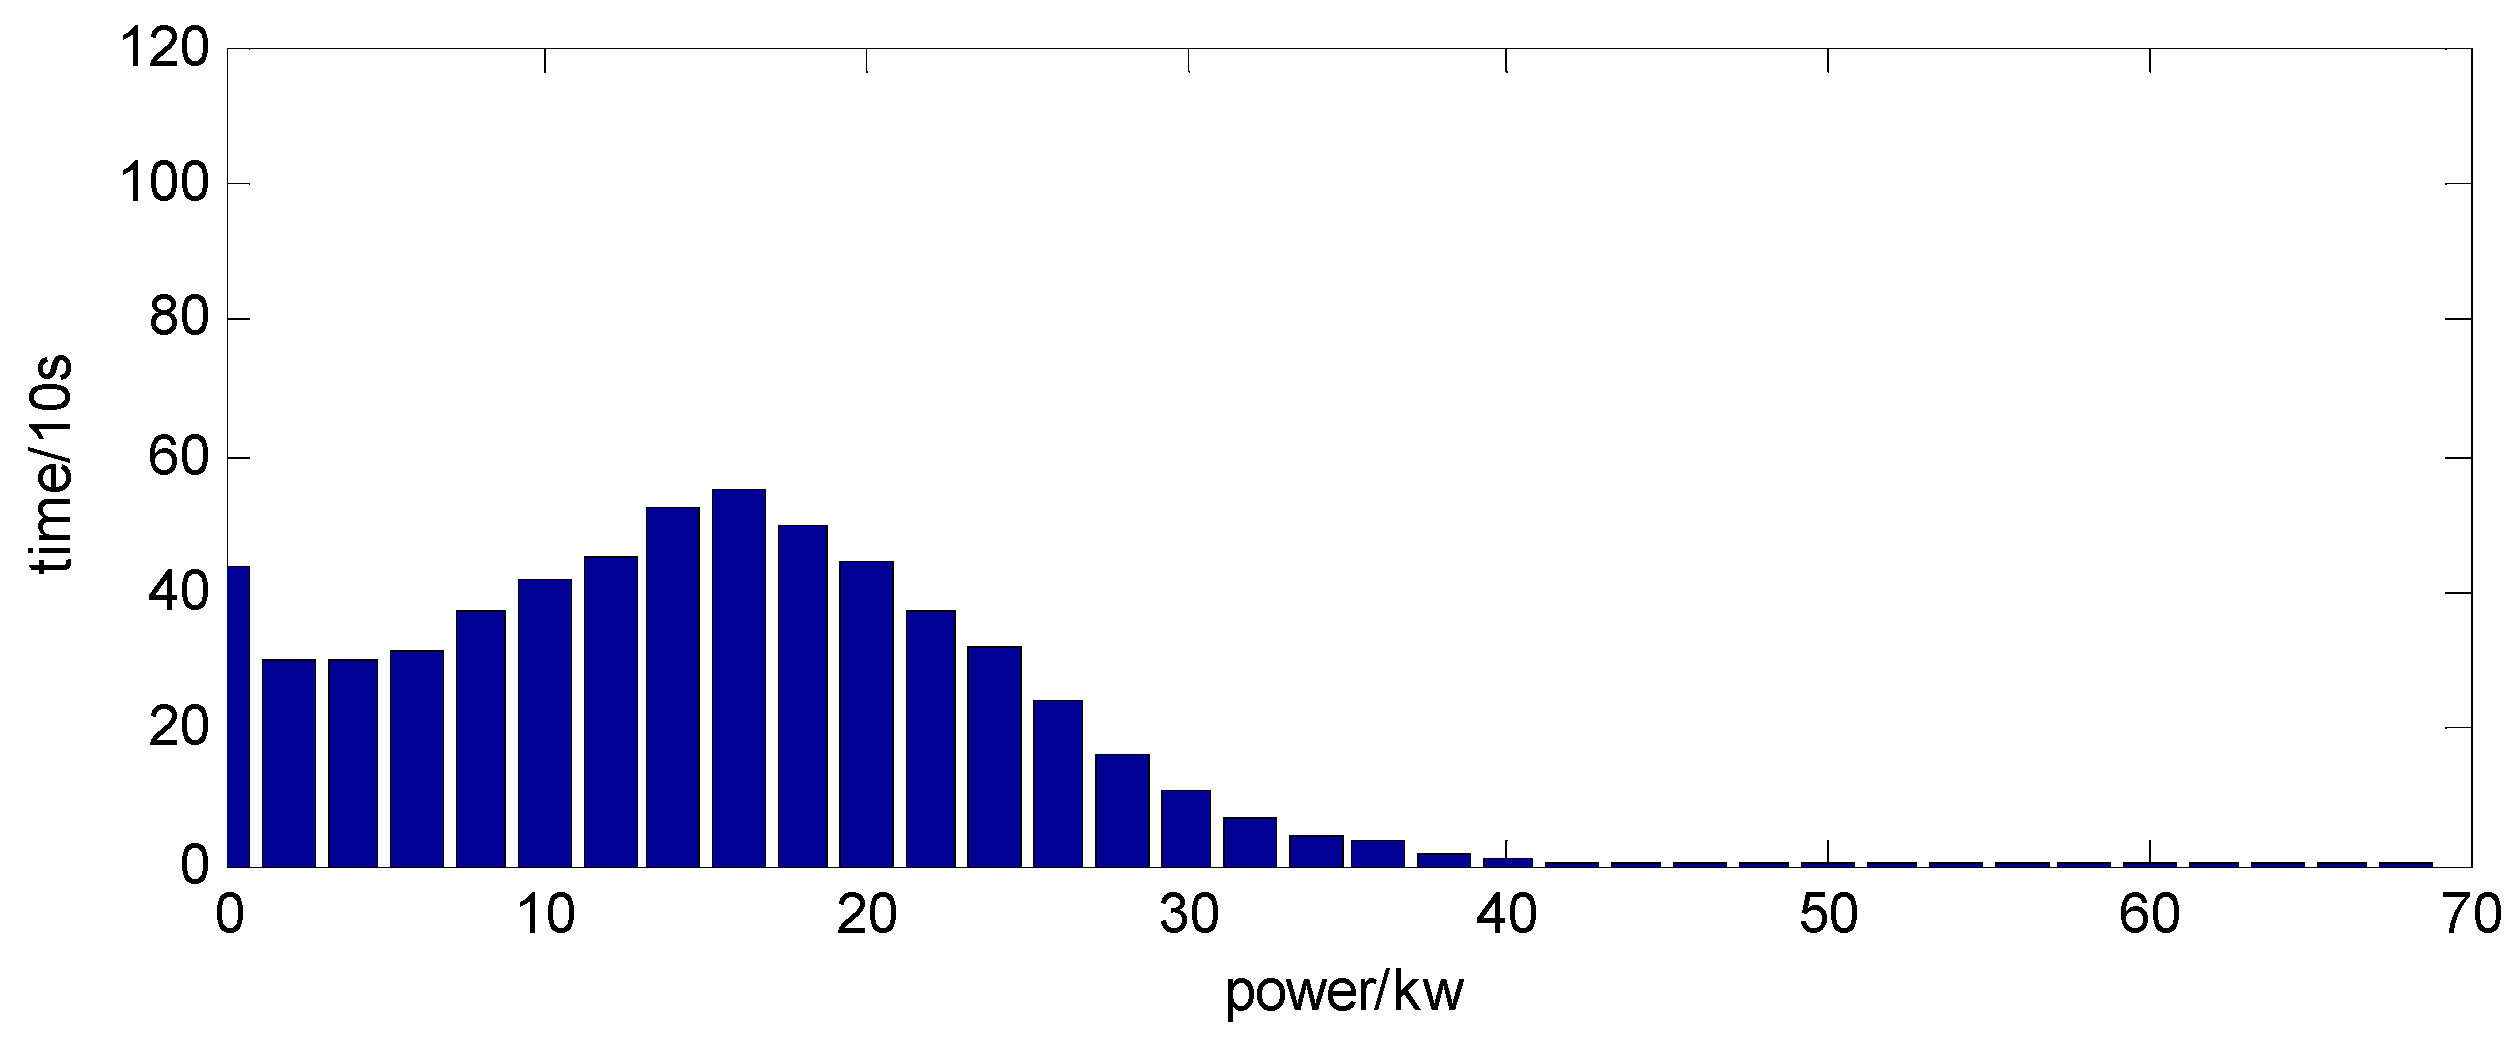
2.2. Energy Storage Requirement Statistics

The ESS performance in a single charging/discharging fragment mainly depends on its charging/discharging capacity and efficiency. The charging/discharging capability and excellent efficiency performance of ESS are the main configuration selection and parameter matching considerations for the HESS. In this section, the charging/discharging capability and efficiency characteristics of an ideal ESS will be obtained according to the ESS power and energy demand under operating conditions.

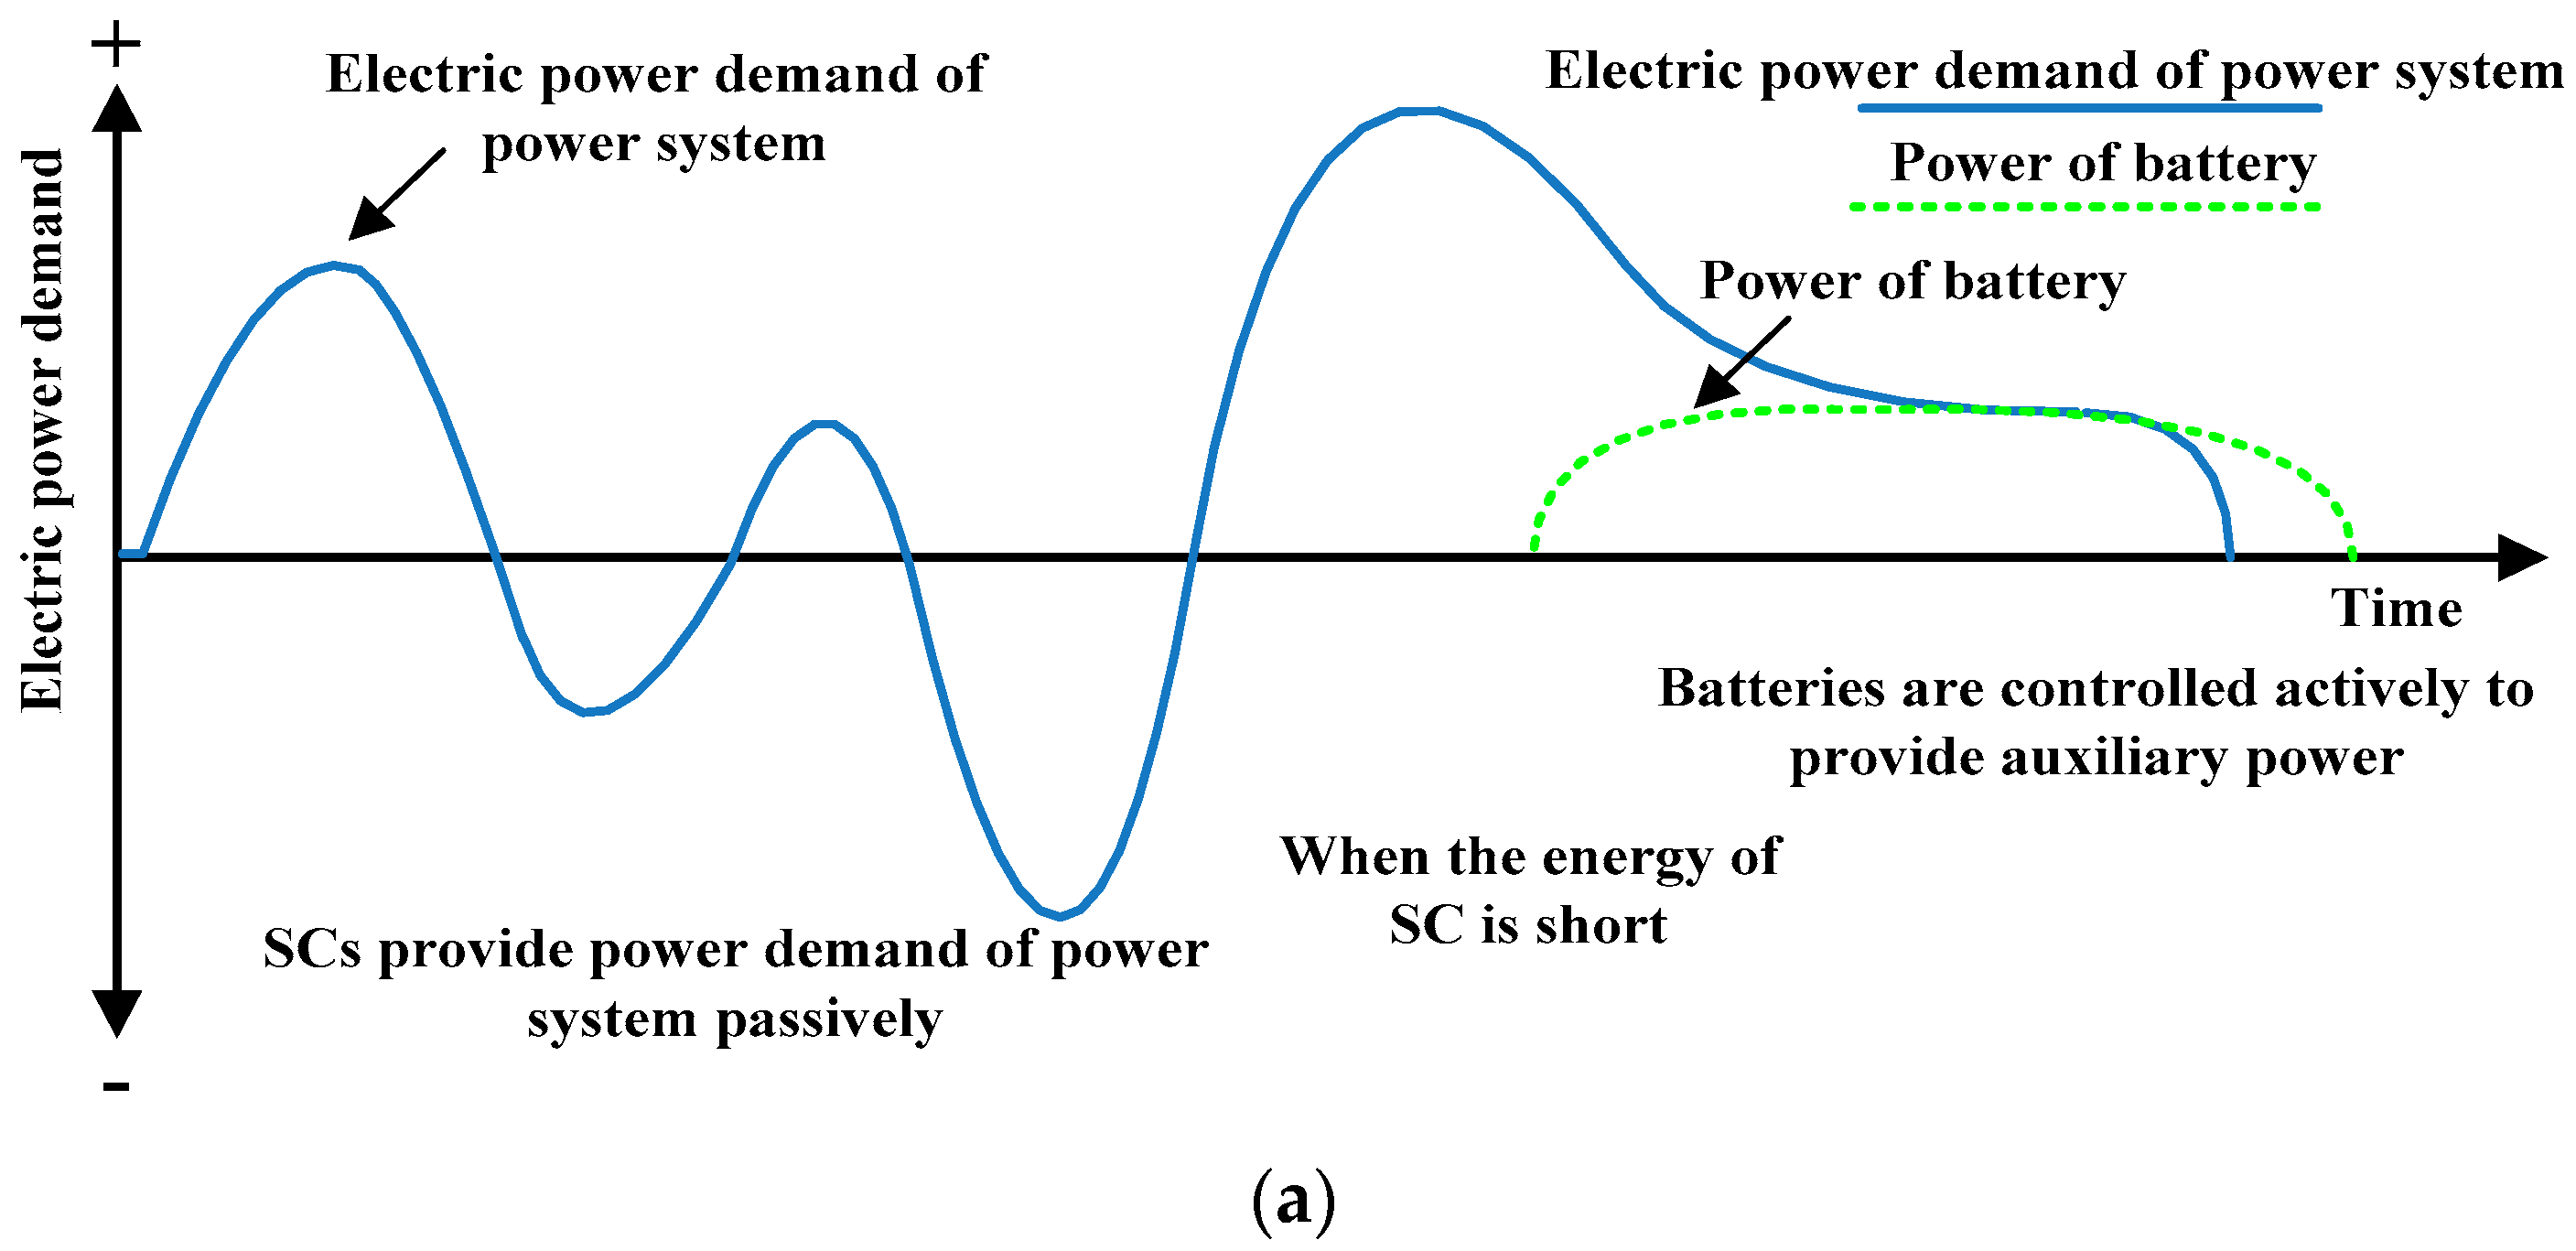
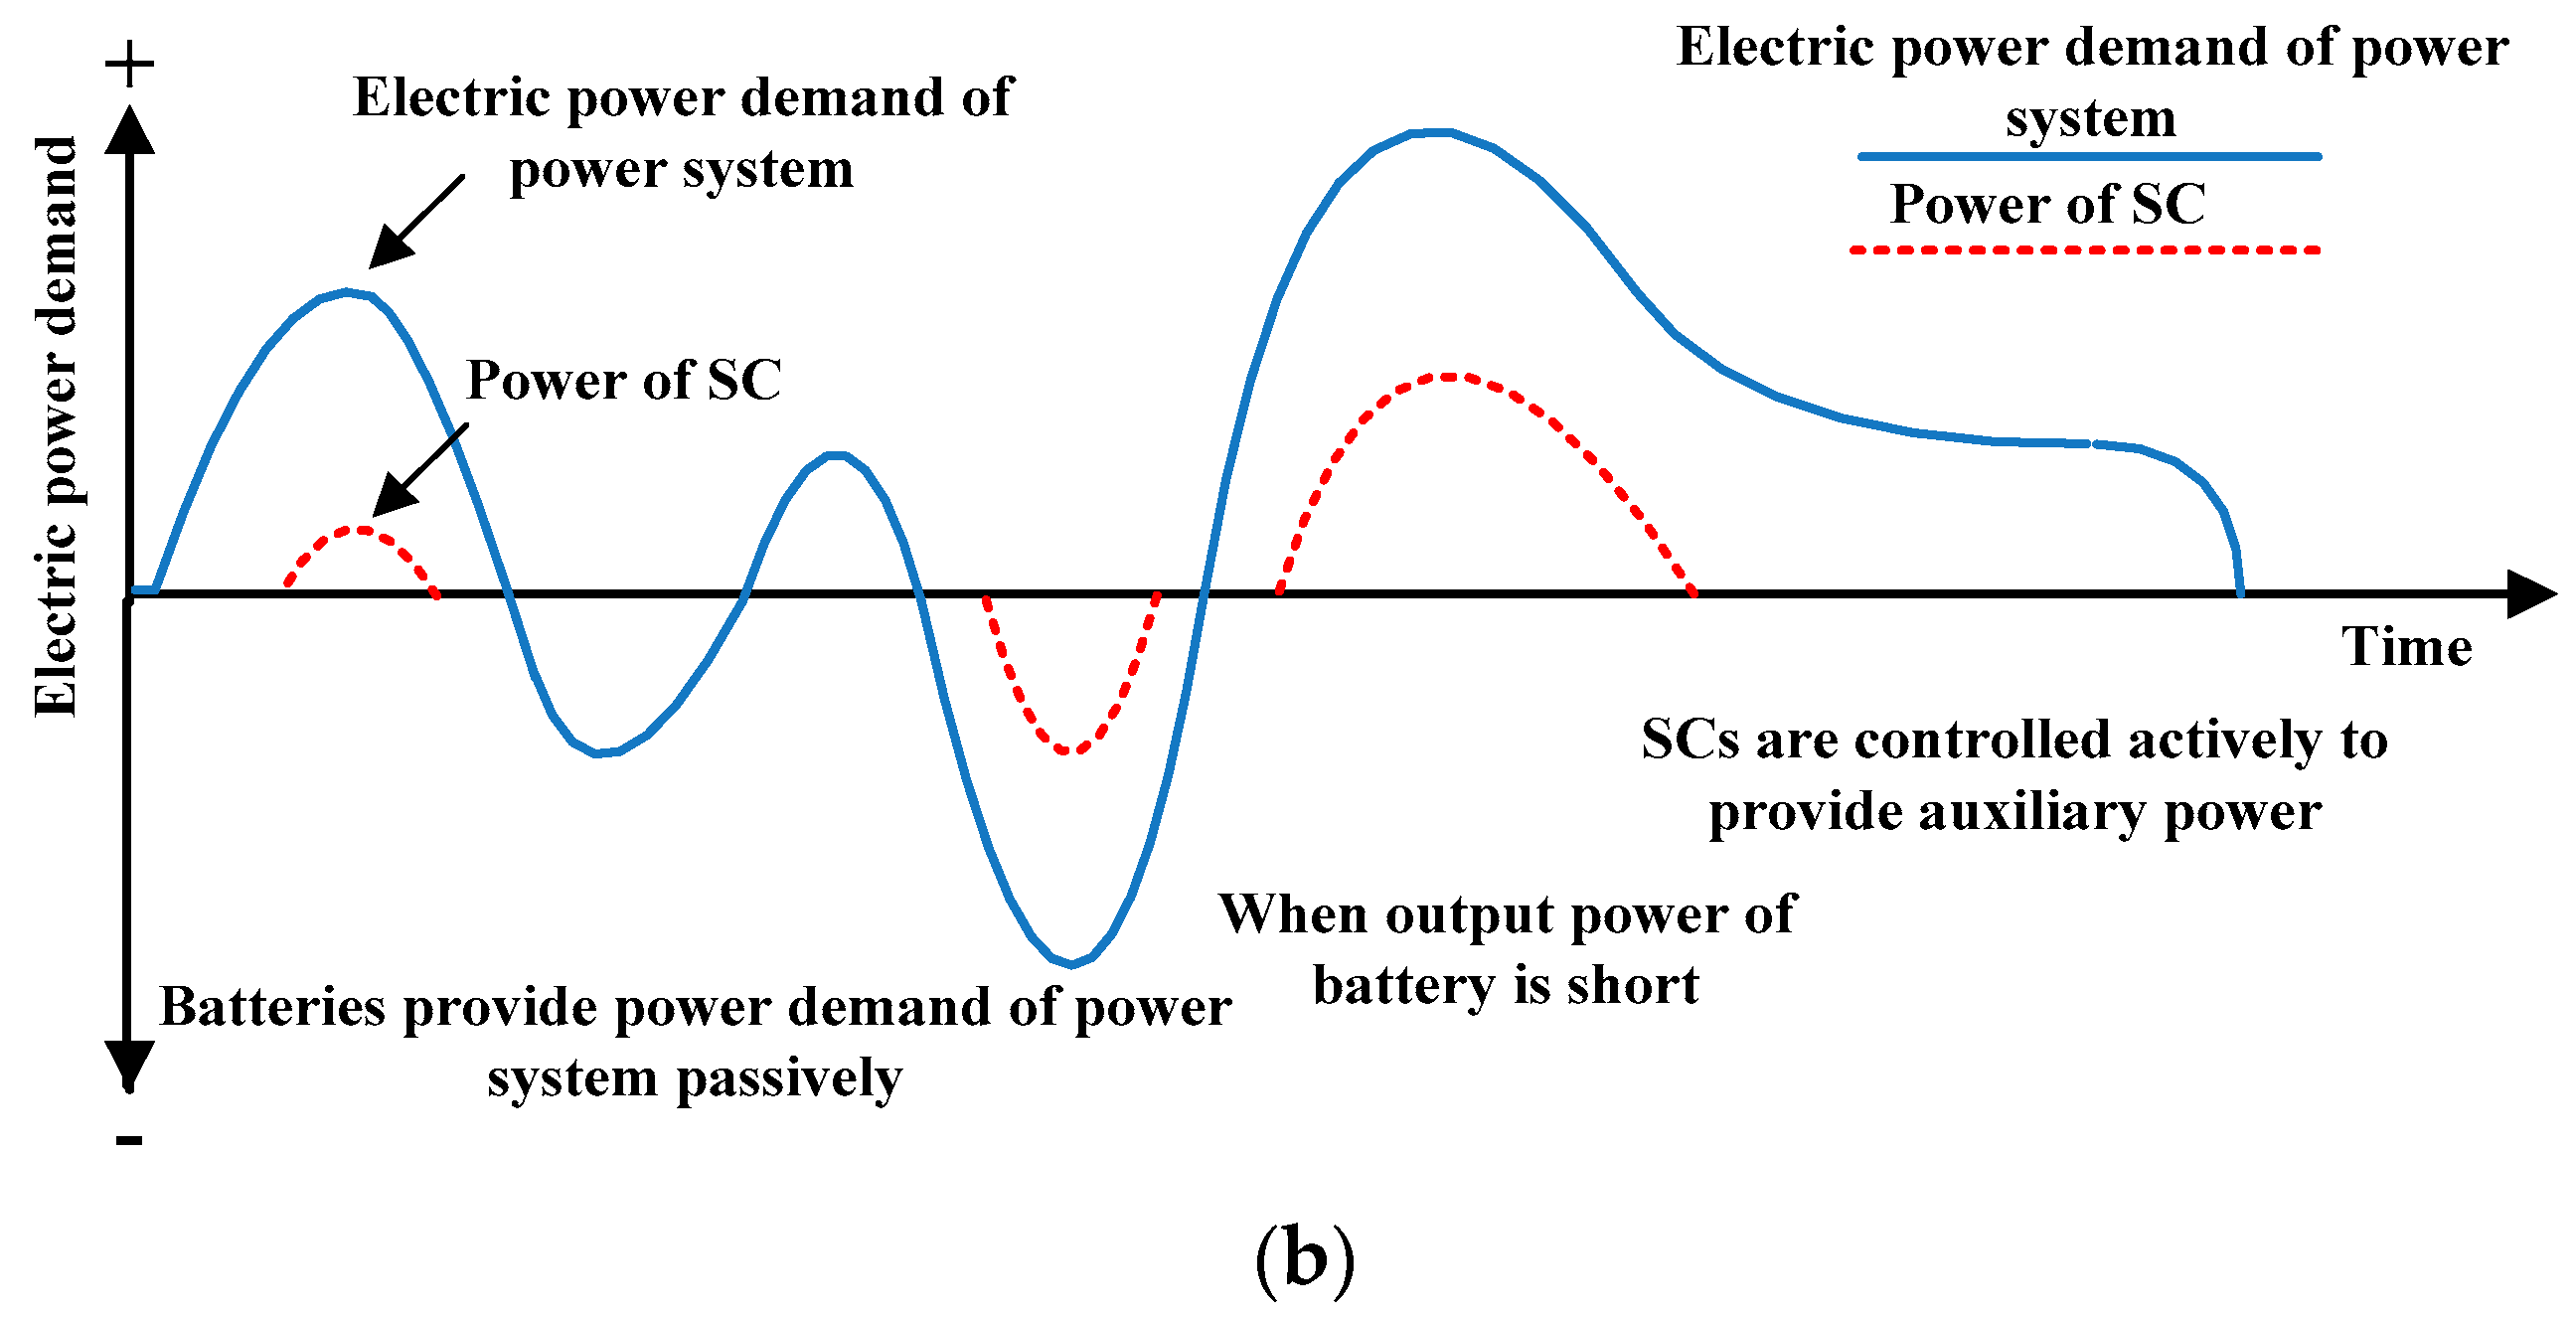
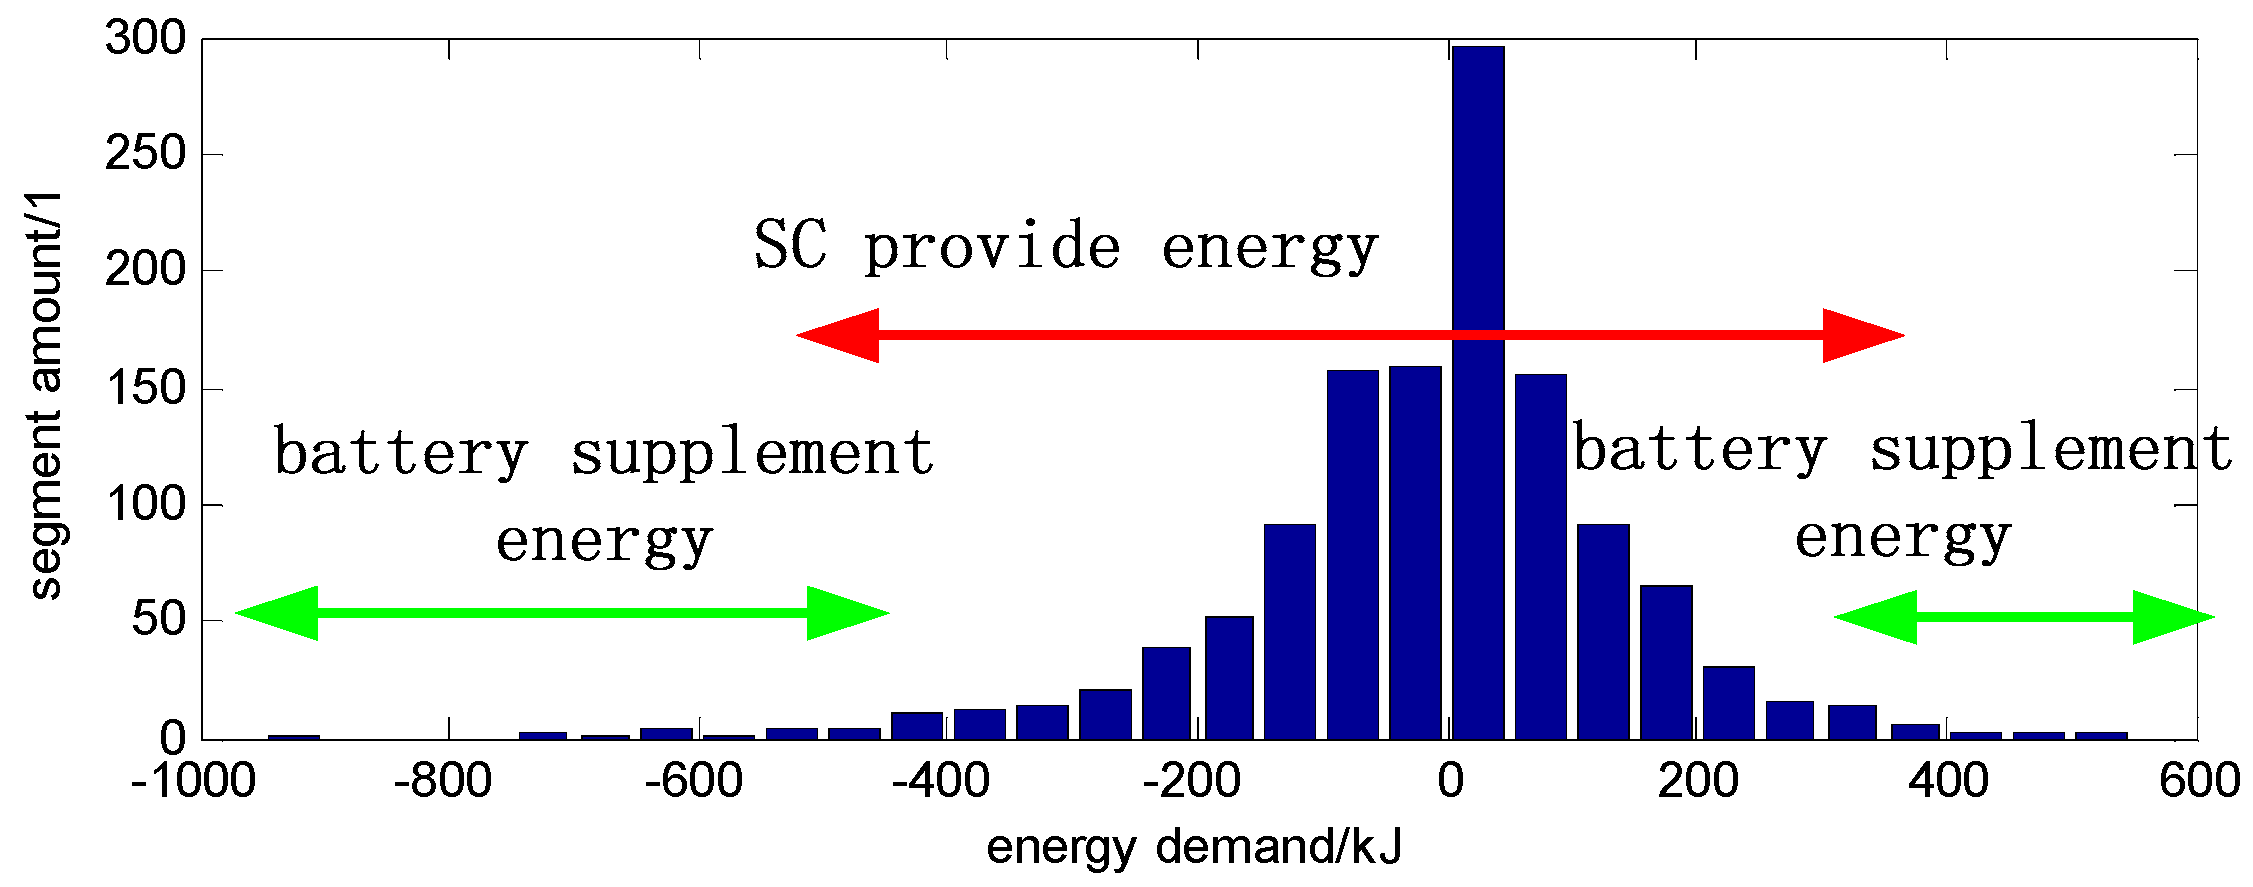
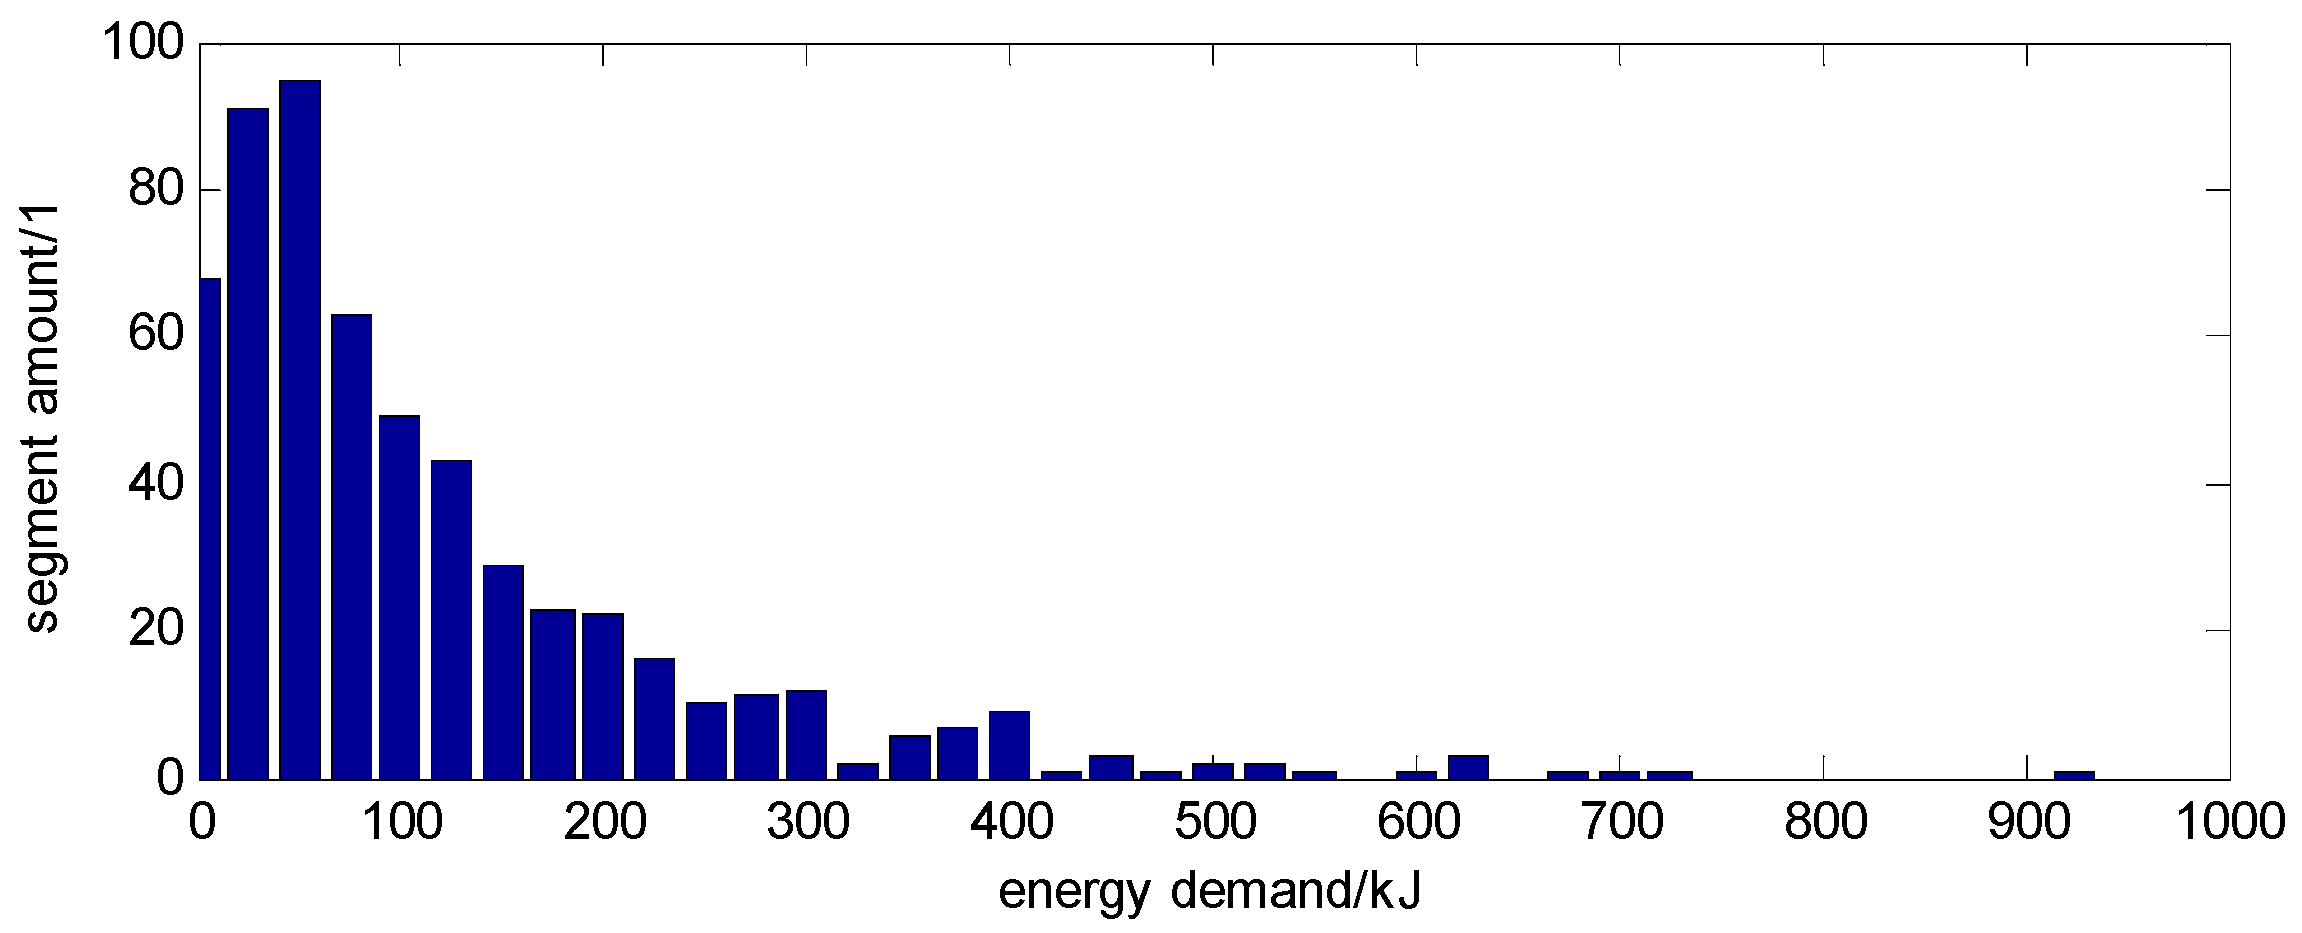
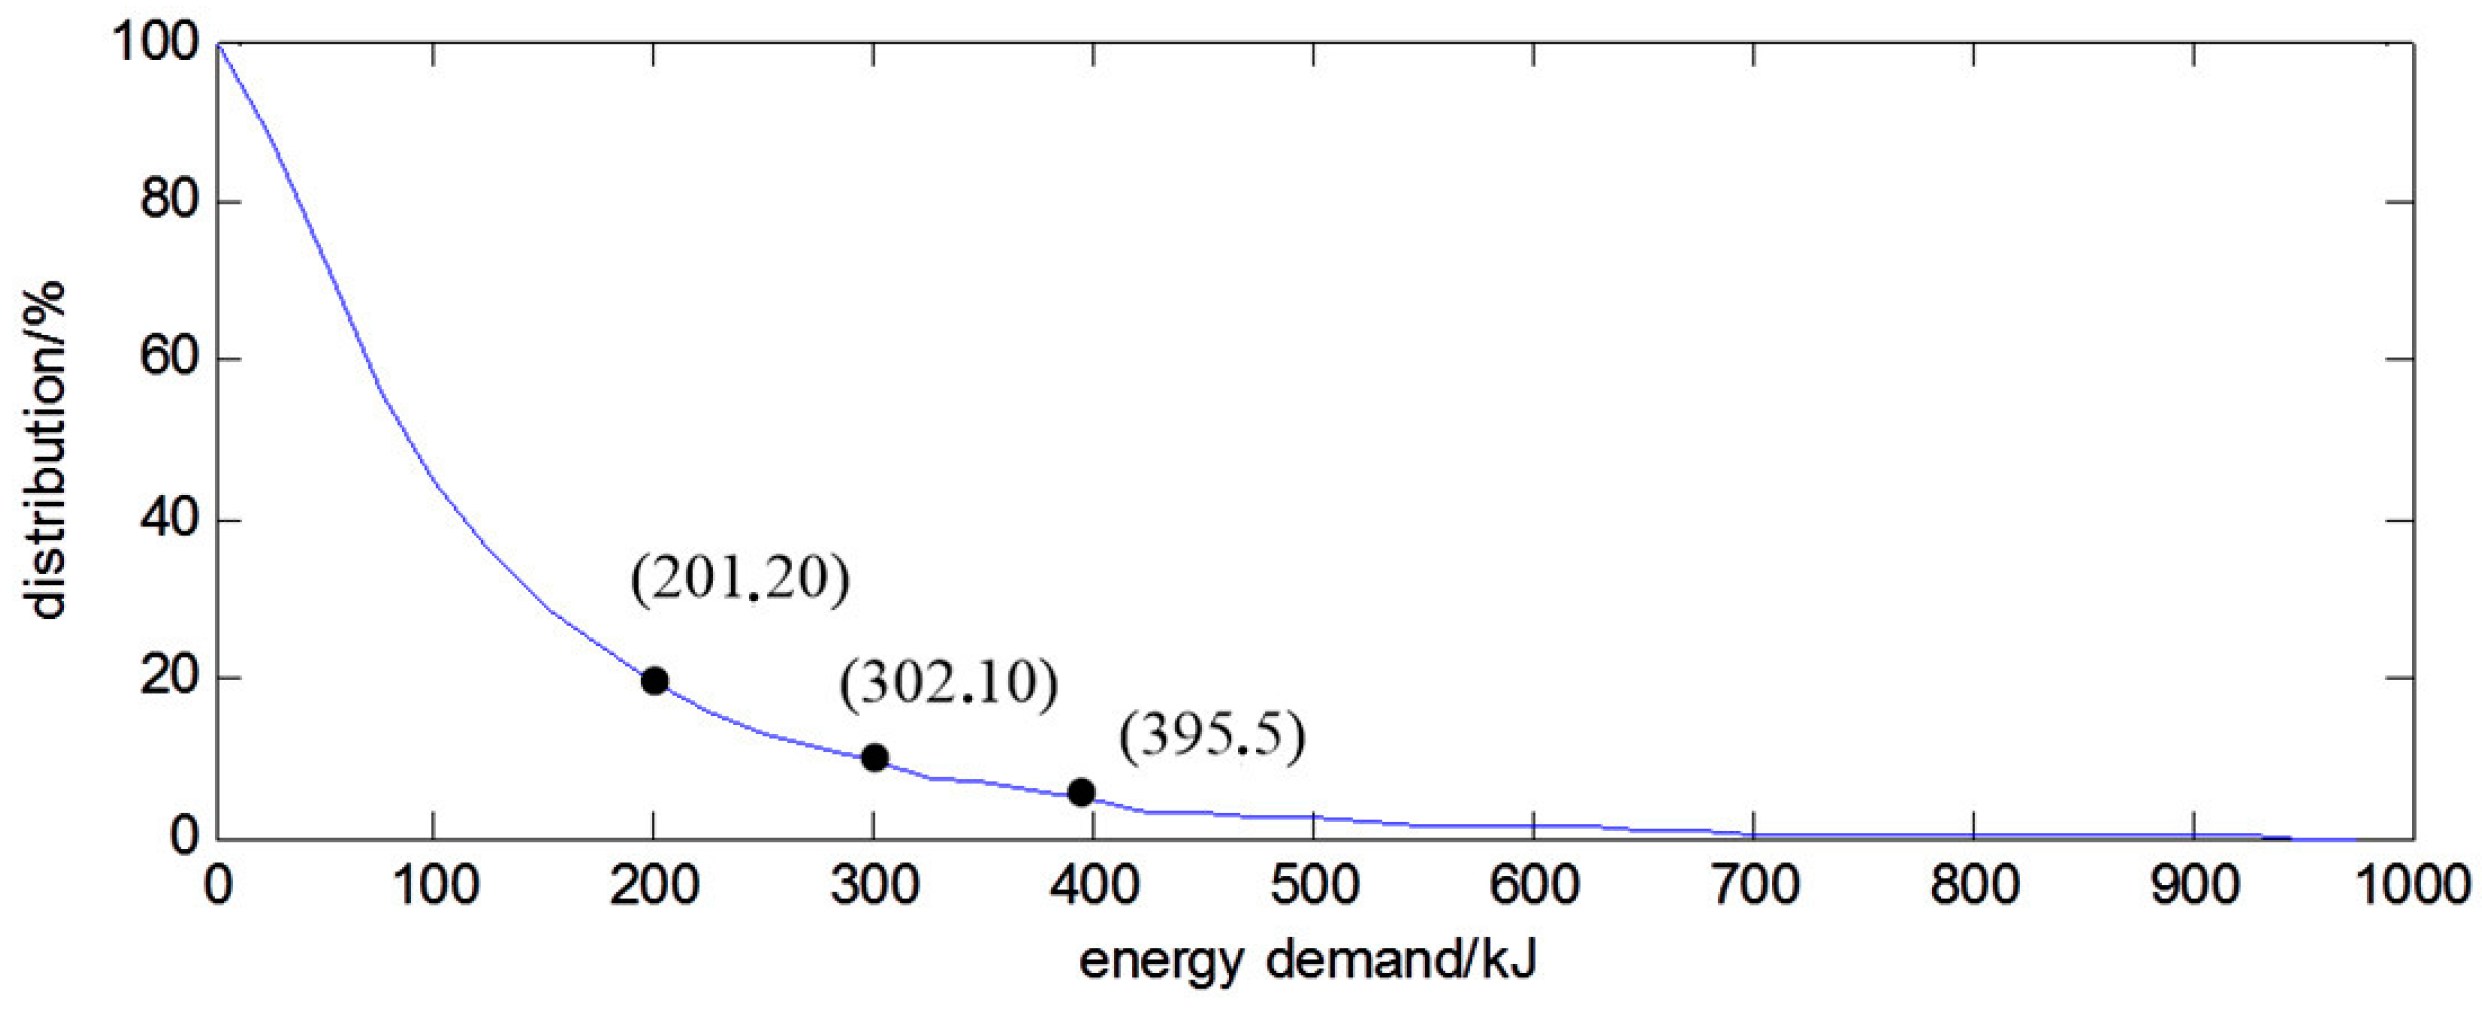
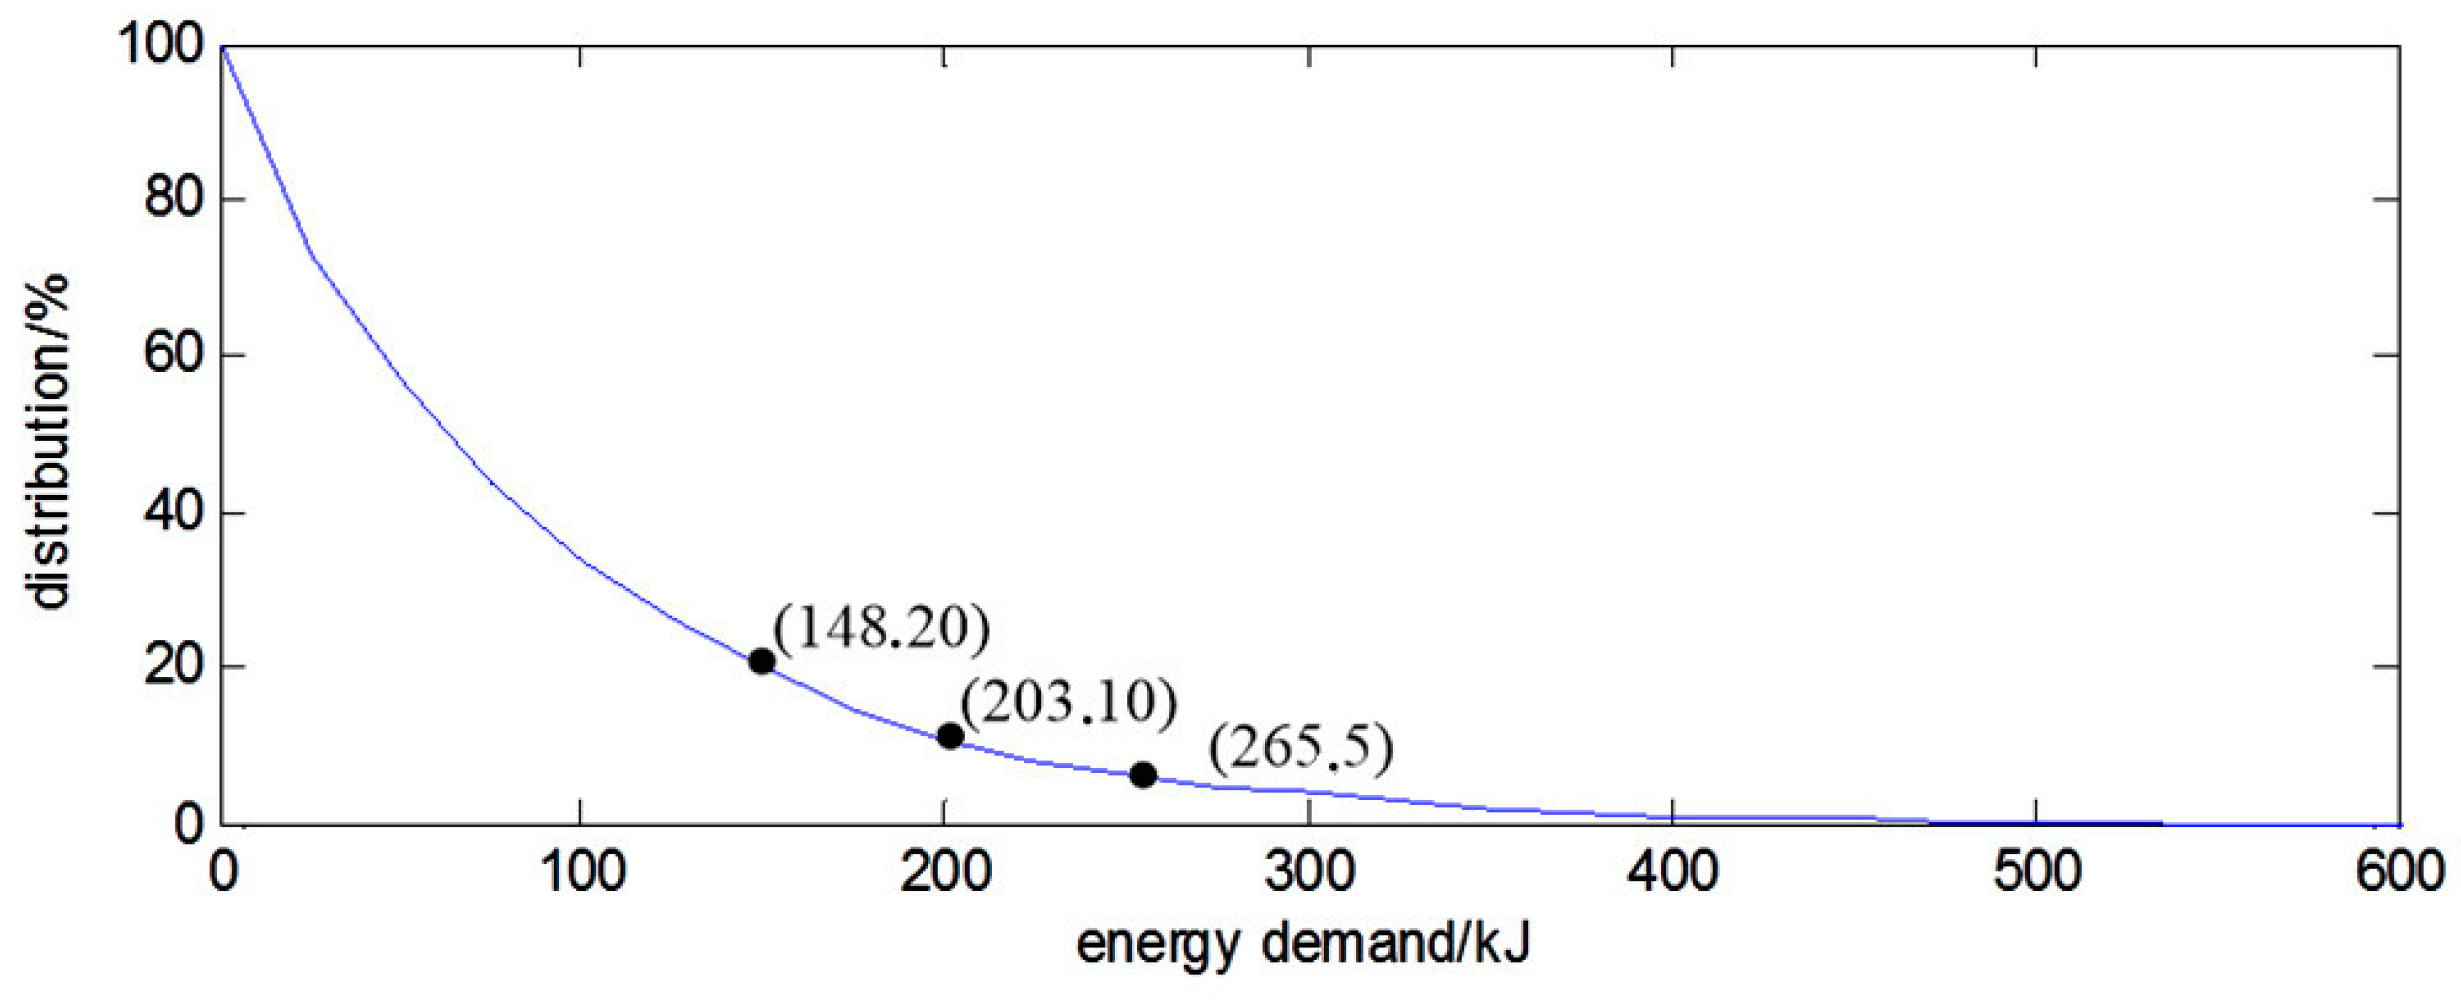
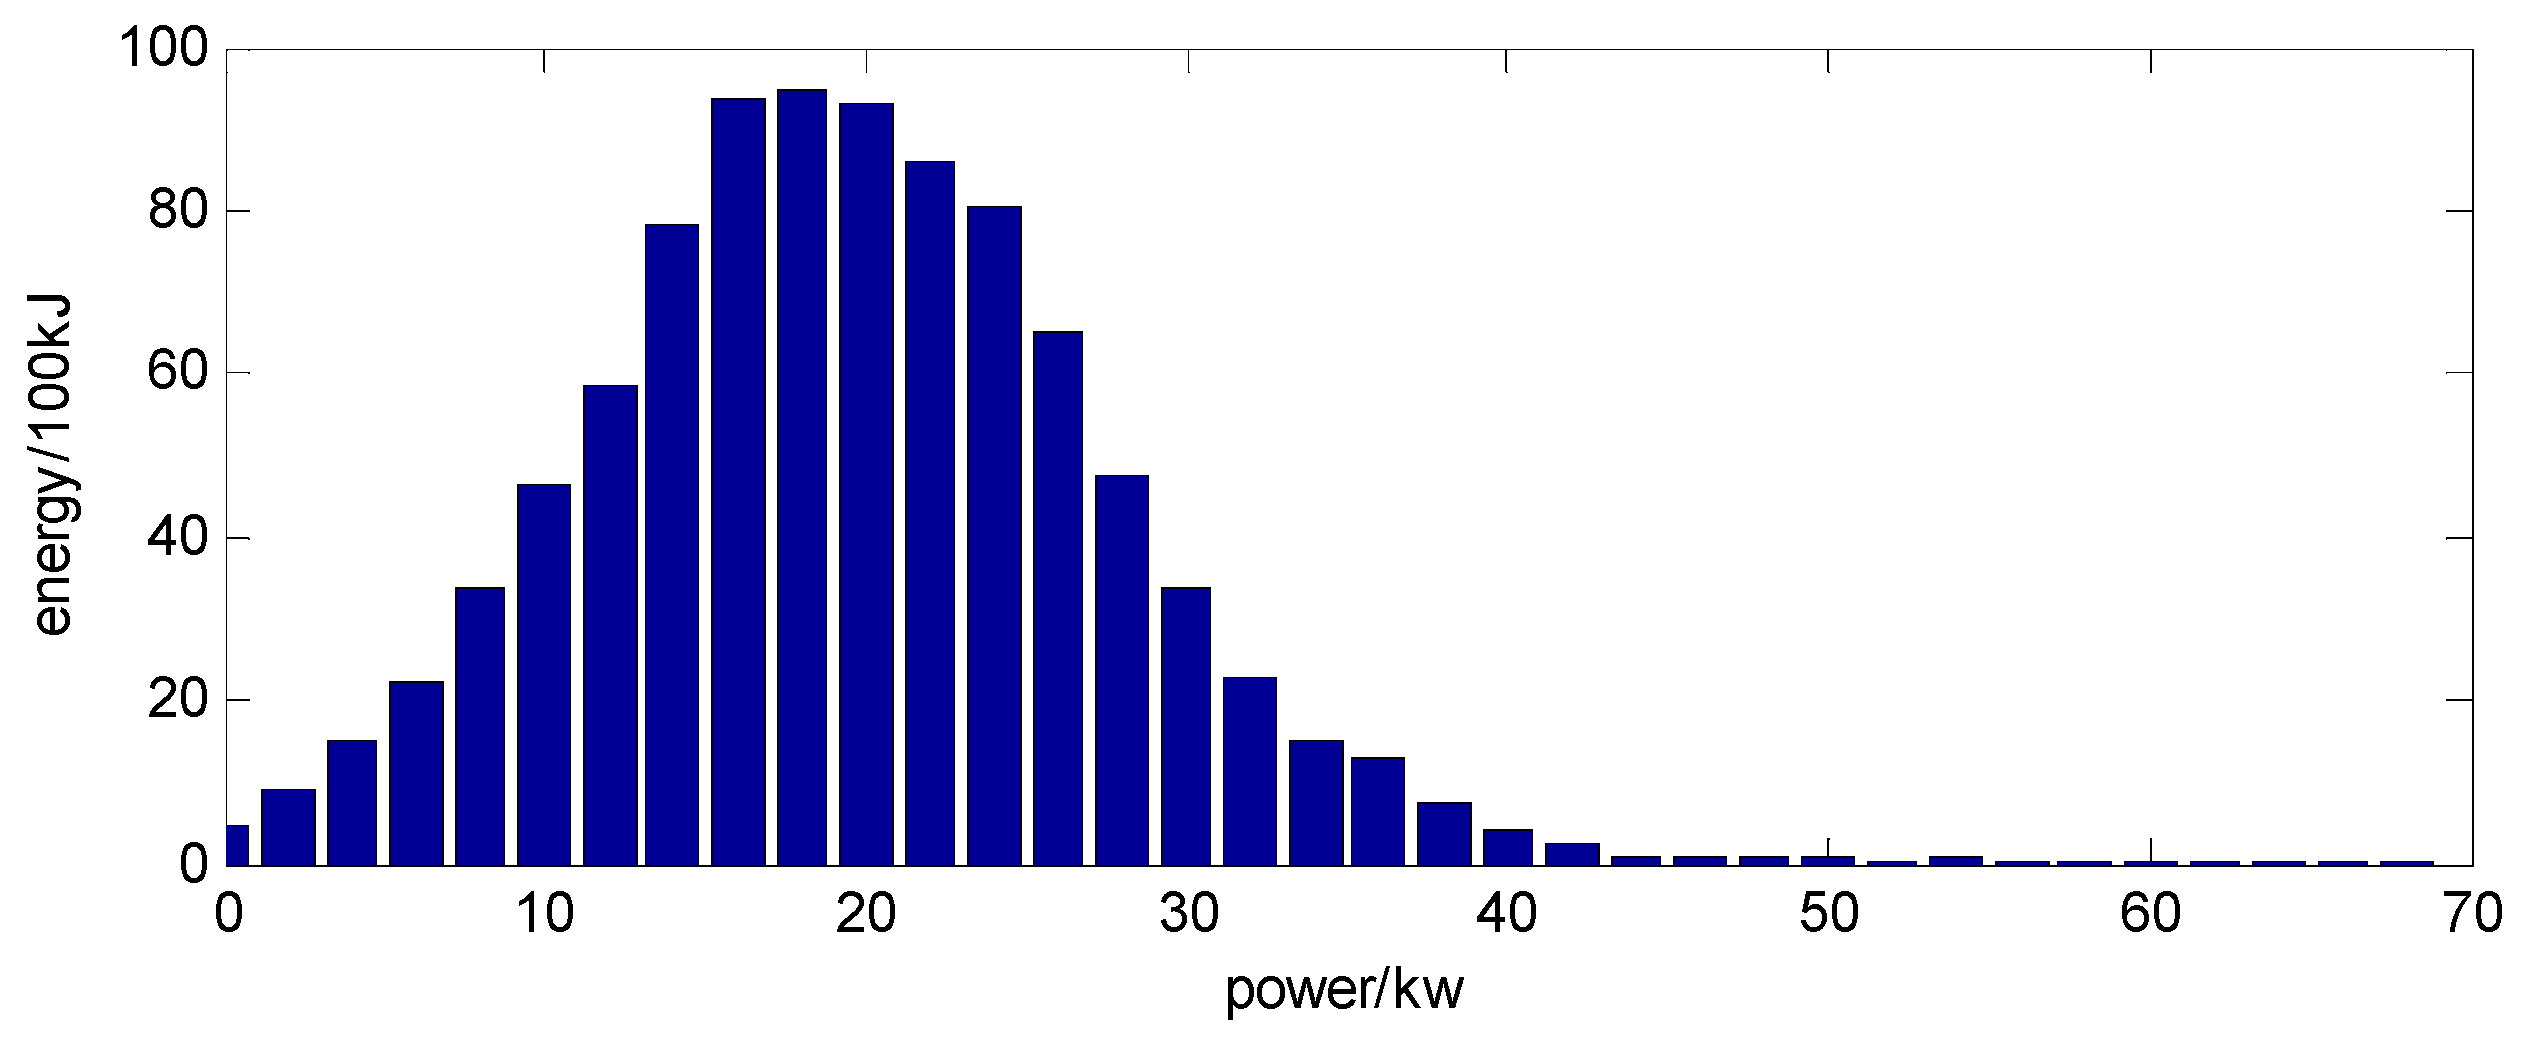
2.2.1. Energy Requirements during Charging/Discharging

The ESS drivetrain energy demand is the energy that the ESS continuously outputs or recycles under each discharge/charge condition. The statistics of all the charging and the discharge demand energy can be used to get the ESS drivetrain energy requirements.
The first step is to gather statistics of the energy demand of discharge conditions. By analyzing the segment numbers in the range of energy demand, the distribution of the energy demand values from 574 discharge conditions in Table 2 is obtained, as shown in Figure 4. In order to better represent the distribution of demanded energy values, the distribution rates of the demanded energy values in the discharge conditions are made by the normalized processing and the concept of the mathematical distribution diagram, as shown in Figure 5. The points (X, Y) in the distribution diagram mean that the number of discharge segments with the energy demand values greater than X accounts for Y% of the total number of discharge conditions.
From Figure 4 and Figure 5, the value of the maximum energy demand fragment is about 920 kJ, and the energy demand value in most discharging fragments is below 300 kJ. The fragments where the energy demand is below 200 kJ account for 80%. The fragments of which energy demand is below 300 kJ account for 90%. The fragments of which the energy demand is below 400 kJ account for 95%. This shows that long-term electric power or pure electric output is very rare, and the drivetrain always operates in short-time assistance mode. The statistical data and the characteristics of urban bus conditions are very consistent. The distribution rate and distribution energy demand in 713 charge conditions were calculated by the same method. The results are shown in Figure 6 and Figure 7.
Compared with the distribution of the energy demand values in the discharge conditions, the charge conditions are more regular. The higher the energy demand value is, the less the number of working condition segments that appear. This is because the charging conditions mean that PTHEB is working in the regenerative braking mode. The regenerative braking energy is proportional to braking speed and brake time, and the PTHEB often travels at low speeds. The PTHEB adjusts speed by short-time braking, so there are more operating conditions with low energy demand values.
As shown in Figure 6 and Figure 7, the max energy demand value is about 540 kJ. The fragments where the energy demand is below 148 kJ account for 80%. The fragments which energy demand is below 203 kJ account for 90%, and the fragments of which the energy demand is below 265 kJ account for 95%.
Overall, the sustained charge and discharge energy demand of the drivetrain is not high. The maximum value is 100 kJ (0.28 kWh) for discharge energy demand and 600 kJ (0.17 kWh) for charge energy demand. Assuming that the drivetrain has a good power capacity balance, ESS can always be restored to the desired level of power after the sustained charge and discharge operations. If the desired level of electricity is zero, when ESS available energy of the upper and lower limits are −1000 kJ (−0.28 kWh) and 600 kJ (0.17 kWh) respectively, it will meet the conditions of all the sustained charging and discharging energy demand. By regarding the discharge demand energy as a negative value, and unifying the energy demand of the charge and discharge conditions, the charge and discharge energy demand distribution of the cycles shown in Figure 8 and listed in Table 2 is obtained.
The energy demand in most charging/discharging fragments is between −400 and 400 kJ, as shown in Figure 8. Therefore, the ESS should be more efficient when energy demand of charging/discharging is between −400 and 400 kJ, while the premise is that the ESS can meet the demand for 600 kJ charging energy and −1000 kJ discharging energy.

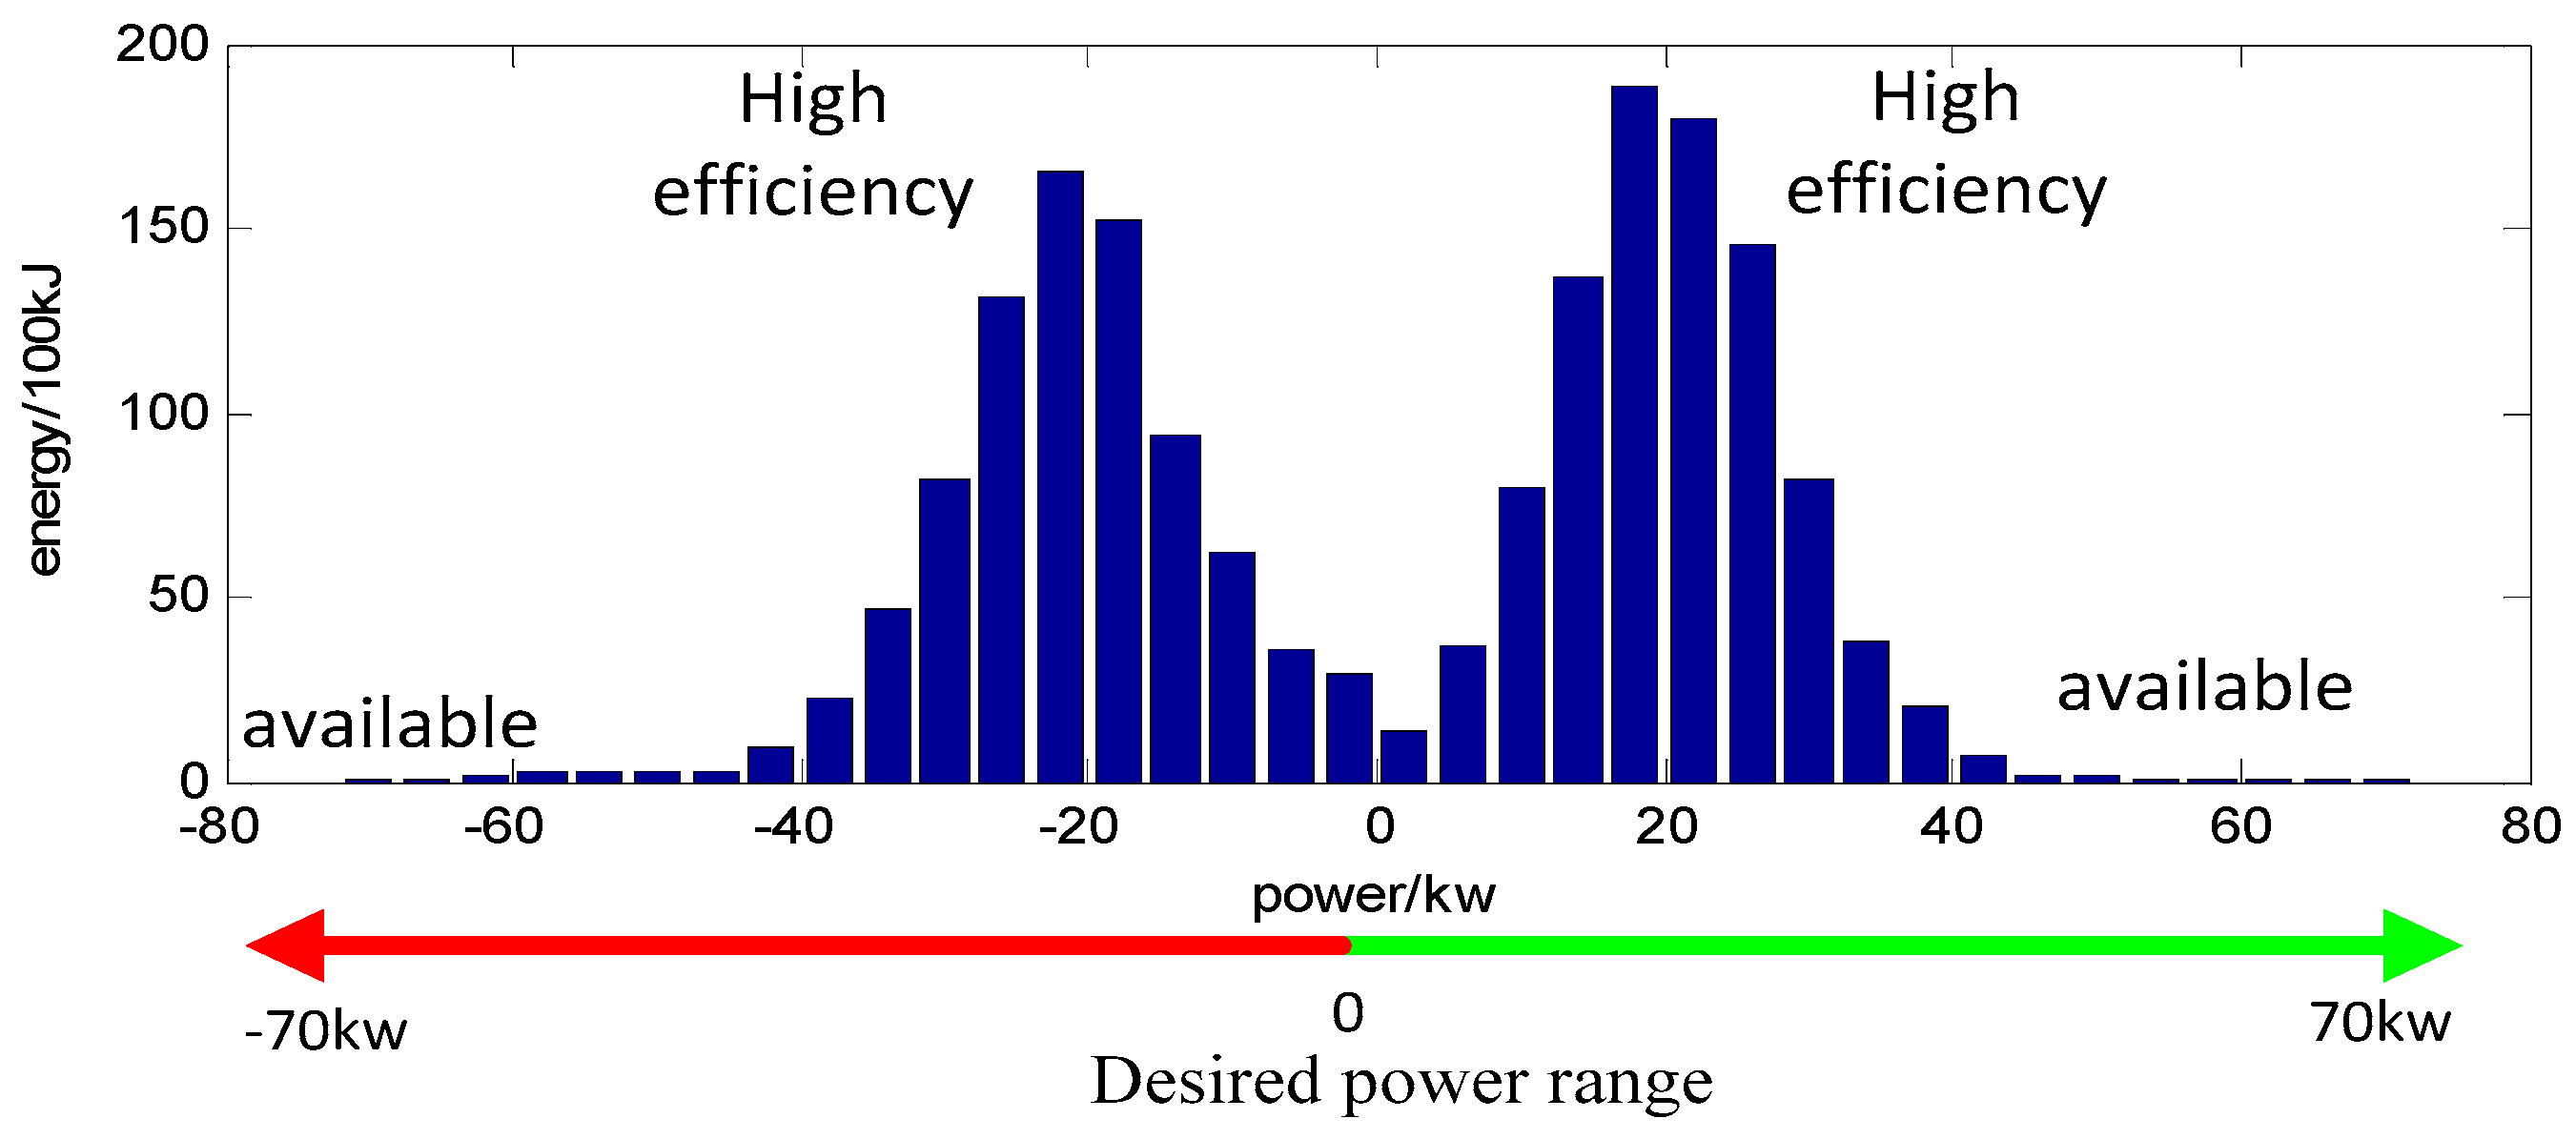
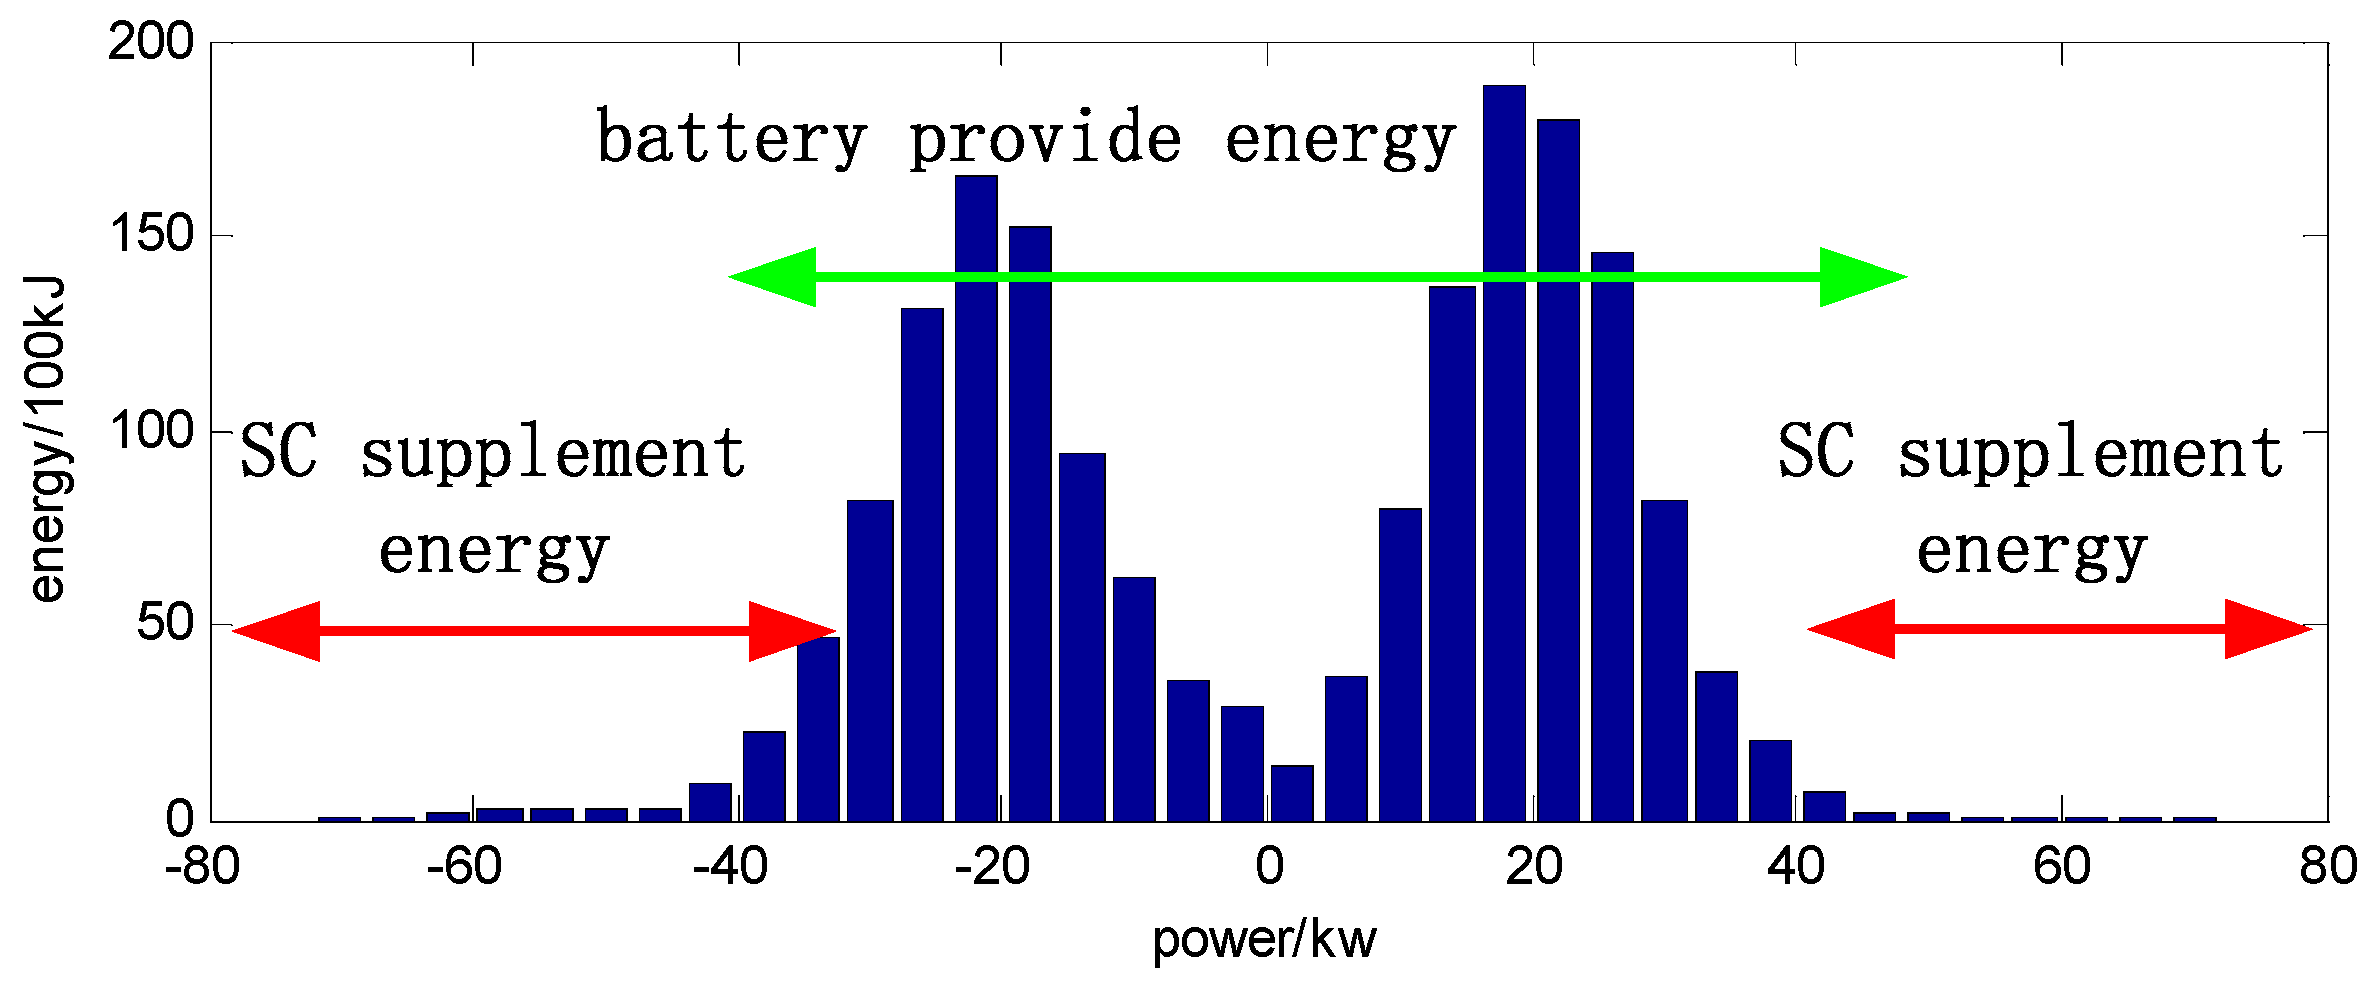
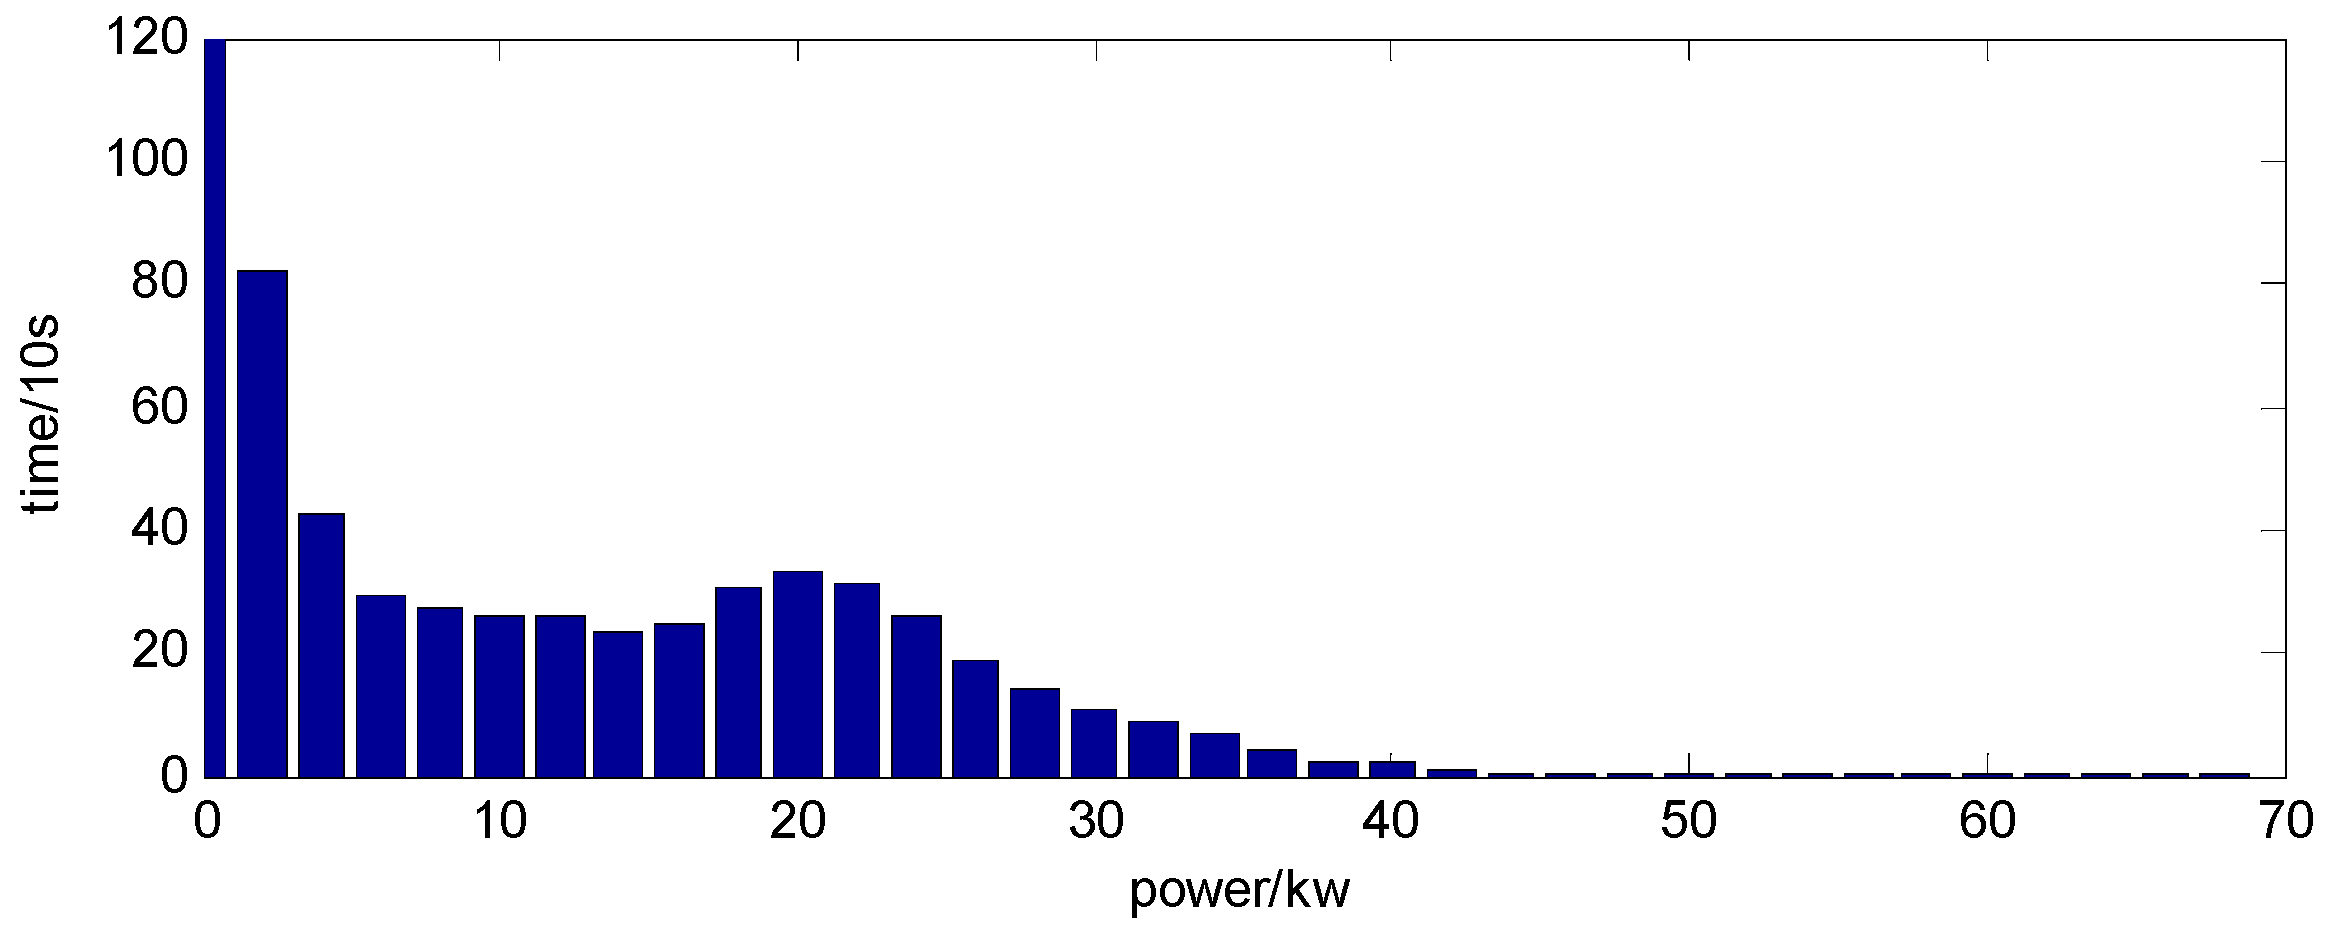
2.2.2. Power Demands during Charging/Discharging

To obtain the power demand of ESS from the vehicle drivetrain, it is necessary to analyze the charge/discharge time of ESS under different charge/discharge power values. The discharge/charge distribution for different powers is obtained, as shown in Figure 9, by counting the 10 sets of data from Table 2.
From Figure 9, 68 kW is the maximum power in the cycle and the discharge power values are lower than 40 kW most of the time, but the energy loss is determined by the efficiency in every power range, and the efficiency is determined by power and time. Therefore, output energy distribution in different discharge power is a better description on the power demand of ESS, as shown in Figure 10.
In Figure 9, the power range during most operating period is 0–5 kW. However, the most output energy of ESS is within the range, which is from 18 to 26 kW in Figure 10. Therefore, the distribution of times and energy in different charge power, as shown in Figure 11 and Figure 12, is obtained the same way. From Figure 11 and Figure 12, 10–30 kW is the power range with the maximum input energy and time. The ESS discharging power is regarded as negative and charging power is regarded as positive. The energy distribution under different charging/discharging power values and the expected performance requirements of ESS are obtained, as shown in Figure 13. In terms of power performance, ESS should have 70 kW charging/discharging power capacity but higher efficiency when the charging/discharging power is between −40 and 40 kW, as shown in Figure 13.

3. Characteristics of the Component in Hybrid Energy Storage System

3.1. Specifications of Battery and Supercapacitor

HESS is composed of LiFePO4 battery and SC. The performance of HESS components is expressed by the density parameter of power, energy and efficiency. The basic parameters such as capacity, nominal voltage and resistance can be determined from the cell specifications and are shown in Table 3. The following calculations in the paper are based on the battery and SC cell parameters in Table 3.

3.2. Efficiency Density and Efficiency Characteristics of Battery and Supercapacitor

Most of the existing literatures are based on the power or energy density of ESS, however none of them can discuss specific work efficiencies, so in this paper, we calculate the specific power loss by defining the efficiency density parameter. The efficiency characteristics of energy storage components, such as SCs and batteries, can be expressed as a ratio of the charge/discharge energy to the lost energy [4]. The loss of energy is due to the efficiency of internal resistance and ampere-hour efficiency. The ratio of the loss of energy to discharge/charge energy is called energy loss rate, as shown in Equation (2):
η = E loss E source
In Equation (2), η is the energy loss rate, E loss is loss of energy, E source is the discharge/charge energy, and defined as follows:
E source = 0 T I × O C V C dt
In Equation (3), O C V C is the open circuit voltage of cell, I is the current.
Meanwhile, power loss rate is defined the ratio of the loss of power to discharge/charge power, as shown in Equation (4):
ρ = P loss P source
In Equation (4), P loss is the loss of power, P source is the discharge/charge power, called source power also, and defined as follow:
P source = I × O C V C
The relationship of P source , P loss and the output power of battery, P out , is shown in Equation (6):
{ charge   P source = P out P loss discharge   P source = P out + P loss
According to the integral relationship of power and energy, the energy loss rate is shown in Equation (7):
η = 0 T P loss dt 0 T P source dt = 0 T ρ × P source dt 0 T P source dt
The energy loss rate and power loss rate represent the efficiency characteristics of the battery pack and SC pack, and are determined by the capability and quantity of the cells therein. The energy loss rate of a battery or a SC at a certain output power can be calculated with the following Equation (8) by using the Rint model shown in Figure 14.
η = 0 T P loss dt 0 T P source dt = 0 T I 2 × R int dt 0 T I × O C V C dt = I × R int O C V C
In Equation (8), I is the cell current at corresponding output power, R int is the internal resistance of cell.
For a battery pack or SC pack consisting of n cells, the output power of a cell at the same output power is one in n of the total output power, and the output current of the cell is I/n. Therefore the energy loss efficiency of the battery pack or the SC pack is shown in Equation (9):
η = 0 T P loss dt 0 T P source dt = 0 T I 2 × R int dt 0 T I × O C V C dt = 1 n × I × R int O C V C
In Equation (9), n is the number of cells, either in parallel or in series.
Therefore, at a certain output power, the higher the efficiency of the cell, the higher the efficiency of the battery pack or SC pack. From the above we can see that efficiency loss or energy loss of the battery or SC pack is determined by the output power, cell properties and the number of cells. The mass, volume, and cost of the pack are directly proportional to the number of cells. Therefore, by referring to the definition of power density and energy density, this paper describes the efficiency characteristics of the battery and SC by using the discharge power of each mass, volume and cost values of the battery or SC at standard power loss rate. The parameters are defined in Table 4.
In this paper, with reference to the definition of power density and energy density, the efficiency characteristics of a battery or SC are expressed by the discharging energy loss rate of the battery or SC for each mass, volume and cost value at standard power. The efficiency density parameters of battery or SC cell can be calculated by Equations (10):
{ ratio   of   mass   to   efficiency :   Z M = I 1 W × R int × M O C V C ratio   of   volume   to   efficiency :   Z Vol = I 1 W × R int × Vol O C V C ratio   of   cost   to   efficiency :   Z Cost = I 1 W × R int × Cost O C V C
where OCVC is the open circuit voltage of cell, the OCVC of battery and SC is 3.2 V and 2.3 V, respectively; I1W is the current value of cell when the output power is 1 W; ZM is the ratio of mass to efficiency; M is the mass of cell (kg); ZVol is the ratio of volume to efficiency; Vol is the volume (L); ZC is the ratio of cost to efficiency; cost is the initial cost (1000 RMB).
As shown in Table 5, the efficiency density parameters of battery and SC are calculated. It can be seen that for the same mass, volume or cost, the SC efficiency loss is about 1/10 of the battery under same output power. The power loss rate of battery pack or SC pack is expressed, as shown in Equation (10), by using the efficiency density parameter:
{ according   to   mass :   ρ = O C V C × I × Z M M pack   according   to   volume :   ρ = O C V C × I × Z V Vol pack   according   to   cost :   ρ = O C V C × I × Z C Cos t pack  
In Equation (11), I is the current at operating power, M pack / Vol pack / Cos t pack is the mass, volume and cost of the battery pack or SC pack, respectively.
According to the distribution of the energy and power demand shown in Figure 13, the output energy values of the battery at different power levels could be obtained. We can get the power loss rate of the battery for different powers according to Table 5 and Equation (11), as shown in Equation (12):
{ according   to   mass :   ρ = P × Z M M pack   according   to   volume :   ρ = P × Z V Vol pack   according   to   cost :   ρ = P × Z C Cos t pack  
In Equation (12), P is the ESS power.
The total energy loss and energy loss rate as well as average efficiency of energy conversion of the battery pack in those operating conditions can be obtained according to the output energy values and the power loss rate values at different operating powers. The calculation method is shown in the following Equation (13):
η = P × Z M M pack × E P E P
where η is the energy loss rate, E P is the output energy at different power range as shown in Figure 13.

4. Comparisons of Two Semi-Active Configurations of Hybrid Energy Storage System

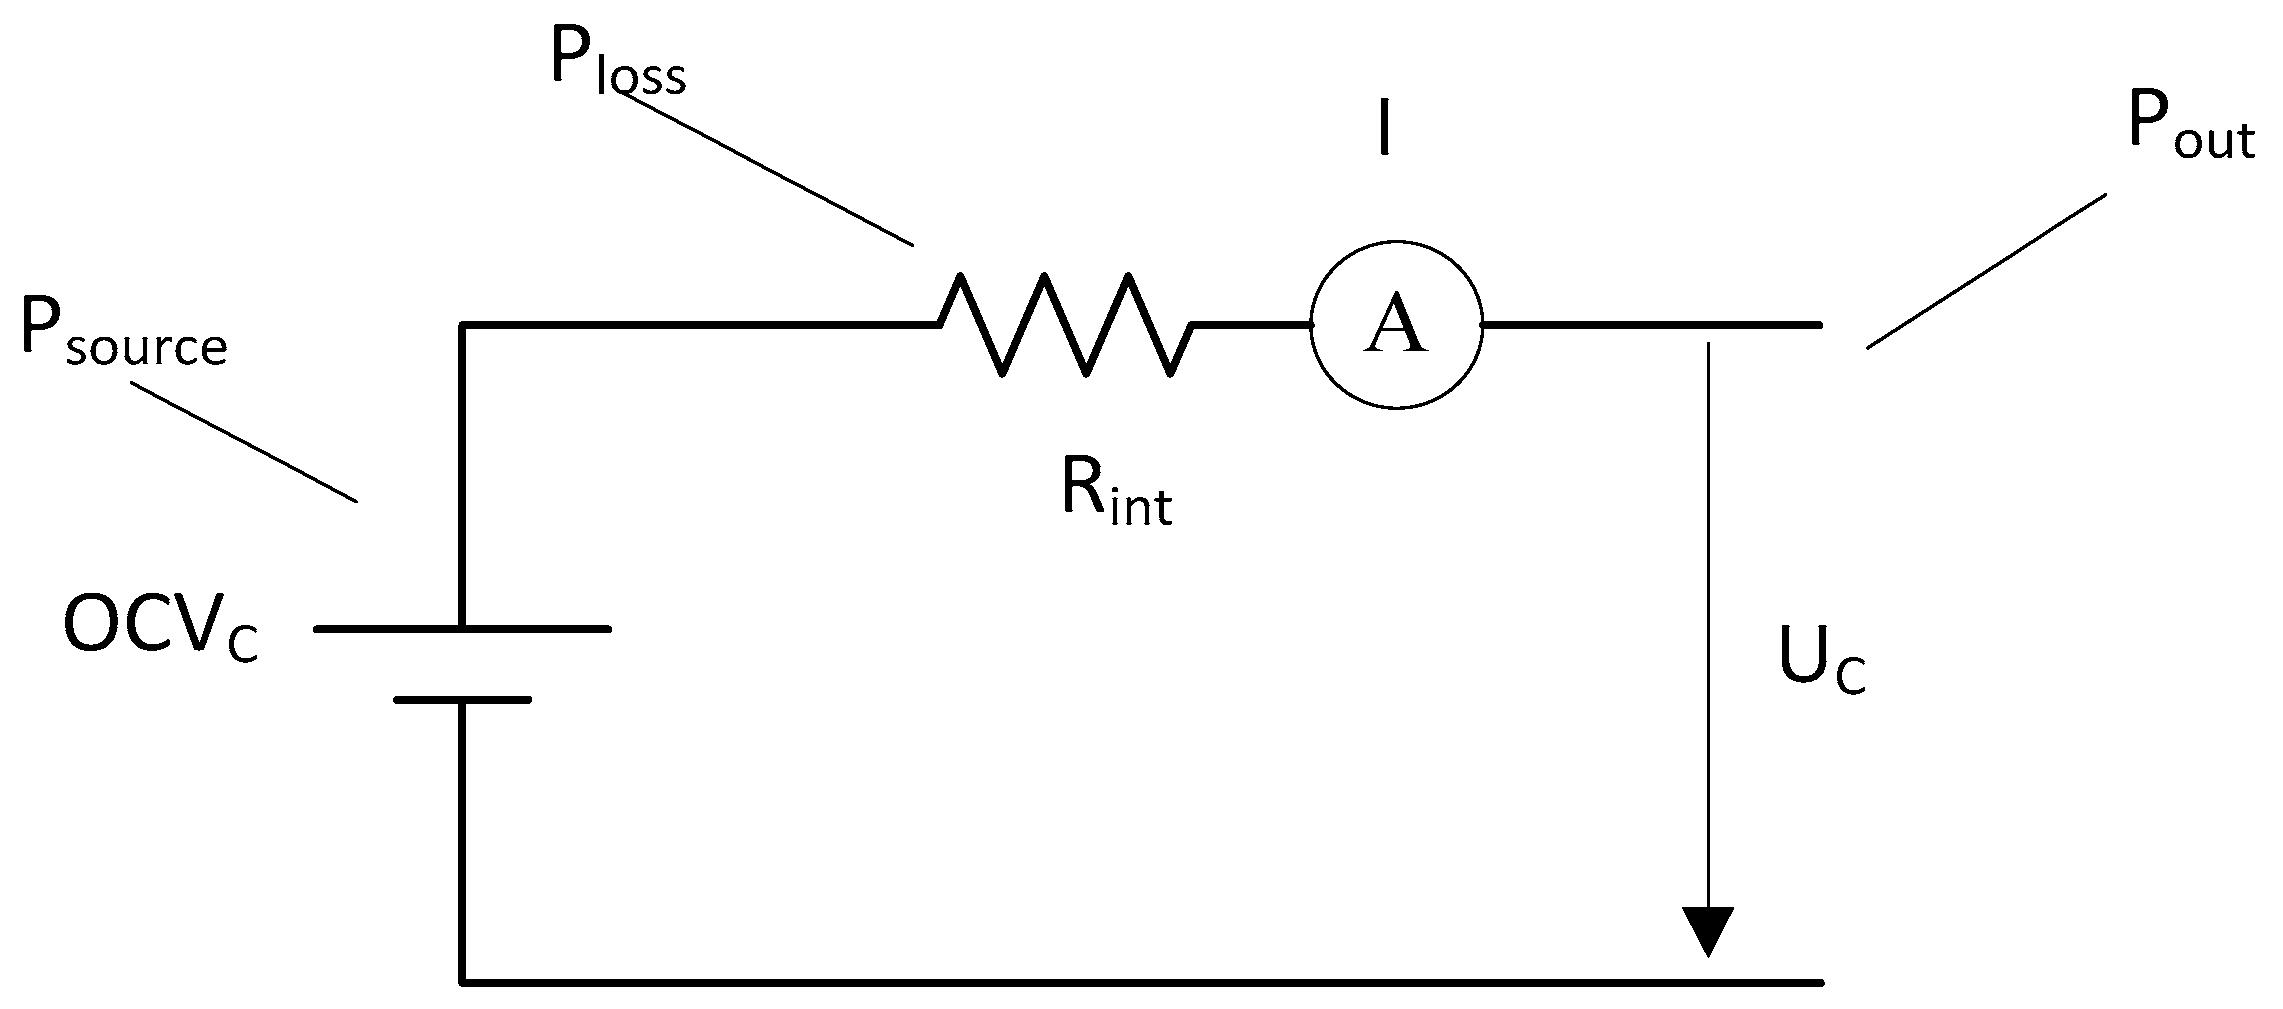
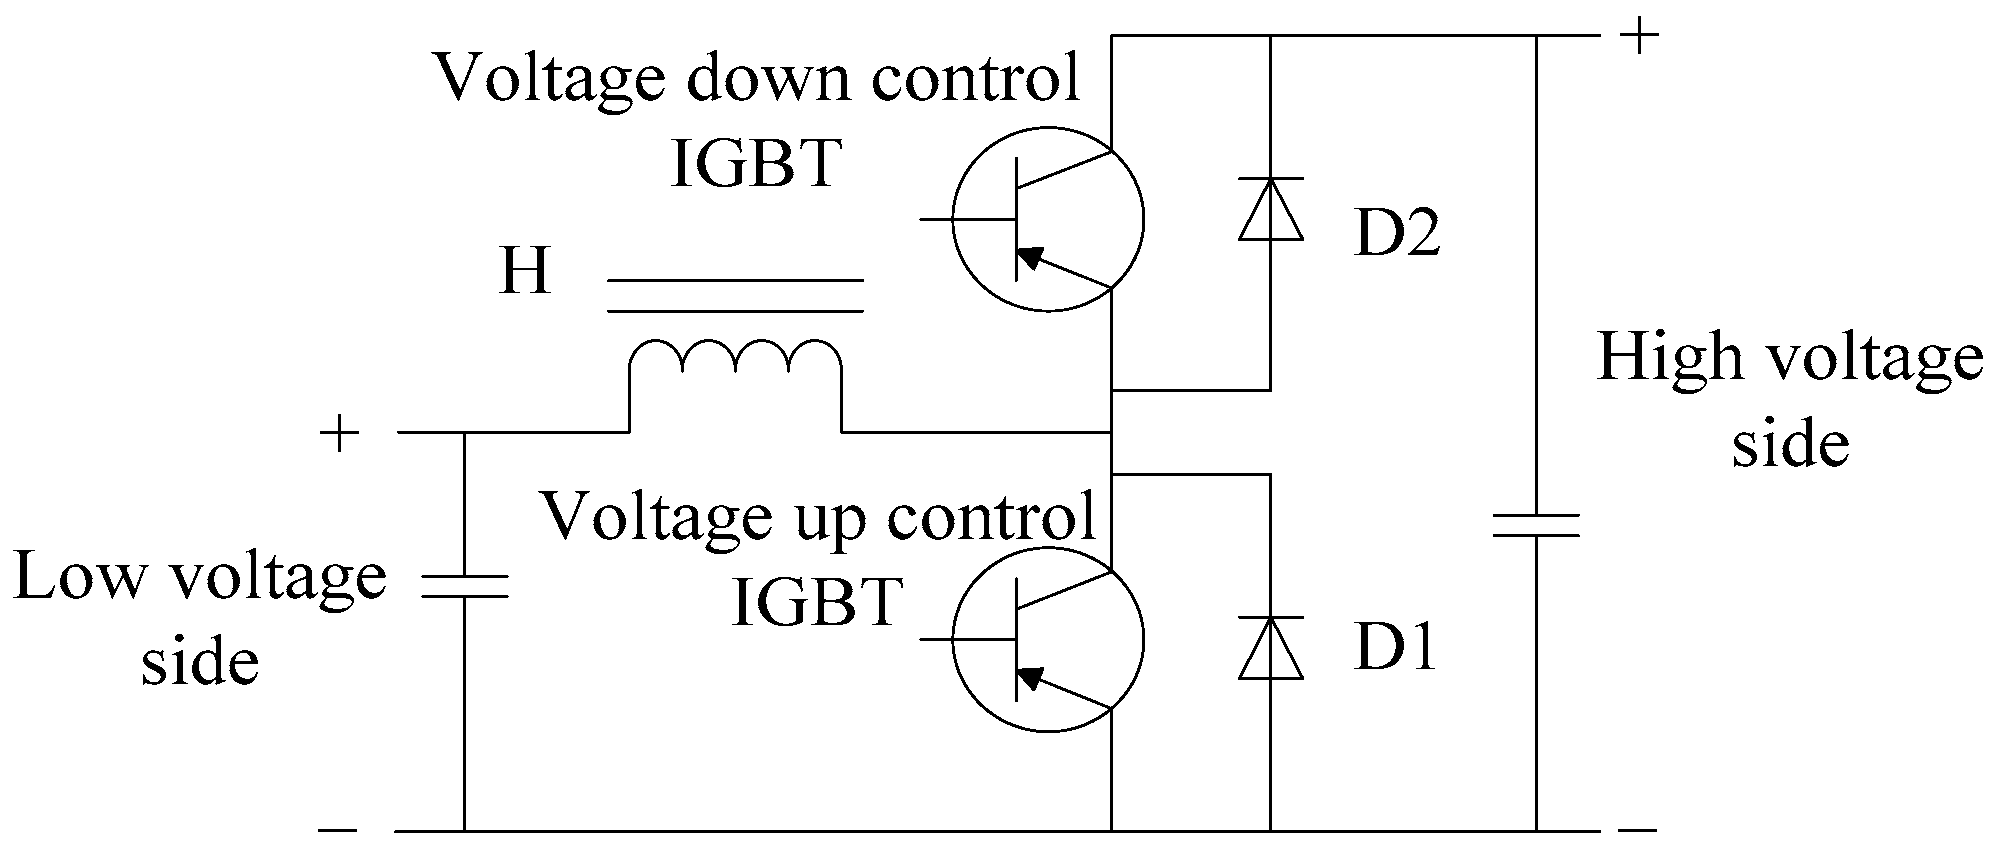
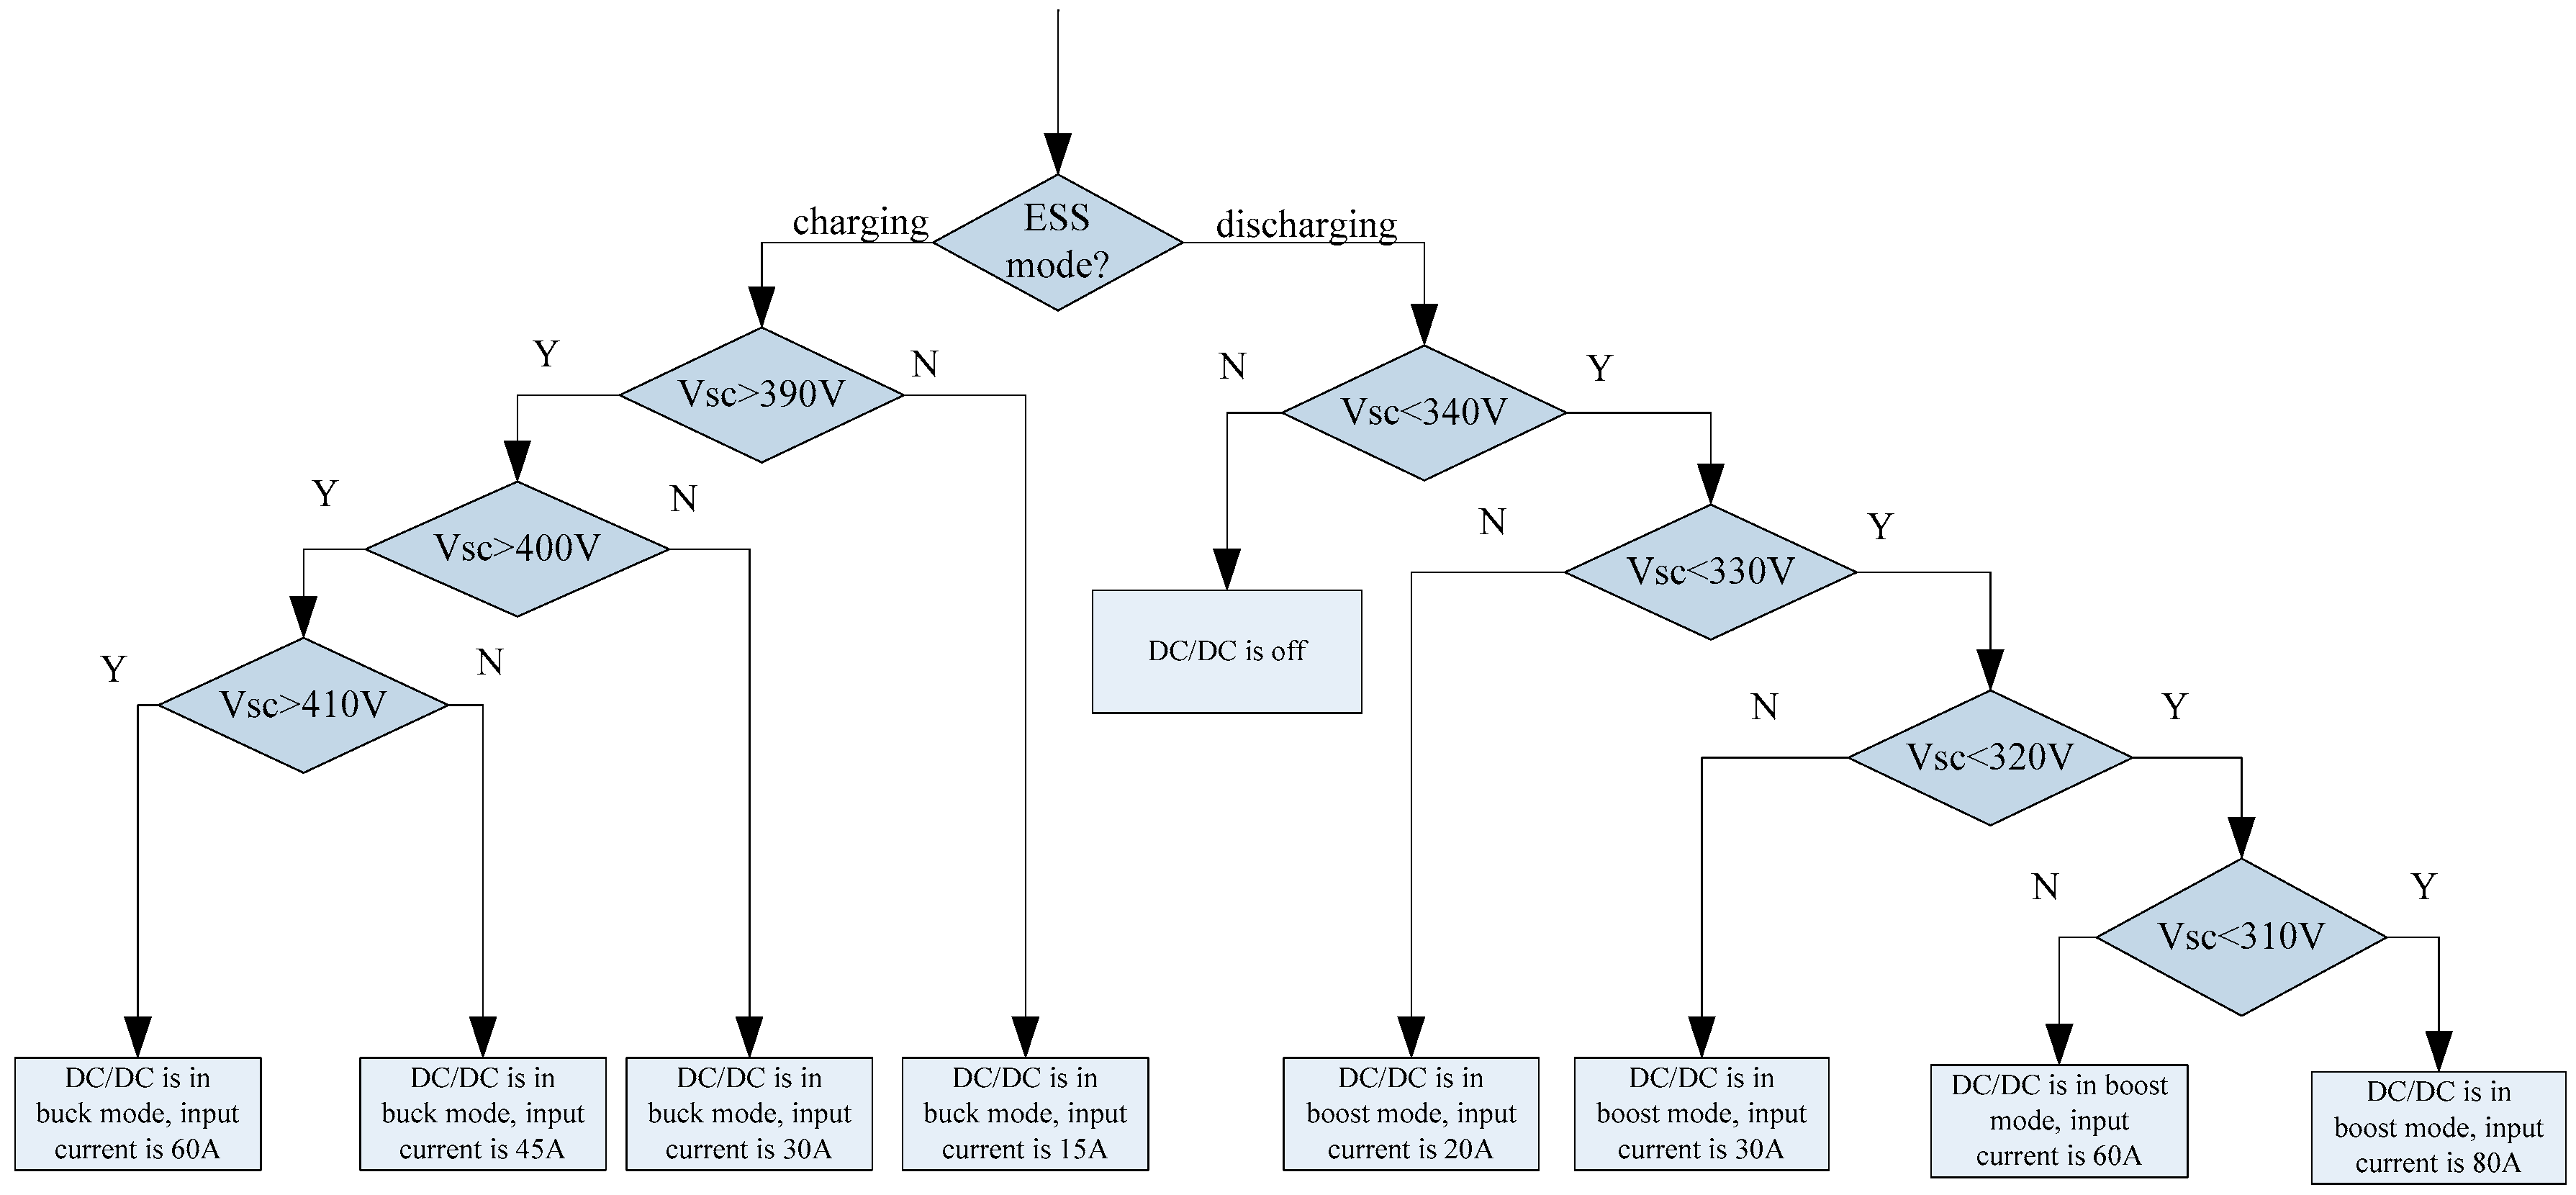
4.1. Reversible Boost DC/DC Converter

In order to control the voltage difference between the battery and SC, DC/DC converters are needed as the power electronic interfaces to control the power flow from the battery or SC to the DC bus. Analysis, design and comparison studies of several bi-directional non-isolated DC/DC converter topologies have shown that the half-bridge and its derived topologies, Cuk Sepic, and Luo, can be considered as potential candidate topologies for HESS in vehicular applications, with different stresses of the active and passive components due to high power and wide input/output voltage requirements.
The reversible boost DC/DC topology shown in Figure 15 is chosen in this paper, with the advantages of high efficiency and low cost, which could actively control the flow of energy and power between the low and high voltage side. When DC/DC is in boost mode, the current is flowing from the high voltage side to low voltage side, and the inductor H will control the output voltage by controlling the Voltage Up Control IGBT. At this time, the current flows from the low side to the high side. The diode D2 has been switched on and the output voltage of Vo = Vin/(1 − D); D is the duty cycle of Voltage Up Control IGBT; Vin means the input voltage of DC/DC. When DC/DC is in buck mode, the current is flowing from the high voltage side to low voltage side, and the inductor H will control the output voltage by controlling Voltage Down Control IGBT. The current flows from the high side to the low side. Then the diode D1 is in reversed state and Vo = Vin × D; D is the Voltage Down Control IGBT duty cycle. The DC/DC performance test results are shown in Table 6. They show that the efficiency is better than the test in [16].

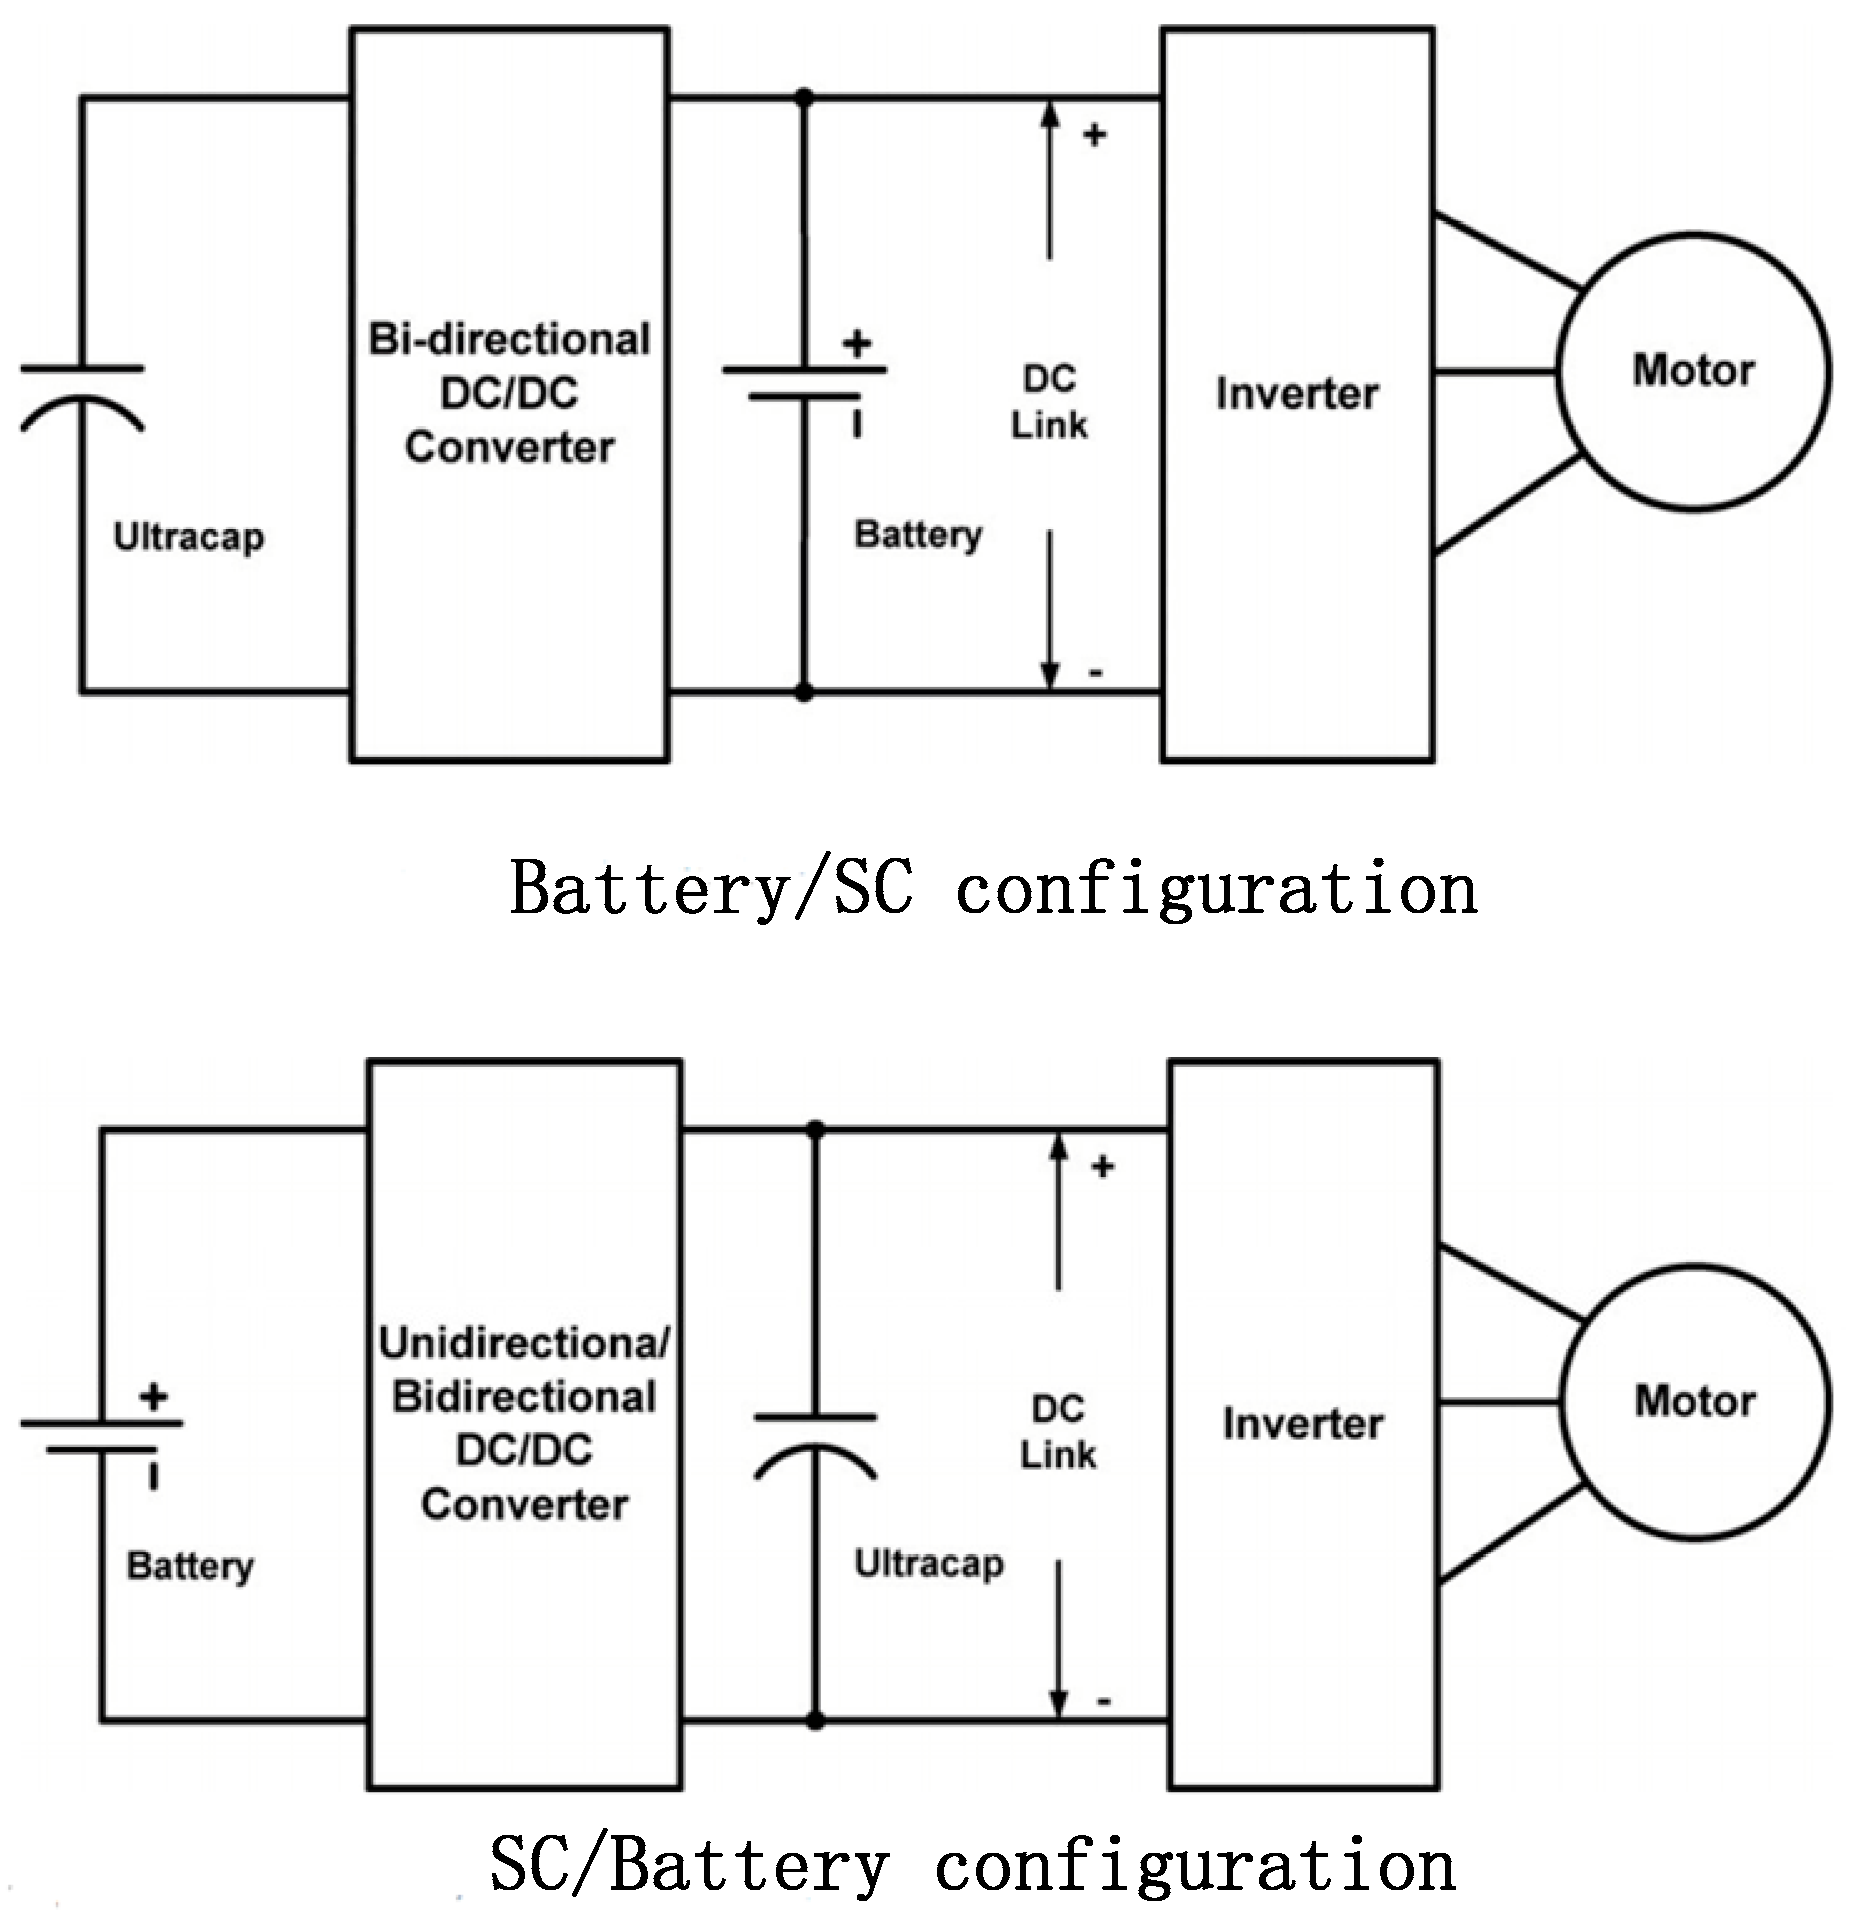
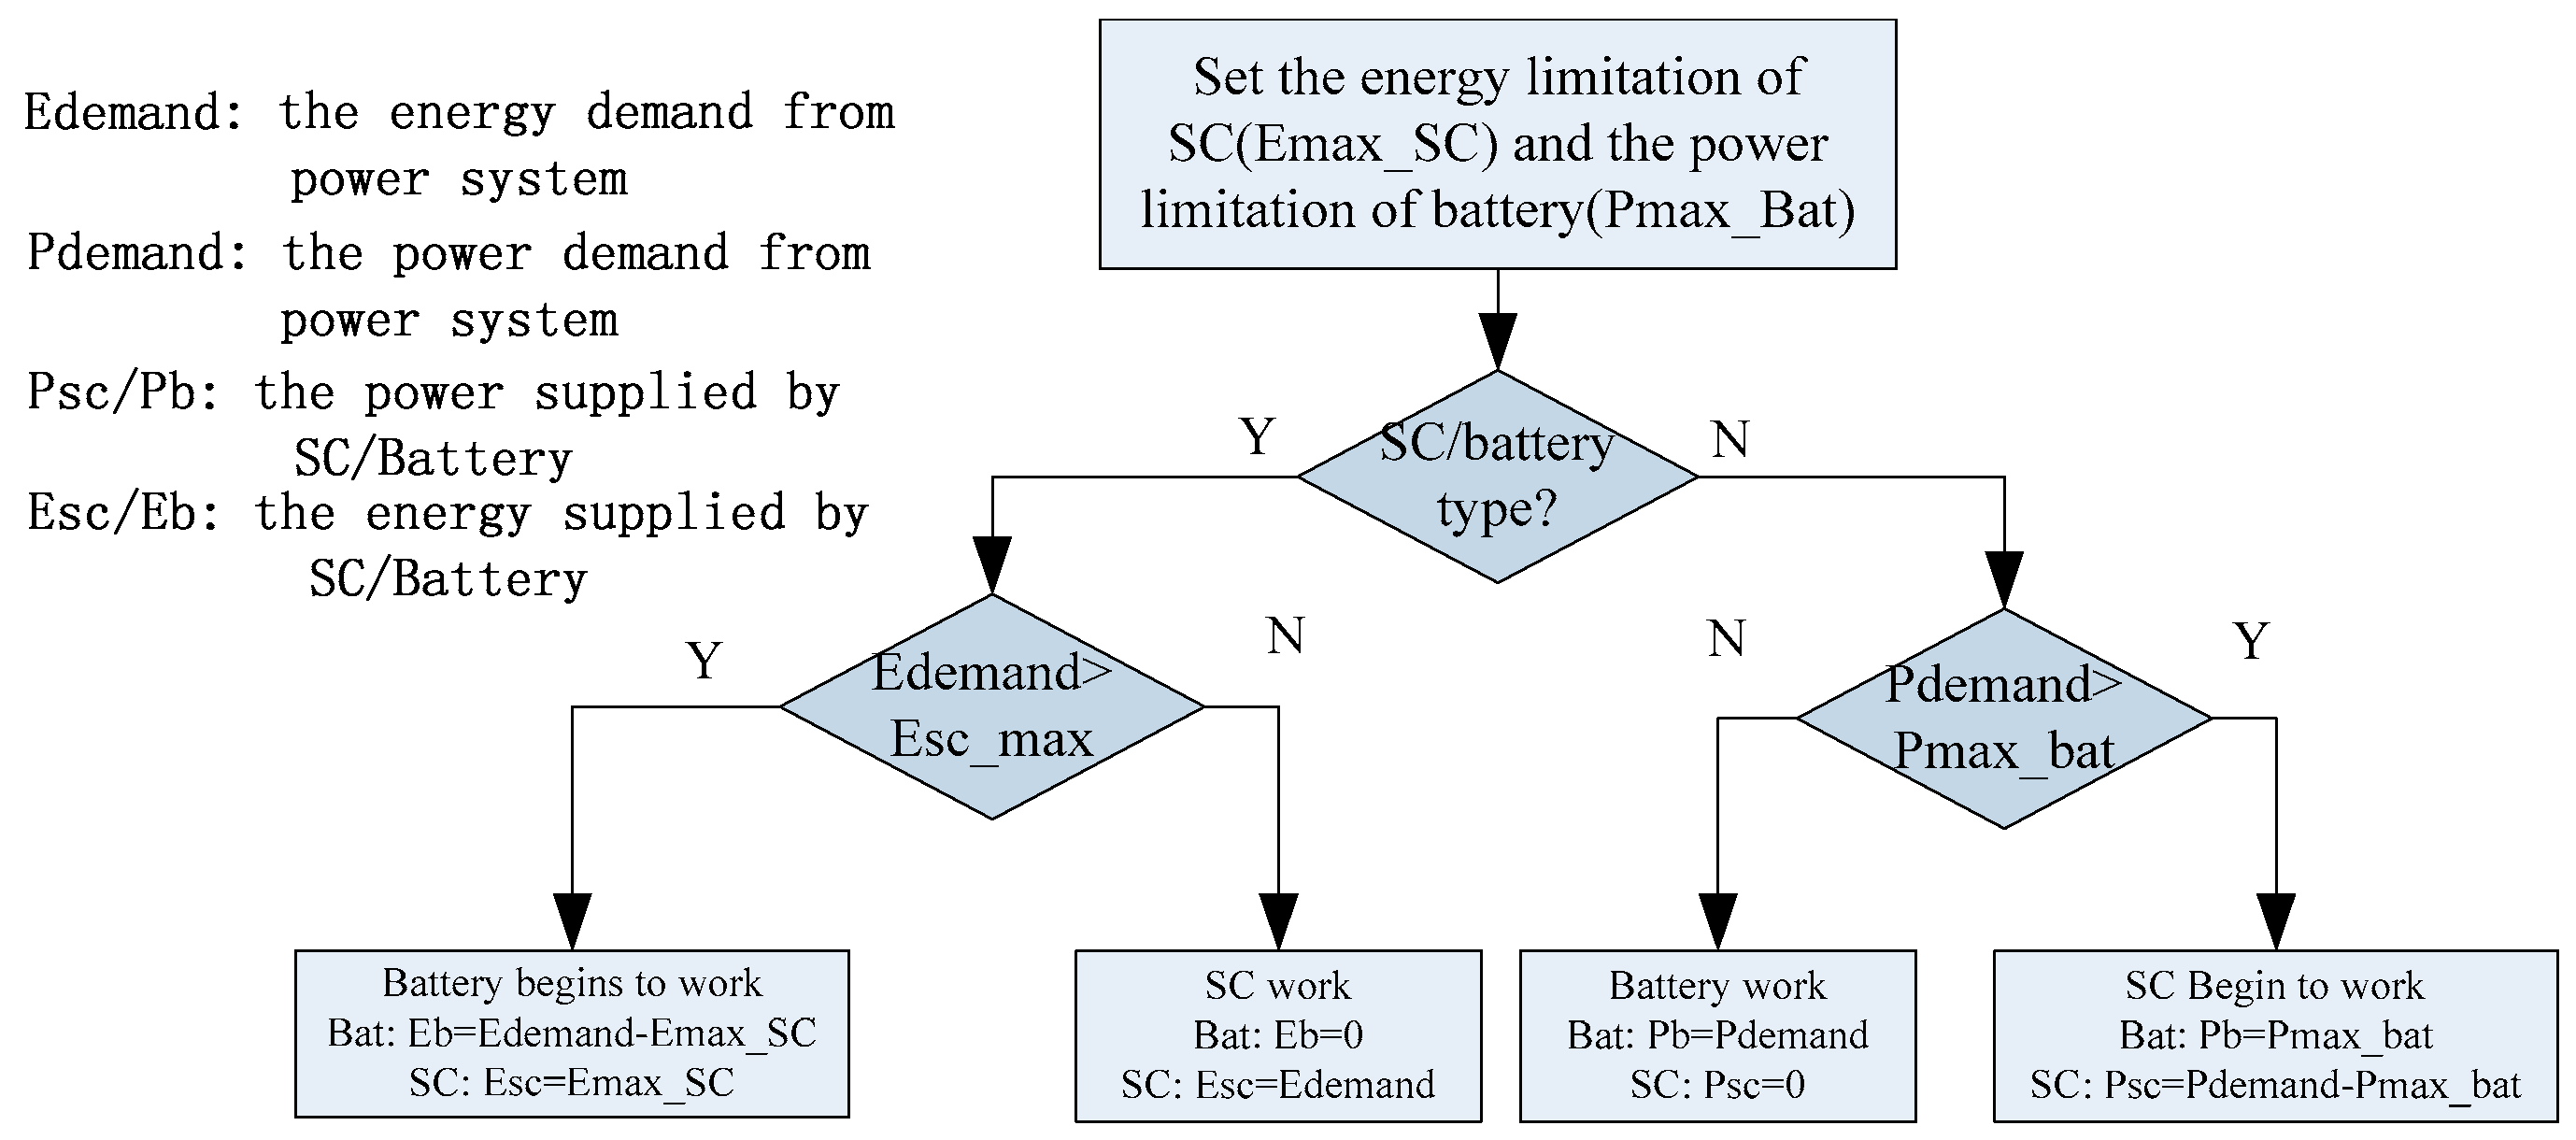
4.2. Configurations and Energy Manegement of Semi-Active Hybrid Energy Storage System

According to the position of the DC/DC converter, the semi-active HESS can be mainly divided into two configurations: battery/SC and SC/battery, as shown in Figure 16. The first HESS topology would connect DC/DC, which is integrated with SC, with battery/DC bus, and it is called battery/SC. The second semi-active HESS would connect DC/DC, which is integrated with battery, with SC/DC bus, and it is called SC/battery. The working principles have been shown in Figure 17 [17].
The basic principle of SC/battery is that SC is used as main energy source to provide the electric power for the drivetrain. Most of the energy demand can be satisfied by the SC individually. For the rest, the battery can provides the auxiliary energy for adjusting the SC voltage so that the SC voltage can be controlled in the range between the upper and lower boundary [13,18], as shown in Figure 17a.
The basic principle of battery/SC is that battery is used as the main energy source to provide the electric power for the drivetrain. Most of the power demand is provided by the battery, and the SC provides auxiliary power. When the power demand is beyond the available power provided by the battery in high power demand, SC begins to supply additional power, as shown in Figure 17b.
In HESS configuration based on battery/SC, the battery only needs to meet the average power requirement of the HEV during driving, whereas the SC is employed to make up for the fluctuation of the electric power demand [9]. The battery has a high energy density, but SC has a high power density. In order to maximize the efficiency of the HESS, it is necessary to develop different energy management strategies for battery/SC and SC/battery.
According to the ratio of mass/volume/cost, we can calculate the maximum power of the battery pack and the maximum energy of the SC pack, which are used to judge the operating modes of the HESS. When the configuration is battery/SC, the comparison of power demand and the maximum power of battery pack determines the working state of battery and SC. When the configuration is SC/battery, the comparison of the energy requirement and the maximum energy of the SC pack determines the working state of battery and SC.
The energy management of the HESS is shown in Figure 18. In the control strategy, firstly the energy limitation of the SC and the power limitation of battery are calculated; secondly, according the different HESS topologies, the power or the energy values are used to judge the energy or power allocation. In the battery/SC topology, the SC is the main power source, while the battery will supply the additional energy when the required energy is larger than the SC storage. For the SC/battery type, the battery is the main power source, the SC needs to supply the gap power between the power demand and the maximum battery discharging power.
Figure 19 shows the energy requirement statistics for different driving cycle sections, from which the conclusion can be drawn that the energy requirements of most cycle sections are small. Thus, the integration type that contains the DC/DC and battery can basically cover the trips, and the SC does not need to be configured too much.
In the battery/SC type, the SC is the main power source while the battery is the assisted power source. Equally, most of the energy is supplied by the SC. Figure 20 shows that the demanded power ranges from −40 to 40 kW. In order to allow the battery to drive the motor alone in most cases, it is mandatory to configure the battery size higher than 40 kW.

4.3. Comparison of Two Configurations

From the theoretical point of view, the layout of the DC/DC does not affect and change the performance of the battery pack and SC pack in HESS. Therefore, without regard to its energy loss caused by DC/DC size and the power conversion process, there is no difference between charge and discharge performance for the above two configurations using the battery and SC pack. However, due to the different control strategies, the output power and energy of the battery and the SC pack are very different under the same operating conditions. Therefore, the different configurations will affect the efficiency, lifespan and the power allocation between the battery and SC in the ESS. In this paper, 70 kW charge and discharge power are regarded as the standards and comparison results of the performance difference between the two configurations with cells are shown in Table 3. The parameters when the ESS is battery-only are as listed in Table 7.
Based on the distribution of power and energy shown in Figure 19 and Figure 20, the output power and energy of battery and SC in the two HESS configurations can be obtained, respectively. By using the data in Table 6, the average energy conversion efficiency of battery and SC at a certain time can be estimated, respectively. The output energy and efficiency of the two HESS configurations with different proportion of battery and SC are shown in Table 8, and in this case the mass/volume/cost values of HESS are the same as the battery-only topology.
The efficiency of DC/DC is taken as 97% and it is used in the efficiency calculation of DC/DC integrated with s battery or SC in Table 8 to calculate the total HESS efficiency. The efficiency of battery-only topology is presented when the proportion of SC is 0. The efficiency of the battery-only topology is 97.6%, which may be because the charge/discharge efficiency and braking energy recovery efficiency of battery is low, and the bus cannot fully recover the braking energy. In the SC/battery configuration, the energy provided by SC increases as the SC size rises. The energy provided by SC is larger, that is, SC is used more adequately, so the total efficiency has been improved. This is because that SC is the main energy source in SC/battery mode, so enhancing its capacity can quickly expand the energy value provided by the SC, as shown in Figure 20. Only in the case that the proportion of SC is small (the column of Vol ratio 25% in Table 8), the total efficiency of HESS (which is 97.31%) may be lower than that of battery-only topology. When the proportion of SC is high, the output energy provided by SC accounts for a large proportion of the total energy, and the efficiency of SC is much higher than that of battery so that the total efficiency of the HESS is close to the efficiency of the SC. Therefore, the potential or advantage of SC/battery is that when proportion of SC is large, the total efficiency of HESS can reach the efficiency of pure SC, and the energy provided by battery in unit volume, mass or cost can be greatly reduced.
When the battery/SC configuration is adopted, with increasing proportion of SC, the energy provided by SC increases, but the SC with large proportion will reduce the total efficiency of HESS. This is because that auxiliary energy source comprising of DC/DC and SC can reduce the peak power of the battery, but apparently it can’t reduce the average output power. When the SC accounts for a large proportion, it can’t effectively reduce the average power of the battery, but it occupies the original part of volume, mass or cost of battery and it will reduce the efficiency of the battery. The efficiency of energy provided by SC is limited by the efficiency of DC/DC. Therefore, the advantage of the battery/SC type is that a small SC can reduce the peak power of battery. But the total efficiency will not be improved and the energy provided by battery in unit volume, mass or cost will increase.
According to the analysis, the SC/battery configuration is more suitable for the target vehicle. We will compare the performance of SC/battery with battery-only topology with a vehicle bench experiment in the next section.

5. Real Vehicle Experiment and Performance Comparison Analysis

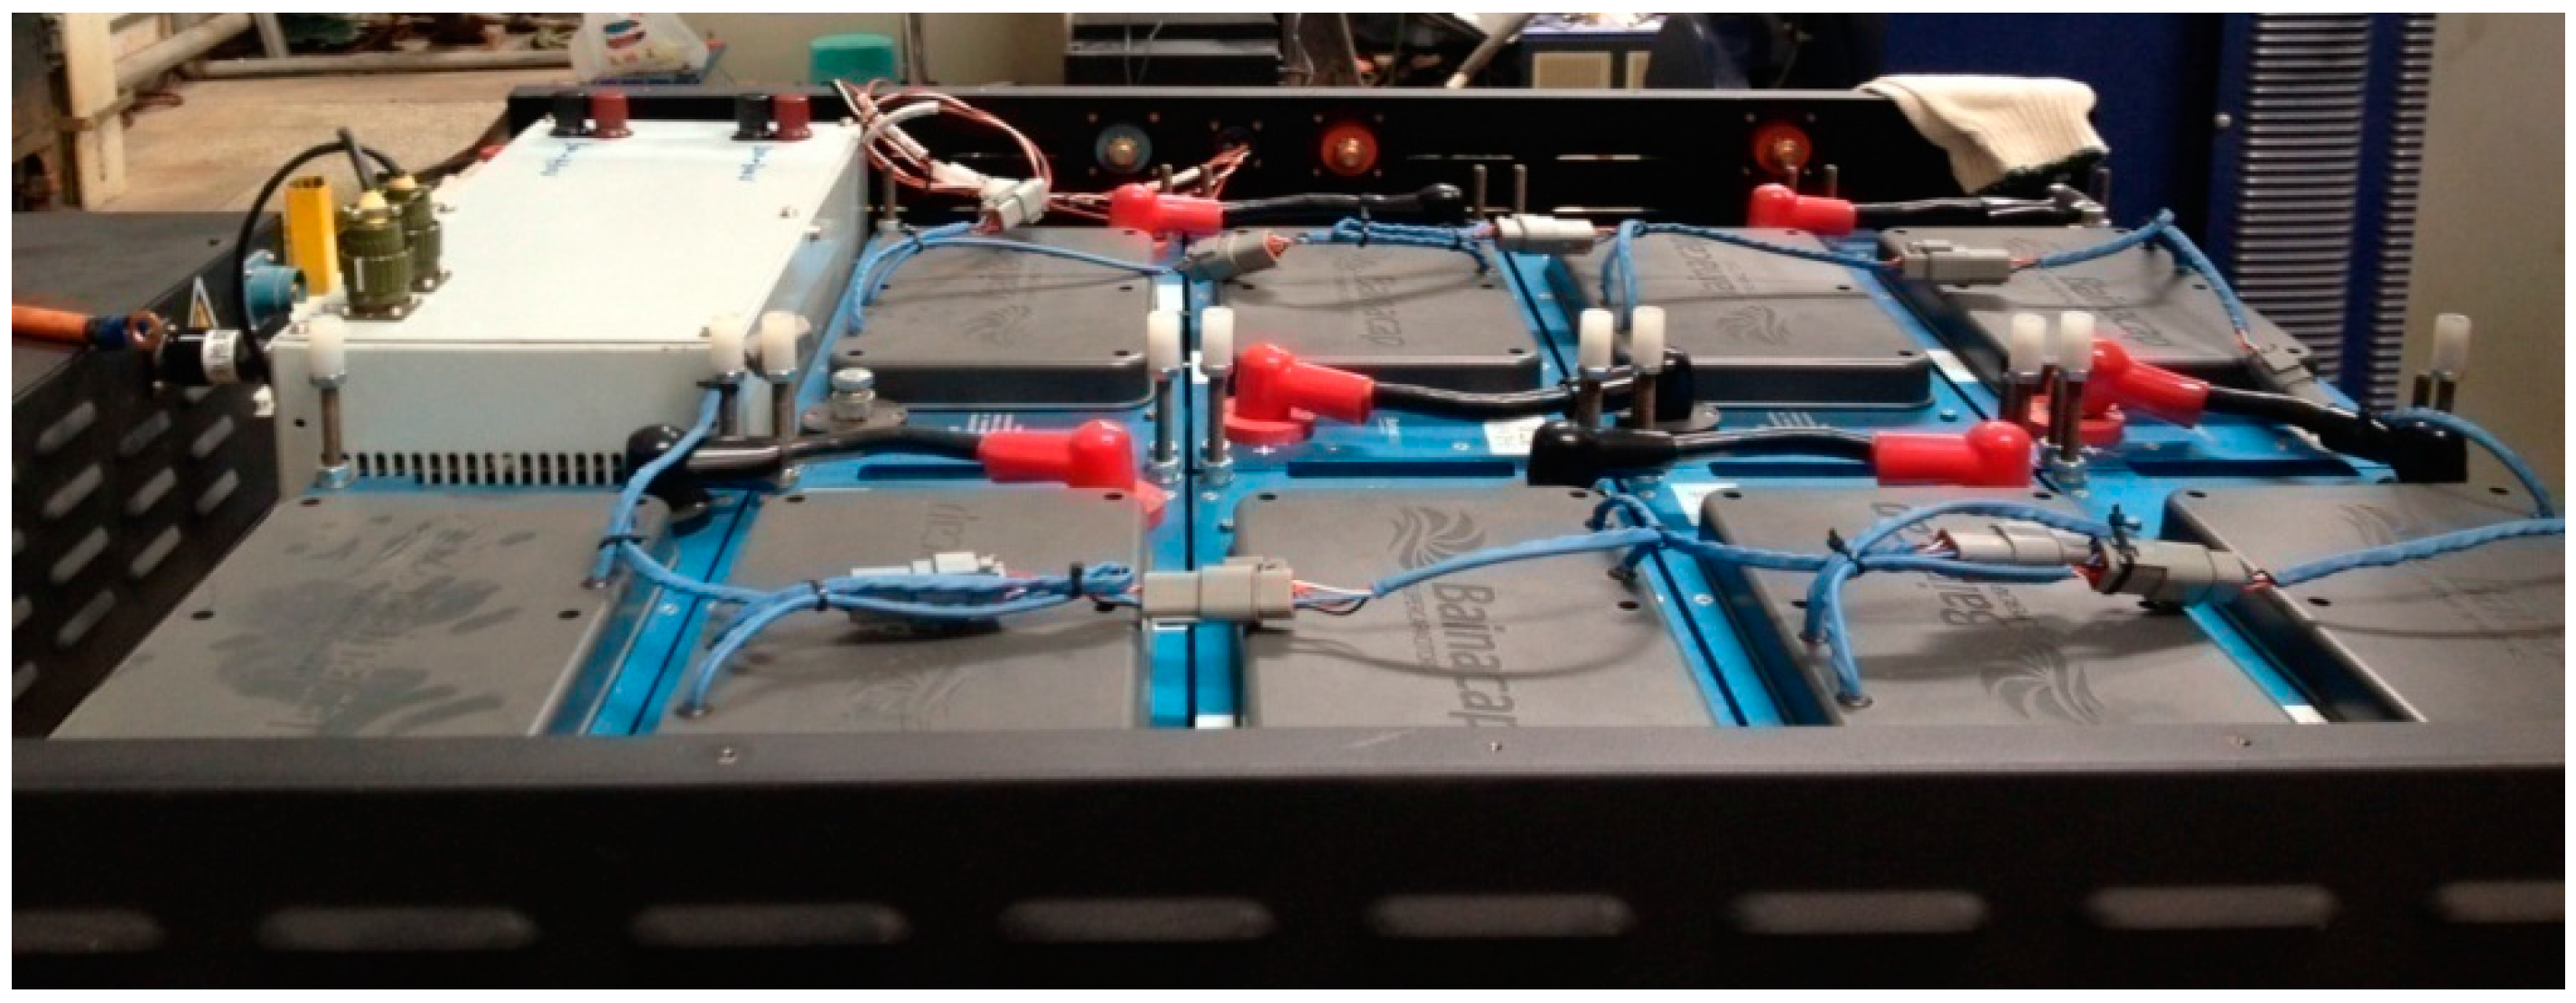
5.1. Prototype of Hybrid Energy Storage System for Real Public Transit Hybrid Electric Bus

For real PTHEB verification, a prototype of the SC/battery HESS is assembled based on the discussion results in Section 4.3. The arrangement of the SC package and DC-DC in the prototype is shown in Figure 21. The SC package is composed of nine SC modules of 48 V, 165 F, and linked to the DC-bus directly. 320 cells of 8 Ah Li-ion batteries are configured with the connection of 4-parallel and 80-series to achieve a 256 V/32 Ah battery package. A 25 kW maximum power DC/DC converter is adopted to control the charging/discharging of battery, whose performance has been obtained by experiments and is shown in Table 6. The DC/DC is placed in the shell of SC, so that the battery can be replaced conveniently of larger capacity ones to achieve more pure electric vehicle range. Specifications of the prototype are listed in Table 9. Compared to battery-only topology, the cost and mass of the SC/battery have obvious advantages under the condition of same volume.

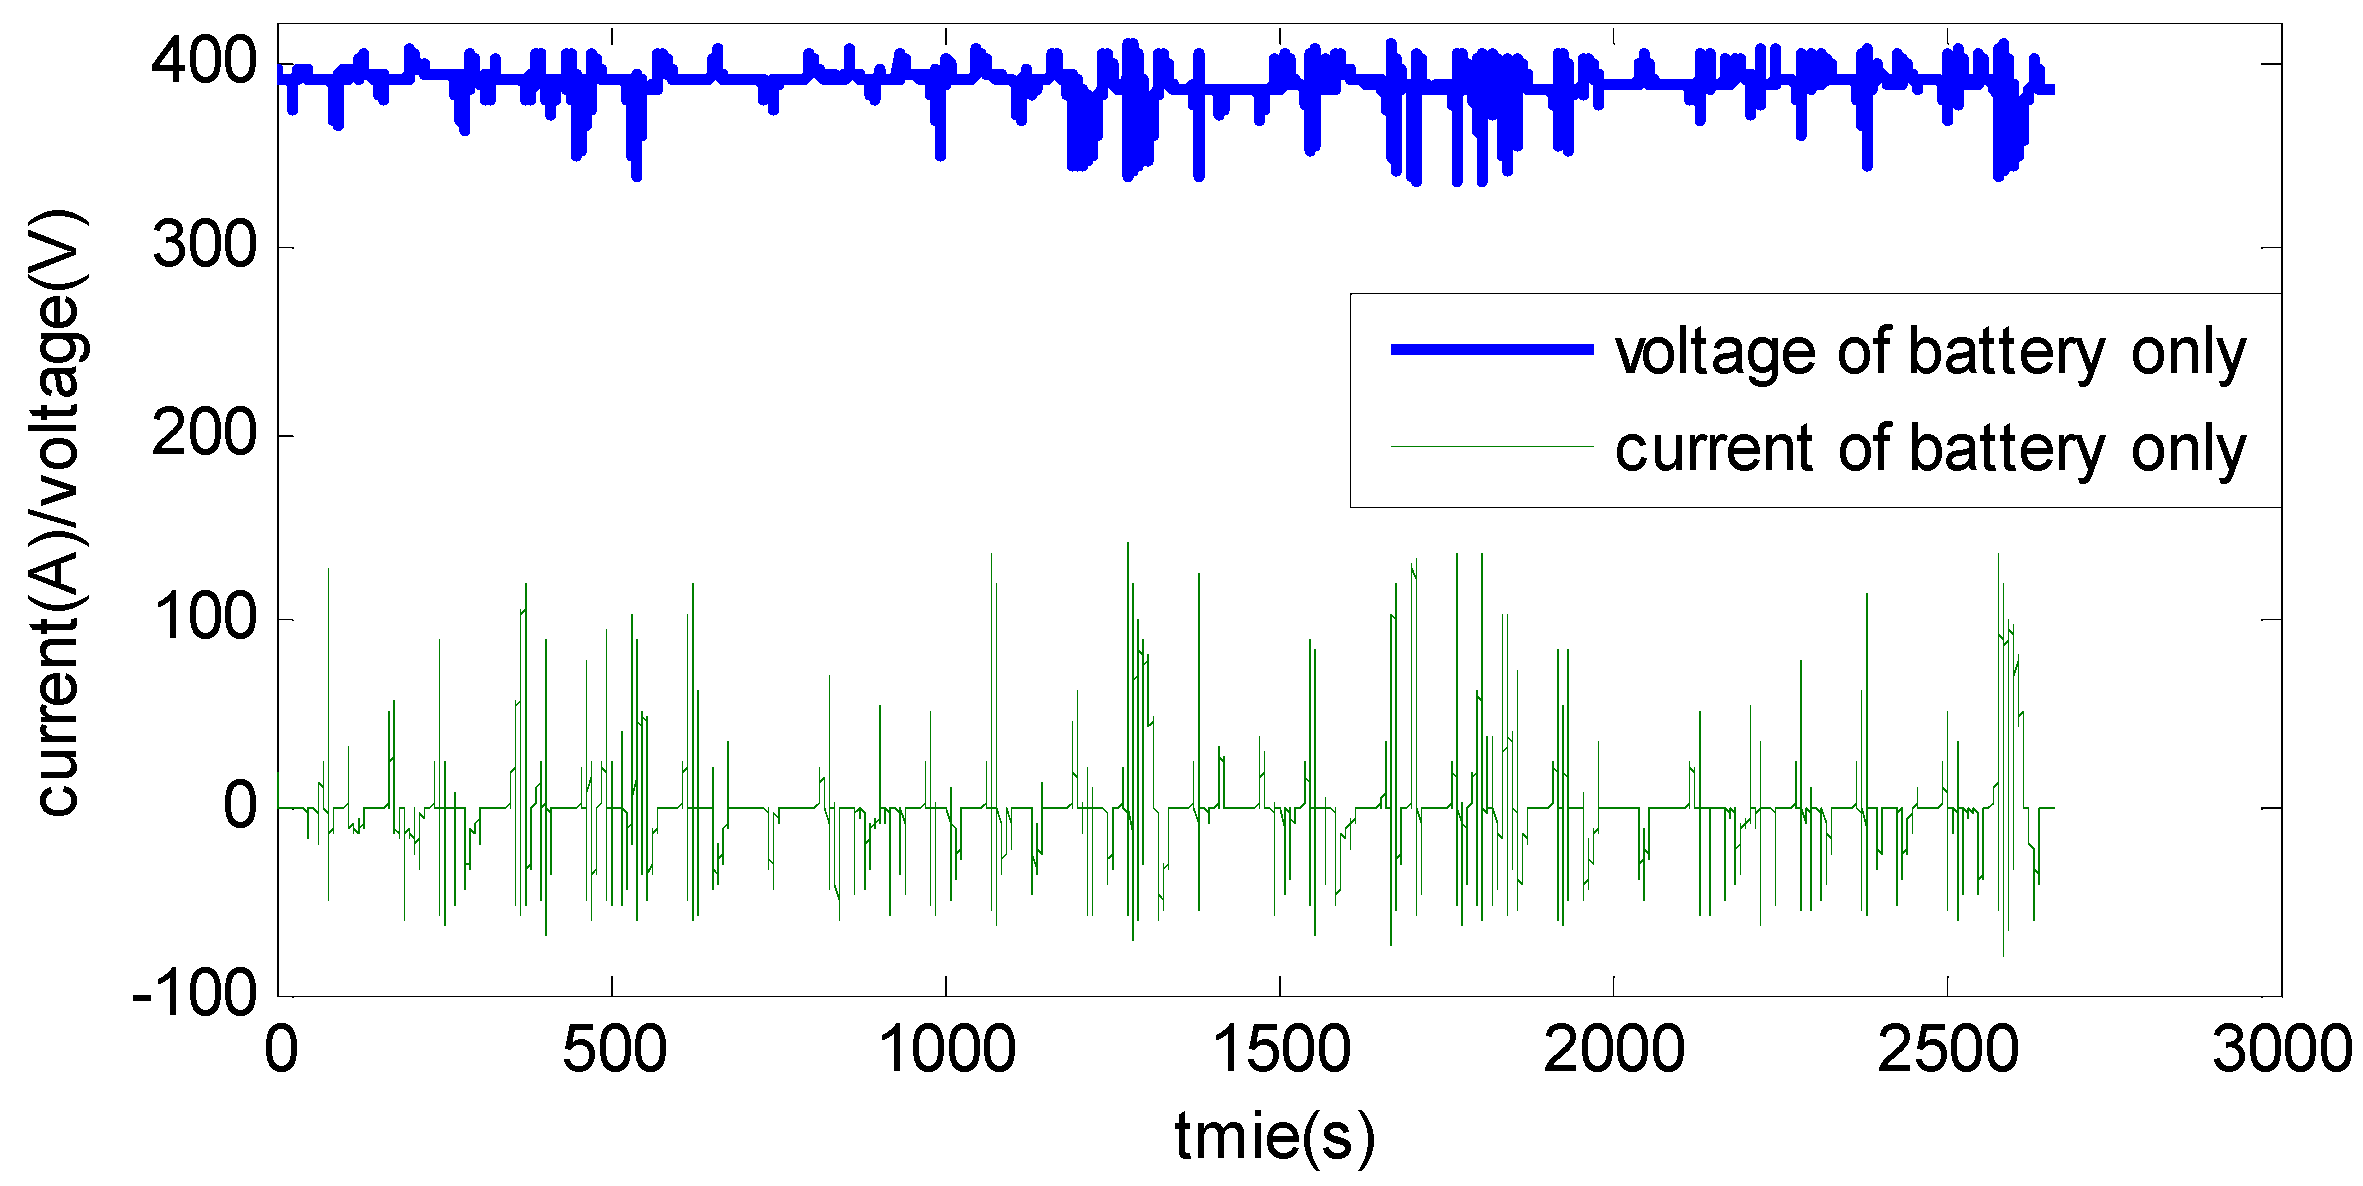
5.2. Experiments of Real Public Transit Hybrid Electric Bus

By taking PTHEB with battery-only topology (40 Ah, 336 V) as the benchmark for fuel economy comparison, the test bench of PTHEB with SC/battery HESS is run with the urban comprehensive driving cycles of China. The vehicle mass is 16.5 t, and single operating time is 1300 s, two cycles are run in advance to balance SOC. The total mileage is 23.2 km. A simple but practical CS of SC/battery HESS, running on Micro-autobox, is adopted for the real prototype, as shown in Figure 22. For this CS, the battery is used as an adjustable auxiliary power unit to control the SC package voltage within the range between upper and lower boundary (300–420 V). From the vehicle control point of view, the only difference with the PTHEB with battery-only topology is that the linear conversion of the SC voltage is used to replace the battery SOC. The initial voltage of SC package is 350 V, and the initial SOC of battery in HESS is 0.5.
The process curves of PTHEB with SC/battery HESS are recorded in Figure 23. From top to bottom, they are acceleration and brake pedal operations, actual speed of the PTHEB, SC package voltage, battery current and the control modes of DC-DC. The DC/DC control modes are expressed as 5-idle, 11-battery charging from DC-link, 13-battery discharging to DC-link, respectively.
As shown in Figure 23, when the voltage of SC is low, SC will be charged from battery through the DC/DC converter; when the voltage of SC is high, SC will charge the battery through the DC/DC, so that the SC and battery voltages are controlled within a reasonable range. In the test, HESS provides in total 3.35 kWh electric energy to or from the motors, while the battery provides 0.79 kWh as auxiliary energy source, which accounts for 24% of the total energy requirements. The SC provides 2.56 kWh as main energy source, which accounts for 76% of the total energy requirements. The validation proves that the topology where the SC works as main energy source, and the battery is used as auxiliary ESS is reasonable, and the feasibility of the parameter selection can also be confirmed.
Meanwhile, to prove the advantages of SC/battery HESS for a PTHEB, the absolute value of energy consumption and SOC of the HESS and battery-only topology during the charging/discharging process are also recorded and compared in Table 10, and the current/voltage curves of the battery in the battery-only PTHEB is shown in Figure 24. In the calculation, the battery SOC in HESS or battery-only topology are all based on the Amp-hour integral method. The battery SOC in HESS increases by 4% and the SOC of the battery in battery-only topology decreases by 1%. The energy consumption of the PTHEB with HESS is 14.44 kWh per 100 km, which is larger than the 10.34 kWh of battery-only PTEHB. The fuel economy can be obtained by transforming the electricity consumption into fuel consumption [15]; the converted results (from 23.2 km converted to 100 km) of the PTHEB have also been shown in Table 10. Near 7% fuel economy improvement can be obtained from PTHEB with SC/battery HESS compared with battery-only PTHEB. From the comparisons shown in Table 10. SC works as the main ESS most of the time with high efficiency, and a battery with small size could accord more with the HESS used on the PTHEB.
As shown in Figure 24, under high power demand and large resistance conditions, the fluctuation range of battery current and voltage can reach −82 A–125 A, and 330 V–420 V, respectively, in the battery-only PTHEB. When it comes to the results shown in Figure 23, although the fluctuation range of the DC-link voltage (namely the SC package voltage) is 300 V–380 V which is determined mainly by SC characteristics during charging/discharging, the frequency of fluctuation is smaller than that of battery-only PTHEB. The maximum current will also come down from 125 A to 80 A in battery-only topology and SC/battery respectively.
Overall, both the SC/battery and battery-only topology can meet the energy and power requirements of the PTHEB working according to the city cycle. In the experiment test, the SC can work normally and the voltage of SC can be controlled in a reasonable range. Furthermore, the SC/battery HESS successfully reduces the energy loss on DC/DC converter caused by the excessive charging/discharging of battery. Because of the greater degree of ESS cooperation, the fuel economy of the PTHEB could be improved effectively.

6. Conclusions

In this paper, two typical semi-active HESSs are put forward for their usage in hybrid electric vehicles. Besides the power and energy density, the ratio of mass to efficiency, volume to efficiency and cost to efficiency are presented as our analysis basis. The energy and power demand of ESS are obtained by analyzing the actual operating data of the target vehicle. Then the two configurations are matched and compared quantitatively when using same mass, volume and cost as inputs. The comparison results show that:
(1)
The SC/battery efficiency is higher than that of battery/SC when the parameters are the same;
(2)
In the SC/battery topology, the energy provided by the SC rises with improved total efficiency as the proportion of SC increases;
(3)
In the battery/SC topology, the total efficiency cannot be obviously improved with the proportion of SC increasing.
Based on the comparison results, the following results can be drawn: firstly, both configurations can be designed to meet the power demand designed properly; secondly, compared with battery as the main energy source, the SC/battery configuration can utilize the high-efficiency performance of the SC, and further improve the efficiency of a HES. The real vehicle experiment indicates that 7% of energy consumption can be saved by a SC/battery semi-active HESS compared to the battery-only topology. In summary, the SC/battery configuration is a better choice than the battery/SC for the target hybrid electric bus.

Acknowledgments

The authors gratefully acknowledge the financial support from the National Natural Science Foundation of China (No. 51107052).

Author Contributions

Changlu Lai and Haitao Min were responsible for total article structure design and writing; Yuanbin Yu contributed the literature review and the funding support; Tao Zhu contributed the analysis of battery and SC, and helped to rearrange the paper structure; Cong Zhang provided lots of comments in the process of revision.

Conflicts of Interest

The authors declare no conflict of interest.

References

  1. Somayajula, D.; Meintz, A.; Ferdowsi, M. Designing efficient hybrid electric vehicles. IEEE Veh. Technol. Mag. 2009, 4, 65–72. [Google Scholar] [CrossRef]
  2. Wang, D.; Coignard, J.; Zeng, T. Quantifying electric vehicle battery degradation from driving vs. vehicle-to-grid services. J. Power Sources 2016, 332, 193–203. [Google Scholar] [CrossRef]
  3. Kim, Y.; Koh, J.; Xie, Q.; Wang, Y.; Chang, N.; Pedram, M. A scalable and flexible hybrid energy storage system design and implementation. J. Power Sources 2014, 255, 410–422. [Google Scholar] [CrossRef]
  4. Ostadi, A.; Kazerani, M. A comparative analysis of optimal sizing of battery-only, ultracapacitor-only, and battery–ultracapacitor hybrid energy storage systems for a city bus. IEEE Trans. Veh. Technol. 2015, 64, 4449–4460. [Google Scholar] [CrossRef]
  5. Zhang, C.; Min, H.; Yu, Y.; Wang, D.; Luke, J.; Opila, D.; Saxena, S. Using CPE function to size capacitor storage for electric vehicles and quantifying battery degradation during different driving cycles. Energies 2016, 9, 903. [Google Scholar] [CrossRef]
  6. Cao, J.; Emadi, A. A new battery/ultracapacitor hybrid energy storage system for electric, hybrid, and plug-in hybrid electric vehicles. IEEE Trans. Power Electron. 2012, 27, 122–132. [Google Scholar]
  7. Jimenez-Espadafor, F.J.; Marín, J.J.R.; Villanueva, J.A.B.; García, M.T.; Trujillo, E.C.; Ojeda, F.J.F. Infantry mobility hybrid electric vehicle performance analysis and design. Appl. Energy 2011, 88, 2641–2652. [Google Scholar] [CrossRef]
  8. Song, Z.; Hofmann, H.; Li, J.; Han, X.; Ouyang, M. Optimization for a hybrid energy storage system in electric vehicles using dynamic programing approach. Appl. Energy 2015, 139, 151–162. [Google Scholar] [CrossRef]
  9. Hung, Y.-H.; Wu, C.-H. An integrated optimization approach for a hybrid energy system in electric vehicles. Appl. Energy 2012, 98, 479–490. [Google Scholar] [CrossRef]
  10. Song, Z.Y.; Li, J.Q.; Han, X.B.; Xu, L.F.; Lu, L.G.; Ouyang, M.G.; Hofmann, H. Multi-objective optimization of a semi-active battery/supercapacitor energy storage system for electric vehicles. Appl. Energy 2014, 135, 212–224. [Google Scholar] [CrossRef]
  11. Qu, X.D.; Wang, Q.N.; Yu, Y.B. Power demand analysis and performance estimation for active-combination energy storage system used in hybrid electric vehicles. IEEE Trans. Veh. Technol. 2014, 63, 3128–3136. [Google Scholar]
  12. Shen, J.Y.; Dusmez, S.; Khaligh, A. Optimization of sizing and battery cycle life in battery/ultracapacitor hybrid energy storage systems for electric vehicle applications. IEEE Trans. Ind. Inform. 2014, 10, 2112–2121. [Google Scholar] [CrossRef]
  13. Yu, Y.B.; Liu, X.G.; Min, H.T.; Sun, H.; Xu, L. A novel fuzzy-logic based control strategy for a semi-active battery/super-capacitor hybrid energy storage system in vehicular applications. J. Intell. Fuzzy Syst. 2015, 29, 2575–2584. [Google Scholar] [CrossRef]
  14. Zhang, C.; Min, H.; Yu, Y.; Wang, Q.; Sun, H. A new method to optimize semiactive hybrid energy storage system for hybrid electrical vehicle by using pe function. Math. Probl. Eng. 2015, 2015, 457303. [Google Scholar] [CrossRef]
  15. Liang, J.Y.; Zhang, J.L.; Zhang, X.; Yuan, S.F.; Yin, C.L. Energy management strategy for a parallel hybrid electric vehicle equipped with a battery/ultra-capacitor hybrid energy storage system. J. Zhejiang Univ. Sci. A 2013, 14, 535–553. [Google Scholar] [CrossRef]
  16. Miller, J.M.; Sartorelli, G. Battery and ultracapacitor combinations—Where should the converter go? In Proceedings of the IEEE Vehicle Power and Propulsion Conference (VPPC), Lille, France, 1–3 September 2010; pp. 1–7.
  17. Liu, S.; Corzine, K.A.; Ferdowsi, M. A new battery/ultracapacitor energy storage system design and its motor drive integration for hybrid electric vehicles. IEEE Trans. Veh. Technol. 2007, 56, 1516–1523. [Google Scholar] [CrossRef]
  18. Song, Z.; Hofmann, H.; Li, J.; Han, X.; Zhang, X. A comparison study of different semi-active hybrid energy storage system topologies for electric vehicles. J. Power Sources 2015, 274, 400–411. [Google Scholar] [CrossRef]
Figure 1. Configuration of the public transit hybrid electric bus (PTHEB).
Energies 10 00279 g001
Figure 2. BSFC of engine and its working region by rule-based charge sustaining (CS).
Energies 10 00279 g002
Figure 3. Engine torque for charge balance of energy storage system (ESS).
Energies 10 00279 g003
Figure 4. The distribution of demand energy value in discharge condition.
Energies 10 00279 g004
Figure 5. The distribution rate of demand energy value in discharge condition.
Energies 10 00279 g005
Figure 6. The distribution of demand energy value in charge condition.
Energies 10 00279 g006
Figure 7. The distribution rate of demand energy value in charge condition.
Energies 10 00279 g007
Figure 8. Energy demand of ESS.
Energies 10 00279 g008
Figure 9. Operating time distribution of ESS in different discharge power.
Energies 10 00279 g009
Figure 10. Output energy distribution of ESS in different discharge power.
Energies 10 00279 g010
Figure 11. Operating time distribution of ESS in different charge power.
Energies 10 00279 g011
Figure 12. Output energy distribution of ESS in different charge power.
Energies 10 00279 g012
Figure 13. Energy distribution under different charging/discharging power.
Energies 10 00279 g013
Figure 14. The Rint model of battery cell or SC cell.
Energies 10 00279 g014
Figure 15. Structure of reversible boost DC/DC. IGBT: insulated gate bipolar transistor.
Energies 10 00279 g015
Figure 16. Two configurations of semi-active HESS.
Energies 10 00279 g016
Figure 17. (a) Power allocation of SC/battery; and (b) power allocation of battery/SC.
Energies 10 00279 g017aEnergies 10 00279 g017b
Figure 18. Energy management of HESS.
Energies 10 00279 g018
Figure 19. Power distribution of the battery/SC HESS.
Energies 10 00279 g019
Figure 20. Power distribution of the SC/battery HESS.
Energies 10 00279 g020
Figure 21. The arrangement of the SC package and DC-DC in our prototype.
Energies 10 00279 g021
Figure 22. The CS of SC/battery HESS in real PTHEB.
Energies 10 00279 g022
Figure 23. The process curves of PTHEB with SC/battery HESS.
Energies 10 00279 g023
Figure 24. The battery current and voltage curves in battery-only PTHEB.
Energies 10 00279 g024
Table 1. Parameters of public transit hybrid electric bus (PTHEB). ISG: integrated starter/generator; and EM: electric motor.
ParameterValue
Total Mass18,000 kg
Frontal area7.3 m2
Wind resistance coefficient0.78
Rolling resistance coefficient0.01
Engine110 kW
ISG/EM20/100 kW
Table 2. Driving information statistics.
Statistic ItemMondayWednesdayFridaySaturdaySundaySum
Driving period (minutes)37424055444251504542447
Driving distance (km)9.610.59.710.59.710.59.710.59.710.5100.9
Discharging fragments59494781644953674956574
Charging fragments73666191756477746765713
Table 3. Battery and SC cell specifications.
ParameterLi-IonSC
Cell Capacity8 Ah1500 F
Internal resistance (mΩ)70.47
Voltage range (V)2.5–3.650–2.7
Weight (g)260320
Volume (L)0.180.33
Cost (RMB)88180
SOC or voltage range0.4–0.61.9–2.7
Available charging/discharging capacity (Wh)25.61.1
Charging/discharging power limits (w)64/1281850
Discharging/charging power mass ratio (w/kg)246/4925781
Energy mass ratio(Wh/kg)98.53.33
Discharging/charging power volume ratio (w/L)355/7105606
Energy volume ratio (Wh/L)142.23.33
Discharging/charging power cost ratio (w/RMB)0.73/14.610.28
Energy cost ratio (Wh/RMB)0.290.0061
RMB is Chinese currency, its unit is yuan.
Table 4. Parameter of efficiency density.
Efficiency Density ParameterDefinitionUnit
MassRatio of mass to efficiencyThe energy loss rate when 1 kg energy source output 1 wkg/W
VolumeRatio of volume to efficiencyThe energy loss rate when 1 L energy source output 1 wL/W
CostRatio of cost to efficiencyThe energy loss rate when 1000 RMB energy source output 1 w1000 RMB/W
Table 5. Efficiency density parameters of battery/SC cell.
ParametersBattery (8 Ah Cell)SC (1500 F Cell)
Ratio of mass to efficiency (%)0.02160.0028
Ratio of volume to efficiency (%)0.01700.0029
Ratio of cost to efficiency (%)0.00780.0016
Table 6. Characteristics of the reversible boost bridge DC/DC.
ParameterVoltageCurrent
High band300 V–400 V83 A
Low band150 V–300 V167 A
Peak power25 kW
Efficiency TestBuck ModeBoost Mode
Power in low band/W523610,54415,924771315,23422,581
Power in high band/W539210,82516,286747114,84921,947
Efficiency/%97.197.497.896.997.597.2
Table 7. The parameters of battery-only pack.
ParameterValue
Mass (kg)290
Volume (L)356
Cost (1000 RMB)10.8
Energy provided by battery-only13.09 kWh
Efficiency97.6%
Table 8. Comparison of two configurations by different ratios of mass/vol/cost.
Parameter of Two Kinds of HESSMass RatioVol RatioCost Ratio
Mass/Volume/Cost ratio of battery to HESS25%50%75%25%50%75%25%50%75%
Mass/Vol/Cost of battery217.514572.5267178898.15.42.7
Mass/Vol/Cost of SC72.5145217.5591782672.75.48.1
SC/battery (SC as main energy source)BatteryEnergy provided (kWh)2.390.440.104.361.570.583.320.940.27
efficiency (%)98.6597.9995.9798.8497.0494.0898.6998.0396.07
SCEnergy provided (kWh)10.8212.6412.998.7211.5612.519.7611.9612.81
efficiency (%)99.3899.6999.7998.0399.4299.6199.1099.5599.70
Total efficiency (%)98.7499.5399.7497.3198.7999.2498.2499.2399.56
battery/SC (battery as main energy source)BatteryEnergy provided (kWh)12.9611.672.8512.9611.672.8512.9611.672.85
efficiency (%)97.8596.9896.7196.8495.5695.1797.9097.0596.79
SCEnergy provided (kWh)0.131.4210.240.131.4210.240.131.4210.23
efficiency (%)99.7599.8999.8999.5399.8099.8099.6399.8499.84
Total efficiency (%)97.8496.9796.8596.8495.796.4597.8997.0396.83
The unit of Mass/Vol/Cost is kg/L/1000 RMB respectively.
Table 9. Specifications of the SC/battery HESS prototype.
ParametersSC PackageBattery PackageDC/DCTotal
Equivalent Capacity18.77 F32 Ah/-
Operating Voltage range (V)300–430200–300/-
Internal resistance (mΩ)37.55120.8/-
Available energy for charging/discharging (Wh)127.3806.1/-
Power limit for charging/discharging (kW)206/158.817.7/35.325-
Mass (kg)11610022238
Volume (L)143.517834.5356
Cost (1000 RMB)50364.9590.95
Table 10. The results of PTHEB with HESS/battery-only.
ESS of the PTHEBEnergy Usage (kWh/100 km)Fuel Economy (1/100 km)Improvement in Fuel Economy
BatterySC
SC/battery HESS3.4111.0329.4↑7%
Battery-only10.34/31.6benchmark

