Article

The Production of Engineered Biochars in a Vertical Auger Pyrolysis Reactor for Carbon Sequestration

1
Research and Development Institute for the Agri-Environment (IRDA), 2700 Einstein Street, Quebec City, QC G1P 3W8, Canada
2
Department of Bioresource Engineering, MacDonald Campus, McGill University, 2111 Lakeshore, Sainte-Anne-de-Bellevue, QC H9X 3V9, Canada
*
Author to whom correspondence should be addressed.
Energies 2017, 10(3), 288; https://doi.org/10.3390/en10030288
Submission received: 12 January 2017 / Accepted: 21 February 2017 / Published: 28 February 2017
(This article belongs to the Special Issue Biomass Chars: Elaboration, Characterization and Applications)

Abstract

:
Biomass pyrolysis and the valorization of co-products (biochar, bio-oil, syngas) could be a sustainable management solution for agricultural and forest residues. Depending on its properties, biochar amended to soil could improve fertility. Moreover, biochar is expected to mitigate climate change by reducing soil greenhouse gas emissions, if its C/N ratio is lower than 30, and sequestrating carbon if its O/Corg and H/Corg ratios are lower than 0.2 and 0.7, respectively. However, the yield and properties of biochar are influenced by biomass feedstock and pyrolysis operating parameters. The objective of this research study was to validate an approach based on the response surface methodology, to identify the optimal pyrolysis operating parameters (temperature, solid residence time, and carrier gas flowrate), in order to produce engineered biochars for carbon sequestration. The pyrolysis of forest residues, switchgrass, and the solid fraction of pig manure, was carried out in a vertical auger reactor following a Box-Behnken design, in order to develop response surface models. The optimal pyrolysis operating parameters were estimated to obtain biochar with the lowest H/Corg and O/Corg ratios. Validation pyrolysis experiments confirmed that the selected approach can be used to accurately predict the optimal operating parameters for producing biochar with the desired properties to sequester carbon.

1. Introduction

In 2014, the Intergovernmental Panel on Climate Change reported that “global emissions of greenhouse gas (GHG) have risen to unprecedented levels despite a growing number of policies to reduce climate change” [1]. GHG emissions need to be lowered by 40% to 70% compared to the 2010 values by mid-century, and to near-zero by the end of the century, if we are to limit the increase in global mean temperature to two degrees Celcius [1].
Pyrolysis, the thermochemical decomposition of biomass under oxygen-limiting conditions at temperatures between 300 and 700 °C, can be a sustainable management solution for agricultural and forest biomasses, and is proposed as a strategy to mitigate climate change. The resulting co-products of pyrolysis are: a liquid bio-oil, non-condensable gases, and a solid biochar. The yields and characteristics of the products depend on pyrolysis operating parameters and biomass feedstock properties. Non-condensable gases are generally used to heat the pyrolysis unit. Bio-oils have heating values of 40%–50% of that of hydrocarbon fuels [2], and could be used to replace fossil heating oil. Biochar can be used as a soil amendment to improve soil fertility and has been proposed as a tool for mitigating climate change [3], because of its potential for carbon (C) sequestration. When biomass is converted into biochar and is applied to soil, C can be stored for more than 1000 years [4,5]. In other words, biochar production is a way for C to be drawn from the atmosphere, and is a solution for reducing the global impact of farming [6]. Woolf et al. [7] reported that biochar and its storage in soil can contribute to a reduction of up to 12% of current anthropogenic CO2 emissions. Moreover, there is evidence that biochar amendment to soil can help reduce GHG emissions, and particularly N2O [8], a powerful GHG, with a global warming potential of 298 [9]. Specifically, agriculture is a major source of N2O, contributing approximately 70% of Canadian anthropogenic N2O emissions. Agricultural soils contribute to about 82% of these emissions [10]. Despite the many potential benefits of soil amendment with biochar, special attention must be paid to the negative side effects. For example, heavy metals (e.g., Cu, Zn, and Mo) could be found in biochar and accumulate in soil, leading to phytotoxicity problems.
The yield and characteristics of pyrolysis products are influenced by different factors, including biomass feedstock and pyrolysis operating parameters (solid residence time, vapor residence time, temperature, heating rate, and carrier gas flowrate). Thus, not all biochars are created equal and biochars should be designed with special characteristics for their use in environmental or agronomic settings [11,12]. Biochars with a low N content, and consequently a high C/N ratio (>30), could be more suitable for the mitigation of N2O emissions from soils [8,13]. Moreover, biochars produced at a higher pyrolysis temperature and with an O/Corg ratio < 0.2, H/Corg ratio < 0.4, and volatile matter below 80%, may have a high C sequestration potential [13]. In fact, a H/Corg ratio < 0.4 would indicate a BC+100 of 70% (i.e., at least 70% of the C in biochar is predicted to remain in soil for more than 100 years), as an H/Corg ratio in the range 0.4–0.7 would indicate a BC+100 of 50% [14].
It is also important to select the proper pyrolysis technology to obtain the desired yield and properties of the product. Among all the existing pyrolysis technologies, the auger reactor is one of the most attractive designs that has been developed [15]. It enjoys some popularity because of its simplicity of construction and operation [16]. In an auger reactor, biomass is continuously fed to a screw, where it is heated in oxygen-free conditions, and then the auger rotation moves the product along the auger axis to the end of the reactor. The gases and organic volatiles leave the reactor at the end of the reactor, and the biochar is collected at the bottom. Gas exits may also be performed along the auger reactor wall, in order to decrease the vapor residence time. The yield of bio-oil (condensed gases) in auger reactors is variable, depending on the operating parameters, but is typically in the range of 40 to 60 wt % of the feedstock, which is lower than what is normally achieved with fluidized-bed reactors. This is because the heat transfer in an auger reactor is lower. Therefore, small-diameter reactor tubes which have a limited distance between the inner reactor tube surface and the internal auger shaft, are needed. In order to increase the heat transfer, some auger reactors combine a small inert solid particulate heat carrier (usually sand or steel shot) with relatively small particles of biomass (1 to 5 mm). The residence time of the vapors is much longer in auger reactors than in fluidized beds, which increases the likelihood of secondary reactions and consequently increases the yield of char [16].
The hypothesis of this research project is that it is possible to produce a biochar with beneficial characteristics from an environmental perspective, when pyrolysis operating parameters are suitably selected in a vertical auger reactor. Thus, the main objective was to validate a response surface methodology approach used to identify the optimal pyrolysis operating parameters (temperature, solid residence time, and nitrogen flowrate), in order to produce engineered biochars with the ideal characteristics for C sequestration.

2. Materials and Methods

2.1. Description of the Response Surface Methodology Approach

2.1.1. Development of the Statistical Models

Response surface methodology (RSM) was selected as an approach to determine the optimal pyrolysis operating parameters, in order to produce engineered biochars that can be used to sequester carbon. RSM is a collection of statistical and mathematical techniques for developing, improving, and optimizing processes [17], and is used to illustrate the relationship between the response variables (dependent variables) and the process variables (independent variables). In this study, the selected independent variables were the pyrolysis temperature, solid residence time in the heater block, and N2 flowrate, which are three parameters known to influence the yields and characteristics of products in an auger pyrolysis reactor [18]. The biochar yield and three indicators of biochar potential for climate change mitigation (C/N, H/Corg, and O/Corg ratios), were the response variables studied. Biochars with the highest C/N ratio are expected to reduce soil GHG emissions, and those with the lowest H/Corg and O/Corg molar ratios are expected to have a high C sequestration potential [13].
The Box-Behnken design was selected for collecting data. For an experiment of three factors, this incomplete factorial design requires three evenly spaced levels for each factor, coded −1, 0, and +1 (Table 1). Two variables (−1 and +1 levels) are paired together in a 22 factorial, while the third factor remains fixed at the center (level 0). A total of 15 experiments run in a random order are necessary, including three repetitions of an experiment, with the three independent variables fixed at their central point.
The method of least squares from the RSREG procedure of SAS [19] was used to estimate the parameters of the quadratic response surface regression models (Equation (1)), fitted to the experimental data obtained from the Box-Behnken design:
Y = β 0 + β 1 T + β 2 R + β 3 N + β 4 T 2 + β 5 ( R × T ) + β 6 R 2 + β 7 ( N × T ) + β 8 ( N × R ) + β 9 N 2
where Y is the studied response variable (biochar yield, C/N, H/Corg, and O/Corg ratios); β 0, … β 9 are the regression coefficients to be estimated; and T, R, and N are the values of the independent variables (temperature, solid residence time, and N2 flowrate, respectively). The significance of each independent variable was determined by the analysis of variance (ANOVA). A lack of fit test was performed to check the adequacy of the model.

2.1.2. Determination of the Stationary Points

A canonical analysis [19] was used to determine the nature of the stationary point (or the point on the surface where the partial derivatives are equal to zero), which can be a point of maximum response, a point of minimum response, or a saddle point. In the case of a saddle point, a RIDGE statement [19] was used to indicate the direction in which further experimentation should be performed, to produce the fastest decrease or increase in the estimated response, starting at the stationary point.

2.1.3. Validation of the Statistical Models

In order to validate the quadratic response surface regression models, a biochar was produced with the pyrolysis operating parameters determined from the response surface analysis, for producing a biochar with the optimal properties to maximize C sequestration (i.e., the lowest O/Corg and H/Corg ratios). A second biochar with the opposite characteristics (highest O/Corg and H/Corg ratios) was produced from each biomass. Predicted values from the response surface models vs. the actual values of the O/Corg, H/Corg, C/N ratios and yield, were compared using linear regression.

2.2. Pyrolysis Experimental Setup and Procedure

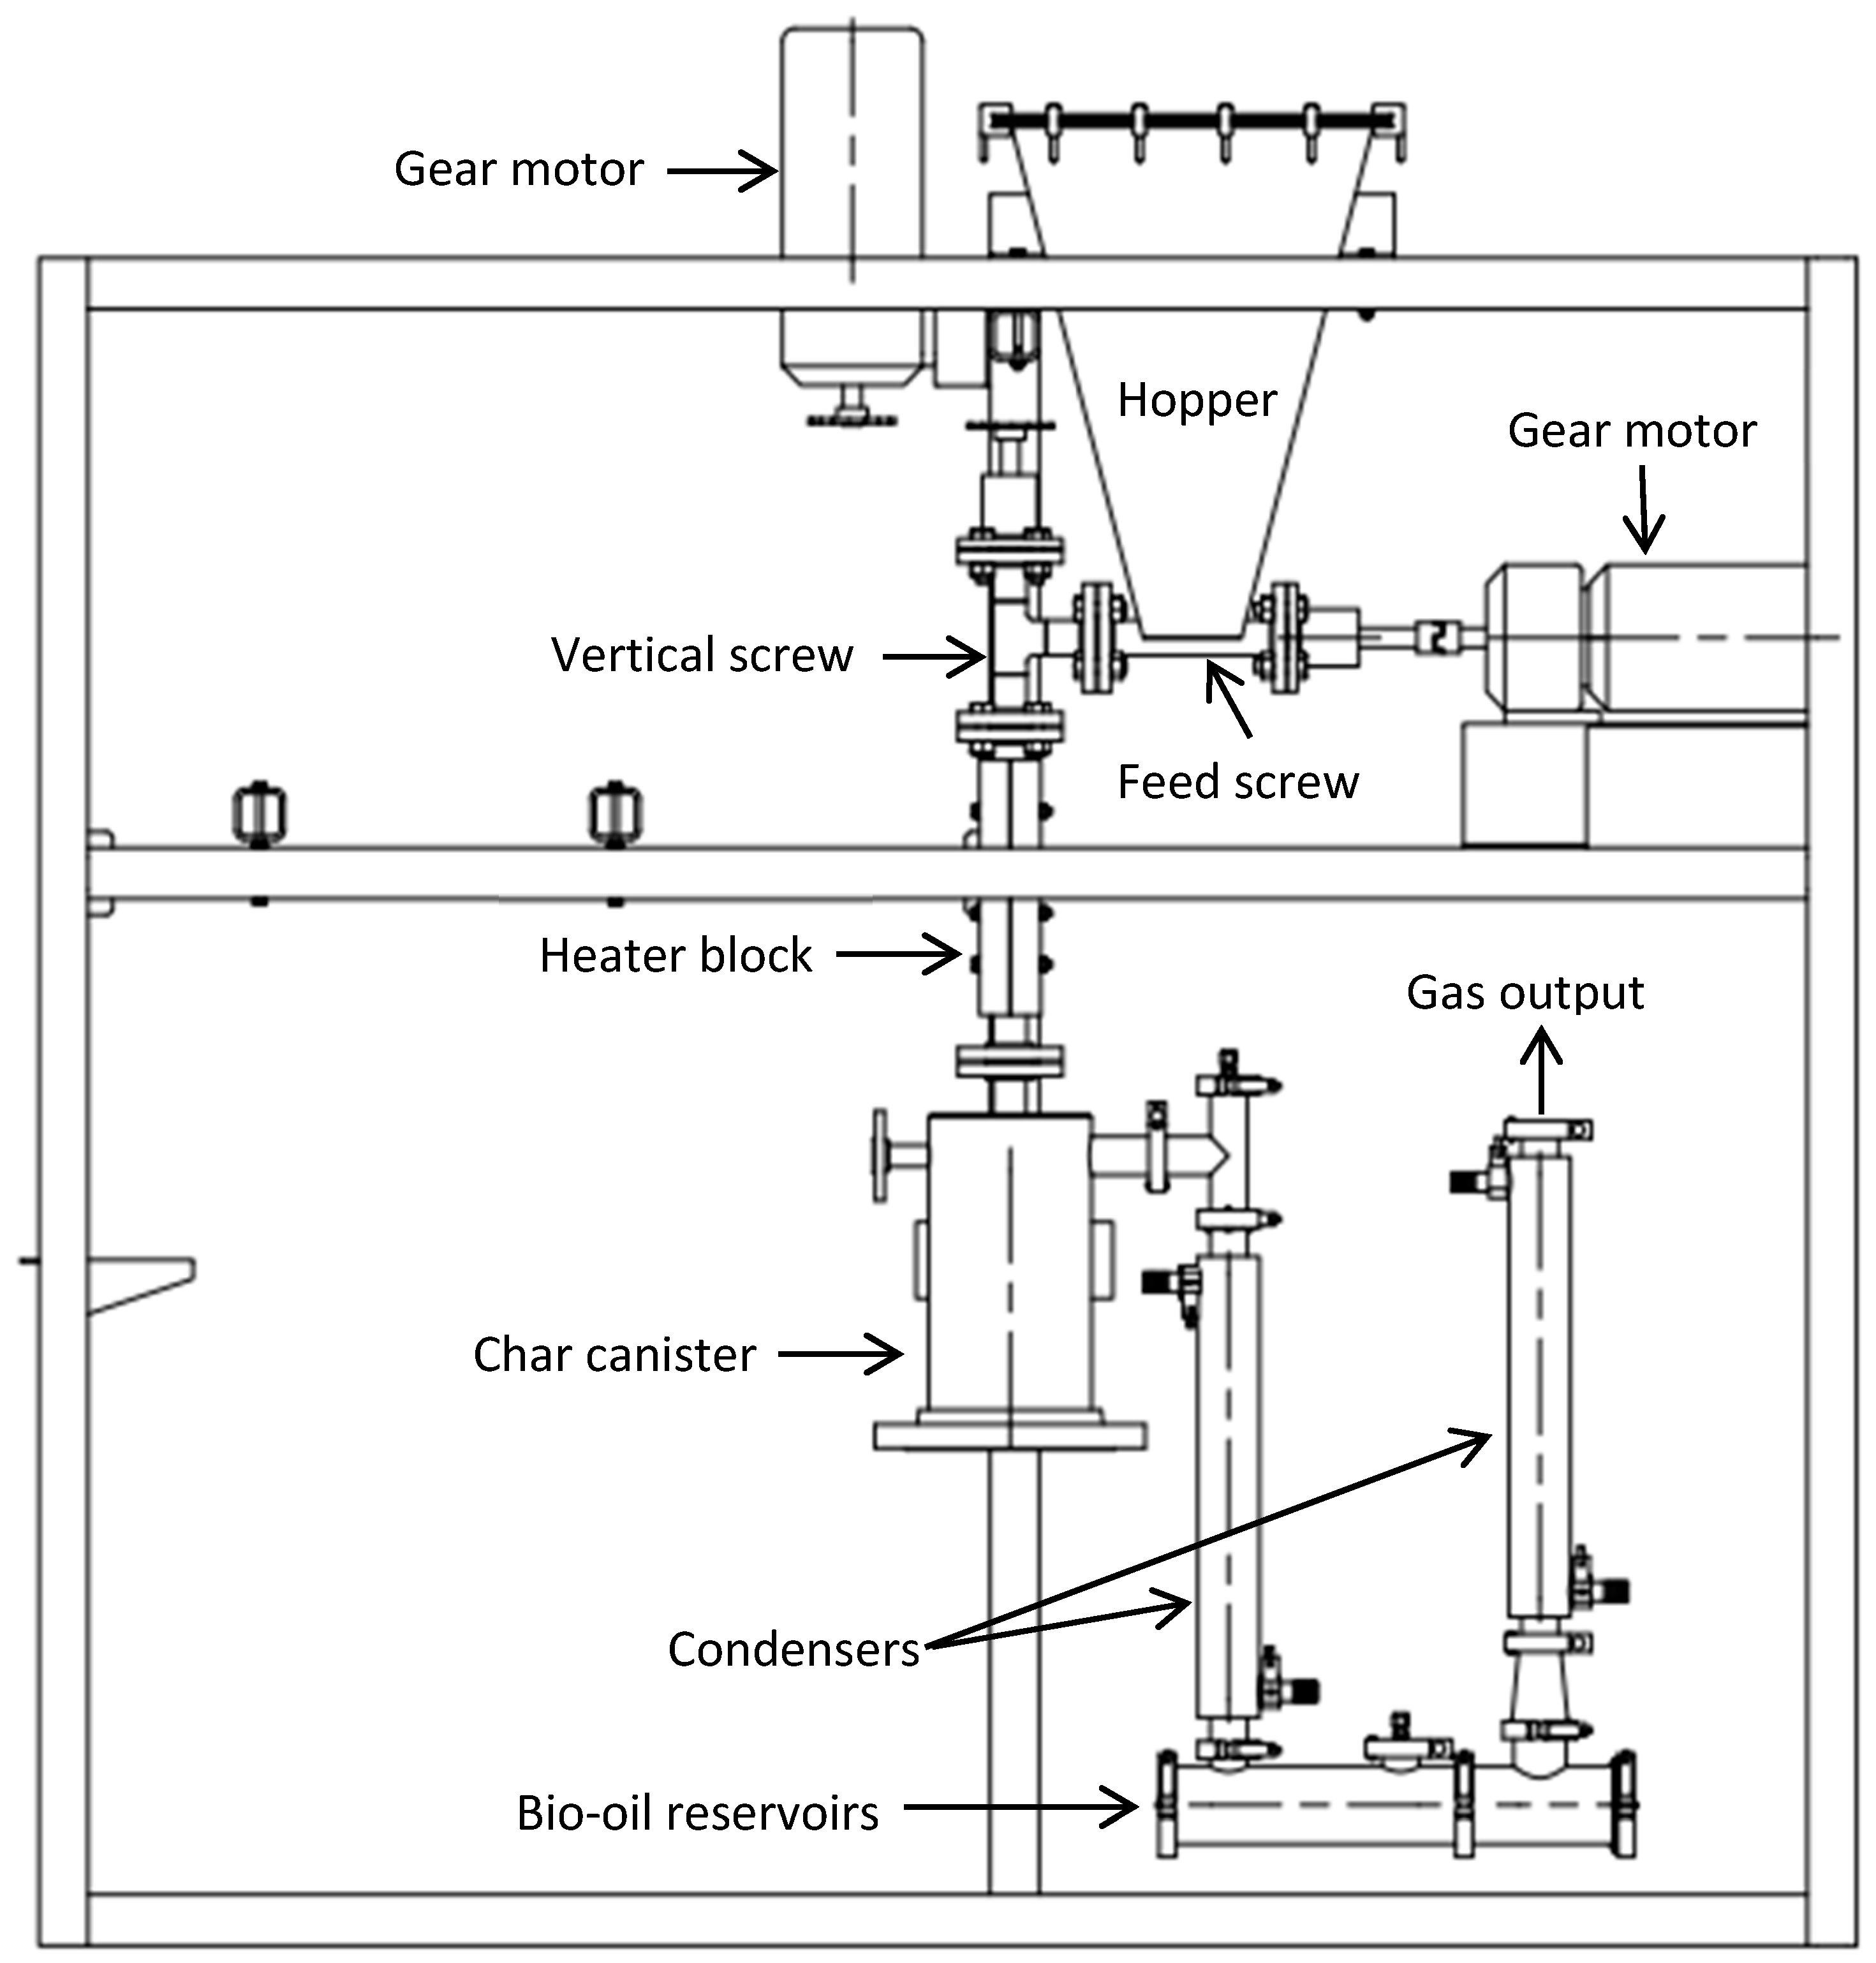
2.2.1. Description of the Vertical Auger Pyrolysis Reactor

In order to validate the selected approach, pyrolysis tests were carried out in a vertical auger pyrolysis reactor (Patent CA 2830968), developed by the Institut de recherche et de développement en agroenvironnement (IRDA) in collaboration with the Centre de recherche industriel du Québec (CRIQ). The pyrolysis unit (Figure 1) was installed at the IRDA research facility (Deschambault, QC, Canada). It included a hopper, a horizontal feed screw, a vertical screw passing through a 25.4 cm long heater block, a canister for the biochar recovery, and a condensation system. The feedstock in the hopper was fed to the heater block by a horizontal and vertical feed screw in a 2.54 cm diameter steel tube. The rotation speed of the two screws was controlled separately by gear motors, thus controlling the biomass flow rate. An agitator was installed and fixed at the hopper lid in order to facilitate and ensure the supply to the horizontal screw when using materials with a low density. Then, the feedstock was transported through the 25.4 cm long reactor within the vertical screw. The feedstock residence time in the reactor was set by controlling the rotation speed of the vertical screw, and was calculated in relation to the pitch of the screw (3.8 cm). Thermal power was supplied by two heating elements of 1500 Watts, inserted in a copper block surrounding the tube in the reaction zone. A thermocouple inserted in the middle of the cooper block registered the outside tube temperature and was used as the set point to control the heating elements. Temperatures were acquired every 10 s by a data logger (CR10X, Campbell Scientific, Edmonton, AB, Canada). At the exit of the vertical screw, the solid product of the pyrolysis (char) dropped into the canister (31.4 cm high and 16.8 cm diameter). A pot (15.2 cm high) was placed into the canister in order to recover the accumulated char. A flange at the bottom of the canister gave access to the pot. Moreover, the fine particles were separated from the gas by an inner baffle (10.2 cm diameter and 10.5 cm long) placed at the exit of the vertical screw. The gas was evacuated by an opening in the upper part of the canister and was directed to the condensation system. Every flange was tightened with a high temperature graphite gasket (1034 kPa) in order to prevent the entry of oxygen into the system. The air flowing into the system was purged with nitrogen, which was injected from the hopper’s lid at volumetric flowrates ranging from 1 to 5 L·min−1, controlled by a flowmeter (Aalborg Instruments, New York, NY, USA; accuracy ±2%). While the nitrogen flow ensured that the pyrolysis reaction occurred in a non-oxygen environment, it also helped to evacuate the pyrolysis gas.

2.2.2. Biomass Selection and Analysis

The type of feedstock utilized for pyrolysis (e.g., woody biomass, crop residues, grasses, and manures) influences the yield and characteristics of the biochar, including the concentrations of elemental constituents, density, porosity, and hardness [20]. Moreover, the yield of the biochar from biomass can be influenced by its lignin, holocellulose, and extractives contents [21]. Three biomasses with different physico-chemical properties were selected for the pyrolysis experiments: wood pellets made from a mixture of Black Spruce (Picea mariana) and Jack Pine (Pinus banksiana), the solid fraction of pig manure (SFPM), and switchgrass (Panicum Virgatum L.). In Canada, forest biomass residues such as logging residues are present in large quantities. Moreover, forest biomass is the most common feedstock used for pyrolysis. Woody biomass has a high C content and low N content, which can lead to a biochar with a high C/N ratio. Switchgrass, a perennial grass, shows great characteristics for bioenergy production, because of its medium to high productivity (8 to 12 t DM·ha−1·yr−1), its sustainability, its great ability to use water and nutrients, its adaptation to the climate of Eastern Canada, and its relatively high gross calorific value (GCV), of between 18.2 to 19.1 MJ·kg−1 [22]. SFPM was selected because pyrolysis could be a sustainable management solution for the surplus of pig manure in some regions, where phosphorus (P) spreading in fields is restricted by regulations. Pyrolysis of the solid fraction of pig manure concentrates P in biochar [23], which facilitates its exportation outside of the region in surplus.
All biomasses were ground and sieved to a particle size between 1.0 and 3.8 mm, prior to pyrolysis. The chemical properties of biomasses (proximate and ultimate analysis) were analysed at the IRDA laboratory (Quebec City, QC, Canada). The C, H, N, and ash content of the biomass were evaluated by dry combustion (Leco TruSpec, St. Joseph, MI, USA). The O content was calculated by subtracting the C, H, N, and ash contents from 100 wt %. Chlorine (Cl) extraction with water and dosage by titration with silver nitrate (AgNO3) was used to determine the Cl content. Cellulose, hemicellulose, and lignin contents were analysed according to the AFNOR method [24].

2.2.3. Pyrolysis Experiments

Preliminary pyrolysis tests and a review of the literature were carried out in order to identify the range of pyrolysis operating parameters needed to obtain typical biochar yields in the pyrolysis auger reactor, ranging from 15% to 45%. For the three selected biomasses, the range of the N2 flowrate selected was between 1 and 5 L·min−1, and the range for the solid residence time was between 60 and 120 s. The range of the pyrolysis temperature found for wood and SFPM was between 500 and 650 °C, and between 450 and 600 °C for switchgrass. For the selected solid residence times, the biomass flowrate in the pyrolysis reactor depended on the biomass properties, and varied from 0.61 to 1.08 kg·h−1 for wood, from 0.42 to 0.8 kg·h−1 for SFPM, and was fixed at 0.57 kg·h−1 for switchgrass.
The Box-Behnken design was carried out for each biomass with the defined range of pyrolysis operating conditions (Table 1), for a total of 45 experiments (Table A1, Table A2 and Table A3).

2.2.4. Products Yield and Biochar Characteristics

Bio-oil (Equation (2)) and biochar (Equation (3)) yields were calculated on a wet biomass basis, the non-condensable gas (Equation (4)) yield was calculated by the difference, and the liquid organic yield (Equation (5)) was calculated by subtracting the water content from the bio-oil yield:
Y i e l d b i o o i l ( wt   % ) = m B 1 + m B 2 m f × 100
Y i e l d b i o c h a r ( wt   % ) = m B i o c h a r m f × 100
Y i e l d g a s ( wt   % ) = m f m B i o c h a r m B 1 m B 2 m f × 100
Y i e l d l i q u i d   o r g a n i c s ( wt   % ) = 100 w a t e r   c o n t e n t 100 × y i e l d   b i o o i l
where mB1 is the mass of bio-oil produced in the first condenser (g), mB2 is the mass of bio-oil produced in the second condenser (g), mbiochar is the mass of biochar collected in the canister (g), mf is the mass of feedstock pyrolysed (g), and the water content is the water content of bio-oil (wt %) measured following the Karl-Fischer titration method [25].
Biochar samples were analysed for moisture, volatile matter, and ash contents, based on the ASTM D1762-84 standard [26]. The organic carbon (Corg), total carbon (Ctot), hydrogen (H), nitrogen (N), and oxygen (O) were also analysed, using the same method as that employed for the analysis of biomasses.

3. Results and Discussion

3.1. Analysis of Biomass

The physicochemical properties of wood, SFPM, and switchgrass, are presented in Table 2. An ultimate analysis (C, H, N, O) shows large variations between the biomasses. The C content of wood is the highest, at 47.7%, and is the lowest for SFPM (40.0%). This is inversely proportional to the ash content, which is highest for the SFPM (11.5%), and lowest for wood (0.57%). SFPM has high N and Cl contents (2.96% and 3609 mg·kg−1, respectively) when compared to wood and switchgrass. The O content is low for SFPM (28.2%), when compared to wood (40.0%) and switchgrass (42.5%). The H content ranges from 3.23% (switchgrass) to 6.39% (wood). The water content of SFPM (13.0%) is higher than switchgrass (7.2%) and wood (6.5%).
Based on an analysis of the lignocellulosic components, wood could necessitate a higher temperature to decompose because its lignin content (24%) is higher than that of SFPM and switchgrass (12.9% and 11.2%, respectively). In fact, the proportion of cellulose, hemicellulose, and lignin in biomass, will influence the degree to which the physical structure is modified during processing [27]. Hemicellulose and cellulose, which are more volatile during thermal degradation [28], are degraded at 200–300 and 300–400 °C, respectively, and lignin is degraded between 200 and 700 °C, representing a wide range in temperatures [29].

3.2. Response Surface Models

3.2.1. Biochar Yield

The yields of products from the 45 pyrolysis tests carried out following the Box-Behnken design, are presented in Appendix A for wood (Table A1), switchgrass (Table A2), and SFPM (Table A3). The highest bio-oil yields were obtained from wood (48.6% to 63.6%) and switchgrass (44.8% to 61.4%), and pyrolysis of these materials was associated with low biochar yields (17.5% to 31.2% and 16.8% to 26.4%, respectively). Conversely, the pyrolysis of SFPM produced lower yields of bio-oil (38.3% to 46.7%) and higher yields of biochar (32.1% to 40.4%). The canonical analysis indicated that the stationary points of the three response surface models are saddle points. Thus, results from the RIDGE analysis, indicating the direction toward which further pyrolysis experiments should be performed, in order to obtain the minimal and maximal estimated values of biochar yield, are presented in Table 3. It is known that biochar yield decreases as pyrolysis temperature increases [30]. Based on the results of the analysis of variance for the models, the biochar yield is significantly dependent on the pyrolysis temperature for the three biomass feedstocks (Pr < 0.05; Appendix B), as the solid residence time is only significant for the switchgrass biochar. In contrast to what is reported in some studies [18,31], the biochar yield was not significantly influenced by the N2 flowrate, which influences the vapor residence time. The predicted biochar yield is the highest for the pyrolysis of SFPM (maximum of 40%), due to the high ash content of the feedstock, which is found in biochar after pyrolysis. The biochar yield from switchgrass and wood pyrolysis are similar. However, the predicted highest value for wood (27.8%) is higher than for switchgrass (25.2%), despite the highest pyrolysis temperature being demonstrated for wood. It reflects the higher lignin content of wood, which preferentially forms char during pyrolysis [21].

3.2.2. H/Corg and O/Corg Ratios

The minimum values of H/Corg and O/Corg indicate a high biochar C stability [32,33,34,35], and thus, a maximum potential for C sequestration. H/Corg and O/Corg ratios of biochars produced from the 45 pyrolysis tests significantly varied for a single biomass, depending on the pyrolysis operating parameters (Table A1, Table A2 and Table A3). The response surface models demonstrated that the biochar produced from the three biomasses only demonstrates a good potential for C sequestration if the operating parameters are properly selected. A minimum stationary point was only found for the O/Corg molar ratio of biochar made from switchgrass; otherwise, saddle points were found. Minimum and maximum values of H/Corg and O/Corg, predicted from the RIDGE analysis, are presented in Table 3. The minimum predicted H/Corg ratios are 0.47, 0.54, and 0.66 for biochars produced from switchgrass, wood, and SFPM, respectively. This means that, for the optimal pyrolysis operational parameters, at least 50% of the C in biochar is expected to remain in the soil for more than 100 years [14]. The predicted minimum O/Corg ratio below 0.2 (0.10, 0.14, and 0.14 for switchgrass, wood, and SFPM, respectively) confirms the C sequestration potential of biochars produced with similar pyrolysis operating parameters. In fact, the pyrolysis operating parameters needed to obtain the minimum H/Corg and O/Corg ratios for each biomass, are similar. Conversely, the maximum predicted H/Corg and O/Corg values for the three biomasses are always above 0.7 and 0.2, respectively. Harvey et al. [36] found that pyrolysis conditions are the primary factors controlling the thermal stability of the resulting biochar. More specifically, Zhao et al. [37] demonstrated that biochar recalcitrance (i.e., its ability to resist decomposition) is mainly determined by pyrolysis temperature. The ANOVA analysis confirmed this fact: the pyrolysis temperature always significantly influenced (Pr < 0.05) the H/Corg and O/Corg ratios (Table A4, Table A5 and Table A6). Moreover, the solid residence time significantly impacted the indicators of C stability for the pyrolysis of switchgrass: as the residence time increased, the H/Corg and O/Corg ratios decreased. Di blasi [38] also reported that the solid residence time has an influence on the physical and chemical characteristics of biochar. The addition of a heat carrier material in an auger reactor could decrease the solid residence time required to provide sufficient reaction heat and time [18]. Finally, Antal and GrØnli [21] reported that biochar characteristics can also be modified with a change in the sweeping gas flow rate, which has an impact on the vapor residence time. Statistical analysis revealed that the N2 flowrate has a significant impact on the O/Corg ratio of SFPM and wood biochars. A lower O/Corg ratio is obtained with lower N2 flowrates.

3.2.3. C/N Ratio

Biochars with a C/N ratio higher than 30 could help in decreasing the N2O emissions from soil [13]. Results of the experimental Box-Behnken design showed that the C/N ratio markedly varies among biomasses, from 430 to 541 for wood, 95 to 115 for switchgrass, and 11.0 to 13.0 for SFPM. The Canonical analysis of the response surface models shows that a maximum stationary point was found for the C/N ratio of wood biochar, and that saddle points were identified for switchgrass and SFPM biochars. The minimum and maximum values estimated from the RIDGE analysis are presented in Table 3. The ANOVA (Table A4, Table A5 and Table A6) showed that none of the pyrolysis operating conditions significantly influenced the C/N ratio of biochar. In fact, because the N content of biomasses is low, particularly for wood and switchgrass (0.128% and 0.454%), the impact of pyrolysis operating parameters on the N content of biochar, and consequently on its C/N ratio, is low. Even if the C/N ratio for a single biomass does not significantly vary, depending on the pyrolysis operating parameters, there are large variations among the biomasses. In the literature, it was found that the C/N ratio is highly dependent on the type of biomass feedstock used for pyrolysis [8,39]. In the present study, the biomass C/N ratio (13.5, 108, and 372 for SFPM, switchgrass, and wood, respectively) is similar to the C/N ratio of biochar produced from the corresponding biomass, and the C/N ratios of biochars produced from wood pyrolysis are the highest (430 to 565), and ranged from 95 to 115 for switchgrass pyrolysis. Thus, based on their chemical composition, biochars made from these two biomasses have the potential to mitigate N2O emissions from soil. Biochars produced from the pyrolysis of SFPM have a C/N ratio lower than 30 (11.0–13.0) and could potentially increase N2O emissions from soil, due to their high N content [39] and low C content.

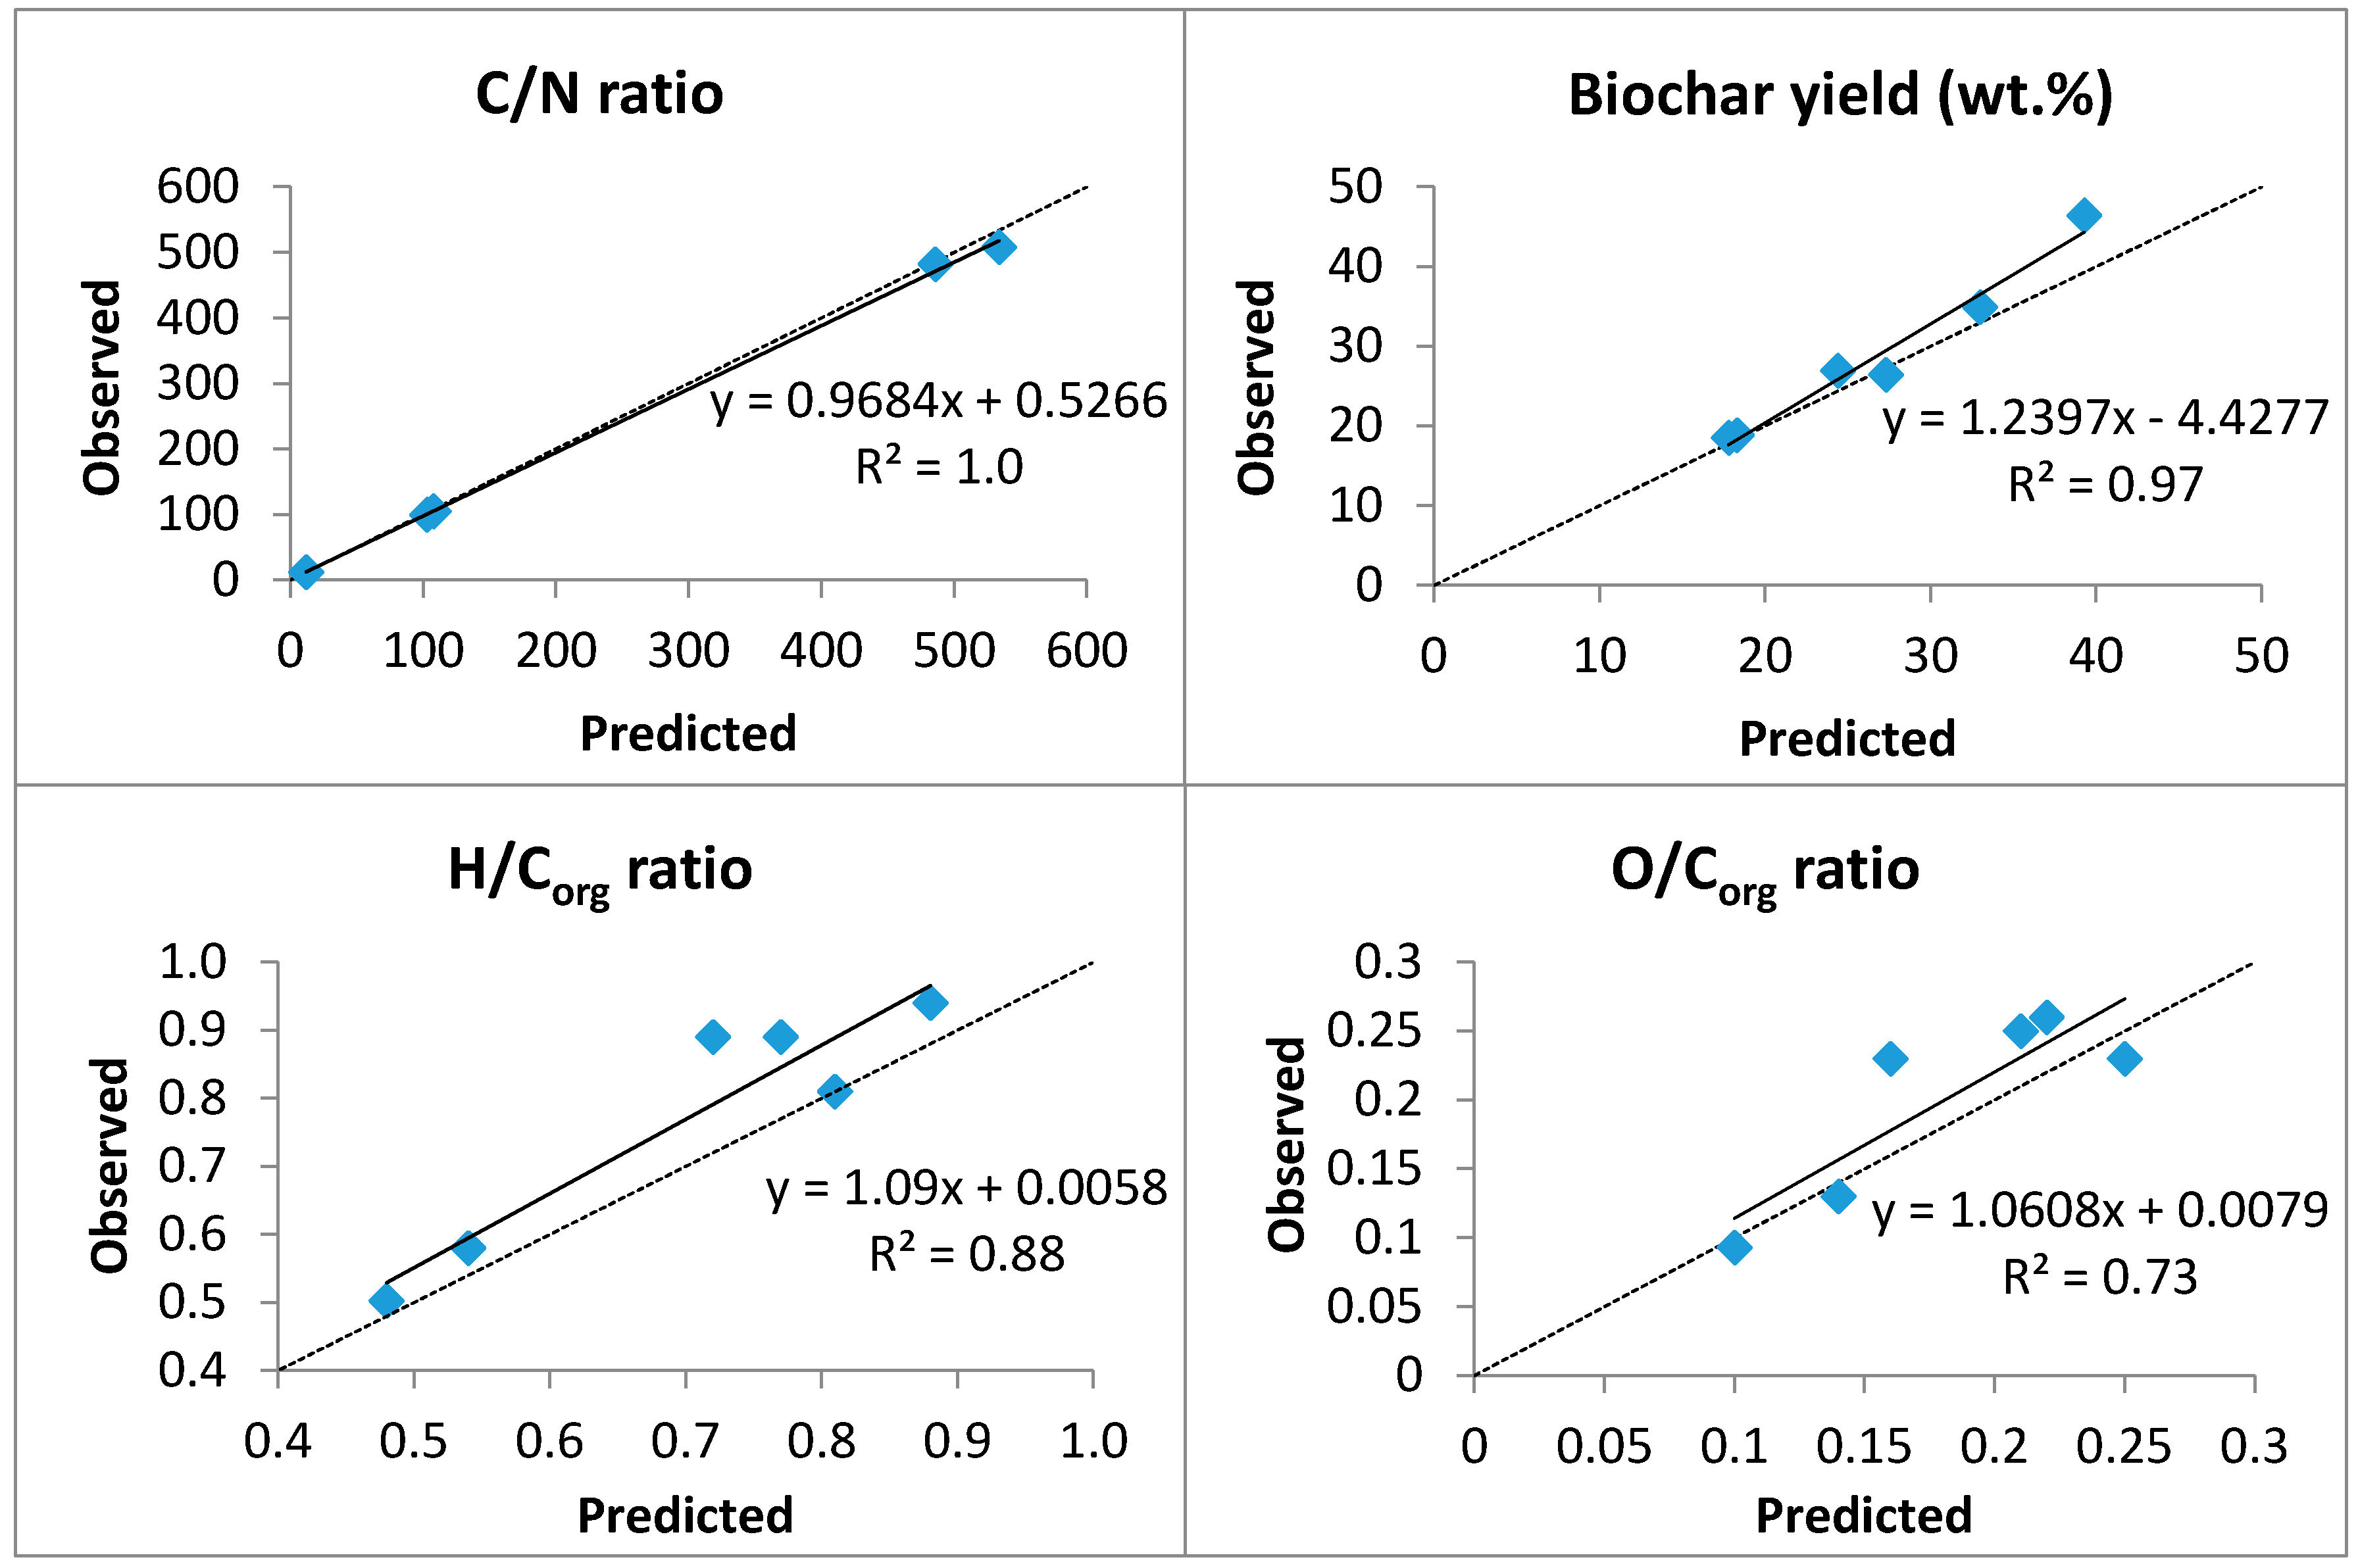
3.3. Experimental Validation of the Models

In order to validate the quadratic response surface regression models, two biochars were produced from wood (B1 and B2), switchgrass (B3 and B4), and SFPM (B5 and B6) (Table 4). B2, B4 (two replicates), and B6 were produced with the pyrolysis operating parameters (temperature, residence time, and N2 flowrate) determined from the response surface analysis for producing a biochar with the optimal properties in order to maximize the C sequestration potential (i.e., the lowest O/Corg and H/Corg ratios). B1, B3, and B5 were produced using the optimal parameters for producing a biochar with the opposite characteristics (highest O/Corg and H/Corg ratio). In fact, because the predicted optimal pyrolysis parameters needed to obtain the optimal O/Corg and H/Corg ratios are similar, the selected temperature, residence time, and N2 flowrate, were average values. For example, the lowest H/Corg and O/Corg ratios predicted for wood biochar would be obtained at 646 °C and 642 °C, respectively (Table 3). Thus, the selected temperature for the production of biochar with the best C sequestration potential was 644 °C (Table 4). The pyrolysis operating parameters for biochar production that were used to validate the models, and the corresponding yields and properties of the resulting biochars are presented in Table 4. B2, B4, and B6 were produced at a higher temperature, during a longer residence time, and with a lower N2 flowrate than B1, B3, and B5, respectively. Their ash contents are higher, whereas their H and O contents are lower. Moreover, the C and N contents of B2 and B4 are higher than B1 and B3, respectively. The water content is always low (about 1%), whereas the biochars produced at higher temperatures are more alkaline.
The observed vs. predicted values for the biochar yield, C/N, H/Corg, and O/Corg ratios, are illustrated in Figure 2. A comparison of the linear regressions with the 1:1 line indicates that the models fit the experimental data for the yield (R2 = 0.97), C/N (R2 = 1.0), H/Corg (R2 = 0.88), and O/Corg (R2 = 0.73). B2 and B4 are expected to have a better potential for mitigating climate change, have a high C sequestration potential (H/Corg < 0.7; O/Corg < 0.2), and have the potential to reduce soil GHG emissions (C/N ratio > 30).

4. Conclusions

Results from this study demonstrated that the response surface methodology approach can be used to accurately predict the optimal operating parameters of a vertical auger reactor (temperature, solid residence time, and nitrogen flowrate), required to produce engineered biochars with specific characteristics for C sequestration. It was highlighted that the pyrolysis products’ yields and biochar characteristics highly depend on the pyrolysis operating conditions and biomass feedstock. Biochar produced from wood and switchgrass can only present a high potential for C sequestration if the pyrolysis operating parameters are properly selected. In fact, the minimum H/Corg and O/Corg ratios predicted from the response surface models reached values lower or equal to 0.54 and 0.14, respectively, for a pyrolysis temperature ranging from 588 to 646 °C, a solid residence time from 99 to 106 s, and a N2 flowrate from 2.0 to 3.1 L·min−1. Moreover, regardless of the pyrolysis operating conditions, the biochars produced from the pyrolysis of wood and switchgrass could help to decrease soil N2O emissions, because their C/N ratios are higher than 30. Further experiments have to be carried out with the produced biochars, in order to evaluate their effect on soil GHG emissions and C sequestration, and to validate the hypothesis made in this study.

Acknowledgments

The authors thank the “Fonds de recherche du Québec—Nature et technologie(FQRNT), the “Programme de soutien à l’innovation en agroalimentaire” (grant number IA113109), the IRDA and McGill University for their financial support. Special thanks are also addressed to Jean-Pierre Larouche, Cédric Morin, Étienne Le Roux, Salha Elcadhi, and Martin Brouillard for their help during the implementation and the realization of the experiments.

Author Contributions

All the authors contributed to the conception and design of the experiments; Patrick Brassard performed the experiments; Patrick Brassard, Michèle Grenier, and Joahnn H. Palacios analyzed the data; Patrick Brassard wrote the paper and all of the co-authors revised it.

Conflicts of Interest

The authors declare no conflict of interest.

Appendix A. Experimental Data: Box-Behnken Design

Table A1. Pyrolysis of wood—Experimental data.
Operational ParametersProducts YieldsBiochar Properties
TRes. TimeN2Bio-OilLiquid OrganicsBiocharSyngasC/NH/CorgO/Corg
°CsL·min−1%%%
50060357.639.031.210.95170.840.25
50090161.939.924.613.24910.680.19
50090555.236.330.214.25310.920.29
500120363.641.923.412.45410.680.19
57560149.131.822.628.04830.680.19
57560556.837.822.220.55120.740.22
57590360.038.120.718.85650.650.19
57590360.640.620.618.24870.650.18
57590361.539.420.217.85040.620.17
575120158.834.421.219.65030.600.15
575120554.435.219.925.25000.630.18
65060356.036.818.325.24300.590.16
65090152.431.318.029.04910.510.13
65090548.827.817.533.14970.570.15
650120348.627.417.633.34660.530.13
T: temperature; Res. Time: solid residence time; N2: Nitrogen flowrate.
Table A2. Pyrolysis of Switchgrass—Experimental data.
Operational ParametersProducts YieldsBiochar Properties
TRes. TimeN2Bio-OilLiquid OrganicsBiocharSyngasC/NH/CorgO/Corg
°CsL·min−1%%%%
45060357.835.425.616.41140.810.25
45090159.234.326.414.01060.770.21
45090560.137.124.914.41020.820.24
450120359.434.124.415.91010.690.19
52560161.434.720.517.91000.640.18
5256055533.419.924.51050.720.21
52590358.337.220.221.21150.600.16
52590358.531.021.319.9950.610.16
5259035930.820.020.6990.580.14
525120156.842.321.921.11020.570.14
525120554.527.920.924.11030.540.14
60060351.530.816.830.5980.580.15
60090148.921.318.731.91050.480.10
60090544.820.417.337.2990.490.11
600120348.121.818.532.91020.460.10
T: temperature; Res. Time: solid residence time; N2: Nitrogen flowrate.
Table A3. Pyrolysis of SFPM—Experimental data.
Operational ParametersProducts YieldsBiochar Properties
TRes. TimeN2Bio-OilLiquid OrganicsBiocharSyngasC/NH/CorgO/Corg
°CsL·min−1%%%%
50060342.812.541.614.911.60.920.21
50090145.712.438.815.112.40.800.16
50090539.310.640.419.512.00.910.21
500120341.710.839.617.012.50.850.18
57560146.710.836.715.012.30.750.16
57560540.111.738.520.611.50.850.23
57590342.311.735.821.012.70.780.18
57590343.712.136.019.412.40.760.16
57590343.611.934.819.811.40.740.17
575120145.712.034.717.712.90.650.14
575120538.69.235.924.512.10.720.16
65060342.710.533.821.812.60.660.14
65090144.07.732.422.813.00.610.13
65090538.39.332.128.811.00.740.18
650120339.18.532.627.212.80.680.14
T: temperature; Res. Time: solid residence time; N2: Nitrogen flowrate.

Appendix B. ANOVA Tables

Table A4. ANOVA for the model of wood biochar.
WoodFactorDFMean SquaresF ValuePr > F
Temperature453.00129.960.0011 *
YieldRes. time48.09504.5800.0632
N2 flowrate42.93501.6600.2936
Temperature40.028718.780.0033 *
H/CorgRes. time40.00634.1200.0763
N2 flowrate40.00704.5800.0631
Temperature40.004322.040.0022 *
O/CorgRes. time40.00104.9300.0552
N2 flowrate40.00147.4300.0247 *
Temperature41452.11.2500.3972
C/NRes. time4471.350.4100.7982
N2 flowrate4304.410.2600.8904
DF: Degrees of freedom; Res. Time: solid residence time; * Significant at Pr < 0.05.
Table A5. ANOVA for the model of switchgrass biochar.
SwitchgrassParameterDFMean SquaresF ValuePr > F
Temperature429.44187.23<0.0001 *
YieldRes. time40.80772.3900.1822
N2 flowrate40.79112.3400.1876
Temperature40.036845.510.0004 *
H/CorgRes. time40.008310.300.0124 *
N2 flowrate40.00141.7000.2847
Temperature40.006172.320.0001 *
O/CorgRes. time40.001720.260.0027 *
N2 flowrate40.00033.0000.1298
Temperature429.9540.5300.7194
C/NRes. time421.6080.3800.8125
N2 flowrate42.11060.0400.9964
DF: Degrees of freedom; Res. Time: solid residence time; * Significant at Pr < 0.05.
Table A6. ANOVA for the model of SFPM biochar.
SFPMParameterDFMean SquaresF ValuePr > F
Temperature427.62496.31<0.0001 *
YieldRes. time42.78959.7300.0141 *
N2 flowrate40.82672.8800.1381
Temperature40.020718.070.0036 *
H/CorgRes. time40.00302.6300.1592
N2 flowrate40.00544.6800.0606
Temperature40.00095.0200.0533 *
O/CorgRes. time40.00084.4700.0661
N2 flowrate40.00148.0400.021 *
Temperature40.21380.8500.5509
C/NRes. time40.19870.7900.5793
N2 flowrate40.69882.7700.1466
DF: Degrees of freedom; Res. Time: solid residence time; * Significant at Pr < 0.05.

References

  1. Intergovernmental Panel on Climate Change (IPCC). Climate Change 2014: Synthesis Report. Contribution of working Groups I, II and III to the Fifth Assessment Report of the Intergovernmental Panel on Climate Change; Pachauri, R.K., Meyer, L.A., Eds.; IPCC: Geneva, Switzerland, 2014; pp. 1–151. [Google Scholar]
  2. Jahirul, M.I.; Rasul, M.G.; Chowdhury, A.A.; Ashwath, N. Biofuels Production through Biomass Pyrolysis—A Technological Review. Energies 2012, 5, 4952–5001. [Google Scholar] [CrossRef]
  3. Wang, J.; Pan, X.; Liu, Y.; Zhang, X.; Xiong, Z. Effects of biochar amendment in two soils on greenhouse gas emissions and crop production. Plant Soil 2012, 360, 287–298. [Google Scholar] [CrossRef]
  4. Haefele, S.M.; Konboon, Y.; Wongboon, W.; Amarante, S.; Maarifat, A.A.; Pfeiffer, E.M.; Knoblauch, C. Effects and fate of biochar from rice residues in rice-based systems. Field Crop. Res. 2011, 121, 430–440. [Google Scholar] [CrossRef]
  5. Kuzyakov, Y.; Bogomolova, I.; Glaser, B. Biochar stability in soil: Decomposition during eight years and transformation as assessed by compound-specific 14C analysis. Soil Biol. Biochem. 2014, 70, 229–236. [Google Scholar] [CrossRef]
  6. Brar, S.K.; Dhillon, G.S.; Soccol, C.R. Biotransformation of Waste Biomass into High Value Biochemicals; Springer: New York, NY, USA, 2014; pp. 1–504. [Google Scholar]
  7. Woolf, D.; Amonette, J.E.; Street-Perrott, F.A.; Lehmann, J.; Joseph, S. Sustainable biochar to mitigate global climate change. Nat. Commun. 2010, 1, 56. [Google Scholar] [CrossRef] [PubMed]
  8. Cayuela, M.L.; Van Zwieten, L.; Singh, B.P.; Jeffery, S.; Roig, A.; Sánchez-Monedero, M.A. Biochar’s role in mitigating soil nitrous oxide emissions: A review and meta-analysis. Agric. Ecosyst. Environ. 2014, 191, 5–16. [Google Scholar] [CrossRef]
  9. Foster, P.; Ramaswamy, V.; Artaxo, P.; Berntsen, T.; Betts, R.; Fahey, D.W.; Haywood, J.; Lean, J.; Lowe, D.C.; Myhre, G.; et al. Changes in Atmospheric Constituents and in Radiative Forcing. In Climate Change 2007: The Physical Science Basis, Contribution of Working Group I to the Fourth Assessment Report of the Intergovernmental Panel on Climate Change; Solomon, S., Qin, D., Manning, M., Chen, Z., Marquis, M., Averyt, K.B., Tignor, M., Miller, H.L., Eds.; Cambridge University Press: Cambridge, UK, 2007; pp. 129–234. [Google Scholar]
  10. Liang, C.; MacDonald, D. Chapter 5: Agriculture (CRF Sector 3). In National Inventory Report 1990–2013: Greenhouse Gas Sources and Sinks in Canada Part 1; Environment and Climate Change Canada: Gatineau, QC, Canada, 2015; pp. 123–146. [Google Scholar]
  11. Novak, J.M.; Busscher, W.J. Selection and Use of Designer Biochars to Improve Characteristics of Southeastern USA Coastal Plain Degraded Soils. In Advanced Biofuels and Bioproducts; Lee, J.W., Ed.; Springer: New York, NY, USA, 2013; pp. 69–96. [Google Scholar]
  12. Sun, Y.; Gao, B.; Yao, Y.; Fang, J.; Zhang, M.; Zhou, Y.; Chen, H.; Yang, L. Effects of feedstock type, production method, and pyrolysis temperature on biochar and hydrochar properties. Chem. Eng. J. 2014, 240, 574–578. [Google Scholar] [CrossRef]
  13. Brassard, P.; Godbout, S.; Raghavan, V. Soil biochar amendment as a climate change mitigation tool: Key parameters and mechanisms involved. J. Environ. Manag. 2016, 181, 484–497. [Google Scholar] [CrossRef] [PubMed]
  14. Budai, A.; Zimmerman, A.R.; Cowie, A.L.; Webber, J.B.W.; Singh, B.P.; Glaser, B.; Masiello, C.A.; Andersson, D.; Shields, F.; Lehmann, J.; et al. Biochar Carbon Stability Test Method: An assessment of methods to determine biochar carbon stability. Int. Biochar Initiat. 2013, 1–10. Available online: http://www.biochar-international.org/sites/default/files/IBI_Report_Biochar_Stability_Test_Method_Final.pdf (accessed on 11 January 2017). [Google Scholar]
  15. Garcia-Perez, M.; Lewis, T.; Kruger, C.E. Methods for Producing Biochar and Advanced Biofuels in Washington State. Part 1: Literature Review of Pyrolysis Reactors; First Project Report; Washington State Department of Ecology: Pullman, WA, USA, 2010; pp. 1–137. [Google Scholar]
  16. Resende, F.L.P. Chapter 1: Reactor Configurations and Design Parameters for Thermochemical Conversion of Biomass into Fuels, Energy, and Chemicals. In Reactor and Process Design in Sustainable Energy Technology; Elsevier: Amsterdam, The Netherlands, 2014; pp. 1–25. [Google Scholar]
  17. Myers, R.H.; Anderson-Cook, C.M.; Montgomery, D.C. Wiley Series in Probability and Statistics: Response Surface Methodology: Process and Product Optimization Using Designed Experiments, 3rd ed.; Wiley: Somerset, NJ, USA, 2016; p. 20. [Google Scholar]
  18. Brown, J.N.; Brown, R.C. Process optimization of an auger pyrolyzer with heat carrier using response surface methodology. Bioresour. Technol. 2012, 103, 405–414. [Google Scholar] [CrossRef] [PubMed]
  19. SAS Institute Inc. SAS/STAT® 12.1 User’s Guide; SAS Institute Inc.: Cary, NC, USA, 2007. [Google Scholar]
  20. Spokas, K.A.; Cantrell, K.B.; Novak, J.M.; Archer, D.W.; Ippolito, J.A.; Collins, H.P.; Boateng, A.A.; Lima, I.M.; Lamb, M.C.; McAloon, A.J.; et al. Biochar: A synthesis of its agronomic impact beyond carbon sequestration. J. Environ. Qual. 2012, 41, 973–989. [Google Scholar] [CrossRef] [PubMed]
  21. Antal, M.J., Jr.; Grønli, M. The art, science, and technology of charcoal production. Ind. Eng. Chem. Res. 2003, 42, 1619–1640. [Google Scholar] [CrossRef]
  22. Brassard, P.; Palacios, J.H.; Godbout, S.; Bussières, D.; Lagacé, R.; Larouche, J.-P.; Pelletier, F. Comparison of the gaseous and particulate matter emissions from the combustion of agricultural and forest biomasses. Bioresour. Technol. 2014, 155, 300–306. [Google Scholar] [CrossRef] [PubMed]
  23. Cantrell, K.B.; Martin, J.H. Stochastic state-space temperature regulation of biochar production. Part II: Application to manure processing via pyrolysis. J. Sci. Food Agric. 2012, 92, 490–495. [Google Scholar] [CrossRef] [PubMed]
  24. Association Française de Normalisation (AFNOR). Organic Soil improvers and Growing Media: Biochemical Fractionning and Estimation of Biological Stability: Method of Organic Matter Characterisation by Successive Solubilisations; Groupe AFNOR: La Plaine Saint-Denis, France, 2005; pp. 1–16. [Google Scholar]
  25. American Society for Testing and Materials (ASTM). E 203–16: Standard Test Method for Water Using Using Volumetric Karl-Fischer Titration; ASTM International: West Conshohocken, PA, USA, 2016; pp. 1–9. [Google Scholar]
  26. American Society for Testing and Materials (ASTM). D 1762–84: Standard Test Method for Chemical Analysis of Wood Charcoal; ASTM International: West Conshohocken, PA, USA, 2011; pp. 1–2. [Google Scholar]
  27. Lehmann, J.; Joseph, S. Biochar for Environmental Management: An Introduction; Earthscan: London, UK, 2009; pp. 1–12. [Google Scholar]
  28. Yang, H.; Yan, R.; Chen, H.; Lee, D.H.; Zheng, C. Characteristics of hemicellulose, cellulose and lignin pyrolysis. Fuel 2007, 86, 1781–1788. [Google Scholar] [CrossRef]
  29. Kim, K.H.; Kim, J.Y.; Cho, T.S.; Choi, J.W. Influence of pyrolysis temperature on physicochemical properties of biochar obtained from the fast pyrolysis of pitch pine (Pinus rigida). Bioresour. Technol. 2012, 118, 158–162. [Google Scholar] [CrossRef] [PubMed]
  30. Scott, D.S.; Piskorz, J.; Bergougnou, M.A.; Overend, R.P.; Graham, R. The role of temperature in the fast pyrolysis of cellulose and wood. Ind. Eng. Chem. Res. 1988, 27, 8–15. [Google Scholar] [CrossRef]
  31. Liaw, S.-S.; Wang, Z.; Ndegwa, P.; Frear, C.; Ha, S.; Li, C.-Z.; Garcia-Perez, M. Effect of pyrolysis temperature on the yield and properties of bio-oils obtained from the auger pyrolysis of Douglas Fir wood. J. Anal. Appl. Pyrolysis 2012, 93, 52–62. [Google Scholar] [CrossRef]
  32. Spokas, K.A.; Baker, J.M.; Reicosky, D.C. Ethylene: Potential key for biochar amendment impacts. Plant Soil 2010, 333, 443–452. [Google Scholar] [CrossRef]
  33. Enders, A.; Hanley, K.; Whitman, T.; Joseph, S.; Lehmann, J. Characterization of biochars to evaluate recalcitrance and agronomic performance. Bioresour. Technol. 2012, 114, 644–653. [Google Scholar] [CrossRef] [PubMed]
  34. Schimmelpfennig, S.; Glaser, B. One step forward toward characterization: Some important material properties to distinguish biochars. J. Environ. Qual. 2012, 41, 1001–1013. [Google Scholar] [CrossRef] [PubMed]
  35. Manyà, J.J.; Ortigosa, M.A.; Laguarta, S.; Manso, J.A. Experimental study on the effect of pyrolysis pressure, peak temperature, and particle size on the potential stability of vine shoots-derived biochar. Fuel 2014, 133, 163–172. [Google Scholar] [CrossRef]
  36. Harvey, O.R.; Kuo, L.-J.; Zimmerman, A.R.; Louchouarn, P.; Amonette, J.E.; Herbert, B.E. An index-based approach to assessing recalcitrance and soil carbon sequestration potential of engineered black carbons (biochars). Environ. Sci. Technol. 2012, 46, 1415–1421. [Google Scholar] [CrossRef] [PubMed]
  37. Zhao, L.; Cao, X.; Mašek, O.; Zimmerman, A. Heterogeneity of biochar properties as a function of feedstock sources and production temperatures. J. Hazard. Mater. 2013, 256–257, 1–9. [Google Scholar] [CrossRef] [PubMed] [Green Version]
  38. Di Blasi, C. Modeling intra- and extra-particle processes of wood fast pyrolysis. AIChE J. 2002, 48, 2386–2397. [Google Scholar] [CrossRef]
  39. Zheng, J.; Stewart, C.E.; Cotrufo, M.F. Biochar and nitrogen fertilizer alters soil nitrogen dynamics and greenhouse gas fluxes from two temperate soils. J. Environ. Qual. 2012, 41, 1361–1370. [Google Scholar] [CrossRef] [PubMed]
Figure 1. Schematic view of the vertical auger pyrolysis reactor.
Energies 10 00288 g001
Figure 2. Biochar yield, C/N, H/Corg, and O/Corg ratios: observed vs. predicted values.
Energies 10 00288 g002
Table 1. Box-Behnken design: list of independent variables and levels.
Independent VariableBiomassValues of the Coded Levels
−10+1
Temperature (°C)Wood500575650
SFPM500575650
Switchgrass450525600
Solid residence time (s)Each biomass6090120
N2 flowrate (L·min1)Each biomass135
Table 2. Biomasses physicochemical properties.
UnitWoodSFPMSwitchgrass
Ctotwt %47.740.045.8
Nwt %0.1282.960.425
Owt %40.028.242.5
Hwt %6.395.853.23
Water contentwt %6.513.07.2
Ashd.b.%0.5711.51.6
Clmg·kg−1103 60928
Ligninwt %24.012.911.2
Cellulosewt %30.411.942.9
Hemicellulosewt %29.922.030.1
Table 3. Estimated values of biochar properties and estimation of optimal pyrolysis operating parameters from the response surface models.
Biochar Yield (wt %)H/CorgO/CorgC/N
WoodMinMaxMinMaxMinMaxMinMax
Estimated value17.227.80.540.810.140.25477539
Temperature (°C)646507646515642517639522
Residence time (s)89799979103807590
N2 Flowrate (L·min−1)3.63.42.93.92.84.12.84.4
Switchgrass
Estimated value17.425.20.470.770.100.23100108
Temperature (°C)593451588456594462588466
Residence time (s)788810680102757472
N2 Flowrate (L·min−1)3.32.83.13.423.43.33.1
SFPM
Estimated value32.2400.660.900.140.2111.512.8
Temperature (°C)649507628508631543594614
Residence time (s)95799479947384103
N2 Flowrate (L·min−1)33.41.63.61.74.44.91.5
Table 4. Products yields and physicochemical properties of biochars produced with optimal pyrolysis operating conditions.
UnitB1B2B3B4 1B4 2B5B6
Pyrolysis parameters
BiomassWoodWoodSG 3SGSGSFPM 4SFPM
Temperature°C516644459591591526630
Res. times80101781041047694
N2 flowrateL·min−14.02.93.42.62.64.01.7
Products yields
Biochar% (w.b.)26.418.526.918.918.646.434.9
Bio-oil% (w.b.)58.251.560.249.449.037.941.5
Biochar properties
Ctotal% (w.b.)71.680.067.179.580.251.549.2
Corg% (w.b.)70.776.064.979.179.947.445.2
H% (w.b.)4.83.734.853.363.353.733.36
O% (w.b.)21.613.422.910.09.5915.613.7
N% (w.b.)0.1410.1660.6410.8280.7804.404.05
Psolublemg·kg−113.77.1610926.732.116555.7
Water content% (w.b.)0.91.21.51.01.80.90.9
Ash (750 °C)% (d.b.)1.42.14.15.65.423.628.1
pH6.87.66.48.78.98.69.3
1 First pyrolysis test for B4 production; 2 Second pyrolysis test for B4 production; 3 Switchgrass; 4 Solid fraction of pig manure.

