Article

In Situ Surface-Enhanced Raman Spectroscopy Study of the Electrocatalytic Effect of PtFe/C Nanocatalyst on Ethanol Electro-Oxidation in Alkaline Medium

by
A. C. Gómez-Monsiváis
1,2,
I. Velázquez-Hernández
1,
L. Álvarez-Contreras
3,*,
M. Guerra-Balcázar
4,
L. G. Arriaga
5,
N. Arjona
1,* and
J. Ledesma-García
4
1
Centro de Investigación y Desarrollo Tecnológico en Electroquímica, Unidad Tijuana, C.P. 22444 Tijuana, Baja California, Mexico
2
Tecnológico Nacional de México, Instituto Tecnológico de Tijuana, Apdo. Postal 1166 Tijuana, Baja California, Mexico
3
Centro de Investigación en Materiales Avanzados S.C., Complejo Industrial Chihuahua, C.P. 31136 Chihuahua, Chihuahua, Mexico
4
Facultad de Ingeniería, División de Investigación y Posgrado, Universidad Autónoma de Querétaro, C.P. 76010 Querétaro, Querétaro, Mexico
5
Centro de Investigación y Desarrollo Tecnológico en Electroquímica, C.P. 76703 Pedro Escobedo, Querétaro, Mexico
*
Authors to whom correspondence should be addressed.
Energies 2017, 10(3), 290; https://doi.org/10.3390/en10030290
Submission received: 19 December 2016 / Revised: 20 February 2017 / Accepted: 21 February 2017 / Published: 1 March 2017
(This article belongs to the Special Issue Direct Alcohol Fuel Cells)

Abstract

:
Currently, the ethanol electro-oxidation reaction has attracted considerable attention in fuel cells because of new green ethanol synthetic methods based on biomass processes that have emerged. In this study, PtFe/C and Pt/C nanoparticles were synthesized by a chemical reduction method and tested in the ethanol electro-oxidation reaction. Furthermore, the electrocatalytic effect of the PtFe bimetallic catalyst was analyzed by in situ surface-enhanced Raman spectroscopy (SERS) coupled to an electrochemical cell. X-ray diffractograms showed typical face-centered cubic structures with crystallite sizes of 3.31 and 3.94 for Pt/C and PtFe/C, respectively. TEM micrographs revealed nanoparticle sizes of 2 ± 0.4 nm and 3 ± 0.6 nm for Pt/C and PtFe/C respectively. PtFe/C exhibited a Pt90Fe10 composition by both X-ray fluorescence and energy-dispersive X-ray spectroscopy. A better electrocatalytic activity as function of concentration was obtained through the incorporation of a small amount of Fe into the Pt lattice and the presence of Fe2+/Fe3+ (observed by X-ray photoelectron spectroscopy). According to SERS experiments, the presence of these iron species promotes the chemisorption of ethanol, the formation of formic acid as main product and renewal of the catalytic sites, resulting in current densities that were at least three fold higher than the values obtained for the Pt/C nanocatalyst.

Graphical Abstract

1. Introduction

One of the challenges in direct ethanol fuel cells (DEFCs) is the enhancement of the slow kinetics of the ethanol electro-oxidation reaction (EOR) [1,2]. It has been reported that the use of alkaline electrolytes can improve the cell performance because the formation of CO2 in alkaline media is greater than in acidic solution due to the replacement of the carbonate ion by OH ions [3,4,5,6]. According to Ma et al. [7], the EOR, can be simply represented for Pd and Pt in alkaline media as follows:
CH 3 CH 2 OH CH 3 CH 2 O   intermediates CH 3 COO
CH 3 CH 2 O poisoning   species   ( C 1 ) CO 3 2
Reaction (1) can occur via a C2 pathway (i.e., the C–C bonds do not break). Meanwhile, Reaction (2) can occur via a C1 pathway, where C–C bonds break and generate poisoning species (such as CO). The use of an alkaline medium increases the OH concentration compared with an acidic medium, providing additional ions for adsorption onto the catalytic surface and improving the oxidation reaction, however, the hydroxyl ions could react with carbon dioxide forming carbonate ions (Reaction (2)), which could both block the catalytic surface and decrease the ionic diffusion resulting in a poor performance [8].
Pt-based nanocatalysts such as Pt-M alloys (M: Ru, Sn, Fe, Co, Ni, W) show excellent activity for ethanol oxidation, with PtRu and PtSn being the most active and studied materials for this reaction [8,9,10,11,12]. PtRu has an especially high tolerance to carbonous poisoning (such COads). Pt-based bi- or tri-metallic mixtures with non-noble metals have been synthesized in order to solve problems with Pt, such as its elevated cost because of its low availability, which limits its use on a large scale, as well as its low tolerance to poisoning [13,14,15]. Stamenkovic et al. found that the reaction kinetics of Pt3Ni are 90 times faster than those of Pt due to an enhanced activity and stability [16]. PtSn/C was tested towards the electro-oxidation of 1 M ethanol in an acidic medium using 1 M perchloric acid as the electrolyte. According to this work, Sn has a positive effect on Pt, decreasing the overpotential by activating interfacial water molecules [17]. Hierarchical porous Pt-Cu alloys have shown good performance toward ethanol oxidation in acidic media (0.5 M H2SO4), where the exceptional activity has been related to its high surface area [18]. Sieben et al. have deposited Pt-Ru nanocatalysts on oxidized multi-walled carbon nanotubes showing a current density of approximately 210 mA·mg−1 Pt, and this value was achieved because of the modification of the electronic structure of Pt atoms lowering the energy adsorption of this material toward carbonaceous species [19]. It has been reported that bismuth increases the electrocatalytic activity of Pt-based materials; Pt95Bi5 showed excellent activity for ethanol oxidation compared with commercial Pt associated with an optimized balance between the surface concentration of Pt atoms and oxygenated species [20]. Cerium oxides as well as zirconium oxides have also shown a positive effect on Pt favoring CO oxidation at lower potentials, resulting in current densities ranging from 330 (combined) to 446 mA·mg−1 Pt (CeO2 alone) [21]. Pt-NiO/C is another exceptional material found in the literature [22]. This material was tested using 1 M ethanol and 0.5 M H2SO4 as the fuel and electrolyte, respectively. In this work, it was found that NiO promotes the activation of C–H and O–H bonds instead of the C–C bond scission, enabling weak adsorption of intermediates. According to our search, the best known catalyst for ethanol electrooxidation is PtRu [23]. This material exhibits a superior current density of 770.7 mA·mg−1 Pt in an acidic medium. Moreover, Ru not only shows high tolerance to carbon monoxide poisoning from CO produced in ethanol oxidation but also toward methanol oxidation because it is considered to be one of the most difficult small organic molecules used as a fuel for energy conversion due to the CO formation. Furthermore, iron is a good option as a secondary non-noble metal. It is a cheap metal for alloying and the most common metal on Earth. Additionally, it is environmentally harmless and offers good electrocatalytic activity as well as stability to Pt electrodes [24,25,26]. Few works have addressed ethanol oxidation on PtFe catalysts. Wang et al. developed a Fe@Pt core-shell through galvanic replacement, which exhibited higher stability than pure Pt [27]. Dong et al. compared the activities of Pt and PtFe supported on single-walled carbon nanotubes (SWCNTs). They found that both materials had similar onset potentials; however, PtFe/SWCNT showed a higher tolerance to CO poisoning and other carbonous species compared to Pt/SWCNT [28]. Iron-iron carbide-inserted carbon nanotube/graphite composite (Fe–C) was prepared and used as support for high Pt nanoparticle loadings [29]; this material was employed for the ethanol electro-oxidation showing high capability of oxidizing adsorbed CO and ethanol molecules associated to the Fe–C support. It has been found that Pt catalysts containing Fe3+ can enhance the electrocatalytic activity in alkaline medium toward methanol oxidation because iron can modify the Pt surface state, promoting the adsorption of OH species and hence improving the CO oxidation as an intermediate [30].
Plenty of these bimetallic nanocatalysts fail to demonstrate the effect of the secondary metal on the electro-oxidation reaction, suggesting only their possible influence on promoting the formation of oxygenated species for the reaction or in enhancing CO oxidation. However, other important aspects are related with the number of electrons extracted by the ethanol molecules, or to the ease of desorption of poisoning species. Moreover, the formation of these species leads to a poor activity, hence the importance of designing bi- or trimetallic electrocatalysts and the relevance of understanding their effect on the reaction mechanism [31]. Two spectroscopic techniques have been used for this purpose: in-situ infrared reflectance spectroscopy [31] and in-situ surface-enhanced Raman spectroscopy (SERS) [32]. Adsorbed CO is easily observed by in situ IR spectroscopy, but this technique has a restricted frequency range compared with SERS, which provides a viable analysis of the vibrational spectra at metal-solution interfaces, where the large surface enhancement enables vibrational information for a wide variety of adsorbates [32]. The main advantage of SERS is the low interference of solvents and other bulk solutions on the spectral information.
In this work, we report the study by surface-enhanced Raman spectroscopy of the effect of PtFe nanocatalyst on the ethanol electro-oxidation mechanism. For this purpose, Pt and PtFe nanoparticles were synthesized using Vulcan carbon as support by a chemical reduction method. Furthermore, their physicochemical and electrochemical characterizations are presented through X-ray diffraction (XRD), X-ray fluorescence (XRF), energy-dispersive X-ray spectroscopy (EDX), high-resolution transmission electron microscopy (HR-TEM), X-ray photoelectron spectroscopy (XPS) and cyclic voltammetry (CV). Both nanocatalysts were tested for the ethanol electro-oxidation, with both their activity and stability toward this reaction being examined.

2. Results and Discussion

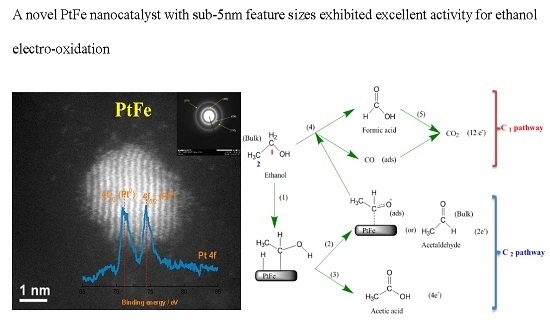
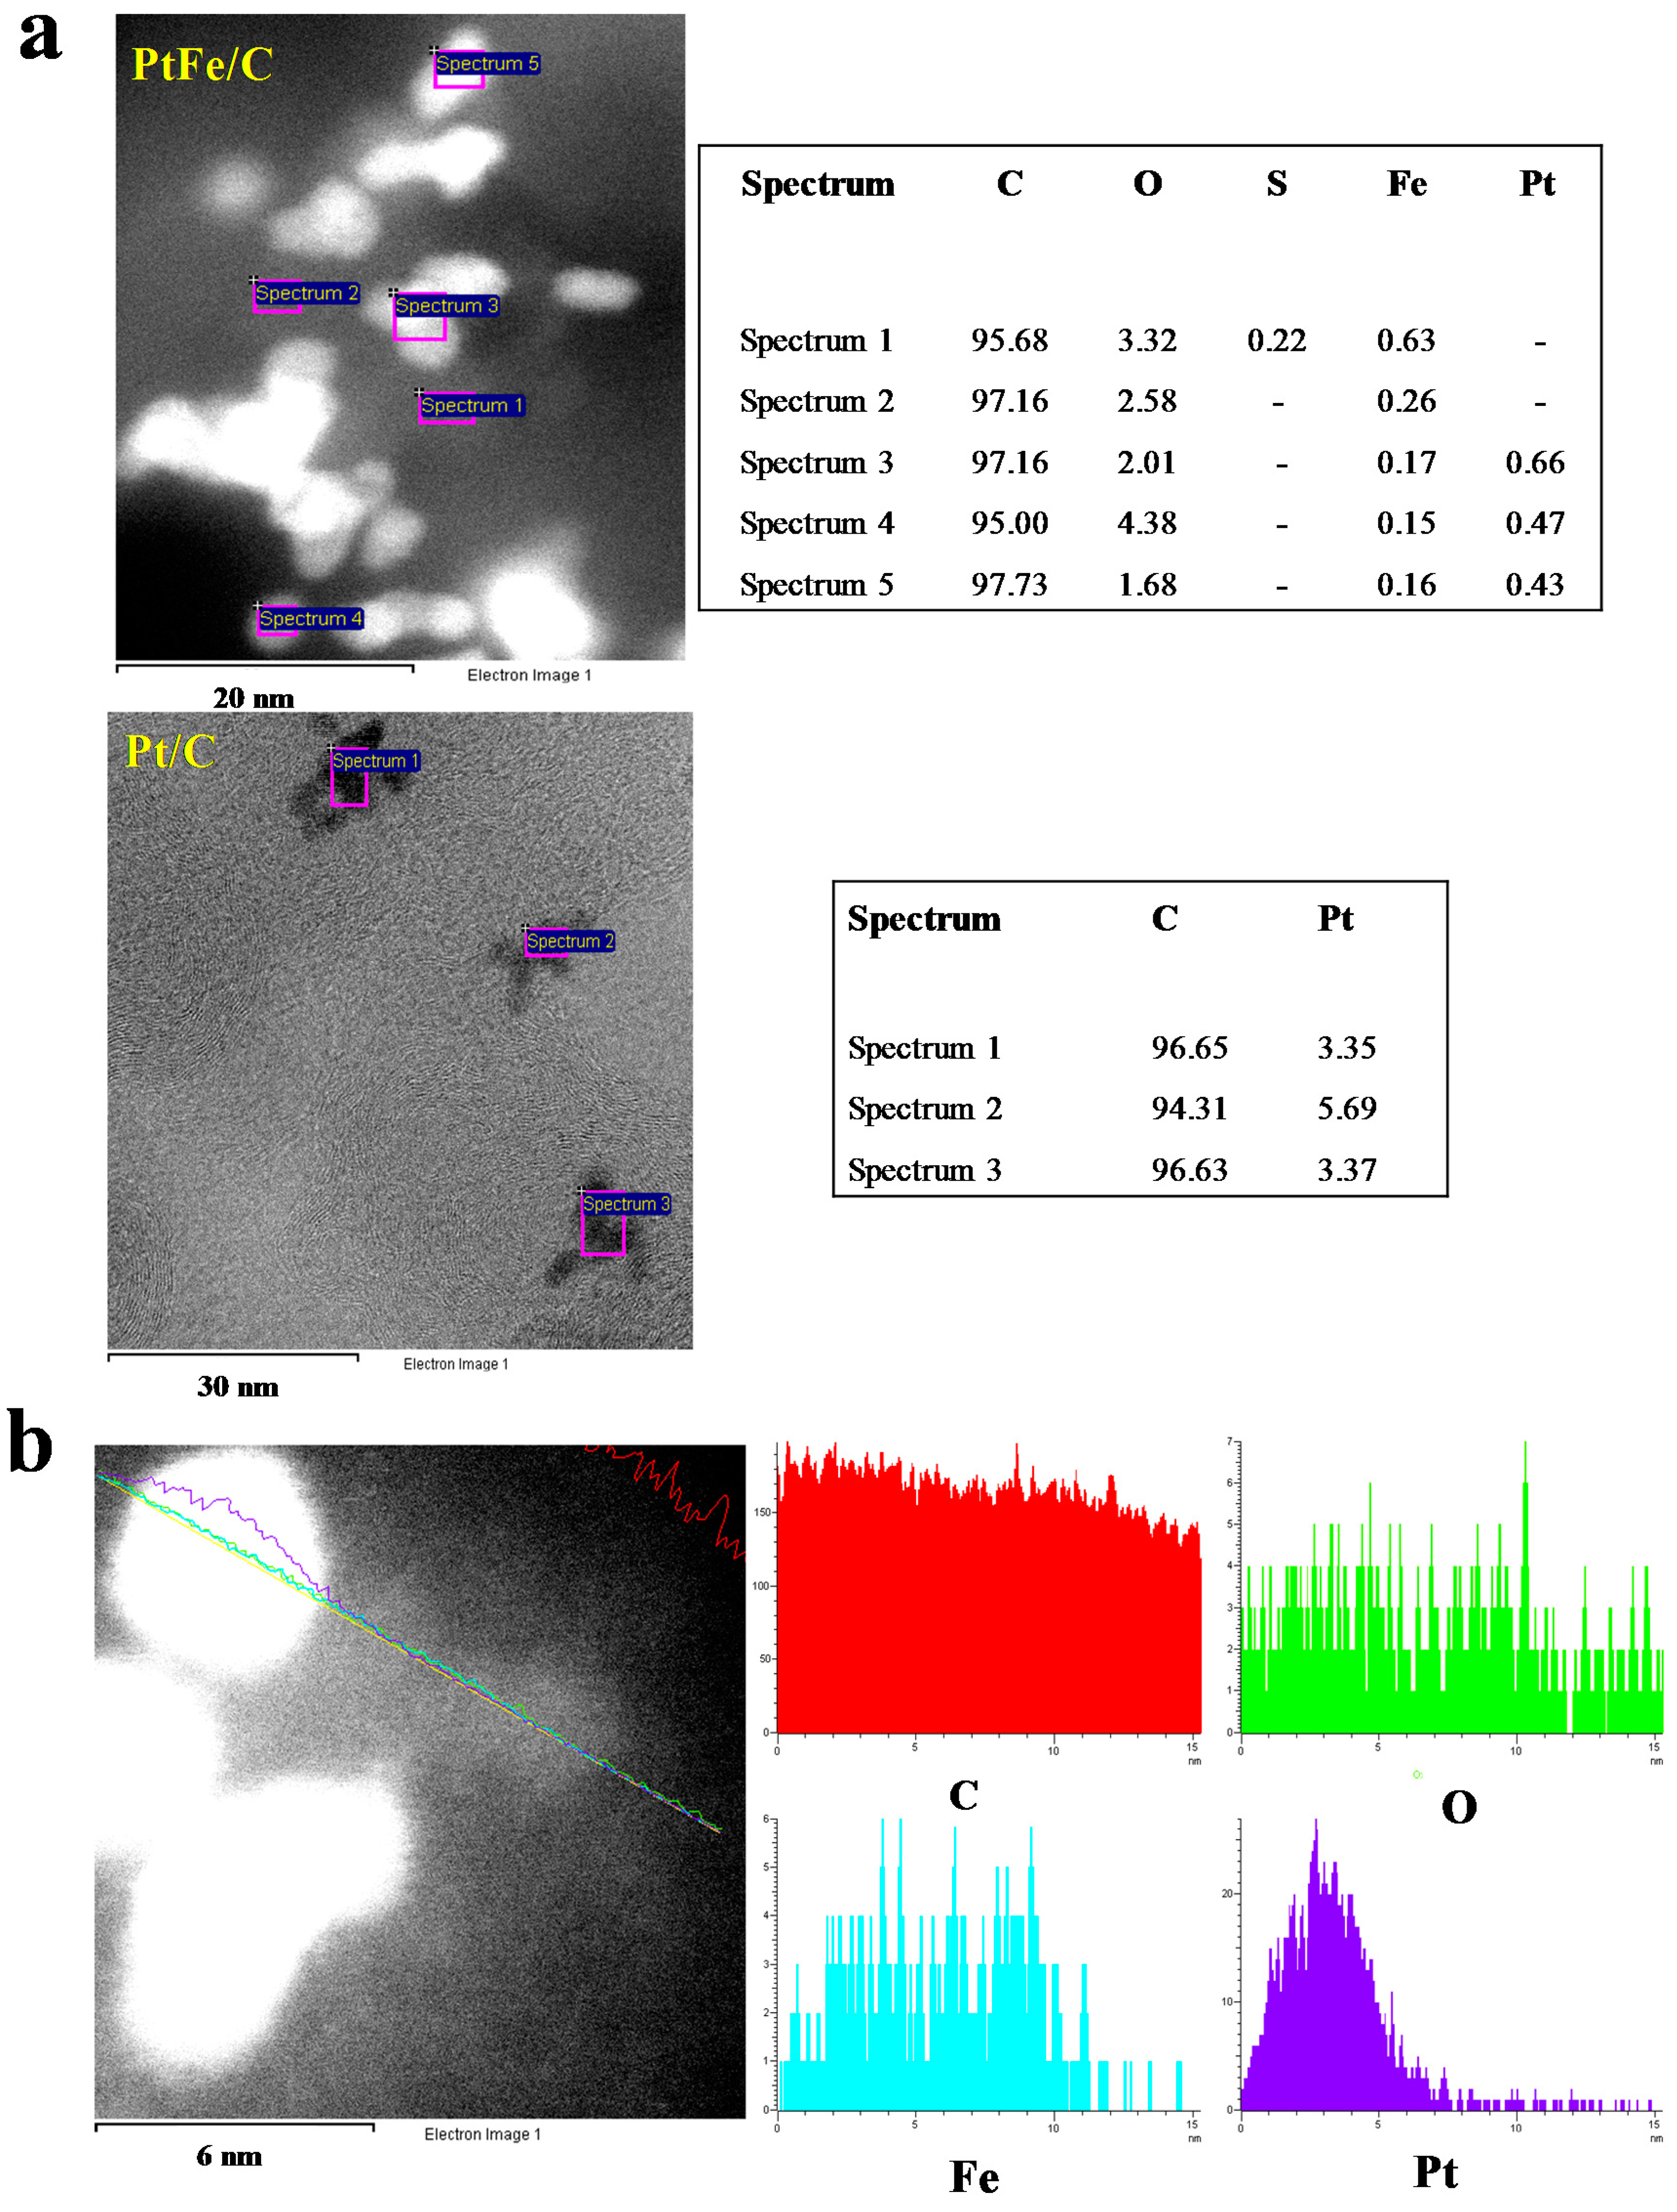
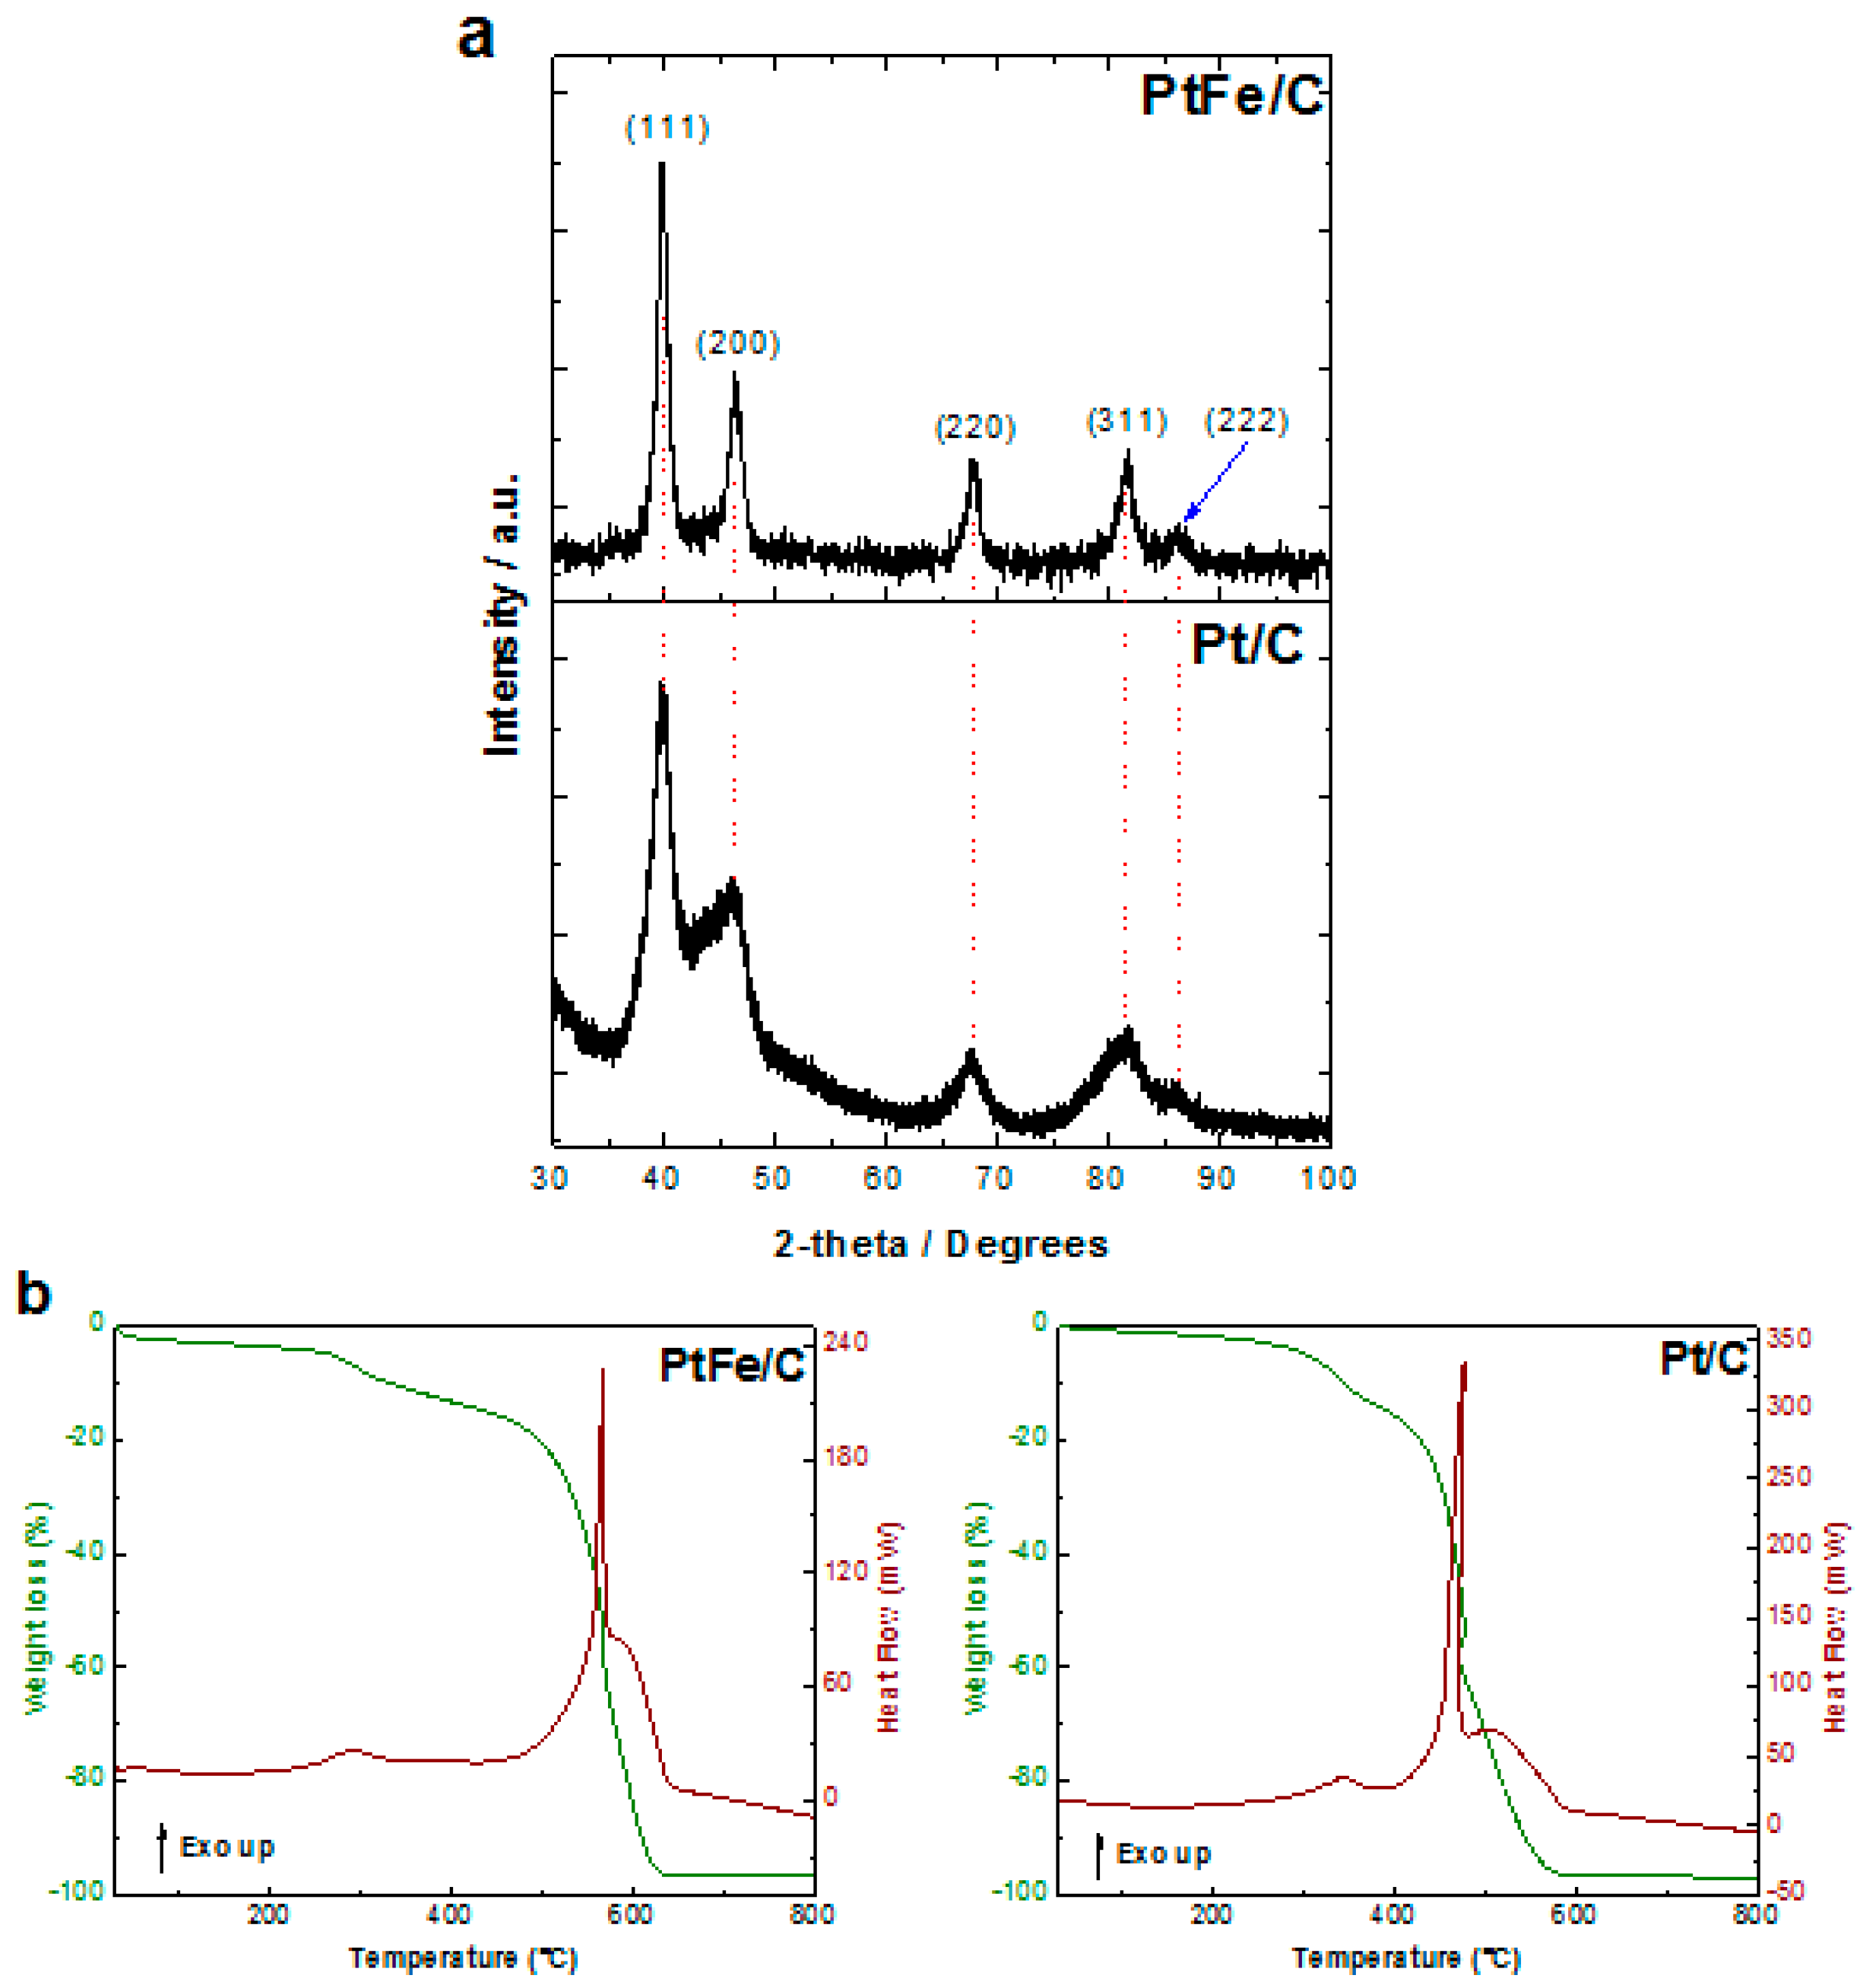
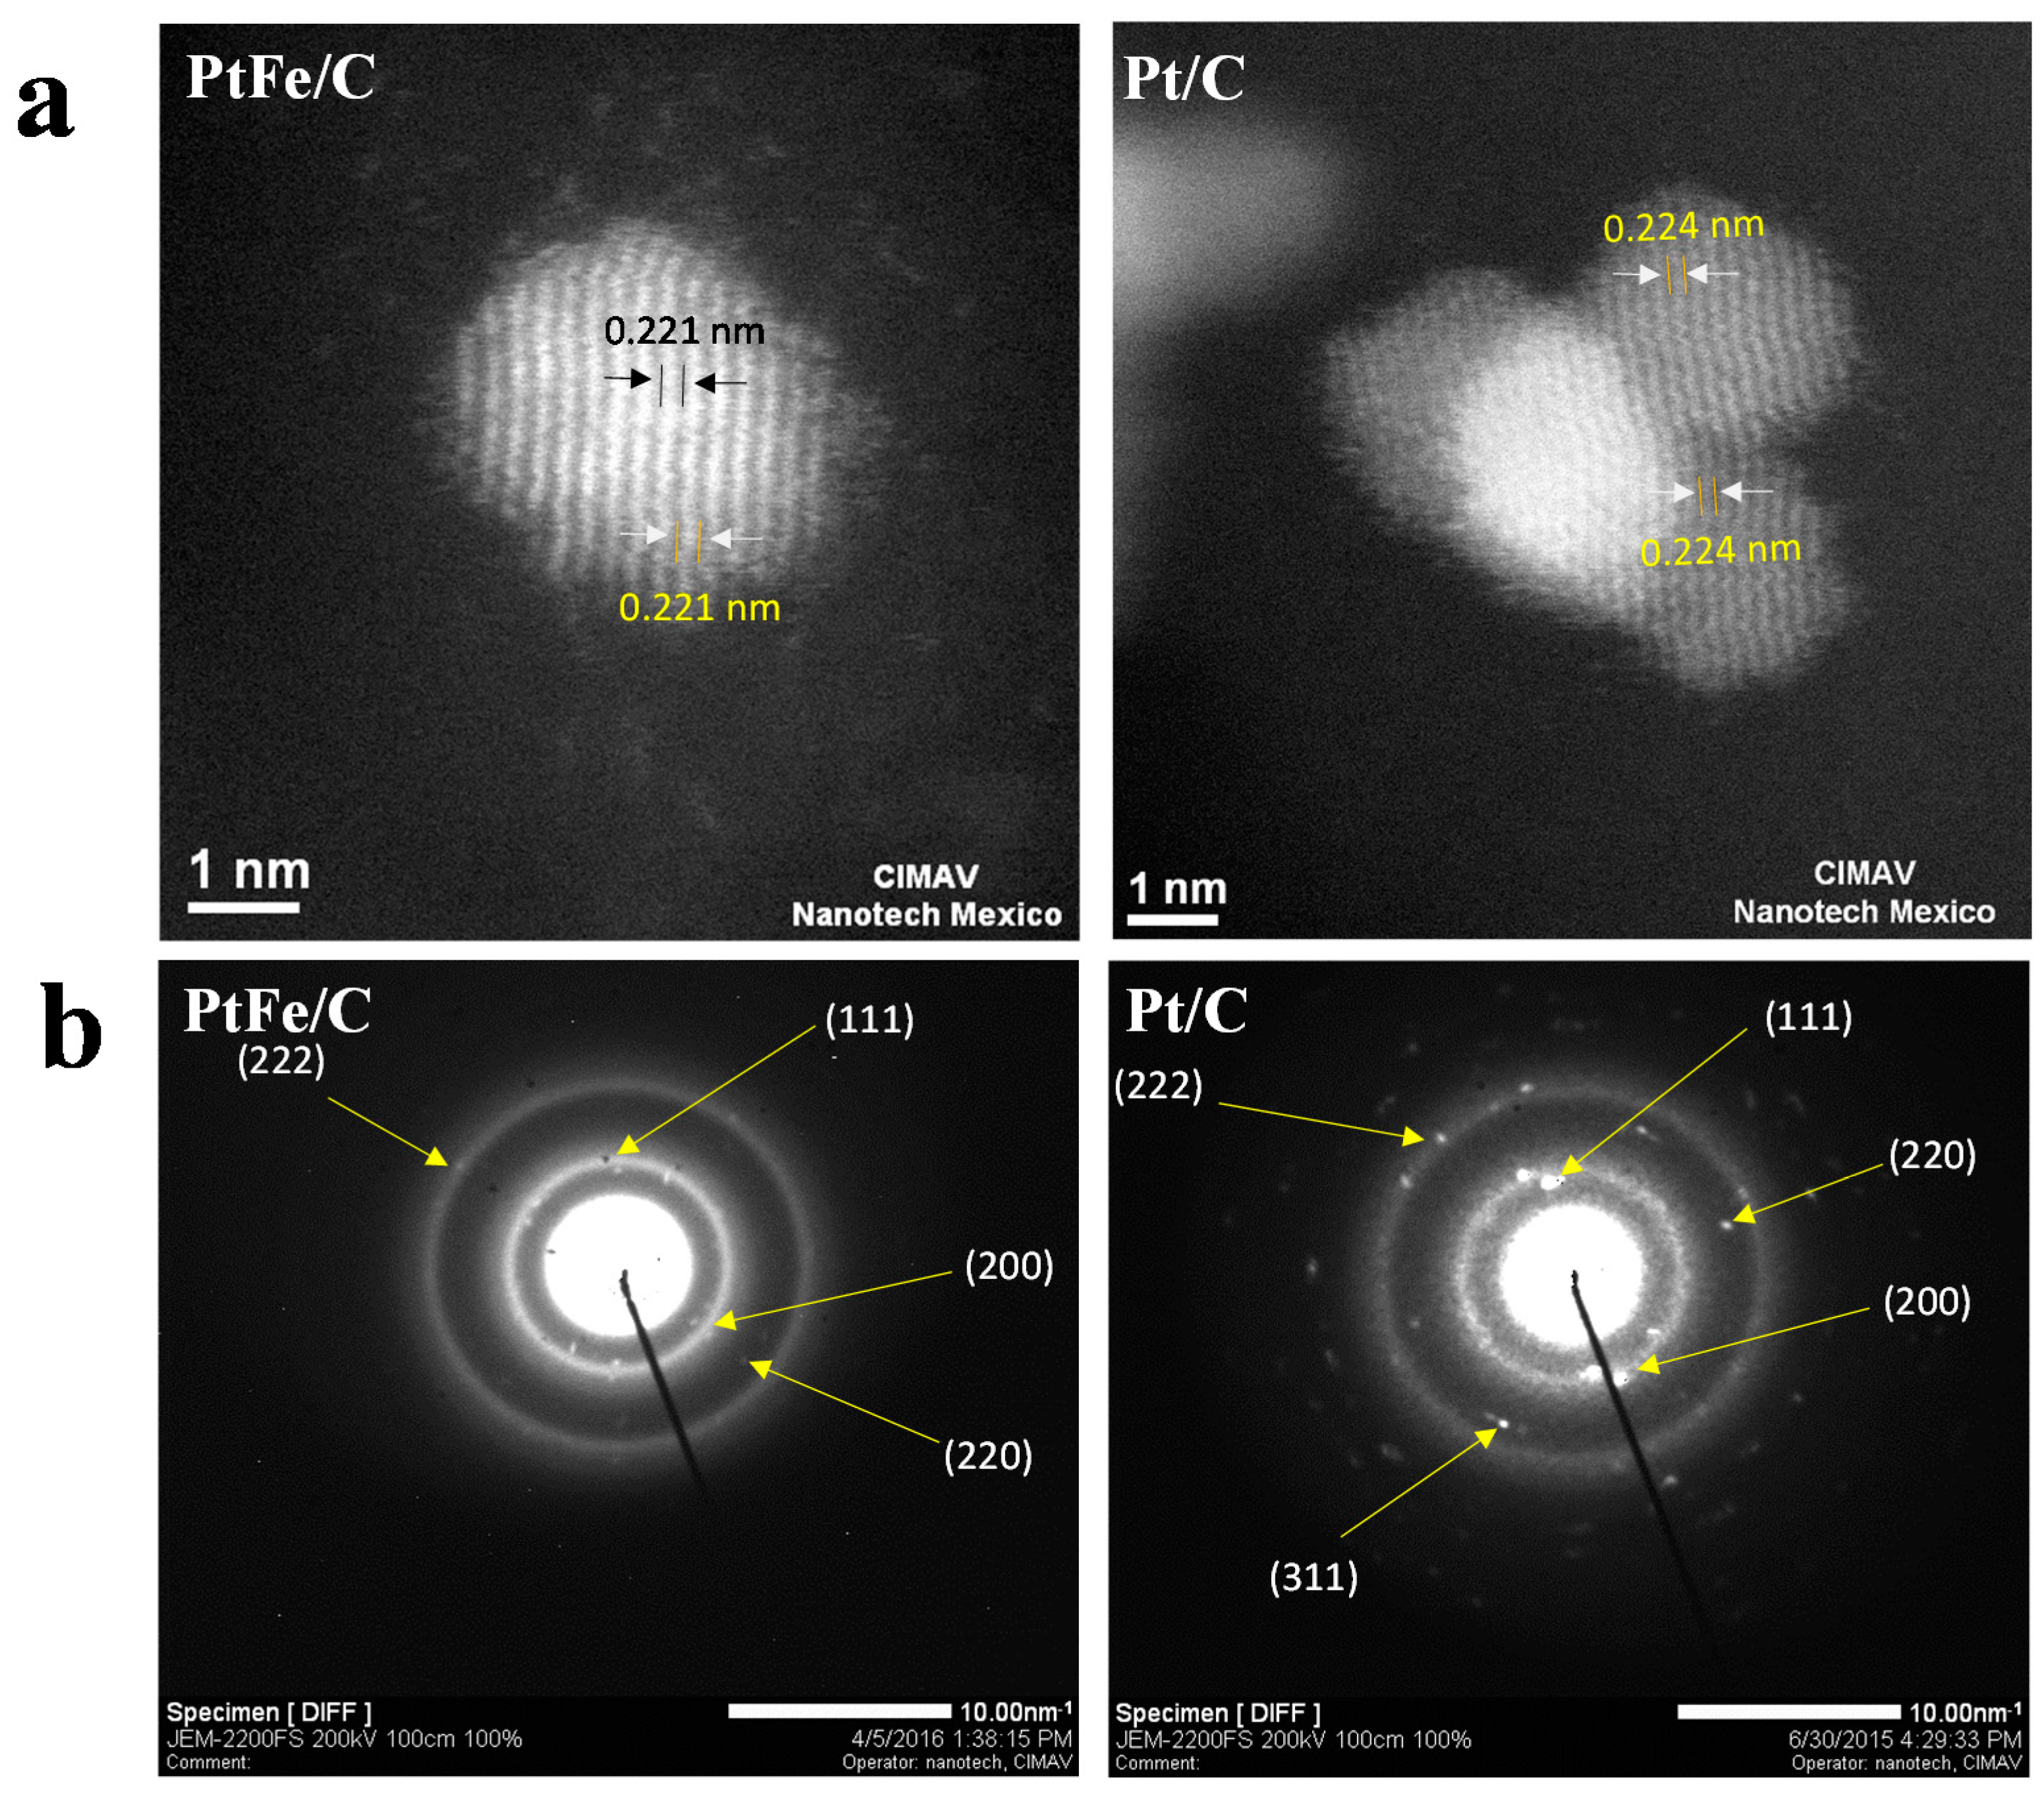
2.1. Physicochemical Characterization

X-ray diffraction patterns for Pt/C and PtFe/C nanocatalysts are shown in Figure 1a. Both materials exhibited the (111), (200), (220) and (311) crystalline planes, which are characteristic of the face-centered cubic structure of Pt. These planes were located at 2-theta values of 39.91, 46.45, 67.73 and 81.33 degrees. The average crystallite sizes were calculated applying the Scherrer’s equation (Equation (3)) to the (111), (200) and (220) planes of each material. The resulting sizes were 3.31 nm and 3.94 nm for Pt/C and PtFe/C, respectively:
d = 0.94 λ β cos θ
In Equation (3), d is the crystallite size, 0.94 is a dimensionless shape factor, lambda is the X-ray wavelength (1.5406 Å Kα of copper), β is the line broadening at half of the maximum intensity and theta is the Bragg angle. Lattice parameters ( a ) for Pt/C and PtFe/C were obtained through Bragg’s law (Equation (4)) applied to the (220) planes, resulting in values of 3.9333 Å for Pt/C and 3.9119 Å for PtFe/C. The incorporation of iron resulted in a contraction of the Pt lattice due to the integration of Fe atoms into the Pt lattice as iron has a smaller lattice (2.8665 Å) [33]:
a = 2 λ sin θ
The atomic Pt–Pt distances ( d f c c ) were calculated to determine changes in the atomic distances of platinum by incorporating iron atoms (Equation (5)). For Pt/C, Pt–Pt distances of 2.781 Å were found, and they were in accordance with typical values found in the literature [34]. The presence of Fe in the PtFe catalyst (average Fe-Fe spacing: 3.09Å [35]) decreased the atomic Pt–Pt distance to 2.766 Å, corroborating its incorporation into the Pt lattice:
d f c c = 2 2 a
Thermogravimetric curves as well as their first derivatives are presented in Figure 1b. The form of the weight loss curve for PtFe/C is characteristic of a thermal decomposition process. However, in the case of Pt/C, a small rebound was observed close to 500 °C, which is characteristic of a multi-step decomposition process. The first derivative plot was used to identify the major decomposition processes that occurred in both materials. In PtFe/C, a small peak was found at 288 °C beginning from 220 °C, and it was attributed to the decomposition of residual ascorbic acid [36]. After that peak, both a sharp and a broad peak were found between 494 and 637 °C, and they were related to the decomposition of Vulcan carbon with different surface groups [37]. In the case of Pt/C, a peak was observed close to 360 °C, and it was related to the decomposition of residual polyvinylpyrrolidone (PVP) [38]. Otherwise, the residual metallic mass content was determined using the weight loss curve, resulting in values of 3.443% for Pt supported on Vulcan carbon and 3.669% for PtFe supported on Vulcan carbon.
TEM micrographs of PtFe/C and Pt/C nanocatalysts as well as their particle distributions are shown in Figure 2a. The XPS spectra for the Fe 2p region and Pt 4f region of PtFe/C are also shown in Figure 2b. A low particle agglomeration for both materials is observed from TEM micrographs, with Pt/C being the material that exhibits the largest agglomeration. Nevertheless, both catalysts showed a narrow particle size distribution, where Pt/C presented particle sizes of 2 ± 0.4 nm, meanwhile PtFe/C showed particle sizes of 3 ± 0.6 nm. The electronic states of PtFe/C studied by XPS showed a pair of binding energy peaks at 71.2 and 74.8 eV corresponding to Pt0 (4f7/2 = 71.2 eV and 4f5/2 = 74.8 eV), whereas the Fe species corresponded to Fe2+ and Fe3+ (Fe 2p3/2 = 710.9 eV and Fe 2p1/2 = 724.2 eV) [39,40]. Therefore, the electrocatalyst consisting of metallic Pt tightly bonded to the Fe oxide, this close bond modifies the structure and electrochemical response of the catalyst.
The oxidized Fe content can be mainly associated with the free Fe particles observed in the catalyst. On the other hand, the small effect of Fe incorporated into the Pt lattice as observed by XPS can be associated with the low content of the PtFe catalyst (approximately 3.67%) combined with the low presence of Fe in the PtFe catalyst. TEM micrographs with higher magnifications were acquired to obtain both the d-spacings and the selected area electron diffraction patterns (Figure 3). Pt/C exhibited an inter-planar d-spacing of 0.224 nm characteristic of a typical Pt-based material with the large presence of the (111) plane (typical value for Pt = 0.226 nm). PtFe/C showed a d-spacing of 0.221 nm, also corresponding to the Pt (111) plane. Compared with Pt/C, the decrease in the d-spacing on PtFe/C as well as its lattice parameter corroborated the incorporation of Fe into the Pt lattice. The selected area electron diffraction (SAED) pattern of the reciprocal lattice of Pt/C showed nanophase formation exhibiting the presence of the (111), (200), (220), (311) and (222) planes. These are characteristic of a face-centered cubic Pt structure with spacings close to the theoretical 0.226, 0.198, 0.141, 0.137, and 0.11 nm for the (111), (200), (220), (311) and (222) planes of Pt-based materials. For PtFe/C, only the (111), (200), (220) and (222) planes were identified and indexed, where the inter-planar d-spacings for all of the planes showed small contractions compared with those corresponding to Pt/C.
Energy dispersive X-ray EDX analyses of Pt/C and PtFe/C are presented in Figure 4a, and the average values are summarized in Table 1. Pt/C nanoparticles exhibited only the presence of Pt without any impurities. The analysis of a set of PtFe/C particles revealed that this material was composed of both PtFe and Fe nanoparticles.
Approximately 46% of the total Fe content was incorporated into the Pt lattice. Additionally, EDX analysis corroborated the existence of single Fe nanoparticles. The mass content was determined by X-ray fluorescence XRF, resulting in a composition of 89% Pt and 11% Fe. Additionally, the average atomic percentages were obtained using EDX for PtFe/C, resulting in 91.62% and 8.37% for Pt and Fe, respectively. The difference between the XRF and EDX results can be related to the slight presence of single Pt and Fe nanoparticles. An EDX line-scan was performed on single PtFe nanoparticles, and a representative line-scan is presented in Figure 4b. From this analysis, it can be corroborated that Fe is present not only in the PtFe nanoparticles but also in a single form. Furthermore, the line-scan showed that the PtFe nanoparticles are mainly composed of Pt, corroborating the observations by EDX and XRF analyses.

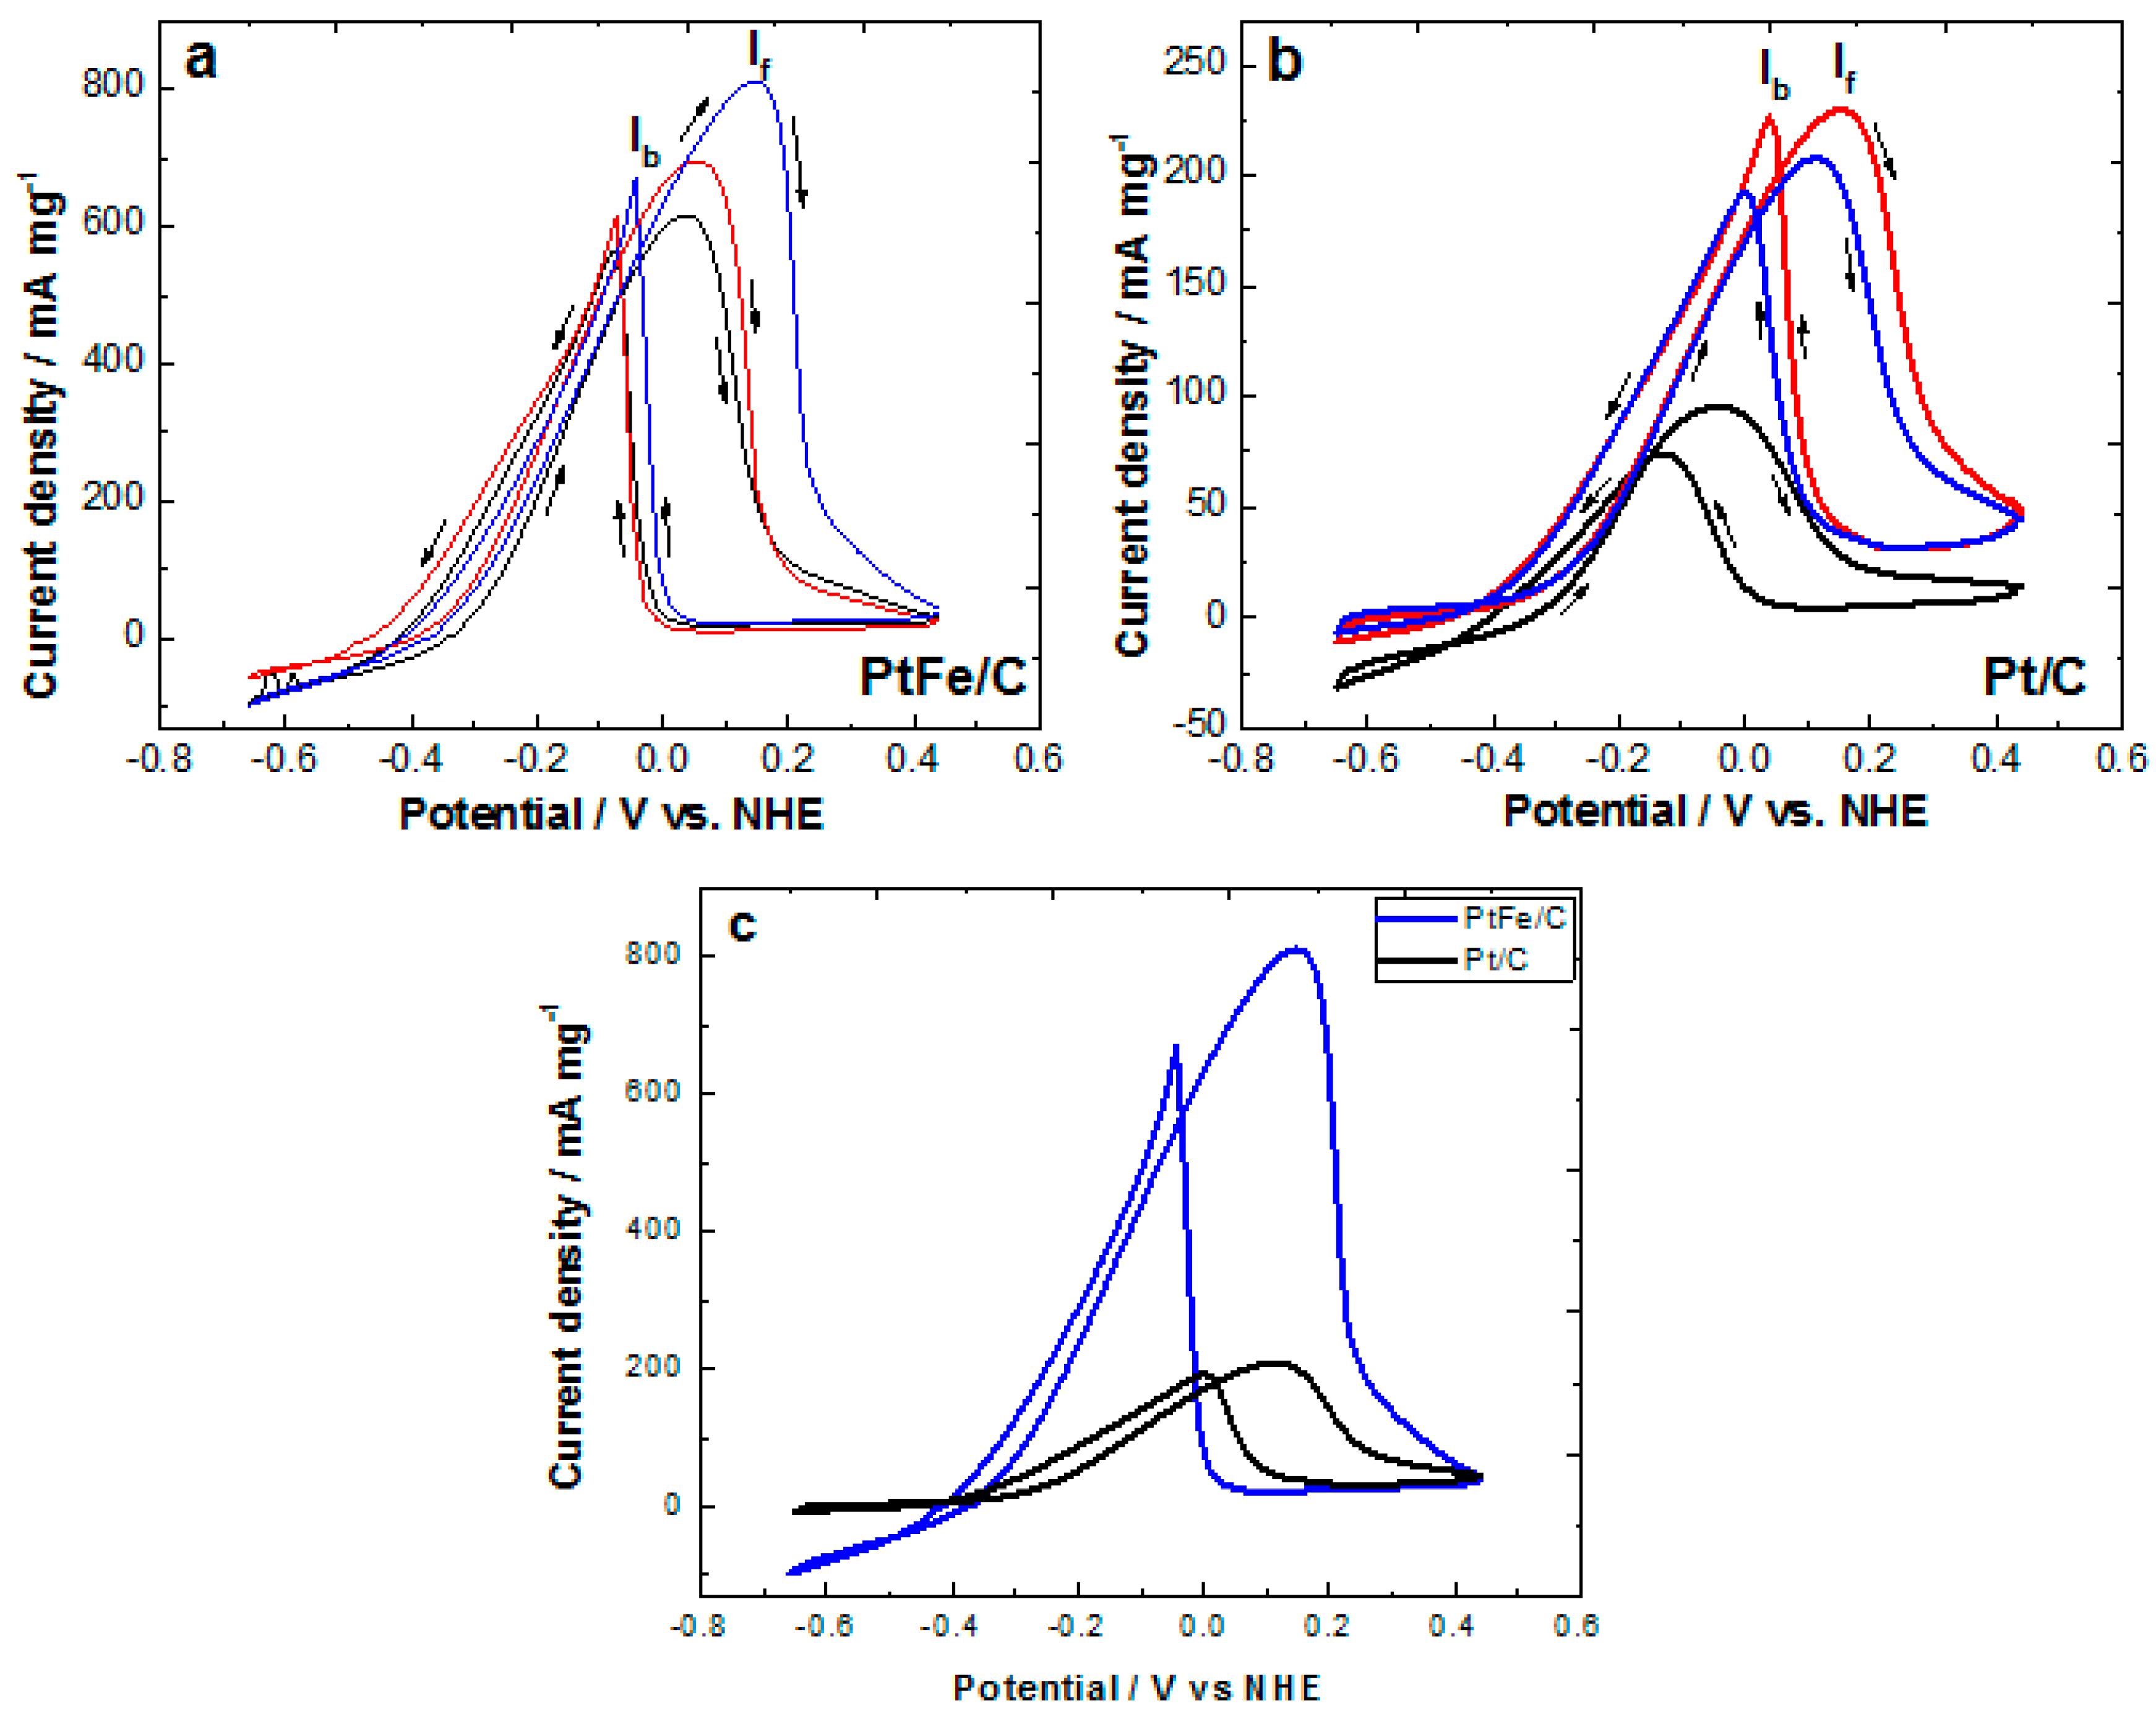
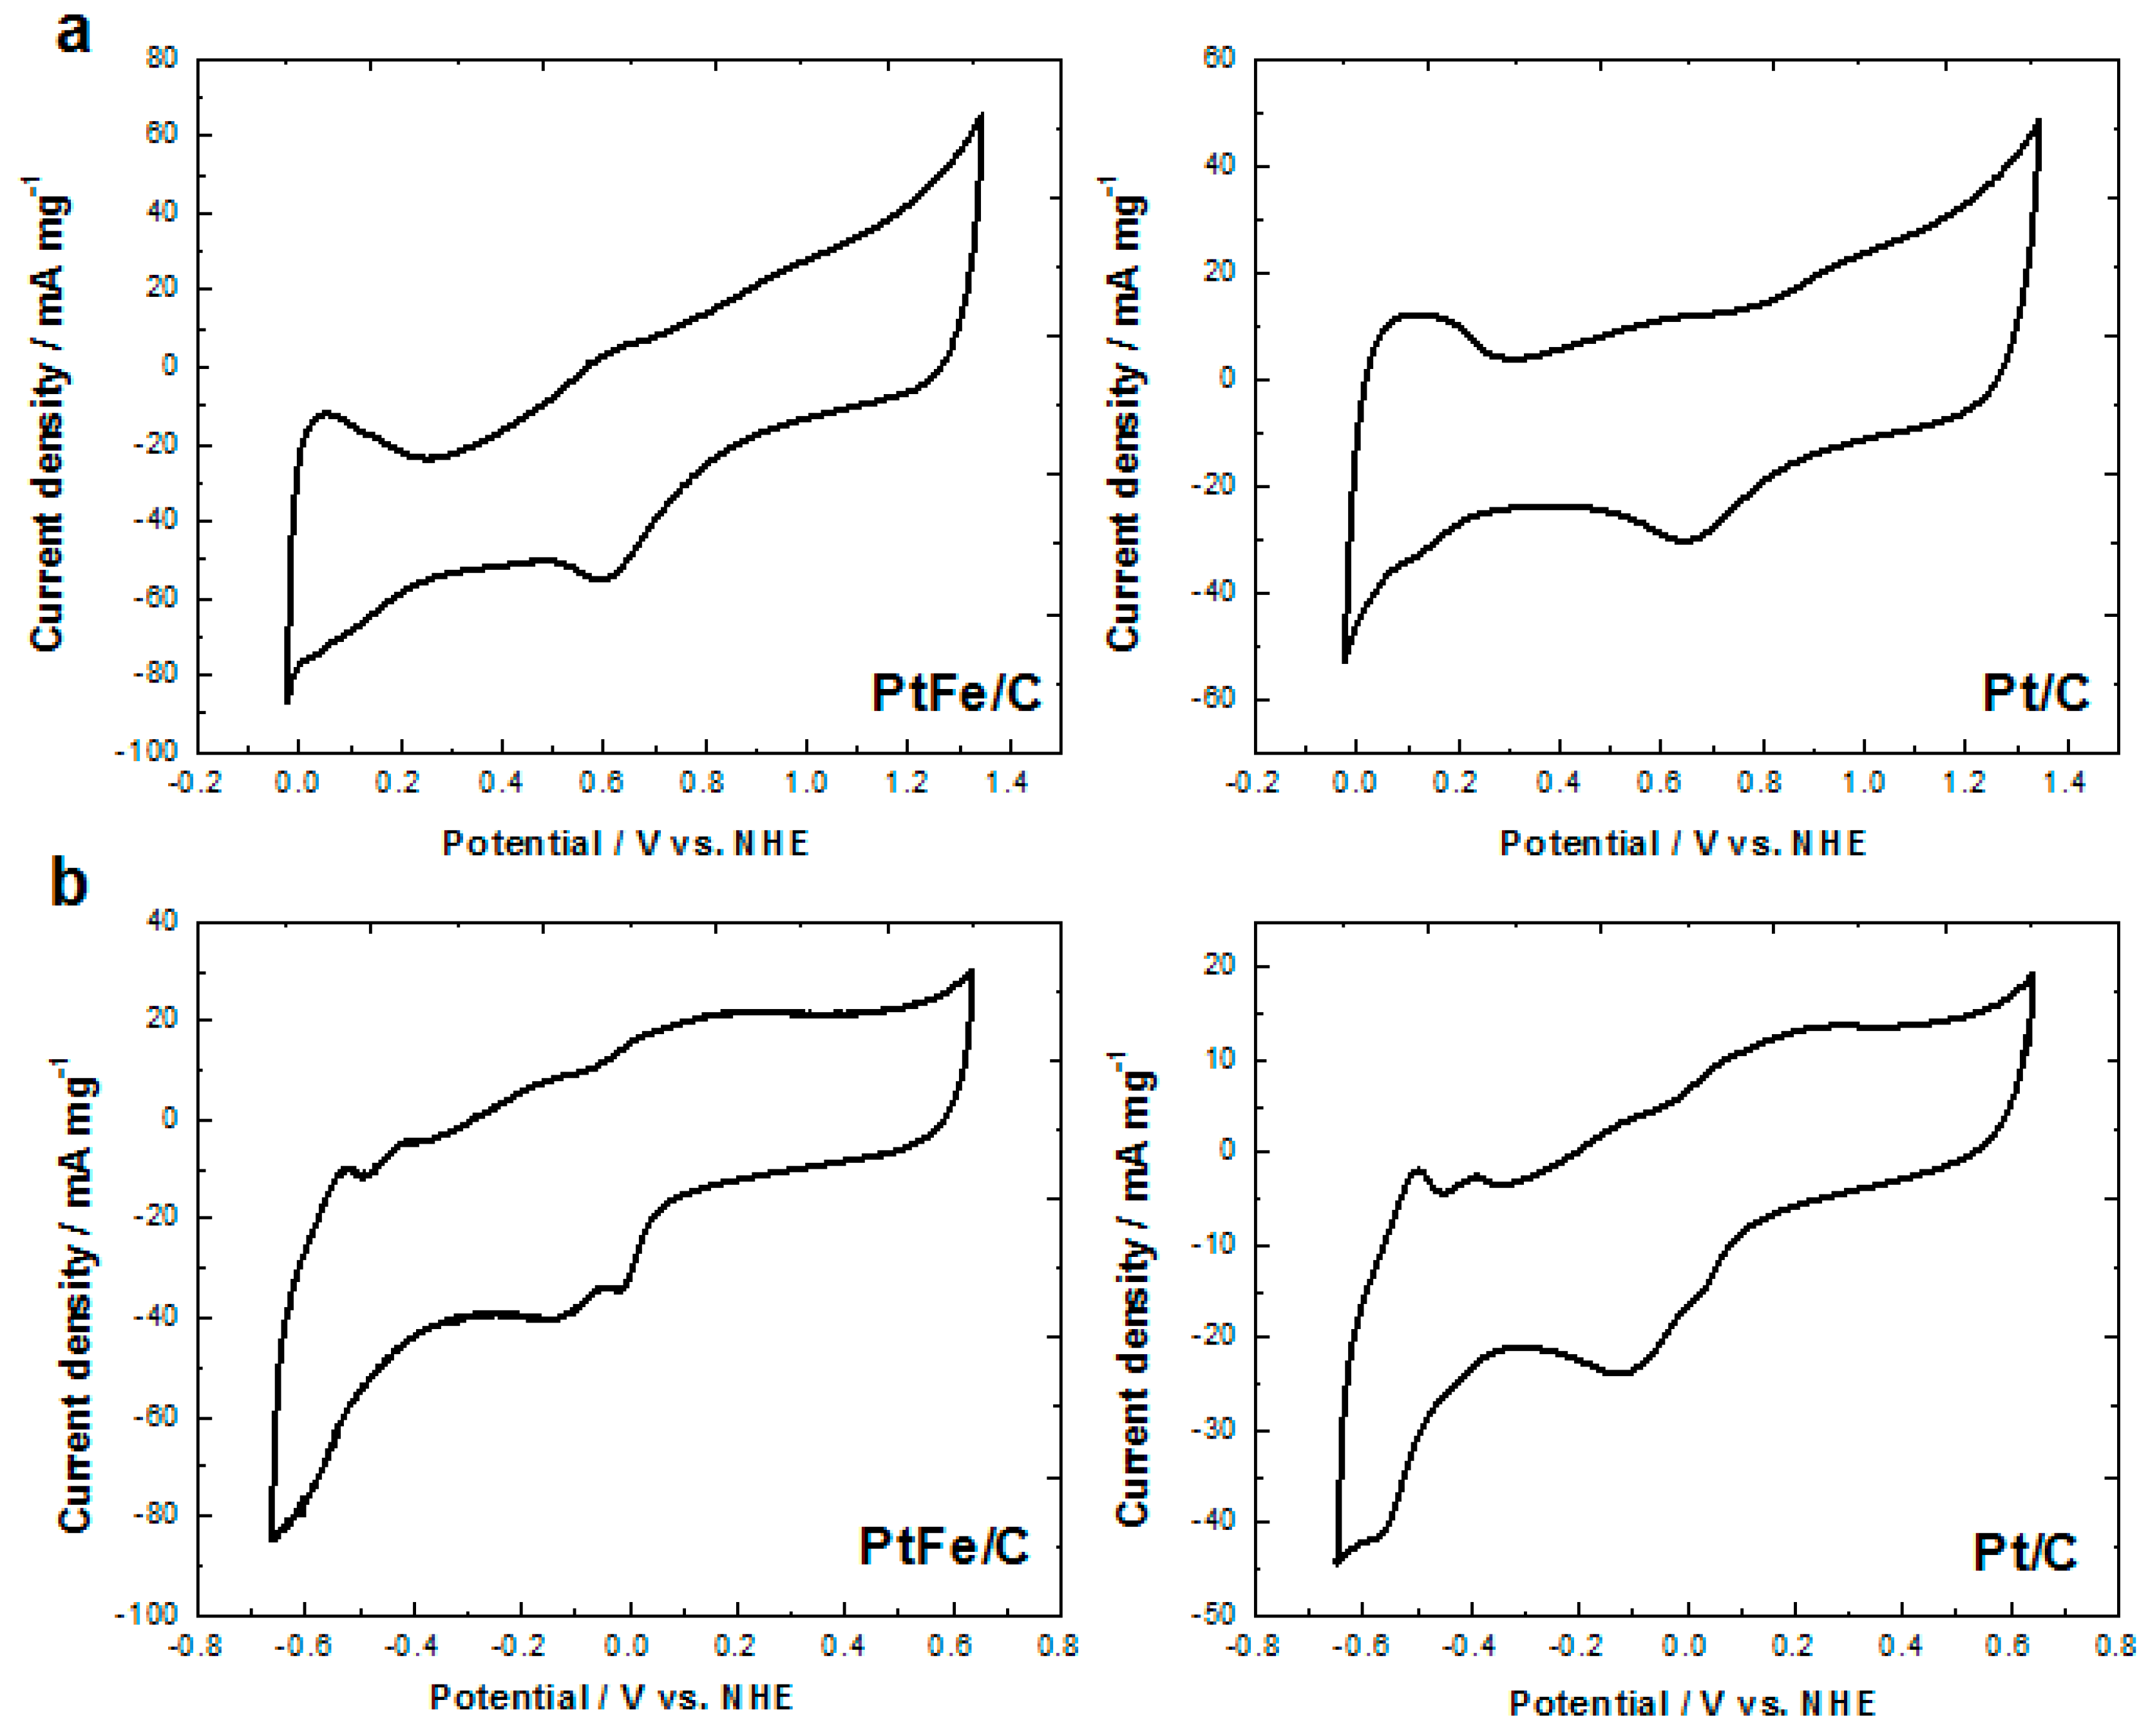
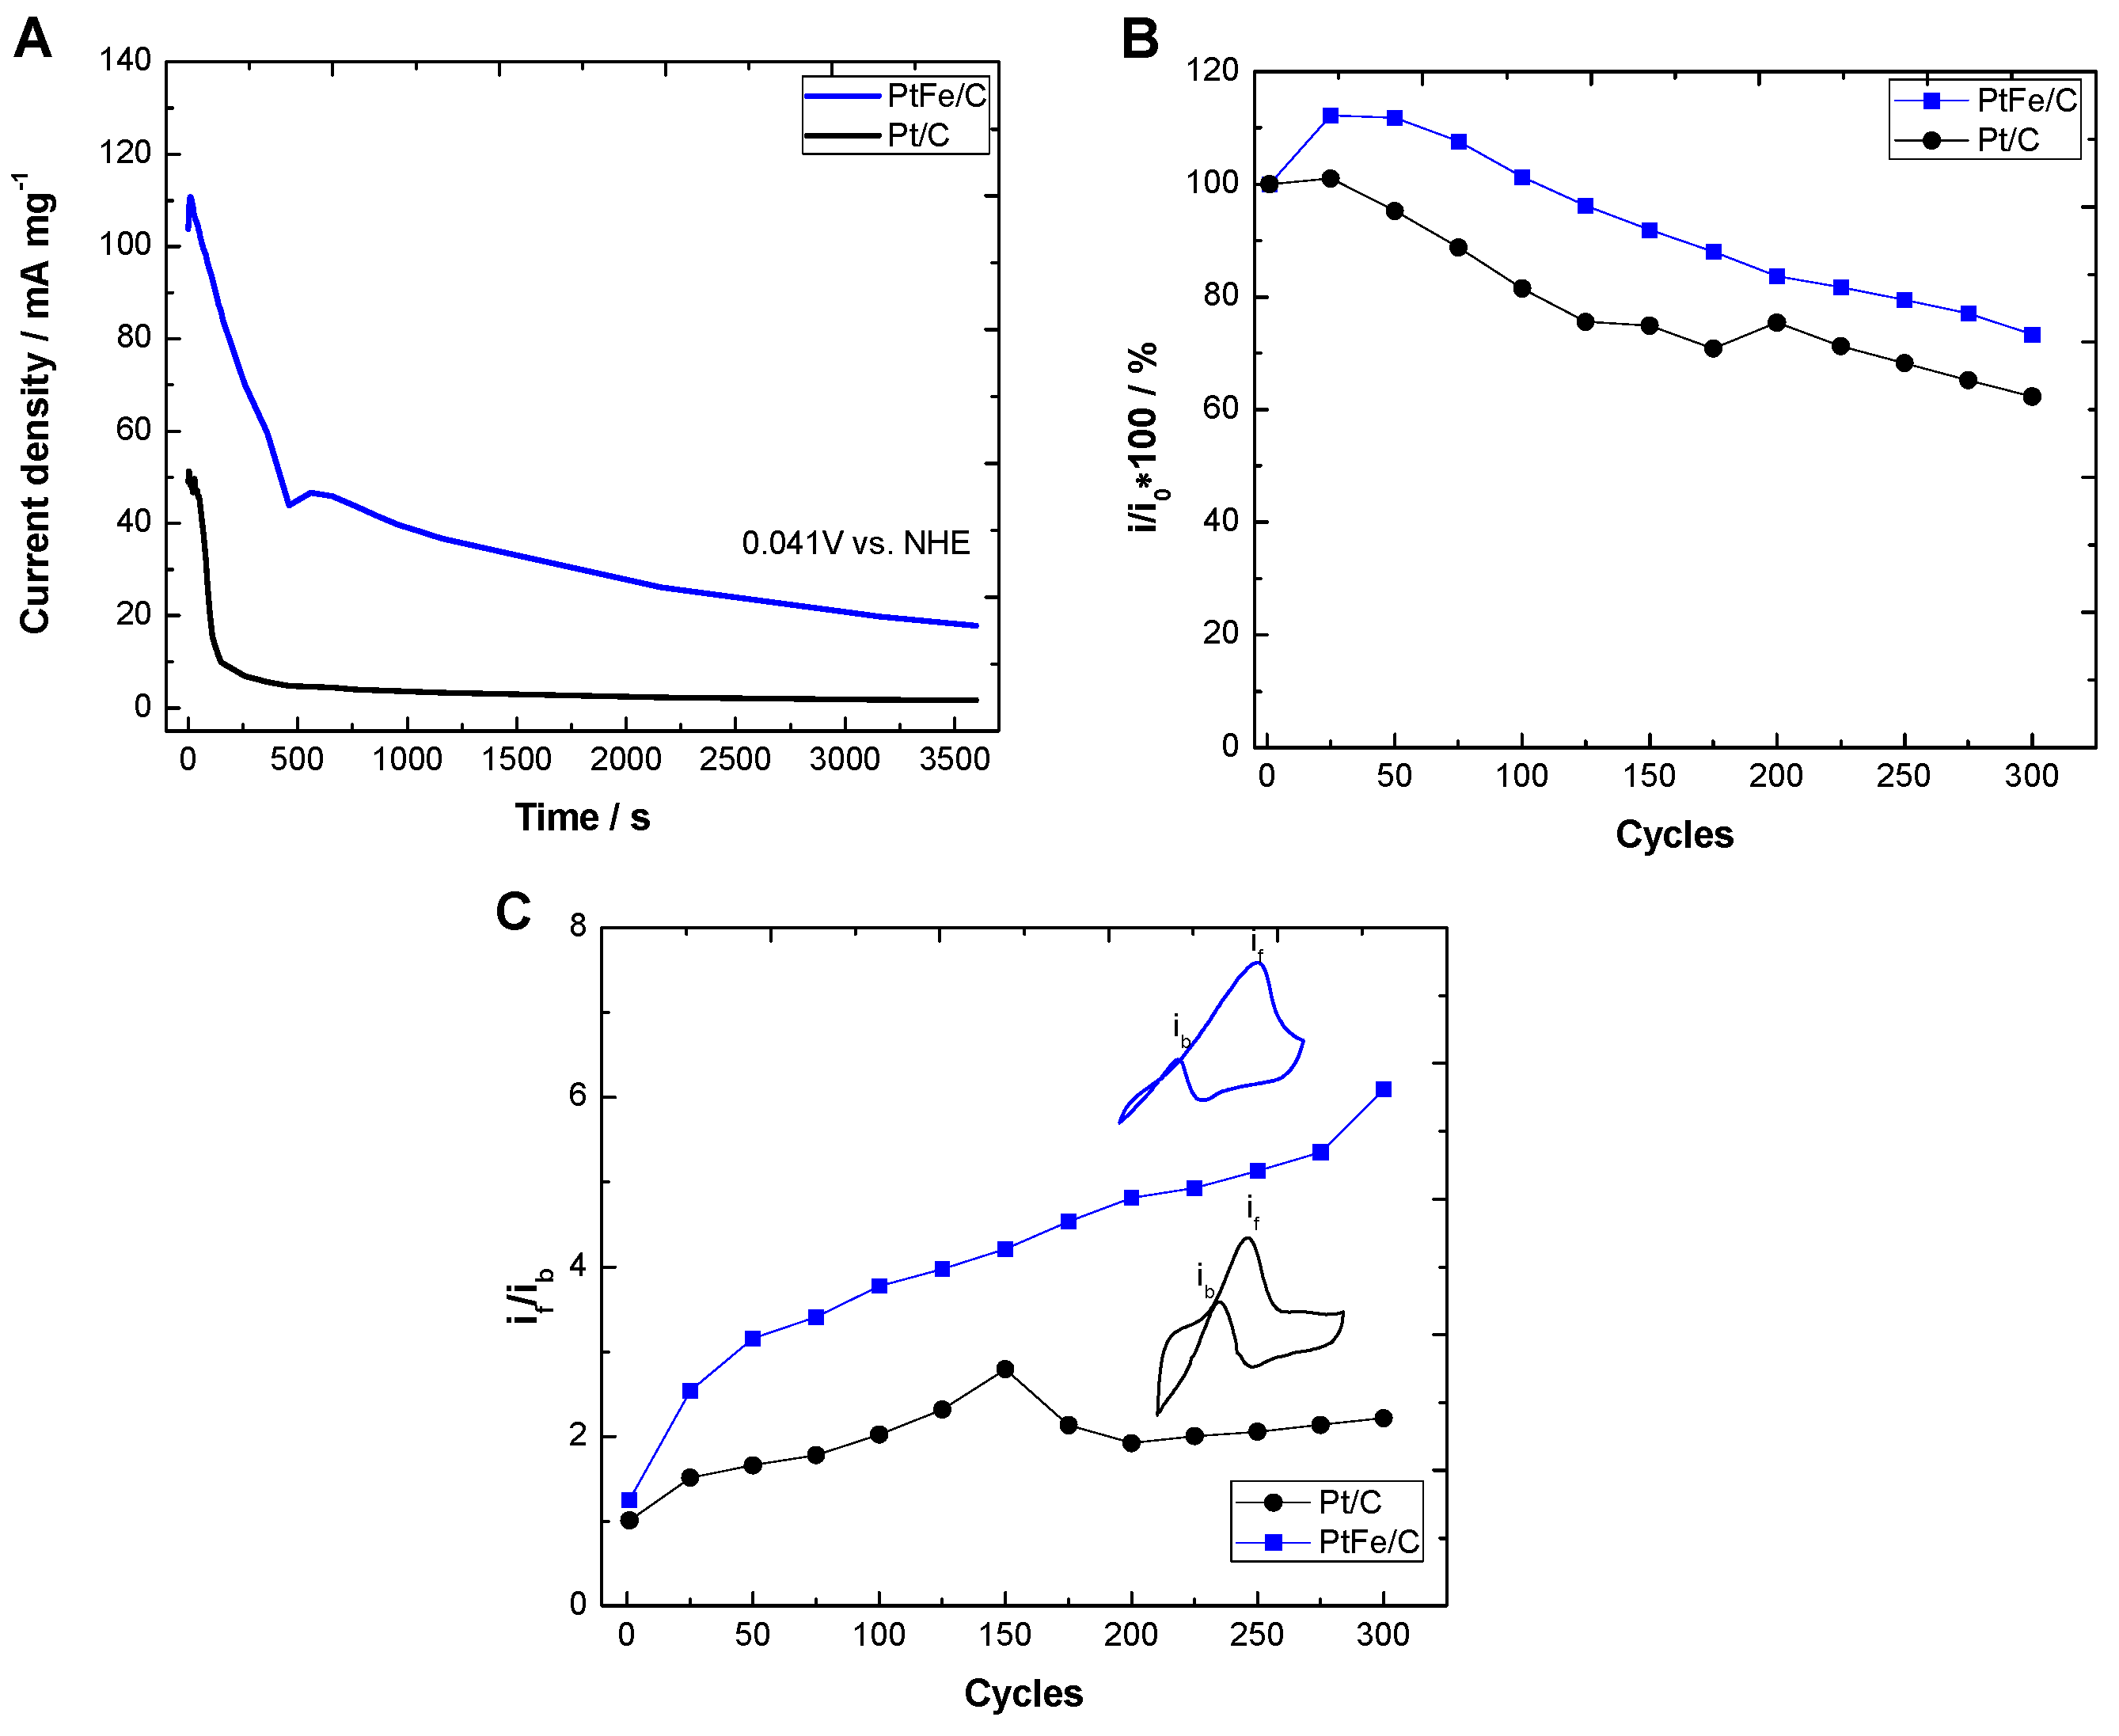
2.2. Electrochemical Characterization

The electrochemical characterization consisted of obtaining the electrochemical profiles by cyclic voltammetry in alkaline and acidic media for both Pt/C and PtFe/C nanocatalysts. The resulting voltammograms are presented in Figure 5a. As can be observed, both materials showed high capacitance, which can be attributed to the low metal content in the catalytic inks (<3.7% of the total mass). Three typical regions of Pt-based materials were identified in acidic medium for both catalysts: (I) the hydrogen adsorption/desorption (from 0 to 0.2 V vs. normal hydrogen electrode (NHE); (II) the capacitive region (from 0.2 to 0.45 V vs. NHE), and (III) the region related to the formation of Pt oxides and their respective reduction occurring between 0.45 to 1.3 V vs. NHE [41]. Specifically, the reduction peaks of Pt oxides were located at 0.65 V for Pt/C and at 0.6 V for PtFe/C, and this shift in potentials is frequently observed for alloyed materials [42,43]. In this particular case, the shift towards a more positive potential can be related to a decrease in the desorption free energy of Pt–OH, Pt–O or Pt–O2 species due to the effect of iron in the Pt lattice [44]. Additionally, slight signals related to iron in the PtFe/C catalyst were observed, which is probably related to its low mass content compared with that of Pt (9-fold higher in mass content). Current densities associated to the hydrogen adsorption/desorption zone are negatives for PtFe/C and Pt/C (Figure 5a). In addition, the form of the cyclic voltammogram of PtFe/C shows ohmic resistance. These behaviors are associated to the presence of remnant PVP from the synthesis procedure due to it is hard to remove. In a previous work, we observed that PVP causes ohmic resistances and interferes in observing the electrochemical profile of noble metals; however, we report that PVP is removed after electrochemical cycling in acid and basic media [45].
In alkaline medium (Figure 5b), both materials showed the typical electrochemical response of Pt-based materials. The reduction of Pt oxides in Pt/C is carried out at −0.11 V vs. NHE (Figure 5b-right). Nevertheless, PtFe/C exhibited two reduction peaks, one at −0.02 V vs. NHE and a second at −0.11 V vs. NHE. The first small peak (−0.02 V) is related to the reduction of Fe oxides formed in the forward scan [46], corresponding to free Fe nanoparticles that were not alloyed with Pt. The second peak (−0.11 V) was attributed to the further reduction of Pt oxides from the PtFe/C catalyst.
The evaluation of the electrocatalytic activities of PtFe/C and Pt/C nanocatalysts for ethanol oxidation as function of the ethanol concentration is presented in Figure 6a,b, respectively. Pt/C showed a maximum current density of 229 mA·mg−1 Pt when 0.5 M ethanol was used (Figure 6b), and this current was 80% higher than the maximum current density obtained in the presence of 0.1 M ethanol. This can be attributed to the saturation of Pt-active sites because of inefficient reaction kinetics. Furthermore, the employment of 0.5 M and 1 M ethanol solutions had no effect on the oxidation potential compared with the value obtained at 0.1 M. In the case of PtFe/C, 814 mA·mg−1 Pt was the maximum current density obtained in the presence of 1 M ethanol. An increase in the ethanol concentration resulted in increases in the current densities of 13% going from 0.1 M to 0.5 M and 32% going from 0.1 M to 1 M ethanol. Additionally, the comparison between the electrocatalytic activity of Pt/C and PtFe/C is shown in Figure 6c.
First, it is observed that both materials showed similar oxidation potentials with 0.1 M ethanol (−0.33 V vs. NHE), indicating that the incorporation of iron into the platinum lattice had no adverse effect on the reaction. On the contrary, it has a positive effect on the maximum peak current density. Therefore, the active sites of the electrocatalyst consist of metallic Pt tightly bonded to the Fe oxide, and this close bond modifies the structure and electrochemical response of the catalyst. This small addition of iron to the platinum lattice (approximately 10%) meaningfully increased the current density from 206 to 814 mA·mg−1 Pt with 1 M ethanol (almost 4-fold higher). This can be related to the decrease in the adsorption strength of the adsorbed oxygen species due to the presence of Fe2+/Fe3+ species [44], as was observed in the acidic electrochemical profile. In this case, Fe2+ species present in the catalyst could help to desorb CO and other carbonaceous species from Pt, cleaning the surface and hence allowing the oxidization of fresh ethanol molecules to enhance the reaction kinetics [30]. This ability to remove by-products can be used as an indicator of the stability of nanocatalysts. In this manner, the stabilities of Pt/C and PtFe/C were tested by the following: (I) chronoamperometry; (II) comparing the peaks of the maximum current density as function of cycling; and (III) through evaluation of the poisoning tolerance to the adsorption of carbonaceous species by dividing the forward peak current density (If) by the backward peak current density (Ib) [47,48,49], with these results illustrated in Figure 7.
Chronoamperograms of Pt/C and PtFe/C (Figure 7a) were obtained at the peak with the maximum current density (0.0241 V vs. NHE, 1 M ethanol) for 3600 s. The exponential drops exhibited by both nanocatalysts showed that both were controlled by diffusional transport. Pt/C showed a sharp drop after 150 s; meanwhile PtFe/C exhibited a gentler drop. Pt/C showed a constant current density of 3 mA·mg−1 Pt, whereas PtFe/C did not reach stabilization in the evaluated time period. However, it showed a current density of 18 mA·mg−1 Pt after 3600 s. Through this experiment, it was observed that PtFe/C showed a higher stability, and it can provide a 9-fold higher current density than Pt/C. The stabilities of both nanocatalysts were also tested as function of cycling (Figure 7b). For this purpose, both materials were electrochemically cycled in the presence of 1 M ethanol in a potential range from −0.65 to 0.45 V vs. NHE for 300 cycles, taking the current density obtained at the 2nd cycle as the reference (I0). From this figure, it can be observed that both materials showed electrochemical activation by the effect of cycling, and for PtFe/C, the current density increased until the 50th cycle. In the case of Pt/C, the current density started to decrease after the 25th cycle, where this drop in current density compared with PtFe/C can be related to the deactivation of active sites because of the stronger adsorption of by-products. After 300 cycles, Pt/C exhibited an activity loss of 37.63% compared with 26.8% for PtFe/C. The activity losses can be majorly related to mass losses by catalyst removal, which was visually observed on the electrode surfaces. The analyses of the peak current densities between the forward and backward scans as a function of cycling are presented in Figure 7c. Two behaviors were found: the first, in which the If/Ib rate was lower than unity (If/Ib < 1), indicated high adsorption and re-oxidation of carbonous species formed in the forward scan. A second behavior corresponding to a higher rate (If/Ib > 1) was related to more efficient ethanol oxidation as well as a lower accumulation of carbonaceous species into the catalysts [48,49]. In this sense, it is shown in Figure 7c that the synthetic method proposed herein enables Pt and PtFe nanomaterials with good tolerance to poisoning to be obtained. Furthermore, the electrochemical cycling had a positive effect on PtFe, not only increasing the activity in terms of the current density but also enhancing the tolerance to poisoning, moving from an If/Ib of 1.23 to a rate of 6.24 at cycle 300.

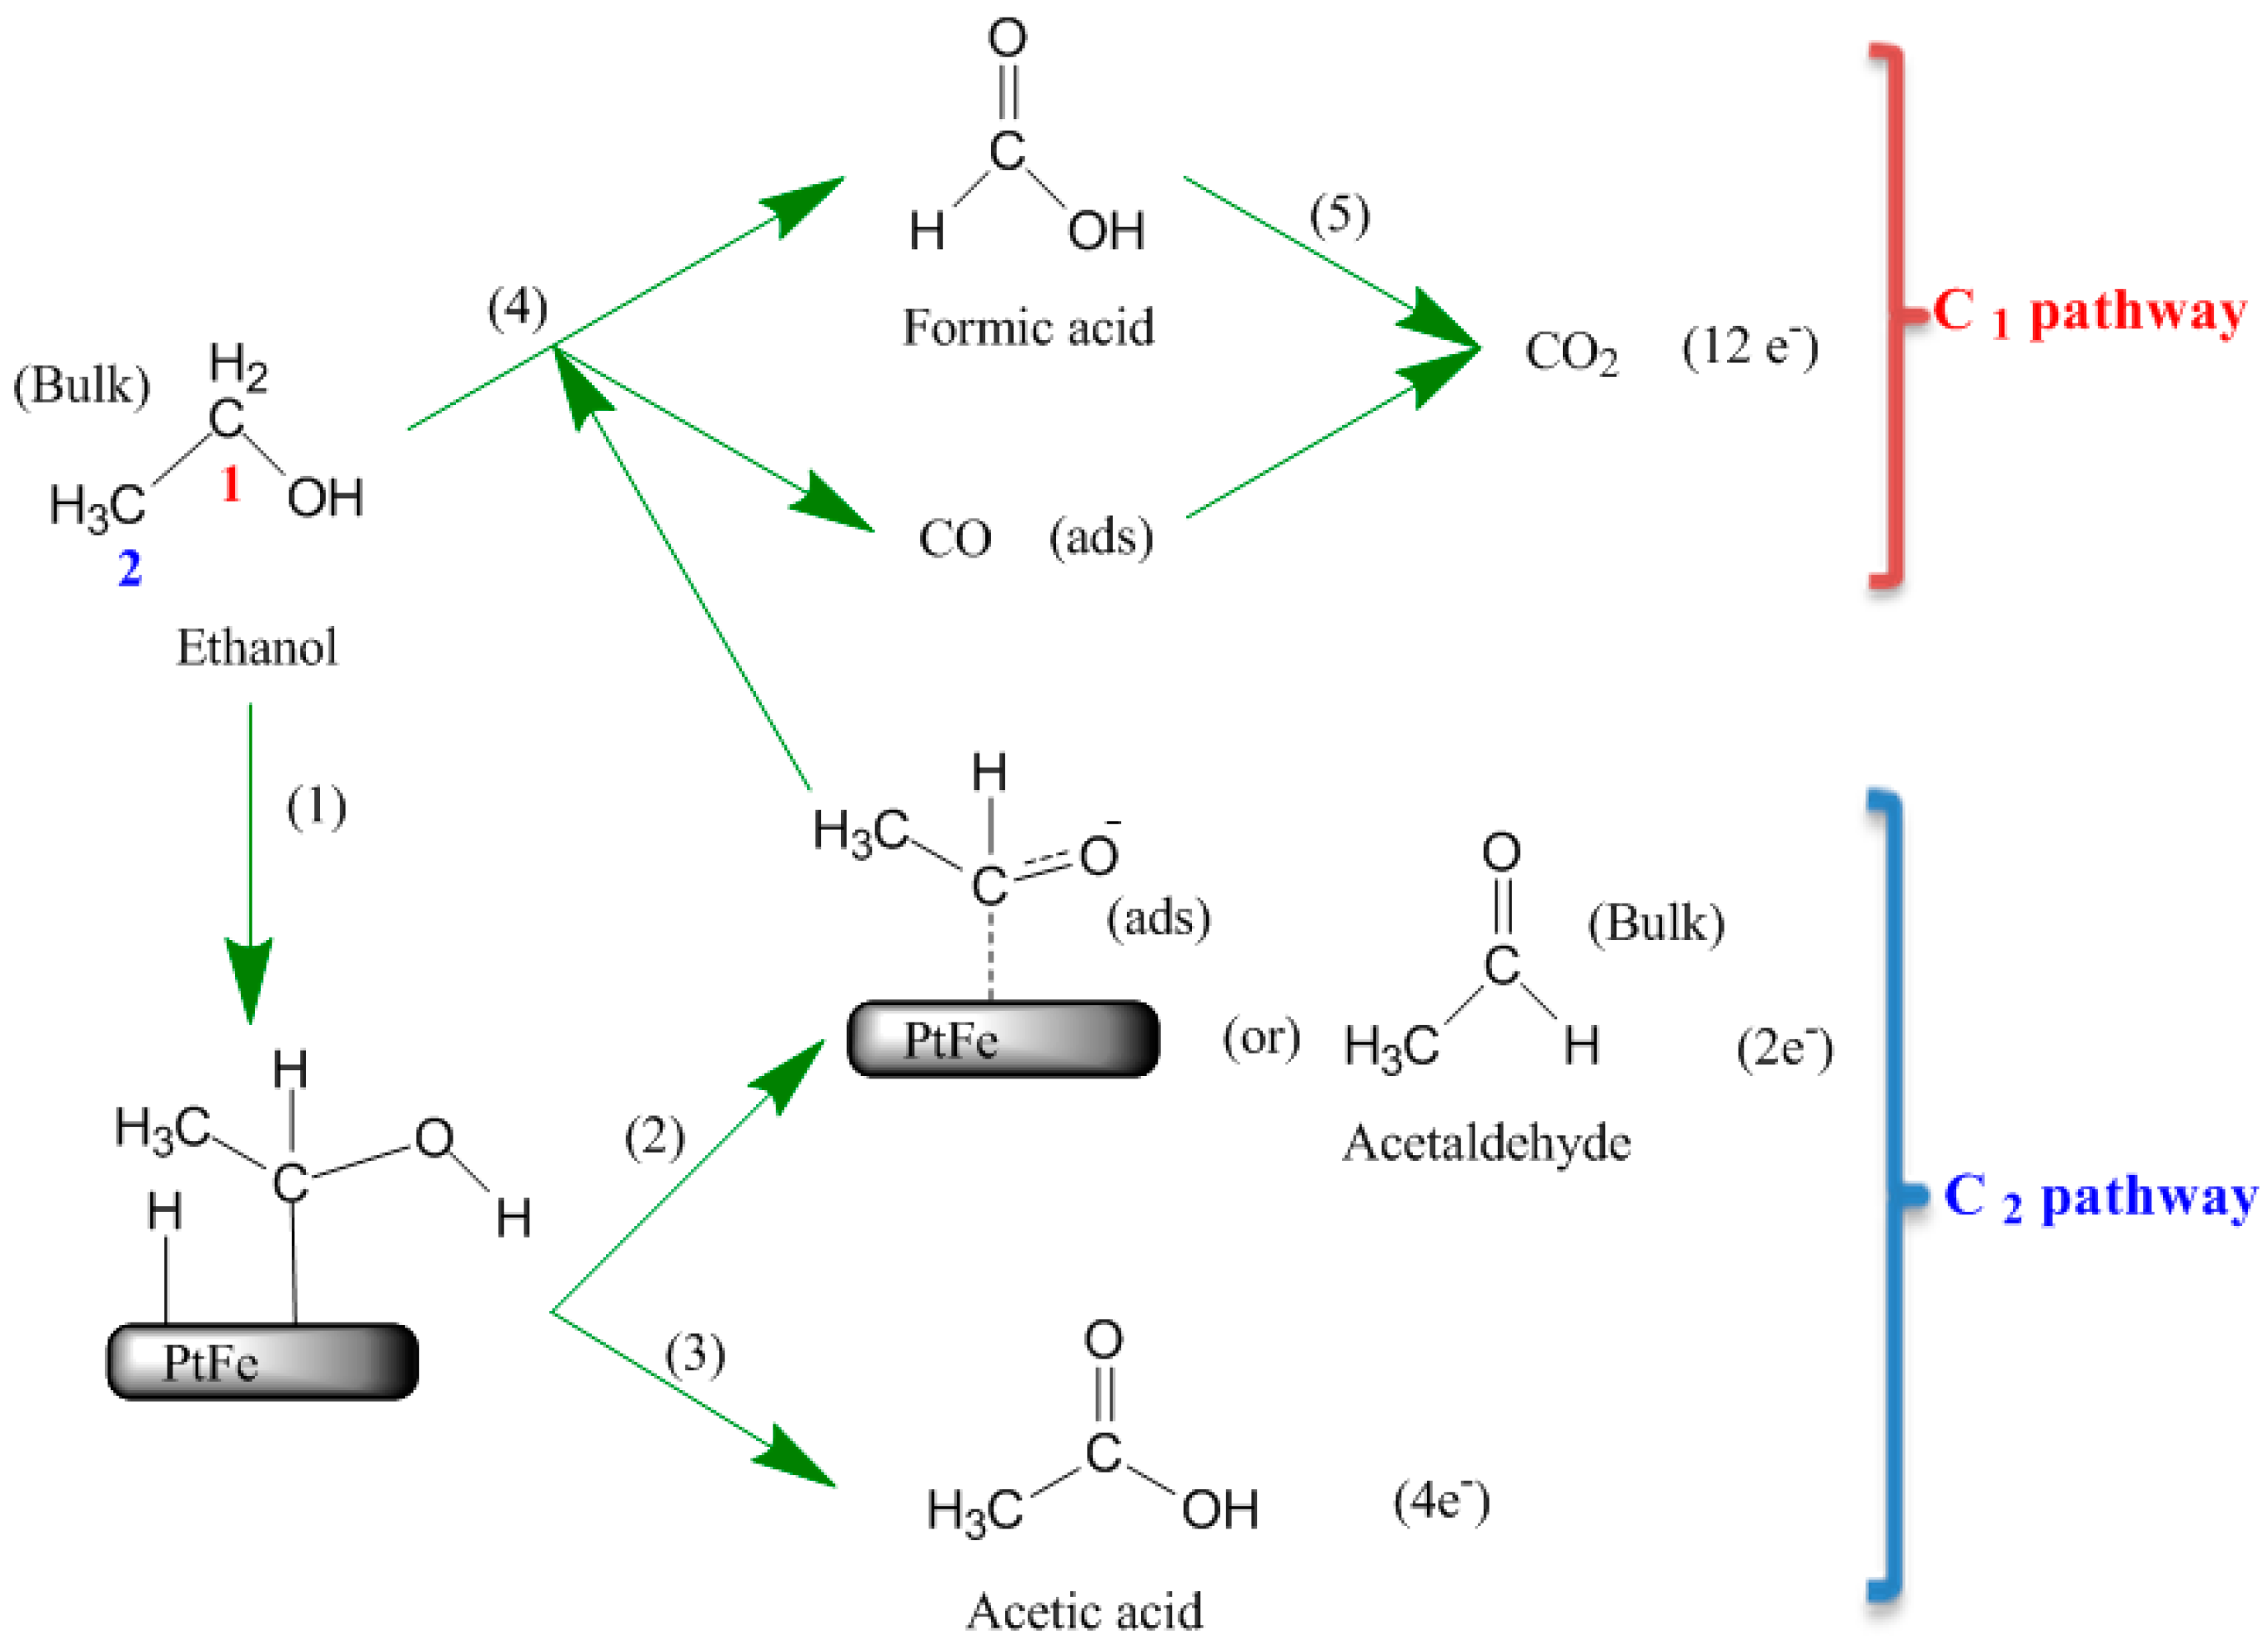
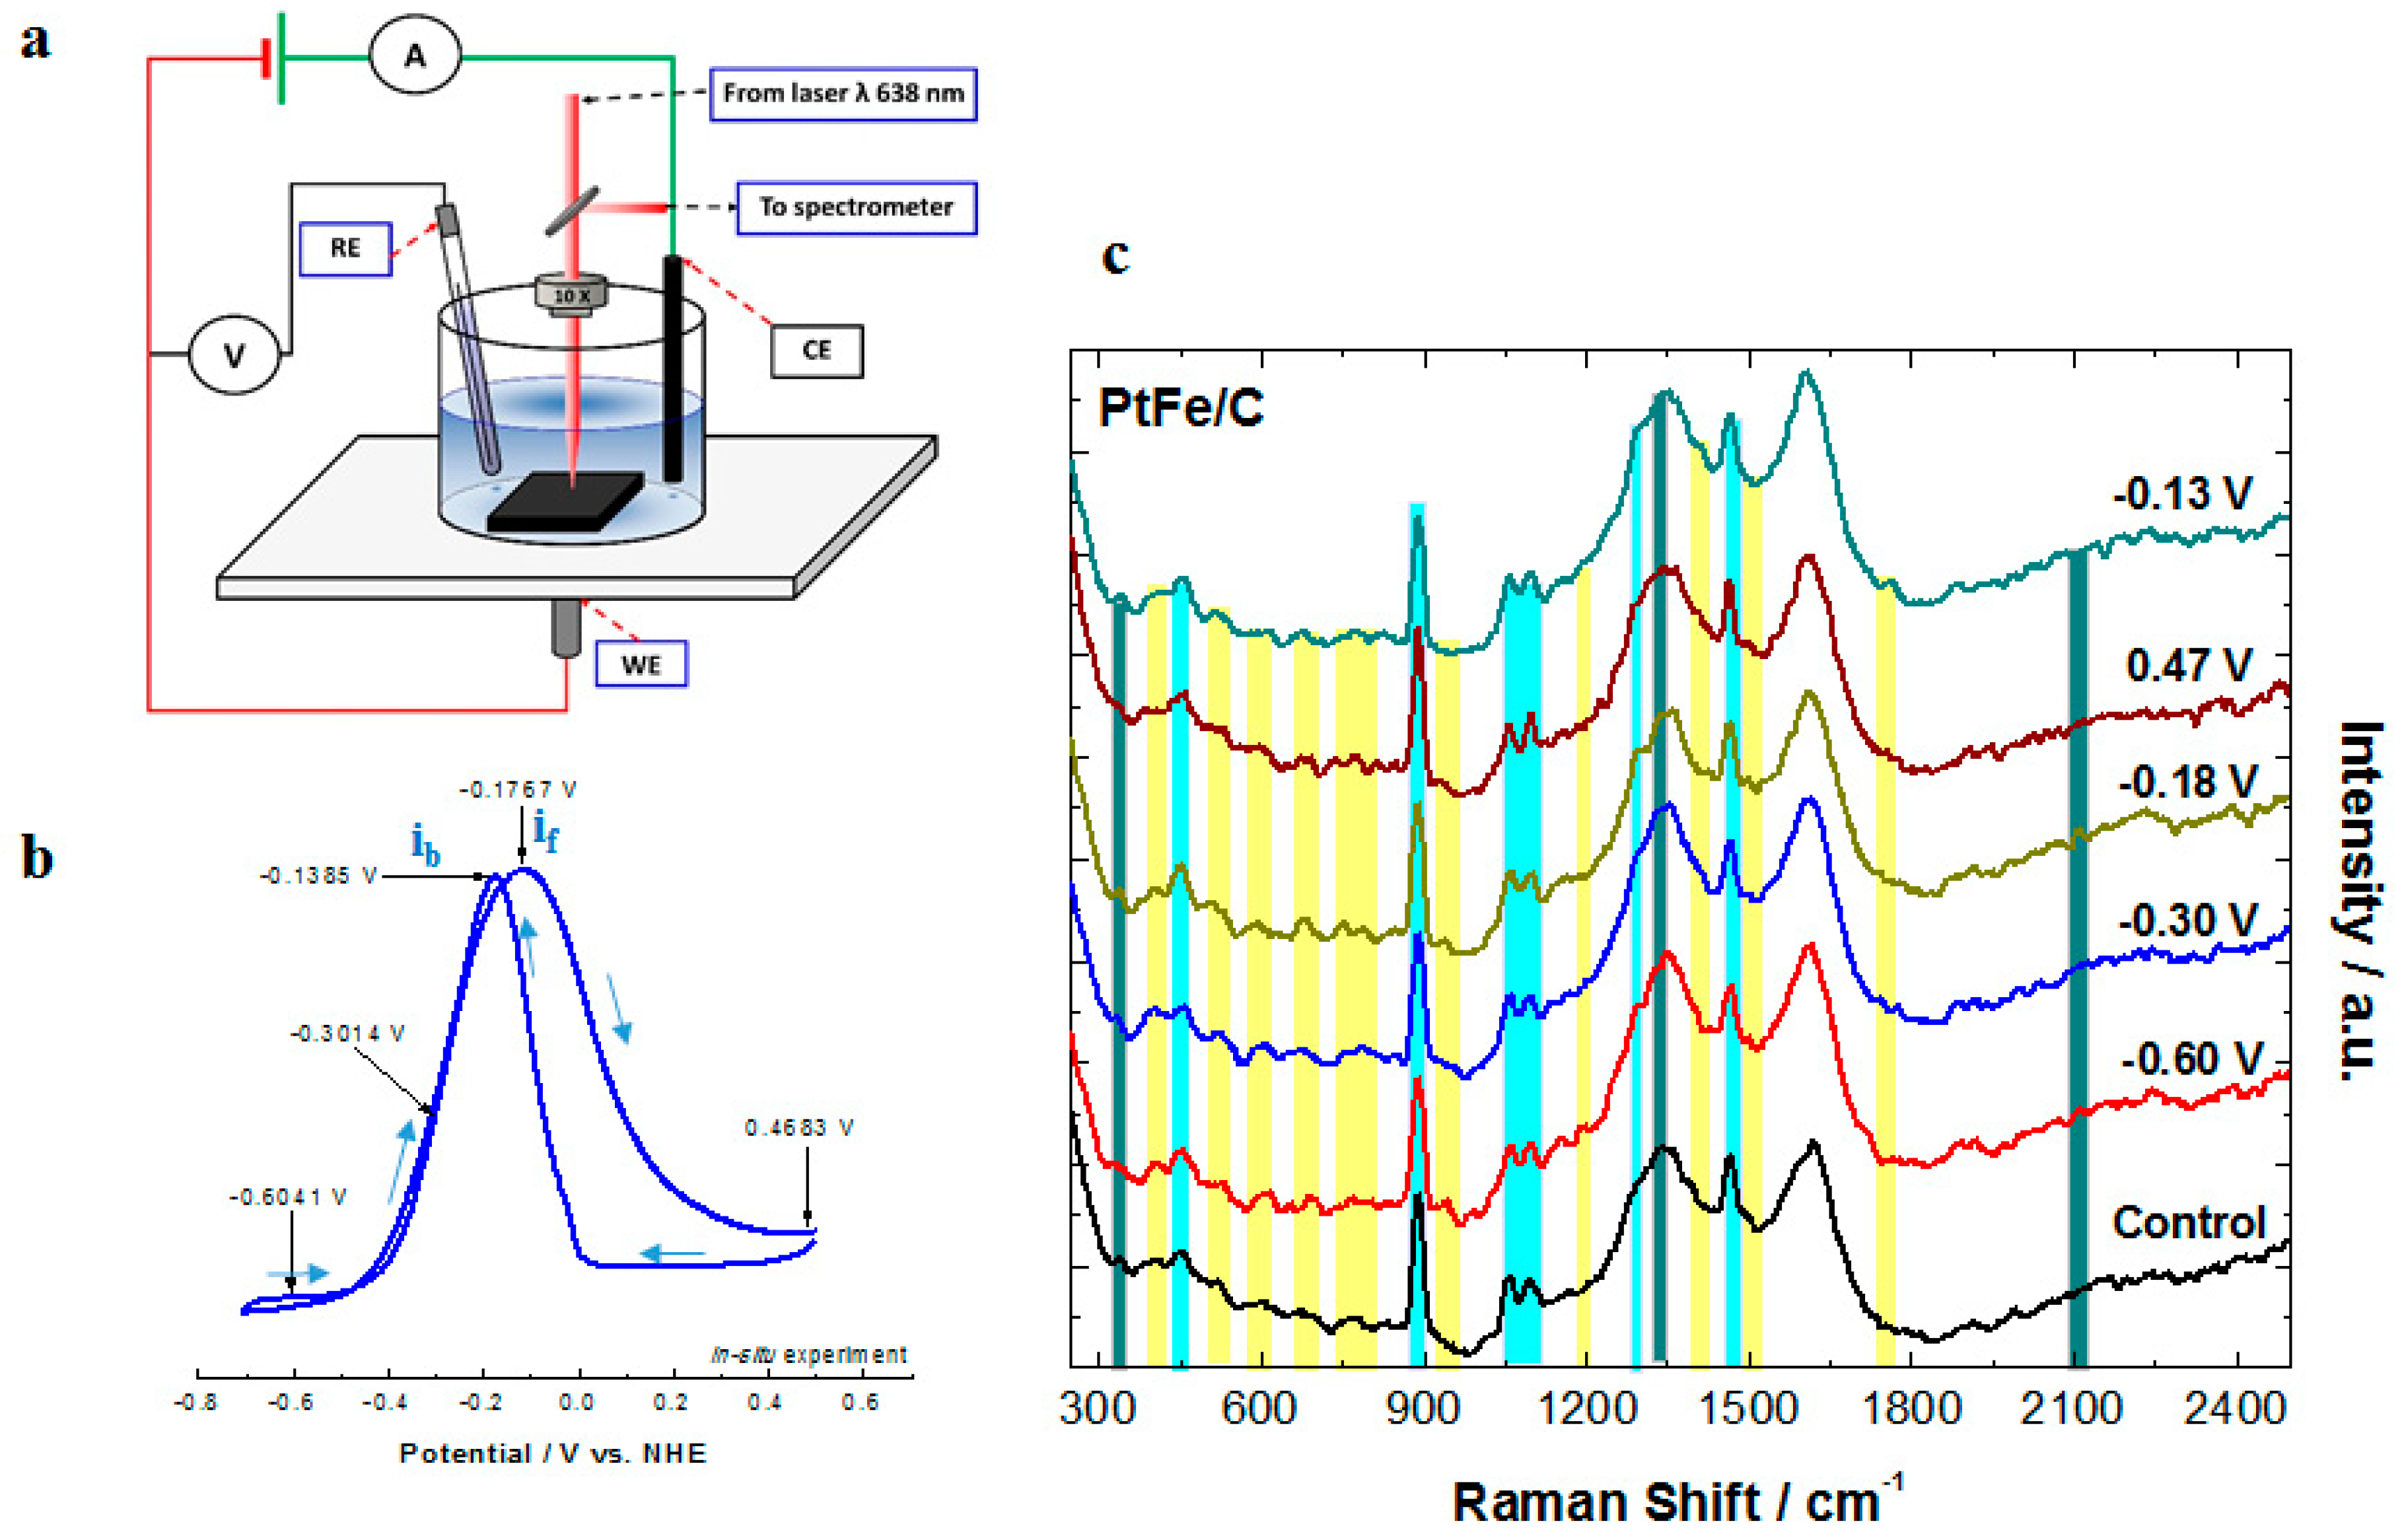
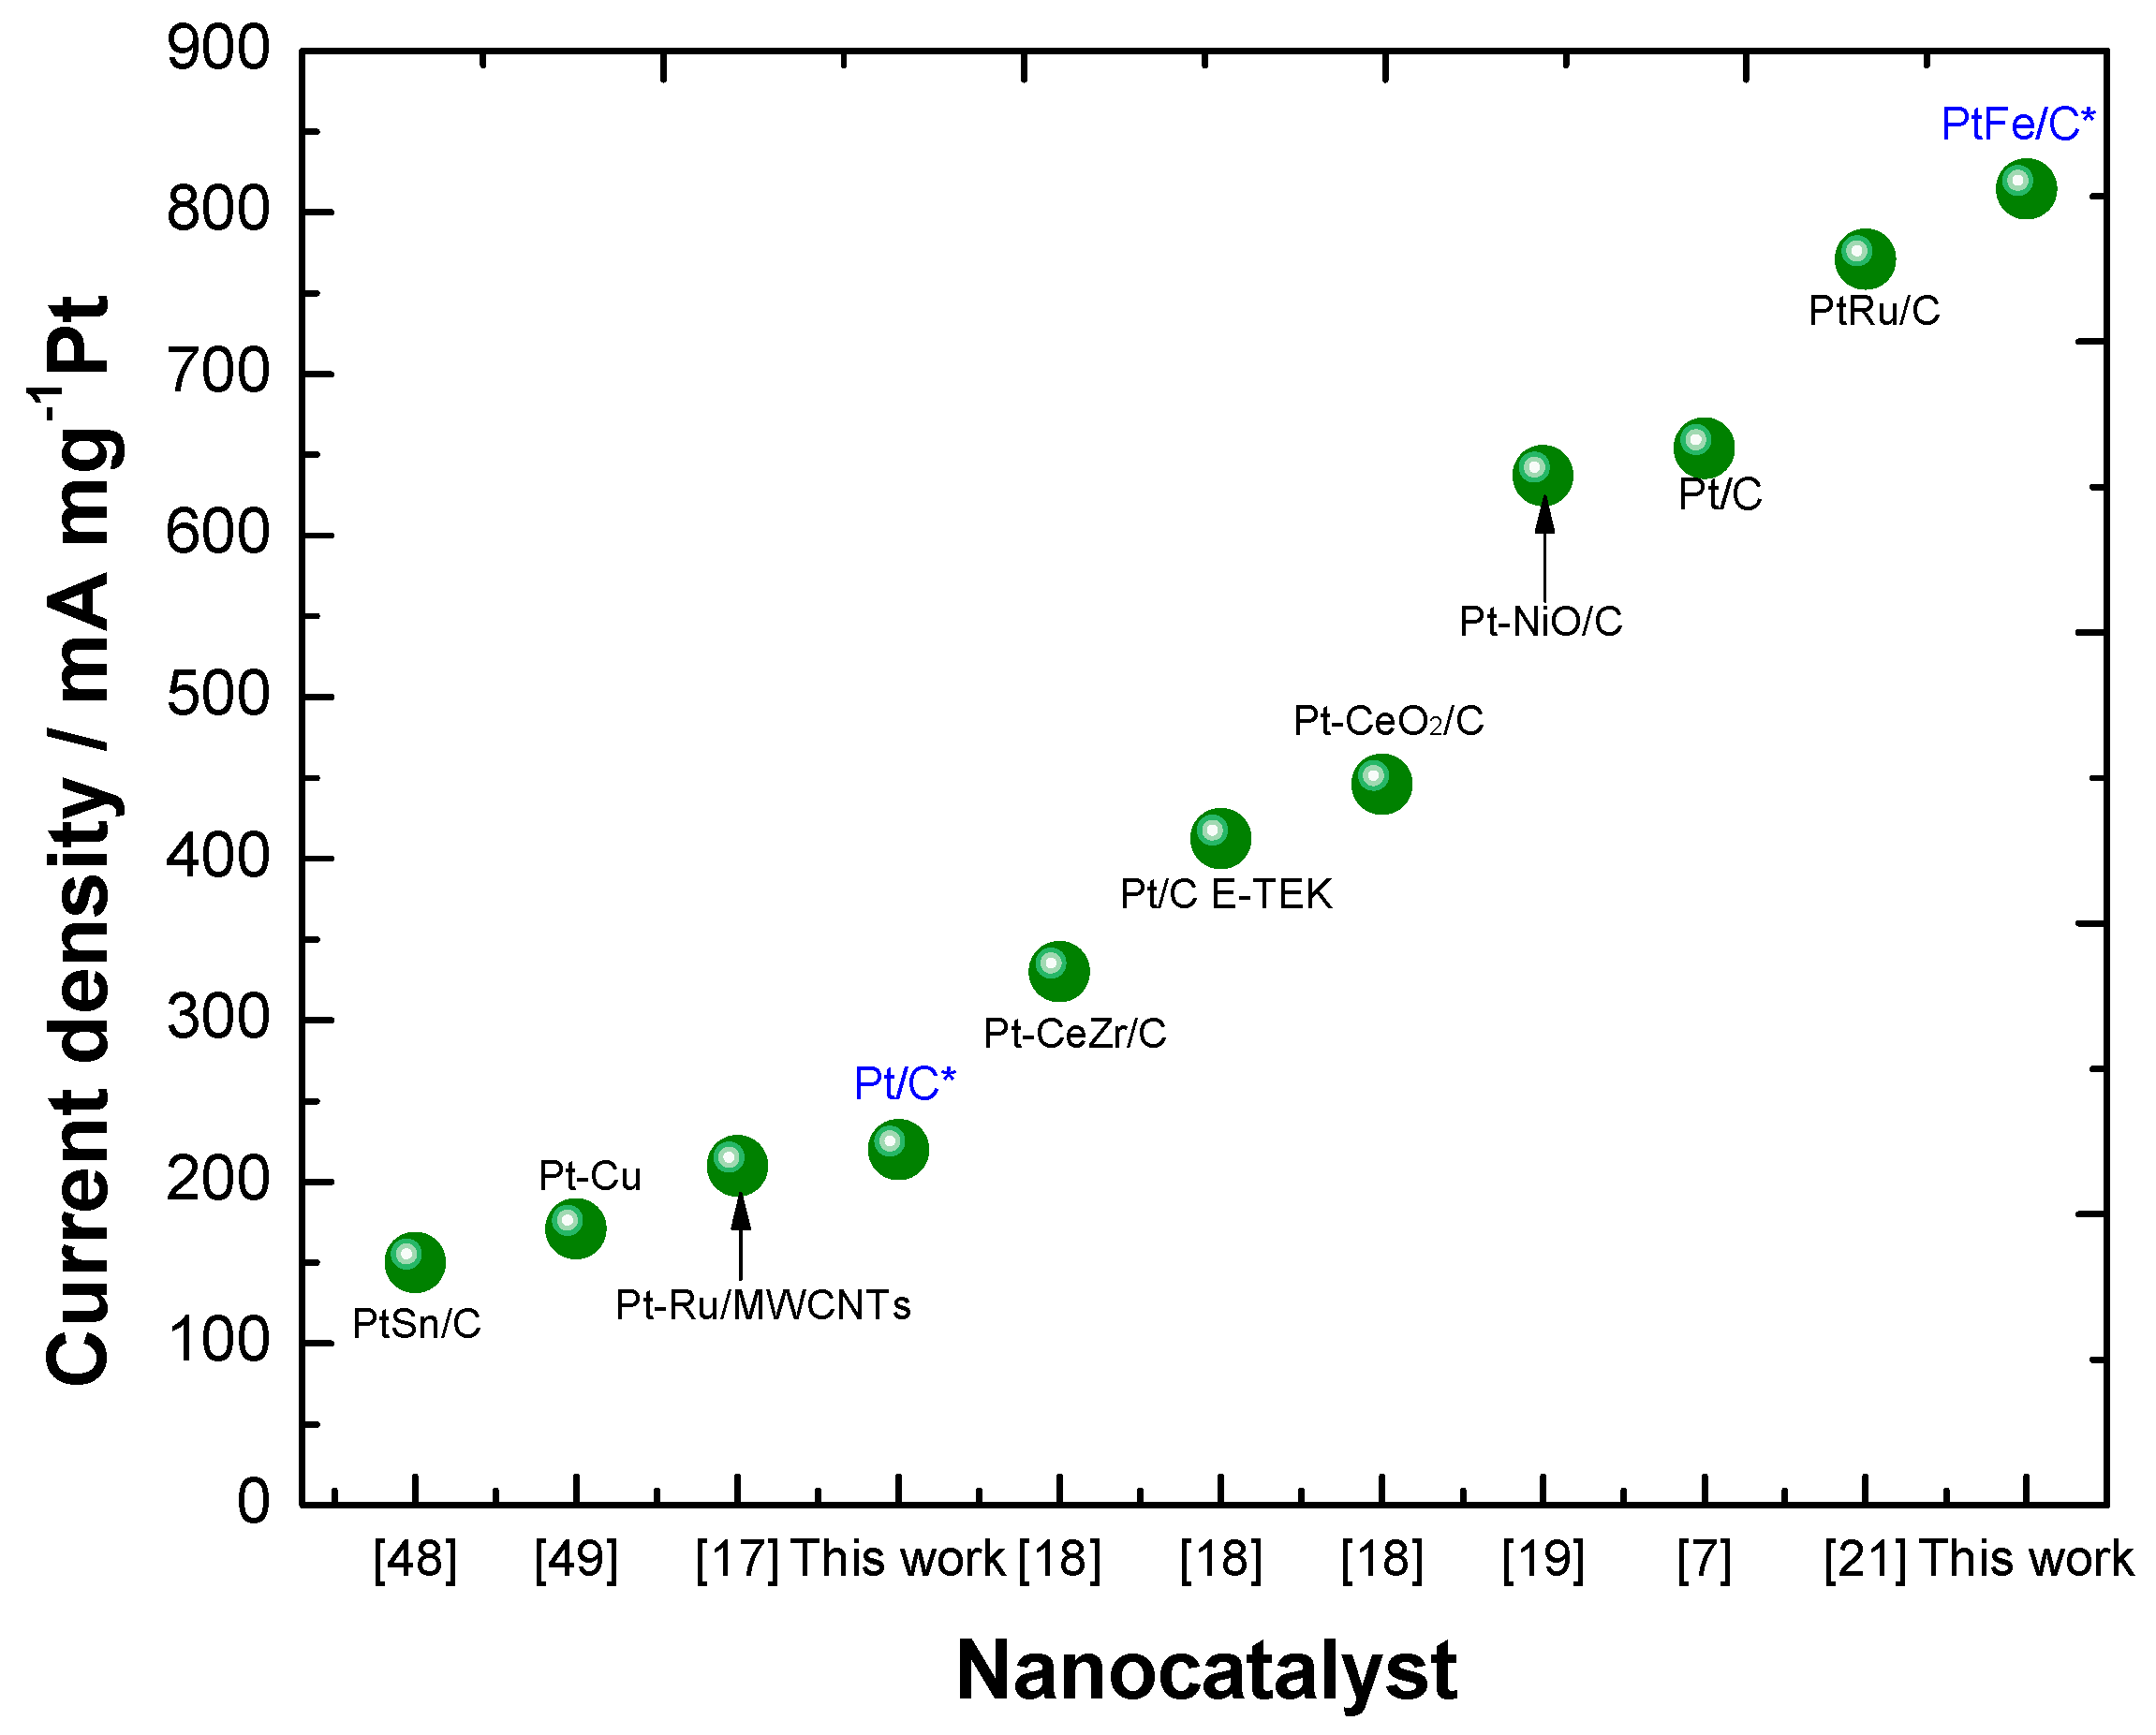
2.3. Surface Enhanced Raman Spectroscopy (SERS) Analysis

The in-situ cyclic voltammogram corresponding to ethanol oxidation on PtFe/C as electrocatalyst is shown in Figure 8. This voltammogram is practically identical to the obtained ex-situ with a higher scan rate (Figure 6a), indicating that PtFe/C has the same behavior at both scan rates. The control spectrum shown in Figure 8 was obtained using a 1 M ethanol solution in contact with PtFe/C without any potential imposing. In this spectrum, the D and G bands of Vulcan carbon used as support are observed at 1338 and 1621 cm−1 respectively [50].
The small band located at 339 cm−1 is associated to typical vibrations of metal oxides [51,52]. In addition, two bands were found in the typical metal-adsorbate vibrations region at 407 and 451 cm−1, being related to the adsorption of ethanol C1 on the PtFe surface [52]. The characteristic bands of ethanol are appreciated at 451, 892 and 1467 cm−1; the latter two bands correspond to νs(C–C–O) and δ(C–O–H) vibrations. Moreover, bands located at 1058 and 1097 cm−1, are related to νa(C–C–O) and γ(C–O–H) vibrations, respectively [51,52,53]. Bands corresponding to vibrations of ethanol C-H bonds are found between 2800 and 3000 cm−1; however, due to these had no significant changes during the electrochemical cycling, they were deliberately omitted from all plots. At the adsorption potential (−0.6041 V), the typical signals of ethanol are observed, appearing a new band at 1290 cm−1 associated to vibration of t(CH2) and δ(C–O–H) of ethanol [53]. At the half-wave potential, the intensity of the ethanol C1 adsorption band increased even in intensity to the C–C band located at 456 cm−1. This behavior is attributed to the electron transfer from ethanol to the catalyst to be chemically adsorbed (Scheme 1). Consequently, at this potential, more molecules of ethanol are chemisorbed on the catalyst than at −0.6041 V. In addition, new bands appeared at this potential. At 521 cm−1 is found the δ(C–C=O) band of acetaldehyde; while C–C vibrations of acetaldehyde or acetic acid are found at 604 and 670 cm−1. C–H (wagging) and CH3 (rocking) vibrations of acetaldehyde are detected at 788 and 847 cm−1 as well as C–O–H vibrations (1138 and 1168 cm−1). Bands related to ν(C=O) carbonyl groups were found at 1740 and 1775 cm−1. The intensity of these bands suggest that, at this potential, acetaldehyde is the predominant specie on the catalytic surface. At the forward peak potential, the band related to metal oxides (338 cm−1) became more intense compared with the control spectrum, while the band of metal-adsorbate (406 cm−1) decreased. At this potential, the δ(C–C=O) band of acetaldehyde appeared (at 507 cm−1), and bands of C–H (wagging) of acetaldehyde (752 cm−1), CH3 (rocking) of ethanol or acetaldehyde (845 cm−1) and CH3 (rocking) band of acetic acid (938 cm−1) are also observed. Ethanol is also oxidized to CO2 at this potential, finding bands at 1305 and 1360 cm−1. Moreover, a small band related to CO is found at 2110 cm−1.
Therefore, at the forward oxidation peak potential, the formation of metal oxides is promoted, enhancing the dehydrogenation process of ethanol and, improving the ethanol oxidation towards acetic acid and CO2 as main products (Scheme 1). From the voltammogram displayed in Figure 8, it can be observed that at 0.4613 V only non-Faradic processes took place. In this potential, the CO, CO2 and metal-adsorbate signals are diminished, and mostly bands of formic acid (692, 1229 cm−1, C–O–H), and acetaldehyde (736 and 775 cm−1 C–H wagging, 815 and 847 cm−1 CH2 rocking, 1123 and 1157 cm−1 ν(C–C) bands) are observed. The decrease on intensity of CO and CO2 bands would be associated to their desorption from the catalytic surface after their formation, considering the high diffusivity of gases in aqueous media [54]. While the permanence of acetaldehyde and formic acid would be associated to their proximity to the catalytic surface, due to they can diffuse into the bulk electrolyte. Finally, at the backward peak potential, the band related to metal oxides is newly observed associated with the renewal of catalytic sites. C–C band related to aliphatic changes of formic acid (515 cm−1) and bands of acetic acid (676 cm−1) and acetaldehyde (773 cm−1, C–H wagging) were observed. Additionally, CH2 and ν(C–C) vibrations of byproducts were also detected at this potential. CO and CO2 were hardly identified, only the band found at 1887 cm−1 (CO) was observed, indicating that, at this potential, the reduction of metal oxides and ethanol re-oxidation promotes the formation of formic acid as the main product.
With these results, the proposed ethanol electro-oxidation mechanism employing PtFe/C as catalyst is summarized in Scheme 1. The first step in the ethanol oxidation involves its dissociative adsorption, which is considered as one of the rate-determining steps for ethanol oxidation at lower potentials [55]. According with the Pletcher mechanism for the concentric adsorption, the organic molecule is dehydrogenated from C1 and simultaneously adsorbed on the catalytic surface [56]. Thus, according with SERS analysis, the PtFe/C nanocatalyst promotes the dehydrogenation at low potentials (Scheme 1, step 1), observing the C1 vibration band from −0.6 V and becoming more intense at −0.30 V. Furthermore, the ability to dissociate the ethanol molecule is confirmed with the bigger presence of acetaldehyde as the dissociative intermediate, being the predominant specie on the electrode as was found applying −0.30 V vs. NHE (Scheme 1, step 2). This ability to perform the dissociative adsorption of ethanol molecules and, the desorption of byproducts observed with the renewal of catalytic sites in the backward potential, allow the re-oxidation of freshly ethanol molecules, enhancing the reaction kinetics, explaining the high current density of PtFe/C shown in Figure 6. Moreover, the presence of metal oxides would provide oxygenated species to the reaction, where OH species could firstly facilitate the incomplete oxidation of ethanol to acetaldehyde/acetic acid and then, occurs the C–C bonding breakage allowing its oxidation towards formic acid (Scheme 1, steps 3 to 5).
Furthermore, a comparison between the activities found for Pt and PtFe with other values found in literature is presented in Figure 9. These materials have been selected because they were normalized in terms of milliamps per milligram of platinum. Additionally, they are presented as function of their maximum current density in an increasing order. Some materials with current densities lower than 150 mA·mg−1 Pt have been reported, but for clarity purposes, they were discarded. Moreover, a more complete comparison of the electrocatalytic activity presented by Pt-based, Pd-based and Pt-free materials for ethanol electro-oxidation was performed by Brouzgou et al. [57], where the highest current density was found for a Pd-based material.
It can be observed that the PtFe/C catalyst exhibits a current density higher than the obtained for a reported Pt–Ru catalyst, showing 814 mA·mg−1 Pt, demonstrating that abundant non-ruthenium based materials such as iron, can show excellent performance in activity and durability. Moreover, this current density value was obtained because of the ability of PtFe to desorb poisoning carbonous species from the platinum surface renewing the active sites to oxidize fresh ethanol molecules. This ability is associated with the presence of Fe oxides, which could provide oxygen and hydroxides to enhance ethanol oxidation allowing surface renovation.

3. Materials and Methods

3.1. Synthesis of Pt/C

Pt/C and PtFe/C were synthesized using an aqueous chemical reduction method. For Pt/C, polyvinylpyrrolidone (PVP, 0.1051 g, average mol. wt. 40,000, Sigma-Aldrich, St. Louis, MO, USA) and L-ascorbic acid (AA, 0.023 g, Sigma-Aldrich, St. Louis, MO, USA) used as the stabilizer and reducing agent, respectively, were mixed in deionized water (8 mL) to give Solution 1. Then, Solution 1 was heated to 80 °C in a three-neck round bottom flask connected to a reflux bath. Simultaneously, a second solution (Solution 2) was prepared mixing by chloroplatinic acid hexahydrate (ACS Reagent ≥ 37.50% Pt basis, 0.0568 g, Sigma-Aldrich, St. Louis, MO, USA) and sodium bromide (BioXtra ≥ 99.0%, 0.2498 g, Sigma-Aldrich, St. Louis, MO, USA) acting as the metal precursor and as an additive, respectively, into deionized water (3 mL). Solution 2 was added dropwise to Solution 1 when it reached 80 °C. The resulting mixture was magnetically stirred. After 90 min, ascorbic acid (0.023 g) dissolved in water (0.5 mL) was added. Thirty minutes later, sodium borohydride (98%, 0.002 g, J. T. Baker, Center Valley, PA, USA) dissolved in water (1.5 mL) was also added to the solution. Both ascorbic acid and sodium borohydride were added as co-reductants to ensure a better conversion of Pt ions to zero-valent Pt. The resulting solution was kept stirring for 3 h. Then, 0.1 g of Vulcan carbon (XC-72R, Cabot, Billerica, MA, USA) was added, and the solution was stirred for another 30 min. Finally, the solution was washed several times with water and centrifuged at 4300 rpm for 20 min between each wash. The resulting powder was maintained in the oven at 100 °C overnight.

3.2. Synthesis of PtFe/C

In a typical synthesis of PtFe/C, PVP (0.1 g) and ascorbic acid (0.024 g) were mixed in water (10 mL, Solution 1). As for Pt/C, PVP and ascorbic acid acted as the surfactant and reducing agent, respectively. Then, 0.3 M KOH (86%, 1 mL, MACRON, Center Valley, PA, USA) was added to Solution 1 thus forming Solution 2. Afterwards, Solution 2 was heated to 90 °C in a three-neck round bottom flask connected to a reflux bath (interior temperature: 5 °C) and to nitrogen tubing to retain an inert atmosphere (99.999%, Infra, DF, Mexico). Simultaneously, a solution containing iron (II) sulfate heptahydrate (≥99.0%, 0.1516 g, Sigma-Aldrich, St. Louis, MO, USA) and sodium bromide (0.25 g) was prepared in 0.3 M KOH (3 mL) to give Solution 3. Solution 3 was added to Solution 2 once it reached 90 °C. The mixture of solutions 2 and 3 was magnetically stirred, and after 30 min, a solution of NaBH4 (0.003 g) dissolved in water (1 mL) was added dropwise. This solution was stirred for another 30 min. Afterwards, water (1 mL) containing H2PtCl6 (0.030 g) was added to the solution, and it was maintained under stirring for 1.5 h. After this time, NaBH4 (0.003 g) in water (1 mL) was again added to promote the complete reduction of metallic precursors, and the final solution was stirred for another 1.5 h. Finally, Vulcan carbon (0.1 g) was added to the solution, and it was stirred for 30 min. The resulting solution was then washed several times with deionized water and dried at 100 °C overnight.

3.3. Physicochemical Characterization

X-ray diffraction patterns were obtained using a D8 Advance diffractometer (Bruker-AXS, Madison, WI, USA) operated at 30 kV and 30 mA. X-ray fluorescence spectra were obtained using Bruker S2 PICOFOX equipment, a Mo tube and Ga as a standard at 50 kV and 600 µA. The thermogravimetric analyses (TGA) were performed on a SDT-Q600 balance (TA Instruments, Champaign, IL, USA). Nanoparticles were heated in an aluminum sample holder from room temperature to 800 °C with a heating rate of 10 °C min−1 under a nitrogen flow of 100 mL·min−1. HR-TEM images and EDX analysis were obtained using a high resolution JEM2200Fs + Cs transmission electron microscope (JEOL, Peabody, MA, USA) with spherical aberration correction for condensed lenses. Surface chemical characterization was performed by X-ray photoelectron spectroscopy in a Escalab 250Xi spectrometer (Thermo Scientific, Waltham, MA, USA) equipped with a six-channel (channeltron) detector. Photoelectrons were generated with a monochromatic Al Ka (1486.68 eV) X-ray source. Survey spectra of samples were collected over the 1100 eV range at a resolution of 1 eV per step, 100 ms and 150 eV of pass energy. High-resolution spectra were collected for the chemical species of interest at a resolution of 0.1 eV per step and 20 eV of pass energy. All measurements were done in ultra-high vacuum conditions (10−10 torr).

3.4. Electrochemical Characterization

The electrochemical characterization consisted of performing cyclic voltammetry in 0.5 M H2SO4 and 0.3 M KOH as electrolytes. Catalysts were electrochemically cycled during 10 cycles in alkaline medium before testing their electrocatalytic activities. To this purpose, a three-electrode electrochemical cell was used, and the experiments were conducted on a PC4/FAS1 potentiostat/galvanostat (GAMRY, Warminster, PA, USA). A saturated calomel electrode was used as the reference electrode, and a graphite rod was used as the counter-electrode. Hg/Hg2SO4 sat. K2SO4 was used as the reference electrode for all experiments carried out in acidic medium. Glassy carbon plates (1.22 cm2, SPI® Instruments, West Chester, PA, USA) polished until a mirror finish was achieved and cycled in sulfuric acid and used as the working electrodes. Pt/C and PtFe/C were deposited on glassy carbon plates by adsorption through catalytic inks. These inks were prepared using 100 µL of isopropanol (≥99.5%, BDH, Radnor, PA, USA) as dispersant and 10 µL of Nafion 117 (5%, Sigma-Aldrich, St. Louis, MO, USA) as binder; these quantities were used per milligram of catalyst. Four layers of catalytic inks were deposited on the glassy carbon electrodes; the first layer was 30 µL, and the other three were 20 µL. For determining the electrocatalytic activity, the same electrochemical configuration was used. Additionally, ethanol (99.91%, Faga Lab®, Mocorito, Sinaloa, Mexico) was tested at different concentrations in alkaline medium (0.3 M KOH), and the reported voltammograms corresponded to the 10th cycle.

3.5. Surface-Enhanced Raman Spectroscopy Experiments

Surface-enhanced Raman spectroscopy (SERS) analyses were conducted using a XploRA spectroscope (HORIBA, Villeneuve d'Ascq, France) equipped with a CCD detector and a BX41 microscope (Olympus, Tokyo, Japan), using a 20 mW laser with 638 nm as the excitation line. The laser beam was focused through an Olympus 10× microscope objective and it was positioned at 1 cm in distance from the electrode surface. In addition, the holographic grating, slit and confocal hole of the system were 1200 g·mm−1, 100 µm and 300 µm respectively, achieving 6 cm−1 in resolution. The acquisition times were 9 s per two accumulations for a total time of 55 s per spectrum. All spectra herein were smoothed and adjusted by using a baseline employing the Savitzky-Golay method using the LabSpec6® software (Villeneuve d'Ascq, France). A home-made cylindrical cell was used as the electrochemical cell for the electrochemical-SERS analyses. The electrochemical configuration was similar to the employed for ex-situ experiments, but the glassy carbon plate was joined to a coiled graphite rod used as electrical contact boned at bottom of the cylindrical cell avoiding electrolyte leakage. In addition, a 5 cm in length Ag/AgCl sat. KCl electrode was used as reference electrode and a 4 cm in length graphite rod as the counter-electrode. A schematic representation of this configuration is presented in Figure 8a. The electrochemical-SERS experiments consisted in obtaining cyclic voltammograms at 1 mV·s−1 and SERS spectra almost each 80 mV. For clarity purposes only five spectra are shown corresponding to four zones of interest: chemisorption zone, ethanol oxidation, formation of metal oxides region and the reduction of metal oxides/re-oxidation of ethanol molecules region.

4. Conclusions

In this study, Pt/C and PtFe/C nanoparticles with small sizes ranging from 2 to 3 nanometers, were successful synthesized through a chemical reduction method using both ascorbic acid and sodium borohydride as reducing agents. TEM micrographs confirmed the presence of these nanoparticles, while X-ray diffraction revealed the existence of small-sized crystallites.
Additionally, single iron nanoparticles were also present in the catalyst, which was corroborated by EDX. The PtFe/C catalyst showed excellent electrocatalytic properties for ethanol electro-oxidation in terms of activity and durability. A maximum current density of 814.36 mA·mg−1 Pt was obtained using 1 M ethanol as fuel along with an If/Ib rate of 6.24 after 300 cycles. This superior activity and good durability were achieved due to iron oxides helped desorbing CO and other carbonaceous species from Pt, providing oxygen and hydroxide species, cleaning the surface and consequently, allowing the oxidation of fresh ethanol molecules. Cyclic voltammograms in acidic media also confirmed this assumption, where shifts in potentials toward more positive values were found for PtFe/C compared with Pt/C, and this phenomenon can be related to the decrease in the desorption free energy of Pt–OH, Pt–O or Pt–O2 species due to the effect of iron in the Pt lattice. SERS analysis confirmed the presence of metal oxides on the catalyst and, the chemisorption of ethanol via C1 at low potentials (−0.60 and −0.30 V vs. NHE) suggesting that, PtFe/C favors the dissociative adsorption of ethanol, considered as one of the principal rate-determining steps of ethanol oxidation. In summary, herein we reported the use of a novel technique such as surface-enhanced Raman spectroscopy coupled to an electrochemical cell which allowed to determine that the activity and poisoning tolerance exhibited by PtFe/C is due to it oxidizes the ethanol molecule towards formic acid mainly, involving a higher electron extraction and the production of a less poisoning intermediate than acetaldehyde, which is commonly formed.

Acknowledgments

Authors acknowledges to the Mexican Council for Science and Technology (CONACYT) for financial support through project Fronteras de la Ciencia grant No. 611 and Laboratorios Nacionales “Laboratorio Nacional de Micro y Nano Fluídica” Grant No. 271649. In addition, we thank to M.C. Carlos Elías Ornelas Gutiérrez from CIMAV NanoTech for TEM analysis support.

Author Contributions

N. Arjona, M. Guerra-Balcázar and J. Ledesma-García conceived and designed the experiments; A. C. Gómez-Monsiváis and I. Velázquez-Hernández performed the experiments; L. G. Arriaga and L. Álvarez-Contreras analyzed the data; I. Velázquez-Hernández, N. Arjona, J. Ledesma-García and L. Álvarez-Contreras wrote the paper.

Conflicts of Interest

The authors declare no conflict of interest.

References

  1. Otomo, J.; Nishida, S.; Takahashi, H.; Nagamoto, H. Electro-oxidation of methanol and ethanol on carbon-supported Pt catalyst at intermediate temperature. J. Electroanal. Chem. 2008, 615, 84–90. [Google Scholar] [CrossRef]
  2. Giz, M.J.; Camara, G.A. The ethanol electrooxidation reaction at Pt (111): The effect of ethanol concentration. J. Electroanal. Chem. 2009, 625, 117–122. [Google Scholar] [CrossRef]
  3. Li, Y.S.; Zhao, T.S.; Liang, Z.X. Performance of alkaline electrolyte-membrane-based direct ethanol fuel cells. J. Power Sources 2009, 187, 387–392. [Google Scholar] [CrossRef]
  4. An, L.; Zhao, T.S.; Chen, R.; Wu, Q.X. A novel direct ethanol fuel cell with high power density. J. Power Sources 2011, 196, 6219–6222. [Google Scholar] [CrossRef]
  5. Andreadis, G.; Tsiakaras, P. Ethanol crossover and direct ethanol PEM fuel cell performance modeling and experimental validation. Chem. Eng. Sci. 2006, 61, 7497–7508. [Google Scholar] [CrossRef]
  6. Merle, G.; Wssling, M.; Nijmeijer, K. Anion exchange membranes for alkaline fuel cells: A review. J. Membr. Sci. 2011, 377, 1–35. [Google Scholar] [CrossRef]
  7. Ma, L.; Chu, D.; Chen, R. Comparison of ethanol electro-oxidation on Pt/C and Pd/C catalysts in alkaline media. Int. J. Hydrog. Energy 2012, 37, 11185–11194. [Google Scholar] [CrossRef]
  8. Akhairi, M.A.F.; Kamarudin, S.K. Catalysts in direct ethanol fuel cell (DEFC): An overview. Int. J. Hydrog. Energy 2016, 41, 4214–4228. [Google Scholar] [CrossRef]
  9. Kamarudin, M.Z.F.; Kamarudin, S.K.; Masdar, M.S.; Daud, W.R.W. Review: Direct ethanol fuel cells. Int. J. Hydrog. Energy 2013, 38, 9438–9453. [Google Scholar] [CrossRef]
  10. Antolini, E. Catalysts for direct ethanol fuel cells. J. Power Sources 2007, 170, 1–12. [Google Scholar] [CrossRef]
  11. Zignani, S.C.; Baglio, V.; Linares, J.J.; Monforte, G.; Gonzalez, E.R.; Aricò, A.S. Performance and selectivity of PtxSn/C electro-catalysts for ethanol oxidation prepared by reduction with different formic acid concentrations. Electrochim. Acta 2012, 70, 255–265. [Google Scholar] [CrossRef]
  12. Camara, G.A.; de Lima, R.B.; Iwasita, T. Catalysis of ethanol electrooxidation by PtRu: The influence of catalyst composition. Electrochem. Commun. 2004, 6, 812–815. [Google Scholar] [CrossRef]
  13. Kannan, P.; Maiyalagan, T.; Opallo, M. One-pot synthesis of chain-like palladium nanocubes and their enhanced electrocatalytic activity for fuel-cell applications. Nano Energy 2013, 2, 677–687. [Google Scholar] [CrossRef]
  14. Liu, Y.; Li, D.; Sun, S. Pt-based composite nanoparticles for magnetic, catalytic, and biomedical applications. J. Mater. Chem. 2011, 21, 12579–12587. [Google Scholar] [CrossRef]
  15. Dai, Y.; Ou, L.; Liang, W.; Yang, F.; Liu, Y.; Chen, S. Efficient and superiorly durable Pt-lean electrocatalysts of Pt−W alloys for the oxygen reduction reaction. J. Phys. Chem. C 2011, 115, 2162–2168. [Google Scholar] [CrossRef]
  16. Stamenkovic, V.R.; Fowler, B.; Mun, B.S.; Wang, G.; Ross, P.N.; Lucas, C.A.; Markovic, N.M. Improved oxygen reduction activity on Pt3Ni(111) via increased surface site availability. Science 2007, 315, 493–497. [Google Scholar] [CrossRef] [PubMed]
  17. Byhan, S.; Coutanceau, C.; Léger, J.-M.; Napporn, T.W.; Kadirgan, F. Promising anode candidates for direct ethanol fuel cell: Carbon supported PtSn-based trimetallic catalysts prepared by Bönnemann method. Int. J. Hydrog. Energy 2013, 38, 6830–6841. [Google Scholar] [CrossRef]
  18. Fan, Y.; Liu, P.-F.; Zhang, Z.-W.; Cui, Y.; Zhang, Y. Three-dimensional hierarchical porous platinum–copper alloy networks with enhanced catalytic activity towards methanol and ethanol electro-oxidation. J. Power Sources 2015, 296, 282–289. [Google Scholar] [CrossRef]
  19. Sieben, J.M.; Duarte, M.M.E. Methanol, ethanol and ethylene glycol electro-oxidation at Pt and Pt–Ru catalysts electrodeposited over oxidized carbon nanotubes. Int. J. Hydrog. Energy 2012, 37, 9941–9947. [Google Scholar] [CrossRef]
  20. Du, W.; Su, D.; Wang, Q.; Frenkel, A.I.; Teng, X. Promotional effects of bismuth on the formation of platinum-bismuth nanowires network and the electrocatalytic activity toward ethanol oxidation. Cryst. Growth Des. 2011, 11, 594–599. [Google Scholar] [CrossRef]
  21. Bai, Y.; Wu, J.; Qiu, X.; Xi, J.; Wang, J.; Li, J.; Zhu, W.; Chen, L. Electrochemical characterization of Pt-CeO2/C and Pt-CexZr1−xO2/C catalysts for ethanol electro-oxidation. Appl. Catal. B 2007, 73, 144–149. [Google Scholar] [CrossRef]
  22. Comignani, V.; Sieben, J.M.; Brigante, M.E.; Duarte, M.M.E. Carbon supported Pt–NiO nanoparticles for ethanol electro-oxidation in acid media. J. Power Sources 2015, 278, 119–127. [Google Scholar] [CrossRef]
  23. Zhou, W.J.; Li, W.Z.; Song, S.Q.; Zhou, Z.H.; Jiang, L.H.; Sun, G.Q.; Xin, Q.; Poulianitis, K.; Kontou, S.; Tsiakaras, P. Bi- and tri-metallic Pt-based anode catalysts for direct ethanol fuel cells. J. Power Sources 2004, 131, 217–223. [Google Scholar] [CrossRef]
  24. Antolini, E. Iron-containing platinum-based catalysts as cathode and anode materials for low-temperature acidic fuel cells: A review. RSC Adv. 2016, 6, 3307–3325. [Google Scholar] [CrossRef]
  25. Huang, T.; Liu, J.; Li, R.; Cai, W.; Yu, A. A novel route for preparation of PtRuMe (Me=Fe, Co, Ni) and their catalytic performance for methanol electrooxidation. Electrochem. Commun. 2009, 11, 643–646. [Google Scholar] [CrossRef]
  26. Malheiro, A.R.; Perez, J.; Villullas, H.M. Surface structure and electronic properties of Pt–Fe/C nanocatalysts and their relation with catalytic activity for oxygen reduction. J. Power Sources 2010, 195, 3111–3118. [Google Scholar] [CrossRef]
  27. Wang, J.; Chen, S.; Wang, P.; Huang, R.; Li, M.; Su, S. Preparation of FePt/GC nanocatalysts and their electrocatalytic activities for ethanol oxidation. CIESC J. 2010, 61, 101–105. [Google Scholar]
  28. Dong, L.; Dong, H.; Yu, L.; Zhang, Q.; Bai, J.; Sui, J.; Ma, B. Comparative study of different carbon nanotube-supported platinum bimetallic and trimetallic catalysts for methanol and ethanol oxidation. ECS Trans. 2011, 41, 1317–1321. [Google Scholar]
  29. Wang, R.; Wang, H.; Li, H.; Wang, W.; Key, J.; Khotseng, L.; Ji, S. An Fe@Fe3C-inserted carbon nanotube/graphite composite support providing highly dispersed Pt nanoparticles for ethanol oxidation. Electrochim. Acta 2014, 132, 251–257. [Google Scholar] [CrossRef]
  30. Xu, Z.; Hu, J.; Yan, Z.; Yang, S.; Zhou, J.; Lu, W. Potassium ferrate (VI) and decomposed K2FeO4 assisted methanol electro-oxidation in alkaline media. Electrochim. Acta 2009, 54, 3548–3552. [Google Scholar] [CrossRef]
  31. Léger, J.M.; Rousseau, S.; Coutanceau, C.; Hahn, F.; Lamy, C. How bimetallic electrocatalysts does work for reactions involved in fuel cells? Example of ethanol oxidation and comparison to methanol. Electrochim. Acta 2005, 50, 5118–5125. [Google Scholar] [CrossRef]
  32. Zhang, Y.; Weaver, M.J. Application of surface-enhanced Raman spectroscopy to organic electrocatalytic systems: Decomposition and electrooxidation of methanol and formic acid on gold and platinum-film electrodes. Langmuir 1993, 9, 1397–1403. [Google Scholar] [CrossRef]
  33. Lubarda, V.A. On the effective lattice parameter of binary alloys. Mech. Mater. 2003, 35, 53–68. [Google Scholar] [CrossRef]
  34. Merte, L.R.; Grabow, L.C.; Peng, G.; Knudsen, J.; Zeuthen, H.; Kudernatsch, W.; Porsgaard, S.; Lægsgaard, E.; Mavrikakis, M.; Besenbacher, F. Tip-dependent scanning tunneling microscopy imaging of ultrathin FeO films on Pt(111). J. Phys. Chem. C 2011, 115, 2089–2099. [Google Scholar] [CrossRef]
  35. Zhang, Z.; Li, M.; Wu, Z.; Li, W. Ultra-thin PtFe-nanowires as durable electrocatalysts for fuel cells. Nanotechnology 2011, 22, 015602. [Google Scholar] [CrossRef] [PubMed]
  36. Jingyan, S.; Yuwen, L.; Zhiyong, W.; Cunxin, W. Investigation of thermal decomposition of ascorbic acid by TG-FTIR and thermal kinetics analysis. J. Pharm. Biomed. Anal. 2013, 77, 116–119. [Google Scholar] [CrossRef] [PubMed]
  37. Baturina, O.A.; Aubuchon, S.R.; Wynne, K.J. Thermal stability in air of Pt/C catalysts and PEM fuel cell catalyst layers. Chem. Mater. 2006, 18, 1498–1504. [Google Scholar] [CrossRef]
  38. Silva, M.F.; da Silva, F.C.; Fogo, F.C.; Pineda, E.A.G.; Hechenleitner, A.A.W. Thermal and FTIR study of polyvinylpyrrolidone/lignin blends. J. Therm. Anal. Calorim. 2005, 79, 367–370. [Google Scholar] [CrossRef]
  39. Kim, M.-C.; Kim, T.-W.; Kim, H.J.; Kim, C.-U.; Bae, J.W. Aqueous phase reforming of polyols for hydrogen production using supported Pt-Fe bimetallic catalysts. Renew. Energy 2016, 95, 396–403. [Google Scholar] [CrossRef]
  40. Mei, H.; Wu, W.; Yu, B.; Wu, H.; Wang, S.; Xia, Q. Nonenzymatic electrochemical sensor based on Fe@Pt core–shell nanoparticles for hydrogen peroxide, glucose and formaldehyde. Sens. Actuators B 2016, 223, 68–75. [Google Scholar] [CrossRef]
  41. Arjona, N.; Guerra-Balcázar, M.; Trejo, G.; Álvarez-Contreras, L.; Ledesma-García, J.; Arriaga, L.G. Staircase and pulse potential electrochemical techniques for the facile and rapid synthesis of Pt and PtAg materials. Electrochim. Acta 2014, 115, 46–55. [Google Scholar] [CrossRef]
  42. Lee, Y.W.; Kim, M.; Kim, Y.; Kang, S.W.; Lee, J.-H.; Han, S.W. Synthesis and electrocatalytic activity of Au−Pd alloy nanodendrites for ethanol oxidation. J. Phys. Chem. C 2010, 114, 7689–7693. [Google Scholar] [CrossRef]
  43. Hong, J.W.; Kim, D.; Lee, Y.W.; Kim, M.; Kang, S.W.; Han, S.W. Atomic-distribution-dependent electrocatalytic activity of Au–Pd bimetallic nanocrystals. Angew. Chem. 2011, 123, 9038–9042. [Google Scholar] [CrossRef]
  44. Sun, Y.; Zhou, T.; Pan, Q.; Zhang, X.; Guo, J. PtFe/nitrogen-doped graphene for high-performance electrooxidation of formic acid with composition sensitive electrocatalytic activity. RSC Adv. 2015, 5, 60237–60245. [Google Scholar] [CrossRef]
  45. Arjona, N.; Guerra-Balcázar, M.; Ortiz-Frade, L.; Osorio-Monreal, G.; Álvarez-Contreras, L.; Ledesma-García, J.; Arriaga, L.G. Electrocatalytic activity of well-defined and homogeneous cubic-shaped Pd nanoparticles. J. Mater. Chem. A 2013, 1, 15524–15529. [Google Scholar] [CrossRef]
  46. Pereira, L.G.S.; Paganin, V.A.; Ticianelli, E.A. Investigation of the CO tolerance mechanism at several Pt-based bimetallic anode electrocatalysts in a PEM fuel cell. Electrochim. Acta 2009, 54, 1992–1998. [Google Scholar] [CrossRef]
  47. Ahmed, M.S.; Jeon, S. Highly active graphene-supported NixPd100–x Binary alloyed catalysts for electro-oxidation of ethanol in an alkaline media. ACS Catal. 2014, 4, 1830–1837. [Google Scholar] [CrossRef]
  48. Wang, Y.; Zhao, Y.; Yin, J.; Liu, M.; Dong, Q.; Su, Y. Synthesis and electrocatalytic alcohol oxidation performance of Pd–Co bimetallic nanoparticles supported on graphene. Int. J. Hydrog. Energy 2014, 39, 1325–1335. [Google Scholar] [CrossRef]
  49. Feng, Y.-Y.; Liu, Z.-H.; Kong, W.-Q.; Lin, Q.-Y.; Du, L.-X. Promotion of palladium catalysis by silver for ethanol electro-oxidation in alkaline electrolyte. Int. J. Hydrog. Energy 2014, 39, 2497–2504. [Google Scholar] [CrossRef]
  50. Vié, R.; Drahi, E.; Baudino, O.; Blayac, S.; Berthon-Fabry, S. Synthesis of carbon nanospheres for the development of inkjet-printed resistive layers and sensors. Flex. Print. Electron. 2016, 1. [Google Scholar] [CrossRef]
  51. Lai, S.C.S.; Koper, M.T.M. Ethanol electro-oxidation on platinum in alkaline media. Phys. Chem. Chem. Phys. 2009, 11, 10446–10456. [Google Scholar] [CrossRef] [PubMed]
  52. She, C.-X.; Xiang, J.; Ren, B.; Zhong, Q.-L.; Wang, X.-C.; Tian, Z.-Q. The Investigation of electro-oxidation of methanol on Pt-Ru electrode surfaces by in-situ Raman spectroscopy. J. Korean Electrochem. Soc. 2002, 5, 221–225. [Google Scholar] [CrossRef]
  53. De Souza, R.F.B.; Neto, É.T.; Calegaro, M.L.; Santos, E.A.; Martinho, H.S.; dos Santos, M.C. Ethanol electro-oxidation on Pt/C electrocatalysts: An “in situ” Raman spectroelectrochemical study. Electrocatalysis 2011, 2, 28–34. [Google Scholar] [CrossRef]
  54. Himmelblau, D.M. Diffusion of dissolved gases in liquids. Chem. Rev. 1964, 64, 527–550. [Google Scholar] [CrossRef]
  55. Wang, Y.; Zou, S.; Cai, W.-B. Recent advances on electro-oxidation of ethanol on Pt- and Pd-based catalysts: From reaction mechanisms to catalytic materials. Catalysis 2015, 5, 1507–1534. [Google Scholar] [CrossRef]
  56. Pletcher, D. Electrocatalysis: Present and future. J. Appl. Electrochem. 1984, 14, 403–415. [Google Scholar] [CrossRef]
  57. Brouzgou, A.; Podias, A.; Tsiakaras, P. PEMFCs and AEMFCs directly fed with ethanol: A current status comparative review. J. Appl. Electrochem. 2013, 43, 119–136. [Google Scholar] [CrossRef]
Figure 1. (a) X-ray diffraction patterns of Pt/C and PtFe/C nanocatalysts; (b) Thermogravimetric analyses for Pt/C and PtFe/C.
Energies 10 00290 g001
Figure 2. (a) HR-TEM micrographs of Pt/C and PtFe/C and particle distribution; (b) XPS spectra of Fe 2p and Pt 4f regions of the PtFe/C catalyst.
Energies 10 00290 g002
Figure 3. HR-TEM micrographs of Pt/C and PtFe/C nanocatalysts. (a) Z-contrast of a set of nanoparticles; (b) Selected area electron diffraction patterns.
Energies 10 00290 g003
Figure 4. (a) EDX spectra of PtFe/C and Pt/C for a set of nanoparticles; (b) EDX line-scan of PtFe/C.
Energies 10 00290 g004
Figure 5. Cyclic voltammograms for PtFe/C and Pt/C in (a) 0.5 M H2SO4 as an acidic electrolyte and (b) 0.3 M KOH as an alkaline electrolyte. Scan rate: 50 mV·s−1.
Energies 10 00290 g005
Figure 6. Cyclic voltammograms for (a) PtFe/C and (b) Pt/C as function of the ethanol concentration. 0.1 M, 0.5 M and 1 M ethanol are illustrated in black, red and blue lines, respectively; (c) Comparison of the activities with 1 M ethanol. Scan rate: 20 mV·s−1.
Energies 10 00290 g006
Figure 7. (a) Stability tests for Pt/C and PtFe/C by chronoamperometry using 0.041 V vs. NHE as the fixed potential for 1 h; (b) Losses in activity comparing the peak current densities in the forward scan, where I0 corresponds to the peak current density of cycle 1; (c) Changes derived from the adsorption of poisoning species calculated from dividing the peak current density of the forward scan by the peak current density of the backward scan.
Energies 10 00290 g007
Figure 8. (a) Schematic representation of the cell arrangement between the electrochemical cell and Raman spectrometer; (b) Cyclic voltammogram of PtFe/C catalyst towards 1 M ethanol oxidation in alkaline medium (0.3 M KOH) at 1 mV·s−1, illustrating voltages in which SERS was performed (forward and backward sweep potential); (c) SERS spectra of chemical changes occurred during the ethanol oxidation on PtFe/C.
Energies 10 00290 g008
Scheme 1. Proposed pathway for ethanol electro-oxidation in alkaline medium using PtFe/C as nanocatalyst.
Energies 10 00290 sch001
Figure 9. Analysis of peak current densities of various nanocatalysts found in the literature for the electro-oxidation of 1 M ethanol. Only materials that were normalized by mass activity (mA·mg−1 Pt) were considered for comparison purposes.
Energies 10 00290 g009
Table 1. Summary of the physicochemical results found for Pt/C and PtFe/C.
PropertyMaterial
Pt/CPtFe/C
PtFe
Crystallite size (nm)3.313.94
Lattice constant (Å)3.93333.9119
Mass content by XRF (%)1008911
Average atomic by EDX (%)4.130.520.16
Residual metallic content by TGA (%)3.4433.669

