Article

Decentralized Framework for Optimal Price-Based Power System Operation Using Feedback Control Mechanism

1
Department of Electrical Engineering, Jeju National University, 102 Jejudaehakno, Jeju-si, Jeju-do 63243, Korea
2
Department of Electrical and Computer Engineering, Seoul National University, 1 Gwanak-ro, Gwanak-gu, Seoul 08826, Korea
3
Department of Industrial Engineering Institute of Engineering Research, Seoul National University, 1 Gwanak-ro, Gwanak-gu, Seoul 08826, Korea
*
Author to whom correspondence should be addressed.
Energies 2017, 10(3), 291; https://doi.org/10.3390/en10030291
Submission received: 28 December 2016 / Revised: 11 January 2017 / Accepted: 20 February 2017 / Published: 1 March 2017

Abstract

:
Future power systems are expected to have distributed energy resources (DERs). A price-based operation (PBO), where dynamic prices are used as the control signal, can be an alternative scheme to address challenging operational issues in the future power systems. In this paper, a decentralized framework for optimal PBO using a feedback control mechanism is proposed to determine the nodal prices for power balance and congestion management. The substructures and feedback controllers of the proposed framework are derived based on the optimal power flow (OPF) method. Thus, the framework guarantees optimality for all situations in real-time and enables the use of various types of controllers. The effectiveness of the proposed framework is verified with the IEEE 39 bus network under some scenarios, such as the failure of a generator and a transmission line. The results clearly demonstrate that the proposed framework successfully resolves the balance and congestion problems by generating appropriate nodal prices in the PBO and provides a solution similar to the optimal solution determined by the conventional OPF method.

1. Introduction

The conventional power systems, which include a small number of suppliers with a large generation capacity and very few consumers with a price-responsive capability, have been designed and operated in a centralized scheme. Economic dispatch (ED) and optimal power flow (OPF) methods are well-known techniques for the centralized power system operation [1]. In the ED method, the amount of generation of each unit is determined with the objective of minimizing the generation cost for the forecasted load; in the OPF method, the constraints on power flows in the network are additionally considered within the ED framework. Then, the system marginal price and/or nodal prices are determined as the outcomes of the optimization procedures. However, future power systems will integrate more widespread distributed energy resources (DERs), such as renewable energy sources, energy storage systems, and price-responsive loads [2,3]. This will lead to a fundamental change of the power industry and challenging operational issues because the number of DERs will be large and the uncertainty and complexity of future power systems will, accordingly, increase significantly [4,5].
When addressing the operational challenges in a decentralized manner, it is suggested that the dynamic prices in an electricity market should be used as a control signal to coordinate the behaviors of DERs, including the price-responsive customers; then, the predictable and reliable system reaction can be achieved [6]. This concept of price-based operation (PBO) as an alternative operating scheme was first presented by Schweppe et al. in the 1980s [7,8].
A considerable number of studies on PBO have been further conducted. The behavior of the participants was modeled as a set of dynamic equations, and the stability of the dynamic system was analyzed in various cases [9,10]. Modified dynamic equations were proposed to improve stability [11]. In addition, [12] described the possibility of congestion management based on real-time price signals. A congestion management scheme employing different prices at each node was suggested in terms of the steady-state operation [13]. This approach is extended in [14], which considers the response dynamics of participants. A method using a real-time feedback controller based on OPF was presented [15]. In [16], an information and communications architecture was proposed to realize the PBO concept. A technique to estimate the behaviors in response to time-varying prices was presented in [17]. A basic feedback control structure of the PBO was presented in [18], where a conventional method for tuning controllers is applied to make effective price signals.
The most critical limitation of the PBO in practical implementation is the real-time transmission of the dynamic price signal. For this reason, the PBO has not attracted much attention as an active research topic. However, in the era of smart grids with a large number of DERs, backed up by rapidly-developing information and communication technology, the PBO can be a candidate to address the emerging operational issues and also an effective decentralized framework in future power systems based on the price-based control signal. Moreover, the concept of the PBO can be applied well to the operation of a microgrid, which can be viewed as a modern small-scale power system with multiple DERs and price-responsive loads. In addition, by suitably defining a multi-objective function and the corresponding behaviors of various DERs and local loads, the PBO can be implemented in a microgrid, which is operated optimally, e.g., in terms of both the operational cost and greenhouse gas emission [19]. Therefore, this paper tries to re-examine the PBO and propose a decentralized framework to coordinate DERs.
In the PBO, similarly as the conventional power system operation, nodal prices should be generated for maintaining power/energy balance and avoiding line congestion. In some cases, it will be more effective to separate the nodal prices into the components related to power/energy balance and line congestion, respectively, then applying different rules to generate each component of nodal prices. Moreover, if the nodal prices are not generated in an elaborately designed structure, an optimal solution may not be achieved even though the conditions on the power/energy balance and line congestion are satisfied. Therefore, this paper proposes a decentralized framework for the PBO using the feedback control mechanism to coordinate DERs, where nodal prices are determined in a decentralized manner while achieving the power balance and congestion management.
The remainder of this paper is organized as follows. In Section 2, the existing OPF method is described as a foundation of this proposal and the nomenclature is also given for the following development. In Section 3, each optimal condition of OPF is interpreted as a substructure of the proposed framework. Specific forms of target systems are also presented in Section 3, which should be considered in the process of the design of the PBO. The overall structure of the framework is also given in Section 4. The effectiveness of the proposed framework is verified by the simulations under various scenarios, including generator and transmission line failures using the IEEE 39 bus network in Section 5. Concluding remarks are given in Section 6.

2. Optimal Power Flow

The formulation of OPF is based on the following assumptions: the power flow is calculated using the DC power flow method [1], and bus 1 is a slack bus, such that θ 1 = 0 . Thus, the OPF problem can be formulated as the following optimization problem:
min P g , P d { F ( P g , P d ) } = min P g , P d { k = 1 n b C g , k ( P g , k ) k = 1 n b U d , k ( P d , k ) }
subject to the power balance equation
1 T P = P 1 + P 2 + + P n b = 0
the load flow equation at each bus
B ^ θ ^ = [ B 2 B 3 B n b ] θ ^ = P
and the transmission line constraint at each branch
P f m a x P f P f m a x
Based on the assumption of DC power flow, the active power flow from bus i to bus j is determined by
P f i , j = θ i θ j x i , j
Subsequently, P f can be represented in terms of relative phase angles θ ^ as
P f = X 1 A ^ θ ^
Let x be defined as x T = [ P g T P d T ] . Then, Lagrangian L : R 2 n b × R 2 n l R can then be obtained from (1) to (4) and (6) as:
L ( x , λ P , λ θ , μ + , μ ) = F ( x ) + λ P ( 1 T P ) + λ θ T ( B ^ θ ^ P ) + μ + T ( X 1 A ^ θ ^ P f m a x ) + μ T ( X 1 A ^ θ ^ P f m a x )
Thus, the optimality condition can be determined from Karush–Kuhn–Tucker conditions [20] as
L x = F ( x ) x λ P 1 λ θ = F ( x ) x ρ = 0
L θ ^ = B ^ T λ θ + A ^ T X 1 μ + A ^ T X 1 μ = 0
L λ P = 1 T P = 0
L λ θ = B ^ θ ^ P = 0
L μ + = X 1 A ^ θ ^ P f m a x 0
L μ = X 1 A ^ θ ^ P f m a x 0
μ + T ( X 1 A ^ θ ^ P f m a x ) = 0 ,   μ + 0
μ T ( X 1 A ^ θ ^ P f m a x ) = 0 ,   μ 0
The optimal nodal prices are composed of Lagrange multipliers λ P and λ θ that satisfy the set of conditions from (8a) to (8h), which can be written as
ρ = λ P 1 + λ θ
The terms μ + and μ are congestion prices, which represent the possible cost reduction that can be achieved when the maximum transfer limit of the line increases by one unit. If no congestion occurs, all elements of μ + and μ are zero. Then, λ θ becomes 0 from (8b), which indicates that the nodal prices are all equal.
For the line constraints in (8e) to (8h), no case involves simultaneous violations of the constraints of the positive and negative flow limits. Moreover, the sign of the power flow depends on its defined direction. Thus, without any loss of generality, only the positive maximum power flow will be considered as inequality constraints. Then, (8f) and (8h) are naturally met, and μ is always equal to zero. Accordingly, for simplicity of expression, μ will be used instead of μ + in the following description. Consequently, (8a)–(8h) constitute the optimal conditions, which are considered in the composition of the general framework for the design of the PBO.

3. Structure of Decentralized Framework

3.1. Substructure for Marginal Price

Although participants in the power market can exhibit various responses to electricity prices, it may be reasonable to assume that their behaviors are based on a perfect competition situation [9,10]. Each participant then changes generation/consumption behaviors with respect to the difference between the price and the marginal cost/benefit. The functions for marginal cost and marginal benefit can also be assumed to be affine [21,22]. Thus, the dynamic behavior of the participants at bus k can be written as
τ g , k P ˙ g , k = b g , k c g , k P g , k + ρ k τ d , k P ˙ d , k = b d , k + c d , k P g , k ρ k ,   k = 1 , , n b
Condition (8a) indicates that, at the optimal operating point, the marginal cost of generation and the marginal benefit of consumption are identical to the nodal prices at the corresponding buses. Thus, (8a) can be satisfied by the assumption regarding the behavior of the participants in (10).

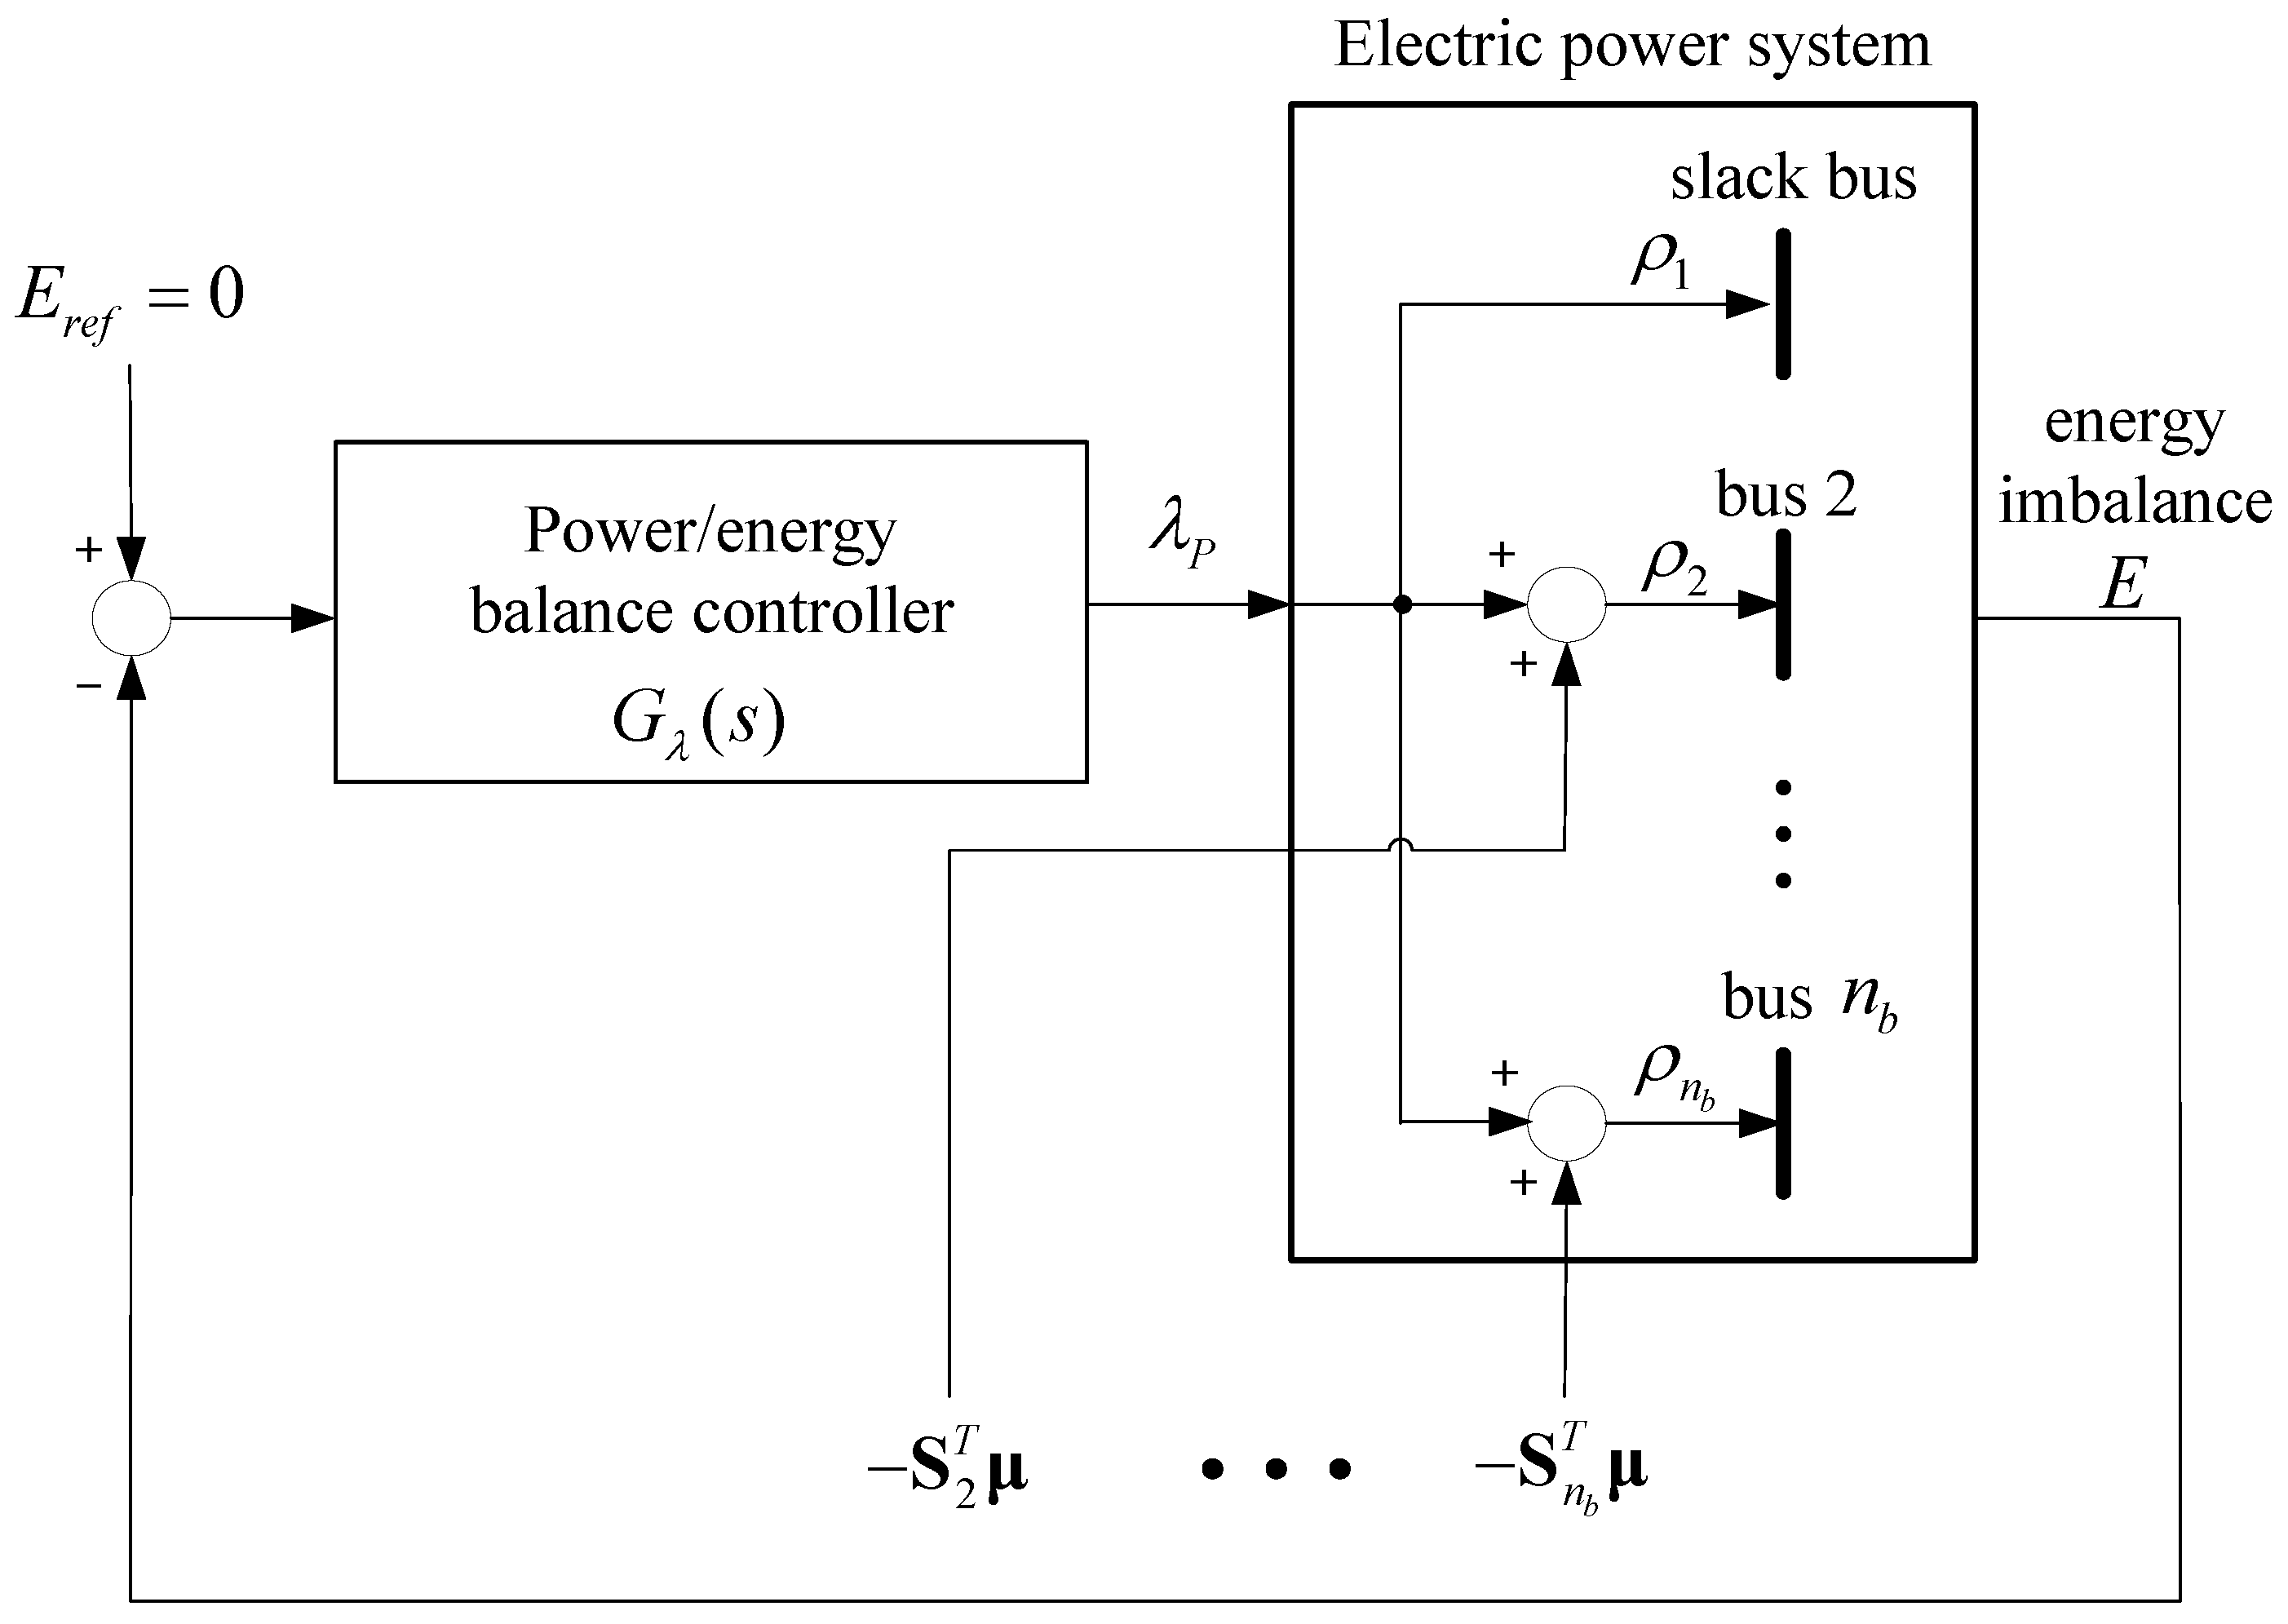
3.2. Substructure for Balancing Power and Energy

The condition of power balance is related to (8c). If the supply is greater than the demand, 1 T P becomes positive. In the opposite case, 1 T P becomes negative. Thus, (8c) can be met by adding the following dynamic equation for power/energy balance to (10)
E ˙ = 1 T P
and by performing the control action to drive the energy imbalance, E , to zero. This condition is equivalent to the typical feedback control problem, in which the energy imbalance is the output of the system, the reference value for the output is set to zero, and the price component, λ P , is the input of the system [18]. This substructure for the power/energy balance is illustrated also in [18].
If the balance condition is represented as a feedback control problem, the performance of the PBO is dependent on the design or tuning of the controller. The target system for the design of the power/energy balance controller can be determined from (10). The constant terms b g , k and b d , k in (10) can be integrated to form a disturbance, D ( s ) , which is added to the system output [18]. The output disturbance can then be represented as
D ( s ) = k = 1 n b { b g , k s 2 ( τ g , k s + c g , k ) + b d , k s 2 ( τ d , k s c d , k ) }
The target system for power/energy balance can be formed from other variables as
H λ ( s ) = k = 1 n b { 1 s ( τ g , k s + c g , k ) + 1 s ( τ d , k s c d , k ) }
In the case of price inelastic demand, the second term related to the demand in (13) is removed, and the target system can be represented as
H λ ( s ) = k = 1 n b { 1 s ( τ g , k s + c g , k ) }
Thus, H λ ( s ) in (13) or (14) is the target system for the design or tuning of the real-time power/energy balance controller, G λ ( s ) .

3.3. Substructure for Nodal Prices

According to (8b), a relationship exists between the Lagrange multiplier, λ θ , and the congestion price, μ , in order to ensure the optimal operation, which can be rewritten as
B ^ T λ θ + A ^ T X 1 μ = 0
In the absence of congestion, μ is equal to 0 . Likewise, λ θ becomes 0 , and all the nodal prices are equal as a result of (9). If congestion occurs, the element of μ corresponding to the congested line becomes positive. Let B ^ T be expressed as
B ^ T = [ b ^ 1 B ^ ]
where b ^ 1 is the first column of B ^ T , which is a ( n b 1 ) × 1 vector corresponding to the slack bus. Similarly, let λ θ be denoted as
λ θ T = [ λ θ , 1 λ ^ θ T ]
Then, (15) can be represented as
λ θ , 1 b ^ 1 + B ^ λ ^ θ + A ^ T X 1 μ = 0
Let λ ^ θ be expressed as
λ ^ θ = λ θ , 1 1 + λ Δ
Then, (18) can be arranged as
λ θ , 1 ( b ^ 1 + B ^ 1 ) + B ^ λ Δ + A ^ T X 1 μ = 0
The elements of the term ( b ^ 1 + B ^ 1 ) in (20) denote the sum of the elements of each row of B except the slack bus. By definition, they are all equal to zero. Thus, (20) becomes
B ^ λ Δ + A ^ T X 1 μ = 0
If the inverse of B ^ is pre-multiplied by (21), the following relationship can be derived:
λ Δ = ( B ^ ) 1 A ^ T X 1 μ = { X 1 A ^ ( B ^ ) 1 } T μ
where X 1 A ^ ( B ^ ) 1 is the power transfer distribution factor (PTDF) except for the assigned slack bus [23], and its dimension is n l × ( n b 1 ) . The value of λ θ , 1 only shifts the value of λ P and does not affect the optimal condition. Thus, the value of λ θ , 1 is assumed to be zero for simplicity. Thus, from (9), (17), (19), and (22), the optimal nodal price can be determined as
ρ = [ ρ 1 ρ ^ ] = λ P 1 n b + [ λ θ , 1 λ ^ θ ] = λ P 1 n b + [ 0 λ Δ ] = [ λ P λ P 1 n b 1 { X 1 A ^ ( B ^ ) 1 } T μ ] = λ P 1 n b S T μ
From the perspective of control engineering, ( S T μ ) can be considered as a disturbance added to the controller output, λ P . This interpretation is used in the composition of the substructure to determine the relationship between the nodal prices and the congestion prices, which is shown in Figure 1. Consequently, the optimal condition in (8b) can be satisfied by subtracting the congestion price multiplied by the PTDF from the nodal price of the slack bus.

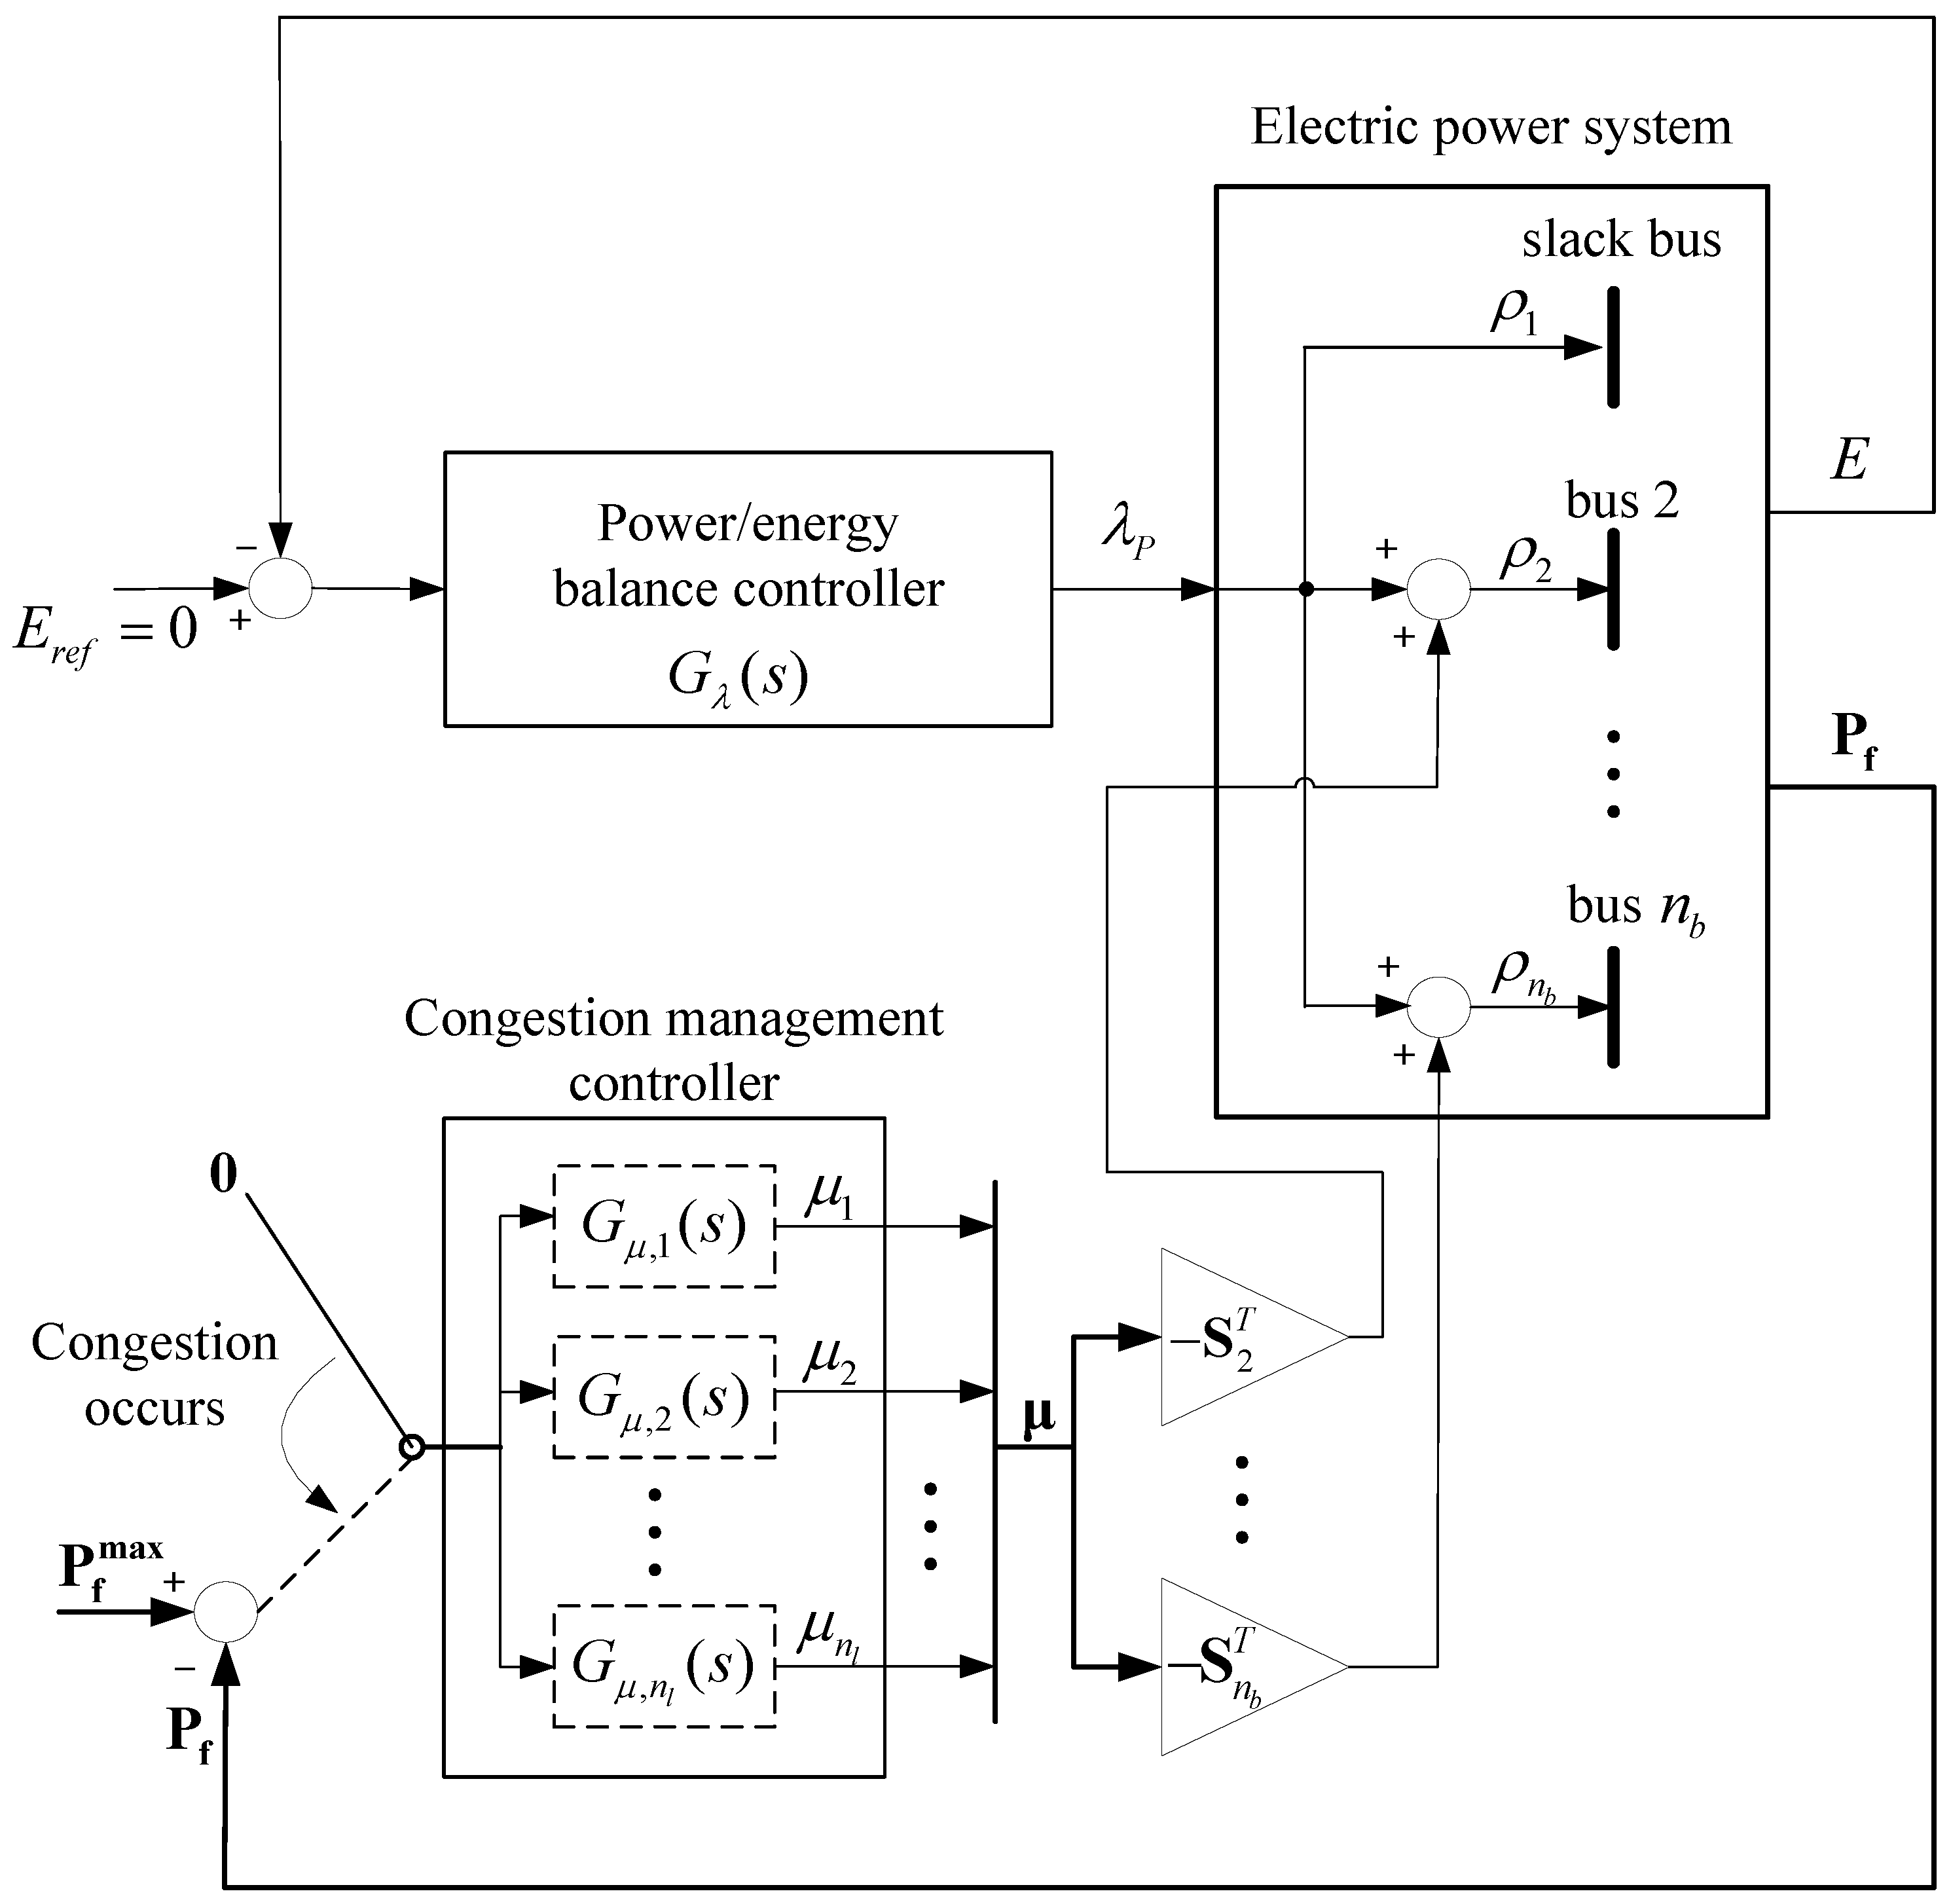
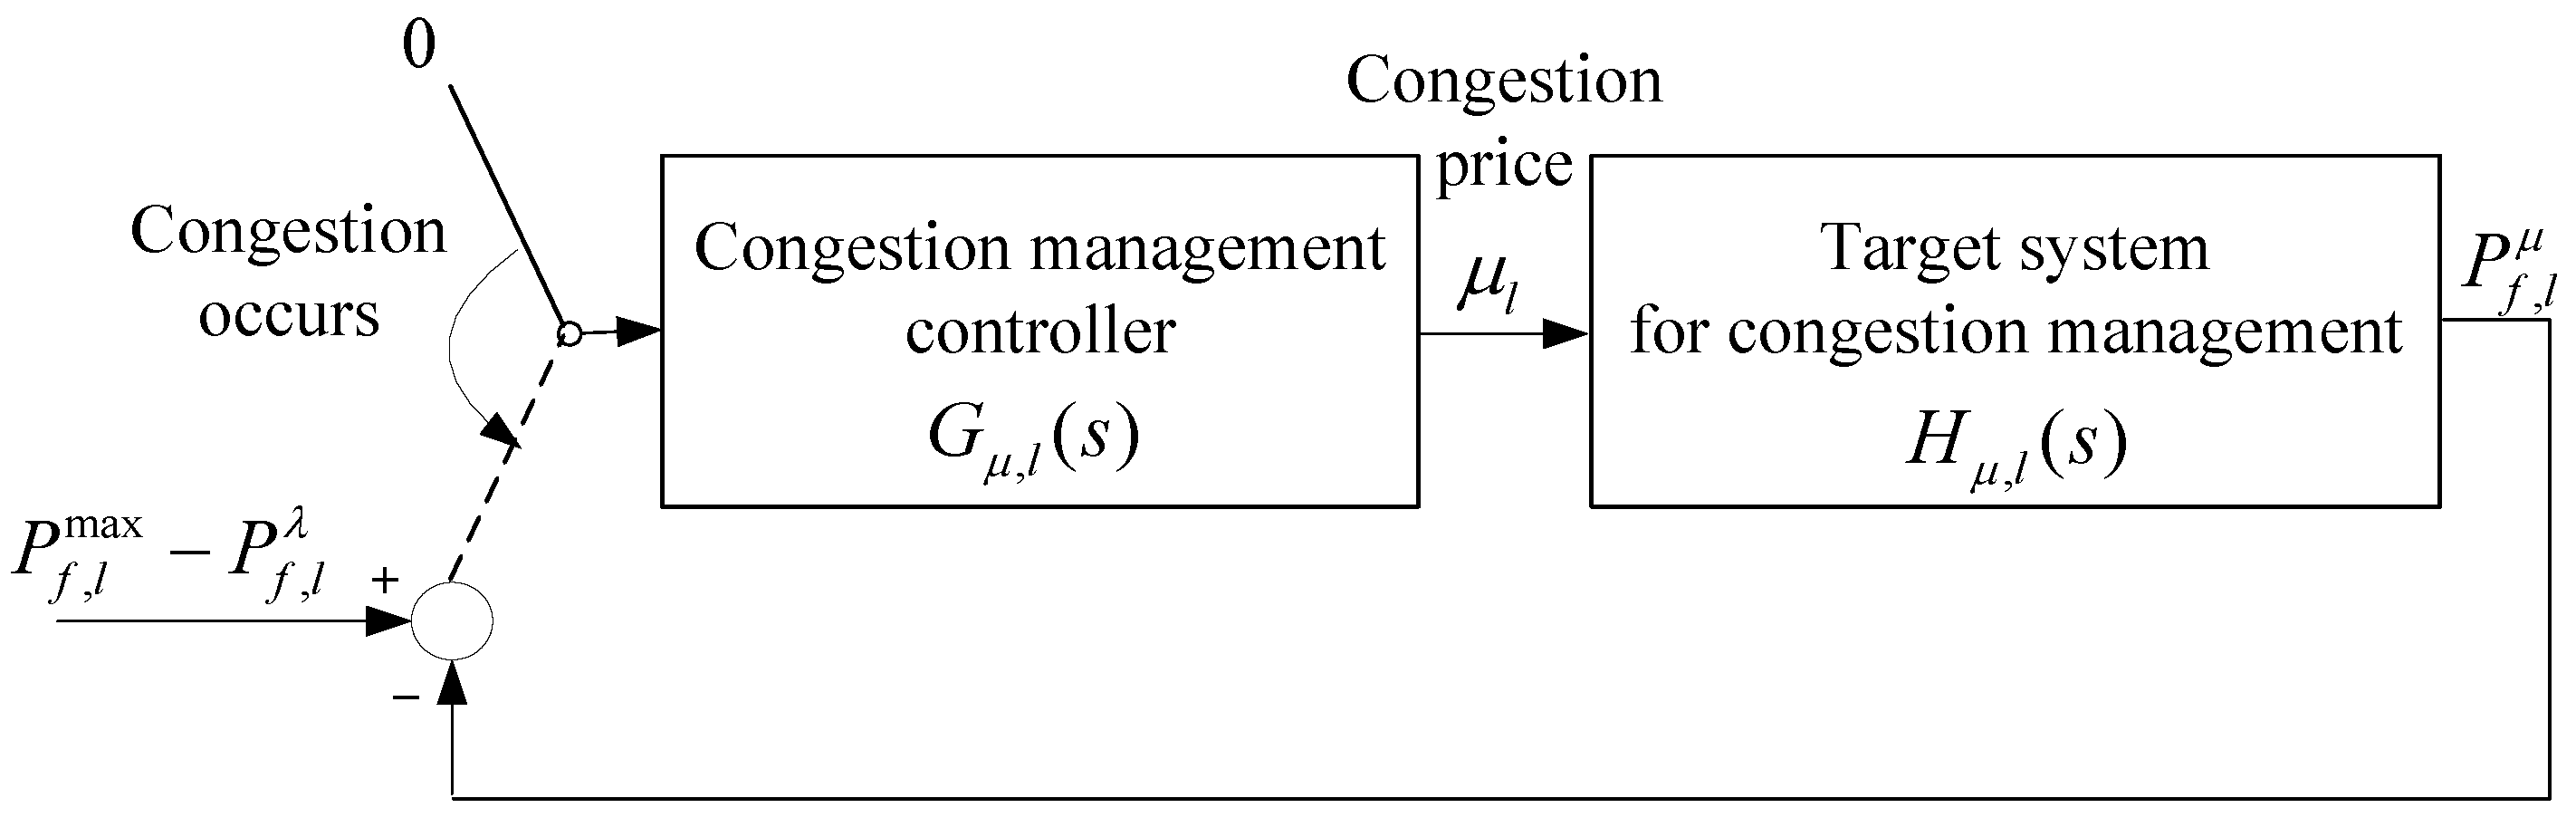
3.4. Substructure for Line Congestion Management

The management of line congestion can also be represented as a feedback control problem. However, a congestion management controller is individually assigned to each line. For line l , the output of a controller is the congestion price, μ l , whereas the output of the system is the variation in power flow attributed to the congestion price. Let P f , l λ and P f , l μ denote the partial components of actual power flow in the line l induced by λ P and μ l , respectively. Then, when congestion occurs, the error input into the controller becomes:
( P f , l max P f , l λ ) P f , l μ
where the terms in parentheses constitute the time-varying reference.
Contrary to the fact that the reference of the power/energy balance controller is always set to zero, the reference of the congestion management controller is conditional and time-varying. The term “conditional” indicates that the reference is set to zero in a normal situation without congestion, but that it changes into the difference between the maximum power flow and the partial component of the actual power flow induced by λ P , or P f , l max P f , l λ , during congestion. The term “time-varying” indicates the variation in the reference, owing to the changes in time in the actual power flow induced by λ P . Subsequently, the role of the controller for managing line congestion is transformed to a reduction in the actual power flow over the maximum flow limit, which is achieved by generating the appropriate congestion price, μ l .
The target system for the design of the congestion management controller can be determined by starting from (13) or (14). From μ l to P f , l μ , multiplication with the negative PTDF converts μ l into nodal prices, as shown in (23) and in Figure 1. This condition induces the variation in power injection at each node according to the transfer function in (13) or (14). Finally, this variation in power injection is transferred into the variation in power flow in the line l , which is then multiplied by the PTDF term. Consequently, the target system for managing congestion in the transmission line can be represented as
H μ , l ( s ) = k = 1 n b { S l , k 2 τ g , k s + c g , k + S l , k 2 τ d , k s c d , k }
Inelastic demand in response to price can be written as:
H μ , l ( s ) = i = 1 n b { S l , k 2 τ g , k s + c g , k }
The negative sign before S l , k in (25) and (26) indicates that the positive congestion price needs to induce a reduction in power flow in order to meet the maximum flow limit. This configuration, which is the feedback control problem for managing congestion in the line l , is shown in Figure 2.

4. Overall Structure of the Framework

The overall structure of the proposed framework for the optimal design of real-time PBO can be obtained by combining the substructures in Figure 1 and Figure 2. However, modifications should be made after investigating the availability of output signals in Figure 2. In other words, although (24) may be reasonable in terms of expression, it cannot be used in real applications because P f , l λ and P f , l μ are immeasurable quantities. By transforming Figure 2 into a form with measurable variables, the actual power flow, P f , l , is represented as
P f , l = P f , l λ + P f , l μ
Then, (24) can be written as
P f , l max P f , l
As P f , l is a measurable quantity, (28) can be used in practical applications. Thus, the overall structure of the framework with measurable quantities can be constructed as shown in Figure 3.

5. Simulations and Verification

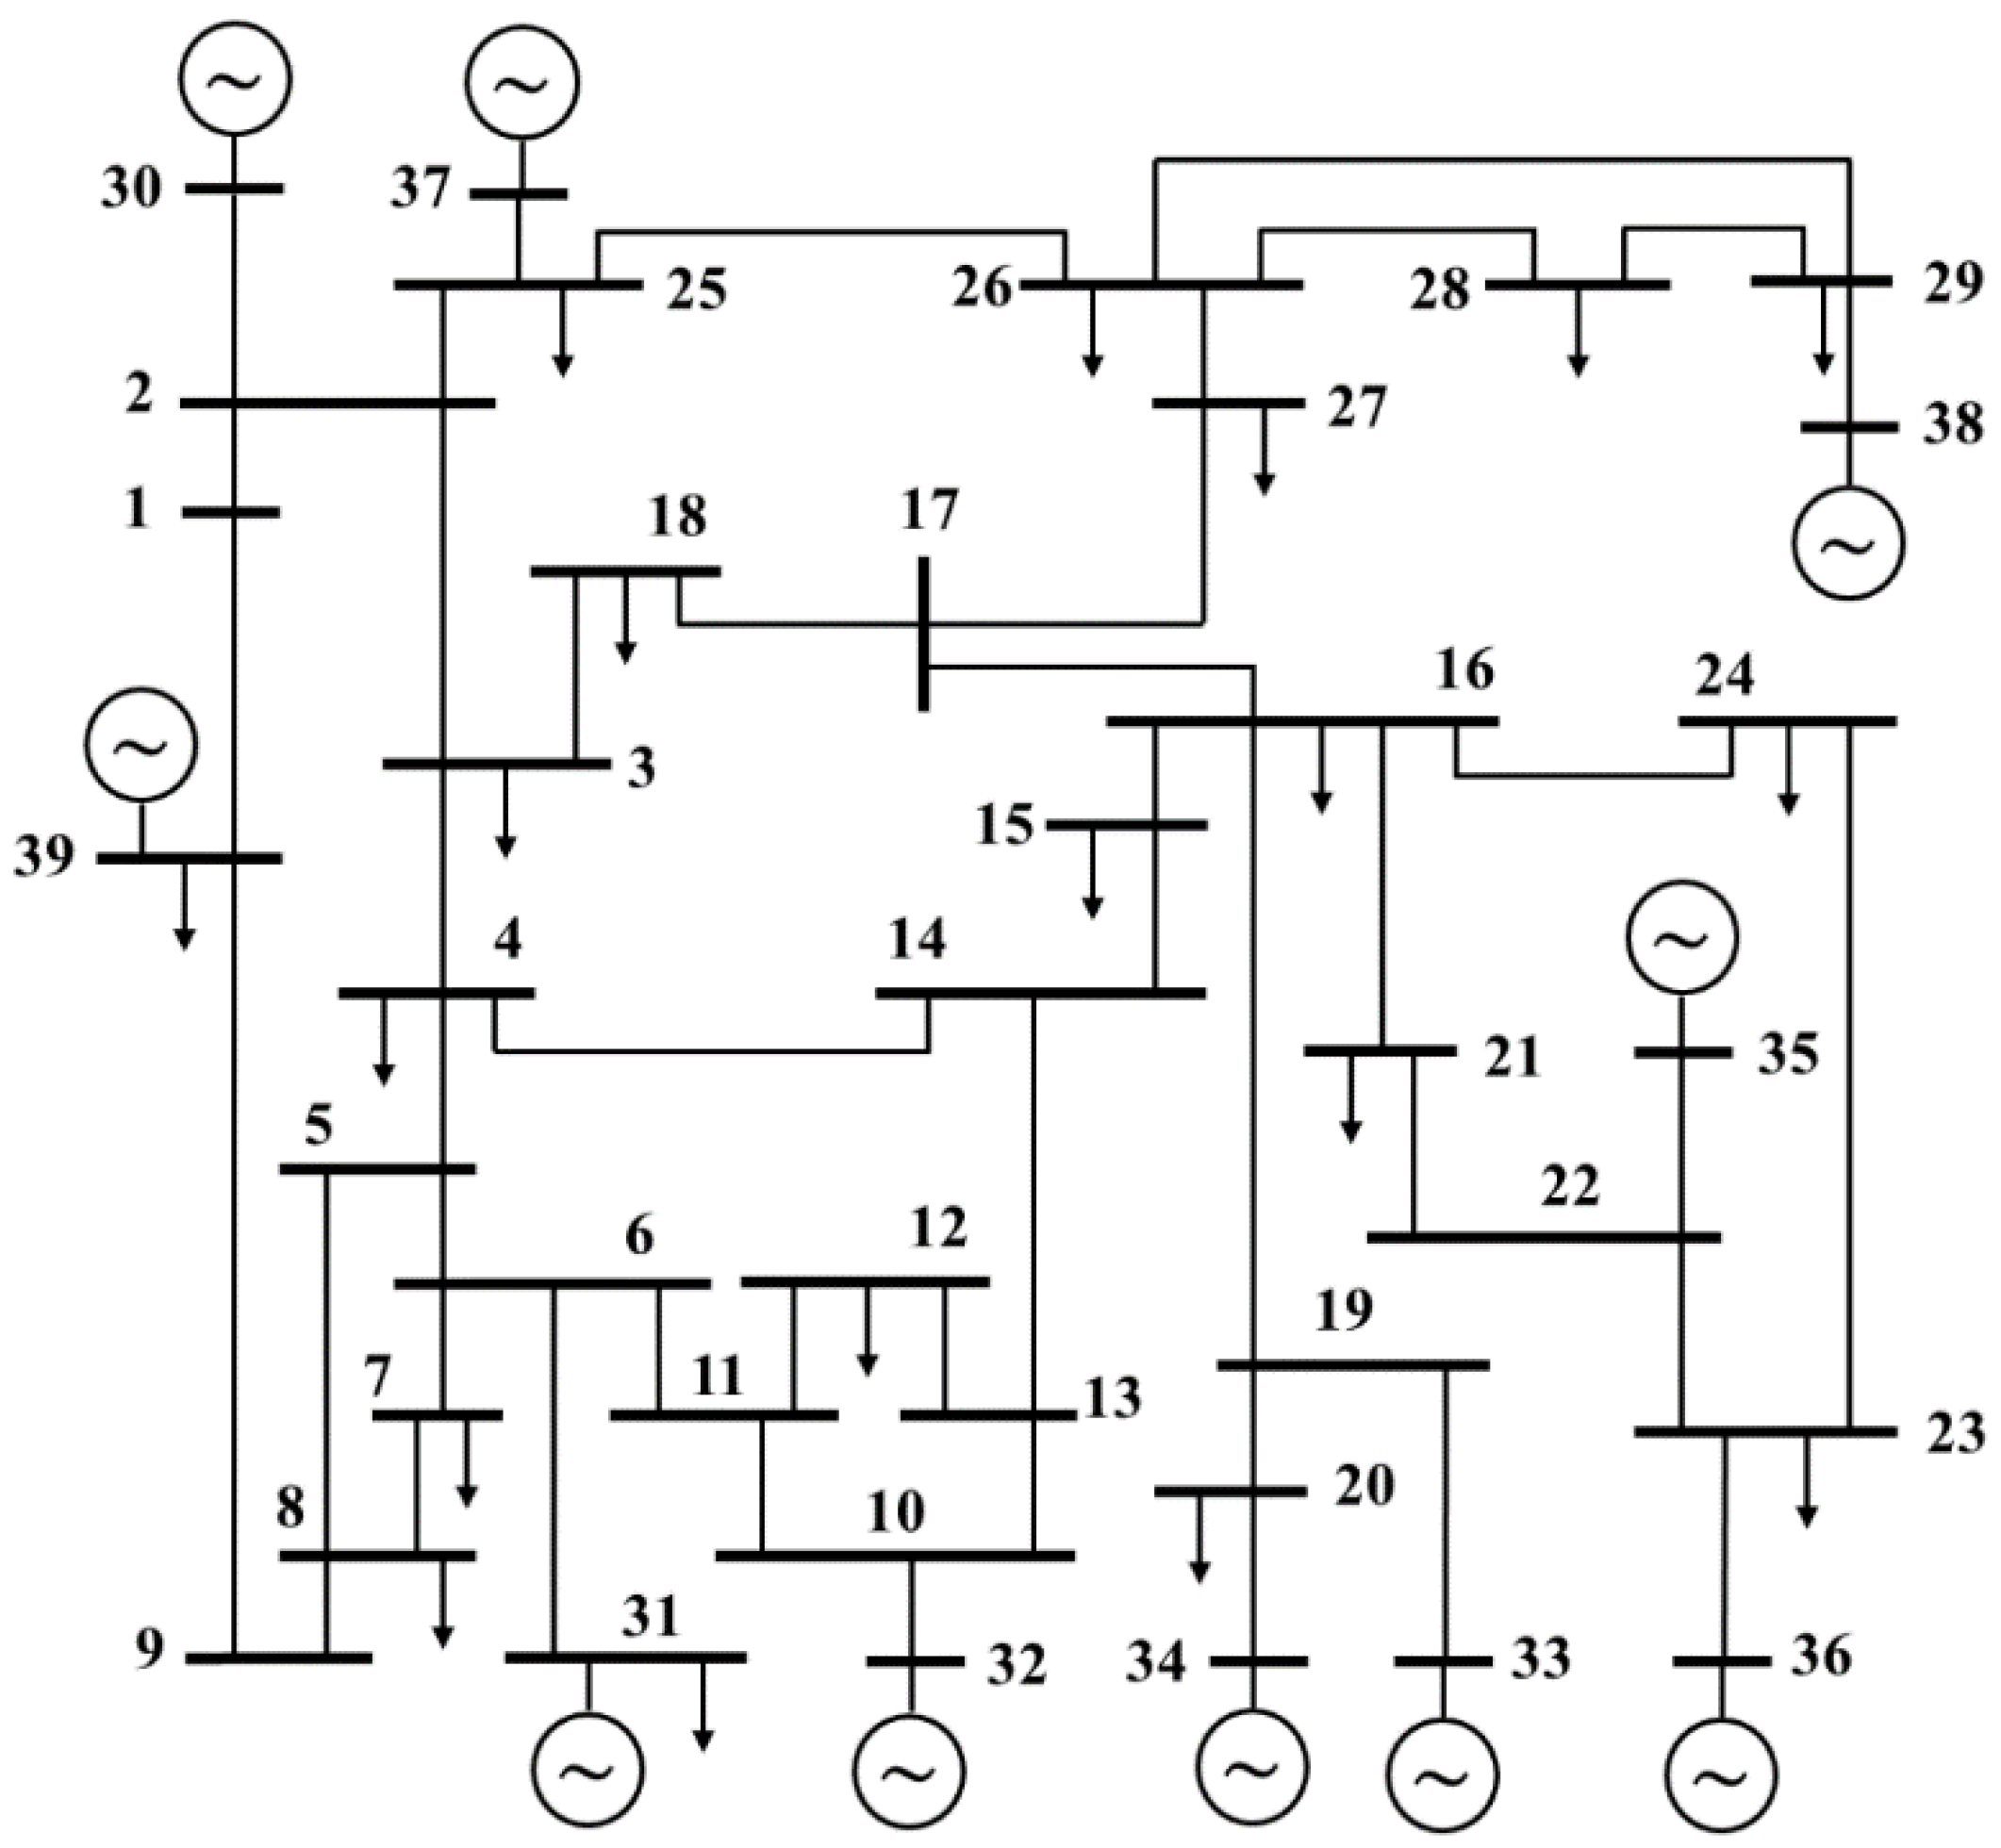
5.1. Simulation Settings

The proposed framework for designing an optimal PBO is simulated and verified with the IEEE 39 bus network [24], as shown in Figure 4. Bus 31 is assumed to be the slack bus [24]. The parameter values for maximum generation and the dynamic equations of suppliers are constructed from generator rating and cost function based on a previous study [25]. These values are given in Table 1. The loads are assumed to be price-inelastic. The constant demand at each bus is the same as in a previous study [24]. The total demand is 6097.1 MW. Subsequently, the quantities of generation in the basic case, which are not limited by maximum generation and congestion, are obtained from the OPF function of Matpower [26]. These values are presented in Table 2. In the basic case, the nodal price at all buses is $15.87/MWh. The values for line susceptance and maximum power flow of each line are taken from [24,26]. In particular, the maximum power flows of the line from bus 16 to bus 19 and the line from bus 23 to bus 24 are both set to 600 MW, which are the lines where congestion occur in the simulation. The simulations are performed with MATLAB/Simulink (version 8.1) and Matpower (version 4.1) [26].
Two scenarios are simulated. The first scenario is a generation failure at the bus 33 given t = 0 [27]. This condition violates the maximum generation at bus 38. As congestion is not observed in this scenario, only the power/energy balance controller is considered. To formulate the power/energy balance controller, three PID controllers are designed according to the tuning rule in [18] by adjusting the speed of closed-loop responses ( τ c ). The specific forms of the balance controllers are presented in Table 3. The approximate target system for tuning can also be derived from [18] as follows:
H ˜ ( s ) = 1 s ( 0.0527 s + 0.1955 )
The specific forms of the balance controllers are given in Table 3.
The second scenario involves the tripping of the line running from bus 21 to 22 at t = 0 [28]. This scenario consists of three events, namely, the violation of maximum generation at bus 38 and the congestion of the line from bus 19 to bus 16 and of the line from bus 23 to bus 24. Two transmission lines are congested; therefore, corresponding controllers for congestion management should be designed in addition to the power/energy balance controller. The PI controller is selected as a type of congestion management controller for the target system in [22] based on the tuning rule in [29]. As a specific form of the power/energy balance controller, the controller in Case A-II ( τ c = 0.4 ) is selected. Based on the selected power/energy balance controller, three designs are developed for the congestion management controller. In Case B-I, however, the concept of separate tuning for the power/energy balance controller and the congestion management controller is not employed; thus, in Case B-I, the congestion management controller is identical to the balance controller. In Case B-II, the gain of the congestion management controller is separately adjusted through trial and error. Finally, in Case B-III, the nodal prices in the steady state are calculated using the existing OPF method, and the congestion management controllers are designed as the unit step functions. Therefore, the congestion prices in Case B-III are not dynamically determined using the feedback control mechanism. The properties of the proposed framework are fully realized in Case B-II by individually designing the power/energy balance controller and congestion management controller. Nonetheless, in addition to the comparison purpose between the methods, Case B-I and Case B-III are meaningful to verify the property of convergence to the optimal state regardless of a specific design within the proposed PBO framework. The specific forms of the balance and congestion management controllers are displayed in Table 4.

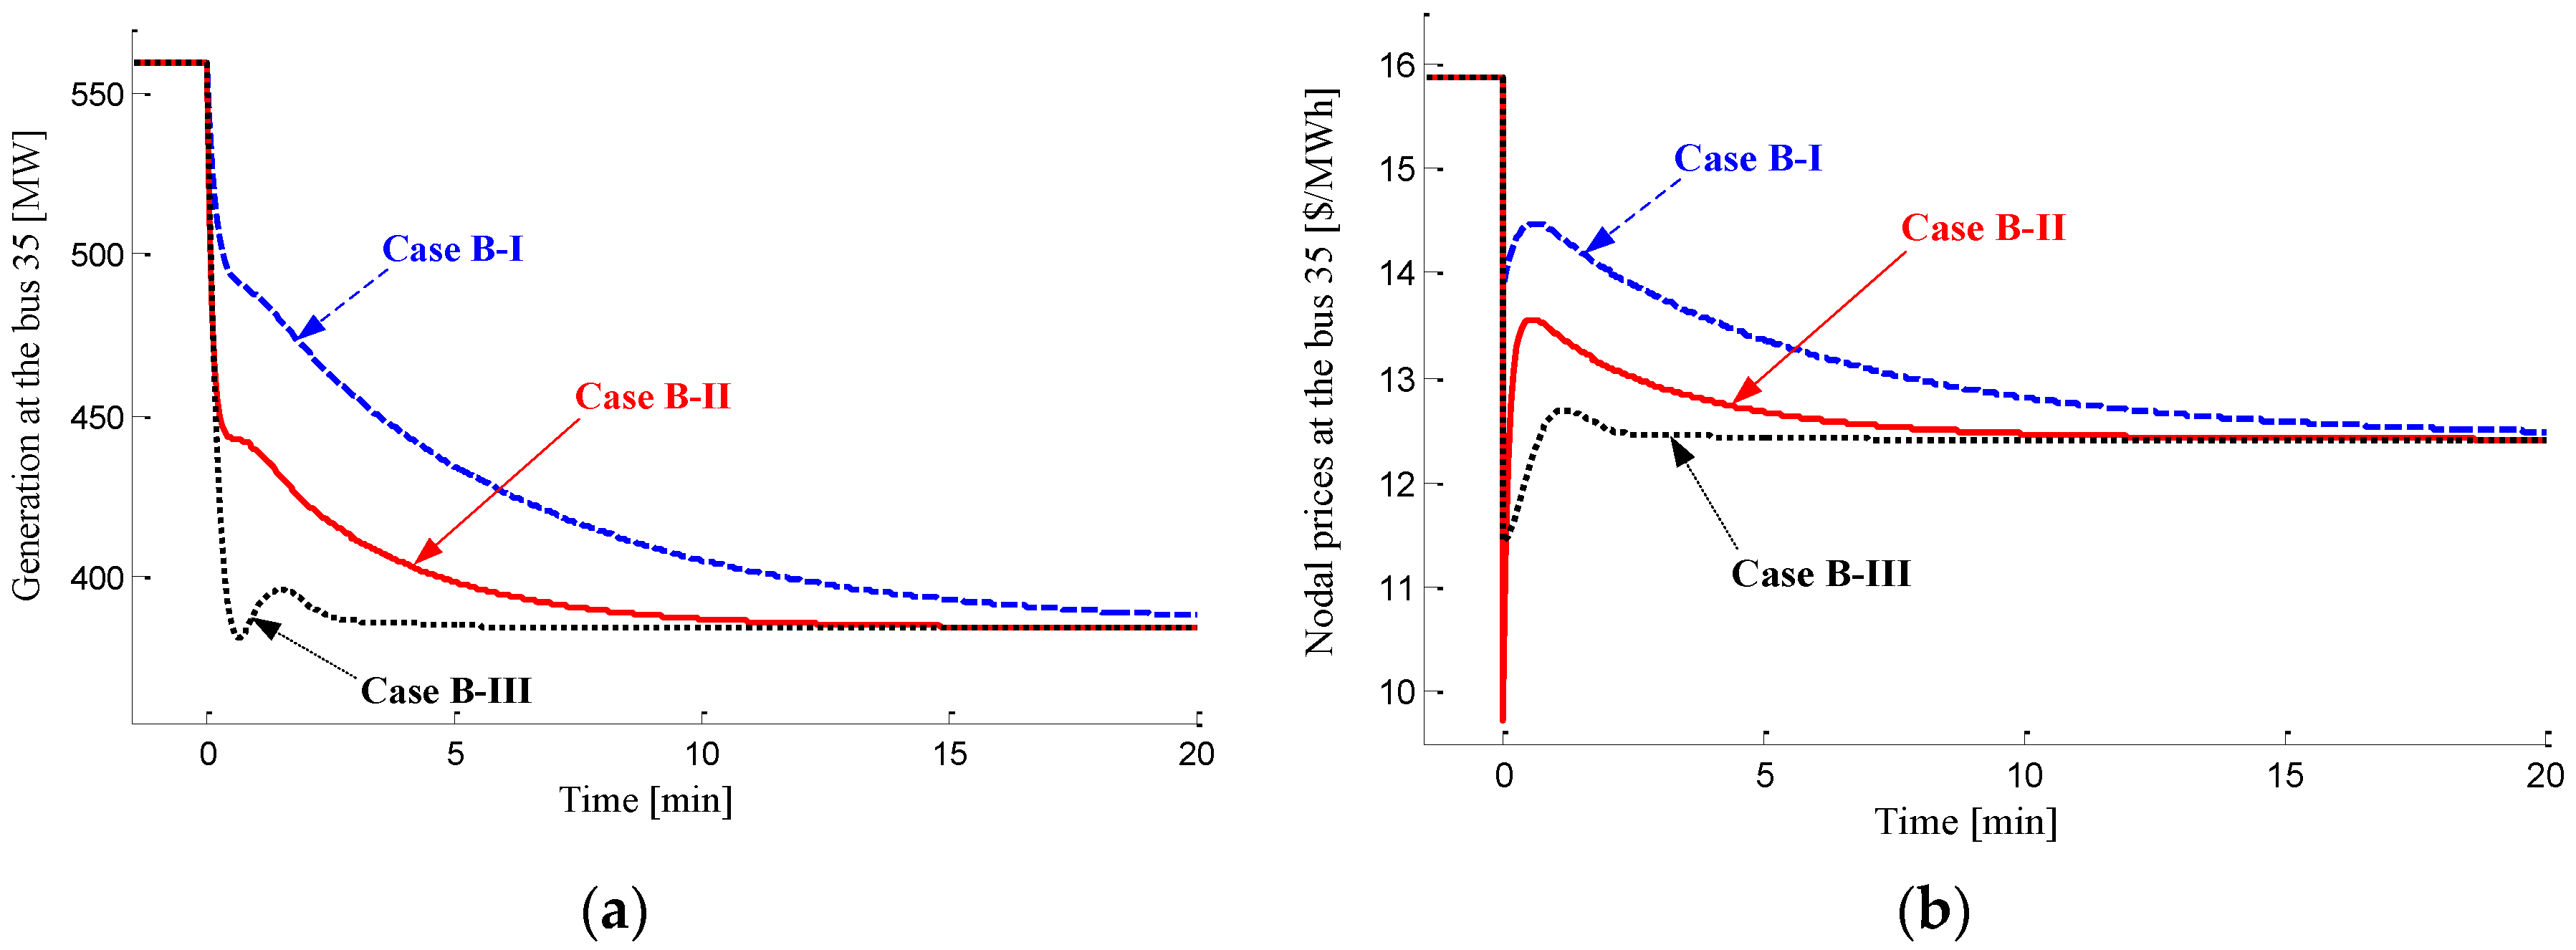
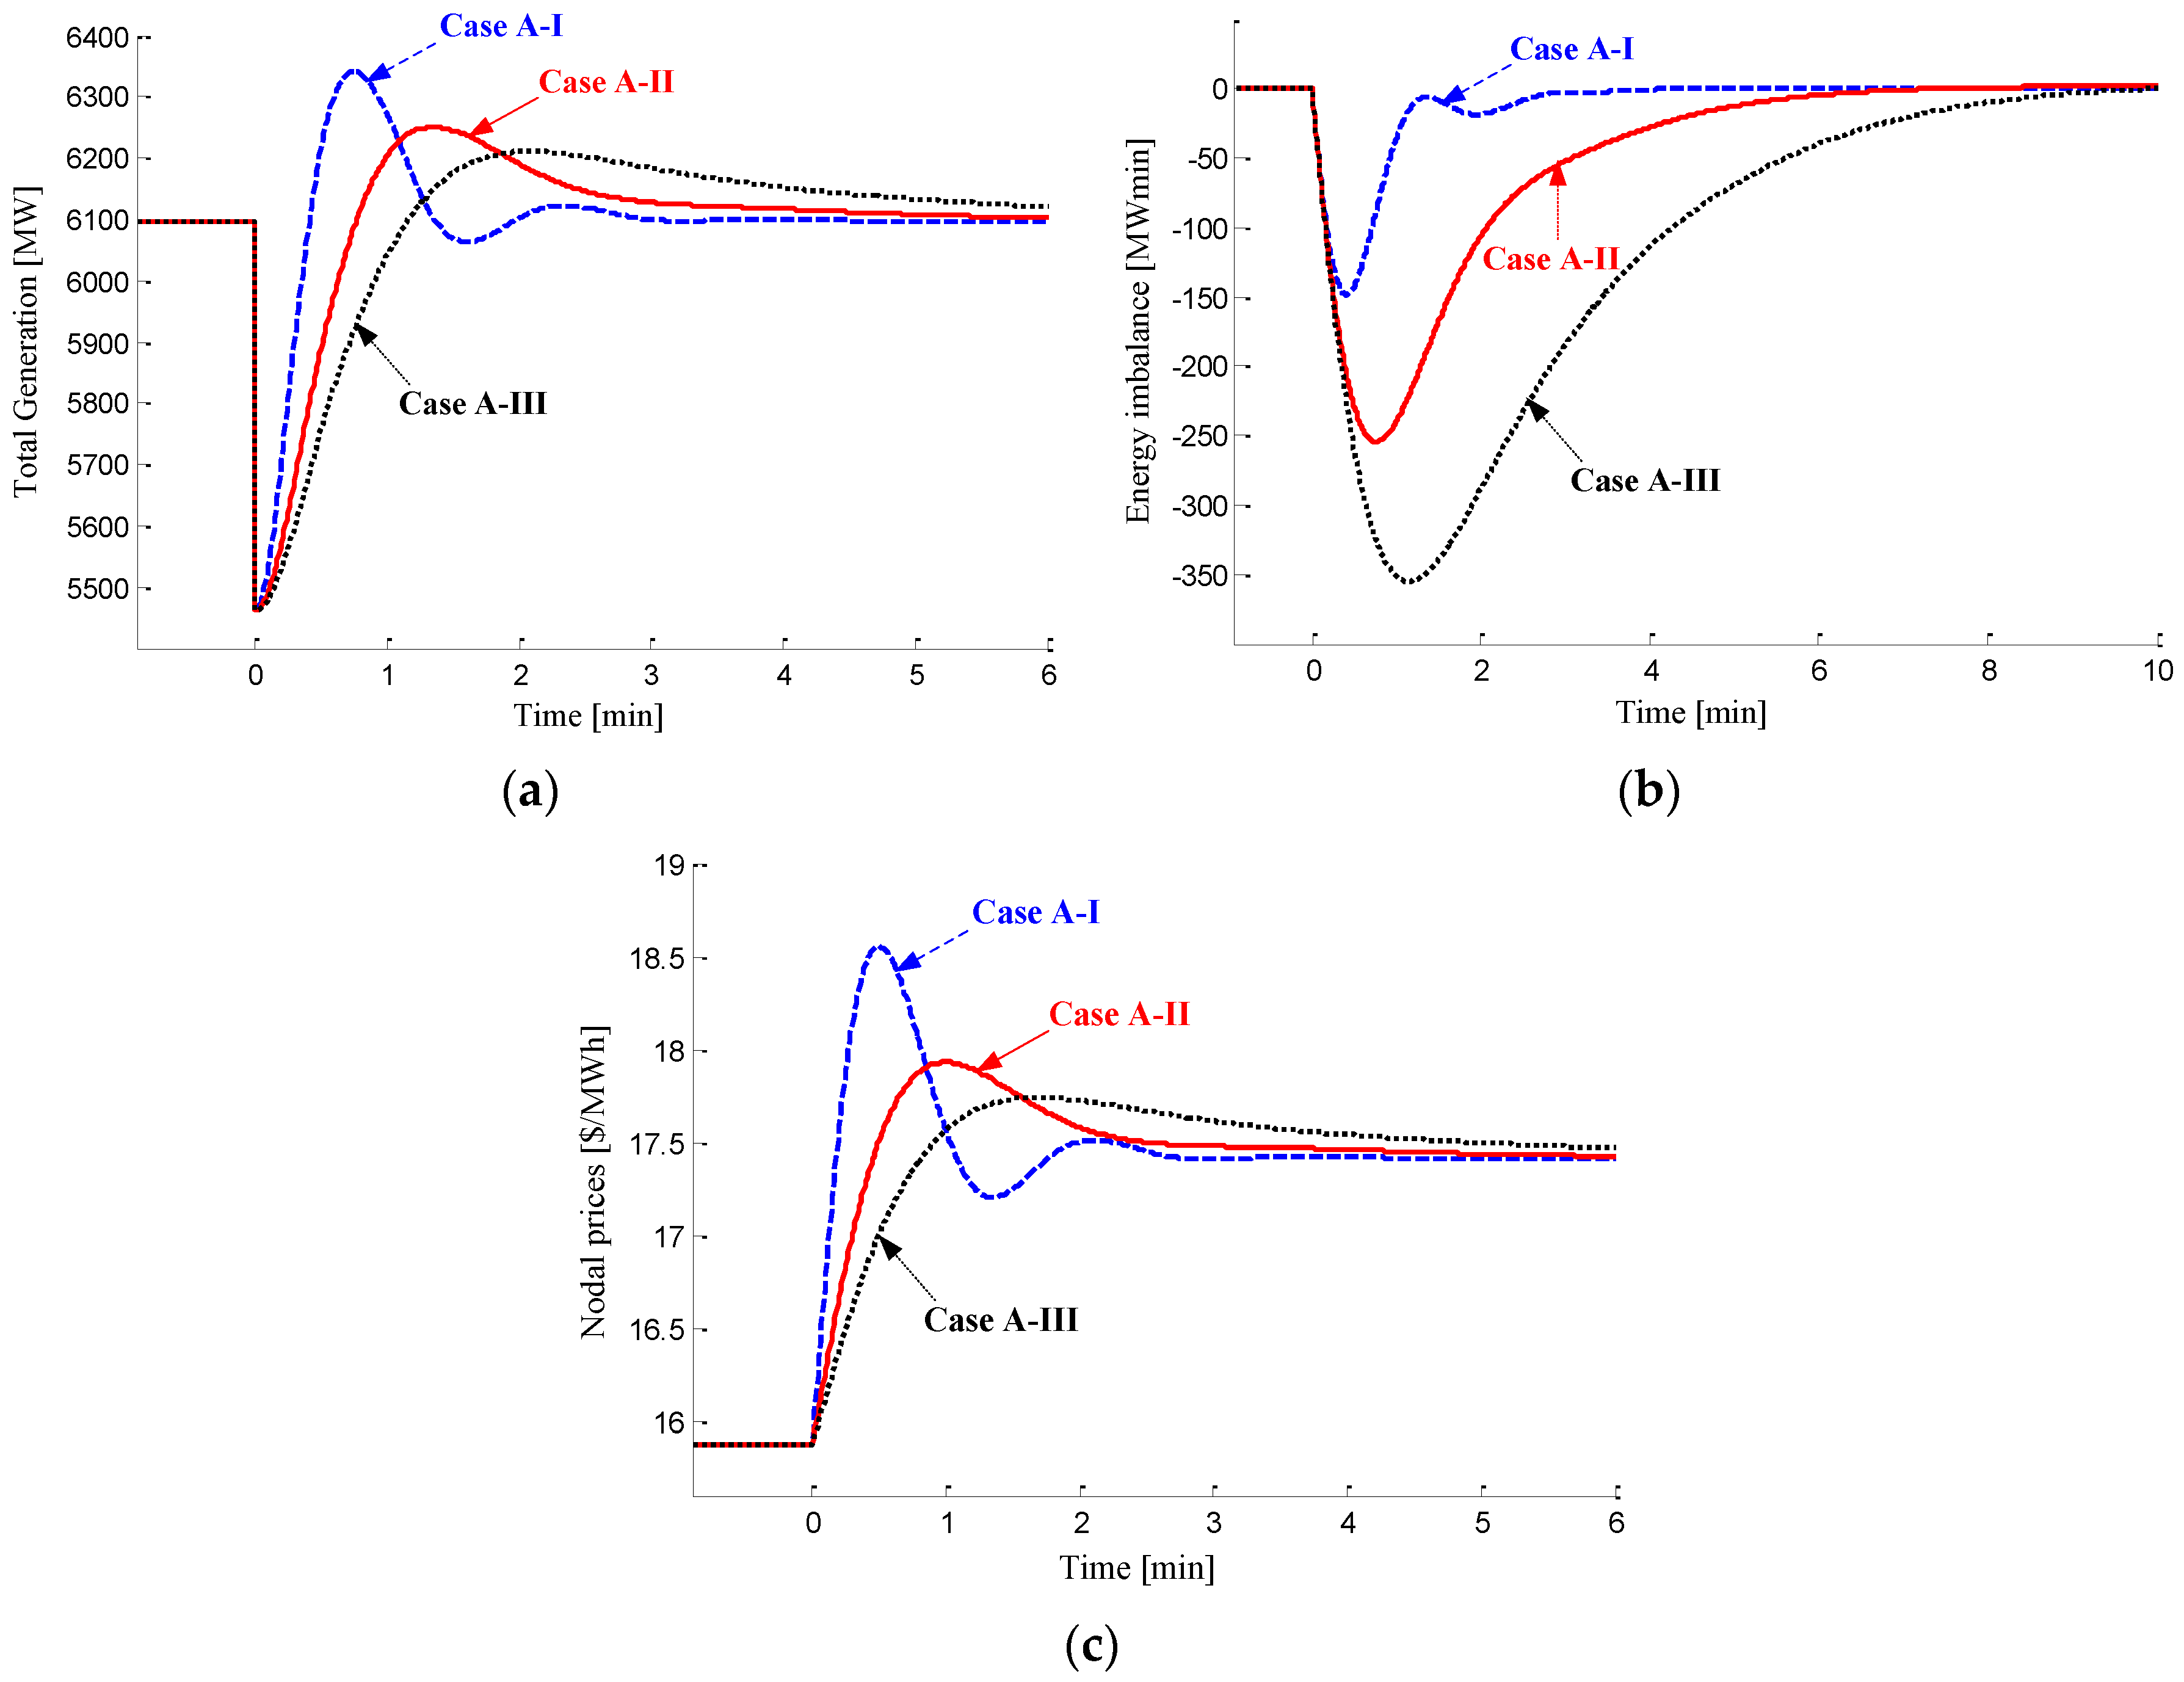
5.2. Simulation Results for a Generation Failure Scenario

The simulation results of a generation failure are shown in Figure 5. A single nodal price is provided to all buses in the absence of congestion. This price changes from $15.87/MWh to $17.41/MWh after the failure. As indicated in Figure 5, the shapes of total generation, energy imbalance, and price vary according to controller design. In particular, the price increases sharply in the presence of a failure. In particular, the total generation and energy imbalance recover quickly to the normal state in contrast to a sharp increase in the price at the instant of failure. Thus, a trade-off exists between the recovery speed and increase in peak value of nodal price. The results in Case A-I must also be investigated. Although the energy imbalance is minimal in this case, the total generation and price oscillate slightly. Therefore, another trade-off occurs between recovery speed and the smooth changes in total generation and energy imbalance. Consequently, a suitable choice between the conflicting properties of various trade-off types is important when designing a PBO.
The simulation does not emphasize the advantages and disadvantages of any certain design; however, it does emphasize the fact that any design can be applied to the proposed PBO framework as long as convergence is guaranteed. In all three controller designs, prices converge to the new steady-state price of $17.41/MWh, which is equal to the optimal nodal price obtained using the OPF method. In all cases, total generation is also equal to total demand. Thus, the proposed framework can generally be used with any of the optimal PBO designs. To improve the dynamic characteristics of PBO, the target system in either (13) or (14) can provide important design information.

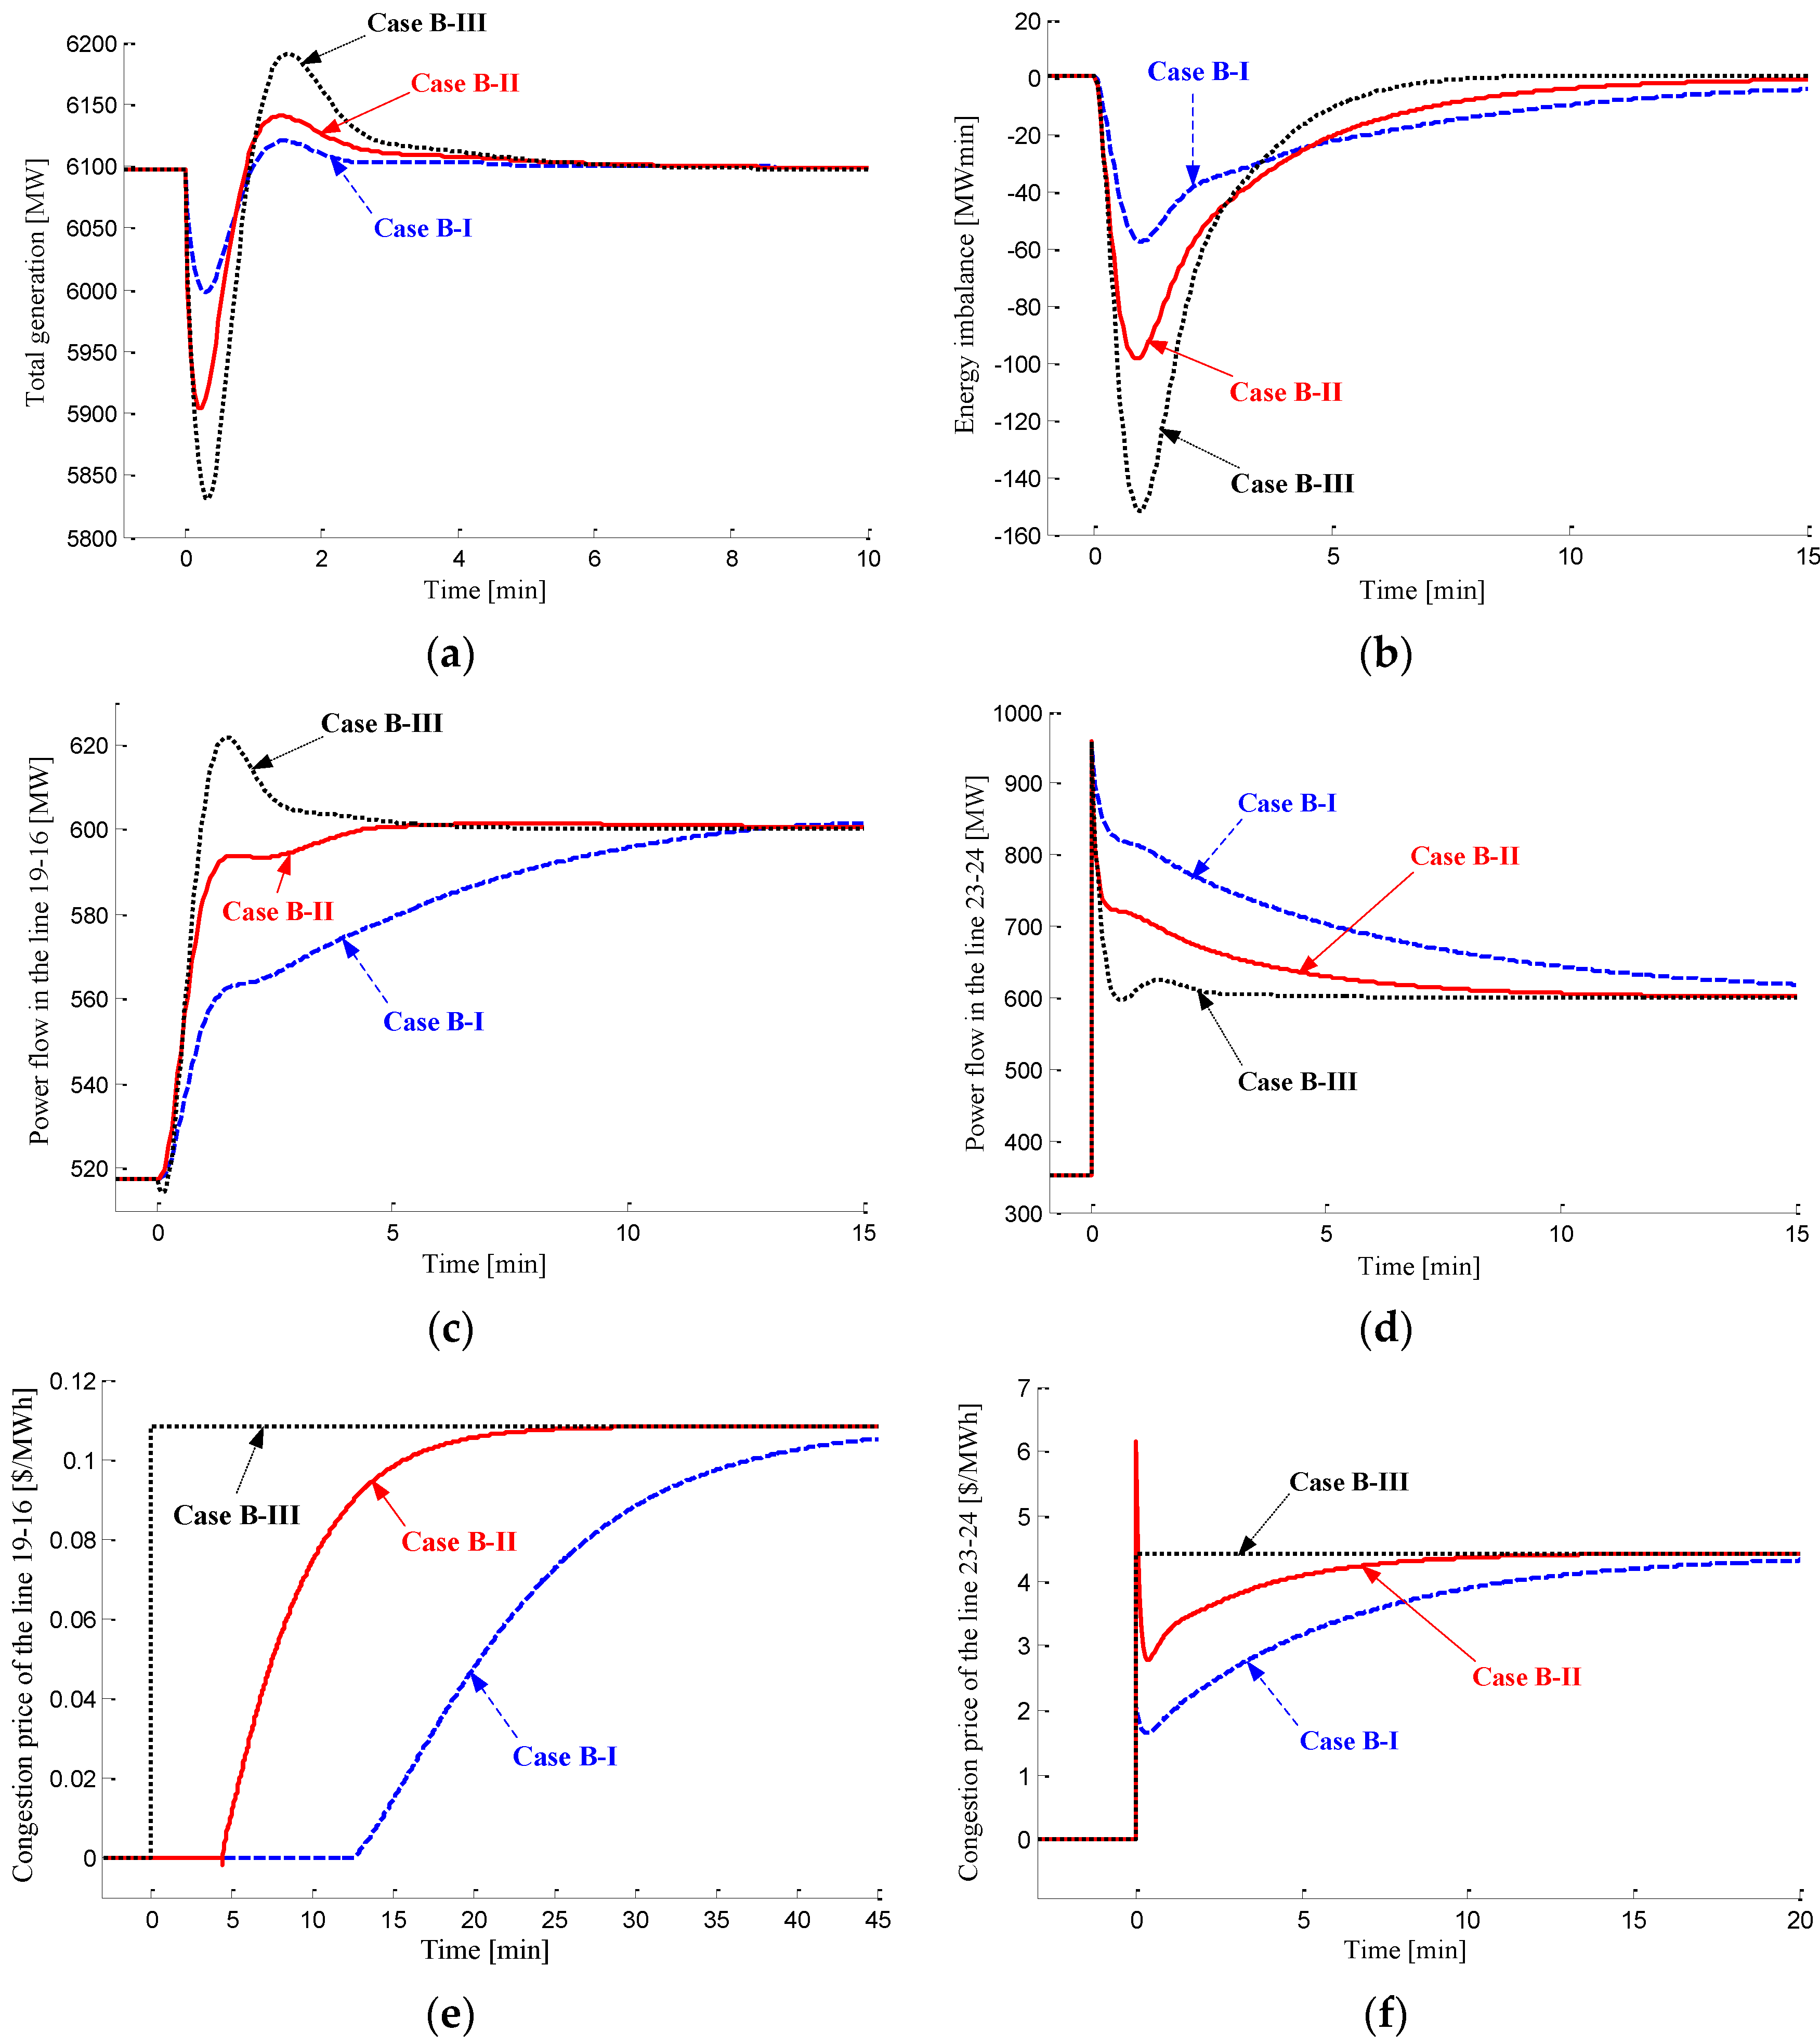
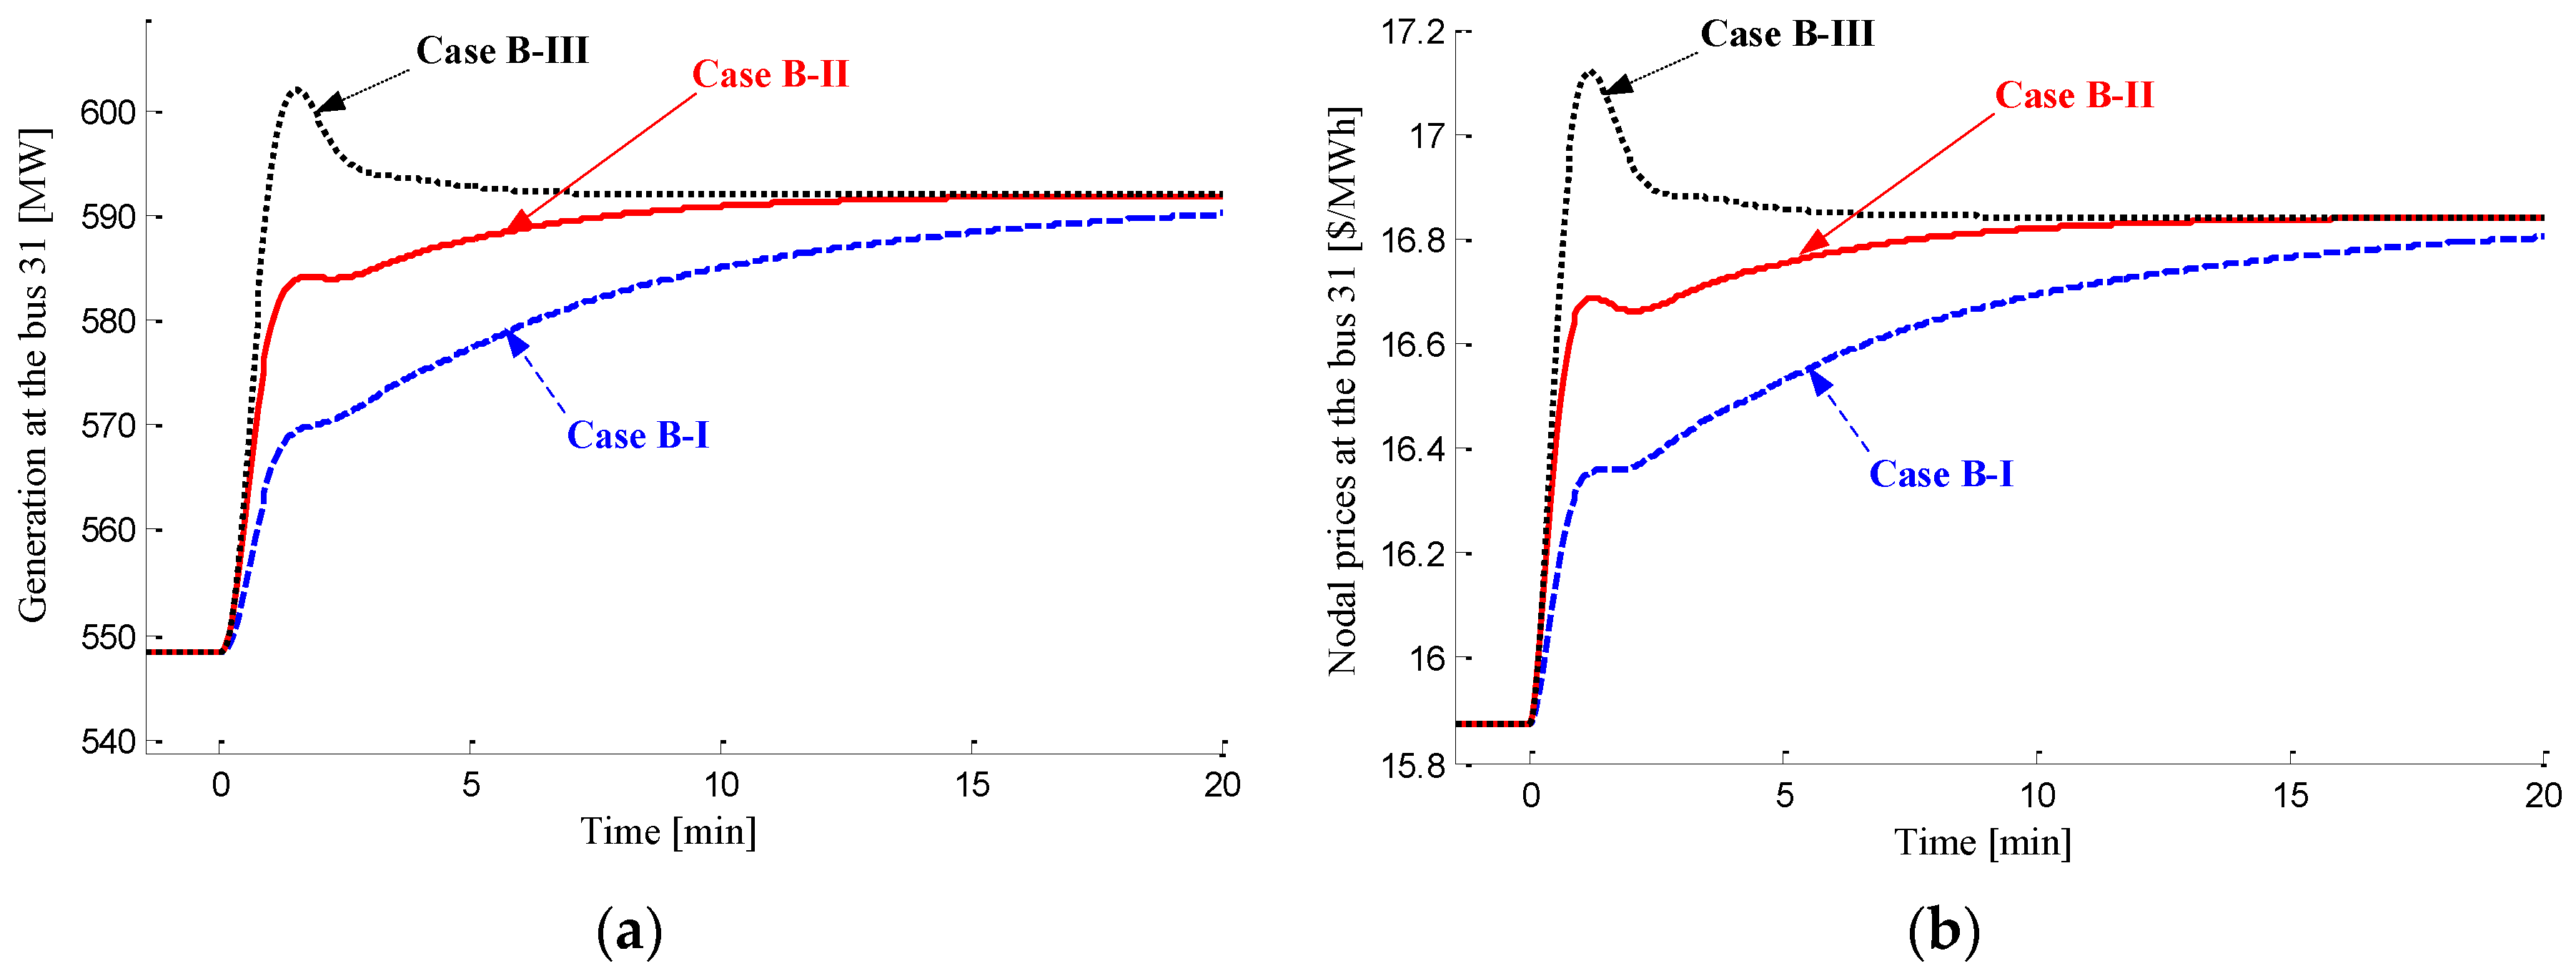
5.3. Simulation Results for a Line Trip Scenario

The simulation results of a line trip are depicted in Figure 6. Even without events such as a generation failure, power/energy imbalance occurs due to the variation in generation quantities. This variation is caused by the price of relieving congestion in the line from bus 23 to bus 24. However, this imbalance is smaller than that in the generation failure event, as shown in Figure 5b.
Figure 6b shows that Case B-I is better than Case B-II because the decrease in the energy imbalance, related to the system frequency, is the smaller. However, it can be seen from Figure 6c,d that the congestion is resolved too slow and, thus, Case B-I is worse than Case B-II in terms of the congestion management. In contrast, Figure 6c shows that the congestions in the line from bus 23 to bus 24 is resolved the fast in Case B-III. As can be seen from Figure 6d, the same is true for the line from bus 19 to bus 16. However, it can be seen from Figure 6b that the variation in the energy imbalance is severe in Case B-III, which means that the system frequency drops the most in Case B-III for the same event. Therefore, considering both the aspects of power/energy balance and congestion management, Case B-II can be the most suitable choice, and the proposed framework enables such a better design.
Regardless of the performance of each case, analyzing the relationship between power/energy balance and congestion management is important. The rapid resolution of congestion is the result of rapid variation and the high overshoot in power generation, as shown in Figure 6a. These occurrences are in turn induced by the abrupt increase in congestion prices, as observed in Figure 6e,f. However, the rapid variation in power generation causes a strong energy imbalance, as depicted in Figure 6b. Thus, congestion management can be enhanced at the expense of energy imbalance or frequency stability. This scenario exhibits a type of trade-off between balance and congestion management. In other words, each transmission system operator may individually manage the congestion of a corresponding line within the framework. Congestion management controllers are also separately designed in this case. However, if the design of the congestion management controller is extremely inclined toward managing the corresponding line, the power/energy balance or frequency stability can be threatened. Therefore, a policy or rule should be implemented in order to appropriately coordinate operations of independent system operators or transmission system operators in a decentralized environment.
The significant difference between the framework and the OPF method is illustrated in Figure 6e. Given that the framework is based on a control mechanism with real-time feedback, the congestion prices of the line from bus 19 to bus 16 increase from zero immediately following congestion ( t = 12.66 min in Case B-I and t = 4.43 min in Case B-II). In Case B-III, the congestion prices jump from zero to the OPF solution at t = 0 because the OPF method was applied in this case. Therefore, the final values in the steady state can be calculated, but the exact instance of congestion onset cannot be predetermined. Hence, the proposed framework is suitable for real-time operation.
As in the generation failure scenario, the framework focuses not only on the performance of the specific design, but also on the convergence characteristics as compared to those of the optimal solution. The total generation is first equalized to a constant total demand in all three cases, as indicated in Figure 6a. The energy imbalance then returns to zero, as displayed in Figure 6b. The congestion prices of the line from bus 19 to bus 16 and the line from bus 23 to bus 24 converge at $0.11 and $4.43/MWh, respectively. These values are equal to those obtained using the OPF method. At all buses, the nodal prices converge to the OPF solution, as do the generation quantities of ten generator buses. This finding is demonstrated with the selected buses 31 and 35 in Figure 7 and Figure 8, respectively. Although the shapes of the variation in the three cases differ with respect to the design of the congestion management controller, they all converge to a single optimal solution derived from the OPF method.

6. Conclusions

This paper proposed a decentralized framework for the real-time price-based power system operation using the feedback control mechanism. The feedback controller determines the status of the power system with regard to power balance and line flows and generates an appropriate price signal in real-time when imbalance or congestion occurs in a power system. Since the substructures of the framework are derived from the optimality conditions of the OPF method, the proposed PBO framework guarantees optimality. In addition, any type of controller can be applied under the optimal condition within the framework as long as it satisfies the convergence property. Further, the tuning of the proposed framework will improve the dynamic characteristics of the PBO.
The performance of the proposed framework was verified with the IEEE 39 bus network for various PBO designs under various conditions, including a generation failure and a transmission line trip. The framework led to stable power system operation after failure, regardless of the form of the controller, even though the transient characteristics are different. The results clearly indicated that the prices in the framework converged to the optimal solution of the OPF method.
The advantages of the PBO lie in the fact that it not only guarantees optimality, but also allows for the use of any type of controller, including a common PID controller. Furthermore, the framework is suitable for the operation of a decentralized environment with a large number of distributed energy resources, which may be the shape of future power systems.

Acknowledgments

This work was supported by the Brain Korea 21 Plus Project in 2016.

Author Contributions

Young Gyu Jin designed the study, developed the mathematical model, and wrote the paper. Si Young Lee and Seung Wan Kim performed the simulations and analysis, and revised the paper. Yong Tae Yoon provided important comments on the approach to structure, modeling, and analysis.

Conflicts of Interest

The authors declare no conflict of interest.

Nomenclature

F total cost function
C g , k cost function of generation at the bus k.
U d , k utility or benefit function of consumption at the bus k
n b number of the buses
n l number of transmission lines
P g = [ P g , 1 ,     ,   P g , n b ] T amount of power generation
P d = [ P d , 1 ,     ,   P d , n b ] T amount of power consumption
P = P g P d net power injection
B line susceptance matrix for DC power flow, n b × n b matrix
B k k-th column of line susceptance matrix B
Β ^ modified line susceptance matrix composed by eliminating the column of slack bus from B, n b × ( n b 1 ) matrix
Β ^ modified line susceptance matrix composed by eliminating the row and the column of slack bus B, ( n b 1 ) × ( n b 1 ) matrix.
θ ^ = [ θ 2 θ 3 θ n b ] relative phase angle to the slack bus assumed to be bus 1
P f = [ P f , 1 P f , 2 P f , n l ] active power flow
P f m a x = [ P f , 1 max P f , 2 max P f , n l max ] active power flow limit
P f i , j active power flow from bus i to bus j
x i , j inductive reactance in p.u. of transmission line connecting buses i and j
X = diag [ 1 / x i , j ] line susceptance matrix
A ^ branch-to-node incidence matrix
λ P Lagrange multiplier associated with equality constraint for power balance
λ θ Lagrange multipliers associated with the equality constraint for power flow, n b × 1 vector.
λ ^ θ Lagrange multipliers associated with the equality constraint for power flow except for the slack bus, ( n b 1 ) × 1 vector.
μ + , μ Lagrange multipliers associated with the inequality constraints for power flow limit
S = [ S 1   S 2     S n b ] = [ S l , k ] matrix of power transfer distribution factors
S l , k sensitivity of the power flow in the line l to power at the bus k
ρ set of nodal prices, n b × 1 vector
ρ ^ set of nodal prices except for the slack bus, ( n b 1 ) × 1 vector
b g , k + c g , k P g , k marginal cost of generation at the bus k
b d , k + c d , k P d , k marginal benefit of consumption at the bus k.
τ g , k , τ d , k time constants of dynamic equations for generation and consumption at the bus k
E energy imbalance or accumulated power imbalance
D ( s ) output disturbance added to energy imbalance
H λ ( s ) target system for tuning in terms of power and energy balance
H μ , l ( s ) target system for tuning in terms of congestion management of the line l
G λ ( s ) controller for balancing power and energy
G μ , l ( s ) controller for congestion management in the line l

References

  1. Wood, A.; Wollenberg, B. Power Generation, Operation and Control, 2nd ed.; Wiley: New York, NY, USA, 1996. [Google Scholar]
  2. Global Wind Report−Annual Market Update 2015. Global Wind Energy Council. Available online: http://www.gwec.net/wp-content/uploads/vip/GWEC-Global-Wind-2015-Report_April-2016_22_04.pdf (accessed on 1 November 2015).
  3. Karimi, M.; Mokhlis, H.; Naidu, K.; Uddin, S.; Bakar, A.H.A. Photovoltaic penetration issues and impacts in distribution network—A review. Renew. Sustain. Energy Rev. 2016, 53, 594–605. [Google Scholar] [CrossRef]
  4. Walling, R.A.; Saint, R.; Dugan, R.C.; Burke, J.; Kojovic, L.A. Summary of distributed resources impact on power delivery systems. IEEE Trans. Power Deliv. 2008, 23, 1636–1644. [Google Scholar] [CrossRef]
  5. De Martini, P.; Kristov, L. Distribution Systems in a High Distributed Energy Resources Future: Planning, Market Design, Operation and Oversight; Lawrence Berkeley Laboratory: Berkeley, CA, USA, 2015. [Google Scholar]
  6. Kok, K.; Widergren, S. A society of devices. PES Mag. 2016, 14, 34–45. [Google Scholar]
  7. Schweppe, F.C.; Tabors, R.D.; Kirtley, H.R., Jr.; Outhred, H.R.; Pickel, F.H.; Cox, A.J. Homeostatic utility control. IEEE Trans. Power Appar. Syst. 1980, PAS-99, 1151–1163. [Google Scholar] [CrossRef]
  8. Schweppe, F.C.; Caramanis, M.C.; Tabors, R.D.; Bohn, R.D. Spot Pricing of Electricity; Kluwer Academic Publishers: Hingham, MA, USA, 1988. [Google Scholar]
  9. Alvarado, F.L. The Dynamics of Power System Markets; University of Wisconsin-Madison: Madison, WI, USA, 1997. [Google Scholar]
  10. Alvarado, F.L. The stability of power system markets. IEEE Trans. Power Syst. 1999, 14, 505–511. [Google Scholar] [CrossRef]
  11. Jokic, A.; Wittebol, E.H.M.; Van den Bosch, P.P.J. Dynamic market behavior of autonomous network-based power systems. Eur. Trans. Electr. Power 2006, 16, 533–544. [Google Scholar] [CrossRef]
  12. Christie, R.D.; Wollenberg, B.F.; Wangensteen, I. Transmission management in the deregulated environment. Proc. IEEE 2000, 88, 170–195. [Google Scholar] [CrossRef]
  13. Glatvitsch, H.; Alvarado, F. Management of multiple congested conditions in unbundled operation of a power system. IEEE Trans. Power Syst. 1998, 13, 1013–1019. [Google Scholar] [CrossRef]
  14. Alvarado, F.L. Controlling power systems with price signals. Decis. Support Syst. 2005, 40, 495–504. [Google Scholar] [CrossRef]
  15. Jokic, A.; Lazar, M.; Van den Bosch, P.P.J. Real-time control of power systems using nodal prices. Int. J. Electr. Power Energy Syst. 2009, 31, 522–530. [Google Scholar] [CrossRef]
  16. Nyeng, P.; Ostergaard, J. Information and communications systems for control-by-price of distributed energy resources and flexible demand. IEEE Trans. Smart Grid 2011, 2, 334–341. [Google Scholar] [CrossRef]
  17. Corradi, O.; Ochsenfeld, H.; Madsen, H.; Pinson, P. Controlling electricity consumption by forecasting its response to varying prices. IEEE Trans. Power Syst. 2013, 28, 421–429. [Google Scholar] [CrossRef]
  18. Jin, Y.G.; Lee, S.Y.; Kim, S.W.; Yoon, Y.T. Designing rule for price-based operation with reliability enhancement by reducing the frequency deviation. IEEE Trans. Power Syst. 2013, 28, 4365–4372. [Google Scholar] [CrossRef]
  19. Moradi, H.; Abtahi, A.; Esfahanian, M. Optimal operation of a multi-source microgrid to achieve cost and emission targets. In Proceedings of the IEEE Power and Energy Conference, Champaign, IL, USA, 19–20 February 2016; pp. 1–6.
  20. Boyd, S.; Vandenberghe, L. Convex Optimization; Cambridge University Press: Cambridge, NY, USA, 2004. [Google Scholar]
  21. Bergen, A.; Vittal, V. Power System Analysis, 2nd ed.; Prentice-Hall: Upper Saddle River, NJ, USA, 2000. [Google Scholar]
  22. Baldick, R. Electricity market equilibrium models: The effect of parametrization. IEEE Trans. Power Syst. 2002, 17, 1170–1176. [Google Scholar] [CrossRef]
  23. Gomez-Exposito, A.; Conejo, A.J.; Canizares, C. Electric Energy Systems: Analysis and Operation; CRC Press: Boca Raton, FL, USA, 2008. [Google Scholar]
  24. Pai, M.A. Energy Function Analysis for Power System Stability; Kluwer Academic Publishers: Hingham, MA, USA, 1989. [Google Scholar]
  25. Nguyen, T.B.; Pai, M.A. Dynamic security-constrained rescheduling of power systems using trajectory sensitivities. IEEE Trans. Power Syst. 2003, 18, 848–854. [Google Scholar] [CrossRef]
  26. Zimmerman, R.D.; Murillo-Sánchez, C.E.; Thomas, R.J. Matpower: Steady-state operations, planning and analysis tools for power systems research and education. IEEE Trans. Power Syst. 2011, 26, 12–19. [Google Scholar] [CrossRef]
  27. Zhong, Z. Power Systems Frequency Dynamic Monitoring System Design and Applications. Ph.D. Thesis, Virginia Polytechnic Institute and State University, Blacksburg, VA, USA, July 2005. [Google Scholar]
  28. Cai, H.R.; Chung, C.Y.; Wong, K.P. Application of differential evolution algorithm for transient stability constrained optimal power flow. IEEE Trans. Power Syst. 2008, 23, 719–728. [Google Scholar] [CrossRef]
  29. Skogestad, S. Simple analytic rules for model reduction and PID controller tuning. J. Process Control 2003, 13, 291–309. [Google Scholar] [CrossRef]
Figure 1. Substructure for the relationship between the nodal prices and congestion prices.
Energies 10 00291 g001
Figure 2. Substructure for the management of line congestion.
Energies 10 00291 g002
Figure 3. Overall structure of the framework for the design of optimal price-based operation.
Energies 10 00291 g003
Figure 4. One-line diagram of the IEEE 39 bus network.
Energies 10 00291 g004
Figure 5. Simulation results for generation failure at the bus 33: (a) total amount of generation; (b) energy imbalance; and (c) nodal prices.
Energies 10 00291 g005
Figure 6. Simulation results for the line tripping scenario in the line from bus 21 to bus 22: (a) total amount of generation; (b) energy imbalance; (c) power flow in the line 19–16; (d) power flow in the line 23–24; (e) congestion prices of the line 19–16; and (f) congestion prices of the line 23–24.
Energies 10 00291 g006
Figure 7. Simulation results for selected bus 31 in the line trip scenario using the framework: (a) amount of generation; and (b) nodal prices.
Energies 10 00291 g007
Figure 8. Simulation results for selected bus 35 in the line trip scenario using the framework: (a) amount of generation; and (b) nodal prices.
Energies 10 00291 g008
Table 1. Parameter values for the maximum generation and the dynamic behaviors of 10 suppliers in the IEEE 39 bus network.
BusMaximum Generation (MW) τ g (min) c g ($/MW2h) b g ($/MWh)
303500.60.03866.9
316501.10.02223.7
328001.20.02082.8
337501.40.01764.7
346501.00.02562.8
357501.30.01883.7
367501.30.01984.8
377001.10.02263.6
389001.80.01423.7
3912002.00.01283.9
Table 2. Quantities of generation in the basic case without any violation of constraints obtained from the OPF method.
BusGeneration (MW)
30232.45
31548.32
32628.50
33634.81
34510.65
35647.49
36559.23
37543.04
38857.23
39935.37
Table 3. Three designs of the power/energy balance controller in the simulation of a generation failure scenario.
Case Name τ g (min)Power/Energy Balance Controller G λ ( s )
Case A-I0.2 (fast) 1.31 × ( 1 + 1 1.07 s + 0.20 s )
Case A-II0.4 (normal) 0.57 × ( 1 + 1 1.87 s + 0.23 s )
Case A-III0.6 (slow) 0.36 × ( 1 + 1 2.67 s + 0.24 s )
Table 4. Three designs of the power/energy balance controller in the simulation of a generation failure scenario.
Case NamePower/Energy Balance Controller G λ ( s ) Congestion Management Controller G μ , l ( s )
Case B-I 0.57 × ( 1 + 1 1.87 s + 0.23 s ) 0.57 × ( 1 + 1 1.87 s )
Case B-II 1.71 × ( 1 + 1 1.87 s )
Case B-III μ 16 19 = 0.11 u ( t )
μ 23 24 = 4.43 u ( t )

