Article

Analysis of Pressure Rise in a Closed Container Due to Internal Arcing

School of Electrical Engineering, Wuhan University, Wuhan 430072, China
*
Author to whom correspondence should be addressed.
Energies 2017, 10(3), 294; https://doi.org/10.3390/en10030294
Submission received: 30 October 2016 / Revised: 23 February 2017 / Accepted: 25 February 2017 / Published: 2 March 2017

Abstract

:
When an arc fault occurs in a medium-voltage (MV) metal enclosed switchgear, the arc heats the filling gas, resulting in a pressure rise, which may seriously damage the switchgear, the building it is contained in, or even endanger maintenance personnel. A pressure rise calculation method based on computational fluid dynamics (CFD) has been put forward in this paper. The pressure rise was calculated and the arc tests between the copper electrodes were performed in the container under different gap lengths by the current source. The results show that the calculated pressure rise agrees well with the measurement, and the relative error of the average pressure rise is about 2%. Arc volume has less effect on the pressure distribution in the container. Arc voltage Root-Mean-Square (RMS) has significant randomness with the change of arc current, and increases with the increase of gap length. The average arc voltage gradients measure at about 26, 20 and 16 V/cm when the gap lengths are 5, 10 and 15 cm, respectively. The proportion (thermal transfer coefficient kp) of the arc energy leading to the pressure rise in the container is about 44.9%. The pressure is symmetrically distributed in the container before the pressure wave reaches the walls and the process of the energy release is similar to an explosion. The maximum overpressure in the corner is increased under the reflection and superimposition effects of the pressure wave, but the pressure waves will be of no importance any longer than a few milliseconds in the closed container.

1. Introduction

Switchgear plays a very important role in electrical energy transport, which has wide application in the power system [1]. If an arc fault occurs in the medium-voltage (MV) switchgear, a considerable amount of energy will be released within a short period of time. Parts of the released energy will increase the thermal energy of the gas in the switchgear and cause the pressure to build-up, which may cause catastrophic consequences to the switchgear, the building it is contained in, or even the maintenance personnel [2]. In order to evaluate the pressure stress on the wall, the internal arcing classification (IAC) tests have been put forward to verify the quality and safety of the switchgear [3]. However, the arc tests require a long test period, as well as substantial manpower and material resources. Hence, the appropriate calculation methods and the small-scale tests were designed and carried out to get the pressure effect caused by the arc fault in the closed container.
At present, the calculation methods for the pressure rise include the standard calculation method (SCM), improved standard calculation (ISCM), CFD and magneto-hydrodynamic (MHD) calculation [4,5,6,7]. When the model size is small and the structure is relatively simple, the SCM and ISCM can produce good results because the propagation time of the pressure wave can be neglected. The arc plasma itself is modeled in the MHD, which can get an accurate result for the pressure and temperature distributions, but the computational time is longer for a real switchgear. Hence, CFD is a suitable tool for calculating the pressure rise caused by the arc fault in the switchgear.
In order to obtain the change of the pressure rise, the arc tests and calculation in simple and small closed compartments were carried out. Anantavanich et al. [8,9] put forward a method to calculate the pressure rise, which considered the variation of gas properties according to the SF6 concentration. The high current (10 and 20 kA, single phase) arc tests in the small container were performed and the pressure rise was obtained by measurement and calculation. Zhang et al. [2,10] performed the arc fault tests under different conditions, and presented a theoretical approach to calculate the thermal transfer coefficient (kp). Iwata et al. [11,12,13] carried out the arc tests in a closed container with varying currents, and the change of the kp and pressure rise with arc current, arc energy, and electrode materials were obtained. Wahle & Pietsh [14] and Rochette et al. [15,16] proposed a porous filter and energy absorption device to reduce the pressure rise in the switchgear when the arc fault occurred, and the efficiency was analyzed by calculation and measurement. Although the arc fault has been studied widely, there are few pieces of research on the arcing characteristics and the variation of pressure rise in the container. The arc voltage data from the arc tests with larger gap lengths in the closed container shows lesser values, which is usually 5 cm or less. However, when the arc fault occurred in a real switchgear, the gap lengths are usually more than 10 cm. Hence, the studies of the arcing characteristics and the change rule of the pressure rise with large gap lengths in the closed container need to be researched further.
In this paper, the simplified energy balance of the arc fault in the switchgear is described, and the multi-physics coupling analysis method based on CFD is put forward to calculate the pressure distribution. The arc fault tests are performed in a closed container, and the short-circuit current was provided by a series circuit of capacitance and inductance. The accuracy of the calculation method was validated by the arc test. The arcing characteristics and the pressure rise were analyzed under different conditions. This research can provide a reference for the pressure rise calculation of a real switchgear.

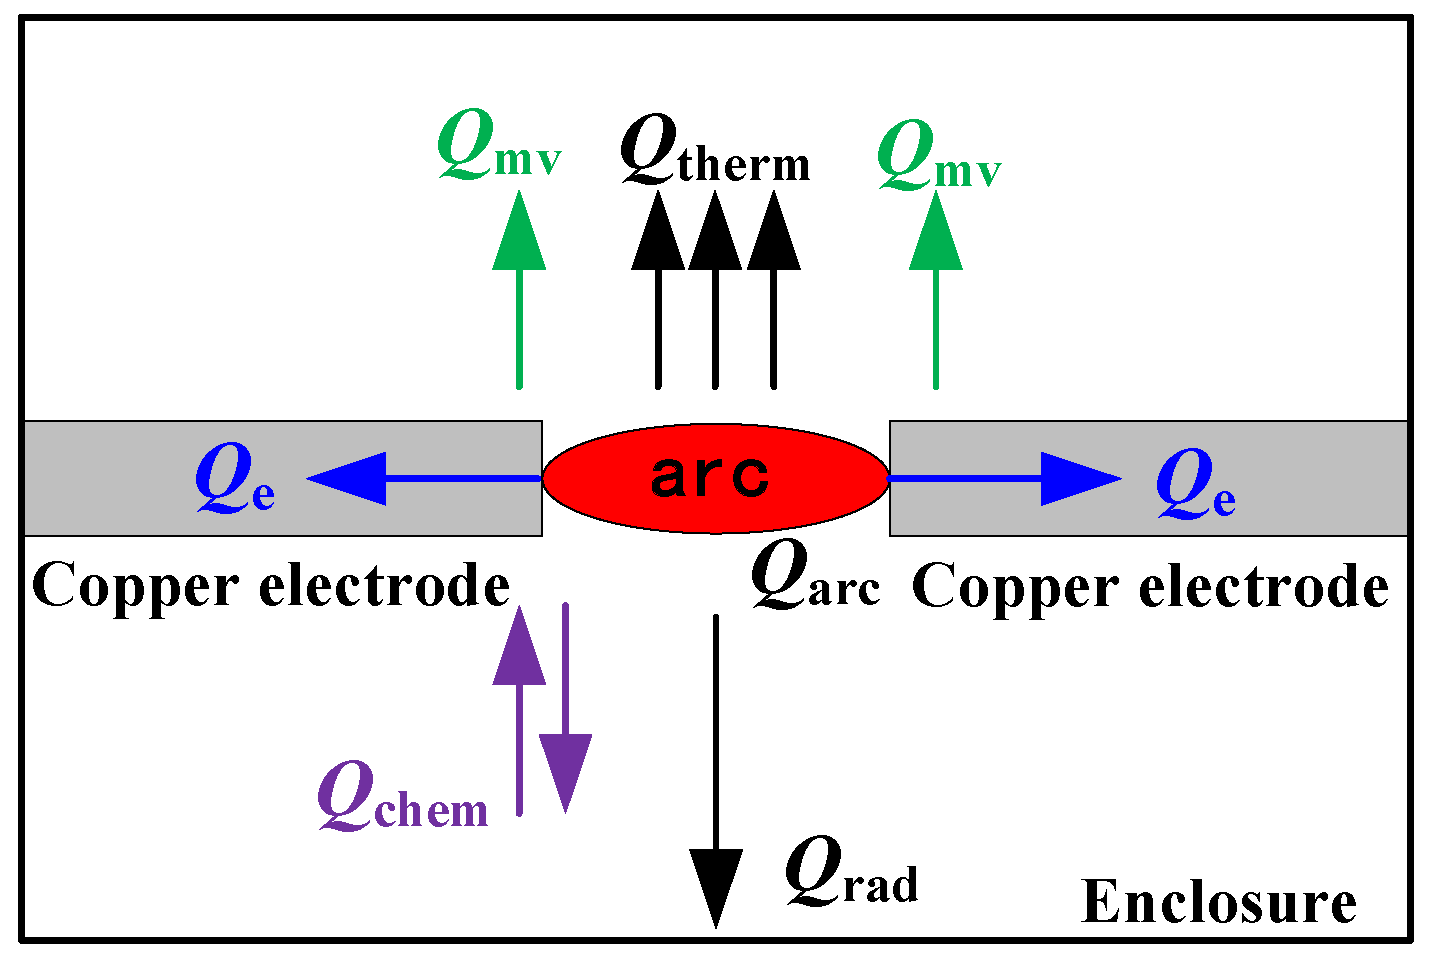
2. Energy Balance of Arc Fault in an MV Switchgear

When an arc fault occurs, the energy (Qarc) released from the arc will be transferred to its surroundings via various ways [2,10]. A simplified energy balance of the arc fault in a closed switchgear is illustrated in Figure 1 [17]. Part of the energy (Qe) heats up the copper electrodes through heat conduction. Another part (Qrad) is radiated by means of electromagnetic waves and is absorbed by the switchgear walls. A further part is consumed by electrode melting and evaporation (Qmv). Metal vapor may react chemically with the insulating gas, resulting in energy release or absorption (Qchem). The last part of the energy (Qtherm) contributes to the surrounding gas by means of heat conduction, convection, and radiation, which leads to pressure rise in the switchgear. The Qtherm mainly contains: (1) the part of the energy absorbed directly from the arc by heat transfer; (2) the part of the energy from the electrodes or the radiation absorbed within the metal vapor cloud; (3) or the energy from the exothermic chemical reactions. The forms of energy mentioned above can be expressed as:
Qarc ± Qchem = Qe + Qrad + Qmv + Qtherm
Because of the complex process of the arcing, it is difficult to calculate each part of the energy mentioned above. In order to simplify the analysis, the proportion of the arc energy leading to the pressure rise (dp) in the switchgear has been used, the term of which is the thermal transfer coefficient or “kp-factor” [4,5], and it is defined in Equation (2).
k p = Q therm / Q arc
The kp is usually determined by fitting the calculated pressure rise to the experimental result before the pressure-relief device is open [11], which is related to the arc current, arc voltage, electrode material, gas density, and the volume of the test container.

3. Calculation Method of the Pressure Rise Caused by Internal Arcing in the Switchgear

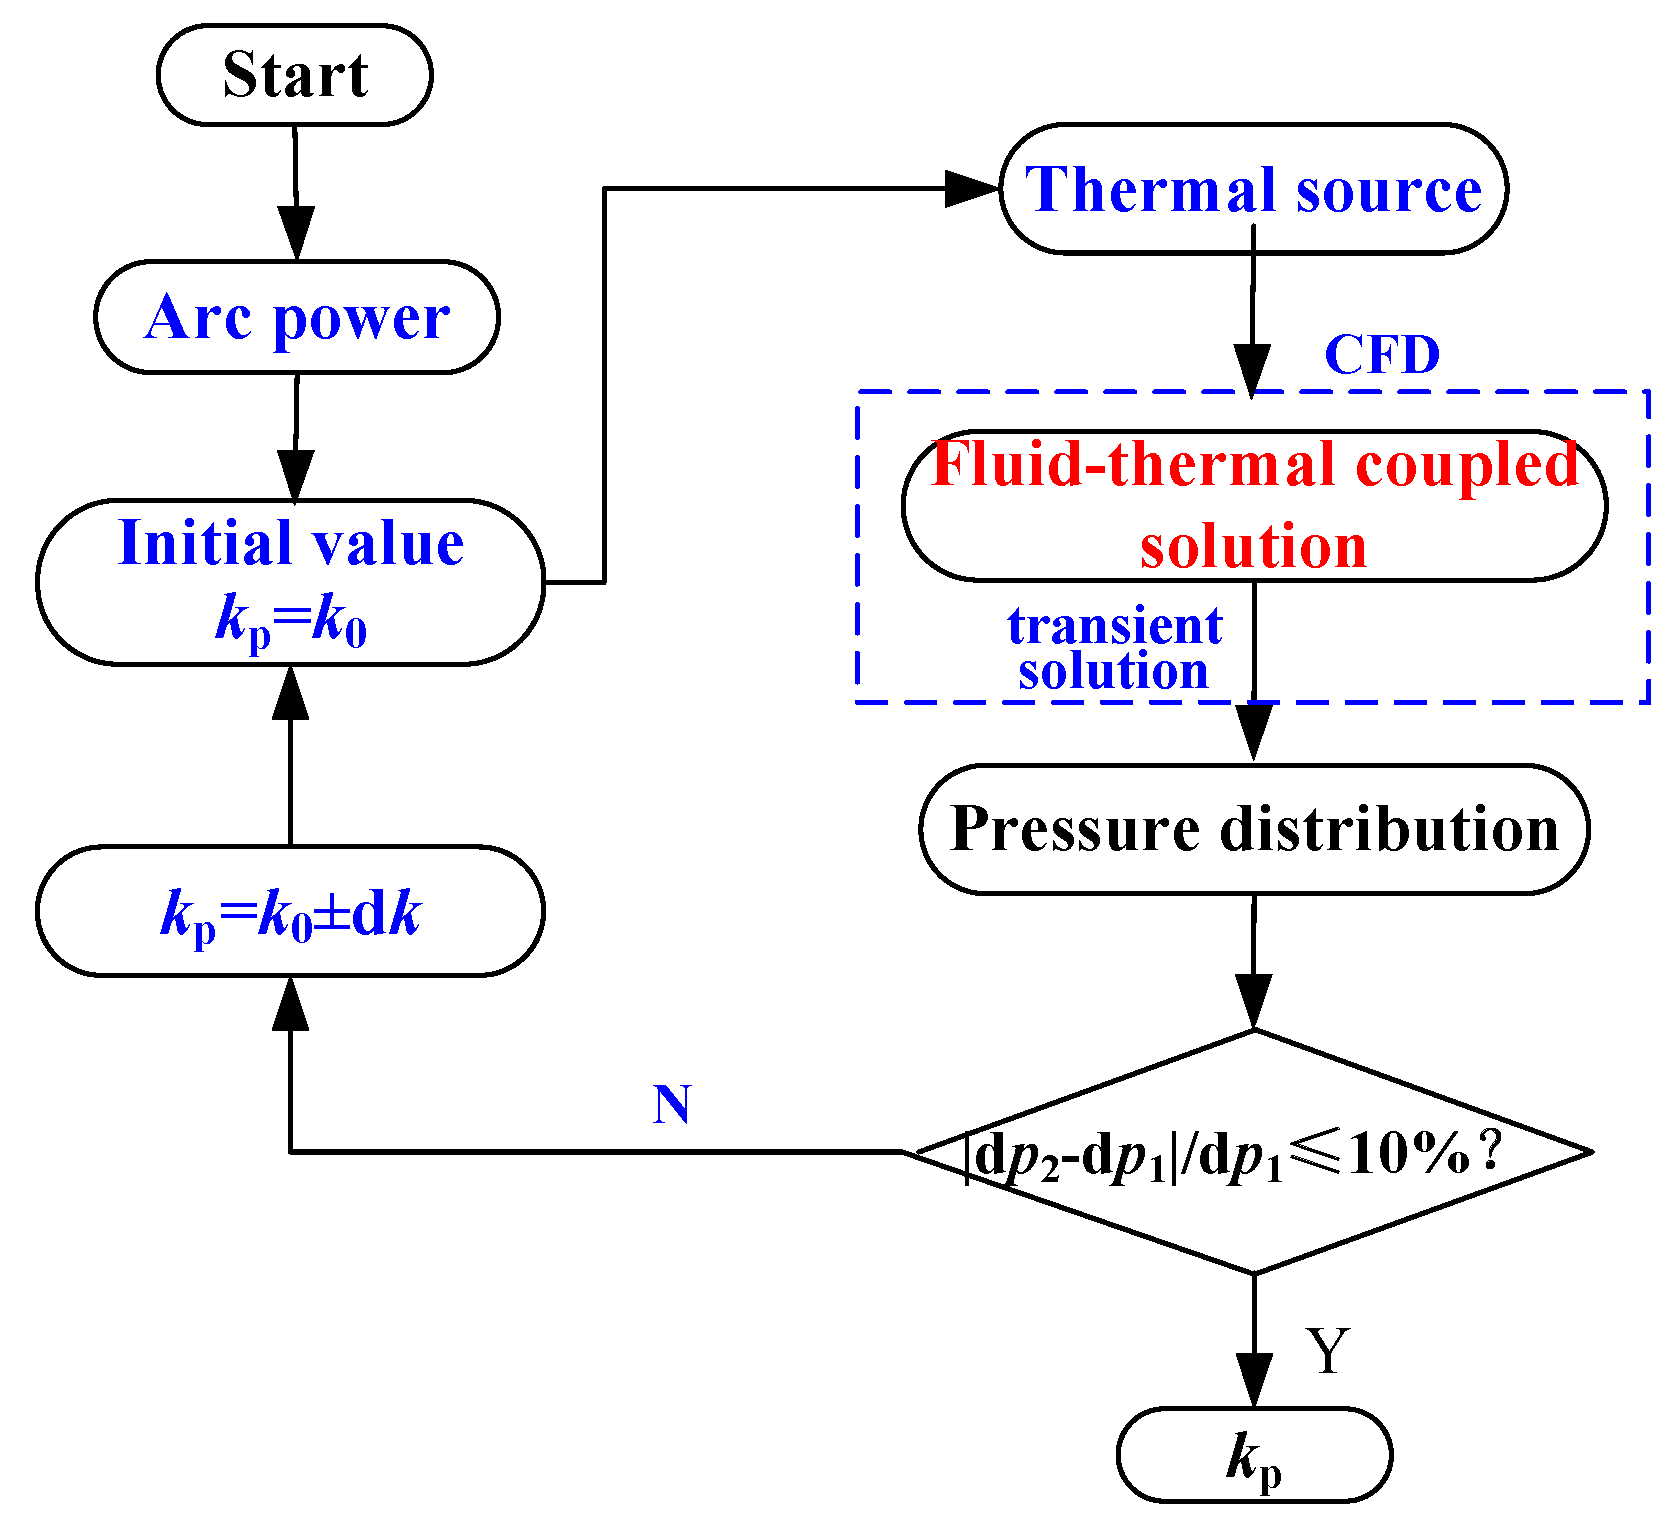
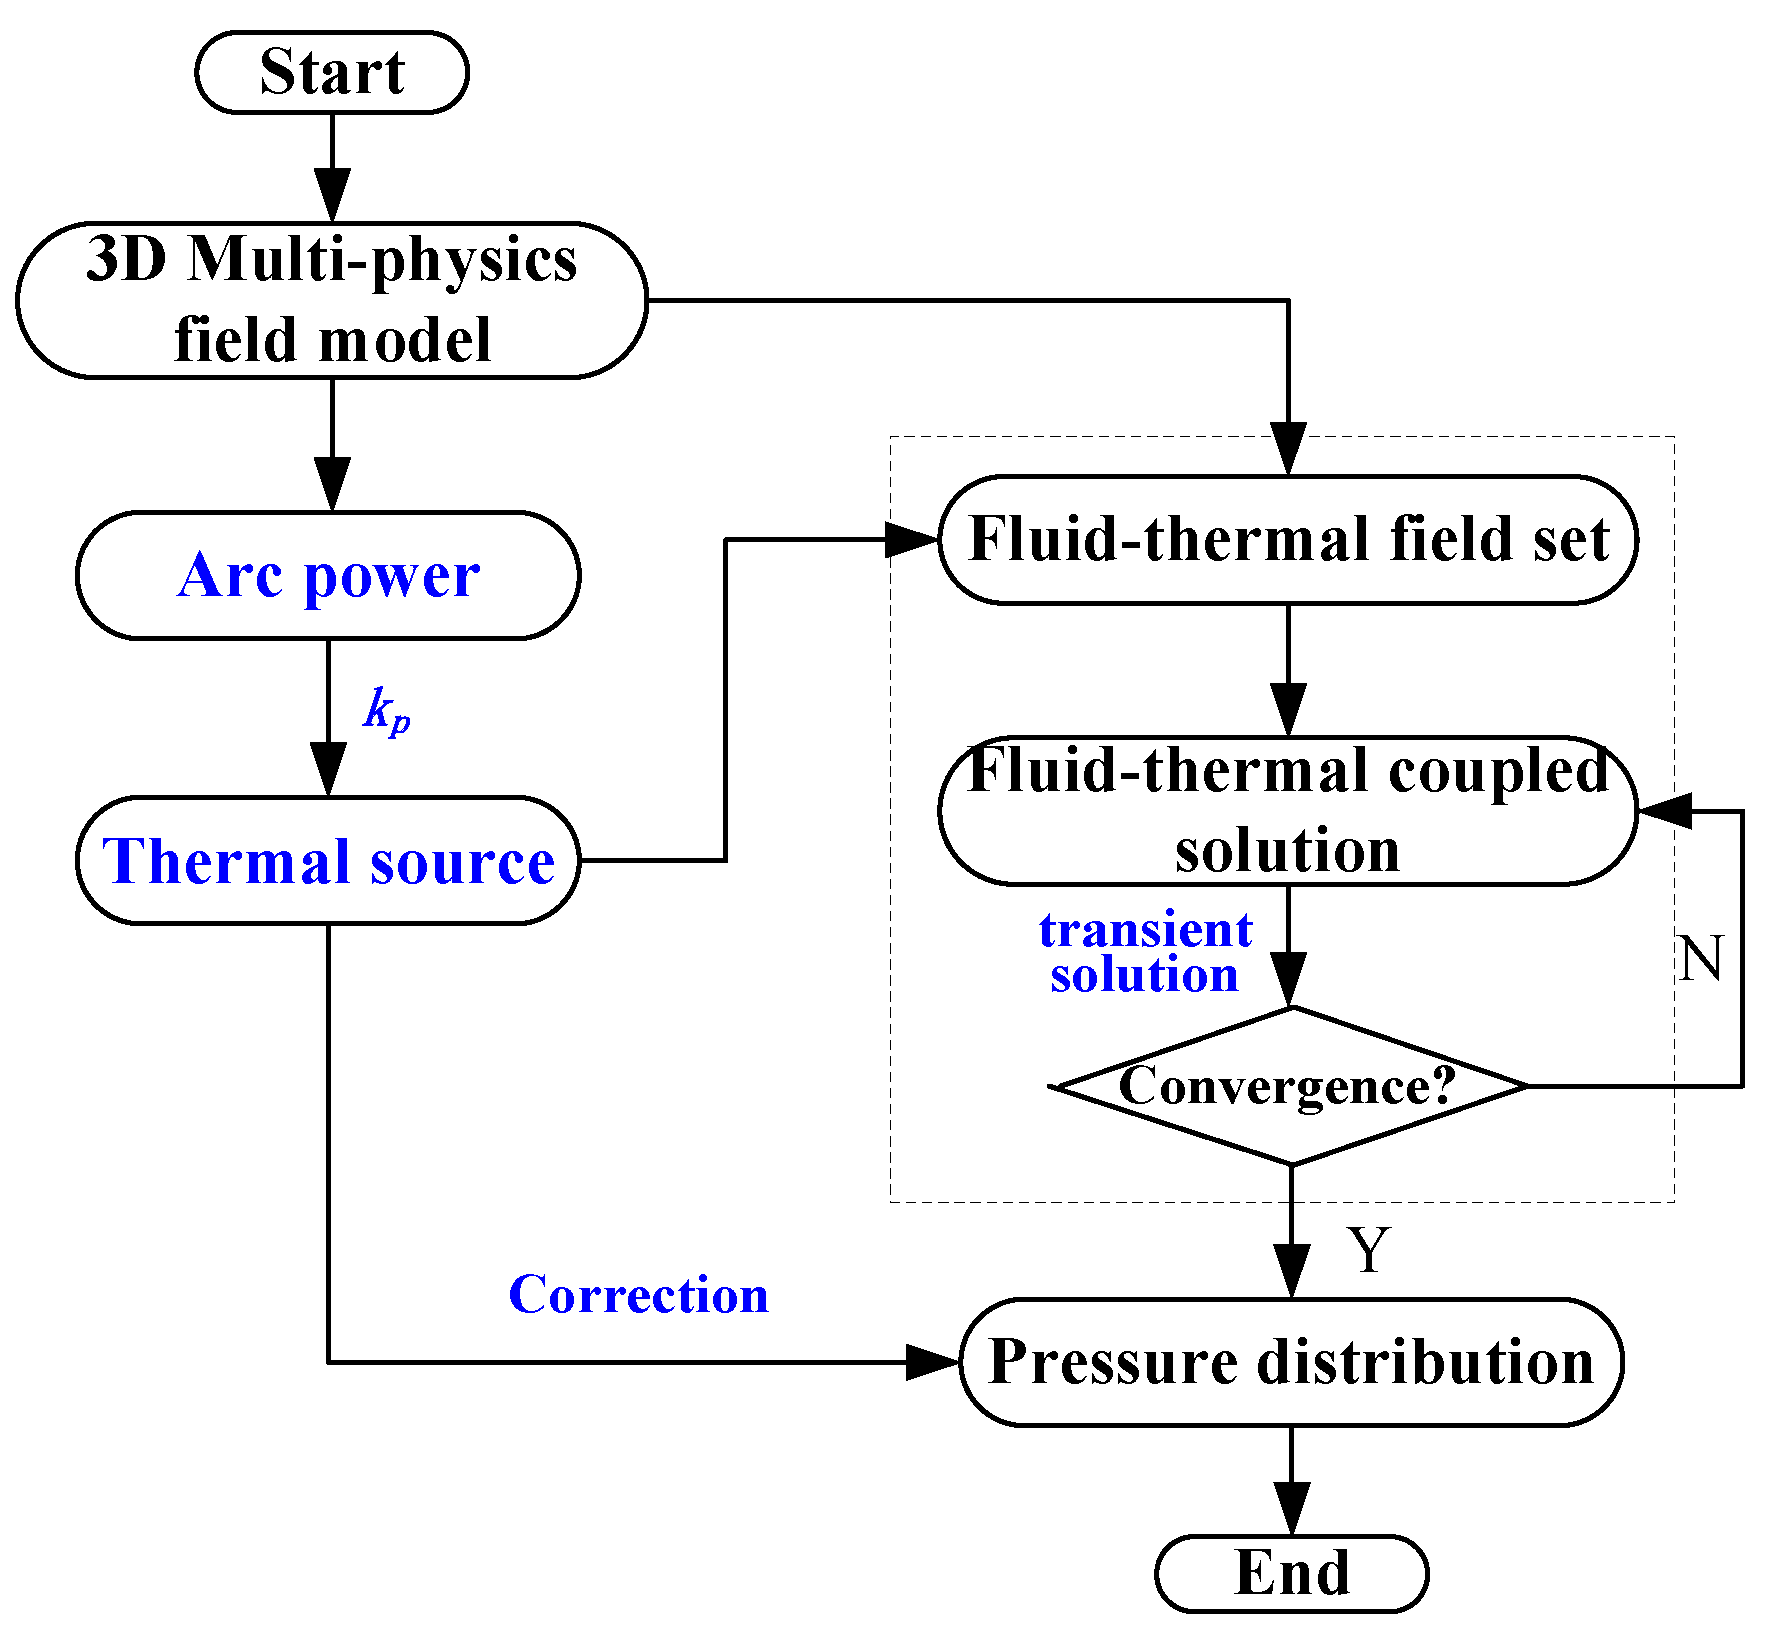
3.1. Calculation Process of Pressure Rise

Generally, the development process of the internal arcing is characterized by four stages: the compression stage, expansion stage, emission stage, and thermal stage [18]. The pressure rise at different stages is depicted in Figure 2 [19]. It can be seen that the influence time of the pressure and thermal effects is not the same. When the switchgear is closed, the pressure effect is larger on the switchgear, but the thermal effect is smaller. The thermal effect has a great impact in the later period of the arcing. Sweeting [20,21] also indicated that the thermal energy in the plasma cloud (after the arc extinction) constitutes the third major hazard of the arc faults.
At the same time, the destructive power of high pressure on the switchgear is quite serious, having the potential to cause a severe explosion phenomenon, and may cause the hot airflow to escape from the compartment. Hence, in order to simplify the computation, the pressure effect in the switchgear can be considered firstly. The multi-physics coupling analysis method based on CFD has been put forward to calculate the pressure rise, as is shown in Figure 3.
The thermal source of power that causes the pressure rise can be obtained by the “kp-factor”. Through the transient coupled solution between the temperature field and fluid field, the pressure distribution in the switchgear can be obtained, and the pressure can be corrected by changing the value of the “kp-factor”. Since the arc itself is not modeled and the movement characteristic of the arc in the magnetic field and airflow field is not considered, it follows that the processes of mutual coupling between the electromagnetic and temperature fields, the electromagnetic field, and the flow field are neglected in this method. The calculation time is greatly reduced using this method compared with MHD, and the local pressure distribution is solved in the switchgear.

3.2. CFD Calculation Method

3.2.1. Governing Equations

The method based on CFD is used to obtain the pressure distribution in a switchgear due to arc fault, which is based on fundamental hydrodynamic conservation laws, such as continuity, the Navier-Stokes equations, and energy conservation. The general form of the conservation equations can be written as [6,7]:
( ρ Φ ) / t + ( ρ v Φ ) = ( Γ Φ Φ ) + S Φ
where Φ is the conserved variables under consideration (such as mass, momentum, or enthalpy), ρ is the gas density, v is the gas velocity, ΓΦ is the corresponding transport coefficient, and SΦ is the source term. For the compressible fluid in the container, the equations of the mass, momentum, and energy conservations can be written as follows:
{ ρ / t + ρ v = 0 ( ρ v ) / t + ( ρ v v ) = p + ( η Δ v ) + S ( ρ h ) / t + ( ρ h v ) = ( k T ) + k p Q a r c + q η
where h is the enthalpy, k is the thermal conductivity, η is the dynamic viscosity, S is the component of the momentum source term, qη is the viscous dissipation, and Qarc is the energy released from arc. The whole 3-D region of the switchgear is discretized into small cells with structured or unstructured grid. The coupled problem between the temperature and fluid fields in the switchgear can be solved by the finite volume method (FVM).
In order to solve the partial differential equations as mentioned above, the equation of state (gas density ρ ) as function of pressure and temperature should be added [17]:
ρ = f ( p , T )
For ideal gas, the equation can be written as:
p M = ρ R T
where R is the gas constant, which is related to the gas type, M is the molar mass of the gas.
The ideal gas state equation is valid when the process of dissociation or ionization is ignored. Namely, when the interactions between the gas molecules are small, Equation (6) can be used. If the volume of the gas molecules and the interactions between them are considered, the real gas model by minimizing Gibbs free energy should be used [13]. Because the arc itself is not modeled and the mean temperature rise in the container is small before the pressure-relief device is open, the ideal gas state equation is used to simplify the calculation.

3.2.2. Energy Input and Boundary Conditions

In this method, the arc is regarded as an isolated air thermal source with fixed volume. The power of the thermal source (P) is calculated by Equation (7), which is homogeneously fed into a small volume. The volume is smaller with respect to the arcing room.
P = kp × Parc = kp × u × i
where Parc is the arc power, u and i are the arc voltage and current, respectively.
Because the “kp-factor” is applied, the complex energy transfer process is changed to the energy transfer between the thermal source and air in the container. At the same time, the arc duration is short, so the walls (such as the container and electrodes) are supposed to be adiabatic during the calculation, and the thickness of the container wall can be neglected [6].

3.3. Determination of the “kp-factor”

For a symmetric and simple container with small volume, the “kp-factor” can be obtained with Equation (8):
k p = V d p ( κ 1 ) Q arc = V M c v d p R Q arc
where V and κ are the volume of the gas in the container and the adiabatic coefficient of the insulating gas, respectively. For air at ambient temperature, the adiabatic coefficient κ is about 1.4 [22]. cv is the specific heat of the gas at constant volume.
This equation is from the SCM [5], which is based on the energy conservation and ideal gas laws. It is effective only if the pressure in the container is uniformly distributed at the end of the arcing, and the pressure difference can be ignored. Hence, this method will yield good results if the structure of the container is simple and the size is comparatively small. In this case, the pressure gradients are equalized immediately, and the pressure measured in one position can represent the pressure distribution in the closed container at the time of arc extinction.
However, if the volume of the container is larger and the structure is more complex, such as the modern commercial air-insulated switchgear, the propagation time of the pressure wave cannot be neglected. The pressure difference is significant at different positions before the pressure-relief device is open, and the distribution characteristics of the pressure in the switchgear should be considered. Hence, the determination method of the “kp-factor” in Equation (8) is not suitable under this condition, which should be determined by the CFD method, as shown in Figure 4.
In the flowchart, dp1 and dp2 are the pressure rise of the monitoring point obtained by measurement and calculation, respectively. The initial value (k0) of kp can be approximately determined by Equation (8). In order to obtain the kp as soon as possible, during the calculation, the convergence precision can be reduced. Namely, the computational time step can be increased, and the computational time will be decreased greatly. After the kp is determined, the high precision calculation results of the pressure distribution can be obtained by recalculation.

3.4. Influence of the Arc Volume on the Calculation of Pressure Rise

When the arc fault happens in the switchgear, the arc shape changes significantly under the action of electromagnetic, thermal buoyancy, and airflow fields. Because the arc is the input region of the thermal source, the choice of the arc volume is an important factor in the calculation of pressure rise. The simulation model has been established to analyze the influence of the arc volume, which is a closed cylindrical container with a diameter (d) of 30 cm and length (l) of 30 cm, and the axial plane of the container is shown in Figure 5. Two identical cylindrical electrodes with diameter of 2 cm are arranged symmetrically in the central of the container, and the gap length is about 5 cm. The arc shape is assumed to be cylindrical, the diameter (D) of which is 1 and 2 cm, respectively. The arc current and voltage is 5 kArms and 200 V, respectively. The kp is assumed to be 0.55. The arc power then varies with time (t) and is expressed as: 0.55 × 200 × 5 2 × sin(100πt) kW.
The pressure distribution of the cross section is shown in Figure 6. From the results, we can find that the pressure is symmetrically distributed in the container, which indicates that the pressure wave is symmetrically developed around the arc. The energy release is similar to the explosion process, and the thermal buoyancy of the air has less of an effect on the propagation of the pressure wave. According to the results, it is revealed that the calculated propagation time of the pressure wave from arc to the container wall is about 0.4 ms, indicating that the propagation velocity of the pressure wave is similar, with an average value of 375 m/s.
The pressure distribution is almost the same under two different arc diameters. At the time of 0.4 ms, the maximum pressure with arc diameters of 1 and 2 cm is 2.170 and 2.276 kPa, respectively, and the relative error is about 4.9%. As the arc duration increases, the difference declines. At the time of 10 ms, the maximum pressure is about 93.4 and 94.6 kPa, respectively, and the relative error is only 0.3%. Although the position of the maximum pressure is different, the values of the pressure have less difference. The maximum and minimum pressure rise is about 94.3 and 92.9 kPa respectively when the arc diameter is 1 cm, and the percentage error is 1.5%. The position of the maximum pressure is associated with the propagation characteristics of the pressure wave, such as the reflection and superposition effects. Compared the result of these two different arc diameters, the pressure distribution is closer, indicating that the arc diameter has less of an effect on the pressure distribution when the arc takes up less space in the container due to the high propagation velocity of the pressure wave. In a real switchgear, the volume of the arc is smaller compared with the larger volume of the switchgear, so the arc volume has less influence on the pressure distribution, which can be determined approximately by the real arcing parameters (arc current, electrode size, etc.). However, different arc volumes may have an effect on the temperature distribution in the switchgear due to the change of the contact area between the arc and the surrounding air.

4. Internal Arc Fault Experiment and Pressure Rise Calculation in a Closed Container

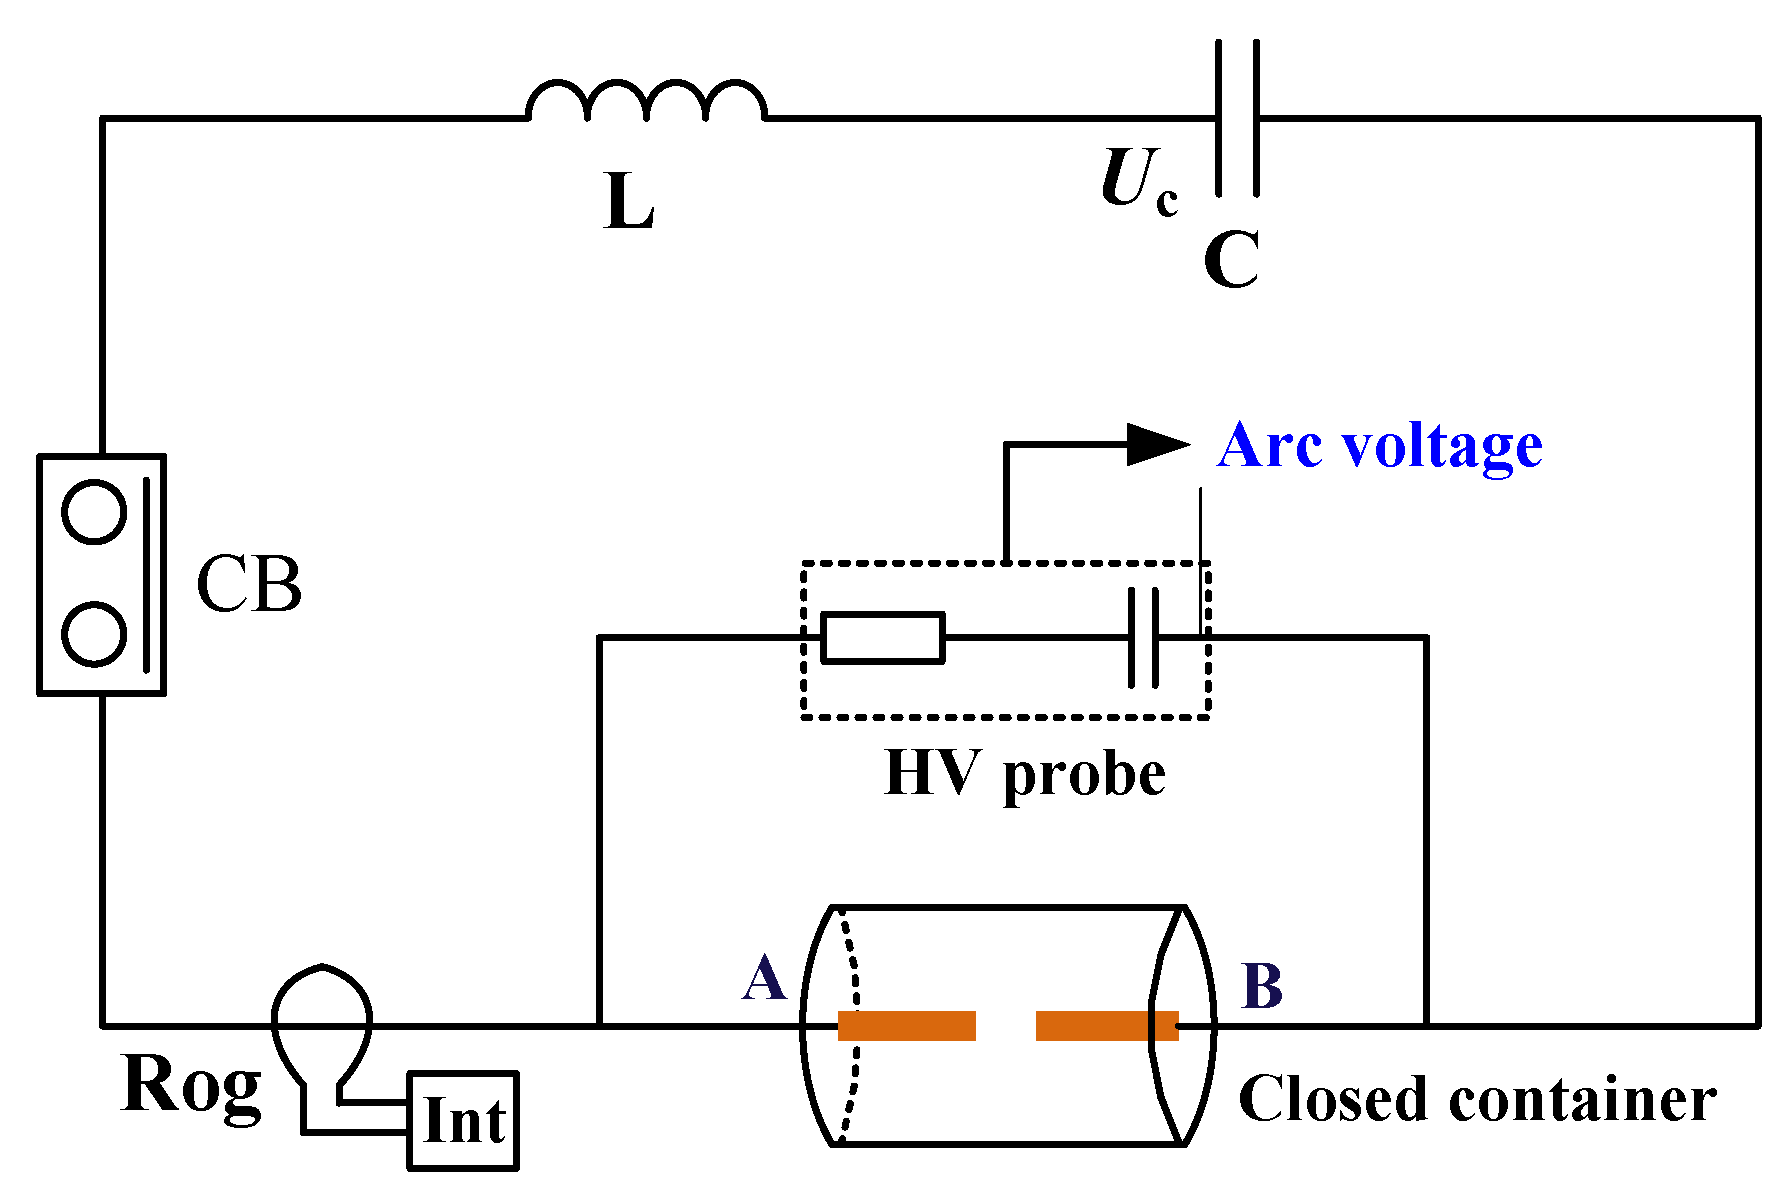
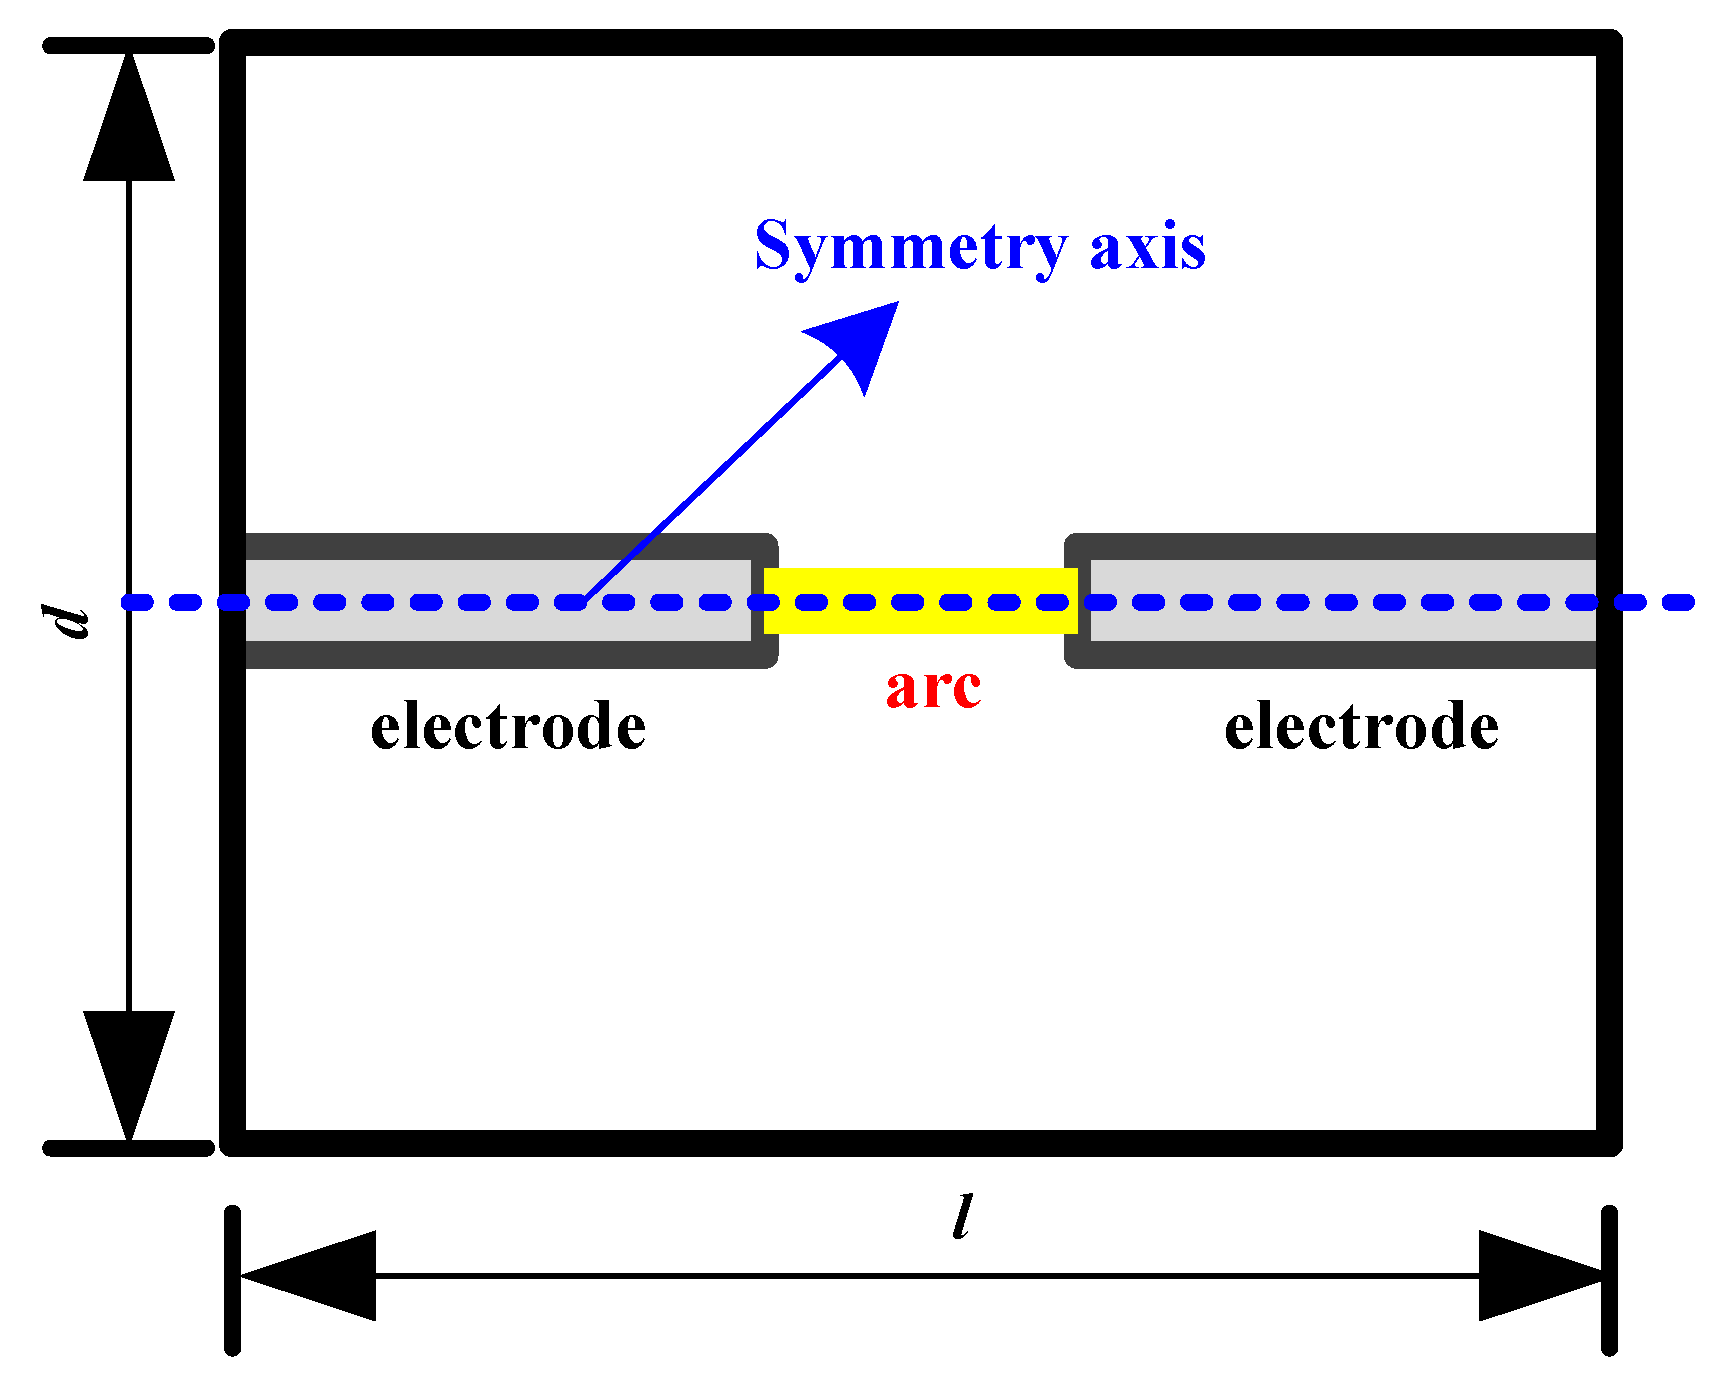
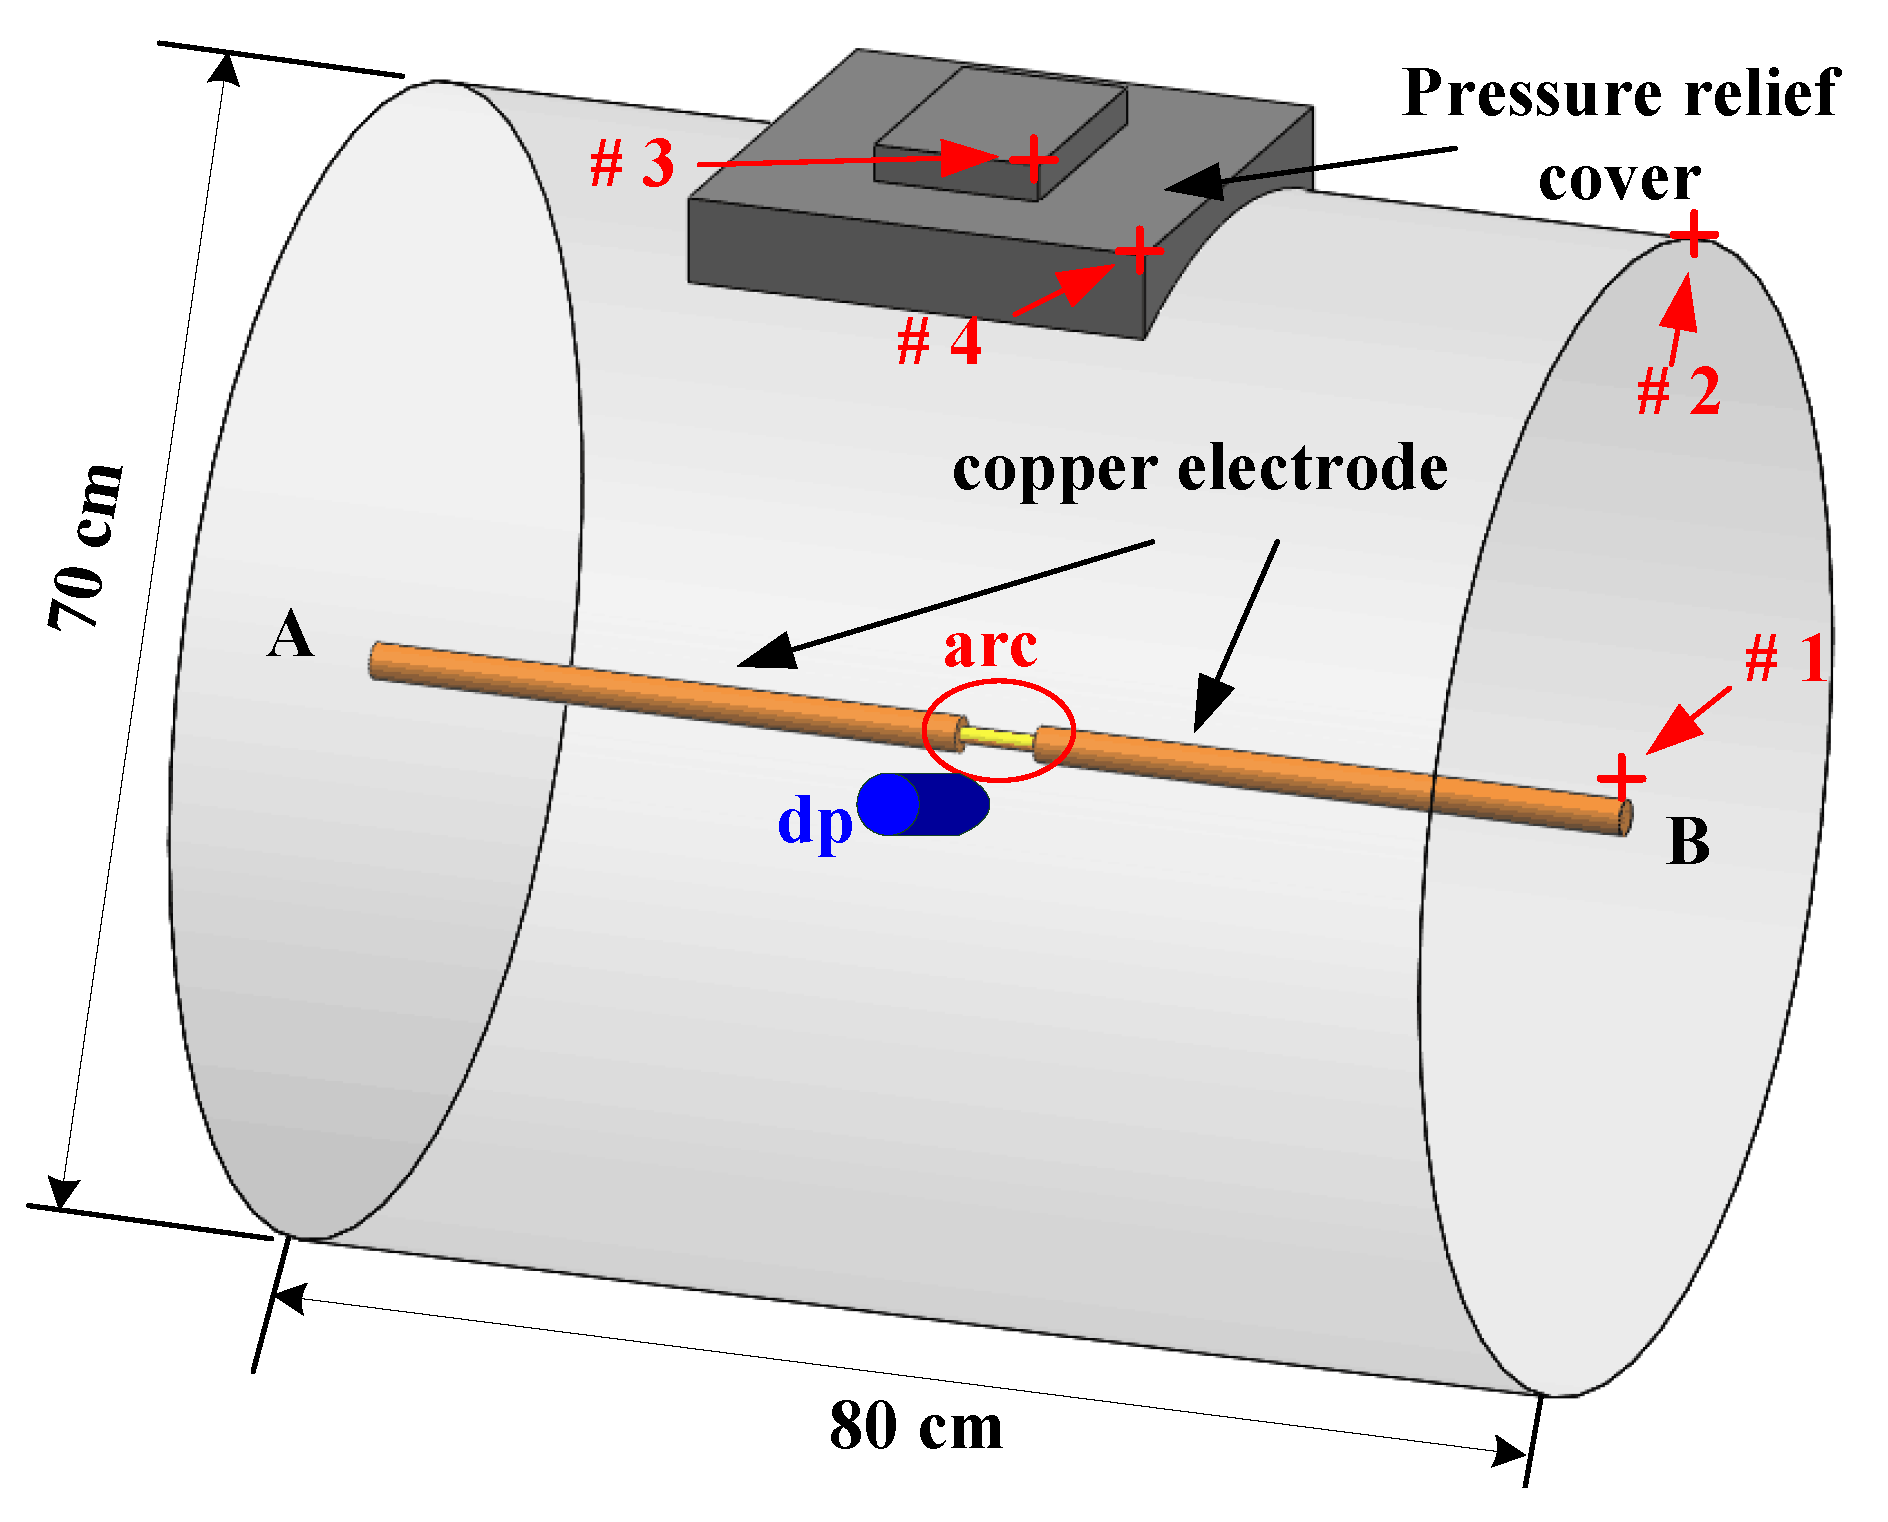
4.1. Expermental Method and Arrangement

The current circuit is shown in Figure 7. It mainly demonstrates the capacitance C (4.2 mF) and inductance L (2.412 mH), and a large current with a frequency of 50 Hz can be generated by the oscillation of both. The arc current can be adjusted by changing the charging voltage of the capacitance C. The CB is a vacuum circuit breaker with a rated short-circuit, making a current of 80 kA, and its initial state is open. A rog (Rogowski Coil, Powertek, Warwickshire, UK) is used to measure the arc current. A Tektronix-P6015A HV (high-voltage) probe (Tektronix Inc., Beaverton, OR, USA) is used to measure the arc voltage.
The design of the cylindrical closed container is given in Figure 8, with a cross-section diameter of 70 cm and a length of 80 cm, and is made of iron. The pressure relief cover with a size of 29 cm × 29 cm located at the top of the container, which is fixed by the high strength bolts, will not be opened during the arcing. The volume of this container is about 0.311 m3. According to the electrode material when the arc fault occurred in a real switchgear, two identical cylindrical copper electrodes with a diameter of 2 cm are arranged symmetrically in the center of the container. The copper electrodes are fixed on both ends of A and B, and connected with the current circuit by the high-voltage cables. The gap length (g) between the copper electrodes can be adjusted, and the location of the arc is in the center of the container. The parts between the copper electrodes and container are insulated by the epoxy resin casing to prevent gas leakage during the arcing. Other measures are also taken to prevent gas leakage, such as sealant and sealing washers. The gas in the closed container is air with ambient pressure.
The arc was ignited by the solder wire with a diameter of 0.5 mm, the physical parameters of which are shown in Table 1. The pressure in the container was measured with a piezoresistive pressure sensor, with an Omega PX409-100G-5 V (OMEGA Engineering Inc., Stamford, CT, USA), which was installed on the inner wall of the container (dp), as shown in Figure 8. The signals of the arc current, arc voltage, and pressure were collected by an NI (National Instruments) data acquisition card and LabVIEW software (LabVIEW8.6, NI Corporation, Austin, TX, USA), and the sampling frequency is set to 5000 Hz. During the tests, in order to reduce the random fluctuations of the data, the test number was increased when the gap length is 10 and 15 cm.

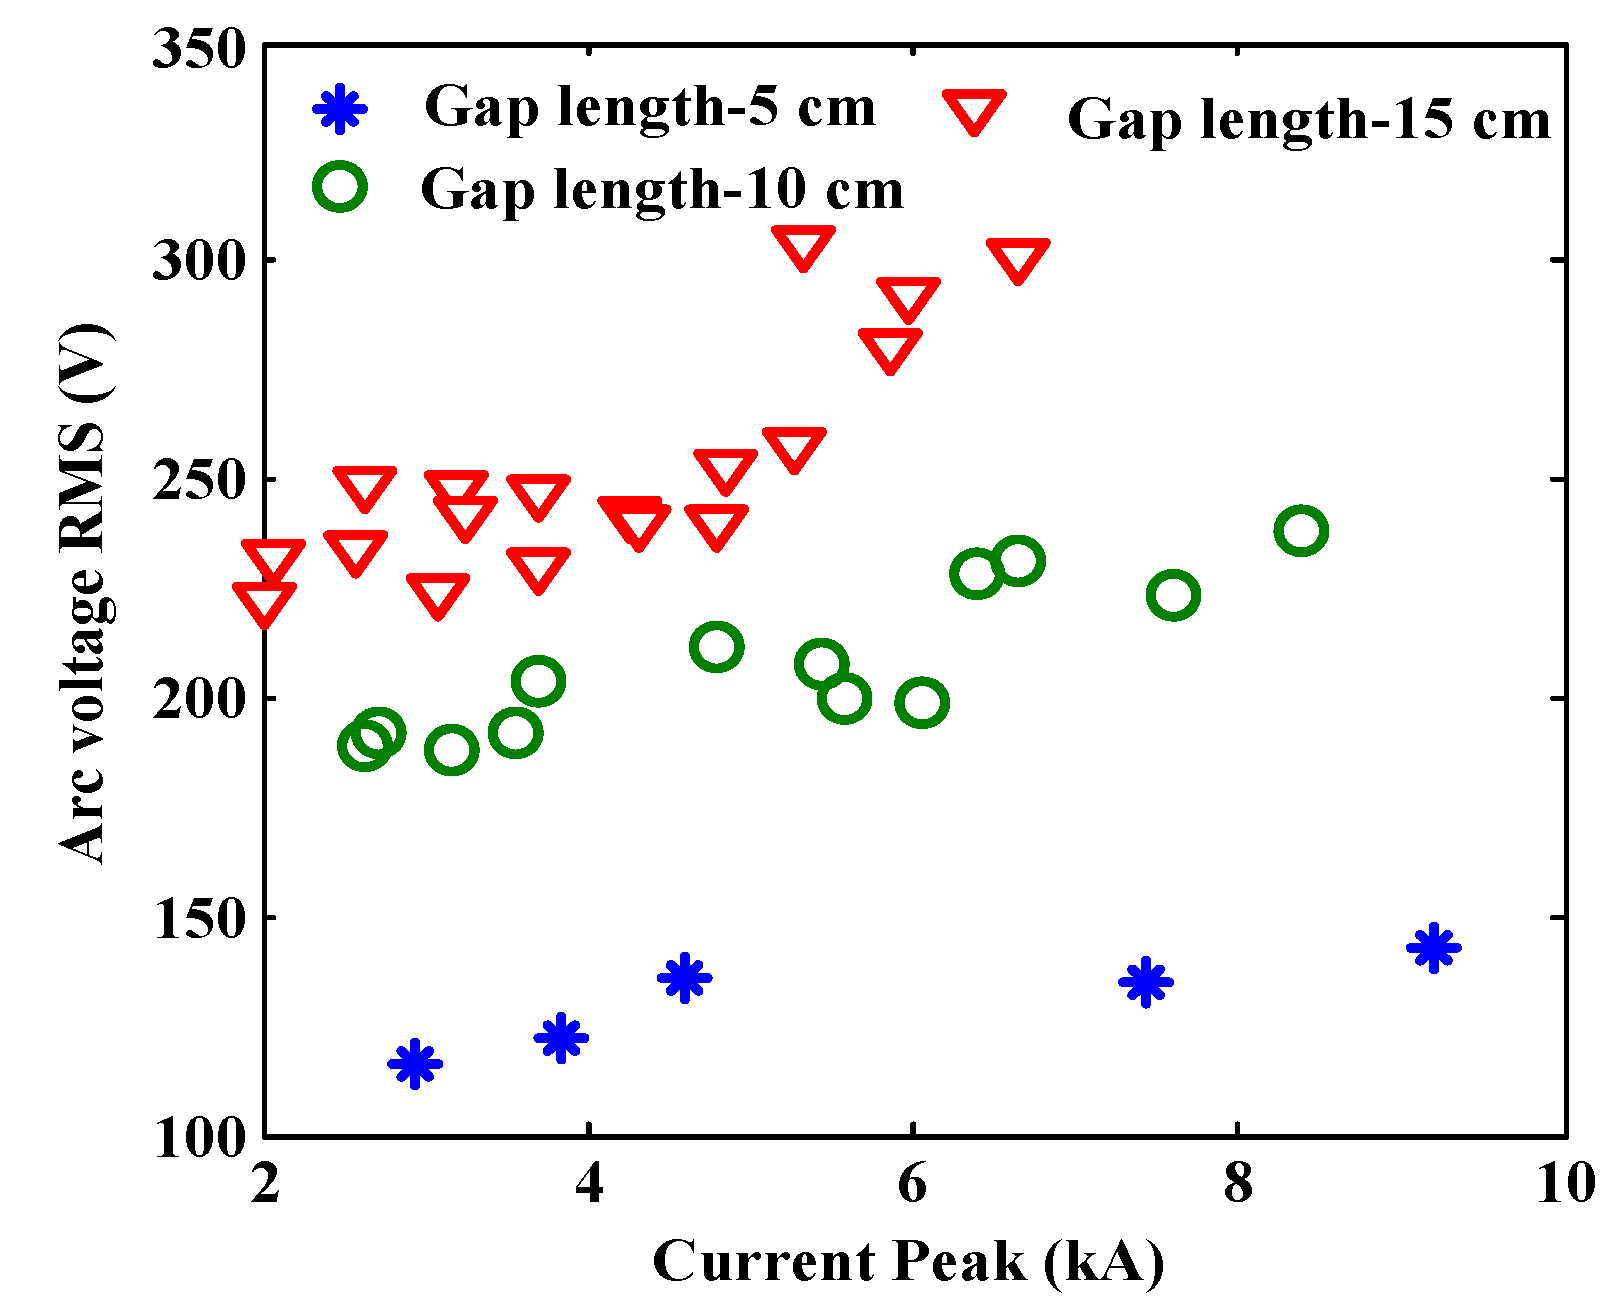
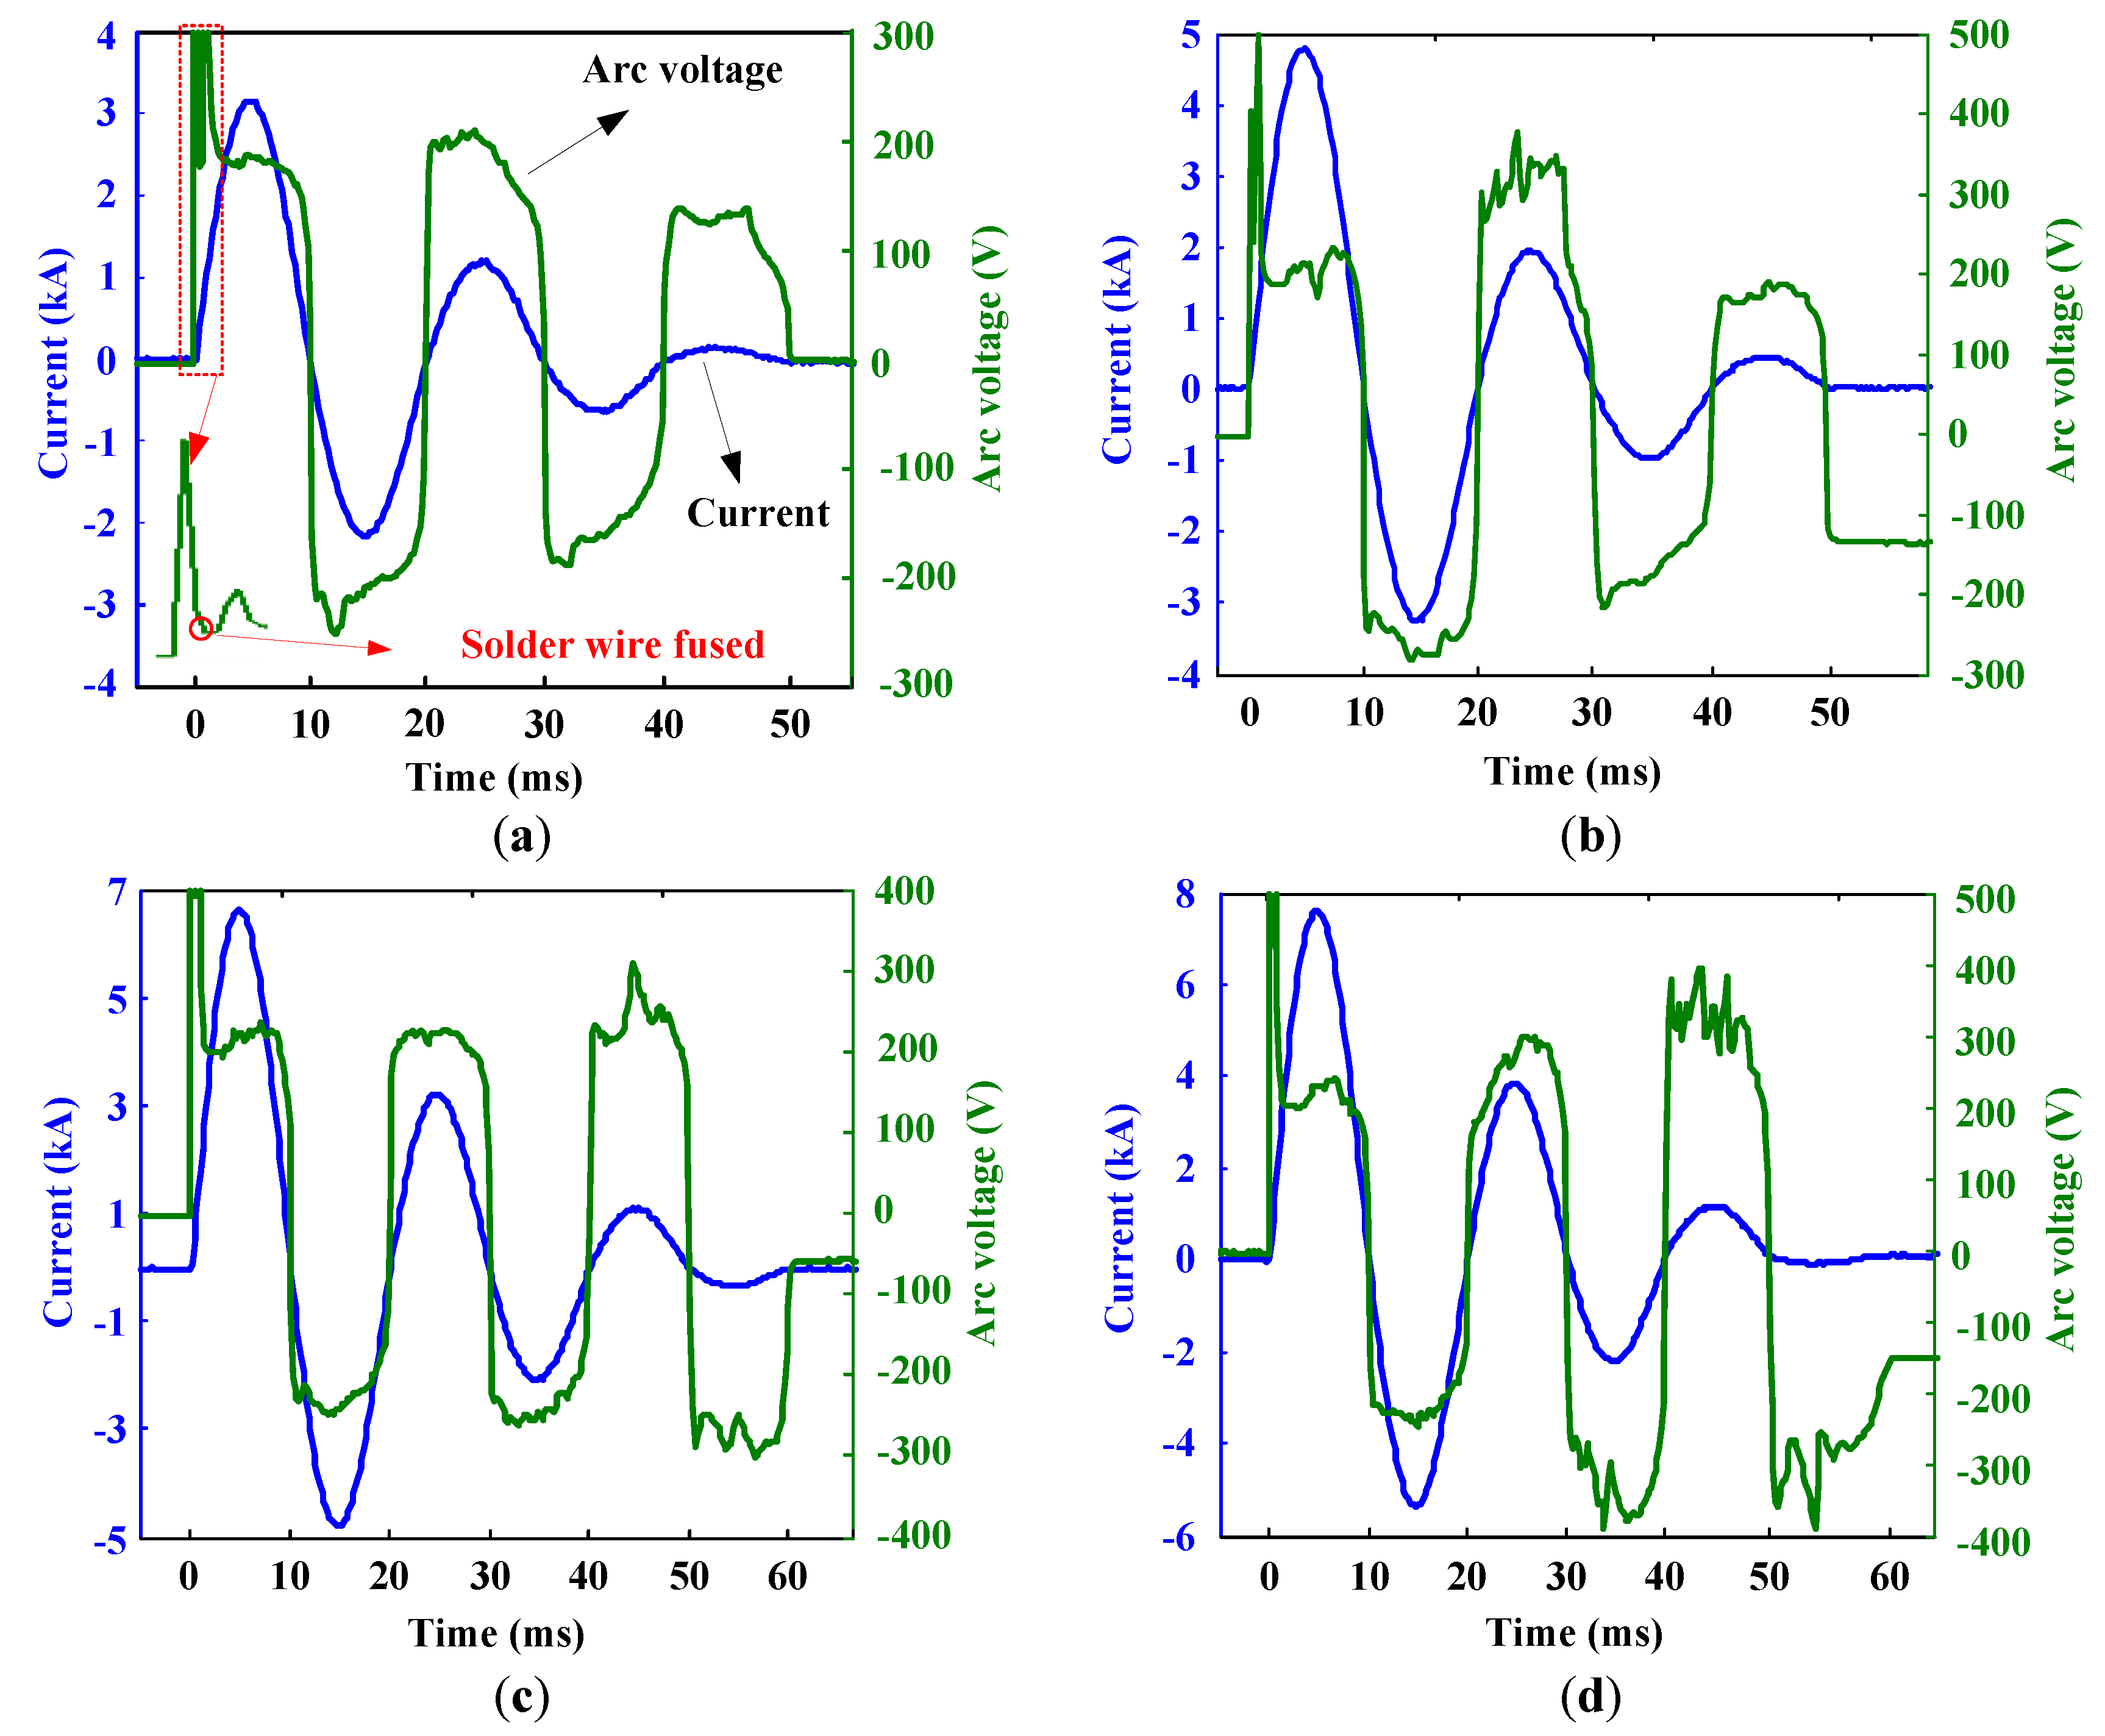
4.2. Change of the Arc Voltage with Current

Because of the low melting point of the solder wire, the energy required for fusing it is low. Thus, the existence of the solder wire has less of an effect on the arcing characteristic. The typical waveforms of the current and arc voltage at different arc energy values are shown in Figure 9 when the gap length is 10 cm.
As can be seen from Figure 9, the current changes with sine function over arc duration, and the frequency is about 50 Hz. With the increase of the charging voltage, the arc current and arc duration both increase. The amplitude of the arc current is declined gradually with the energy attenuation of the capacitance. There are fluctuations in the arc voltage during the arcing. The gap voltage has a larger value due to the transient overvoltage and the process of the solder wire fusing, especially at the initial stage. Afterwards, the arc voltage is nearly constant because the arc burns stably. The arc voltage has a significant difference at different arcing stages. According to the local amplified signal at the starting point of the arcing, as shown in Figure 9a, it can be found that the gap voltage decreases in the initial stage and then increases. This is mainly associated with the fusing process of the solder wire. The resistance of a solder wire with a length of 10 cm is about 73 mΩ. When the current goes through the gap, the solder wire is fused gradually and the conductivity of the gap increases, which causes the gap voltage to reduce from a large value at the initial stage. After about 0.2 ms, the solder wire is fused, and the arc appears in the gap. Due to the decreasing U-I-characteristic of the arc, the arc resistance is greater than the resistance of the solder wire at the beginning of the arcing, and makes the arc voltage increase. With the increase of arc current, the arc temperature rises and maintains a high value, which cause the arc resistance to decline. Hence, the arc voltage is reduced, and remains stable in each arcing cycle.
When the charging voltage is 3 kV, the curve of the arc voltage is relatively smooth, and the fluctuations are small. With the increase of charging voltage, the fluctuations of the arc voltage are intensified, and the number of spike pulses increases. The arc voltage has obvious fluctuations, especially at the end of arcing, as shown in Figure 9c,d, which show a large difference compared with the arcing in an open-air environment. The total energy released by the arc increases with the increase of charging voltage and arc duration, and the pressure in the container will increase gradually. In general, the higher pressure will have an influence on the parameters of the arc plasma, such as conductivity, density, etc. [23]. Higher pressure also has a significant effect on the motion characteristics of the arc due to the heated air movement [24]. However, because the maximum amplitude of the arc voltage has no significant change and the pressure in the container is not very large, the effect of pressure on the arc parameters is lower. Hence, the ups and downs of the arc voltage curve may be mainly related to the arc motion caused by the higher pressure at the end period of arcing. In order to analyze conveniently, the arc voltage RMS at each half wave of the arcing is defined:
Q arc = t 1 t 2 u ( t ) i ( t ) d t = k = 1 n u ( k ) i ( k ) / f
u arc = Q arc f / k = 1 n i ( k )
where t1 and t2 are the time of the arc current passing across zero, u(k) is the arc voltage of sampling point k, i(k) is the arc current of sampling point k, n is the number of sampling points, f is the sampling frequency, and uarc is the arc voltage RMS.
The change of the arc voltage with the current peak at different gap lengths is shown in Figure 10. It can be seen from the results that the change of the arc voltage with the arc current is relatively complex, and neither have any definite relation, which indicates the randomness of the arc voltage is larger for longer gap lengths. However, according to the change trend of the arc voltage, we can see that the arc voltage increases with the arc current, but the rate of rise is smaller. When the gap lengths are 5, 10 and 15 cm, the variation ranges of the arc voltage are 116–143, 188–238, 223–304 V, and the standard deviations of which are 11.06, 17.16 and 25.32, respectively. The fluctuation of the arc voltage is intensified with the increase of gap length, which is mainly attributed to the fluctuation of the arc itself when the gap length is larger.
The influence of the gap length on the arc voltage is larger than the arc current, and the arc voltage is obviously increased with the increase in gap length. When the gap lengths are 5, 10 and 15 cm, the average potential gradients of the arc are 26, 20 and 16 V/cm, respectively, which is gradually decreased with the increase in gap length. The potential gradient of the arc in the closed container is greater than that of an open-air environment [25]. Hence, for a real switchgear, the arc voltage should be obtained by reference to the actual arc test.

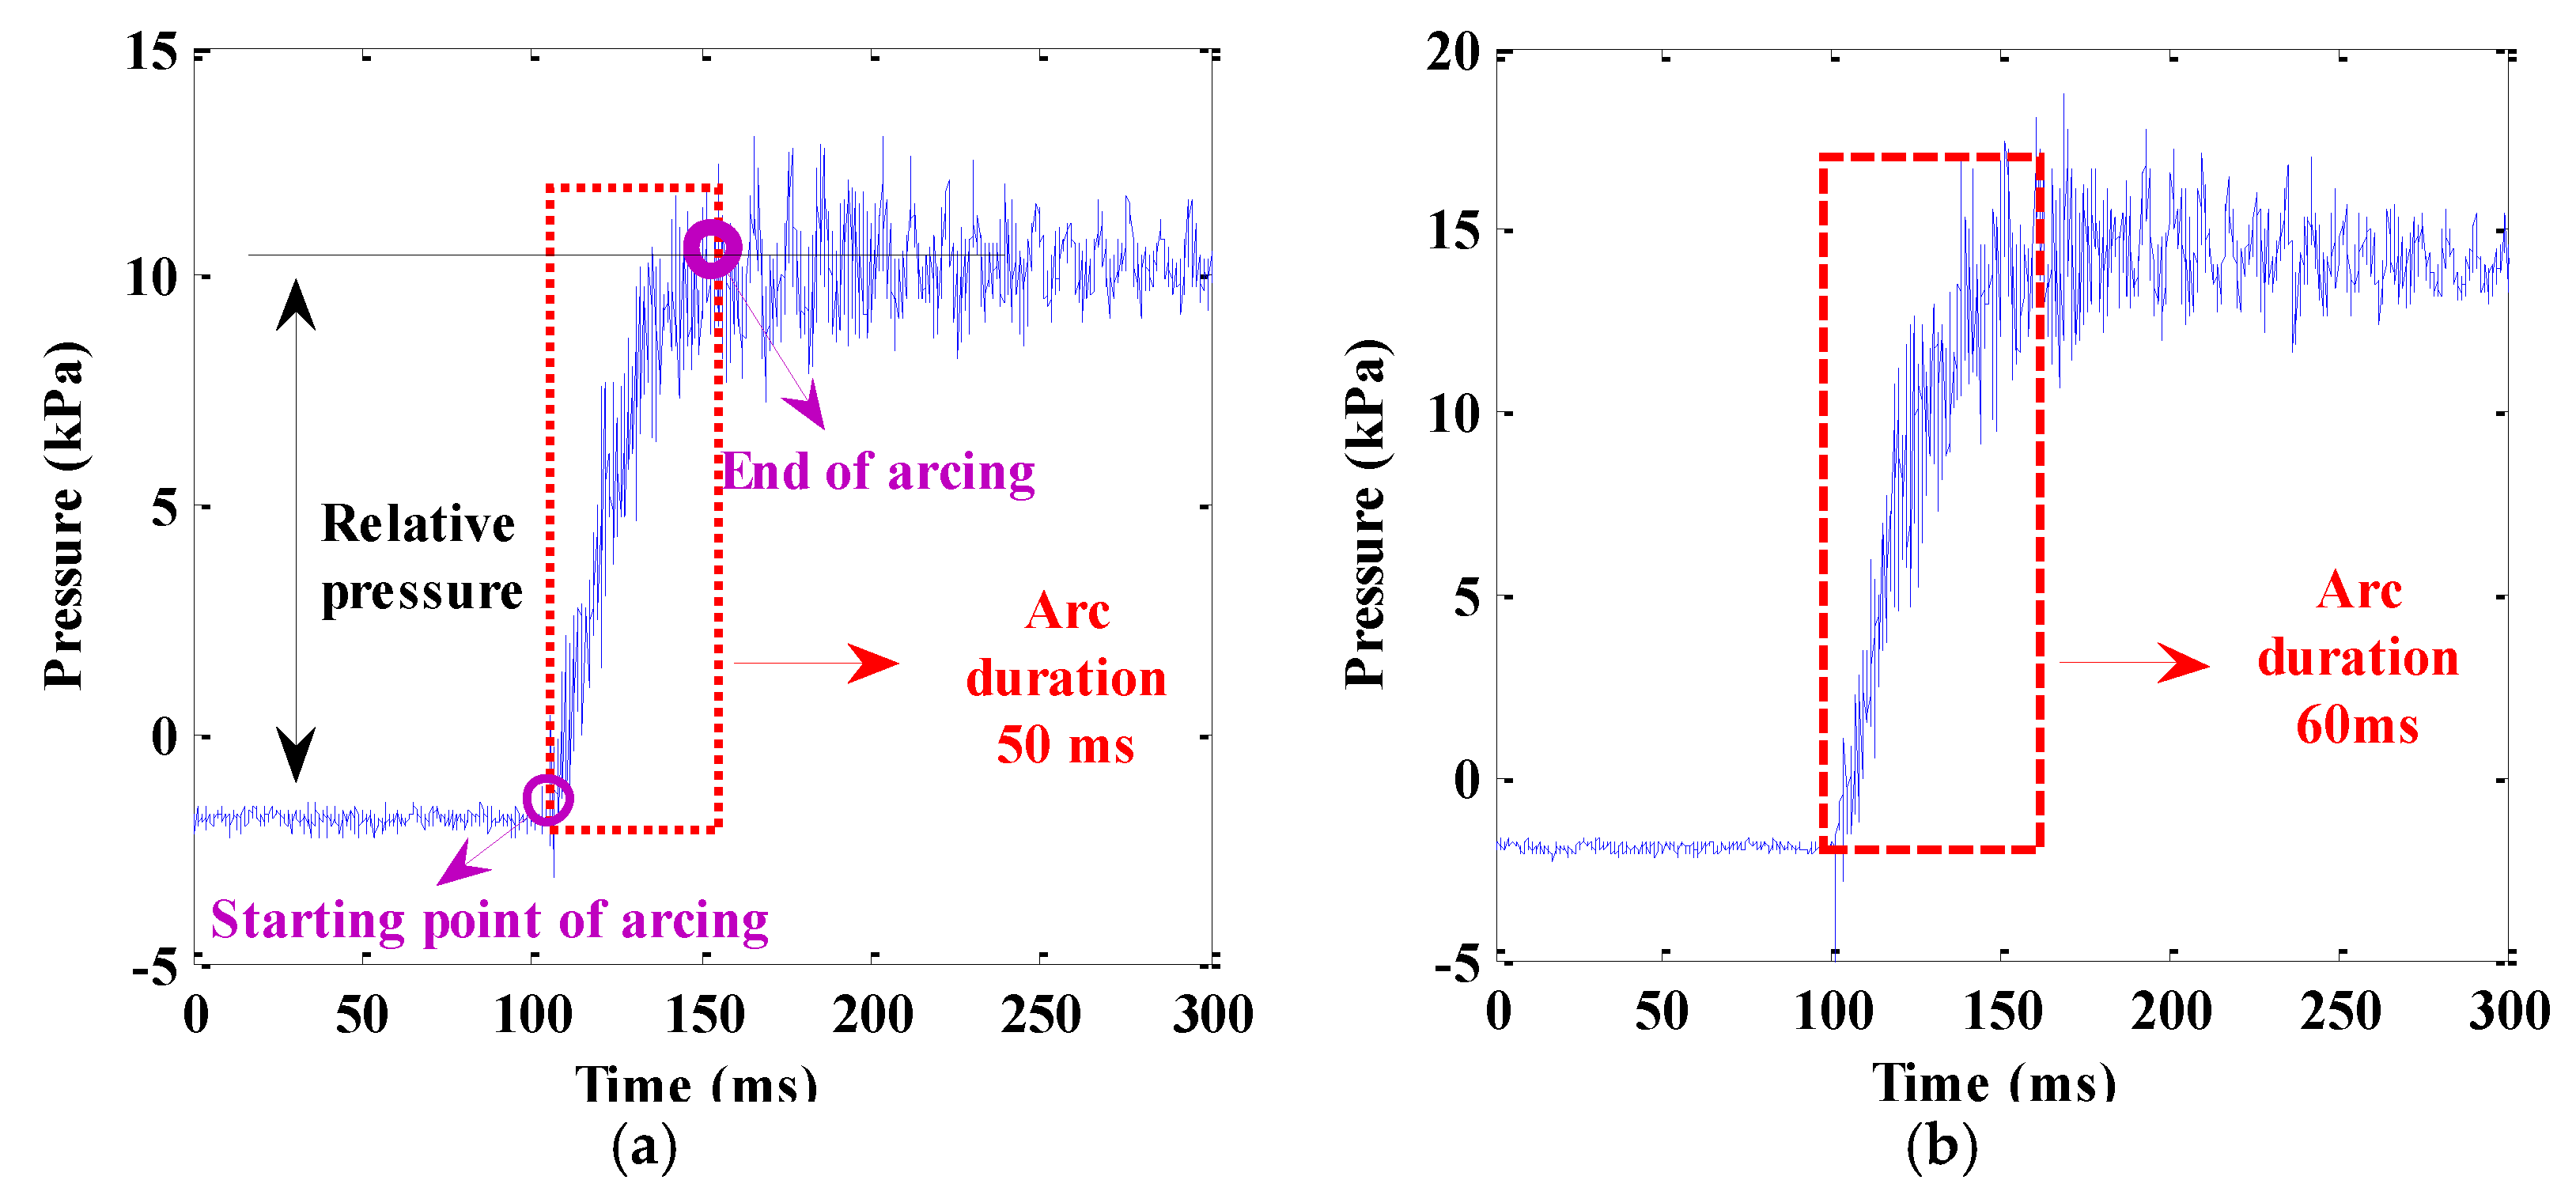
4.3. Pressure Rise in the Container

The pressure signals due to the arcing in a closed container are shown in Figure 11 when the charging voltages are 4.35 and 6 kV (g = 10 cm). The signals at other values are similar; only the amplitudes are different.
From these results, it can be seen that the pressure is close to linear variation with the arc duration, but the signals show large fluctuations. These are mainly related to the complex change of the arc energy (the arc power has large fluctuations during the arcing in the container), and the reflection of the pressure waves on the walls. For a further study of the signals, it can be found that the maximum pressure does not stop rising immediately at the time of arc extinction (the last time the arc current passes across current zero and the arc current is interrupted), but appears as a small increase of about 1 kPa. For these reasons, the pressure increase after arc extinction may be due to three conditions: (1) there still exists energy input, e.g., a continuous evaporation of the electrode material and the effect of the post-arc period; (2) the reflection and superposition of the pressure waves; and (3) the disturbances of the measuring system. However, by the time of arc extinction, the pressure balance has been established with uniform distribution (almost no pressure difference) in the container because the propagating velocity of the pressure wave is equivalent to the speed of sound. If there is no energy input after the arc extinction, the magnitude of the pressure will not be increased, but fluctuation due to the reflection of the pressure wave on the walls will be experienced. In Section 3.4, during the calculation, the arc power is set to zero after the arc duration exceeds 10 ms, and the pressure curve is fluctuating under the reflection of the pressure waves, but the maximum amplitude of the pressure is of almost no change. Hence, the reflection of the pressure waves may not be the main reason for the pressure increase after the arc extinction.
At the same time, a frequency analysis of the pressure signal during different periods has been analyzed by fast Fourier transform (FFT). The results show that the electromagnetic shielding of the measurement system works well, so the increase of maximum pressure after the arc extinction has nothing to do with the disturbances of the measuring system.
After the arc current is interrupted, the temperature of the gap needs time to decay under the action of the post-arc current and residual plasma cloud, which may still be higher than the melting temperature of the copper electrodes [21]. Hence, the energy released by the glowing metal droplets, the post arc current, and residual plasma may be the reasons for the pressure increase with a small value after the arc extinction. Although the released energy is less, the pressure rise will obviously be due to the small volume of the container.

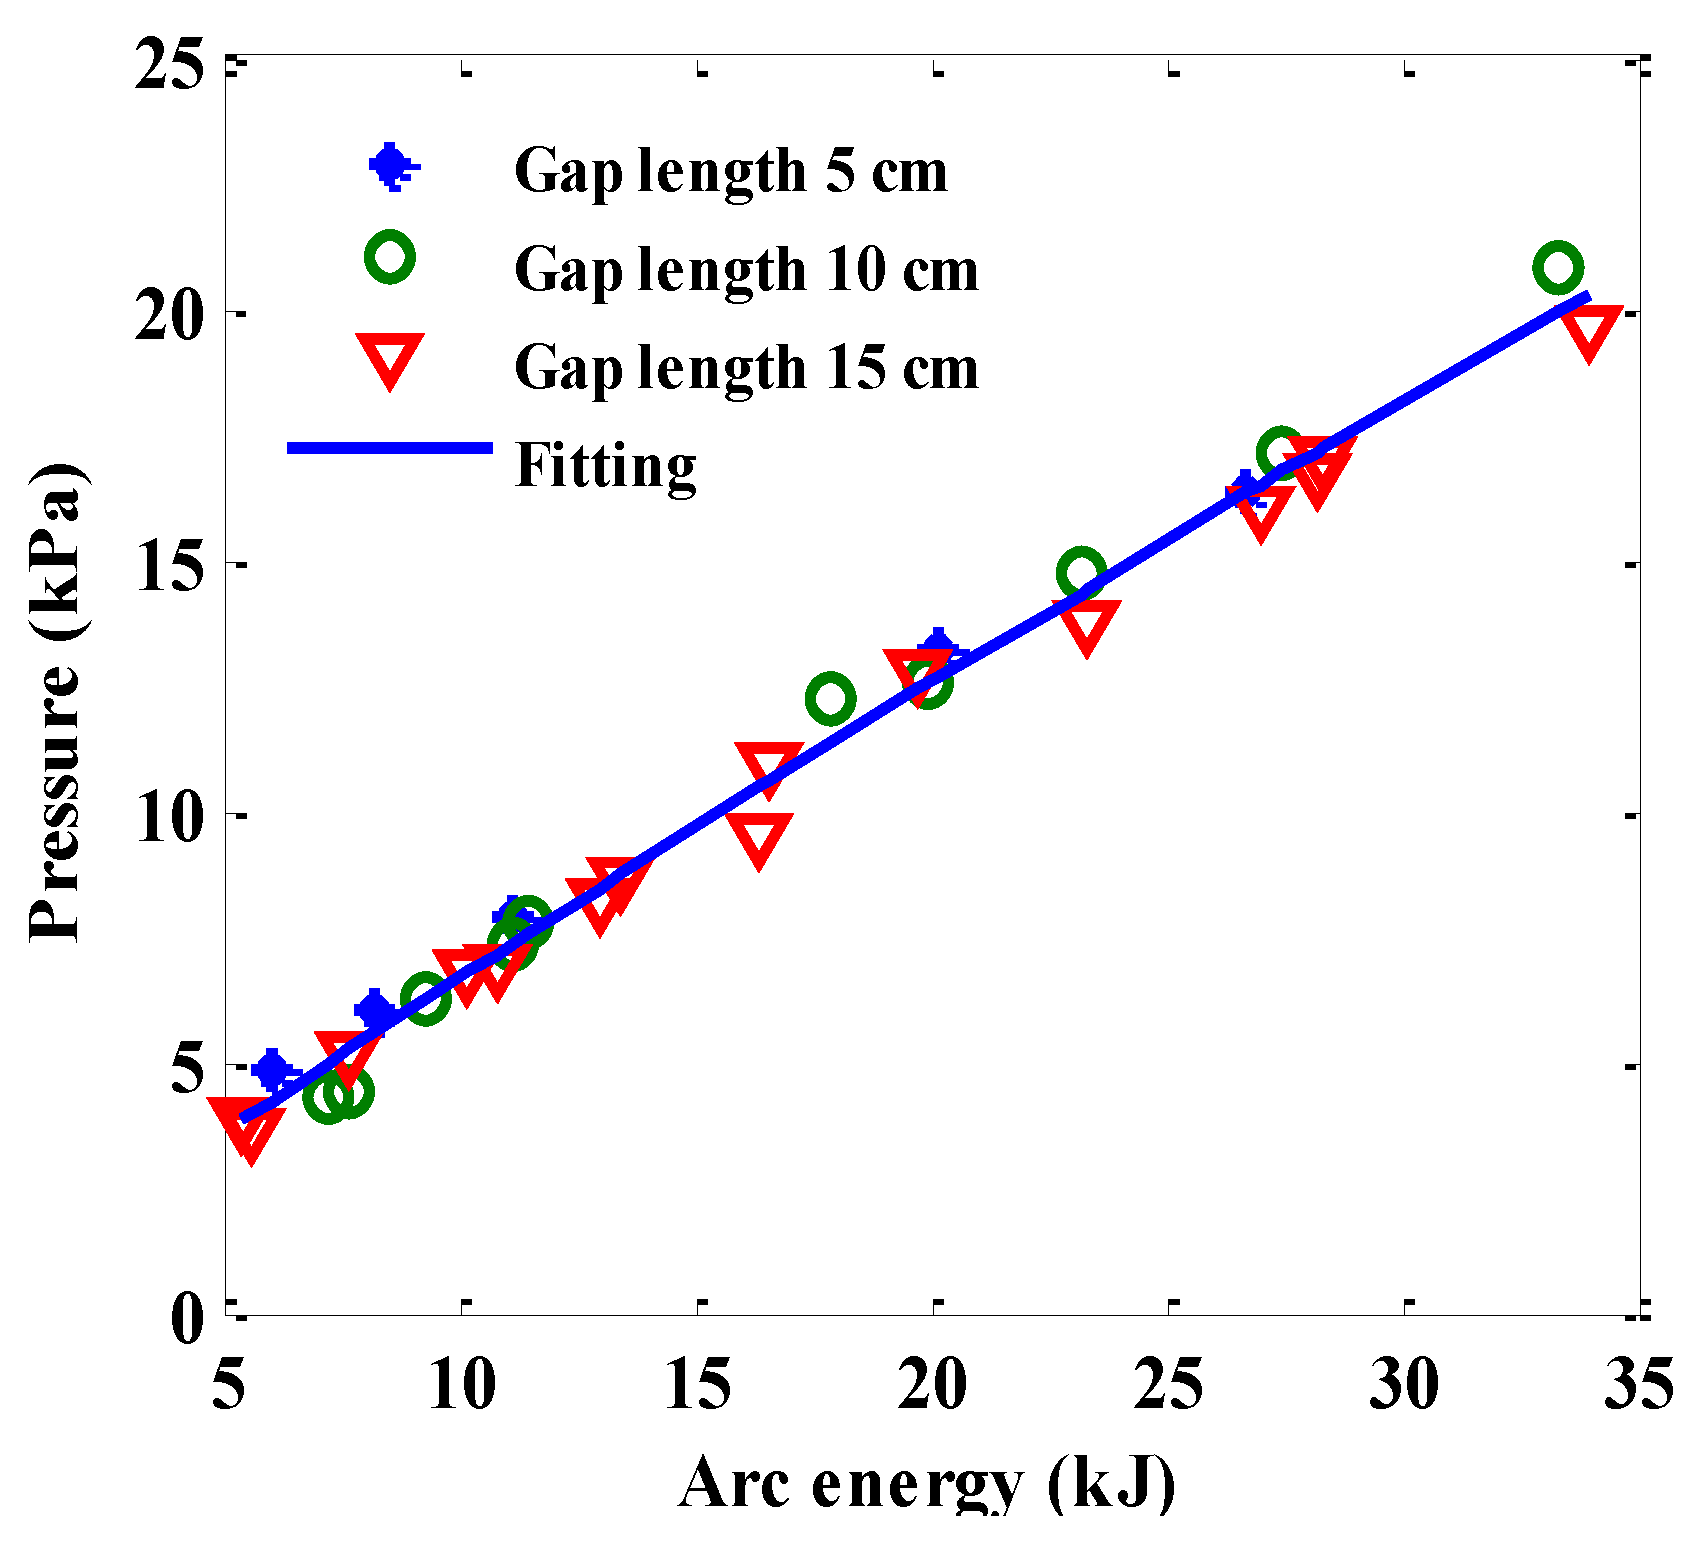
4.4. Relationship Between Pressure Rise and Arc Energy

The pressure rise in the closed container is closely related to the energy release from the arc. Therefore, it is necessary to analyze the change of pressure rise with respect to the arc energy. The energy release during the arcing can be calculated by Equation (9). Due to the energy consumption of fusing the solder wire being only about 15 J, its effect can be negligible compared with the arc energy (the minimum arc energy is about 5.982 kJ in the experiments). The relationship between pressure rise and arc energy for different gap lengths is given in Figure 12. It is observed that the pressure rise is close to a linear increase in arc energy, and the change is relatively consistent under different gap lengths. It implies that the pressure rise in the container is mainly related to the arc energy under the current experimental conditions, and the impact of the gap length is smaller. However, the increase of arc energy is nearly in linear variation with the initial gap length [26]. The relationship between pressure rise (dp) and arc energy (Qarc) is obtained by the least square curve-fitting method, as shown in Figure 12, which can be expressed as follows:
dp = 0.5789 (kPa/kJ)·Qarc (kJ) + 0.8642 (kPa)
The square of the fitting correlation coefficient R2 is 0.989 and the standard deviation is 0.5258, proving the validity of the fitting. As can be seen from Figure 12, the curve obtained by linear fitting is well aligned with the original data.
Since the size of the container is smaller and the structure is relatively simple, the kp can be determined by Equation (8). The specific heat cv is mainly related to the gas temperature and pressure. However, in this experiment, the pressure has less of an effect when the value of which is not as large. By measuring the air temperature in the container, we found that the average temperature is only about 323 K when the arc energy is 33.326 kJ. The temperature has a large effect on the specific heat when it exceeds 1000 K [27]. Hence, the specific heat in Equation (8) can still take the value at a normal temperature, i.e., 0.717 J/(g·K).
From Equation (11), the dp/Qarc (the slope of the curve) is close to a constant of 0.5789. According to Equation (8), the kp is about 0.449 when the arc energy is larger. Hence, the proportion of the arc energy leading to pressure rise in the container is about 44.9%. At the same time, the change of pressure rise with arc energy is similar for different gap lengths. It indicates that the kp is not strongly influenced by the gap length and arc energy when the value of arc energy is smaller, as described in this paper. However, if the arc energy continues to increase, the change of kp needs to be researched further.

4.5. Simulation Results Verification and Pressure Distribution in the Container

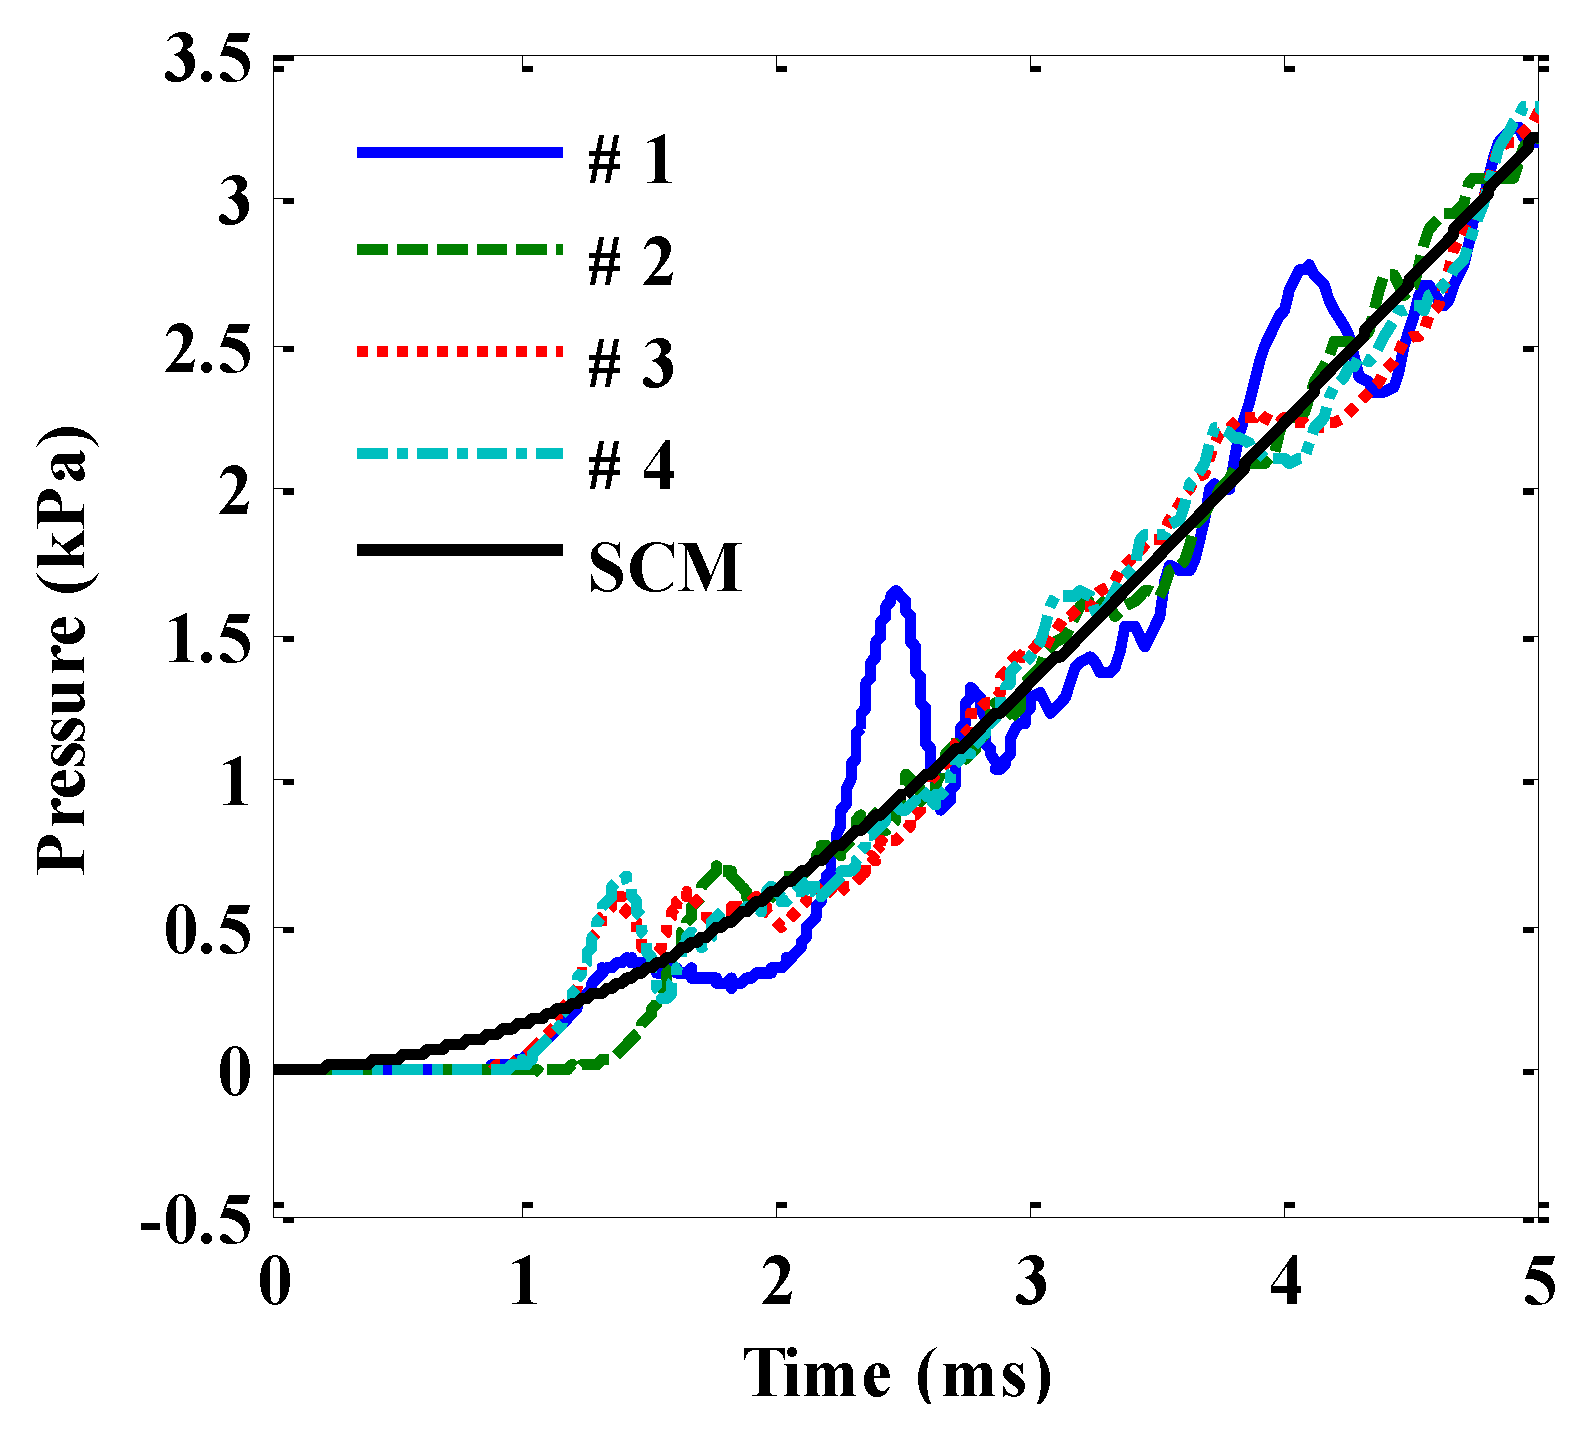
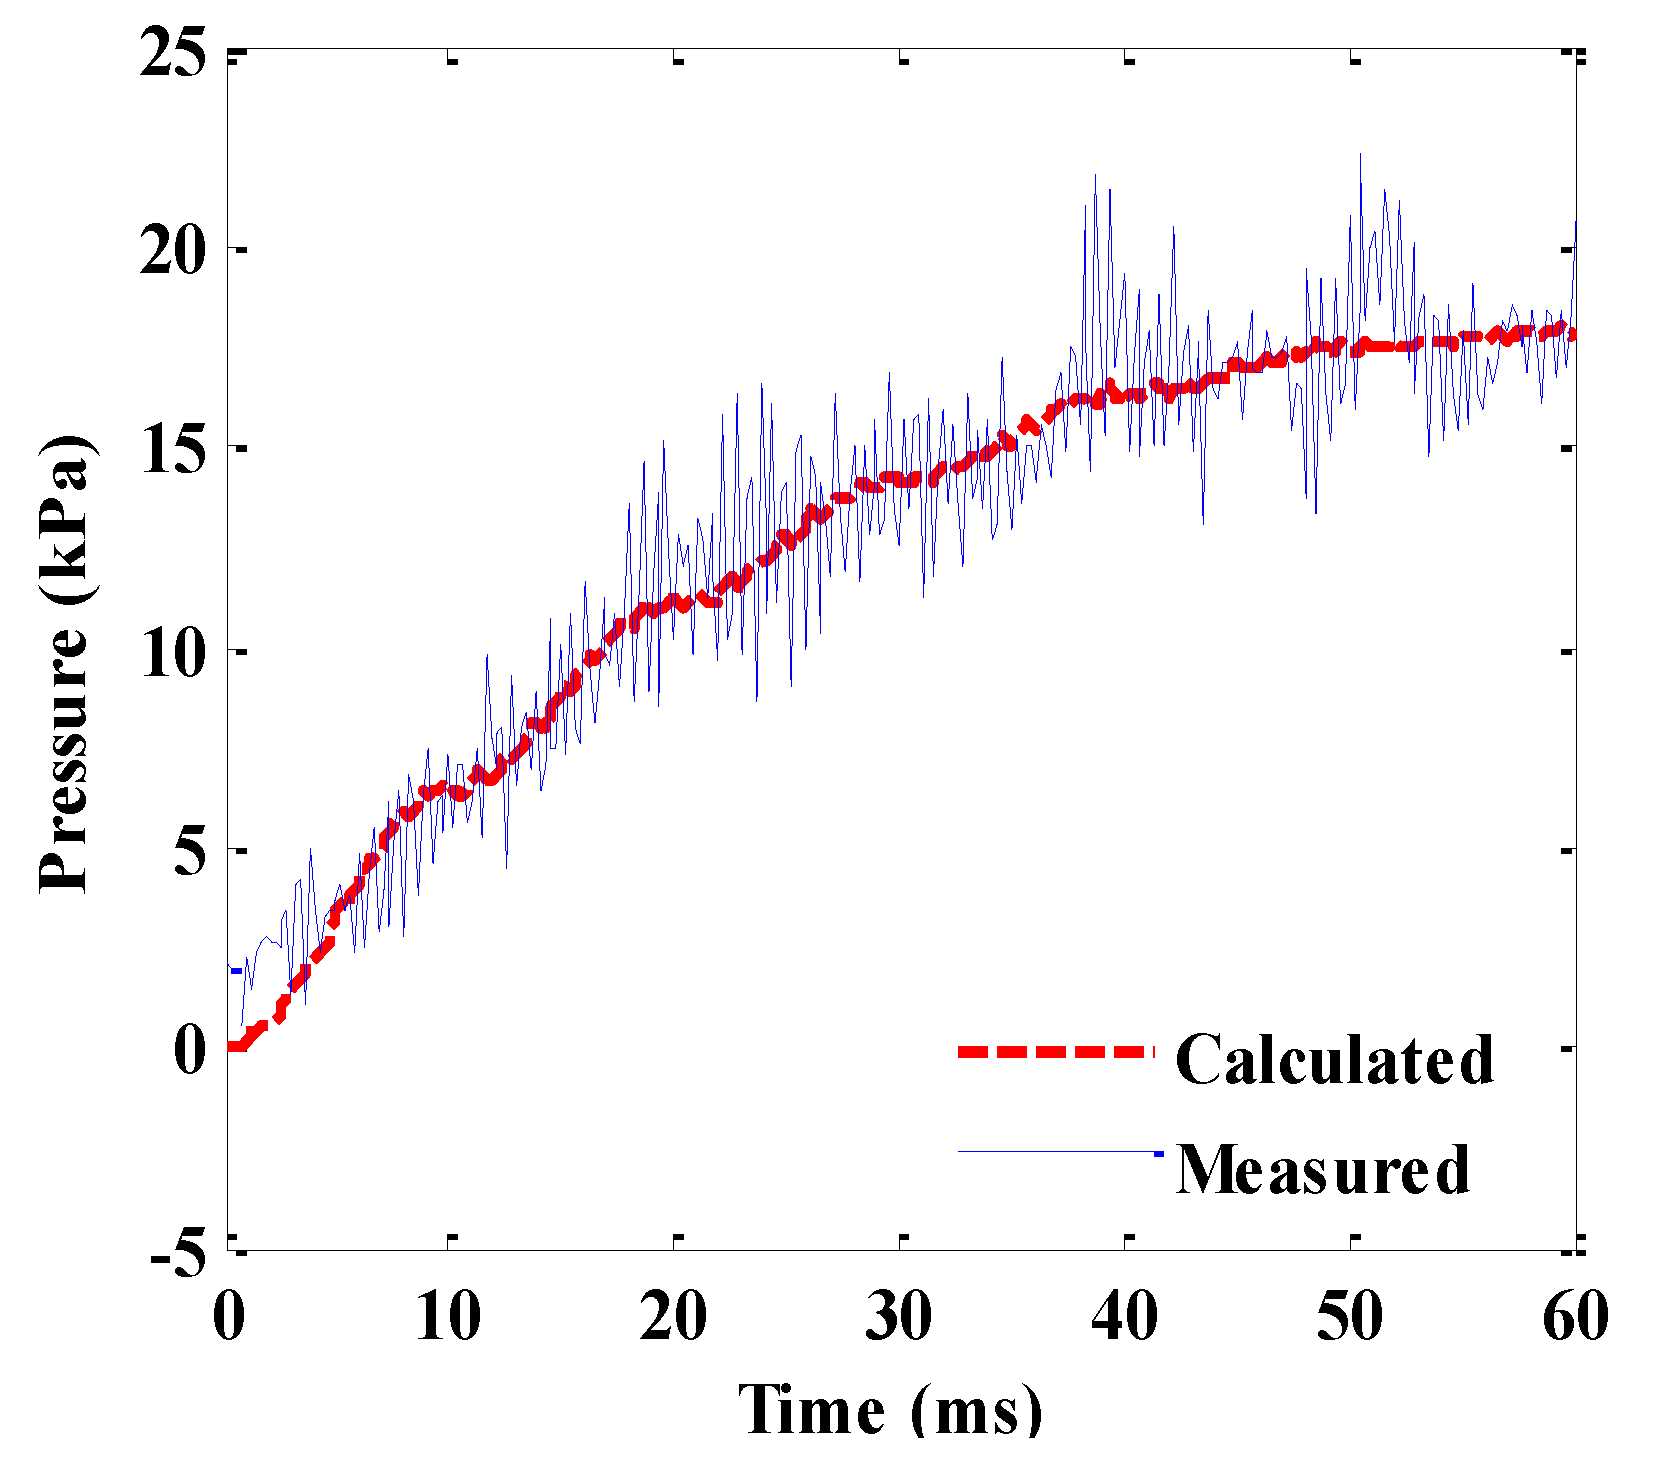
4.5.1. Verification of the Simulation Method

In order to verify the accuracy of the calculation, the results between calculation and measurement are compared. When the charging voltage of the capacitance is 6 kV and the gap length is 10 cm, with the pressure signal obtained by measuring shown in Figure 11b, the change of arc power with arc duration is shown in Figure 13, which is obtained by the arc voltage times arc current (the arc voltage and arc current are obtained by measuring as described in Section 4.2). The arc energy is about 27.488 kJ. The results show that the change rule of arc power is consistent with the arc current, which varies with sine function, and the oscillation period is about 10 ms. In each occurrence of the current value being zero, the arc power is also at zero. The fluctuations of the arc power are large, especially at the initial of arcing, which is related to the sudden increase of arc voltage near a current value of zero. In order to simplify the analysis, the arc power at each cycle is taken as sine rule changing with the arc duration, and can be calculated as follow:
P arc = u ( t ) × i ( t ) = P max | sin ( 100 π t ) | . ( W )
where u(t) and i(t) are the arc voltage and current, respectively, and Pmax is the maximum of the arc power signal at each arcing cycle (at the time of arc current reaching the peak value).
The simulation parameters are set by reference to Section 3.4, and the “kp-factor” is about 0.51 in this experimental condition according to Equation (8). Considering the symmetry of the experimental container, in order to simplify the calculation, the 1/4 model has been built to calculate the pressure distribution in the container by the CFD-method. The pressure obtained by the measurement and calculation is shown in Figure 14. It can be seen that the change of the pressure with arc duration by calculation is in accord with that of the measurement, but the fluctuations of the pressure rise obtained by the experiment are larger. This is mainly due to the complex change of the arc energy during the arcing, so the fluctuations of the arc power are bigger in the process of arcing. However, in order to simplify the calculation, the fluctuations of the arc power are ignored. Hence, the fluctuation of the calculated pressure rise is smaller. When the arc duration is 60 ms, the average pressure rise obtained by measurement and calculation are about 18.37 and 17.89 kPa, respectively, and the relative error is only about 2%. The error is mainly from the estimation of kp by Equation (8) and the ignored fluctuations of the arc power during the calculation. On the whole, a rather good agreement on pressure rise between the calculation and measurement can be obtained, and the calculation method is verified.

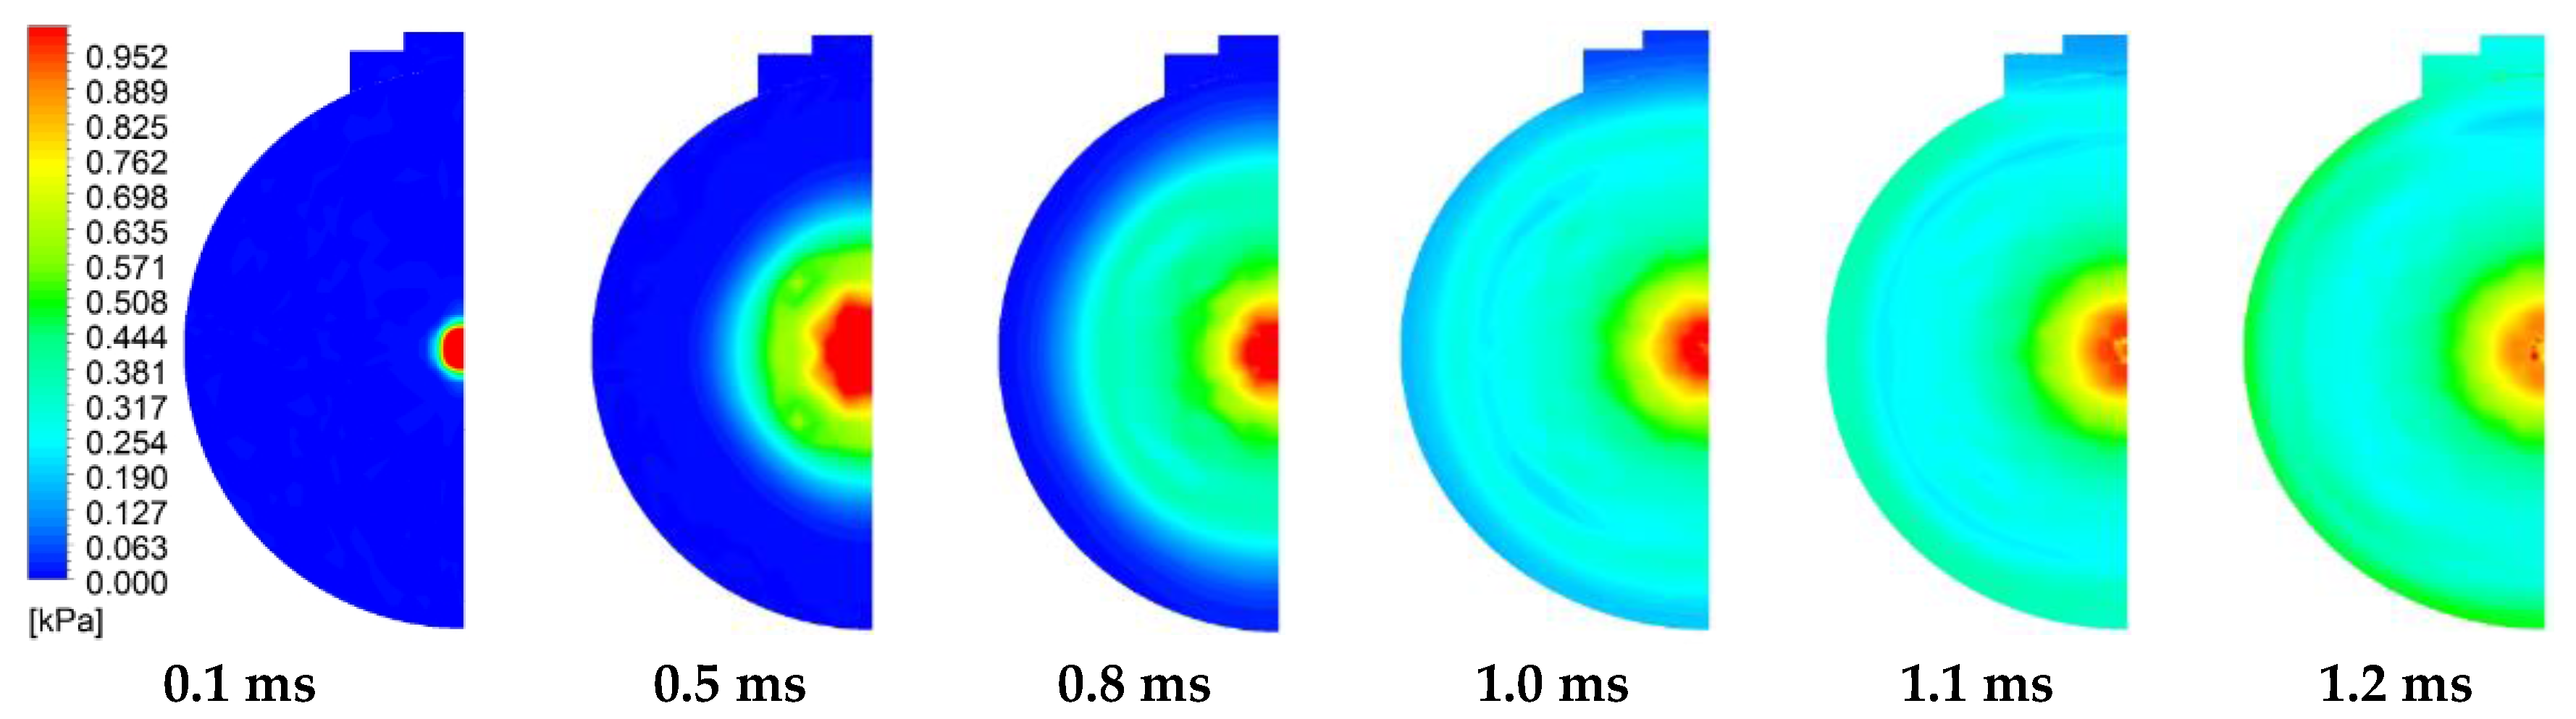
4.5.2. Pressure Distribution in the Container

The pressure distribution of the symmetry plane of the container at different times is shown in Figure 15. From these results, we find that the pressure is symmetrically distributed in the container before the pressure waves reach the walls. The pressure is decreased gradually from the arc to the wall and the maximum pressure is located in the vicinity of the arc zone. After the pressure waves reach the wall, the reflection effect of the pressure wave appears on the wall, which obviously causes the overpressure near the wall to increase, and the pressure amplitude is greater than the in areas located in the middle of the container, as shown at the times of 1.1 and 1.2 ms. Hence, the reflection and superposition effects of the pressure wave should not be ignored in a switchgear with a complex structure, and the pressure difference will be larger for different positions in the switchgear [28]. With the increase of arc duration, the pressure difference is reduced at various positions in the container, and the pressure tends to be more uniformly distributed.
In order to analyze the change of the pressure rise in the container, the monitor points #1–#4 have been selected, as shown in Figure 8. The monitor points are all located in the internal surface of the walls. Points #3 and #4 are located in the corner near the pressure relief cover, and point #1 is located in the corner between the wall and electrode. Figure 16 show the change of the pressure rise with arc duration for different monitor points, which have been compared with the result obtained by the SCM-method. After an arc duration of 5 ms, pressure waves are of no longer of any importance and the pressure in the container is close to uniform distribution. Moreover, the pressure difference for different monitor points is small. Hence, the curves only show the results before an arc duration of 5 ms. From these results, we find that the starting time of the pressure rise is the same for monitor points #1, #3, and #4, which is about 0.9 ms. The average propagation velocity of the pressure wave by calculation is about 445 m/s, which is greater than the speed of sound under standard conditions. According to the propagation velocity and the distance, the time of the pressure wave reaching monitor point #2 is about 1.2 ms, which is the same as the starting time of the pressure rise in Figure 16. Hence, the greater starting time of the pressure rise for monitor point #2 is due to it being located further away from the arc.
The propagation velocity (v) of the pressure wave is equal to the local speed of sound, which depends on the temperature and pressure, and it can be calculated with the following equation:
v = κ p / ρ
where κ is the heat capacity ratio, p is the pressure, and ρ is the density. The propagation velocity is proportional to the pressure and temperature, and the velocity increases with the arc duration due to the increase of pressure.
It can be seen from the Figure 16 that the pressure development at the monitor points shows some fluctuations before an arc duration of 5 ms, which is related to the reflections of the pressure wave on the walls. The pressure difference for the monitor points is only large as the pressure wave reaches the wall, and the difference is gradually decreased with continuous arcing, which indicates that the pressure in the container is balanced immediately with a uniform pressure distribution due to the fast propagation velocity of the pressure wave. Although monitor points #1, #3 and #4 are all located in the corner of the container, the pressure at point #1 has a larger fluctuation and amplitude than the other monitor points. The change trend of the pressure curves for #3 and #4 is similar. Hence, the reflection effects of the pressure waves on the walls are different for different monitor points. At some time values, the maximum pressure at monitor point #1 is greater than others due to the stronger reflection and superposition effects of the pressure wave. When the arc duration is about 2.4 ms, the pressure peak at point #1 is about twice as large as at other points. These results suggest that the pressure rise in the position with a larger corner (i.e., the area of the surfaces that compose the corner is large) in the container is increased significantly at some time values, and the maximum value is greater than other areas with small corners within a given period of arcing (within a few milliseconds).
From Figure 16, we also know that the result obtained by the SCM-method cannot reflect the reflection and superposition effects of the pressure wave at the beginning of the arcing, which can only present the variation of average pressure rise in the container. For a real switchgear with a pressure-relief device, the pressure difference will be larger at different positions due to the complex structure. If the SCM-method is used to calculate the pressure rise in a real switchgear, it will lead to an unreasonable result before the pressure-relief device is open. It is of significance to note that when we want to know the location of the maximum pressure in the switchgear, the SCM-method has obvious shortcomings when compared with the CFD method.

5. Conclusions

In order to study the arcing characteristic and the variation of pressure rise in a closed container due to the arc fault, small-scale experiments were carried out, as well as spatial resolved pressure rise calculations. The results are summarized as follows.
(1)
Arc volume has less influence on the calculation of pressure distribution when the arc duration is short and the arc length is relatively fixed. The relative error of the average pressure rise between the measurement and calculation is about 2%. Hence, the CFD-method can produce a good spatial pressure distribution in a closed container. The application in a real switchgear will be carried out in the further research.
(2)
The arc voltage shows fluctuations with the increase of pressure and temperature in a closed container, especially at the end period of arcing (at low currents). Arc voltage RMS changing with arc current shows a large degree of randomness, and the fluctuations of which increase with the increase of gap length. When the gap lengths are 5, 10 and 15 cm, the average potential gradients of the arc are about 26, 20 and 16 V/cm, respectively.
(3)
The pressure rise in the container increases with the increase of arc energy, and both show a good relation with linear function. The proportion (kp) of the arc energy leading to pressure rise in the container is about 44.9%. There is less influence of gap length and arc energy on kp when the arc energy is low. For higher arc energy, the change of the pressure rise and kp under different electrode types (rod or plane electrodes) needs to be performed in further research.
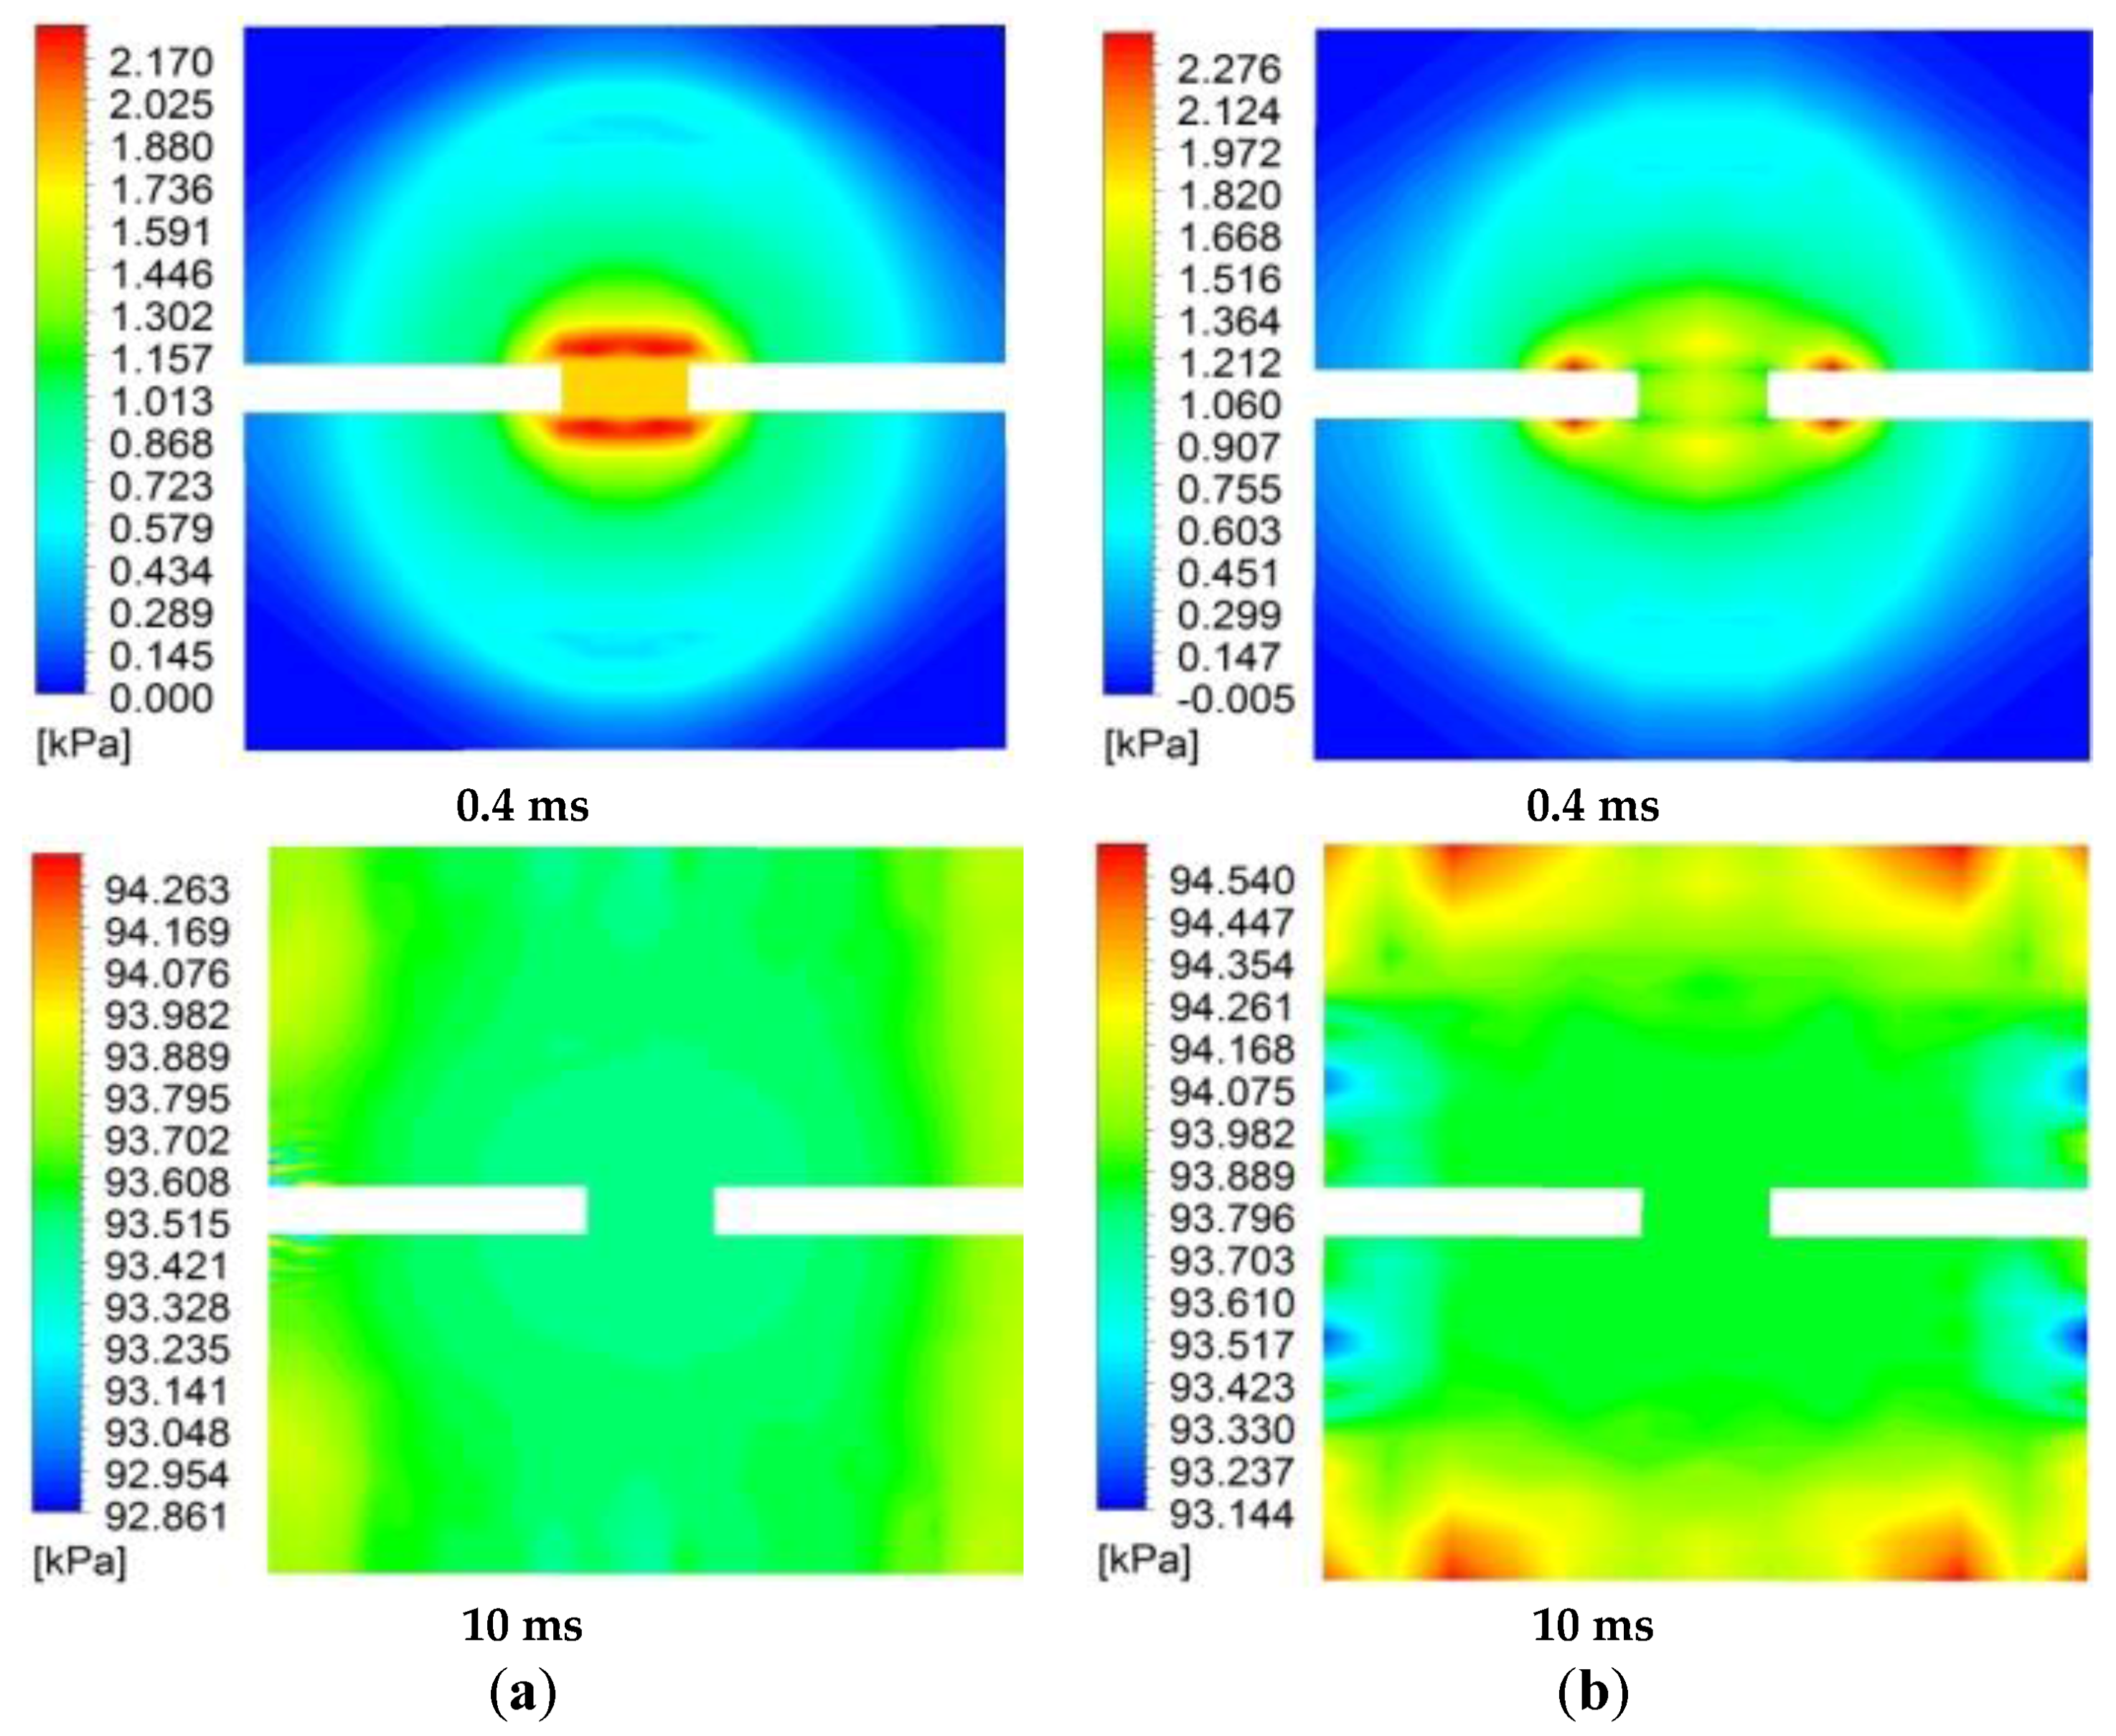
(4)
When the pressure waves reach the container wall, their reflection and superimposition effects will appear on the wall, which causes the maximum overpressure near the wall to increase. The peak value of the overpressure in the positions with a large corner is greater than in other areas with a small corner at the beginning of arcing. After a few milliseconds, pressure waves are no longer of any importance in a closed container.

Acknowledgments

This paper is supported by the Fundamental Research Funds for the Central Universities of China (Grant No. 2042016gf0008).

Author Contributions

All authors contributed equally to the research described in this work. Peng Li carried out the main research tasks and wrote the full manuscript. Jiangjun Ruan and Daochun Huang conceived and designed the experiment and calculation methods; Ziqing OuYang and Li Zhang performed the experiments; Mingyang Long and Mengting Wei analyzed the data.

Conflicts of Interest

The authors declare no conflicts of interest.

References

  1. Cai, B.; Chen, D.G.; Li, Z.P. Simulation and experiments on internal arcing faults in MV metal-clad switchgear. Trans. China Soc. Eletr. Tech. 2004, 19, 82–87. [Google Scholar]
  2. Zhang, X.; Zhang, J.; Gockenbach, E. Calculation of pressure and temperature in medium-voltage electrical installations due to fault arcs. J. Phys. D Appl. Phys. 2008, 41, 1–11. [Google Scholar] [CrossRef]
  3. AC Metal-Enclosed Switchgear and Controlgear for Rated Voltages above 1 kV and Up to and Including 52 kV; IEC 62271-200; International Electrotechnical Commission: Geneva, Switzerland, 2011.
  4. Dasbach, A.; Pietsch, G.J. Calculation of pressure waves in substation buildings due to arcing faults. IEEE Trans. Power Del. 1990, 5, 1760–1765. [Google Scholar] [CrossRef]
  5. Friberg, G.; Pietsch, G.J. Calculation of pressure rise due to arcing faults. IEEE Trans. Power Del. 1999, 14, 365–370. [Google Scholar] [CrossRef]
  6. Rong, M.; Li, M.; Wu, Y.; Yang, F.; Liu, W.; Li, Y.; Chen, Z. 3-D MHD modeling of internal fault arc in a closed container. IEEE Trans. Power Del. 2014. [Google Scholar] [CrossRef]
  7. Wu, Y.; Li, M.; Rong, M.; Yang, F.; Murphy, A.B.; Wu, Y.F.; Yuan, D. Experimental and theoretical study of internal fault arc in a closed container. J. Phys. D Appl. Phys. 2014, 47, 1–14. [Google Scholar] [CrossRef]
  8. Anantavanich, K.; Pietsch, G.J.; Gockenbach, E. Modelling of SF6-air mixtures in MV switchgear during internal arcing using a CFD tool. In Proceedings of the 15th International Symposium on High Voltage Engineering (ISH), Ljubljana, Slovenia, 27–31 August 2007.
  9. Anantavanich, K.; Pietsch, G.J. Calculation of overpressure in the surroundings of fault arcs in SF6-air mixtures. In Proceedings of the 17th International Conference on Gas Discharges and Their Applications, Cardiff, UK, 7–12 September 2008.
  10. Zhang, X.; Pietsch, G.; Gockenbach, E. Investigation of the thermal transfer coefficient by the energy balance of fault arcs in electrical installations. IEEE Trans. Power Del. 2006, 21, 425–431. [Google Scholar] [CrossRef]
  11. Iwata, M.; Anantavanich, K.; Pietsch, G. Influence of arc current on fraction kp of electric arc energy leading to pressure rise in a closed container. In Proceedings of the 17th International Conference on Gas Discharges and Their Applications, Cardiff, UK, 7–12 September 2008.
  12. Iwata, M.; Anantavanich, K.; Pietsch, G.J. Influence of current and electrode material on fraction kp of electric arc energy leading to pressure rise in a closed container during internal arcing. IEEE Trans. Power Del. 2010, 25, 2028–2029. [Google Scholar] [CrossRef]
  13. Iwata, M.; Tanaka, S.I.; Ohtaka, T.; Amakawa, T.; Anantavanich, K.; Pietsch, G.J. CFD calculation of pressure rise due to internal AC and DC arcing in a closed container. IEEE Trans. Power Del. 2011, 26, 1700–1709. [Google Scholar] [CrossRef]
  14. Wahle, A.; Pietsh, G.J. Effect of energy absorption systems on internal arc testing of medium voltage switchgear. In Proceedings of the 17th International Conference on Gas Discharges and Their Applications, Cardiff, UK, 7–12 September 2008.
  15. Rochette, D.; Clain, S.; Bussiére, W.; André, P.; Besnard, C. Porous filter optimization to improve the safety of the medium-voltage electrical installations during an internal arc fault. IEEE Trans. Power Del. 2010, 25, 2464–2471. [Google Scholar] [CrossRef]
  16. Rochette, D.; Clain, S.; André, P.; Bussiére, W.; Gentils, F. Two-dimensional modeling of internal arc effects in an enclosed MV cell provided with a protection porous filter. J. Phys. D Appl. Phys. 2007, 40, 3137–3144. [Google Scholar] [CrossRef]
  17. Anantavanich, K. Calculation of Pressure Rise in Electrical Installations Due to Internal Arcs Considering SF6-air Mixtures and Arc Energy Absorbers. Ph.D. Thesis, RWTH Aachen University, Aachen, Germany, March 2010. [Google Scholar]
  18. Finke, S.; Koenig, D.; Kaltenborn, U. Effects of fault arcs on insulating walls in electrical switchgear. In Proceedings of the International Symposium on Electrical Insulation, Anaheim, CA, USA, 2–5 April 2000.
  19. Wactor, M.; Olsen, T.W.; Ball, C.J.; Lemmerman, D.J.; Puckett, R.J.; Zawadzki, J. Strategies for mitigation the effects of internal arcing faults in medium-voltage metal-enclosed switchgear. In Proceedings of the IEEE/PES Transmission and Distribution Conference and Exposition, Developing New Perspectives, Atlanta, GA, USA, 28 October–2 November 2001.
  20. Sweeting, D. Arcing faults in electrical equipment. In Proceedings of the 56th Petroleum and Chemical Industry Conference, Anaheim, CA, USA, 14–16 September 2009.
  21. Sweeting, D. Arcing faults in electrical equipment. IEEE Trans. Ind. Appl. 2011, 47, 387–397. [Google Scholar] [CrossRef]
  22. Bjortuft, T.R.; Granhaug, O.; Hagen, S.T.; Kuhlefelt, J.H.; Salge, G.; Skryten, P.K.; Stangherlin, S. Internal arc fault testing of gas insulated metal enclosed MV switchgear. In Proceedings of the 18th International Conference and Exhibition on Electricity Distribution, Turin, Italy, 6–9 June 2005.
  23. Lowke, J.J. Simple theory of free-burning arcs. J. Phys. D Appl. Phys. 1979, 12, 1873–1886. [Google Scholar] [CrossRef]
  24. Sing, A.; Ahmmed, M.; Atharparvez, M. Numerical simulation of arc splitting process in a L V switching device considering thermo-field emission mechanism. In Proceedings of the 2015 IEEE 61st Holm Conference on Electrical Contacts, San Diego, CA, USA, 11–14 October 2015.
  25. Fjeld, E.; Hagen, S.T. Small scale arc fault testing in air. In Proceedings of the 20th International Conference and Exhibition on Electricity Distribution-Part 1, Prague, Czech Republic, 8–11 June 2009.
  26. Fjeld, E.; Hagen, S.T. Small-scale arc fault testing of medium-voltage metal-enclosed switchgear. IEEE Trans. Power Del. 2016, 31, 37–43. [Google Scholar] [CrossRef]
  27. Liang, D.W.; Li, B.; Rong, W. Thermodynamic characteristics of thermally perfect gas and solution of N-S equations. J. Nanjing Univ. Aeronaut. Astronaut. 2003, 35, 424–429. [Google Scholar]
  28. Chen, X.F.; Zhang, Y.; Zhang, Y. Effect of CH4-air ratios on gas explosion flame microstructure and propagation behaviors. Energies 2012, 5, 4132–4146. [Google Scholar] [CrossRef] [Green Version]
Figure 1. Simplified energy balance of the arc fault before the pressure relief device is open.
Energies 10 00294 g001
Figure 2. Different stages of the pressure rise before and after the pressure relief device is open.
Energies 10 00294 g002
Figure 3. Flowchart of the pressure rise calculation method.
Energies 10 00294 g003
Figure 4. Flowchart of the kp- determination method.
Energies 10 00294 g004
Figure 5. Cross-section of the simulation model.
Energies 10 00294 g005
Figure 6. Pressure distribution at different time. (a) D = 1 cm; (b) D = 2 cm.
Energies 10 00294 g006
Figure 7. Schematic diagram of the current circuit.
Energies 10 00294 g007
Figure 8. Closed container.
Energies 10 00294 g008
Figure 9. Signals of current and arc voltage under different charging voltages. (a) 3 kV; (b) 4.35 kV; (c) 6 kV; and (d) 6.8 kV.
Energies 10 00294 g009
Figure 10. Change of the arc voltage with current peak under different gap lengths.
Energies 10 00294 g010
Figure 11. Change of the pressure rise with arc duration for different charging voltages. (a) 4.35kV; (b) 6 kV.
Energies 10 00294 g011
Figure 12. Change of the pressure rise with arc energy under different gap lengths.
Energies 10 00294 g012
Figure 13. Charge of the arc power with arc duration.
Energies 10 00294 g013
Figure 14. Pressure rise obtained by calculation and measurement.
Energies 10 00294 g014
Figure 15. Pressure distribution of the cross section in the container.
Energies 10 00294 g015
Figure 16. Change of the pressure with arc duration at different monitor points by computational fluid dynamics (CFD) and standard calculation method (SCM).
Energies 10 00294 g016
Table 1. Physical parameters of the solder wire.
Melting Point (°C)Density (g/cm3)Specific Heat Capacity (kJ·kg−1·K−1)Electrical Resistivity (Ω·m)
1838.40.1914.5 × 10−8

