Article

A Study on the Optimization of Surfactants in the Main and Vice Slug in Weak Base ASP Flooding

1
College of Petroleum Engineering, Northeast Petroleum University, Daqing 163318, China
2
Beijing Deweijiaye Technology Corporation Ltd., Beijing 100027, China
3
Post-Doctoral Scientific Research Station, Daqing Oilfield Company, Daqing 163413, China
4
Research Center of Sulige Gas Field, Changqing Oilfield Company Limited, Xi’an 710000, China
5
Chemical Engineering Department, Rice University, Houston, TX 77005, USA
*
Author to whom correspondence should be addressed.
Energies 2017, 10(3), 304; https://doi.org/10.3390/en10030304
Submission received: 25 November 2016 / Accepted: 28 February 2017 / Published: 3 March 2017

Abstract

:
In ASP (Alkali-Surfactant-Polymer) flooding processes, surfactants help to enhance oil recovery by lowering the interfacial tension between the oil and water. However, due to the high cost of surfactants and the stability of the emulsion that varies with surfactant concentration, it is necessary to optimize the surfactant concentration in ASP flooding. In this study, we combined numerical simulation and physical experimental research to solve this problem. In order to screen for the optimal surfactant concentration in the main and vice slugs, CMG (Computer Measurement Group) numerical simulation software was used to change the surfactant concentration in the injected compound system and the oil recovery factor and the recovery percent of reserves were compared. The physical experiments were also carried out with different surfactant concentrations and the results verified the simulation results. It shows that the recovery factor increases with the surfactant concentration. The optimal surfactant concentration in the main and vice slug are 0.3% and 0.15%, respectively. As for improving the recovery factor, it is more efficient to increase the mass fraction of the surfactant in the vice slug than in the main slug. It demonstrates that the amount of surfactant in the main slug plays a more important role in displacing oil from the formation.

1. Introduction

At present some oilfields have entered the high water-cut period, which has brought about many issues, such as difficulties in the development process and poor economic benefits. Some recovery technologies must be applied to improve recovery efficiency. Based on polymer flooding, we developed ASP (Alkali-Surfactant-Polymer) flooding, which provides a stable production for the old oilfields and broad prospects for enhanced oil recovery [1,2].
Research results have shown that adding surfactant into the slug is very helpful in improving the recovery efficiency. Firstly, the surfactant can reduce the interfacial tension between the water and oil phase and turn the residual oil into an oil-water emulsion, which makes crude oil more dispersed and results in higher crude oil production. However, adding too much surfactant into the compound system will reduce its viscosity, causing difficulties in fluid control. Additionally, surfactants are expensive, therefore it is necessary to optimize the surfactant concentration [3,4,5]. Results have shown that the ASP system with a lower concentration of surfactant can improve oil recovery by 22.3%, which was better than that of the surfactant/polymer system, alkali/polymer system, and polymer system [6]. Using a surfactant with higher concentration does not guarantee higher oil recovery, but it does increase the cost of the operation. It was found that using low concentration surfactants can improve the recovery efficiency significantly [7]. The surfactant type and mass fraction were selected through the orthogonal test method. The results showed that the QY-3 surfactant has the best compatibility with polymers resulting in an effective synergistic effect, which greatly reduced the oil-water interfacial tension. The results also showed that the oil displacement efficiency is the most economical and effective when the mass fraction of the surfactant is 0.3% [8]. The surfactant concentration used for EOR (Enhanced Oil Recovery) in the Daqing Oilfield low permeability oil reservoir was also studied. Five different concentrations (0.1%, 0.2%, 0.3%, 0.4%, and 0.5%) of SY surfactant were used for flooding. The results showed that 0.3% is the optimum concentration, due to the lower surfactant usage and good oil recovery characteristics [9]. The surfactant adsorption in the reservoir was also studied, and the results showed that the adsorption is irreversible with concentration and reversible with salinity [10].
However, research on optimizing the surfactant concentration in weak base ASP flooding has been only briefly reported. In this article, based on the geological characteristics of SA II10-SA III in the Daqing oilfield, a geological model through CMG (Computer Measurement Group) software (Computer Measurement Group, Turnersville, NJ, USA) was constructed, and the model was verified by the dynamic history of water drive production. Then the optimal surfactant concentrations in the main slug and vice slug were screened through numerical simulation. Finally, a physical experiment was conducted to verify the simulation results.

2. Numerical Simulation Model

In order to ensure the smooth development of a reservoir numerical simulation, a reasonable development plan was generated and a fine 3D geological model was established on the basis of comprehensive geological studies. Combining the existing Eclipse black oil model and the geological characteristics of the block, the CMG-STARS (Computer Measurement Group, Steam, Thermal and Advanced process Reservoir Simulation) chemical flooding model was established and modified.

2.1. Numerical Simulator

The CMG parallel simulator can directly input the results of reservoir descriptions into several modules, which can be returned to the geological modeling software simultaneously, so as to realize the real full oil reservoir numerical simulation.
The CMG software can be used to calculate and process the model. It can deal with complex structural oil and gas reservoirs. The resulting solution is stable, and the data processing function is strong. The STARS module can simulate the thermal recovery and chemical flooding in the oil field. As compared to other numerical simulation software, it has a better simulation effect, especially in the following aspects:
(1)
It includes a flexible component model, user can defined chemical reaction kinetics, phase equilibrium constant model, function model, saturation function model, and flexible good geological mechanics model of the simulator, and the user can simulate all kinds of chemical flooding processes based on this software;
(2)
It can fully characterize the physicochemical mechanism in the process of chemical flooding, it can simulate the change of molecular weight of the polymer, polymer shear, affect the degree of mineralization, adsorption, and retention, permeability decrease, inaccessible pore volume, non-Newtonian fluid, polymer degradation, capillary number equation, interfacial tension, components of the dispersion and diffusion, ion exchange reaction, emulsification, etc. It also can be used to simulate the scale of the laboratory to the scale of the mine, such as the choice of the chemical agent, the optimization of the development method, the research on the oil displacement mechanism, the chemical flooding simulation, and so on.
Based on the above analysis, we chose the CMG software as the numerical simulator software.

2.2. Geologic Characteristics

The site for the ASP flooding experiment is located in the west of the Daqing oilfield, including the SA II10-SA III10 blocks. The reservoir is a clastic reservoir with a delta plain and inner front sedimentary facies. This clastic reservoir has thick deposition, wide distribution, relatively good connectivity, and high capacity of injection and output. The physical property parameters of this area are as follows: oil-bearing area of the site 3.7 km2, perforated sandstone thickness 23.4 m, net pay thickness 14.7 m, and mean permeability 0.553 µm2. The well pattern is a five point area with a distance of 125 m between the injection and producing well. There are 230 wells in the area, including 99 injection wells and 131 producing wells. The geological reserves are 706.19 × 10⁴ t. The pore volume is 1377.07 × 104 cm3. At present, the extraction rate is 39.84%; the comprehensive water content is 92.8%, which is in the super high water cut stage.

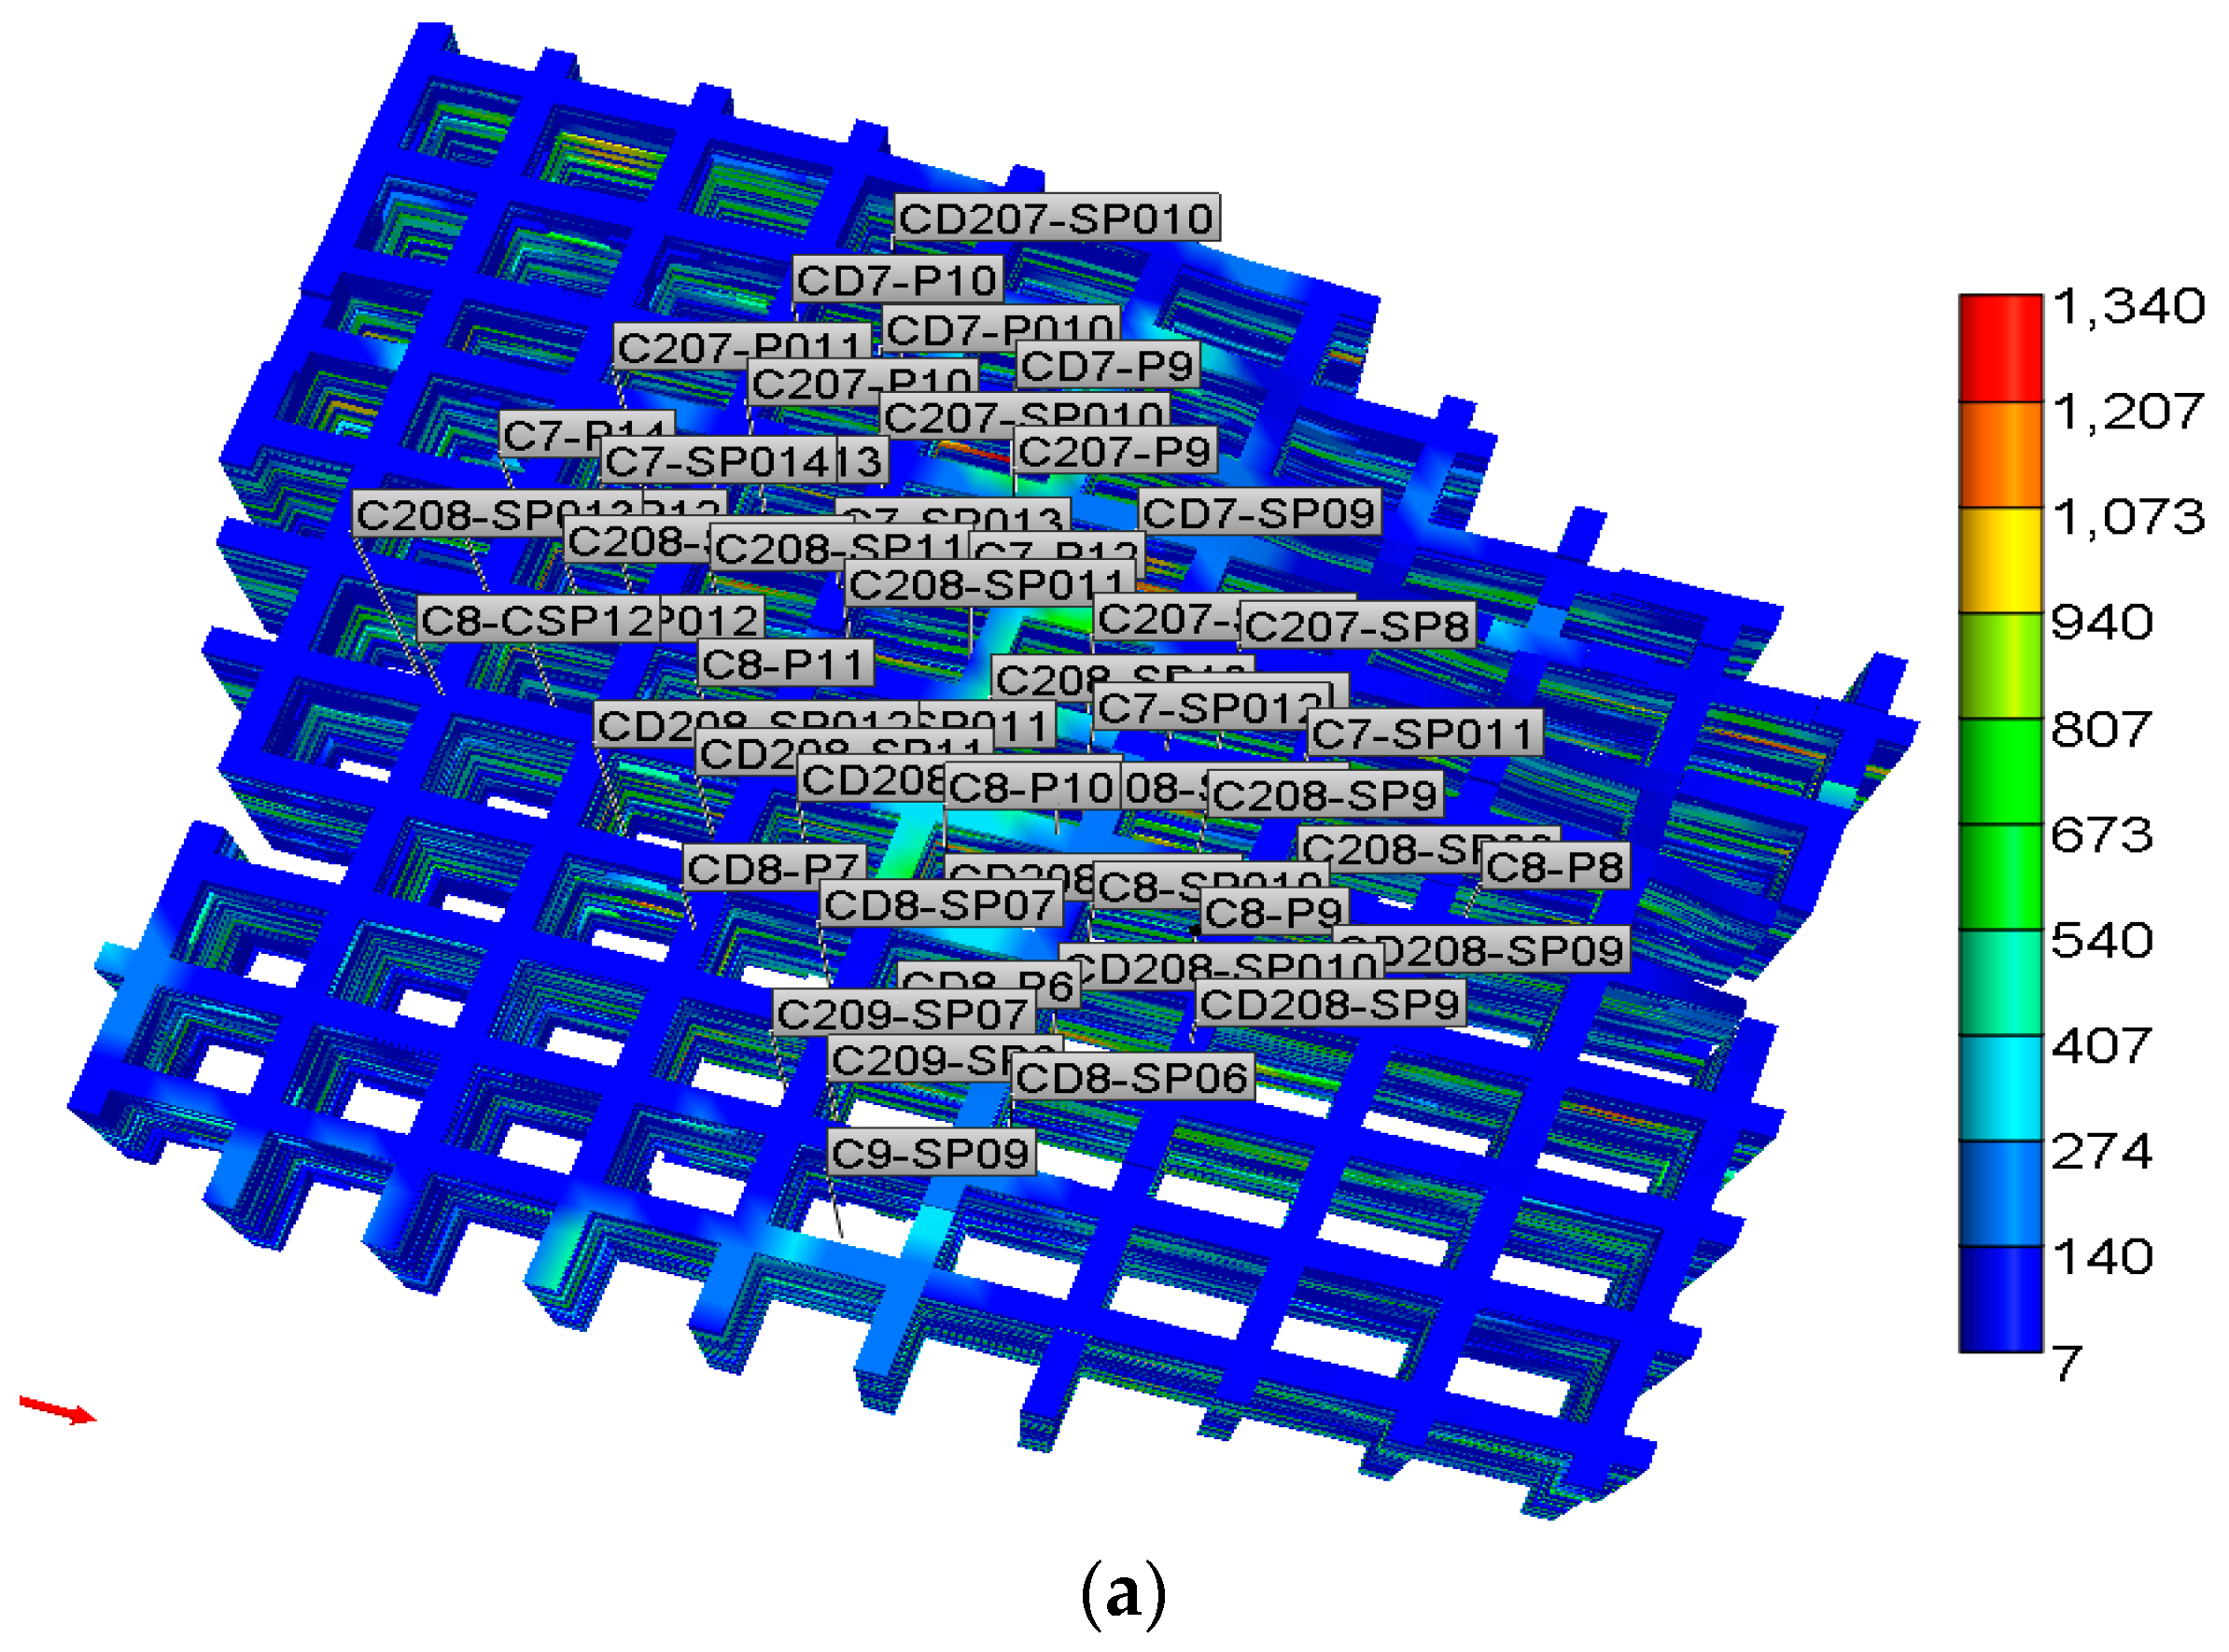
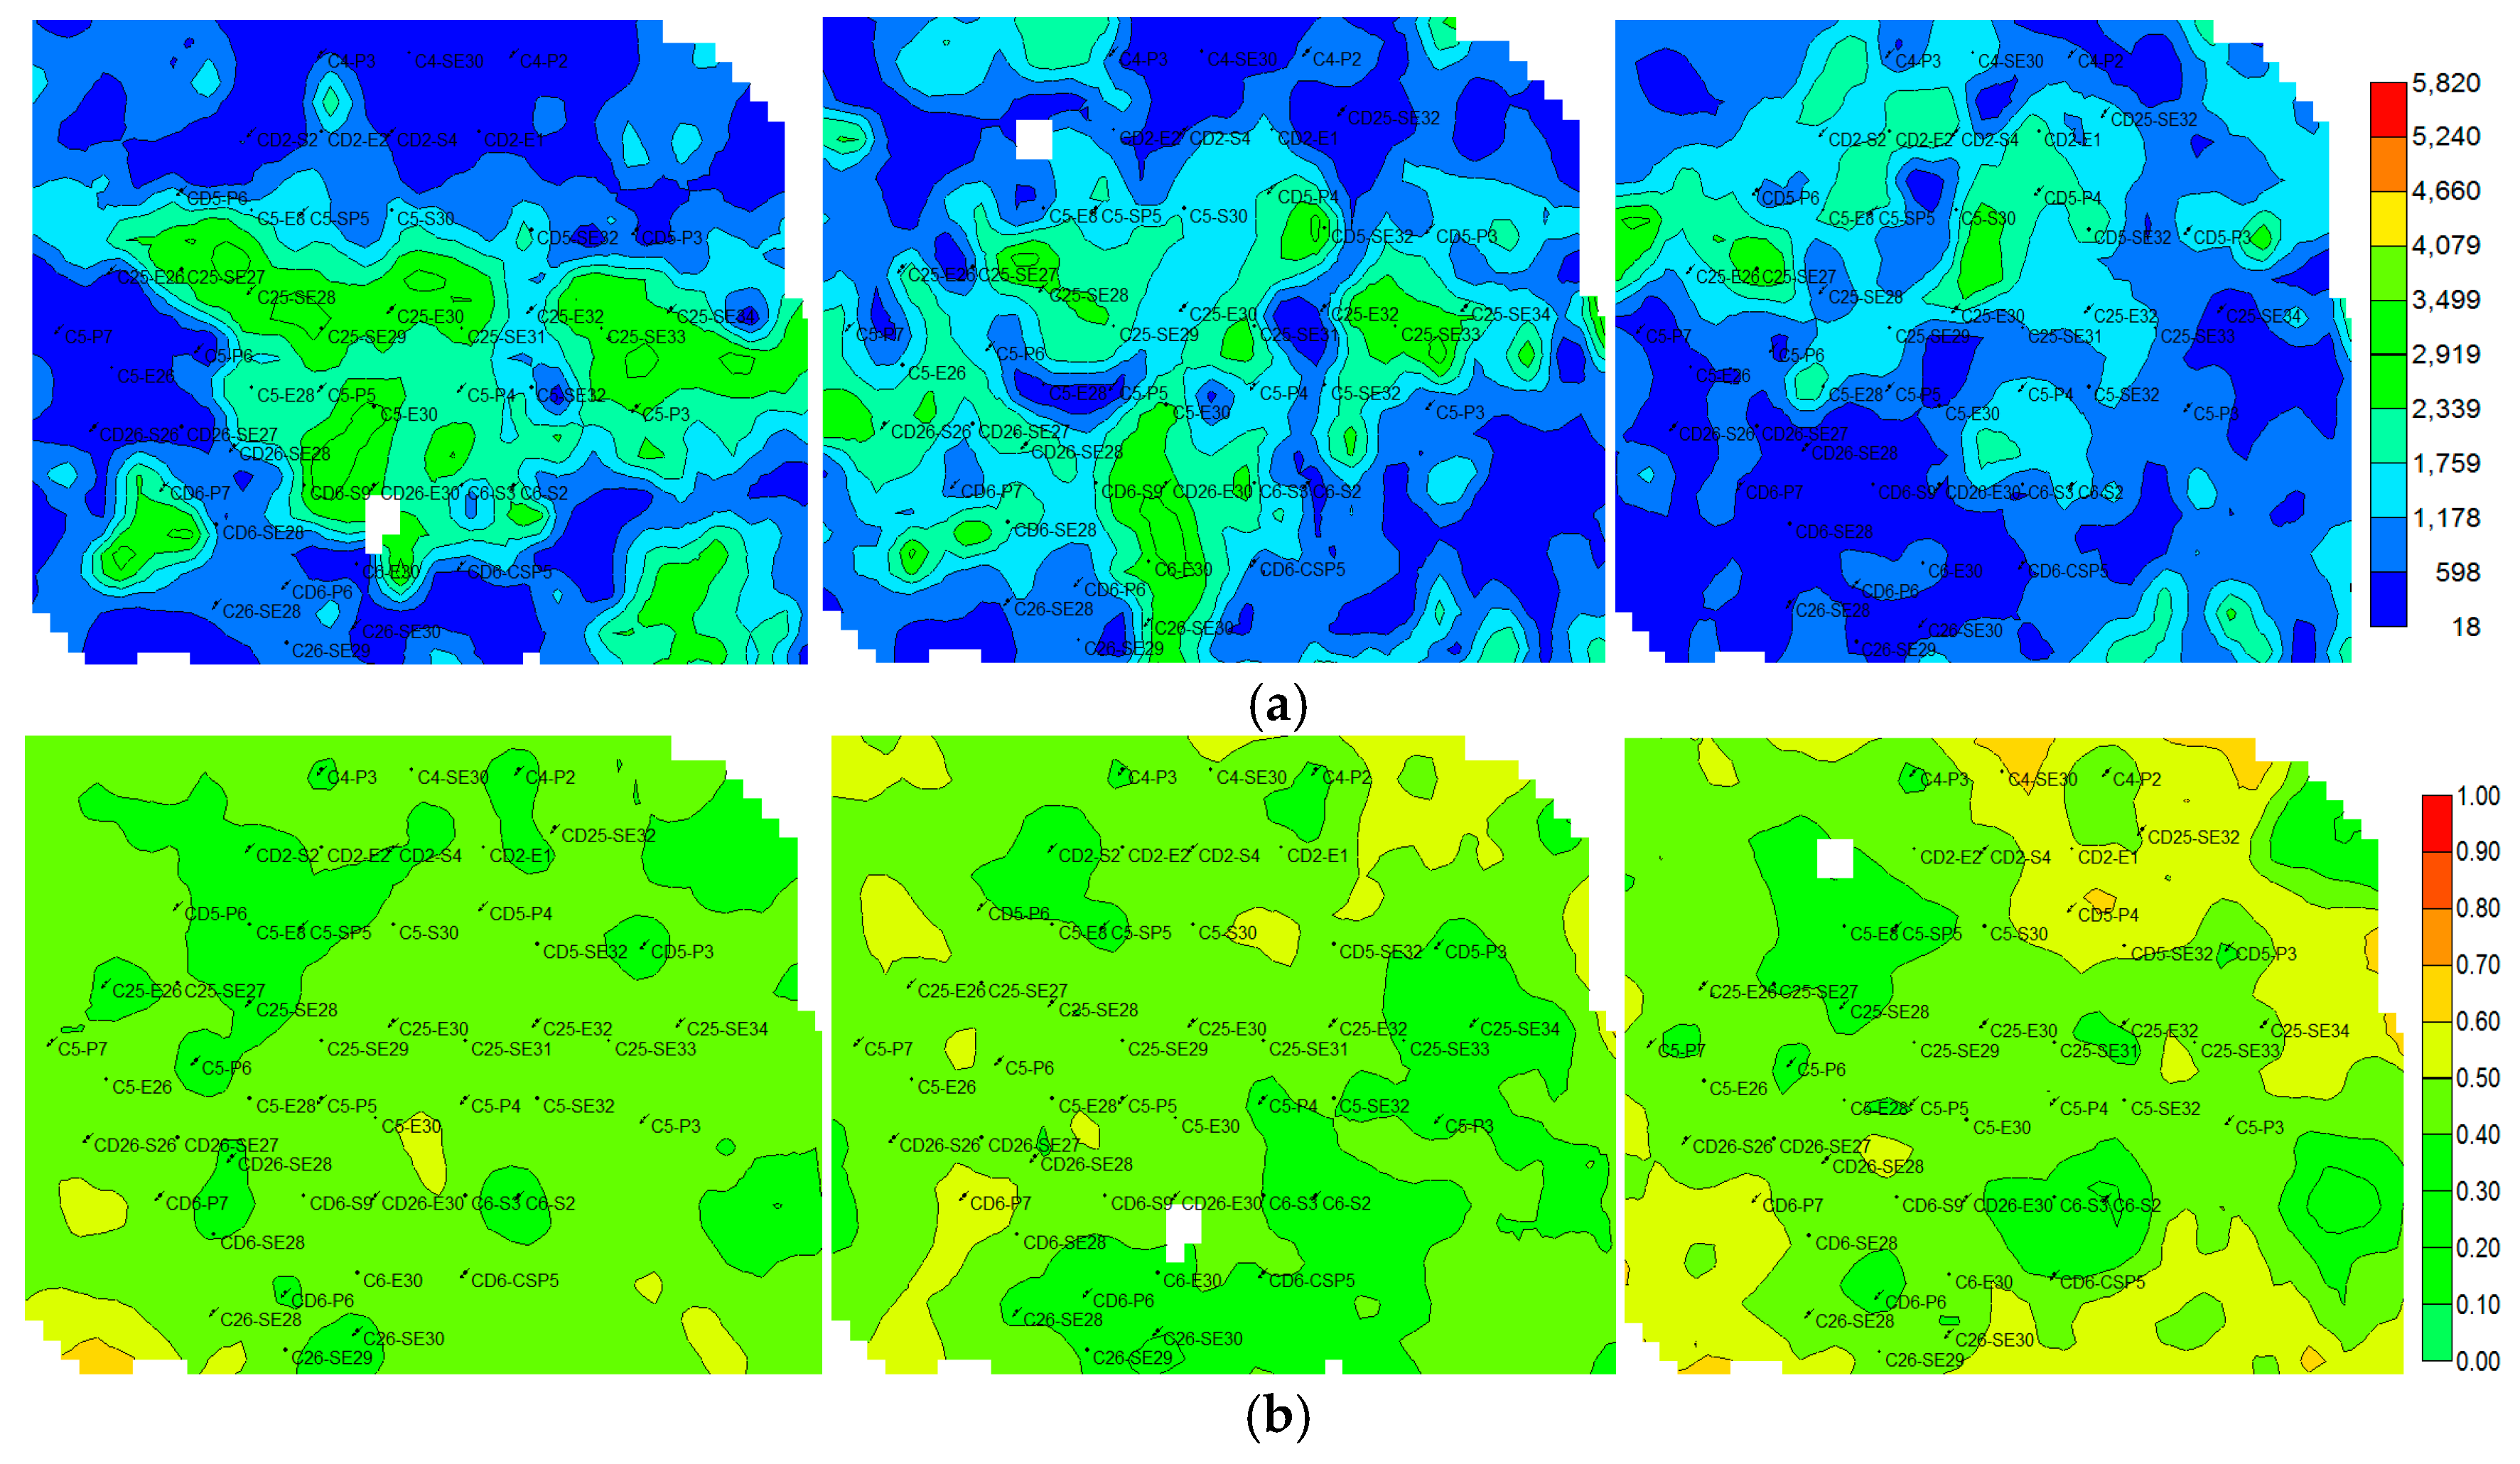
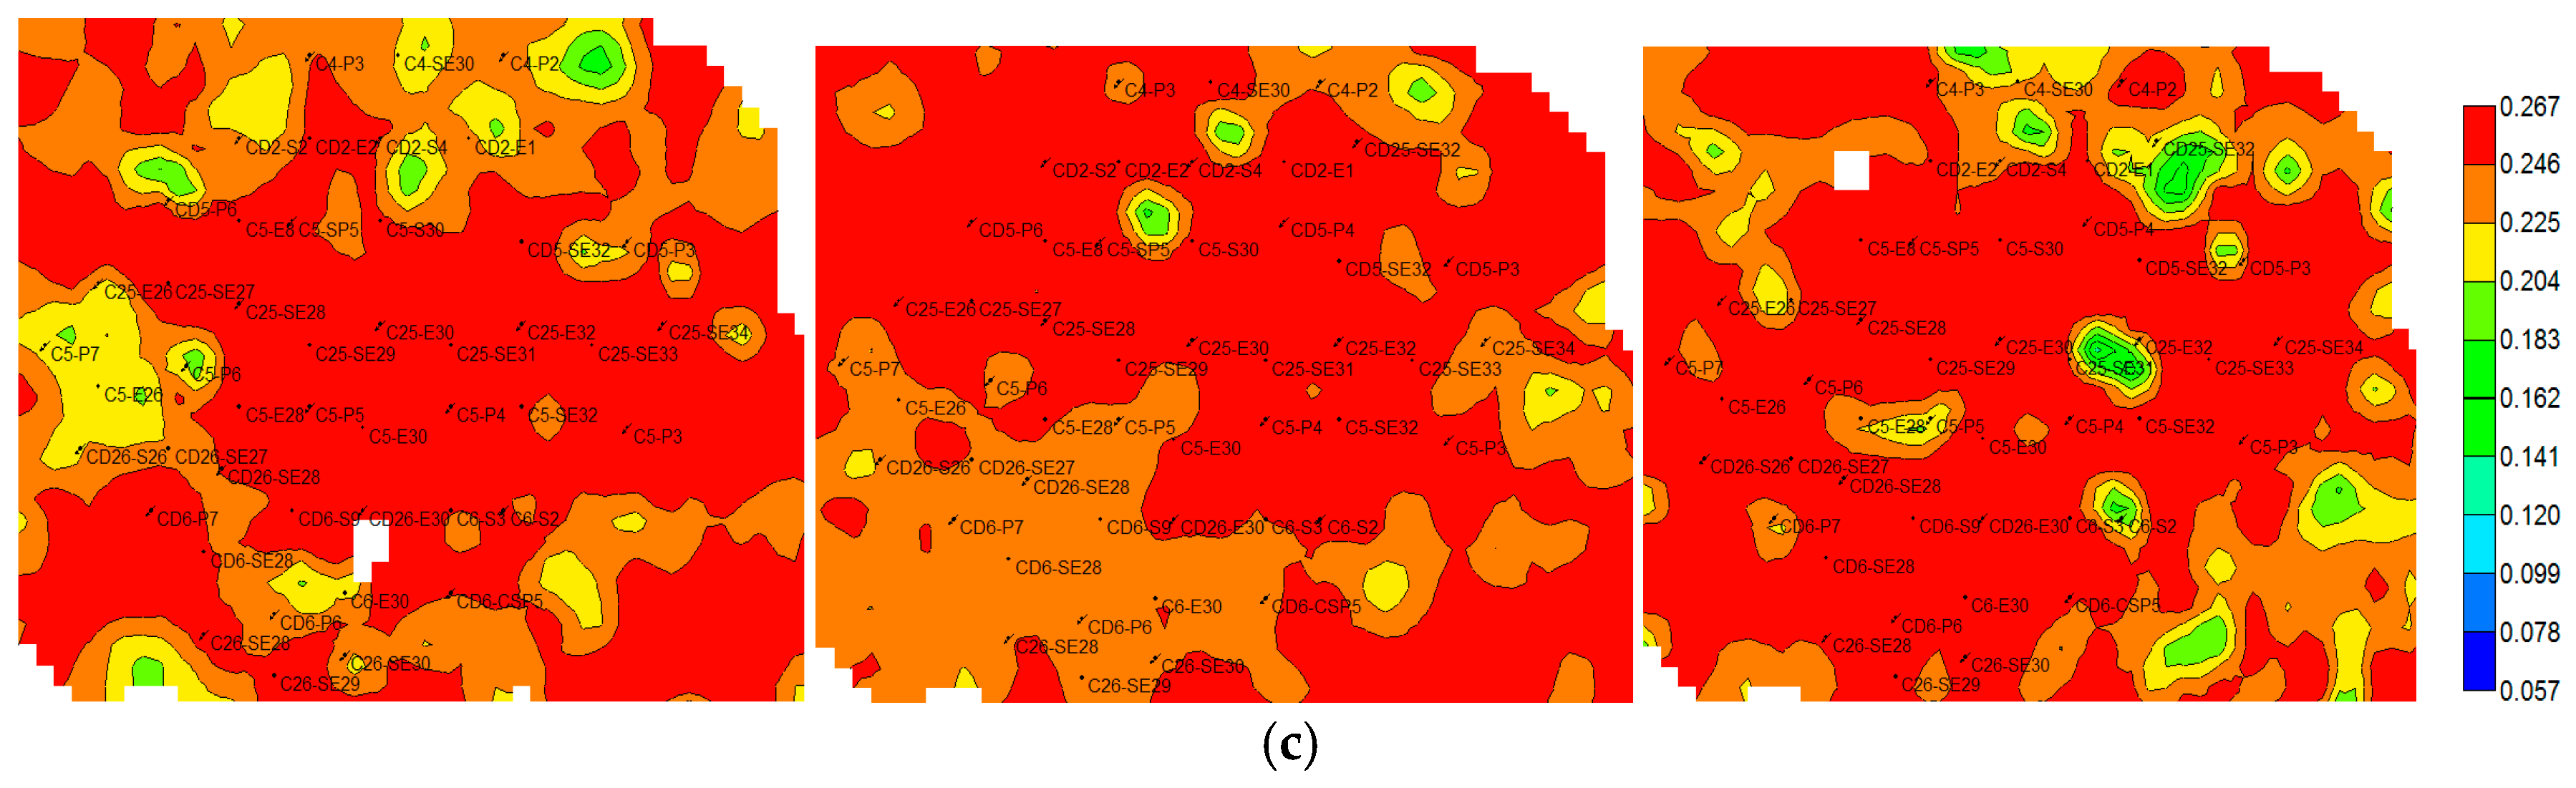
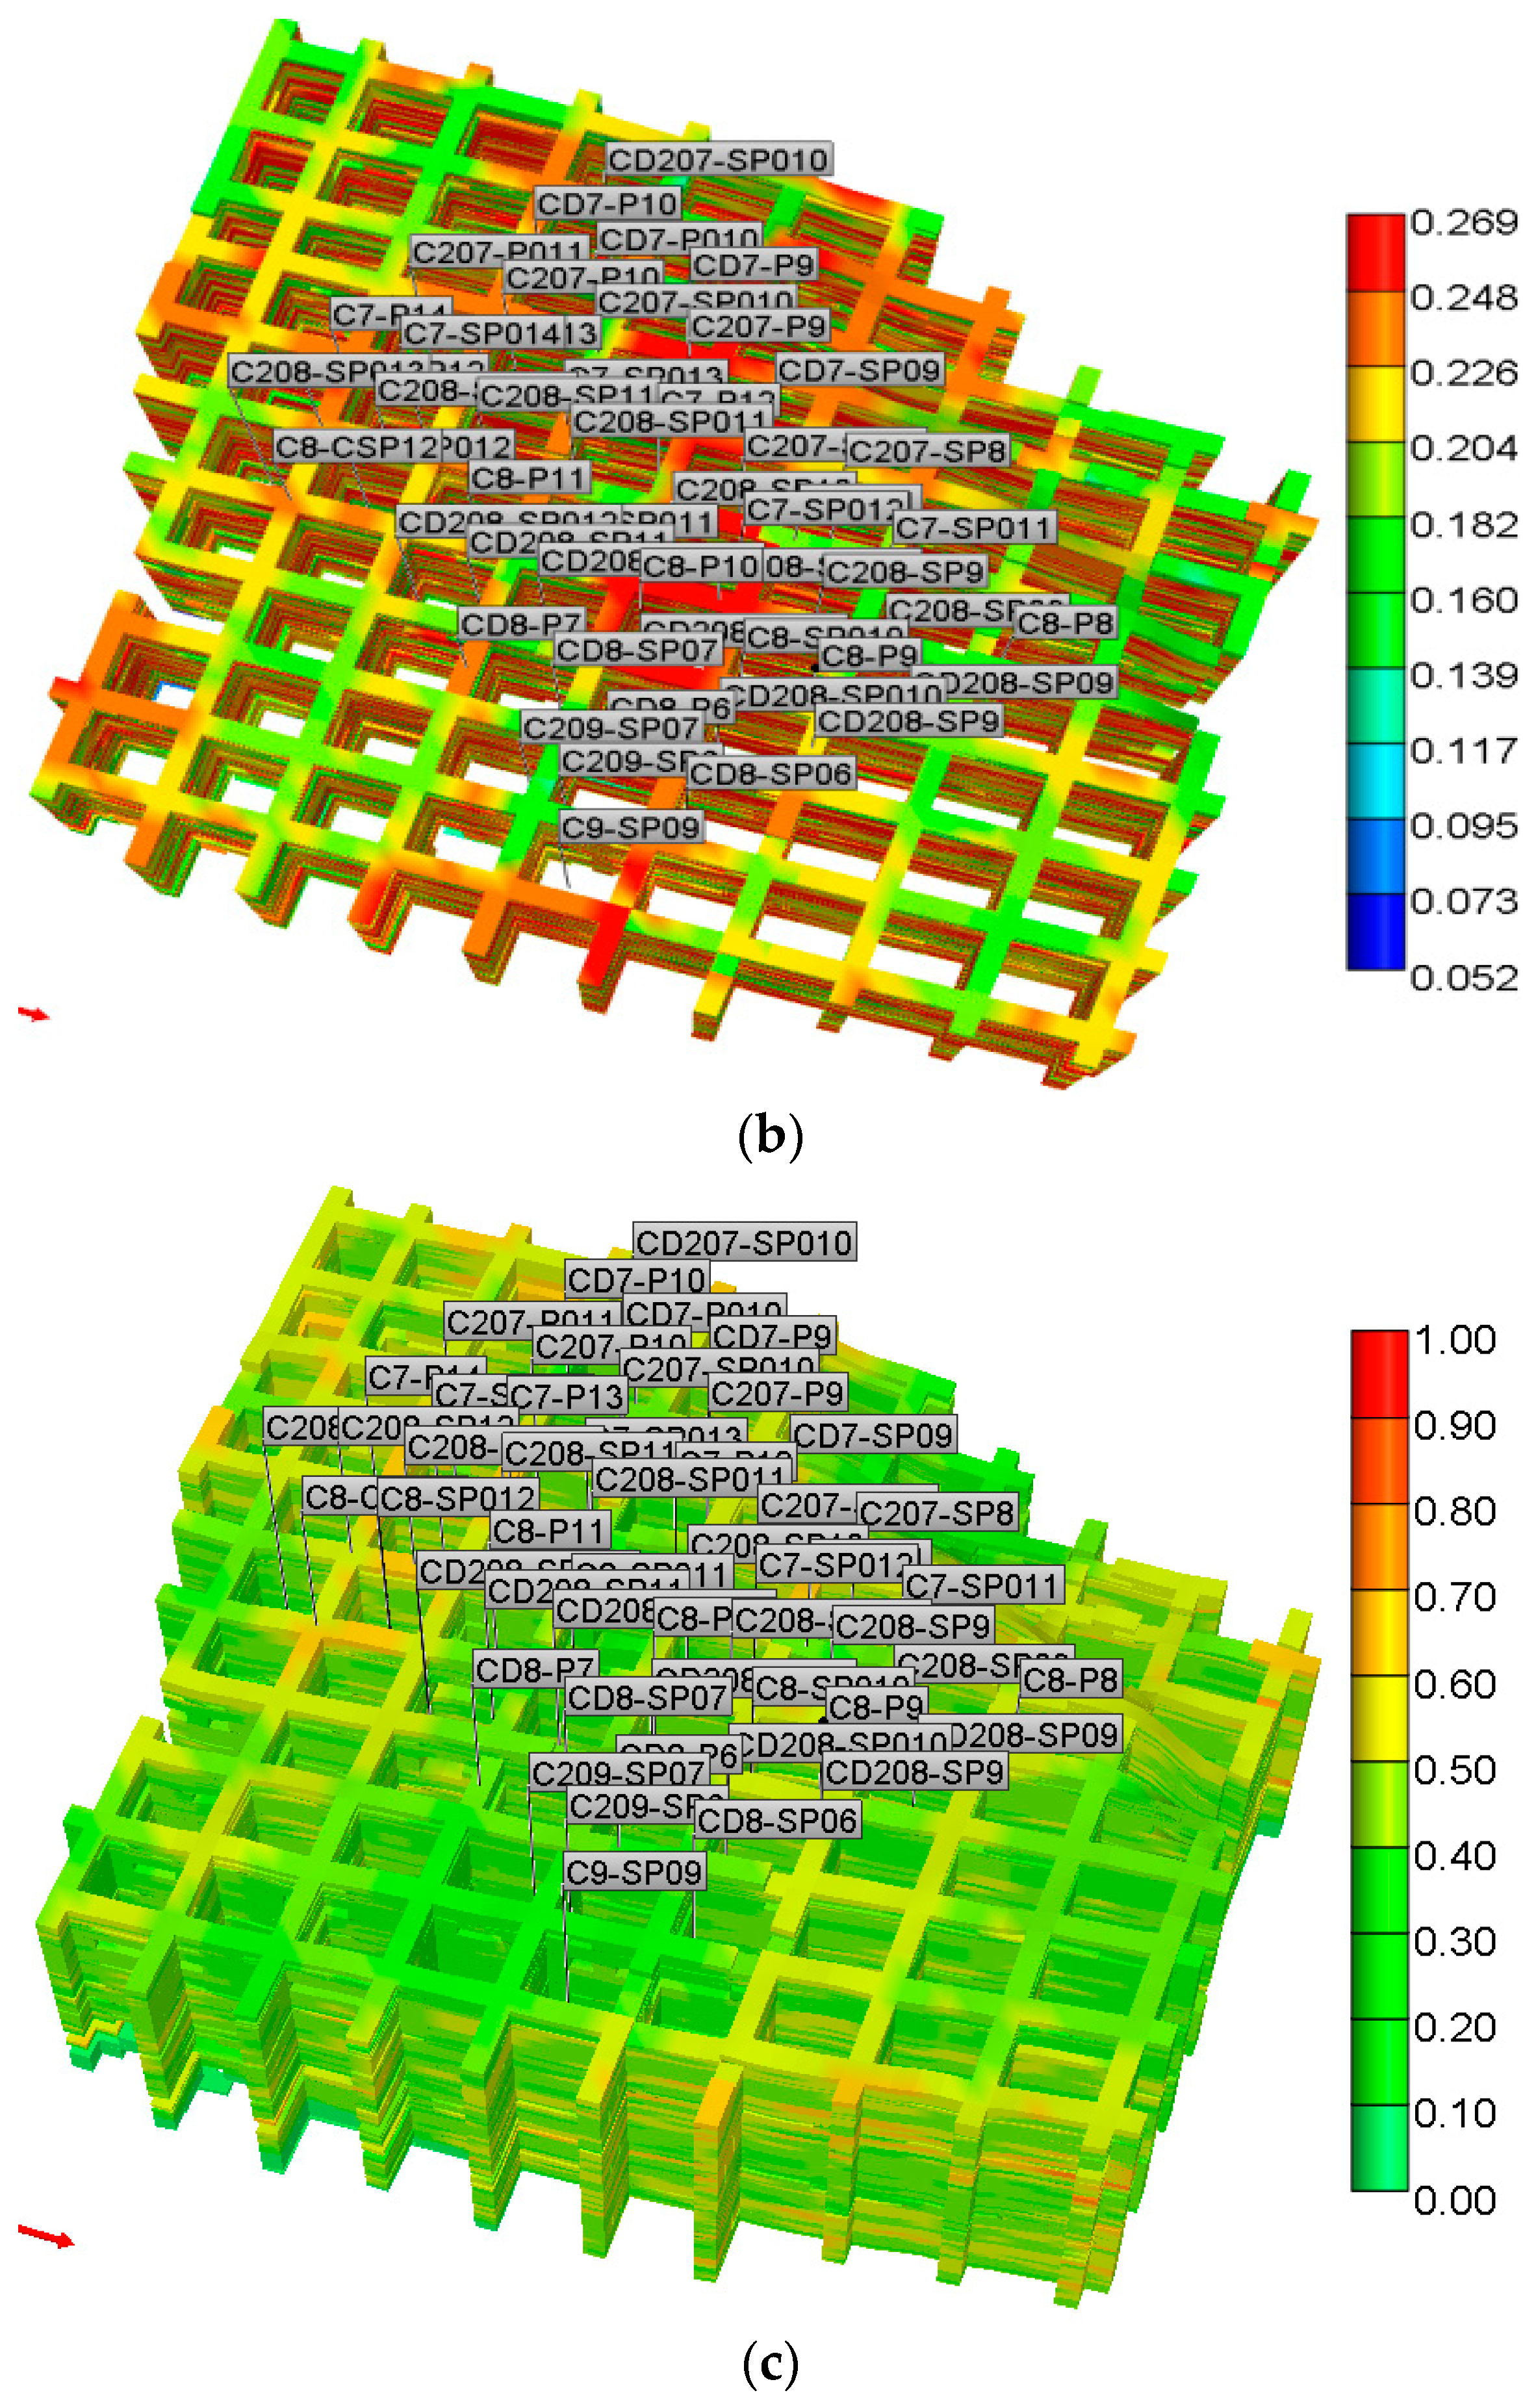
2.3. Geologic Models Characterization

The ASP flooding numerical simulation is implemented using the STARS module of the CMG software. The numerical simulation model, which is a multicomponent chemical flooding model, is intercepted in the center representative area of the experimental zone. In the model, there are 50 wells, including 28 injection wells and 22 producing wells. Total grid numbers of the model are 51 × 44 × 53 = 118,932 in the X and Y coordinate axis. Each grid size is 10 m. In the longitudinal axis, a refined grid is used that represents a mean thickness of 0.5 m. The model of permeability, porosity, and oil saturation is shown in Figure 1. The contour map of the permeability and oil saturation of the main layer are shown in Figure 2.

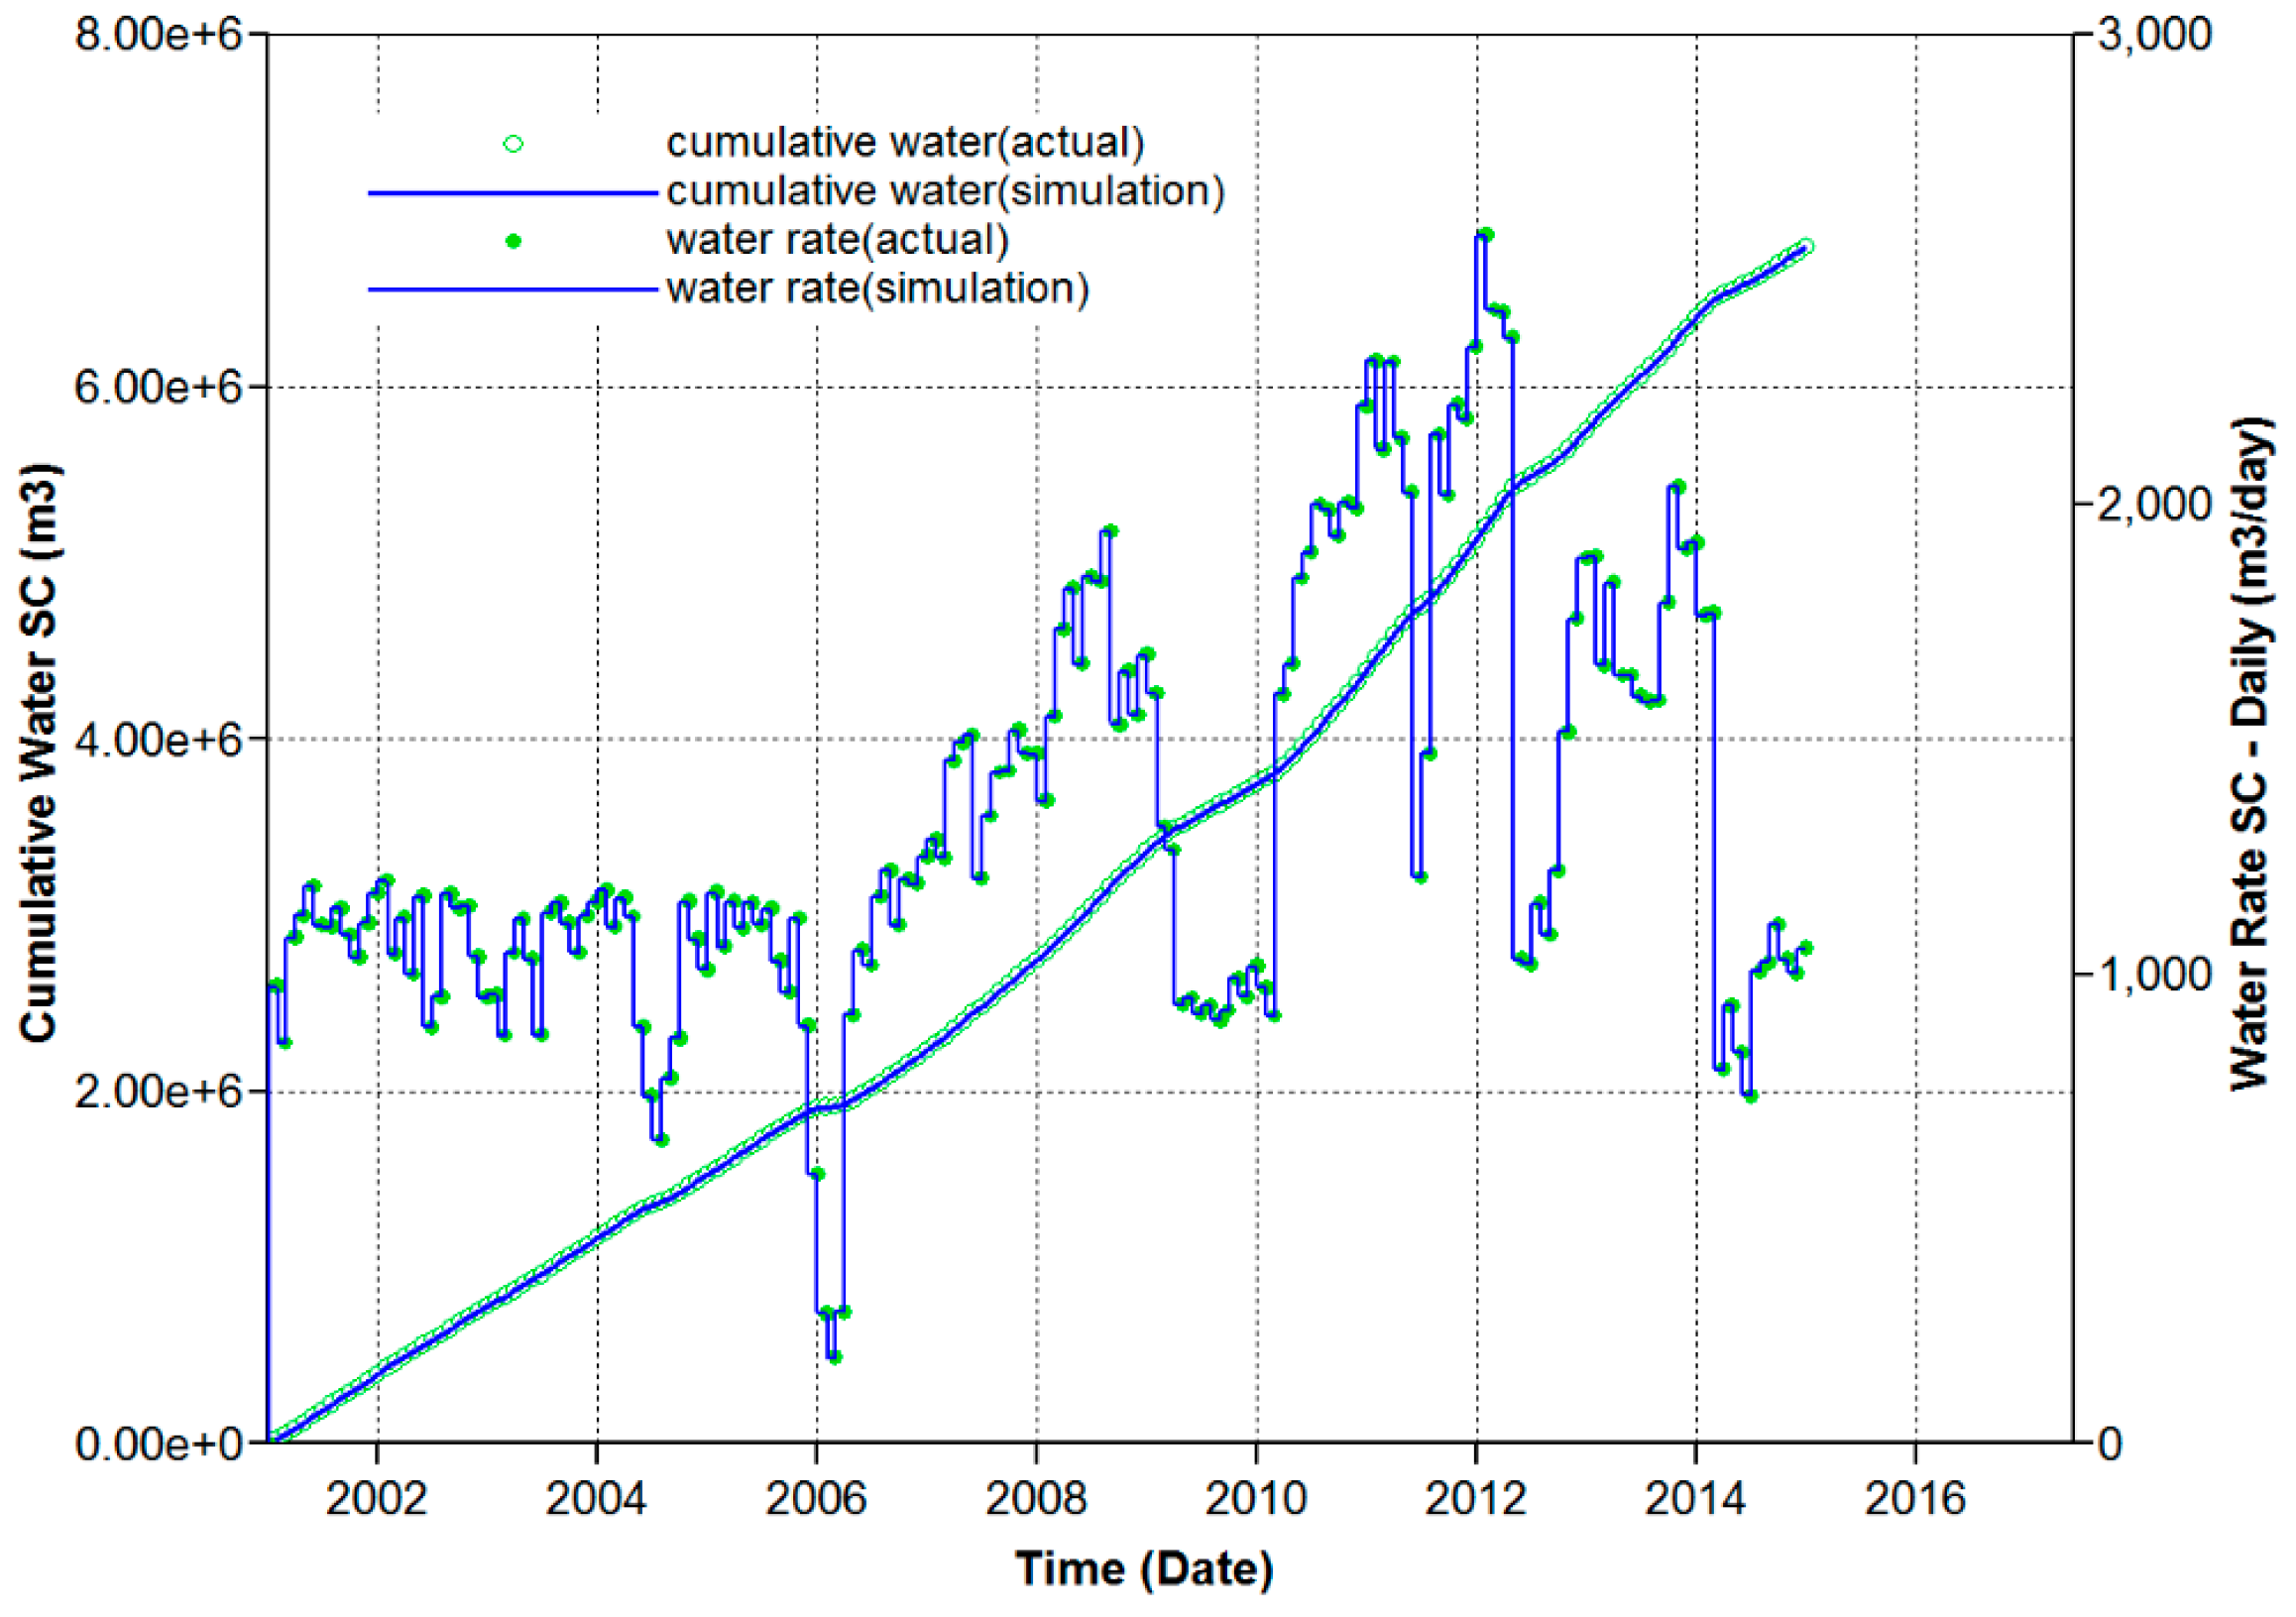
3. Dynamic Fitting of the Reservoir Water Flooding Production

In the fitting process, the fixed liquid quantity was used for the production well, and the monthly averaged liquid quantity, from January 2001 to December 2014 was used for the production data fitting. The actual production fluid data was input into the model for calculations.

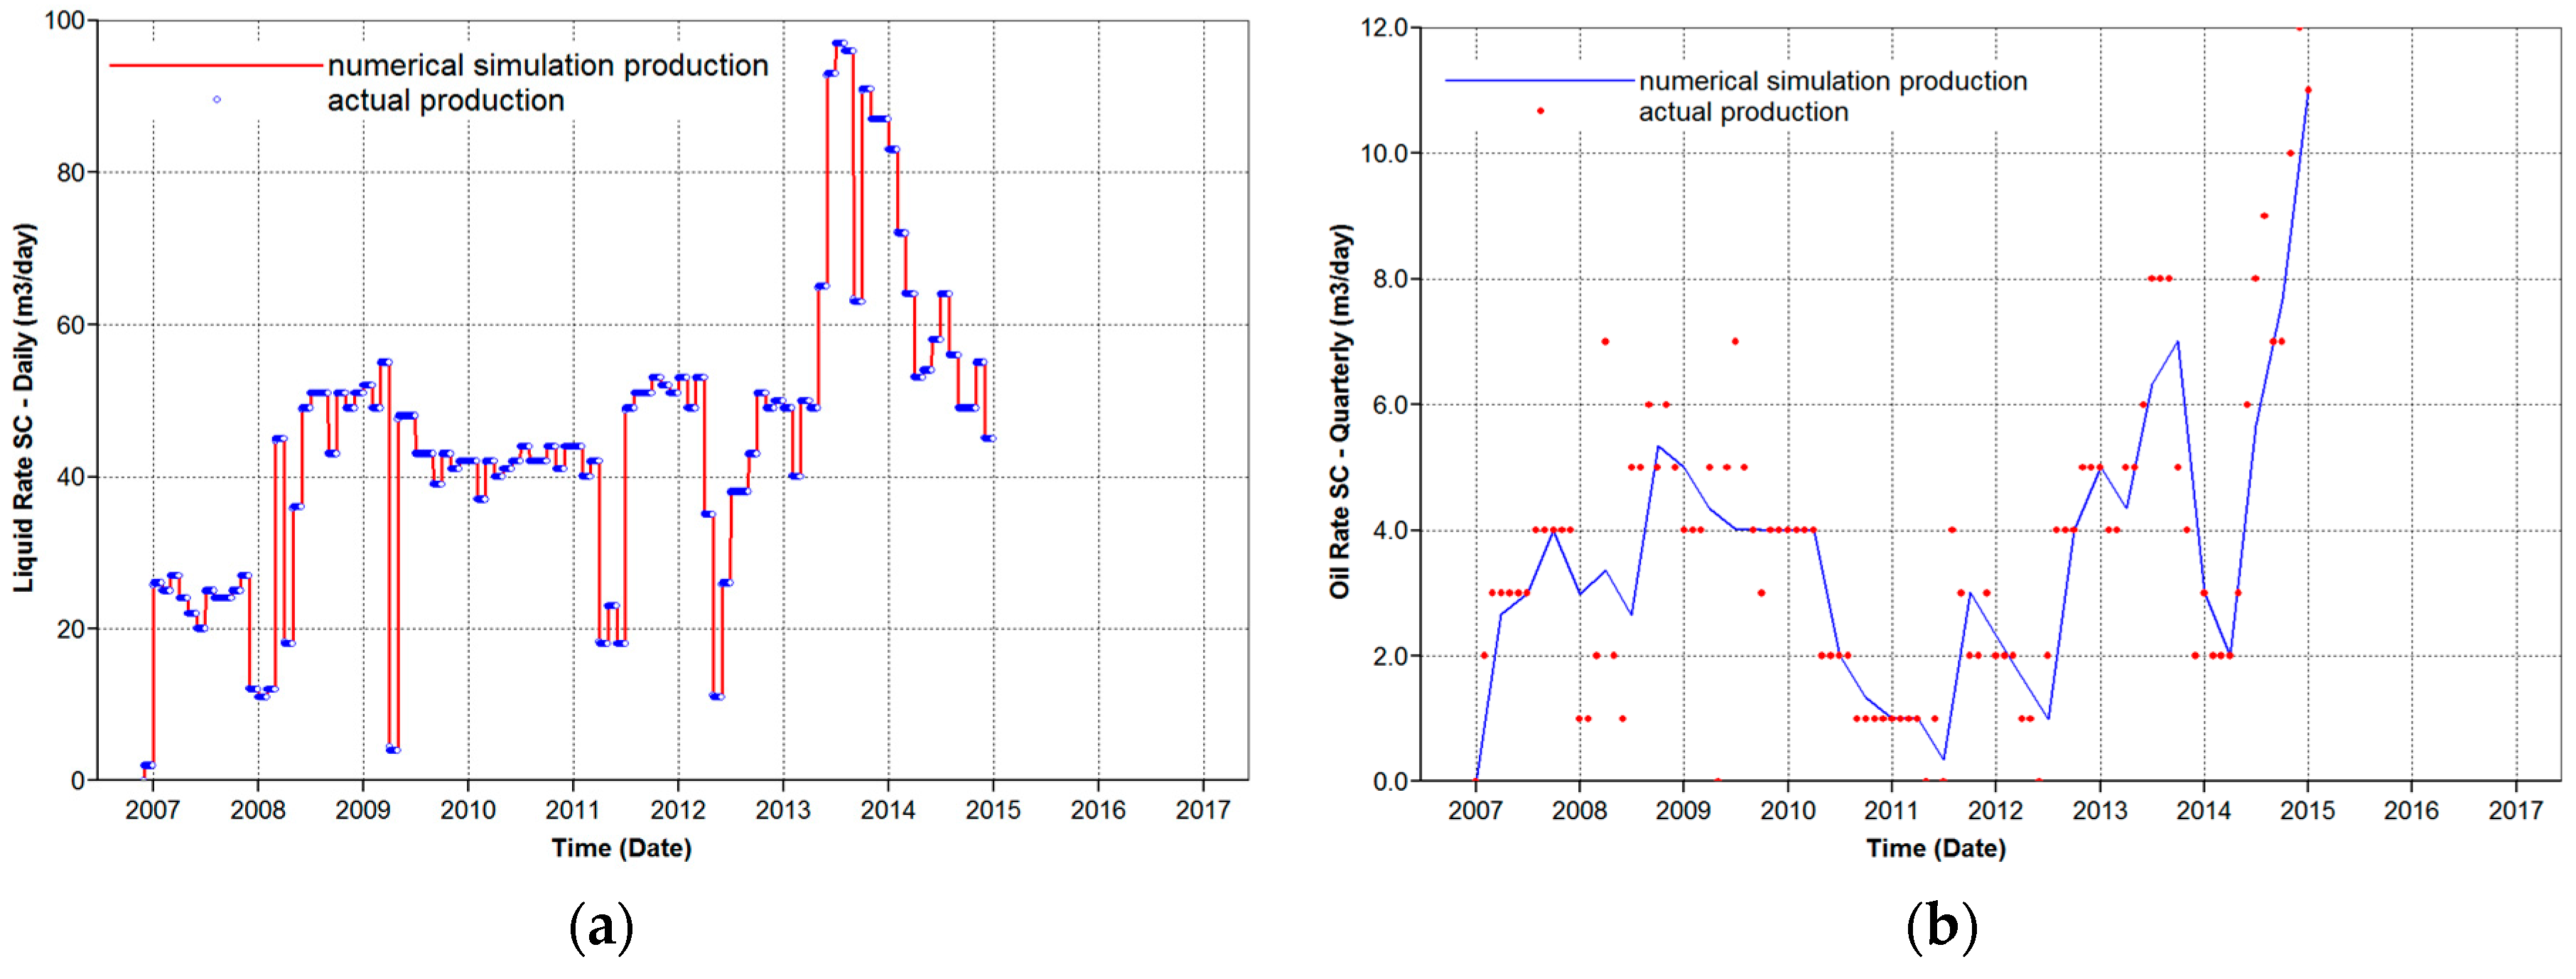
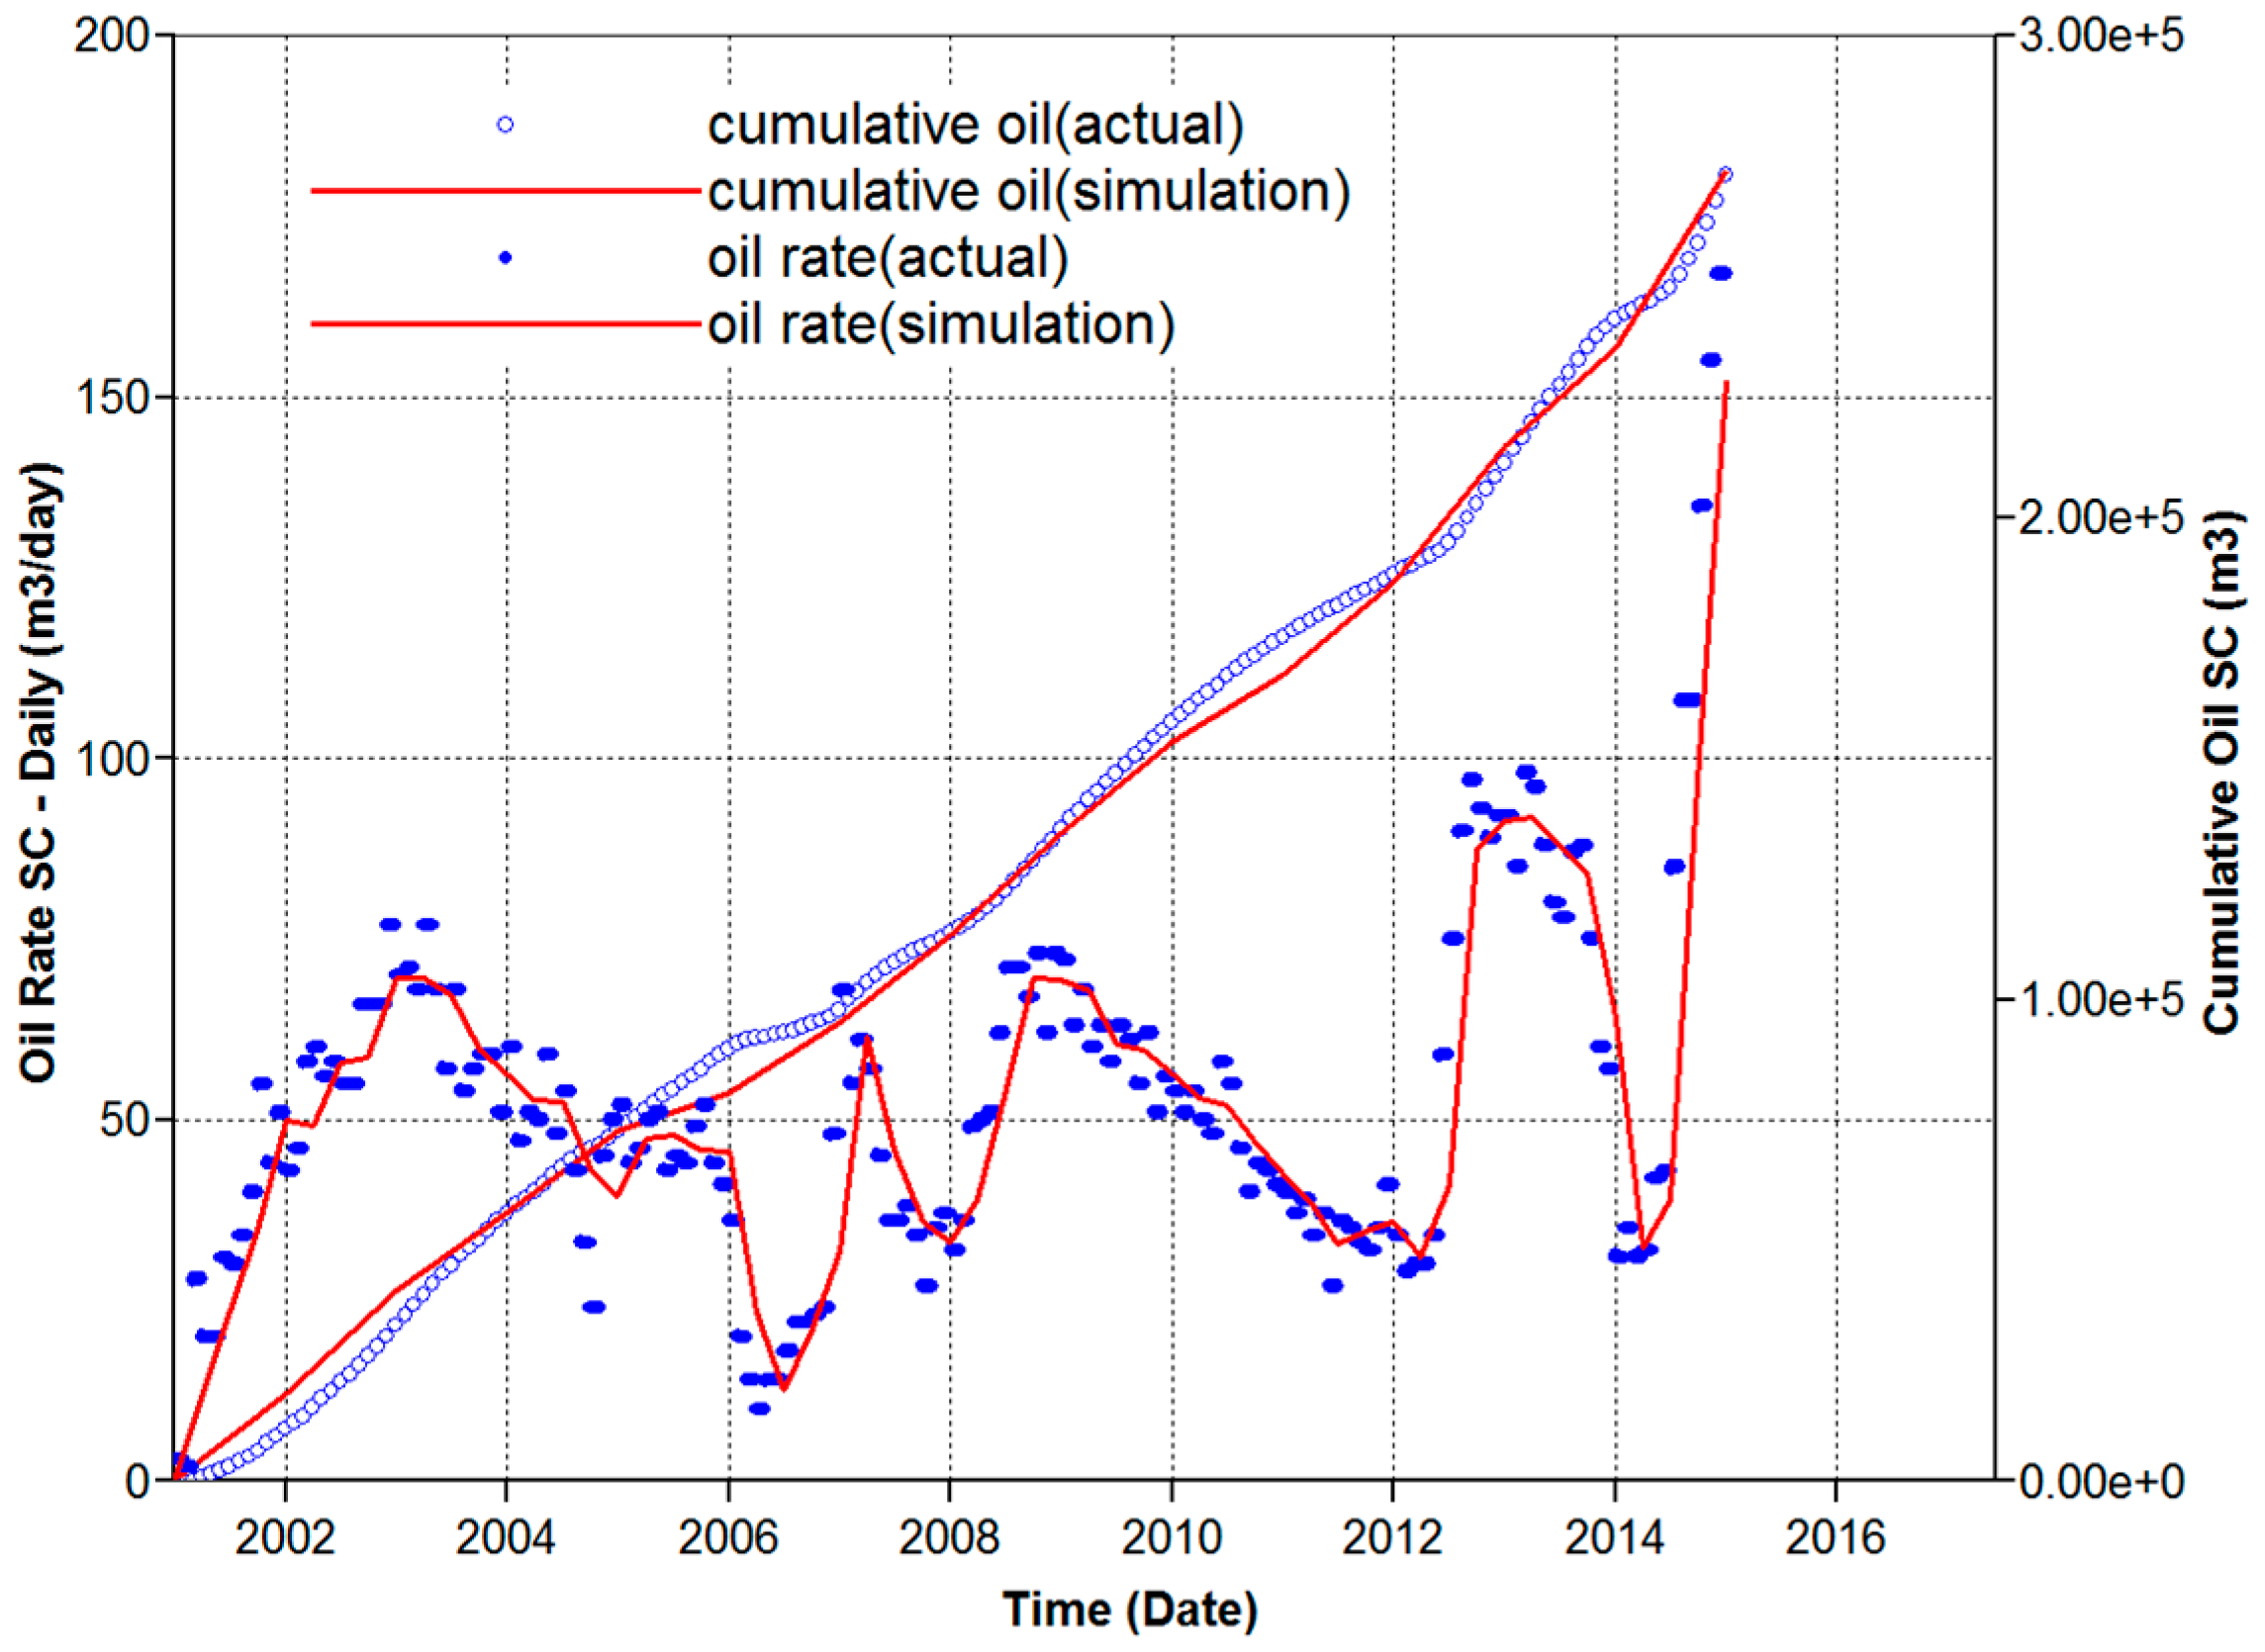
3.1. Dynamic History-Matching of Production in the Whole Block

The production dynamics of the whole block are shown in Table 1. The relative error of cumulative oil production is 1.69%. The relative error of cumulative liquid production and water injection is 0.5%. The fitting curve of oil production and water injection in the experimental area is shown in Figure 3 and Figure 4.

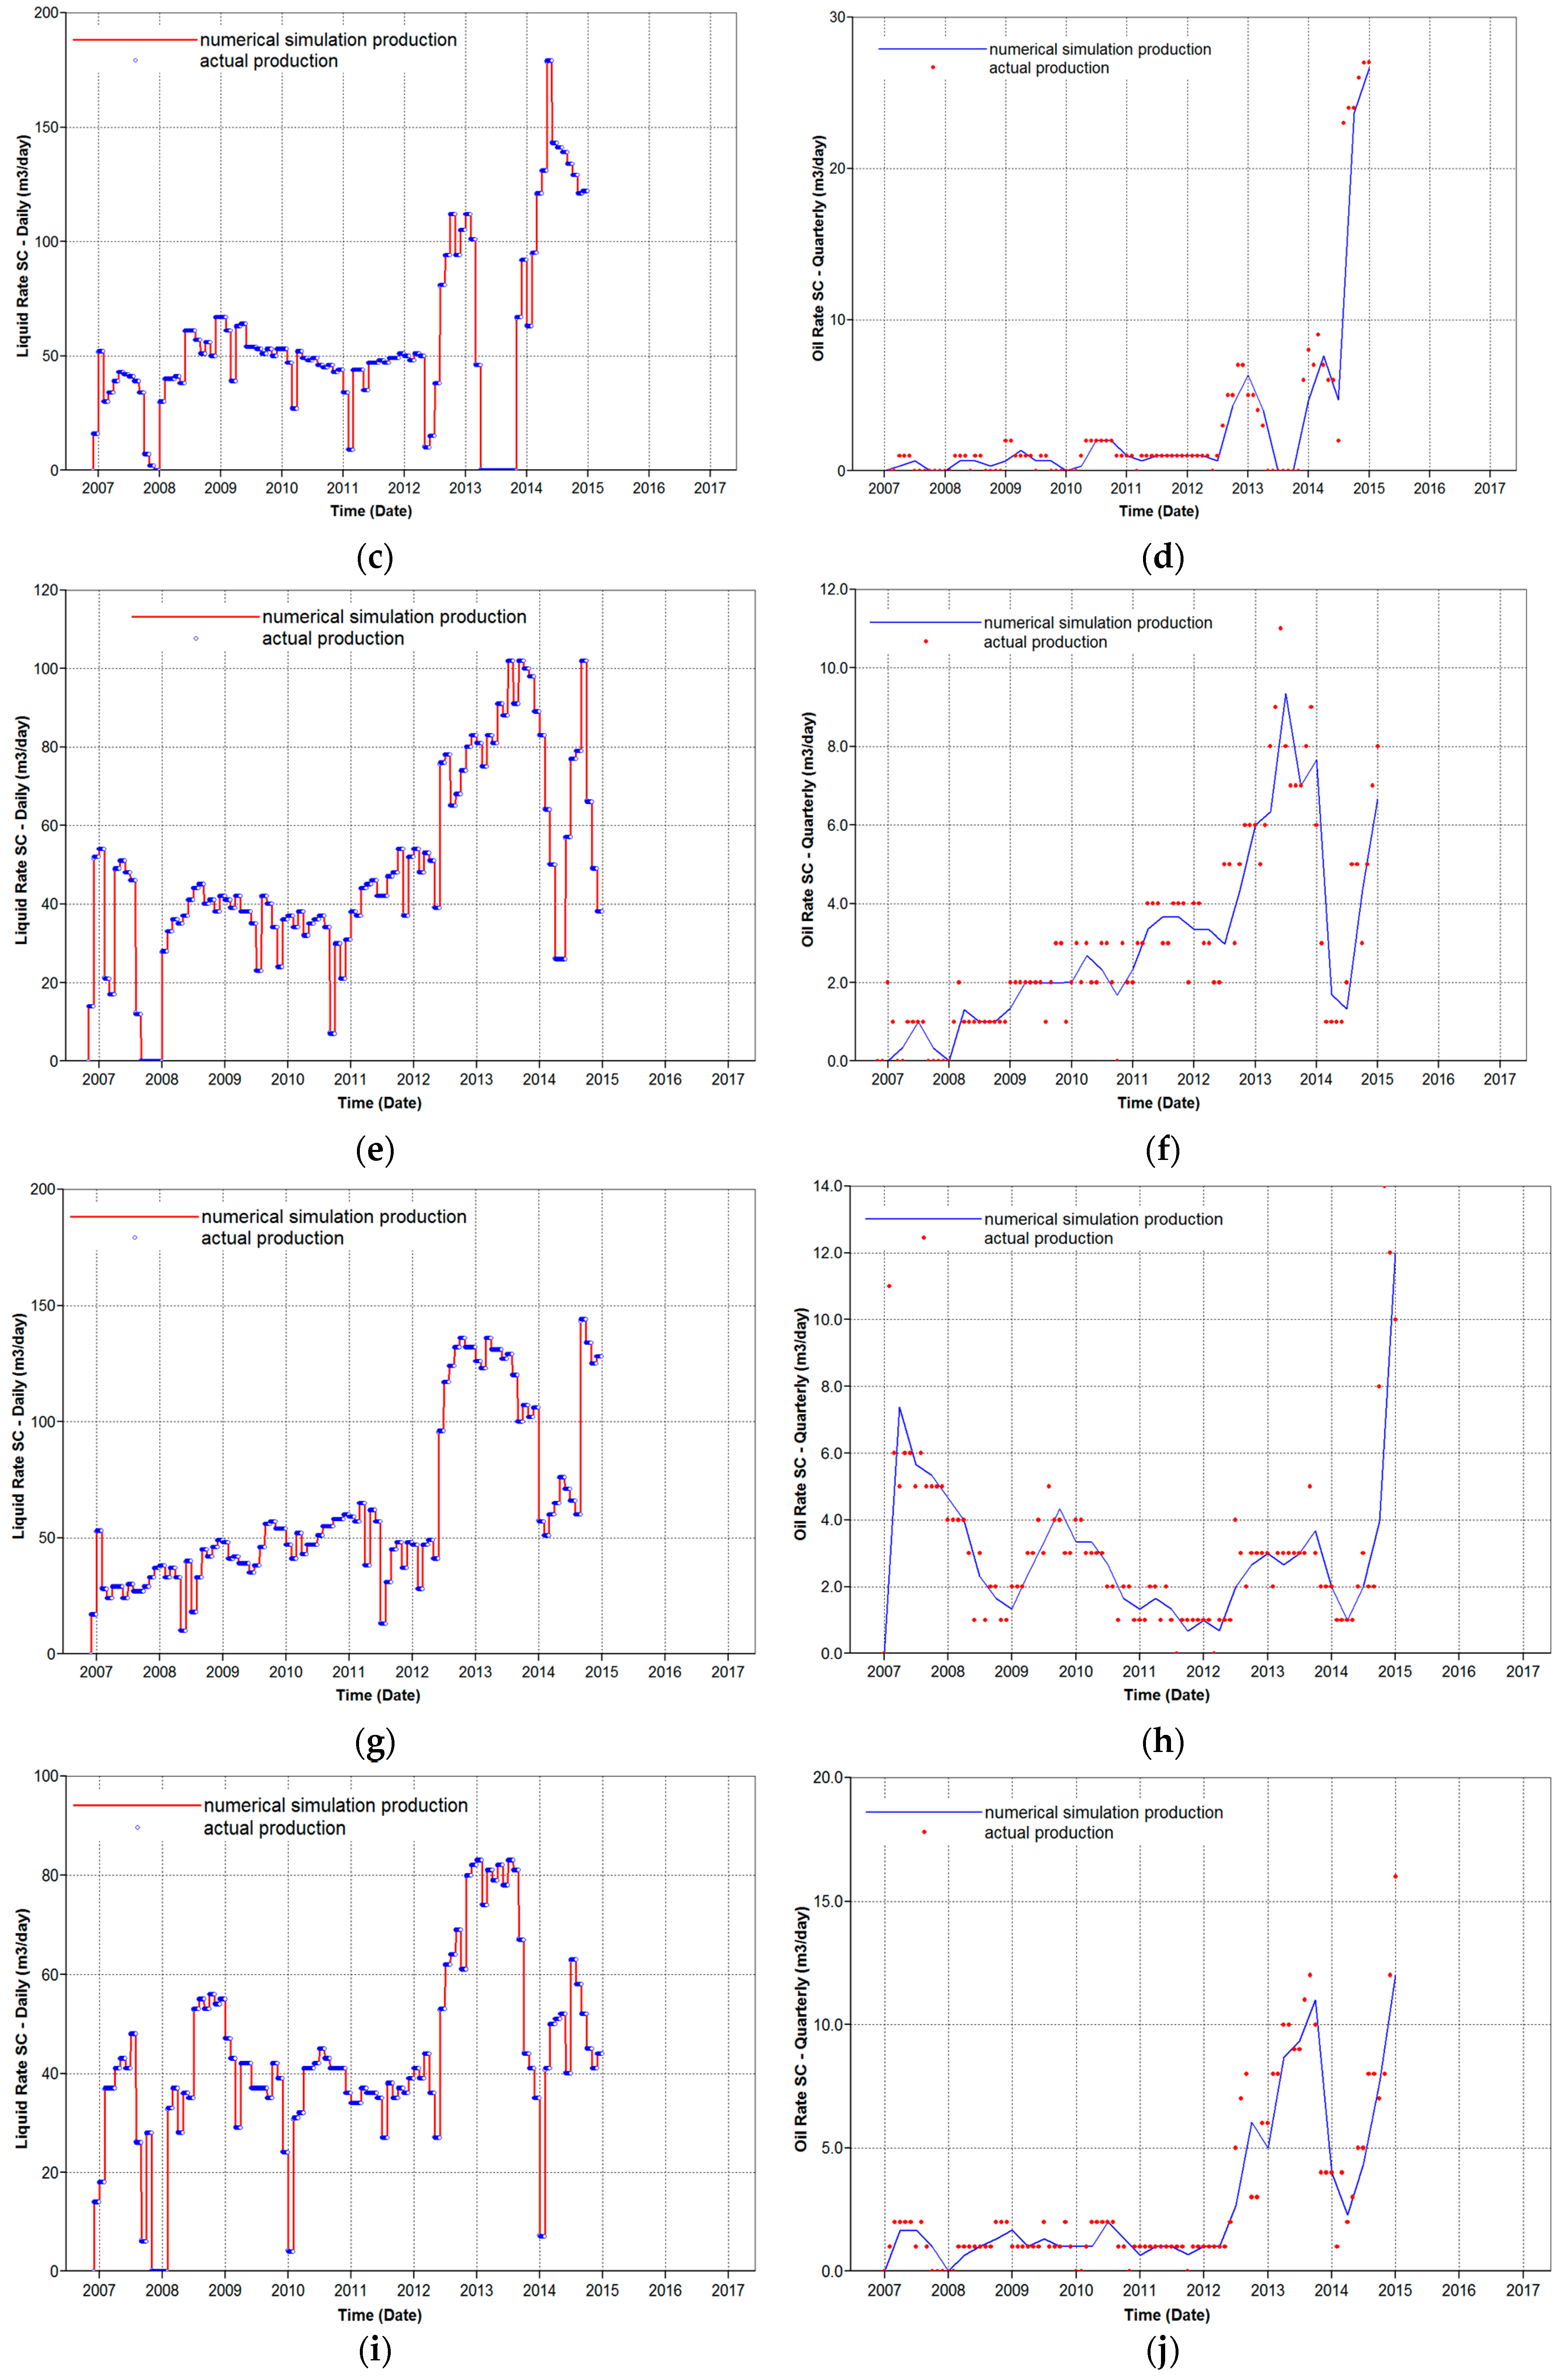
3.2. Dynamic History-Matching of Production in a Single Well

On the basis of fitting geological reserves, the history-matching of single well water flooding was conducted, with oil production and water content from a fixed single well liquid production. The fitting time was from January 2011 to December 2014. First, the relative permeability curve and permeability and conductivity distribution were adjusted in order to keep the entire block of oil and water production trend consistent. Then, the local adjustment of permeability and conductivity in the near well zone of each well was conducted to keep the fitting of the output profile consistent with the actual production history. At the end of the history-matching, the water injection and production wells were well fitted with the fitting rate more than 90% and the average error less than 10%. This shows that the geological model has good agreement with the real reservoir. Therefore, we can use this geological model to simulate the optimization of the surfactant concentration. The history-matching curves of monthly liquid and oil production are shown in Figure 5.

4. Numerical Simulation Results

Based on previous experience [11,12,13], when only the main slug was injected, the oil displacement effect was poor. However, with the pre-polymer slug, vice slug, and rear-polymer slug, the recovery efficiency was improved greatly. Therefore, in this study, the pre-polymer slug, main slug, vice slug, and rear-polymer slug were injected sequentially.

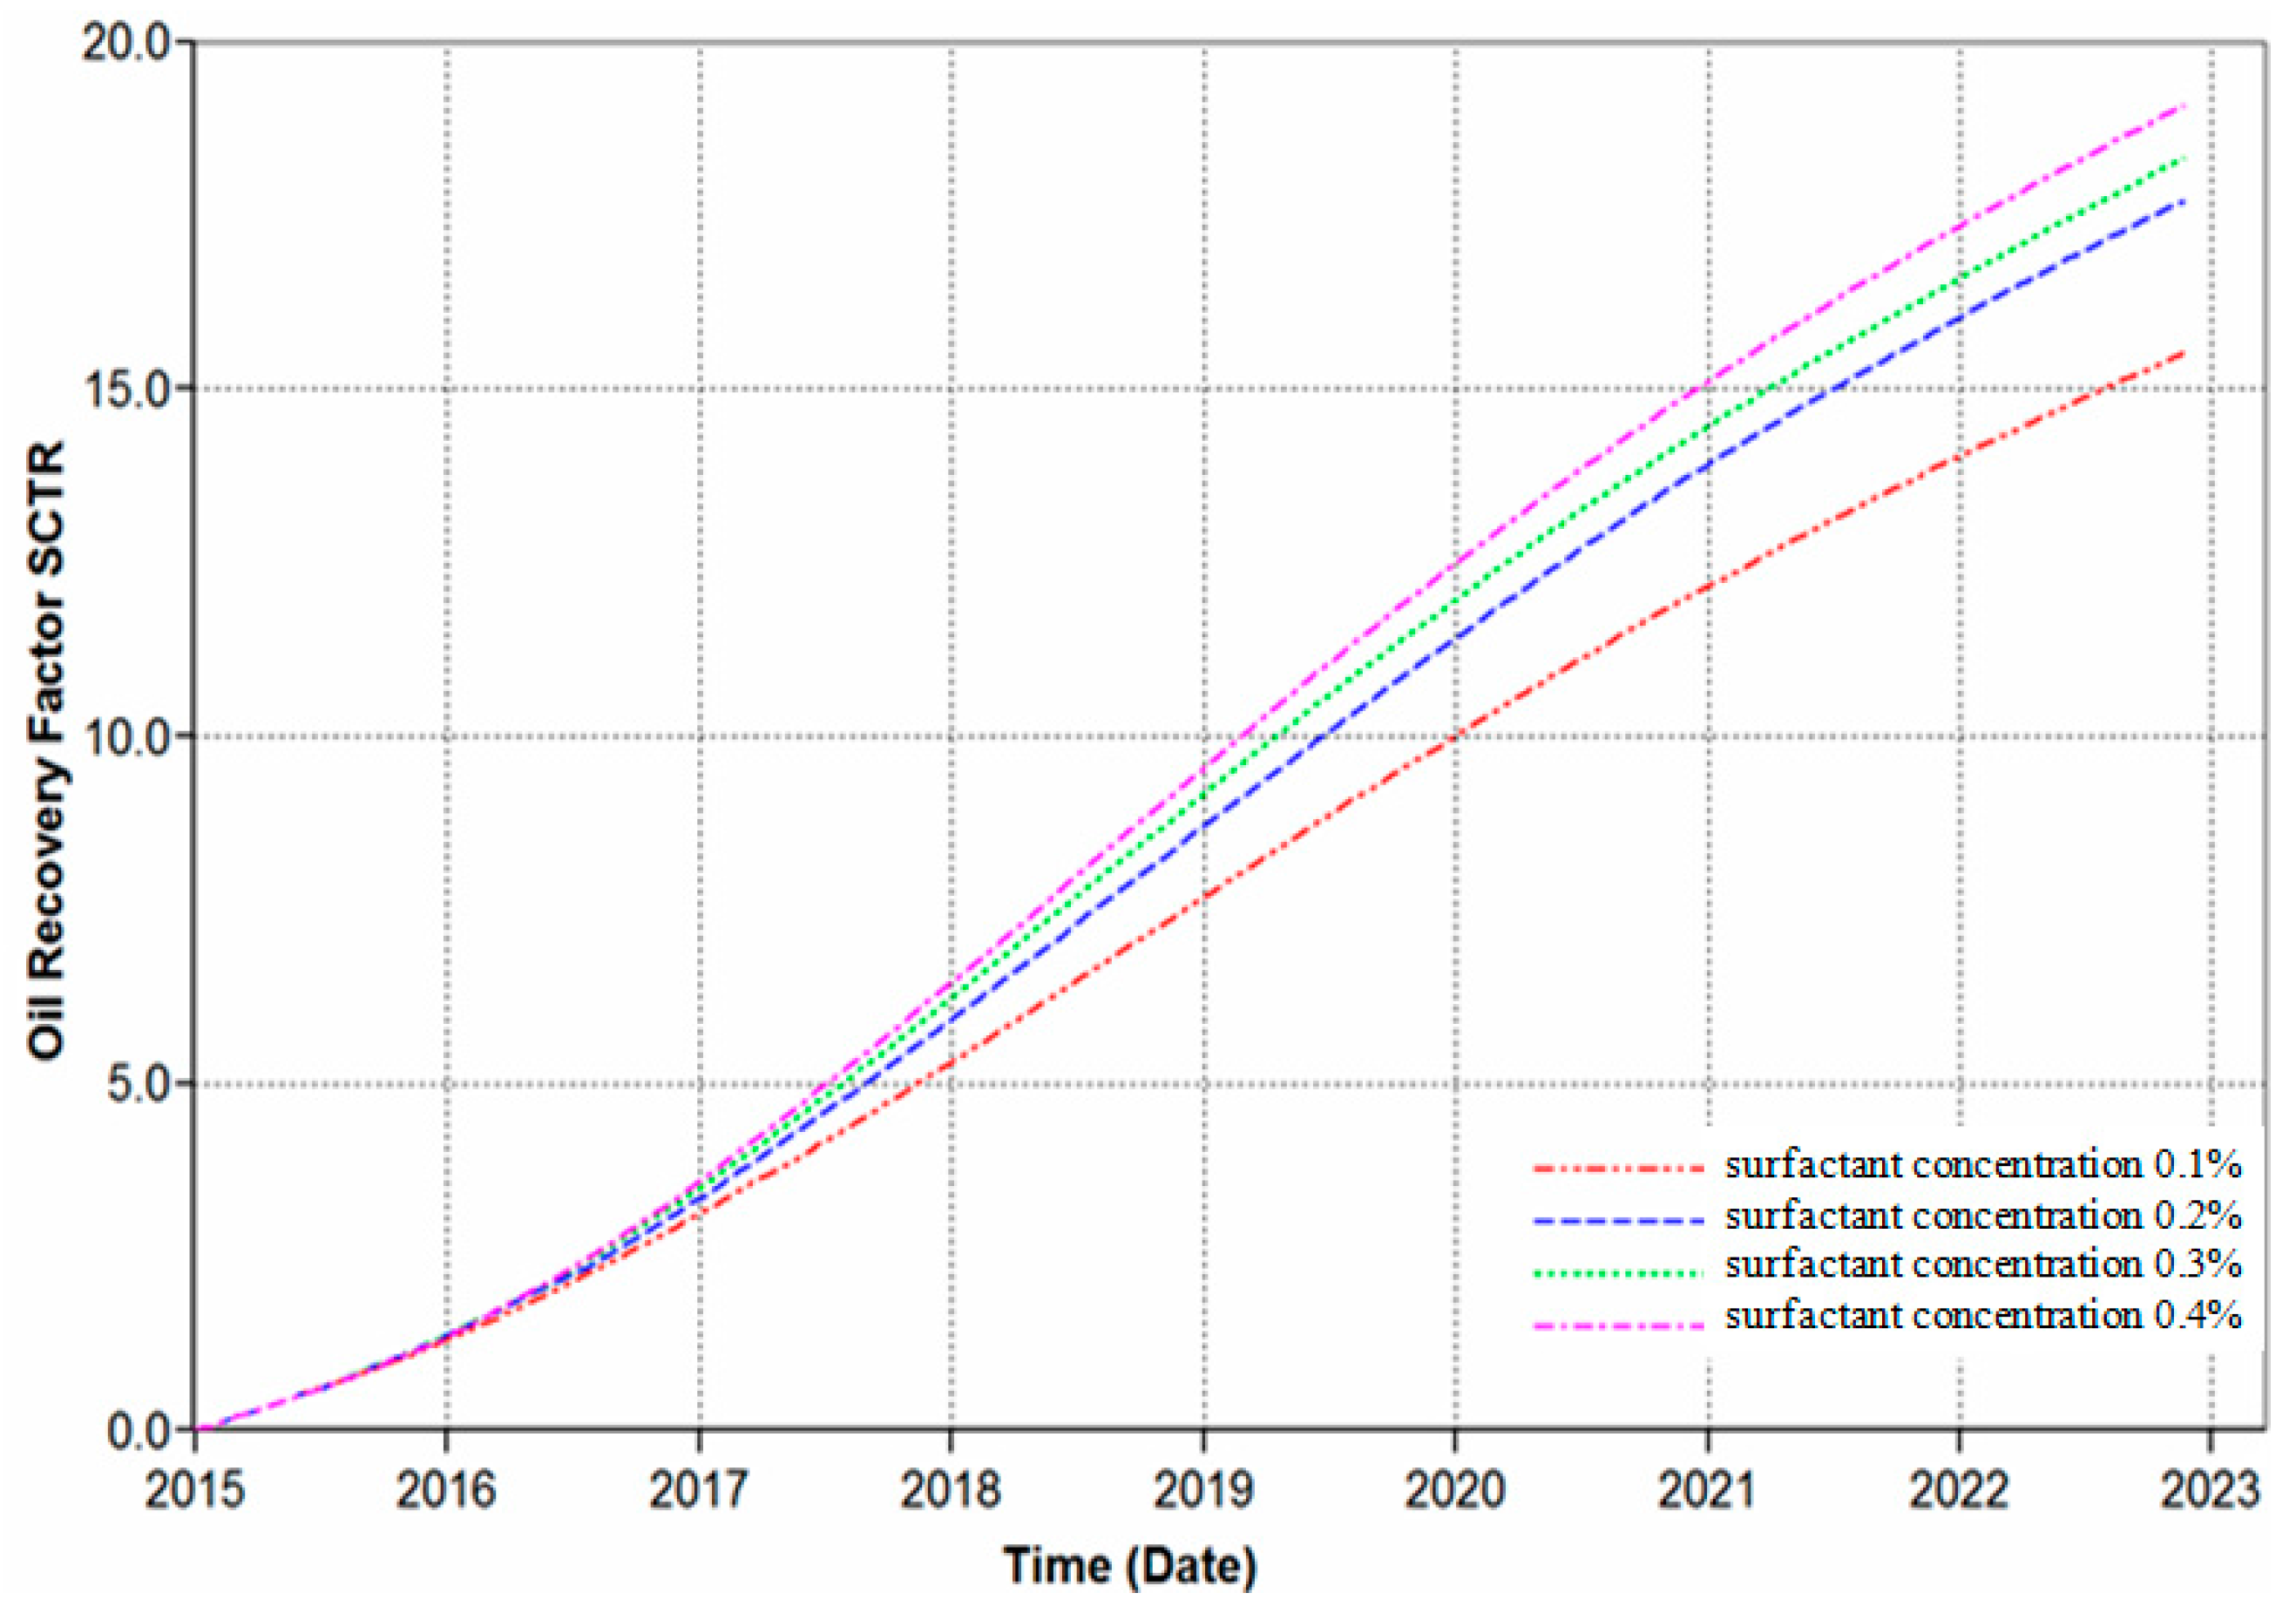
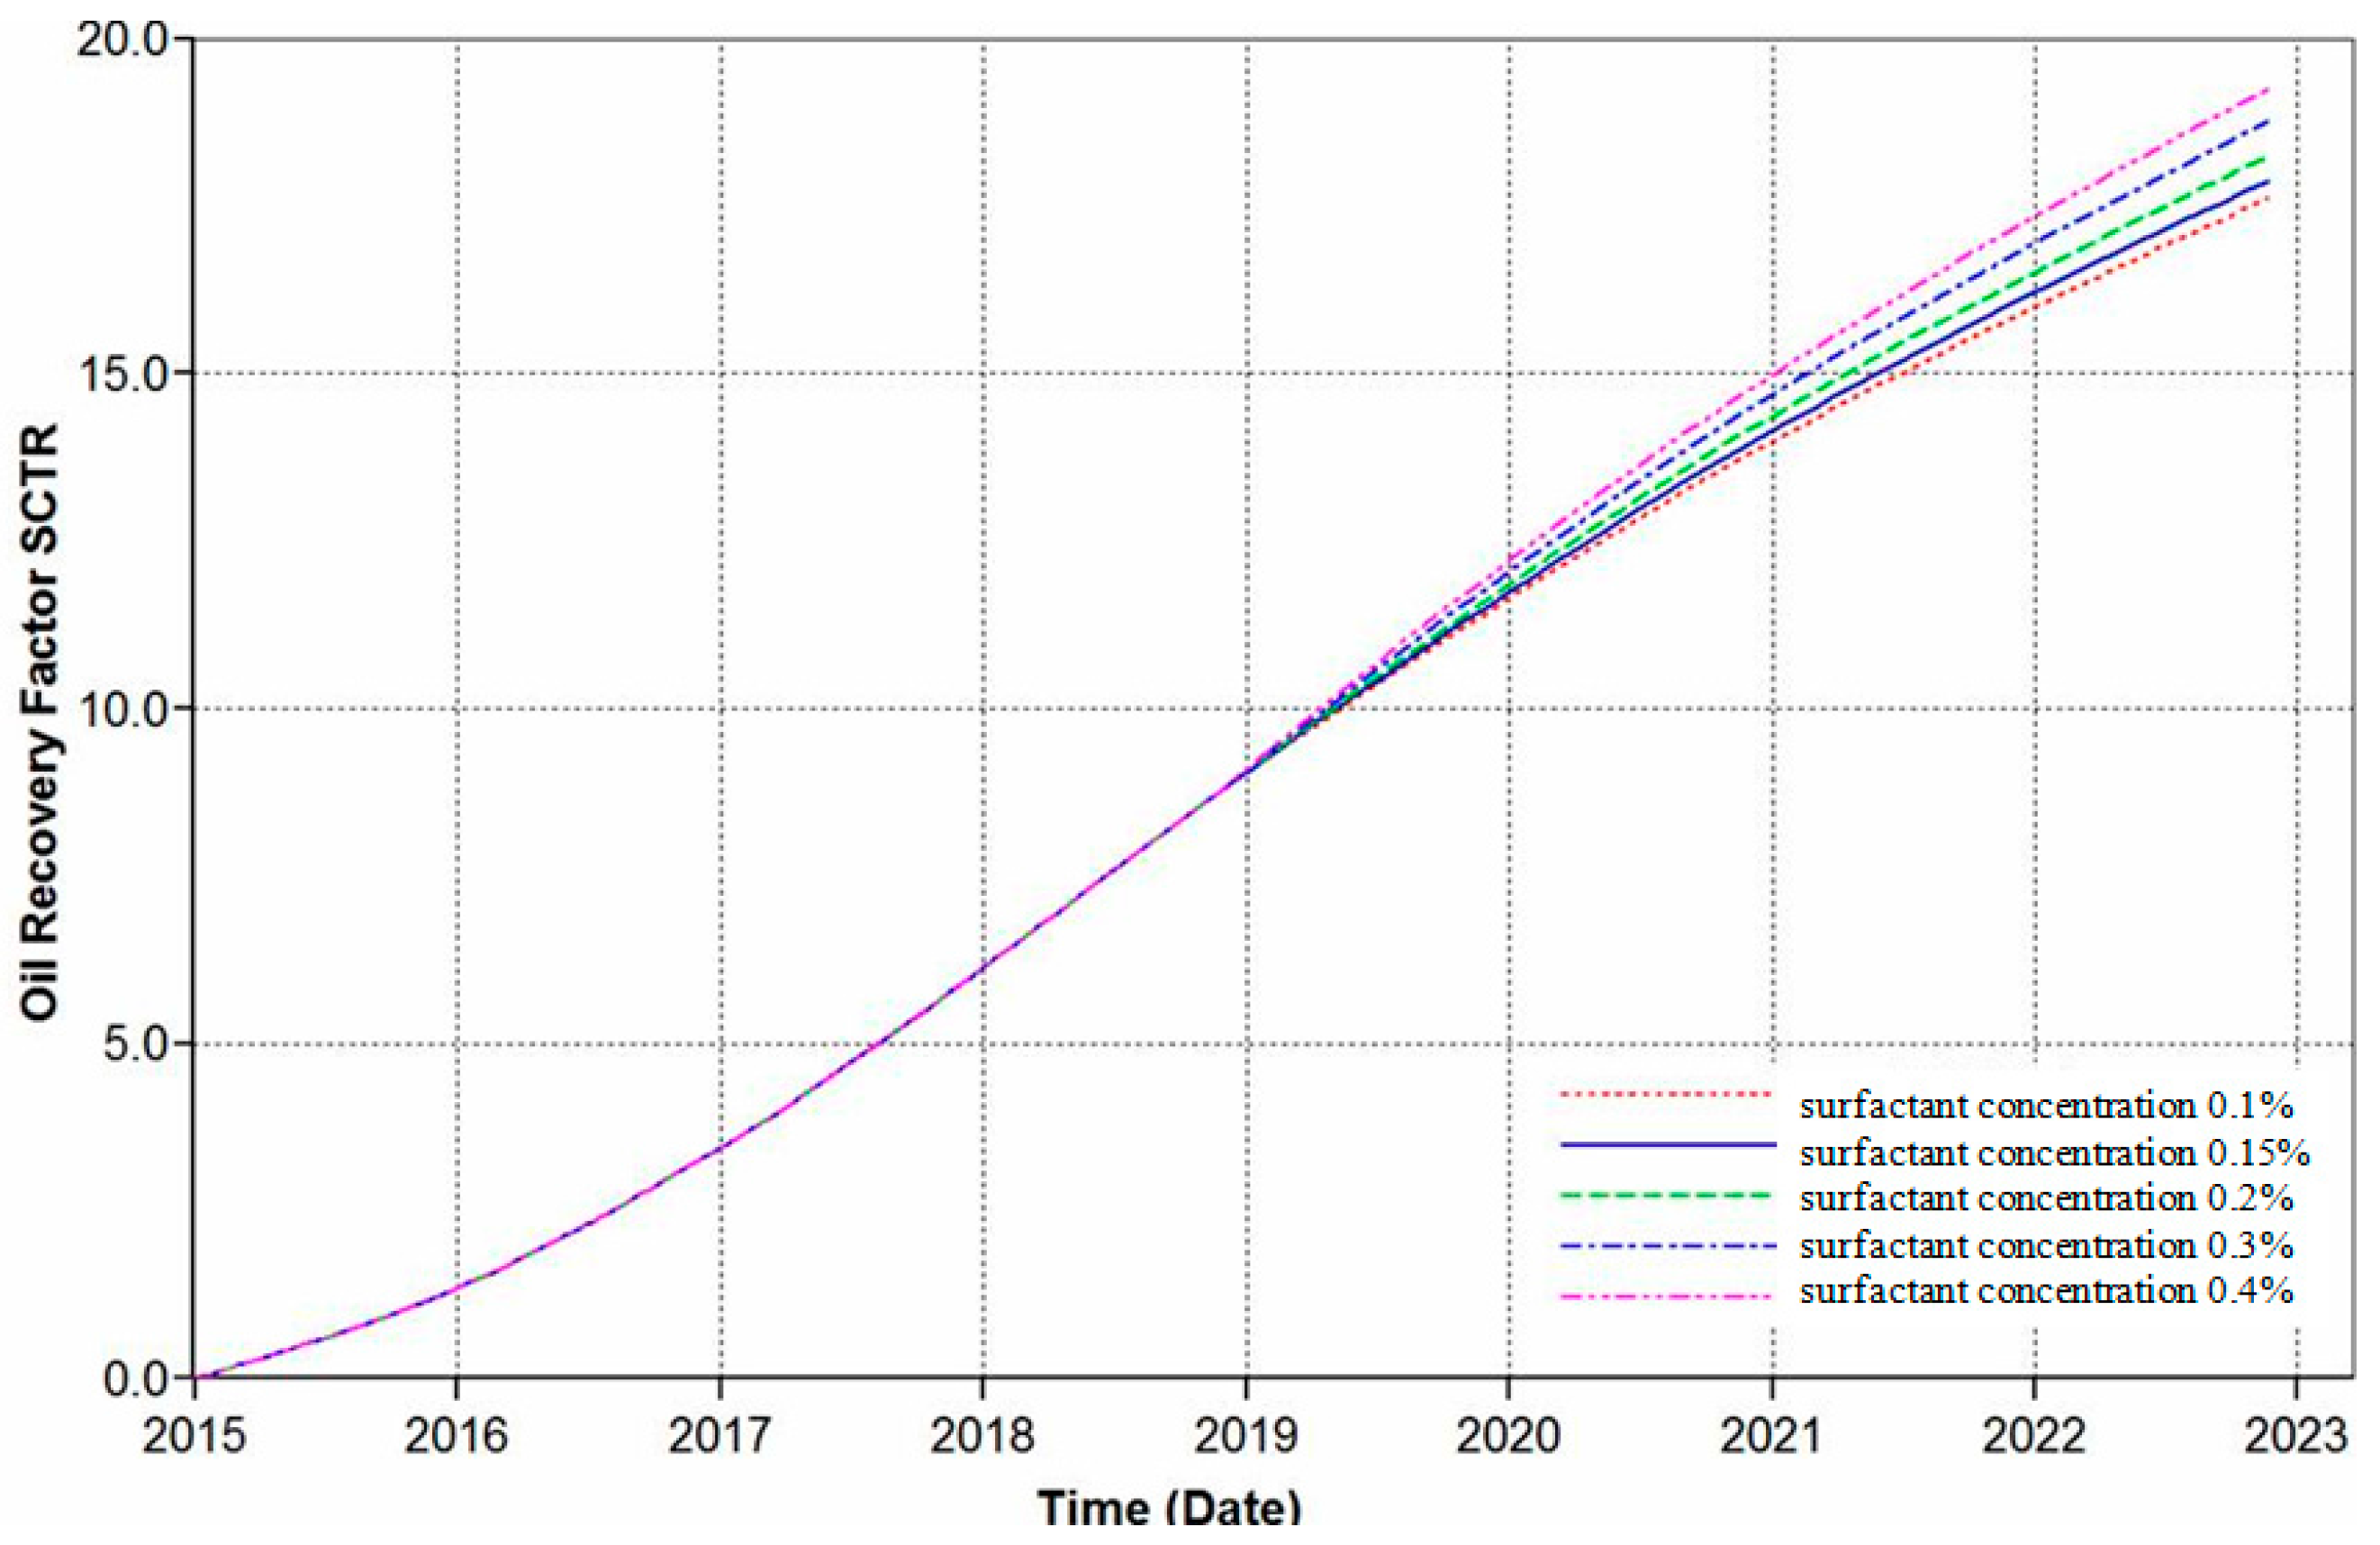
4.1. Effect of Surfactant Concentration in the Main Slug on the Oil Displacement Results

The surfactant used in the optimization is petroleum sulfonate, and the reason why we used it in this simulation is that the surfactant used in actual production is petroleum sulfonate. The surfactant concentration used in the Daqing oilfield is between 0.05% and 0.4%, so our task is to optimize the concentration in this range.
The numerical simulation schemes are shown in Table 2. We compared the results of the experimental schemes and chose the optimal surfactant concentration.
Numerical simulation results are shown in Figure 6 and Table 3. Figure 6 shows that the recovery factor increases with the surfactant concentration in the main slug and the length of exploitation. Table 3 shows that the value of the recovery factor increases to its highest value when the surfactant concentration is 0.2%. After that point, the value of the recovery factor gradually declines. However, when the ASP flooding solution flows through the actual formation, the surfactant will be absorbed, resulting in damage for the compound system. Therefore, the surfactant concentration in the main slug should be slightly higher than the optimum value, to ensure the stability of the compound system. Considering that excessive surfactant concentration is not helpful for the stability of the emulsion, the surfactant concentration in the main slug should be 0.3%.

4.2. Effect of Surfactant Concentration in the Vice Slug on the Oil Displacement Results

The numerical simulation was carried out with 0.04 PV pre-polymer slug (1600 mg/L polymer); 0.35 PV main slug (0.3% surfactant + 1.2% surfactant + 1900 mg/L polymer); 0.15 PV vice slug (surfactant + 1.0% alkali + 1800 mg/L polymer); and 0.25 PV rear-polymer slug (1600 mg/L polymer). The surfactant concentrations in the vice slug were 0.1%, 0.15%, 0.2%, 0.3%, and 0.4%, respectively. The results of the experimental schemes were compared and the optimal surfactant concentration was chosen based on the results.
The numerical simulation results are shown in Figure 7 and Table 4. Figure 7 shows that the recovery factor also increases with the increase of the surfactant concentration in the vice slug. Table 4 shows that the recovery factor increases to its highest value when the surfactant concentration is 0.15%. After that point, the value of the recovery factor gradually declined. When the vice slug flowed through the formation, part of the surfactant in the main slug was adsorbed, which prevented the surfactant in the vice slug from being consumed. Considering the influence of economic factors, the surfactant concentration in the vice slug should be 0.15%. By comparing the effect of the surfactant concentration in the main slug and vice slug, we concluded that the increased value of the recovery factor is bigger when we increased the mass fraction of the surfactant in the main slug rather than in the vice slug. This shows that the amount of surfactant in the main slug plays a more important role in displacing oil from the formation. Therefore, the surfactant concentration in the main slug should be higher than the optimum value.

5. Oil displacement Experiment

5.1. Experimental Materials and Equipment

(1)
Core: artificial epoxy resin cementation heterogeneous cores, 4.5 cm × 4.5 cm × 30 cm;
(2)
Polymer: the polymer is partially hydrolyzed polyacrylamide, with an average relative molecular weight of 16–19 million and 25 million, and a solid content of 88%, from Daqing Refining and Chemical Company in China. The alkali is Na2CO3 of analytical grade; the surfactant is alkyl benzene sulfonate with a solid content of 50%, from Daqing Refining and Chemical Company in China;
(3)
Experiment water: the injected water was from injection allocation station II of factory one from the Daqing oilfield. The injection and formation water contains sodium bicarbonate and includes high concentrations of Na+ and K+ and relatively low concentrations of Mg2+ and SO42− ions. The average total salinity of the injection water and formation water were 4012.7 and 8025.4, respectively. The composition of the injected water and formation water are shown in Table 5;
(4)
Experimental oil: the synthetic oil used in the displacement experiment was compounded with the crude oil sampled (degassed and dehydrated) from Daqing Oilfield and the aviation kerosene. The viscosity of the synthetic oil was 7.0 mPa·s at 45 °C.

5.2. Experimental Procedure

(1)
The pore volume was measured by vacuum and then saturating it with underground water. All steps were conducted at room temperature;
(2)
At 45 °C, the core was saturated with 1.2 PV (Pore Volume) oil, and was then stopped when the oil saturation was larger than 70%;
(3)
At 45 °C, the core was flooded with water until the water cut was 98%. The pressure change, liquid producing capacity, water rate, and oil rate in each period were recorded, and then the recovery factor was calculated;
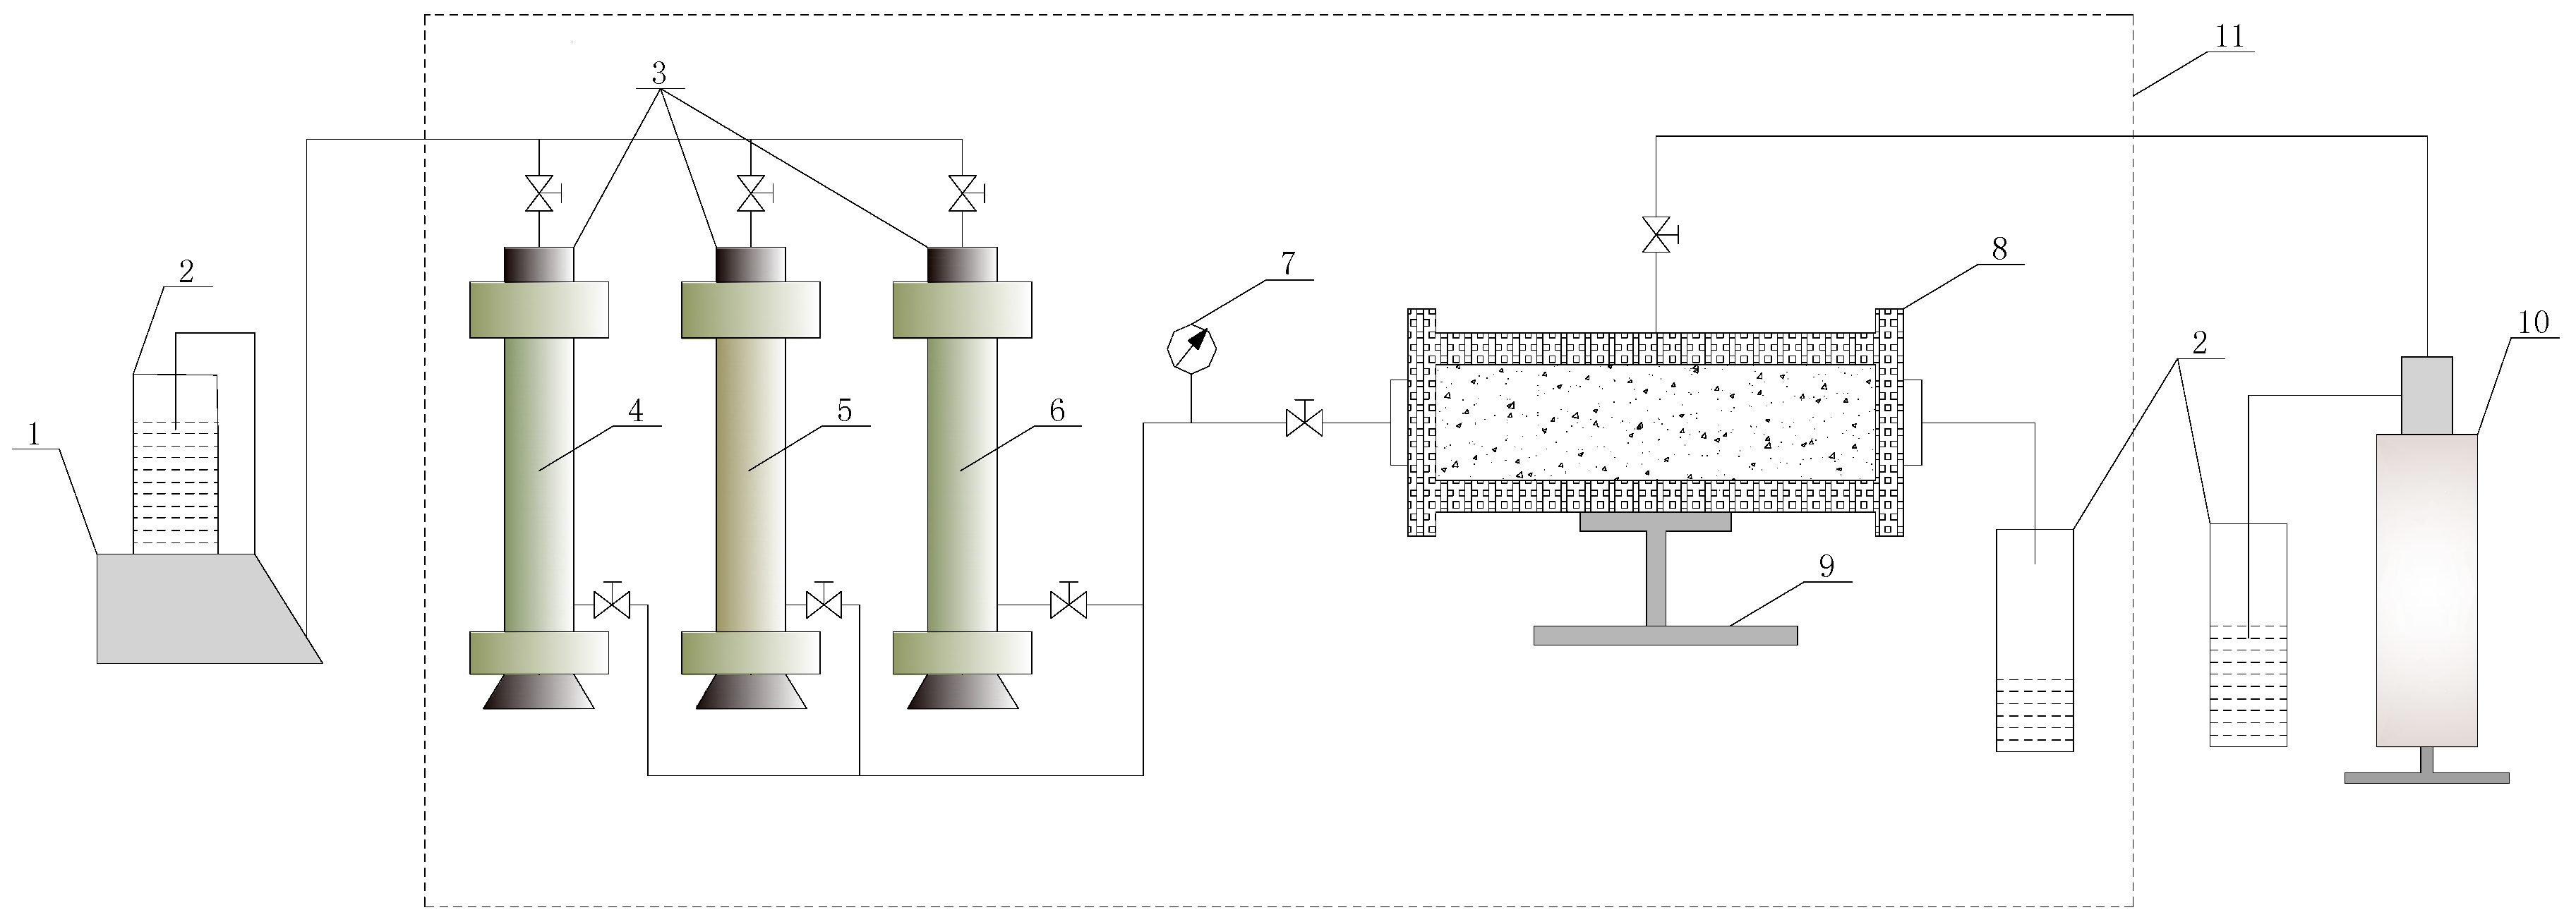
(4)
At 45 °C, the chemical flooding was conducted. Each slug was injected according to the experimental scheme. The pressure change value, liquid producing capacity, water rate, and oil rate in each period were recorded, and then the recovery factor was calculated. The experimental process diagram is shown in Figure 8 [14].

5.3. Experimental Results

(1) The oil displacement experiments were conducted with three different surfactant concentrations in the main slug: 0.25%, 0.3%, and 0.35%, respectively. All other conditions were the same. The concrete schemes are shown in Table 6.
Table 6 and Table 7 show that for the same pre-polymer slug (0.04 PV of 1600 mg/L polymer with a molecular weight of 25 million), main slug (0.35 PV of alkali (1.2%) + surfactant (0.25%) + polymer (1900 mg/L with molecular weight of 16–19 million)), vice slug (0.15 PV alkali (1%) + surfactant (0.15%) + polymer (1800 mg/L with molecular weight of 16–19 million)), and post-polymer slug (0.2 PV polymer (1600 mg/L with molecular weight of 16–19 million)), the concentration of surfactant in the main slug varied from 0.25% to 0.35%. When the surfactant concentration in the main slug was 0.25%, the chemical flooding recovery factor was 80.07% and the oil recovery was improved by 23.57% compared to the water flooding. When the surfactant concentration in the main slug was 0.3%, the chemical flooding recovery factor was 80.97%, which improved by 24.17% compared to water flooding. The oil recovery factor increased by 0.6% compared to that for the 0.25% surfactant concentration in the main slug. When the surfactant concentration in the main slug was 0.35%, the chemical flooding recovery factor was 81.56%, which improved by 24.56% compared to water flooding. The oil recovery factor increased by 0.39% compared to the surfactant concentration of 0.3% and 0.99% compared to the surfactant concentration of 0.25% in the main slug. It is shown that the recovery factor increased significantly compared to water flooding. It is also shown that the amplification oil recovery factor for the surfactant concentration that increased from 0.25% to 0.3% is bigger than those from 0.3% to 0.35%. It is concluded that the oil recovery factor increased with the surfactant concentration in the main slug. However, the amplification of the oil recovery factor decreased with the surfactant concentration, which was consistent with the results of the numerical simulation. According to the above analysis, the optimal concentration of the surfactant in the vice slug is 0.3%.
(2) The oil displacement experiments were conducted with surfactant concentrations of 0.05%, 0.10%, and 0.15% in the vice slug, respectively. The concrete schemes are shown in Table 8.
Table 8 and Table 9 show that under the same pre-polymer slug (0.04 PV polymer, 1600 mg/L and molecular weight of 25 million); the main slug (0.35 PV alkali-1.2% + surfactant-0.3% + polymer with a concentration of 1900 mg/L and molecular weight of 16–19 million); the vice slug (0.15 PV alkali-1% + surfactant-0.05% + polymer, 1800 mg/L, and molecular weight of 16–19 million) and the post-polymer slug (0.2 PV polymer, 1600 mg/L, and molecular weight of 16–19 million), the surfactant concentration in the vice slug varied from 0.05% to 0.15%. When the concentration of the surfactant in the vice slug was 0.05%, the chemical flooding recovery factor was 80.23% and the oil recovery was improved by 23.03% compared to water flooding. When the surfactant concentration in the vice slug was 0.1%, the chemical flooding recovery factor was 80.10% and the oil recovery was improved by 23.60% compared to water flooding, which was increased by 0.57% compared to that for the surfactant concentration of 0.05% in the vice slug. When the surfactant concentration in the vice slug was 0.15, the chemical flooding recovery factor was 80.97% which was improved by 24.17% compared to water flooding. The oil recovery was increased by 0.75% compared to that of the surfactant concentration of 0.1% and by 1.32% compared to that of the surfactant concentration of 0.05% in the vice slug. When the surfactant concentration in the vice slug was 0.2%, the chemical flooding recovery factor was 81.28%, which was improved by 24.88% compared to water flooding. The oil recovery was increased by 0.51% compared to that of the surfactant concentration of 0.15% and by 1.28% compared to that of the surfactant concentration of 0.1% in the vice slug, and by 1.85% compared to that of the surfactant concentration of 0.05% in the vice slug. It is concluded that the recovery factor increased significantly compared to those of water flooding. It demonstrates that the amplification oil recovery factor for the surfactant concentration that increases from 0.1% to 0.15% is bigger than that from 0.05% to 0.1%. It also shows that the oil recovery factor increases with the surfactant concentration in the vice slug. The amplification of the oil recovery factor also increases with the surfactant concentration, which is consistent with the results of the numerical simulation. Therefore, the optimal concentration of the surfactant in the vice slug is 0.15%.

6. Conclusions

(1)
According to the numerical simulation, the oil recovery increases gradually with the surfactant concentration in the main slug. The optimal concentration of the surfactant in main slug is 0.3%;
(2)
According to the numerical simulation, the oil recovery factor increases gradually with the surfactant concentration in the vice slug. The optimal concentration of surfactant in the vice slug is 0.15%;
(3)
Compared to increasing the mass fraction of surfactant in the vice slug, the recovery factor increased more when increasing the mass fraction of surfactant in the main slug. This demonstrates that the amount of surfactant in the main slug plays a more important role in displacing oil from the formation than in the vice slug.

Acknowledgments

This work was financially supported by National Natural Science Foundation of China (No. 51404070); Natural Science Foundation of Heilongjiang Province (No. QC2015056).

Author Contributions

Bin Huang and Huan Liu contributed to all parts of the process of this study: developing the methodology, designing the numerical experiments, and writing the paper; Wei Zhang and Cheng Fu performed the numerical experiments; Pengxin Feng conducted the physical experiment; Ying Wang analyzed the data. Wei Zhang and Ying Wang revised the paper.

Conflicts of Interest

The authors declare no conflict of interest.

References

  1. Wang, J.L.; Sun, Y.; Wei, Y.X. Research and outlook of the ASP flooding. Foreign Oilfield 2001, 8, 15–19. [Google Scholar]
  2. Cheng, J.C.; Wu, G.Z.; Hu, J.Q. The key theory and technology of ASP flooding in improving oil recovery. Acta Petrol. Sin. 2014, 2, 310–318. [Google Scholar]
  3. Wu, W.X.; Zhang, D.; Lang, L.Y. Surfactant agent on the properties of recognition system optimization. FAU Oil Gas Field 2013, 6, 772–774. [Google Scholar]
  4. Niu, L.W.; Jiang, G.P.; Lu, X.G.; Li, J.B.; Su, Y.C.; You, H.L.; Yuan, S.W. The performance of ASP system and its effect on oil displacement efficiency. Oil Field Chem. 2014, 2, 290–294. [Google Scholar]
  5. Lu, X.G.; Qi, L.Q.; Niu, J.G. Laboratory evaluation of flooding efficiency for ASP solution of lower surfactant and alkaline concentration in the Daqing Oil field. Acta Petrol. Sin. 2002, 5, 59–63. [Google Scholar]
  6. Xie, Y.Y.; Hou, J.R.; Zhang, J.Z.; Xie, D.H.; Ren, F.; Zhang, Y. Evaluation of low-concentration surfactant system for chemical flooding. Pet. Geol. Recover. Effic. 2014, 1, 74–77. [Google Scholar]
  7. Yan, W.H.; Yao, Z.J.; Shi, X.B.; Wu, A.D.; Pan, W.H. Experimental Study on the Displacement of Oil by ASP Weak Alkali System in Class III Reservoirs. Spec. Oil Gas Reserv. 2013, 2, 102–104. [Google Scholar]
  8. Zhang, T.K.; Li, Y.H.; Zhao, F.L. Laboratory research of oil displacement compound system for layer IV5–11, Shuanghe oilfield. Pet. Geol. Recovery Effic. 2012, 1, 62–65. [Google Scholar]
  9. Yu, H.W.; Chen, T.P.; Gao, M.; Liu, J.S.; Liu, J.L. Estimates of surfactant concentration used for EOR in Daqing oil field low permeability oil reservoir. In Proceedings of the SPE Enhanced Oil Recovery Conference, Kuala Lumpur, Malaysia, 19–21 July 2011.
  10. Lashgari, H.R.; Sepehrnoori, K.; Delshad, M. A four-phase chemical/gas model in an implicit-pressure/explicit-concentration reservoir simulator. SPE J. 2016, 21, 1086–1105. [Google Scholar] [CrossRef]
  11. Zhang, F.S.; Zhang, Y.P.; Xie, H.Z.; Zhang, H.B. Alkali/surfactant/polymer effects on the emulsion stability. J. Oil Gas 2005, S6, 925–927. [Google Scholar]
  12. Yang, C.L.; Zhang, Q.C.; Hu, X.H.; Wang, G.X.; Zhou, Z.X. Numerical simulation of Alkalescence-surfactant-polymer flooding in the test area of the North-Two-West, Saertu Oil Field. J. Daqing Pet. Insur. 2008, 5, 41–44. [Google Scholar]
  13. Han, P.H.; Me, S.C.; Zhang, S.Y.; Li, Z.P.; Wang, Y. Numerical simulation of Daqing oil field south area of polymer and surfactant/surfactant alternating injection. Daqing Pet. Geol. Dev. 2006, 2, 75–77. [Google Scholar]
  14. Xie, K.; Lu, X.G.; Li, Q.; Jiang, W.D.; Yu, Q. Analysis of reservoir applicability of hydrophobically associating polymer. SPE J. 2015, 21. [Google Scholar] [CrossRef]
Figure 1. Different models. (a) Permeability model; (b) porosity model; and (c) oil saturation model.
Energies 10 00304 g001aEnergies 10 00304 g001b
Figure 2. Contour map of main layer. (a) Permeability contour map; (b) porosity contour map; and (c) oil saturation contour map.
Energies 10 00304 g002aEnergies 10 00304 g002b
Figure 3. Fitting curve of the oil production in the experimental area.
Energies 10 00304 g003
Figure 4. Fitting curve of the water injection rate in the experimental area.
Energies 10 00304 g004
Figure 5. Fitting curve of the monthly liquid and oil production of a single well. (a) Liquid production of the CD208-SP10 well; (b) CD208-SP10 well; (c) liquid production of the CD8-SP07 well; (d) oil production of the CD8-SP07 well; (e) liquid production of the C208-SP010 well; (f) oil production of the C208-SP010 well; (g) liquid production of the C8-SP012 well; (h) oil production of the C8-SP012 well; (i) liquid production of the CP208-SP11 well; and (j) oil production of the CD208-SP11 well.
Energies 10 00304 g005aEnergies 10 00304 g005b
Figure 6. Recovery factor comparison of different experimental schemes.
Energies 10 00304 g006
Figure 7. Recovery factor comparison of different experimental schemes.
Energies 10 00304 g007
Figure 8. Diagram of the experimental process. 1-plunger pump; 2-beaker; 3-container; 4-water; 5-polymer; 6-ASP solution; 7-pump sensor; 8-core holder; 9-base; 10-manual pump; 11-oven.
Energies 10 00304 g008
Table 1. Production dynamics of the whole block.
ItemsCumulative Oil Production (104 m3)Cumulative Liquid Production (104 m3)Cumulative Water Injection (104 m3)
Simulation26.64327.76678.967
Actual27.09329.40682.362
Table 2. Numerical simulation schemes of the oil displacement with different surfactant concentrations in the main slug.
SchemePre-Polymer SlugMain SlugVice SlugRear-Polymer SlugSurfactant Concentration in Main Slug/%
10.04 PV (Pore Volume)
(1600 mg/L, 25 million P a)
0.35 PV (1.2% A b + S c + 1900 mg/L, 16–19 million P)0.15 PV (1% A + 0.15% S + 1800 mg/L, 16–19 million P)0.2 PV (1600 mg/L, 16–19 million P)0.1
20.2
30.3
40.4
a polymer, b alkali, c surfactant.
Table 3. Recovery factor percentage of different experimental schemes.
SchemeSurfactant Concentration/%Recovery Factor/%Increased Value of Recovery Factor/%
10.115.53--
20.217.722.19
30.318.530.81
40.419.080.55
Table 4. Recovery factor percentage of different experimental schemes.
SchemeSurfactant Concentration/%Recovery Factor/%Increased Value of Recovery Factor/%
10.117.74--
20.1518.530.79
30.218.900.37
40.319.150.25
50.419.330.18
Table 5. Water composition of the injection and formation water (mg/L).
Component Water TypeCationsAnionsTotal Salinity
Na+ + K+Mg2+Ca2+CO32−HCO3ClSO42
Injection water12657.332.06210.071708.56780.129.614012.7
Formation water253014.664.12420.143417.121560.2419.228025.4
Table 6. Concrete schemes of the oil displacement with different surfactant concentrations in the main slug.
SchemePre-Polymer SlugMain SlugVice SlugSurfactant Concentration in Main Slug/%Post-Polymer Slug
10.04 PV (1600 mg/L, 25 million P a)0.35 PV (1.2% A b + S c + 1900 mg/L, 16–19 million P)0.15 PV (1% A + 0.15% S + 1800 mg/L, 16–19 million P)0.250.2 PV (1600 mg/L, 16–19 million P)
20.3
30.35
a polymer, b alkali, c surfactant.
Table 7. Oil displacement results with different surfactant concentrations in the main slug.
SchemeOil Saturation/%Water Flooding Recovery Factor/%Chemical Flooding Recovery Factor/%Added Value by Chemical Flooding/%Amplification of Recovery Factor/%
174.156.580.0723.57--
273.556.880.9724.170.60
373.857.081.5624.560.39
Table 8. Concrete schemes of the oil displacement with different surfactant concentrations in the vice slug.
SchemePre-Polymer SlugMain SlugVice SlugSurfactant Concentration in Vice Slug/%Post-Polymer Slug
10.04 PV (1600 mg/L, 25 million P a)0.35 PV (1.2% A b + 0.3% S c + 1900 mg/L, 16–19 million P0.15 PV (1% A + S + 1800 mg/L, 16–19 million P)0.050.2 PV (1600 mg/L, 16–19 million P)
20.10
30.15
40.2
a polymer, b alkali, c surfactant.
Table 9. Oil displacement results with different surfactant concentrations in the vice slug.
SchemeOil Saturation/%Water Flooding Recovery Factor/%Chemical Flooding Recovery Factor/%Added Value by Chemical Flooding/%Amplification of Recovery Factor/%
173.657.280.2323.03--
273.856.580.1023.600.57
373.556.680.9724.370.77
473.456.481.2824.880.51

