Article

Optimization of a Bubbling Fluidized Bed Plant for Low-Temperature Gasification of Biomass

by
María Pilar González-Vázquez
,
Roberto García
,
Covadonga Pevida
and
Fernando Rubiera
*
Instituto Nacional del Carbón, INCAR-CSIC, Apartado 73, 33080 Oviedo, Spain
*
Author to whom correspondence should be addressed.
Energies 2017, 10(3), 306; https://doi.org/10.3390/en10030306
Submission received: 8 February 2017 / Revised: 24 February 2017 / Accepted: 28 February 2017 / Published: 4 March 2017
(This article belongs to the Special Issue Biomass Chars: Elaboration, Characterization and Applications)

Abstract

:
Investigation into clean energies has been focused on finding an alternative to fossil fuels in order to reduce global warming while at the same time satisfying the world’s energy needs. Biomass gasification is seen as a promising thermochemical conversion technology as it allows useful gaseous products to be obtained from low-energy-density solid fuels. Air–steam mixtures are the most commonly used gasification agents. The gasification performances of several biomass samples and their mixtures were compared. One softwood (pine) and one hardwood (chestnut), their torrefied counterparts, and other Spanish-based biomass wastes such as almond shell, olive stone, grape and olive pomaces or cocoa shell were tested, and their behaviors at several different stoichiometric ratios (SR) and steam/air ratios (S/A) were compared. The optimum SR was found to be in the 0.2–0.3 range for S/A = 75/25. At these conditions a syngas stream with 35% of H2 + CO and a gas yield of 2 L gas/g fuel were obtained, which represents a cold-gas efficiency of almost 50%. The torrefaction process does not significantly affect the quality of the product syngas. Some of the obtained chars were analyzed to assess their use as precursors for catalysts, combustion fuel or for agricultural purposes such as soil amendment.

1. Introduction

The constant growth of the world’s energy demand, combined with the limited reserves of fossil fuels, their fluctuating prices and the environmental damage they cause, has led to the search for a sustainable and environmentally friendly fuel that complements traditional fossil fuels as the main energy source. This aim is supported by several different trans-national policies starting with the Kyoto Protocol of 1998 and most recently the Paris agreement and the European Union’s “Horizon 2020” program, which aims to improve efficiency until reaching a 20% reduction in Europe’s energy consumption and a 20% increase in the use of renewable energy [1,2,3]. According to the International Energy Agency (IEA), the use of renewable energy sources in Spain reached 14.9% of overall consumption in 2014, with Spain taking twelfth place among IEA members [4].
Some of the reported advantages of biomass, such as its CO2 life cycle neutrality [5], its moderate NOx or SO2 emissions and its autonomy as a resource [6], make it a very useful feedstock for achieving these fixed goals. The energy conversion of biomass can be performed in different ways, bio and thermochemical being the most common. Biochemical conversion can be achieved by fermentation or anaerobic digestion [7,8,9], whilst the thermochemical processes include combustion, pyrolysis and gasification, with the oxidizing agent being the major difference between them, since combustion requires an excess of air while pyrolysis takes place in an inert atmosphere. Of these techniques, gasification is one of the most promising as it allows solid matter with a low energy value to be converted into a clean gaseous fuel that is easy to handle [10] by partially oxidizing carbonaceous fuels from low temperatures (600–650 °C), thereby preventing sintering, agglomeration and other ash-melting-related problems [11,12].
The quality and composition of the outlet gas depends on the selected fuel, oxidizing agent (oxygen, air, steam, carbon dioxide or their mixtures) and its ratio, gasification equipment (fixed, fluidized bed or entrained flow gasifier) and reaction conditions (temperature or bed material) [13]. This product has many possible uses ranging from the direct production of heat and electricity to the production of a wide variety of chemicals [14,15].
The gasification process takes place in five stages: pyrolysis, volatiles and char combustion, char gasification and gas–gas reactions [16,17,18], the main reactions being:
Water-Gas Reaction I
C + H2O → CO + H2      ∆H = 131.3 kJ/mol
Water-Gas Reaction II
C + 2 H2O → CO2 + 2 H2     ∆H = 89.7 kJ/mol
Water-Gas Shift Reaction III
CO + H2O → CO2 + H2     ∆H = −41.2 kJ/mol
Methane-Steam Reforming Reaction IV
CH4 + H2O → CO + 3H2      ∆H = 206 kJ/mol
Water-gas (I), (II) and water-gas shift reactions (III) are the most important when using air/steam mixtures as gasifying agent, as in the present work. The last reaction, methane-steam reforming, is highly useful as it increases the quantity of H2 in the gaseous product [19].
Gasification is quite a well-known energy conversion technique that is commonly applied to biomass, using different types of reactor and gasifying agents. For example, Guizanni et al. [20] used a Macro-TG analyzer to study the influence of the conversion degree (20%, 50% and 70%) and the oxidizing agent used (CO2, H2O or their mixture) during beech wood gasification on its char structure, surface chemistry and mineral content. Kuo [21] used different air–steam blends to gasify raw bamboo and two of its torrefied products (250, 300 °C) in downdraft fixed bed equipment to study their cold gas efficiency and carbon conversion in each case. Entrained flow gasifiers have also been used in some cases, as in Chen’s work [22], where torrefied bamboo was gasified in an O2-impoverished atmosphere, or as in Hernandez’s study [16] in which grape marc was oxidized using different steam/O2 mixtures. The latter concluded that the optimum quantity of steam in the oxidizing agent blend ranges between 40% and 70% in mole percentage.
The gasification equipment most widely used is the bubbling fluidized bed, as it has some major advantages like the possibility of using many different fuels and gaseous agents, permitting a wide flexibility of operation [14,23]. Of the works developed at bench-scale those of Makwana [24] and Skoulou [15] both used air to respectively gasify rice husk and olive kernels. Rapagna [25] partially oxidized almond shells in pure steam, whilst Kulkarni [26] used N2-O2 blends to gasify torrefied pine. Zaccariello [23] co-gasified plastic wastes, wood and coal in a pre-pilot plant concluding that the gas yield increases and H2 decreases with plastic content in the feeding mixture. Mohd Salleh [27] treated the biochar of empty fruit bunches in an air atmosphere with the aim of determining the effect of temperature (500–850 °C) on the quality of the product gas, focusing on its composition and HHV. Pinto [28] gasified straw-lignin pellets in steam/oxygen, using stoichiometric ratios (SR) of 0 to 0.3 and a steam-to-biomass ratio (SBR) of 0.7 to 1.2 at different temperatures in the range of 750–900 °C, and achieved conversions of over 65% at 900 °C, for SR = 0.2 and SBR = 1.0. Gil et al. [29] used a pilot scale bubbling fluidized bed to study the influence of the selected gasifying agent (air, steam and steam/O2) and its ratio to biomass (pine chips) on the distribution of the gas product (gas, char and tar yields) and its quality (H2, CO, CO2, CH4). It is also worth noting that if air, O2 or their blends with steam are employed as the gasifying agent, an auto-thermal process is obtained [10,19,30].
As has been widely reported, raw biomass presents certain problems of its own. These are its general heterogeneity, low energy density and highly hygroscopic behavior, which can negatively affect its storage, handling, grinding and transportation properties [31,32,33]. These limitations can be remedied by torrefaction, which is a thermal pre-treatment at a mild temperature (200–300 °C), for 30–180 min, in an inert (N2) or low reactive atmosphere (3%–6% O2) [34], in which moisture and light volatiles originating from the decomposition of hemicellulose are eliminated [35,36]. As a result, the treated biomass has a much lower moisture content and a higher energy density, qualities that enhance its hydrophobicity and grinding properties [37]. This process can be successfully combined with gasification [28,29,33].
The aim of the present work is to compare the behavior of different biomass samples (wood, torrefied biomass, agricultural and industrial wastes) after gasification in a bubbling fluidized bed gasifier at mild temperatures (600 °C), using an air–steam mixture at different stoichiometric and steam/air ratios (SR, S/A) as oxidizing agent. The quality of the product gas flow was analyzed on the basis of its composition (CO, H2, CH4), high heating value (HHV), gas yield (ηgas) and cold-gas efficiency (ηcold-gas). In addition, the possibility of reusing the carbon-rich partially oxidized chars in agricultural applications, for thermal conversion or as a catalyst-sorbent precursor was evaluated.

2. Materials and Methods

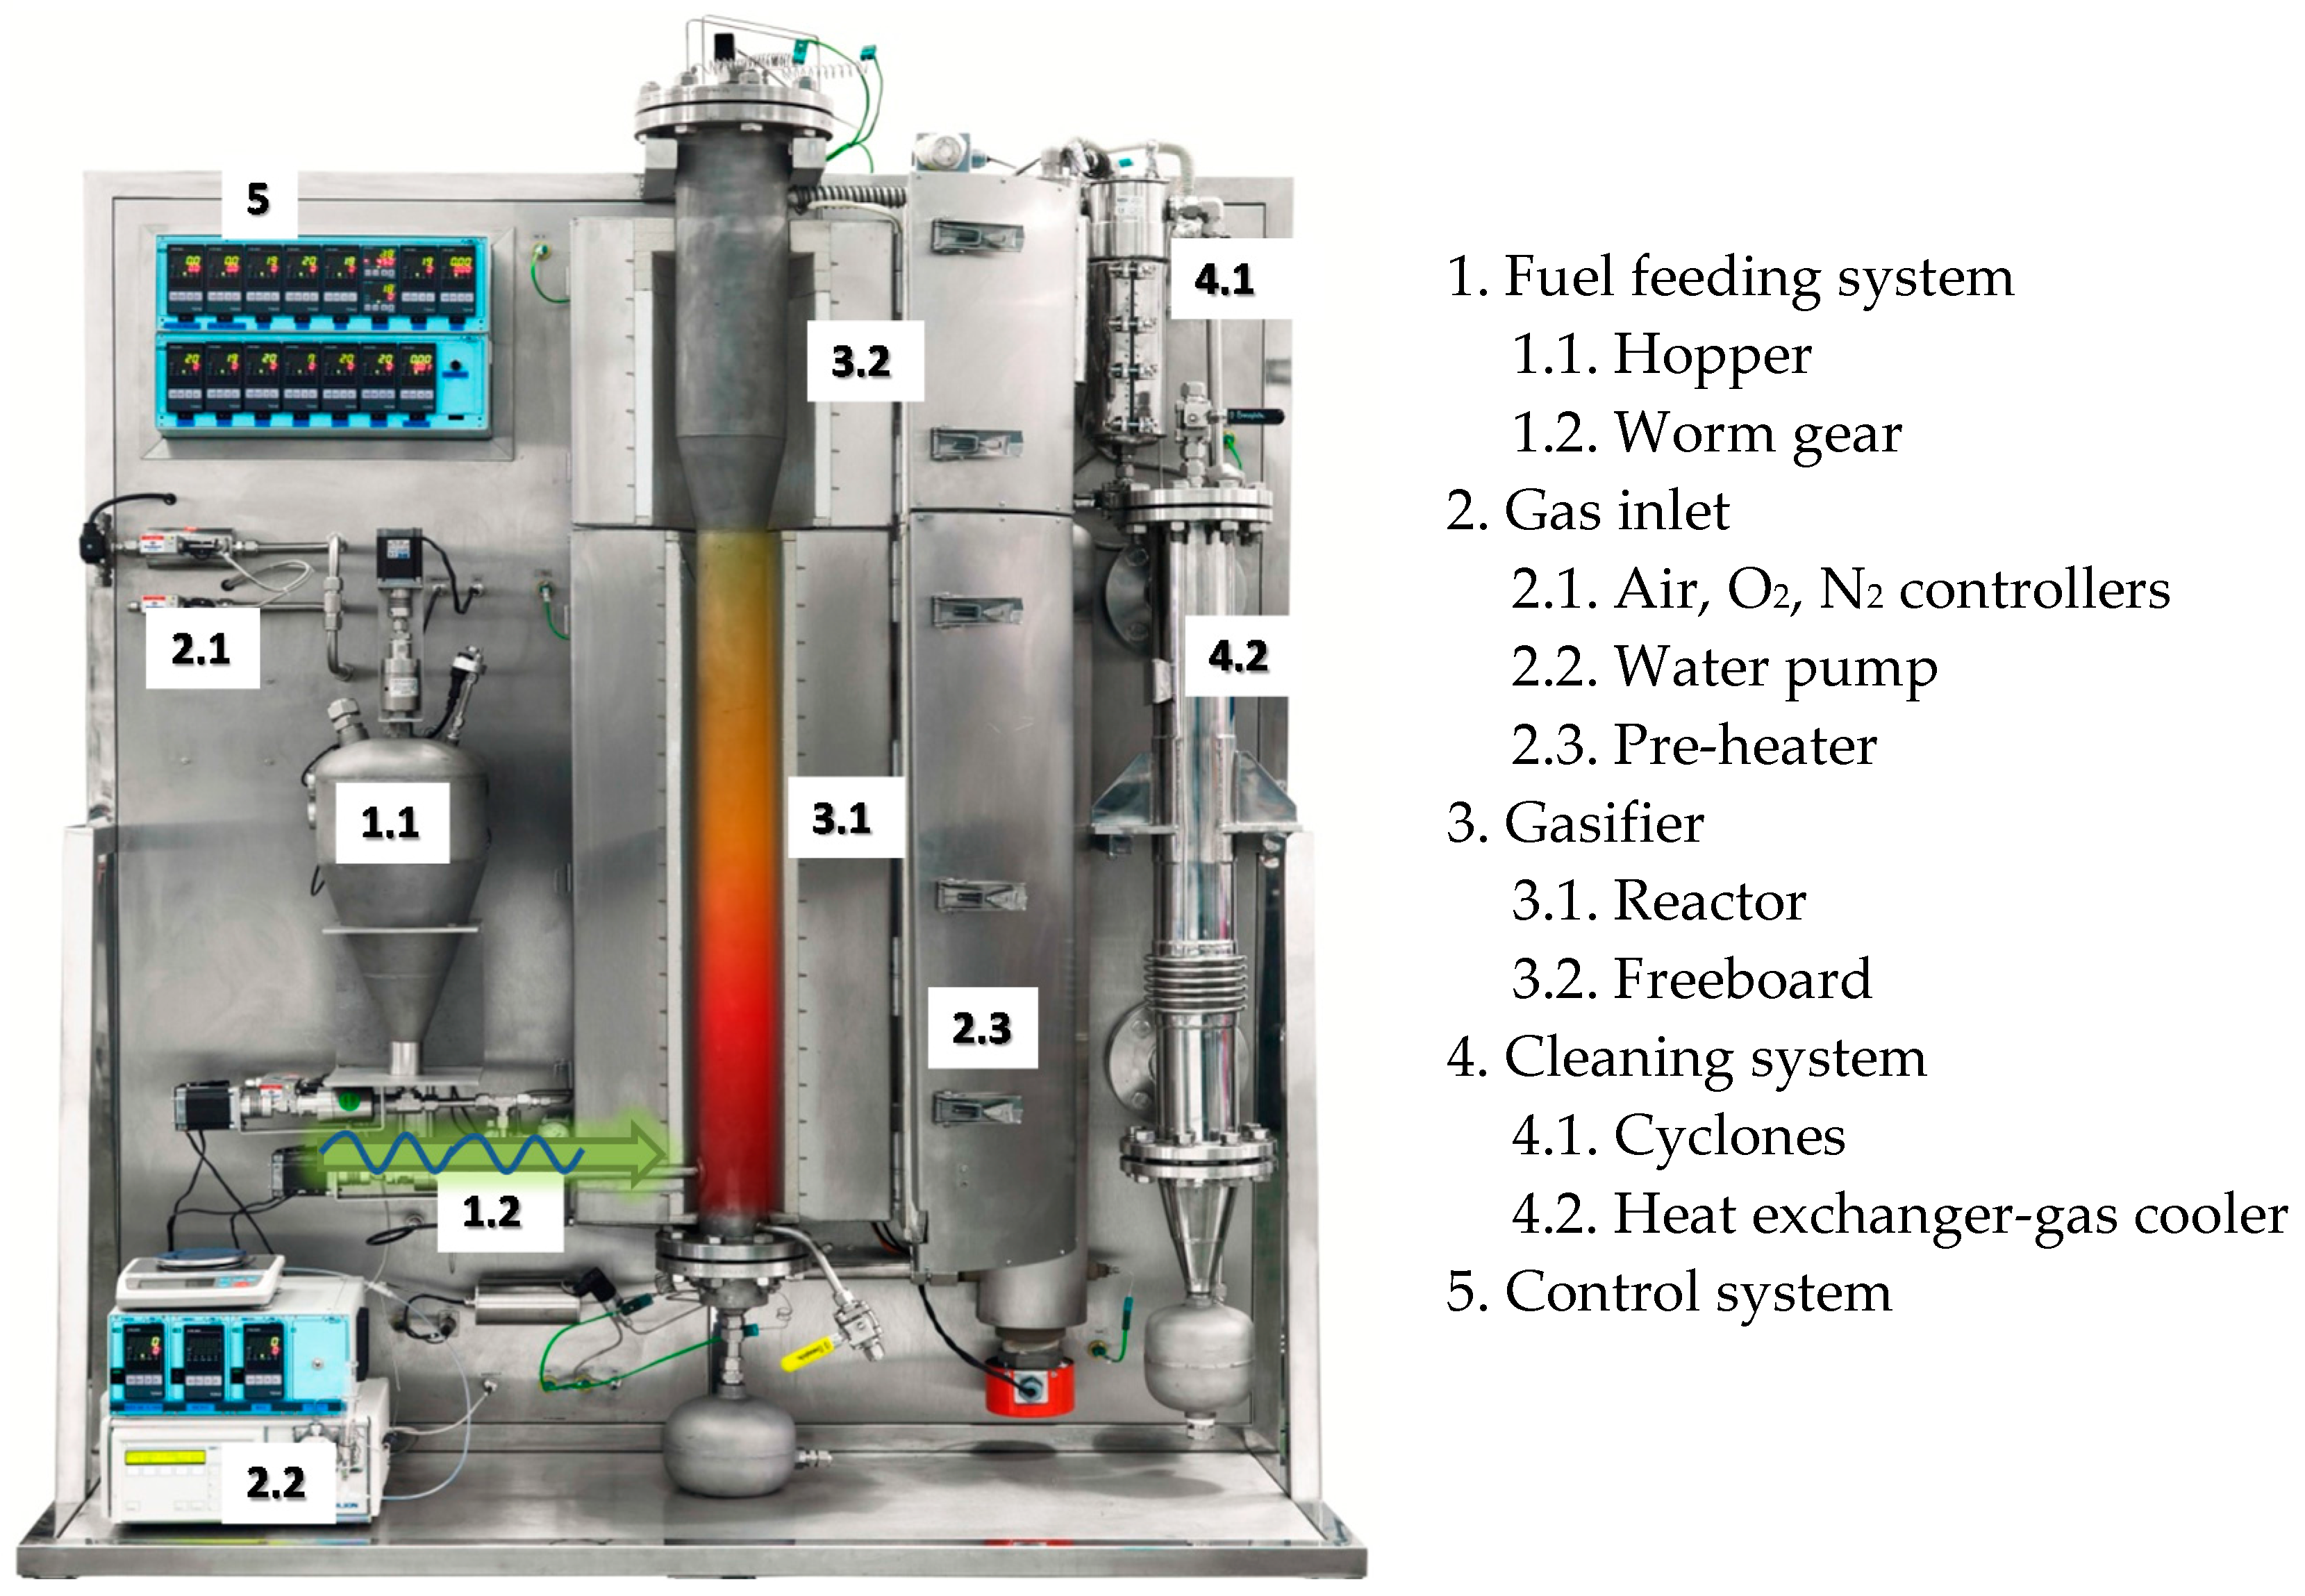
2.1. Gasification Equipment

A highly versatile gasification pilot plant allowing the use of different fuels and steam and air flows was employed. In this way, a wide range of stoichiometric ratios (SR) [38], steam-to-biomass ratios (SBR) [29] and steam-air ratios (S/A) [16] could be tested. These parameters can be defined as follows:
SR = ( Oxygen fuel ) used ( Oxygen fuel ) stoichiometric
SBR = Total   water   supplied   ( g min ) Fuel   supplied   to   SR   ( g min )
S A = Total   water   supplied   ( g min ) Total   air   supplied   ( g min )
Depending on the fuel’s characteristics the plant can treat up to nearly 10 kg/h, providing a maximum of 55 kWth. The plant consists of the following components: fuel feeding, gas inlet and pre-heating, gasification reactor, outlet gas cleaning system and control and monitorization systems that are shown in Figure 1.
The fuel feeding system includes a 16.7 L storage hopper and an 8 mm-diameter refrigerated worm gear that introduces the sample into the fluidized bed reactor. The auger’s rotation speed can be calibrated so that it provides the mass flow of fuel required in each case.
The reactive gases (air, N2 or O2) are supplied by two Bronkhorst High-Tech mass flow controllers that can provide up to 240 NL/min of overall gas, which is enough to satisfy the reaction and fluidization requirements of this equipment. A Wilson 307 piston pump feeds in the selected mass flow of liquid water which is subsequently heated up to 400 °C to ensure a continuous condensate-free flow of steam into the reactor. The mix of gases involved in the reaction process is then pre-heated by a 4.5 kW Watrod SS310 circulation heater.
The SS310 cylindrical gasification reactor is 1 m in length, has an inside diameter of 77 mm and approximately 1.3 kg of coal ash (212–710 µm) was used as reaction bed. The reactor ends in a 529 mm long and 133 mm diameter freeboard. Both the reactor and freeboard are surrounded by two independent ovens that can supply a maximum power of 22 kW, which is sufficient to raise the temperature at the reactor wall to 920 °C.
After completing the reaction process, the outgoing gas flow crosses a double cyclone system heated at 400 °C, where particulate matter is eliminated, and then a heat exchanger where condensed water and light tars are separated from gaseous emissions. After this first cleaning step, the remaining flow goes through a cold trap that captures the heavier tars. The cleaned gases are sent to four Rosemount Binos® 100 gas analyzers where the main gases (CO, CO2, H2, CH4 and excess O2) are measured in terms of volume percentage.
There is also a control system that measures and continuously monitors every parameter involved in the reaction process, such as the inlet and outlet gas flows, temperatures or pressure drop to assure full control of the whole process.

2.2. Biomass Characterization

As previously mentioned, this work focuses on testing the gasification behavior of nine biomass samples of different origin (wood, forest and food industry wastes). One hardwood and two softwood samples (chestnut (CHE) and pine (PIN) sawdust, respectively) together with their torrefied products (CHET, PINT) , obtained by heating at 280 °C for 1 h in a Nabertherm RSR horizontal tubular rotary furnace [37], were studied. In addition, two Spanish seasonal products, almond shells (AS) and olive stones (OS), were tested. Two wastes obtained from well-known Spanish food industries, grape (GP) and olive pomaces (OP), and a sample of cocoa shell (CS) were also studied.
Every sample was air-dried at room temperature for several hours to eliminate external moisture and then ground and sieved down to the range 0.1–1 mm. After this, they were fully characterized; fixed carbon (FC) and oxygen (O) contents were calculated by difference in mass percentage in dry basis [39,40]:
FC   ( % )   =   100     ( VM   +   Ash )
O   ( % ) =   100     ( Ash   +   C   +   N   +   H   +   S )
Bulk density (BD) was determined using a commercial device (Quantachrome Instruments Autotap-tapped density analyzer), by measuring the mass and volume of each sample in a 250 mL test tube after 300 hits.
Gaseous emissions were measured and recorded by means of gas analyzers and suitable software, and the results were used to calculate the gas yield (ηgas) [16] by applying a balance to the inert gas (N2) that came into the reactor as part of the air, the HHV of the syngas obtained [41], measured in kJ/Nm3, and the cold-gas efficiency [42]:
η gas = Q ˙ outlet gas m ˙ fuel
HHV gas = ( x CO · 3018 + x H 2 · 3052 + x CH 4 · 9500 )
where Q ˙ and m ˙ are the volumetric and mass flows, respectively, and xi is the volume percentage of each gas in the product flow.
η cold gas = η gas · HHV gas HHV fuel
The samples that presented the best results were mixed in different mass ratios and their thermogravimetric profiles were studied, using a Setaram TAG24 thermogravimetric analyzer (Caluire, France). To this end 5 mg of fuel was subjected to a 15 °C/min temperature ramp from room temperature to 900 °C maintained for 1 h. The gas flow was fixed at 50 mL/min of air impoverished to simulate the oxidizing gas used during the gasification experiments.
In addition, the particle size distribution of the samples used in the biomass mixtures was determined by sieving 80 g of sample for 15 min on a Retsch AS200 sieve shaker (Haan-Gruiten, Germany) using three sieves with mesh sizes of 150, 500 and 710 µm.

2.3. Char Samples

As previously mentioned, the gasification conditions selected for this work (a mild temperature and high steam content in the oxidizing gas flow) imply lower carbon conversion levels and an increase in the amount of partially oxidized chars compared to those obtained in more aggressive atmospheres. Such chars could be reused as fertilizer, fuel for pure combustion or as precursor for catalysts or sorbents as suggested by Qian et al. [43].
With this aim in mind, chars obtained from samples CHE, OS and GP were studied using a Quanta FEG 650 scanning electron microscope (SEM) (Eindhoven, The Netherlands) coupled to an Ametek energy dispersive X-ray analyzer (EDX) (Tilburg, The Netherlands), in order to obtain structural and semi-quantitative composition information.
In addition, textural characterization of some of the studied samples was also carried out by applying nitrogen physical adsorption at −196 °C on a Micromeritics ASAP 2010 and their surface area was calculated by means of the Brunauer-Emmet-Teller (BET) equation.

3. Results and Discussion

3.1. Biomass Analysis

The ultimate and proximate analysis, HHV and bulk density are listed in Table 1.

3.2. Preliminary Selection of Operation Conditions

The aim of this work is to determine the best gasification conditions for the selected biomass samples from the wide range of SR and S/A ratios originally studied. To this end PIN was subjected to reaction atmospheres with different S/A ratios (85/15, 75/25, 50/50, 25/75 and 15/85), combined with a SR from 0.1 to 0.7, implying a SBR range from 0.14 to 8.58. The results obtained shown in Figure 2, prove that too large SR impoverishes the properties of the outlet flow and leads to a decrease in CO, H2 and CH4, and hence HHV. On the other hand, a too low stoichiometric ratio, SR, minimizes the ηgas, and causes a decrease in the energy yield. In addition, a high S/A ratio seems to improve the properties of the outlet gas but slows down the reaction due to the smaller flow of carrier gas that impoverishes the phase contact in the gasifier. Because of this, an SR range between 0.1–0.4 and a medium-high S/A ratio (50/50, 75/25), i.e., a SBR from 0.24 to 4.69, were selected for the rest of the experiments. These ranges are reasonably similar to the ones commonly reported in the literature [12,15,38].

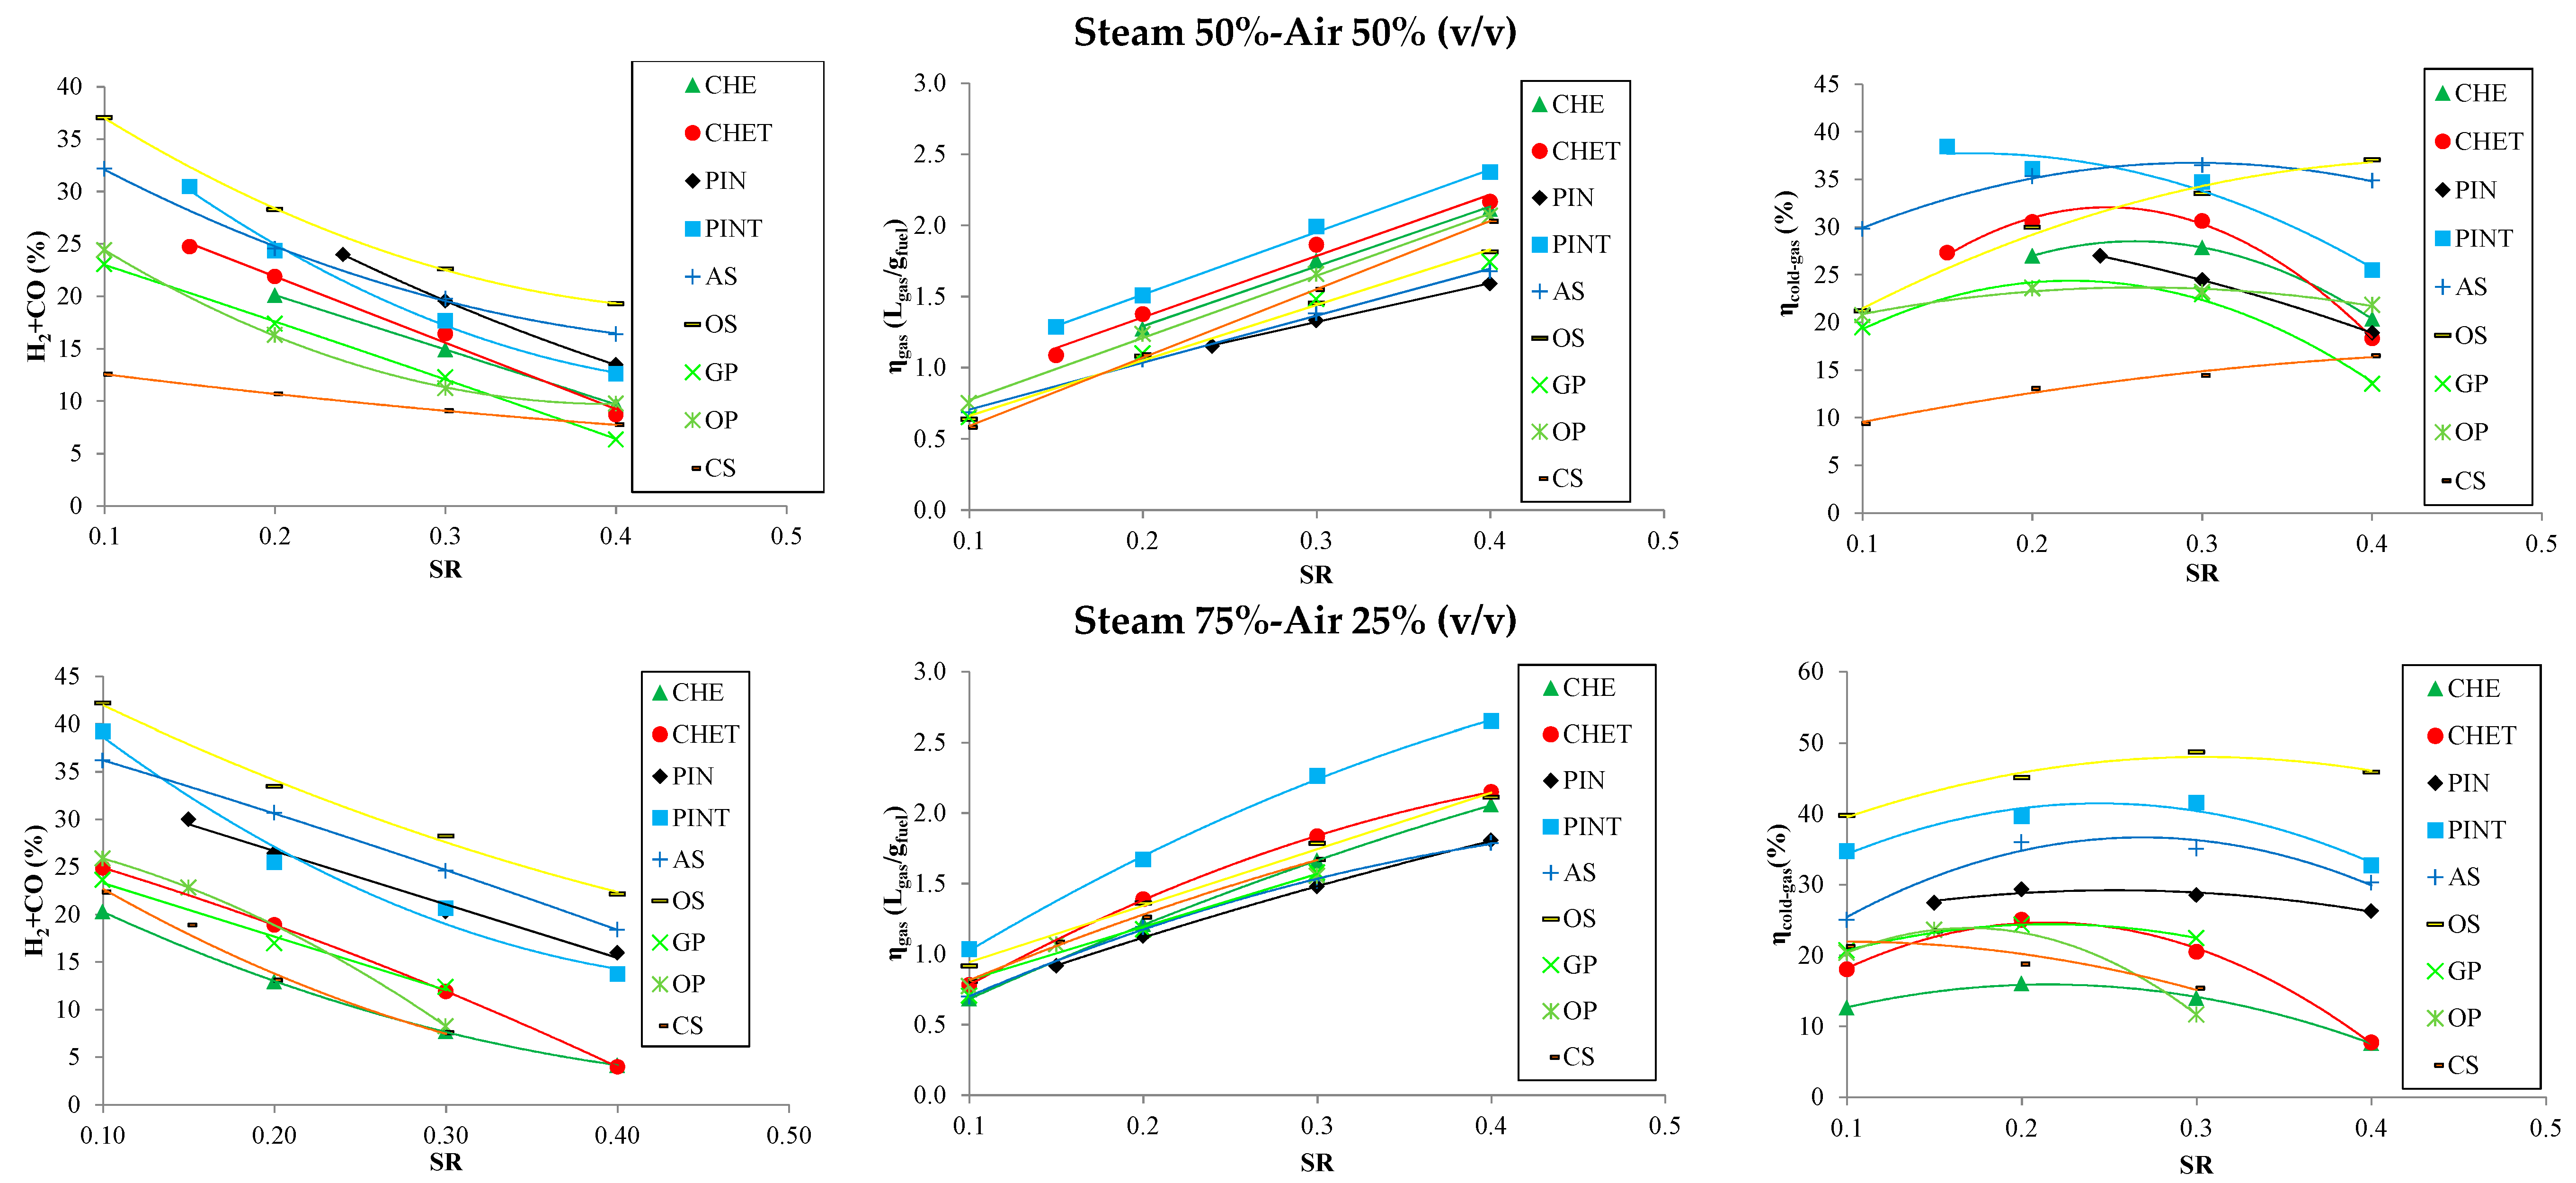
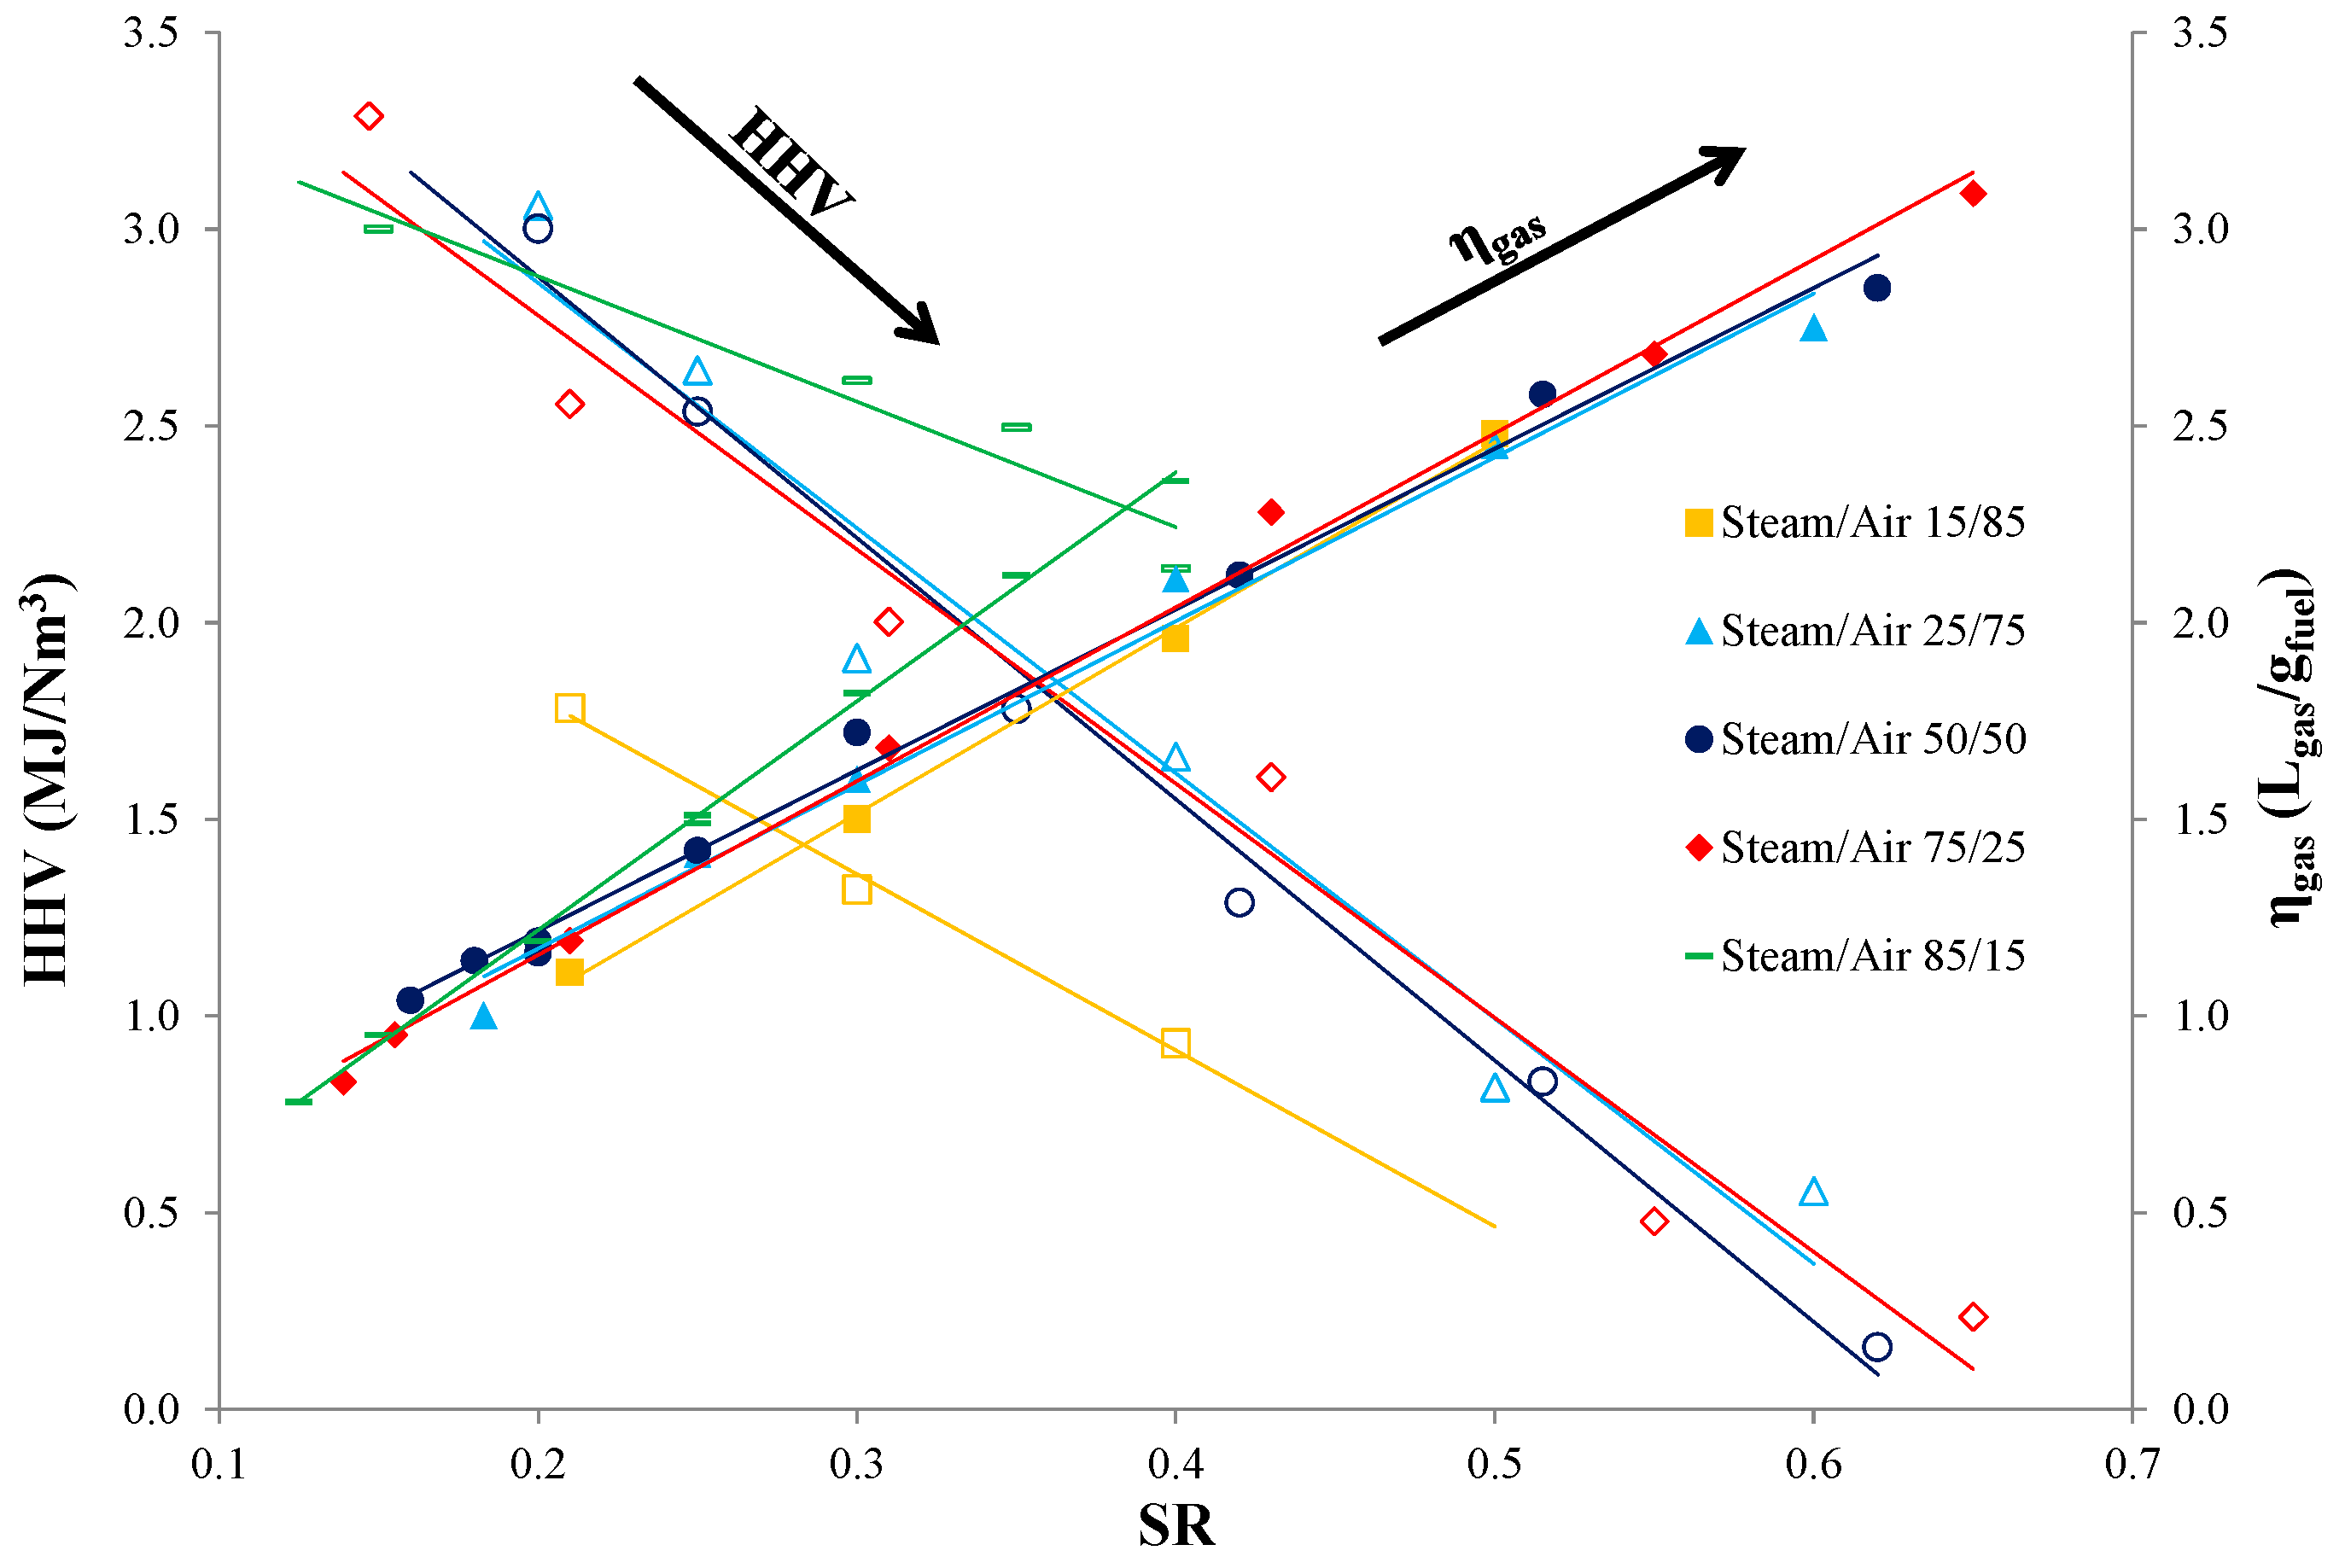
3.3. Effect of SR and Steam/Air Ratio on the Product Gas Properties

The sum of gaseous emissions obtained, (CO + H2), ηgas (Lgas/gfuel) and ηcold-gas (%) for the previously selected conditions are presented in Figure 3. In addition, details of the gaseous emissions (CO, H2, CH4) and their calculated HHV are shown in Table 2. Some general statements can be made on the basis of these results. For example every gaseous emission (CO, H2, CH4), and thus HHV, decreases as SR increases for both tested S/A ratios. The gas yield shows the opposite trend (Figure 3), with a linear increase with SR, for both of the tested steam/air ratios. As cold gas efficiency relates these two terms that have conflicting tendencies, an optimum value is achieved, in most cases in the SR range selected, again for both S/A ratios.
A comparison of the biomass samples shows that quite high values were obtained in the total amount of syngas produced from OS, AS, PIN and PINT. By contrast, raw and torrefied chestnut (CHE and CHET), the pomaces (GP and OP) and CS gave poorer yields. This result is much more marked in the experiments carried out at a higher S/A (75/25), where two distinct groups can be observed, with CHET, the best of the second group, yielding 20% syngas at a SR = 0.2, whilst PIN and PINT nearly reach 30% at this point. The highest levels for the combination CO + H2 were obtained for OS at both S/A ratios (50/50 and 75/25), though it was slightly higher in the second case (35% and 30% at SR = 0.2 and 37%–42% at SR = 0.1). From the slight differences between PIN-CHE and their torrefied couples PINT-CHET, it can be concluded that torrefaction does not significantly improve the gasification properties for either hardwood or softwood, as previously reported by Kulkarni et al. [26].
The highest ηgas values were obtained with the torrefied samples (PINT and CHET), with values close to 2.5 and 2 Lgas/gfuel, respectively, at SR = 0.4. At SR = 0.2 the values are slightly lower, reaching 1.5 Lgas/gfuel in the case of PINT. For all the samples excepting PINT, the ηgas results obtained at both S/A are similar, so it can be concluded that the steam feeding does not significantly affect the gas-volume production.
It can also be seen that the ηcold-gas of most samples presents an optimum value in the selected SR range, between 0.1 and 0.4. Important differences between the samples become apparent on considering different steam-air ratios. The best results for the 50/50 air–steam ratio were obtained with PINT and AS, with yields close to 35% at a SR between 0.2 and 0.3 in both cases. OS and CS present a linear increase in the range studied, which means that these samples require a richer air atmosphere to optimize their gasification process at a low S/A ratio. CHET presents its maximum yield at a SR close to 0.25, reaching 30%. All the other samples show levels under 25%.
Things change considerably at the 75/25 steam-air ratio. In this case OS reaches values close to 50% in the SR range between 0.2–0.3, followed by PINT and AS with yields over 40% and 35%, respectively, in the same range as in the previous case, generally considered as the optimum range for biomass gasification in other previous works [26,43,44]. All the other samples reach levels below 30%, with the worst values, just slightly over 10%, corresponding to CHE and CS. A significant difference is observed in the case of the ηcold-gas of the raw samples and their corresponding torrefied counterparts at both S/A ratios. As can be seen, the values of the torrefied samples are much higher, whilst in the case of the pure gaseous emissions they are quite similar. This can be attributed to the higher density of the samples after the torrefaction process. As a result a smaller mass of sample is required to obtain the same gas flow, which leads to a higher yield.
When analyzing the influence of S/A on the gaseous composition and HHV of the outlet gas, no general conclusion can be drawn. From Table 2 it can be seen that an increase in this ratio from 50/50 to 75/25 does not influence every sample in the same way. In the case of CHE and CHET their behavior is quite similar, as every gaseous compound (CO, CH4 and H2), and therefore HHV, decreases as the S/A increases. The only exceptions are the H2 emissions with CHET at a SR of below 0.2 and the CO emissions with CS at a SR of above 0.3 which increase as the S/A ratio increases. The gaseous behavior with PIN, PINT and OS is quite similar, as CO remains almost unvaried as the steam/air increases while CH4, H2 and HHV experience a slight increase in their values as the S/A ratio rises from 50/50 to 75/25. AS and GP also present the same evolution as CO decreases, whereas CH4 remains nearly constant and H2 increases, meaning the overall HHV remains constant or undergoes a slight decrease. OP shows the most changeable behavior with the variation in S/A, as CO, H2 and in turn HHV increase with the steam/air ratios, but only at SR values of below 0.2. On the other hand CH4 decreases as the steam/air ratio increases from 50/50 to 75/25. From Table 2, it can be seen that the quantity of steam supplied plays a key role in the composition of the outgoing gas, and in the richness of the syngas obtained during the gasification process, but this is very much dependent on the type of fuel and the operation conditions (SR). Consequently, no general statement can be made about the influence of S/A on the gasification process, so each sample must be carefully studied individually and its gasification conditions optimized to maximize the components required in the gaseous stream product.

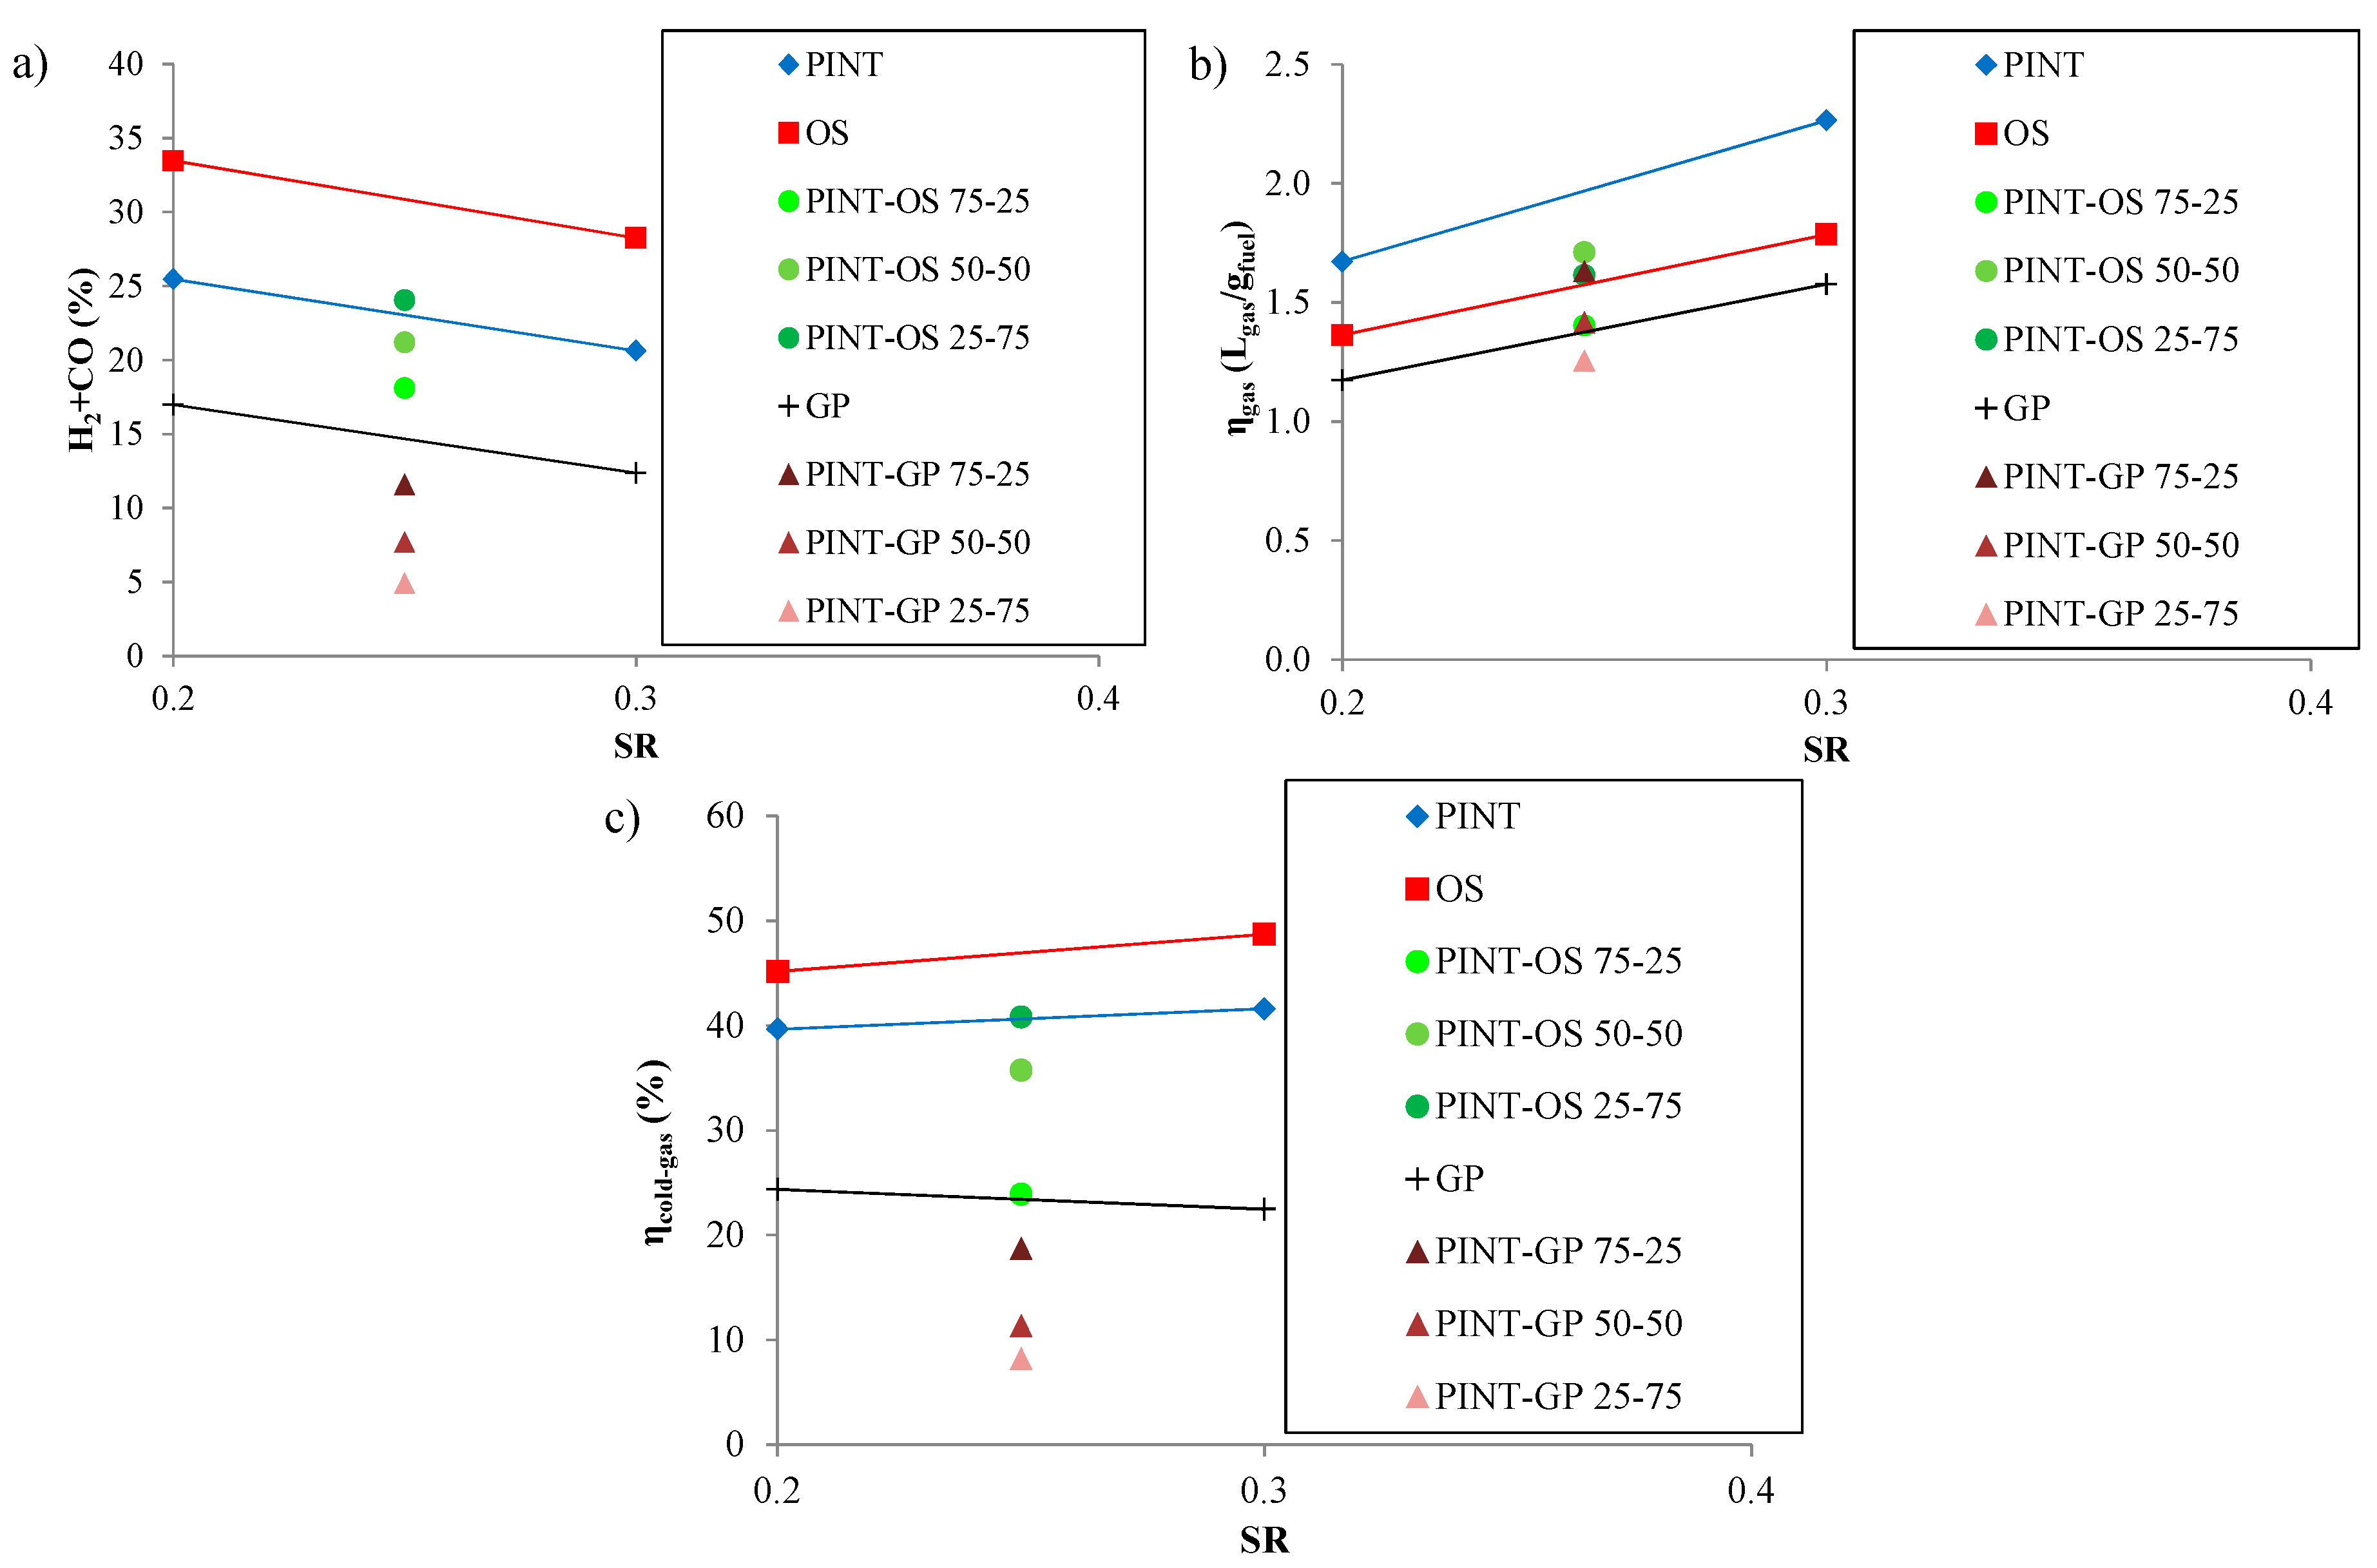
3.4. Selection of Optimum Conditions and Biomass Mixtures
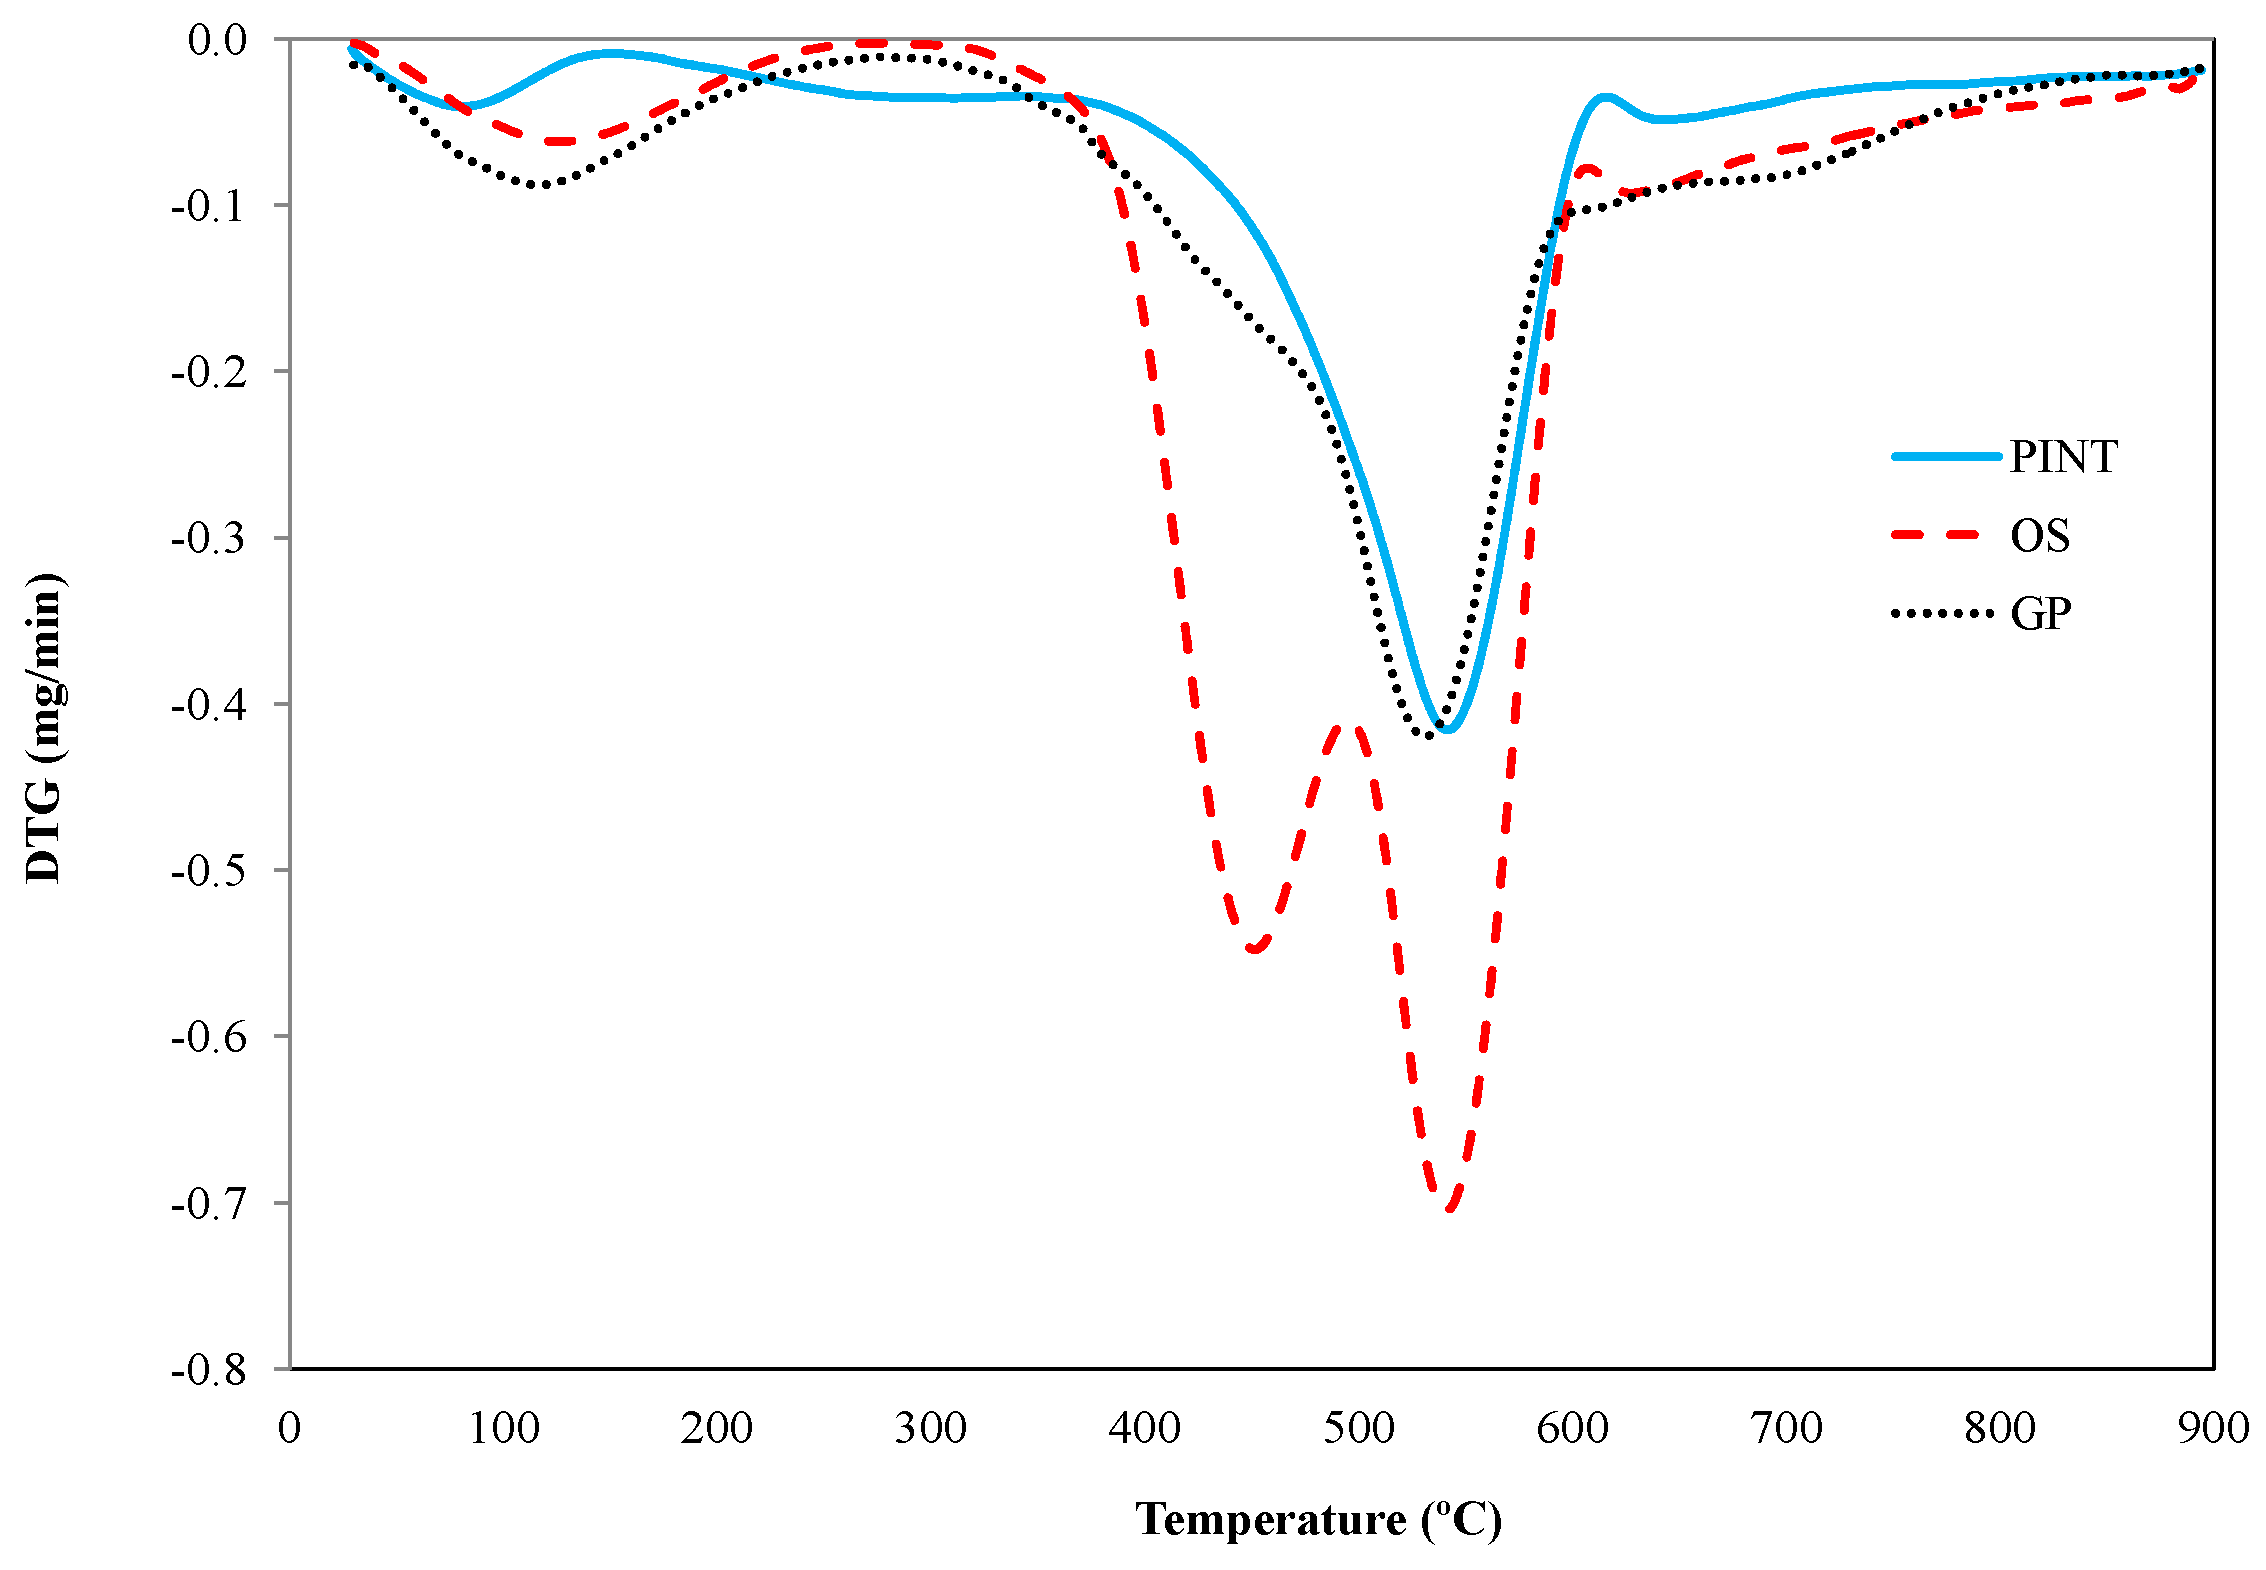
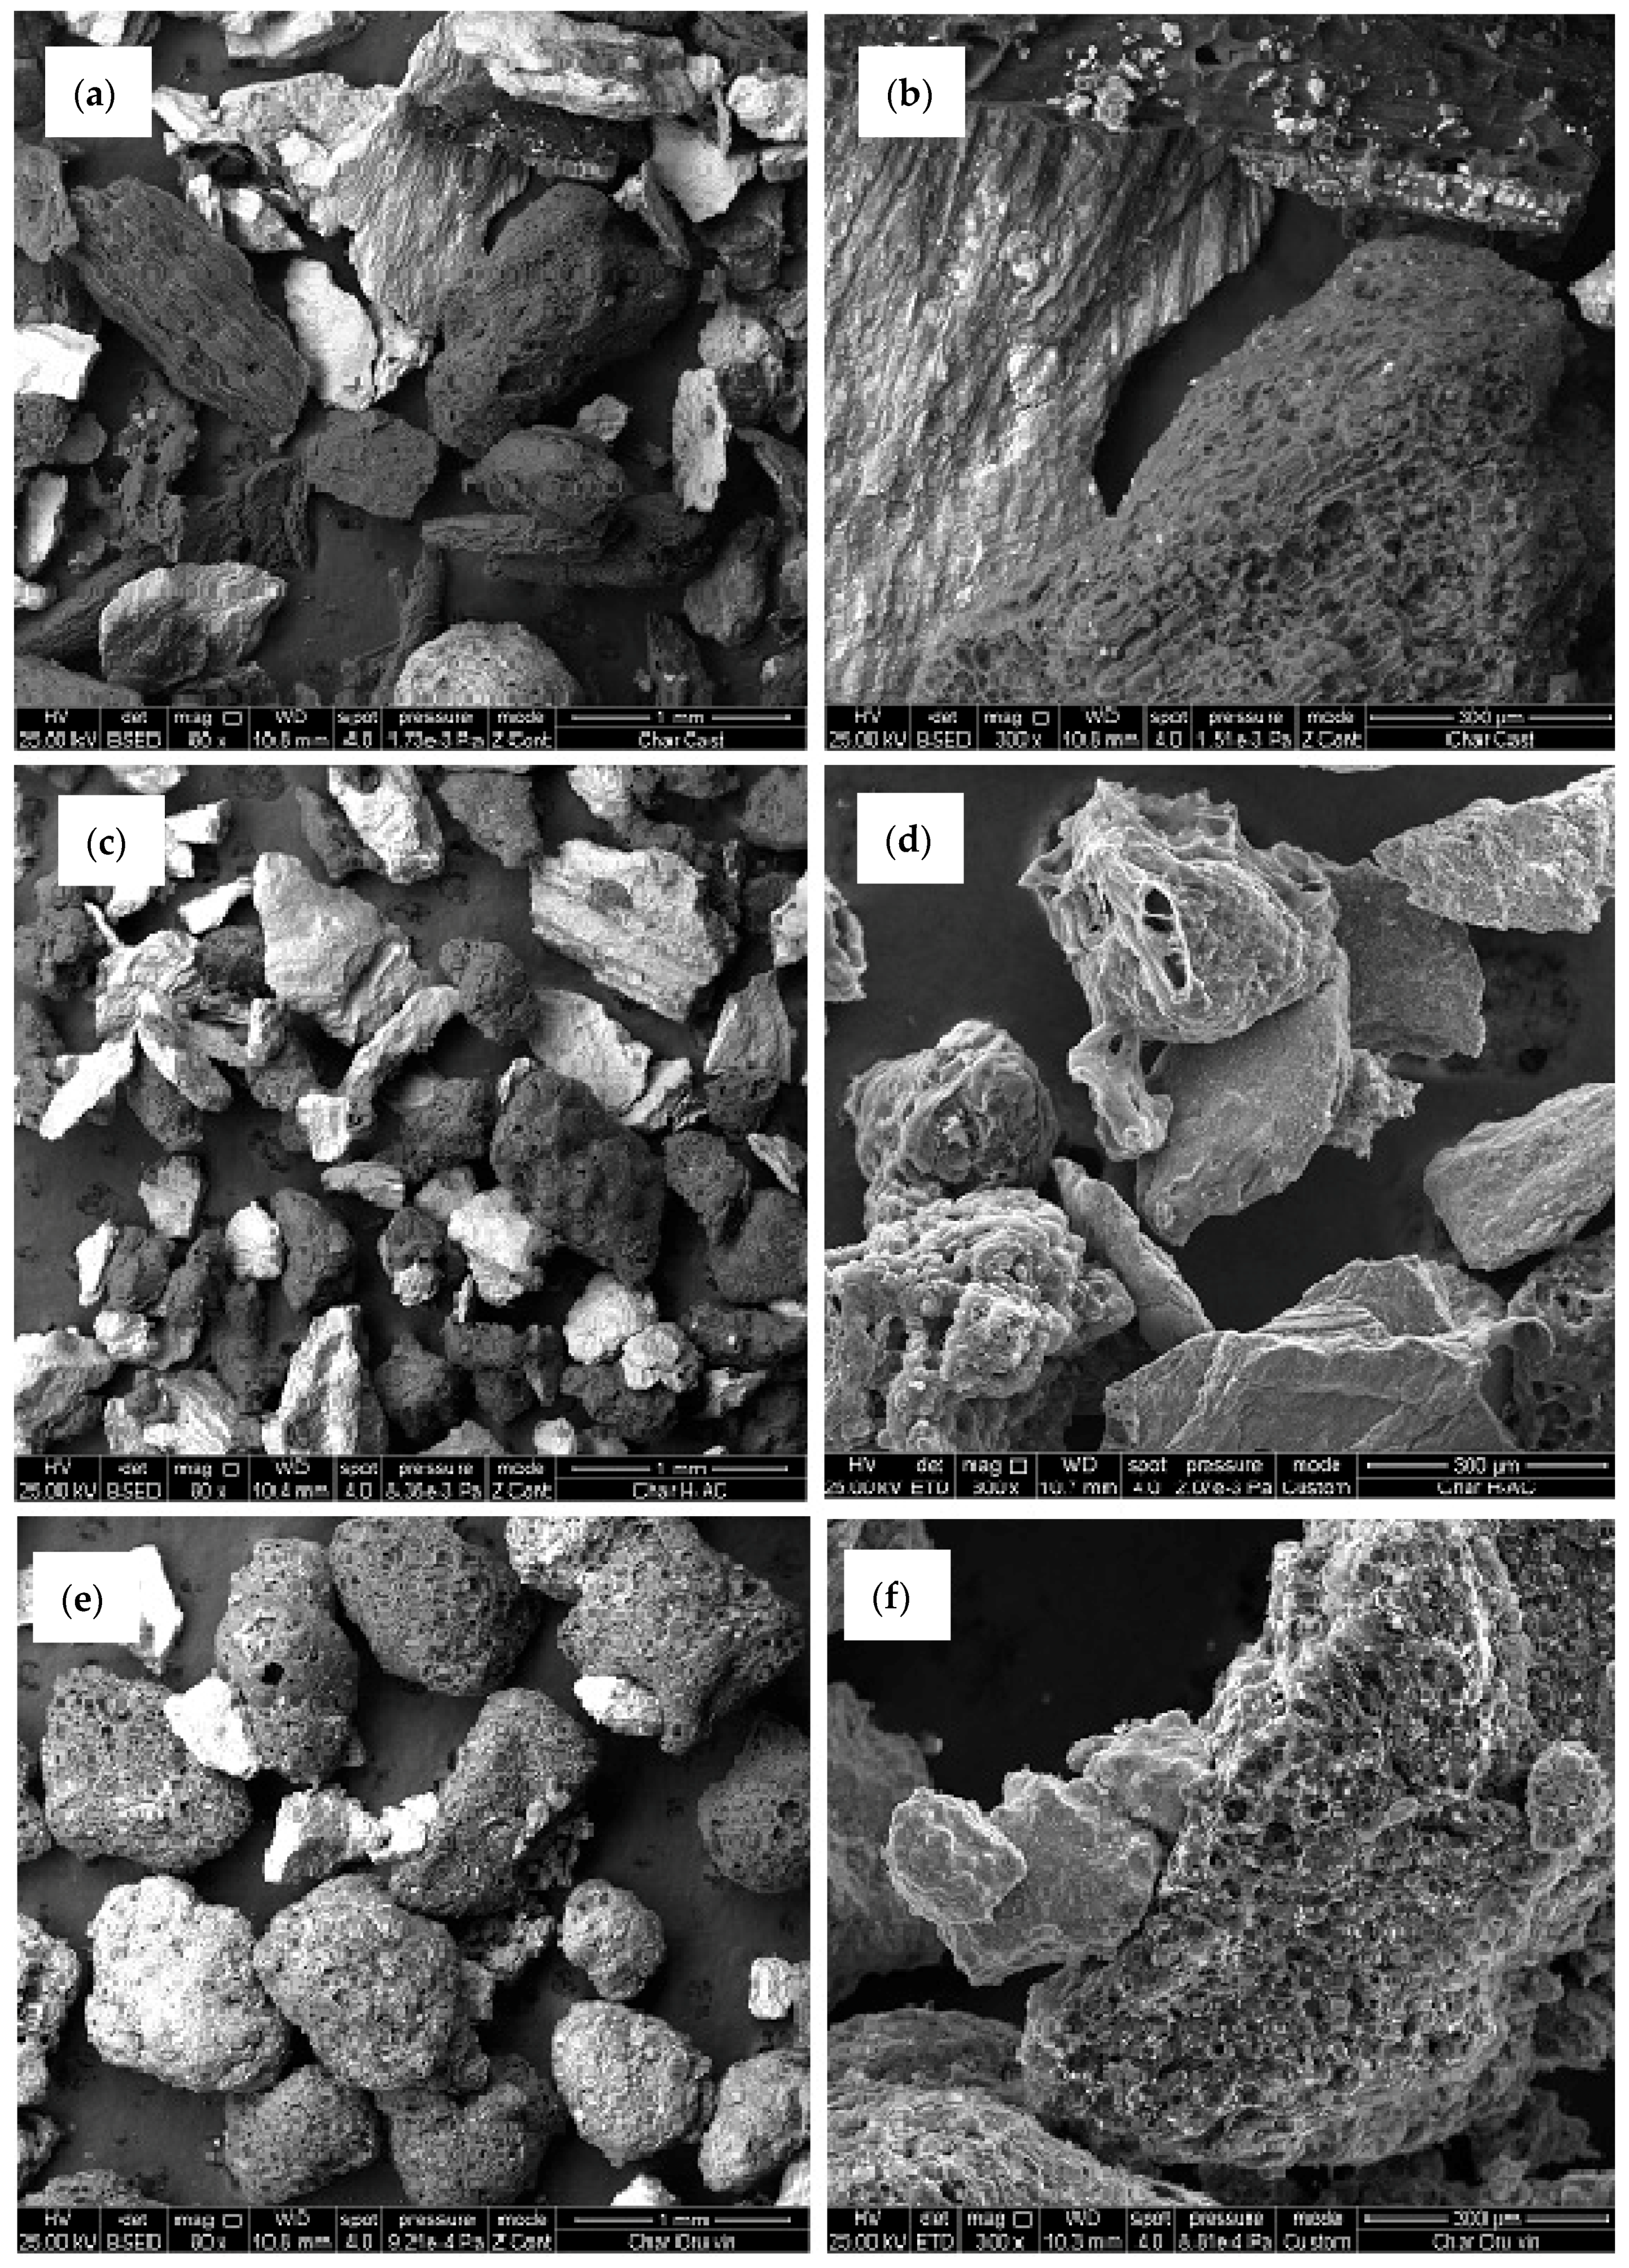
An analysis of the results shows that OS exhibited the best gasification behavior and the highest syngas production whereas the highest gas yield was provided by PINT. The two biomasses were mixed and gasified at 600 °C, at a SR of 0.25, as both of them showed optimum cold gas efficiency in the SR range of 0.2–0.3, at a steam/air ratio of 75/25 in order to maximize syngas production. Three OS/PINT mass ratios (25/75, 50/50, 75/25) were tested and the results were compared with those obtained from the gasification of pure fuels in the same conditions. GP/PINT mixtures were also tested in the same conditions at the same ratios, as GP showed good grinding and handling properties but discrete performance in gasification. All the obtained results are shown in Figure 4.
As can be seen from the results in Figure 4, none of the tested mixtures outperform the best of the single samples, excluding all possibility of synergy. Not only this, but in the OS/PINT series, only the 75/25 steam/air ratio improves the syngas composition yielded by the worst of the single biomasses (PINT) whilst gas and thermal yield results are similar to the worst cases. The results of the GP/PINT series are even poorer, at least at the particle size studied in this work. A possible explanation for this impoverishment is provided by the DTG profiles in Figure 5. As can be seen, both OS and GP have ignition temperatures slightly lower that than of PINT (370, 353 and 389 °C, respectively). In addition to this, whilst the peak temperatures are similar (541, 530 and 542 °C), OS presents a previous peak at approximately 450 °C. This temperature difference may lead, in poor oxygen atmospheres as is the case, to the quasi-total oxidation of one of the fuels, which would remove most of the O2 from the reaction environment ,whilst the other fuel would experience a low reaction rate, a phenomenon known as oxygen starvation [45].
Another interesting feature visible to the naked eye was the heterogeneity of the samples in the size range selected (0.1–1mm). This was especially marked in the case of OS and GP, where two phases, a very thin powdery one and another phase with larger and harder sphere-shaped particles, were observed. An examination of their particle size distribution in Figure 6 shows that the raw OS and GP samples had a higher content of small particles whilst PINT presents a higher percentage of large ones. This lends support to the hypothesis of oxygen starvation as the more reactive fractions of both fuels react sooner, thereby consuming most of the oxidizing agent.

3.5. Chars Study

As previously mentioned, of the potential advantages of carrying out the gasification process at a mild temperature and in a steam-rich environment are the increase in the production of syngas and, at the same time, the possibility of reusing the partially oxidized chars through their thermal conversion, as sorbent or catalyst precursor, or even for soil amendment. To this end SEM and EDX analyses were carried out on three of the studied samples: a lignocellulosic sample, CHET (Figure 7a,b), a hard sample, OS (Figure 7c,d) and an intermediate sample, GP (Figure 7e,f).
SEM images were obtained at two different magnifications (×80 and ×300) to respectively identify the sample’s shape and general structure and to study its surface in more detail. A comparison of the images obtained at ×80 shows that in all three cases there are two kinds of particles: particles that have been almost totally oxidized that appear in clear color and particles that are much darker which are the ones more suitable for thermal conversion. This is confirmed by the EDX results, where it can be seen that the carbon composition ranges from 10%–15% in particles basically formed by elements like Si, Al, Ca, K and O in significant quantities, to 90% in OS, 80% in CHET or close to 75% in GP, all of which are high values that suggest an important remaining HHV. The presence of elements such as Ca and K together with a high N content is highly suitable for agricultural soil improvement [46]. In addition, K is also considered as a natural catalyst for biomass gasification in CO2 atmosphere, controlling it, together with external surface area at low conversion degree. On the other hand, at high conversion levels it is correlated with the catalytic index (CI) = (K + Ca + Mg + Na + Fe)/(Si + Al). [47].
With respect to the particle’s shape and surface it can be said that those of CHET present a much more heterogeneous structure with an undefined shape, where both porous and non-porous particles co-exist. This can be seen in detail in the image taken at ×300 (Figure 7b). In contrast, the GP sample consists mainly of spherical particles, with a large quantity of pores (Figure 7f). The OS sample seems to be intermediate between the previous two, with spherical and amorphous particles, with and without pores. To complement the SEM images, textural characterization was carried out and BET surface areas of 2, 27 and 132 m2/g for OS, CHET and GP, respectively, were determined. Due to this, GP with its high C content, specific surface and porous structure seems to be the most suitable char sample to use as a possible precursor to obtain sorbents or catalysts

4. Conclusions

The effect of certain operational variables, SR and S/A, during gasification of different types of biomass on product gas quality, composition and cold-gas-efficiency was evaluated. The results were used for the optimization of the low-temperature gasification of biomass in a purpose-built atmospheric bubbling fluidized bed reactor. It was found that the same gasification conditions do not affect every biomass in the same way, as its performance depends on its particular characteristics. In some cases, richer steam environments maximize the production of the syngas, whilst in other cases it is maximized in poorer environments, so gasification conditions must be carefully tested for each individual biomass. What can be taken as a general rule is that the total richness of syngas decreases as the SR increases.
The torrefaction process does not significantly improve gasification performance, by enhancing the richness of the syngas stream, but it increases the yield. The gas yield linearly increases with SR at approximately the same ratio for all samples. A higher S/A does not apparently affect this in any significant way. Cold gas efficiency (ηcold-gas) exhibits, in most cases, a second-order polynomial behavior in the range studied, with a maximum in the 0.2–0.3 range. This occurs in all cases for the 75/25 steam/air ratio. In a comparison of the fuel samples, OS and AS presented the highest syngas yield in the outlet gas, with values slightly over 35% at SR = 0.2 in both cases when gasified at the highest S/A tested (75/25). On the other hand, PINT cold-gas efficiency reached more than 1.5 L/gfuel at a SR higher than 0.2 for both the S/A tested. The OS sample presented efficiencies close to 50% in the SR range of 0.2–0.3 for a S/A ratio of 75/25. For the 50/50 S/A ratio the results are slightly lower, dropping to 35% in the same range as for AS and PINT. The char study has shown that the OS samples achieve C percentages of up to 90%. The other samples (CHET and GP) present particles with C mass content of over 75%, in addition to a porous structure and substantial surface areas, up to 132 m2/g in the case of GP. This indicates that they may be effective in other thermal conversion techniques, like combustion, or even as precursors for catalysts or sorbent manufacturing. The presence of nutrients such as N and K suggests that they could also play a positive role in soil amendment.

Acknowledgments

This work has received financial support from the Spanish MINECO (ENE2014-53515-P), cofinanced by the European Regional Development Fund (ERDF), and from the Gobierno del Principado de Asturias (PCTI-GRUPIN14-079). María Pilar González-Vázquez also acknowledges a fellowship awarded by the Spanish MINECO (FPI program), cofinanced by the European Social Fund.

Author Contributions

María Pilar González-Vázquez and Roberto García conducted experimental work, data analysis and calculations. María Pilar González-Vázquez, Roberto García, Covadonga Pevida and Fernando Rubiera discussed the results and contributed to the writing of the manuscript.

Conflicts of Interest

The authors declare no conflict of interest.

References

  1. European Commission. Communication from the Commission to the European Parliament and the Council; EC: London, UK, 2015. [Google Scholar]
  2. Pacesila, M.; Burcea, S.G.; Colesca, S.E. Analysis of renewable energies in European Union. Renew. Sustain. Energy Rev. 2016, 56, 156–170. [Google Scholar] [CrossRef]
  3. Bartolini, F.; Angelini, L.G.; Brunori, G.; Gava, O. Impacts of the CAP 2014–2020 on the agroenergy sector in Tuscany, Italy. Energies 2015, 8, 1058–1079. [Google Scholar] [CrossRef]
  4. International Energy Agency. Energy Policies of IEA Countries. 2015. Available online: http://www.iea.org/countries/membercountries/spain/ (accessed on 3 February 2017).
  5. Siedlecki, M.; de Jong, W.; Verkooijen, A.H.M. Fluidized bed gasification as a mature and reliable technology for the production of bio-syngas and applied in the production of liquid transportation fuels—A review. Energies 2011, 4, 389–434. [Google Scholar] [CrossRef]
  6. García, R.; Pizarro, C.; Lavín, A.G.; Bueno, J.L. Characterization of Spanish biomass wastes for energy use. Bioresour. Technol. 2012, 103, 249–258. [Google Scholar] [CrossRef] [PubMed]
  7. Hosseini, S.E.; Wahid, M.A. Hydrogen production from renewable and sustainable energy resources: Promising green energy carrier for clean development. Renew. Sustain. Energy Rev. 2016, 57, 850–866. [Google Scholar] [CrossRef]
  8. Mudhoo, A.; Kumar, S. Effects of heavy metals as stress factors on anaerobic digestion processes and biogas production from biomass. Int. J. Environ. Sci. Technol. 2013, 10, 1383–1398. [Google Scholar] [CrossRef]
  9. Wu, T.Y.; Hay, J.X.W.; Kong, L.B.; Juan, J.C.; Jahim, J.M. Recent advances in reuse of waste material as substrate to produce biohydrogen by purple non-sulfur (PNS) bacteria. Renew. Sustain. Energy Rev. 2012, 16, 3117–3122. [Google Scholar] [CrossRef]
  10. Meng, X.; de Jong, W.; Fu, N.; Verkooijen, A.H.M. Biomass gasification in a 100 kWth steam-oxygen blown circulating fluidized bed gasifier: Effects of operational conditions on product gas distribution and tar formation. Biomass Bioenergy 2011, 35, 2910–2924. [Google Scholar] [CrossRef]
  11. Kumar, A.; Jones, D.D.; Hanna, M.A. Thermochemical biomass gasification: A review of the current status of the technology. Energies 2009, 2, 556–581. [Google Scholar] [CrossRef]
  12. Alipour Moghadam, R.; Yusup, S.; Azlina, W.; Nehzati, S.; Tavasoli, A. Investigation on syngas production via biomass conversion through the integration of pyrolysis and air–steam gasification processes. Energy Convers. Manag. 2014, 87, 670–675. [Google Scholar] [CrossRef]
  13. Dudyński, M.; van Dyk, J.C.; Kwiatkowski, K.; Sosnowska, M. Biomass gasification: Influence of torrefaction on syngas production and tar formation. Fuel Process. Technol. 2015, 131, 203–212. [Google Scholar] [CrossRef]
  14. Wan Ab Karim Ghani, W.A.; Moghadam, R.A.; Mohd Salleh, M.A.; Alias, A.B. Air gasification of agricultural waste in a fluidized bed gasifier: Hydrogen production performance. Energies 2009, 2, 258–268. [Google Scholar] [CrossRef]
  15. Skoulou, V.; Koufodimos, G.; Samaras, Z.; Zabaniotou, A. Low temperature gasification of olive kernels in a 5-kW fluidized bed reactor for H2-rich producer gas. Int. J. Hydrog. Energy 2008, 33, 6515–6524. [Google Scholar] [CrossRef]
  16. Hernández, J.J.; Aranda, G.; Barba, J.; Mendoza, J.M. Effect of steam content in the air–steam flow on biomass entrained flow gasification. Fuel Process. Technol. 2012, 99, 43–55. [Google Scholar] [CrossRef]
  17. Balat, M.; Balat, M.; Kirtay, E.; Balat, H. Main routes for the thermo-conversion of biomass into fuels and chemicals. Part 2: Gasification systems. Energy Convers. Manag. 2009, 50, 3158–3168. [Google Scholar] [CrossRef]
  18. Haykiri-Acma, H.; Yaman, S. Interpretation of biomass gasification yields regarding temperature intervals under nitrogen–steam atmosphere. Fuel Process. Technol. 2007, 88, 417–425. [Google Scholar] [CrossRef]
  19. Sharma, A.M.; Kumar, A.; Huhnke, R.L. Effect of steam injection location on syngas obtained from an air–steam gasifier. Fuel 2014, 116, 388–394. [Google Scholar] [CrossRef]
  20. Guizani, C.; Jeguirim, M.; Gadiou, R.; Escudero Sanz, F.J.; Salvador, S. Biomass char gasification by H2O, CO2 and their mixture: Evolution of chemical, textural and structural properties of the chars. Energy 2016, 112, 133–145. [Google Scholar] [CrossRef]
  21. Kuo, P.-C.; Wu, W.; Chen, W.-H. Gasification performances of raw and torrefied biomass in a downdraft fixed bed gasifier using thermodynamic analysis. Fuel 2014, 117, 1231–1241. [Google Scholar] [CrossRef]
  22. Chen, W.H.; Chen, C.J.; Hung, C.I.; Shen, C.H.; Hsu, H.W. A comparison of gasification phenomena among raw biomass, torrefied biomass and coal in an entrained-flow reactor. Appl. Energy 2013, 112, 421–430. [Google Scholar] [CrossRef]
  23. Zaccariello, L.; Mastellone, M.L. Fluidized-bed gasification of plastic waste, wood, and their blends with coal. Energies 2015, 8, 8052–8068. [Google Scholar] [CrossRef]
  24. Makwana, J.P.; Joshi, A.K.; Athawale, G.; Singh, D.; Mohanty, P. Air gasification of rice husk in bubbling fluidized bed reactor with bed heating by conventional charcoal. Bioresour. Technol. 2015, 178, 45–52. [Google Scholar] [CrossRef] [PubMed]
  25. Rapagnà, S.; Latif, A. Steam gasification of almond shells in a fluidised bed reactor: The influence of temperature and particle size on product yield and distribution. Biomass Bioenergy 1997, 12, 281–288. [Google Scholar] [CrossRef]
  26. Kulkarni, A.; Baker, R.; Abdoulmomine, N.; Adhikari, S.; Bhavnani, S. Experimental study of torrefied pine as a gasification fuel using a bubbling fluidized bed gasifier. Renew. Energy 2016, 93, 460–468. [Google Scholar] [CrossRef]
  27. Mohd Salleh, M.A.; Kisiki, N.H.; Yusuf, H.M.; Ab Karim Ghani, W.A.W. Gasification of Biochar from Empty Fruit Bunch in a Fluidized Bed Reactor. Energies 2010, 3, 1344–1352. [Google Scholar] [CrossRef]
  28. Pinto, F.; André, R.N.; Carolino, C.; Miranda, M.; Abelha, P.; Direito, D.; Dohrup, J.; Sørensen, H.R.; Girio, F. Effects of experimental conditions and of addition of natural minerals on syngas production from lignin by oxy-gasification: Comparison of bench- and pilot scale gasification. Fuel 2015, 140, 62–72. [Google Scholar] [CrossRef]
  29. Gil, J.; Corella, J.; Aznar, M.P.; Caballero, M.A. Biomass gasification in atmospheric and bubbling fluidized bed: Effect of the type of gasifying agent on the product distribution. Biomass Bioenergy 1999, 17, 389–403. [Google Scholar] [CrossRef]
  30. Lim, Y.; Lee, U.-D. Quasi-equilibrium thermodynamic model with empirical equations for air–steam biomass gasification in fluidized-beds. Fuel Process. Technol. 2014, 128, 199–210. [Google Scholar] [CrossRef]
  31. Gucho, E.M.; Shahzad, K.; Bramer, E.A.; Akhtar, N.A.; Brem, G. Experimental study on dry torrefaction of beech wood and miscanthus. Energies 2015, 8, 3903–3923. [Google Scholar] [CrossRef]
  32. Chen, W.-H.; Lu, K.-M.; Tsai, C.-M. An experimental analysis on property and structure variations of agricultural wastes undergoing torrefaction. Appl. Energy 2012, 100, 318–325. [Google Scholar] [CrossRef]
  33. Chew, J.J.; Doshi, V. Recent advances in biomass pretreatment—Torrefaction fundamentals and technology. Renew. Sustain. Energy Rev. 2011, 15, 4212–4222. [Google Scholar] [CrossRef]
  34. Arias, B.; Pevida, C.; Fermoso, J.; Plaza, M.G.; Rubiera, F.; Pis, J.J. Influence of torrefaction on the grindability and reactivity of woody biomass. Fuel Process. Technol. 2008, 89, 169–175. [Google Scholar] [CrossRef]
  35. Tapasvi, D.; Khalil, R.; Skreiberg, Ø.; Tran, K.Q.; Grønli, M. Torrefaction of Norwegian birch and spruce: An experimental study using macro-TGA. Energy Fuels 2012, 26, 5232–5240. [Google Scholar] [CrossRef]
  36. Chen, W.-H.; Kuo, P.-C. A study on torrefaction of various biomass materials and its impact on lignocellulosic structure simulated by a thermogravimetry. Energy 2010, 35, 2580–2586. [Google Scholar] [CrossRef]
  37. Gil, M.V.; García, R.; Pevida, C.; Rubiera, F. Grindability and combustion behavior of coal and torrefied biomass blends. Bioresour. Technol. 2015, 191, 205–212. [Google Scholar] [CrossRef] [PubMed]
  38. Narváez, I.; Orío, A.; Aznar, M.P.; Corella, J. Biomass gasification with air in an atmospheric bubbling fluidized bed. Ind. Eng. Chem. Res. 1996, 35, 2110–2120. [Google Scholar] [CrossRef]
  39. Telmo, C.; Lousada, J.; Moreira, N. Proximate analysis, backwards stepwise regression between gross calorific value, ultimate and chemical analysis of wood. Bioresour. Technol. 2010, 101, 3808–3815. [Google Scholar] [CrossRef] [PubMed]
  40. Obernberger, I.; Brunner, T.; Bärnthaler, G. Chemical properties of solid biofuels—Significance and impact. Biomass Bioenergy 2006, 30, 973–982. [Google Scholar] [CrossRef]
  41. Xiao, R.; Zhang, M.; Jin, B.; Huang, Y.; Zhou, H. High-temperature air/steam-blown gasification of coal in a pressurized spout-fluid bed. Energy Fuels 2006, 20, 715–720. [Google Scholar] [CrossRef]
  42. Weiland, F.; Nordwaeger, M.; Olofsson, I.; Wiinikka, H.; Nordin, A. Entrained flow gasification of torrefied wood residues. Fuel Process. Technol. 2014, 125, 51–58. [Google Scholar] [CrossRef]
  43. Qian, K.; Kumar, A.; Patil, K.; Bellmer, D.; Wang, D.; Yuan, W.; Huhnke, R.L. Effects of biomass feedstocks and gasification conditions on the physiochemical properties of char. Energies 2013, 6, 3972–3986. [Google Scholar] [CrossRef]
  44. Gómez-Barea, A.; Arjona, R.; Ollero, P. Pilot-plant gasification of olive stone: A technical assessment. Energy Fuels 2005, 19, 598–605. [Google Scholar] [CrossRef]
  45. De Micco, G.; Fouga, G.G.; Bohé, A.E. Coal gasification studies applied to H2 production. Int. J. Hydrogen Energy 2010, 35, 6012–6018. [Google Scholar] [CrossRef]
  46. Zambon, I.; Colosimo, F.; Monarca, D.; Cecchini, M.; Gallucci, F.; Proto, A.; Lord, R.; Colantoni, A. An innovative agro-forestry supply chain for residual biomass: Physicochemical characterisation of biochar from olive and hazelnut pellets. Energies 2016, 9, 526. [Google Scholar] [CrossRef] [Green Version]
  47. Bouraoui, Z.; Jeguirim, M.; Guizani, C.; Limousy, L.; Dupont, C.; Gadiou, R. Thermogravimetric study on the influence of structural, textural and chemical properties of biomass chars on CO2 gasification reactivity. Energy 2015, 88, 703–710. [Google Scholar] [CrossRef]
Figure 1. Photograph of the gasification plant with its main components.
Energies 10 00306 g001
Figure 2. Gas yield and HHV of the gas obtained for PIN at different steam/air ratios.
Energies 10 00306 g002
Figure 3. Comparison of the obtained results (H2 + CO emissions, gas yield (Lgas/gfuel) and cold-gas efficiency (%)) at the selected steam/air ratios (50/50 and 75/25) vs. SR.
Energies 10 00306 g003
Figure 4. Results of the syngas composition (a) (CO + H2), (b) gas yield and (c) cold-gas efficiency of the biomass mixtures.
Energies 10 00306 g004
Figure 5. Combustion profiles, expressed as the derivative thermogravimetric (DTG) of the samples.
Energies 10 00306 g005
Figure 6. Cumulative particle size distribution of the biomass samples used for mixtures.
Energies 10 00306 g006
Figure 7. SEM images of (a,b) CHET; (c,d) OS and (e,f) GP chars at ×80 and ×300 magnifications.
Energies 10 00306 g007
Table 1. Proximate and ultimate analyses, high heating value (HHV) and bulk density of the studied samples.
SamplesUltimate Analysis
(wt %, db)
Proximate Analysis
(wt %, db)
HHV
(MJ/kg, db)
BD
(kg/m3)
CNHSOAshVM *FC
CHE50.20.35.60.0143.40.581.218.319.1296
CHET51.30.45.40.0242.60.380.019.719.6374
PIN51.00.36.00.0242.20.485.114.519.9226
PINT56.10.45.70.0137.40.577.122.422.0265
AS49.40.35.90.0542.91.578.919.619.6655
OS51.20.36.00.0341.90.681.517.920.5781
GP45.51.85.10.1734.712.767.619.718.7772
OP49.41.65.40.1237.46.272.521.320.3772
CS48.02.75.90.2135.37.970.421.719.1490
* VM = volatile matter; FC: fixed carbon; db: dry basis.
Table 2. Gaseous emissions (vol. %) and HHV (in MJ/Nm3) obtained for the studied samples.
Samples50% Steam-50% Air (v/v) 75% Steam-25% Air (v/v)
SRSBRCOCH4H2HHV SRSBRCOCH4H2HHV
CHE 0.11.111.42.48.93.5
0.20.711.13.89.04.1 0.22.26.92.26.02.5
0.31.18.22.96.83.0 0.33.24.31.63.41.6
0.41.45.71.54.01.8 0.44.33.70.50.40.7
CHET0.150.514.44.510.34.9 0.11.110.93.414.04.5
0.20.712.63.99.24.3 0.22.29.42.89.53.5
0.31.19.52.96.93.2 0.33.35.91.76.02.2
0.41.55.51.43.31.7 0.44.42.60.51.40.7
PIN 0.151.115.45.414.66.0
0.240.613.44.110.64.7 0.21.513.44.613.05.2
0.30.810.52.99.13.6 0.32.310.03.210.33.8
0.41.07.21.66.32.4 0.43.07.72.28.32.9
PINT0.150.618.56.211.96.3 0.11.221.05.318.27.1
0.20.814.44.99.95.1 0.22.311.94.413.65.0
0.31.210.13.67.53.7 0.33.59.43.111.33.9
0.41.67.21.75.42.3 0.44.77.92.25.82.6
AS0.10.219.711.112.58.5 0.10.716.16.120.17.0
0.20.514.38.610.36.5 0.21.413.35.117.45.9
0.30.711.26.78.55.2 0.32.210.43.514.24.5
0.41.09.35.07.14.1 0.42.97.62.510.83.3
OS0.10.325.05.312.06.8 0.10.823.58.918.78.9
0.20.518.65.39.75.7 0.21.517.06.416.46.8
0.30.814.54.78.14.7 0.32.314.25.014.05.6
0.41.012.24.47.14.2 0.43.110.64.111.54.5
GP0.10.311.16.712.05.6 0.10.99.26.314.45.5
0.20.67.94.59.44.0 0.21.86.84.310.23.9
0.30.95.83.36.52.9 0.32.85.42.77.02.7
0.41.23.61.62.71.5
OP0.10.312.56.311.95.6 0.11.012.05.213.95.4
0.20.78.64.57.73.9 0.151.69.94.012.94.5
0.31.16.43.24.82.7 0.33.25.01.23.21.5
0.41.46.22.33.62.1
CS0.10.36.73.75.93.1 0.11.18.35.514.15.0
0.20.76.02.34.62.3 0.151.66.74.312.24.1
0.31.15.51.63.61.8 0.22.14.73.08.42.8
0.41.44.81.42.91.6 0.33.22.82.04.81.8

