Article

Fundamental Analysis of Thermal Overload in Diesel Engines: Hypothesis and Validation

by
Sangram Kishore Nanda
1,2,
Boru Jia
2,*,
Andrew Smallbone
2 and
Anthony Paul Roskilly
2
1
Services Switzerland Ltd., CH-8401 Winterthur, Switzerland
2
Sir Joseph Swan Centre for Energy Research, Newcastle University, Newcastle upon Tyne NE1 7RU, UK
*
Author to whom correspondence should be addressed.
Energies 2017, 10(3), 329; https://doi.org/10.3390/en10030329
Submission received: 3 January 2017 / Accepted: 2 March 2017 / Published: 8 March 2017
(This article belongs to the Special Issue Internal Combustion Engines 2017)

Abstract

:
‘Thermal Overload’ can be defined as a condition under which design threshold values such as the surface temperature of combustion chamber components is exceeded. In this paper, a low λ value is identified as the most probable cause of voluminous flame production, resulting in high surface temperatures of engine components, i.e., engine thermal overload. Test results indicated that the flame became voluminous when the excess air ratio, λ was low, and the exhaust temperature increased from 775 to 1000 °C with λ changing from 1.12 to 0.71. Temperature indicating paints were applied on two piston crowns to investigate the effect of the voluminous flame on component surface temperature. The piston crown with high rates of hot corrosion was very close to matt glaze (much in excess of the design temperature), which proved that high surface temperature and salt deposition on the crown in the heavily burned away regions could have been caused by flame and fuel impingement, respectively. A numerical calculation was presented to estimate the flame temperature for various air excess ratio, which provides a guidance for the operation conditions of diesel engines to avoid engine thermal fatigue due to thermal overload.

1. Introduction

In the last couple of decades, the power output from slow speed diesel engines has increased steadily to meet the high propulsion power demand of large container vessels. This has motivated engine makers to increase the power density (output per cylinder) up to 5800 kW (Wärtsilä–Sulzer RTA96-C Common Rail marine compression-ignition engine) and reduce the specific weight from 55 to 30 kg/kW with the use of new materials and modern design tools [1]. This has resulted in more power from the same bore size and number of cylinders for an engine family. Other key drivers for engine development are low specific fuel oil consumption, which influences the direct operating costs of a ship, and environmental legislation limiting the level of harmful pollutants from diesel engines [2,3,4,5,6]. Rising fuel prices and enforcement of the legislation limiting the NOx and SOx from marine diesel engines have made these drivers more important [7,8,9,10]. A reduction in the fuel consumption can be achieved by running the cylinder hotter, operating closer to stoichiometric conditions where cycle temperatures are higher, and increasing the volume expansion ratio to extract more work for a fixed heat input. This is achieved during the engine optimisation with near uniform air to fuel ratio across the combustion chamber but at the expense of a smaller safety margin between normal operation and thermal overload for continuous service rating.
‘Thermal Overload’ can be defined as a condition under which design threshold values such as surface temperature of combustion chamber components is exceeded. The consequence is a reduction in operating life of the component or catastrophic failure depending on the extent of overload. Combustion chamber components such as the cylinder head, exhaust valve, cylinder liner and pistons are made of materials that meet the necessary design objectives such as good tribological properties for the cylinder liner and high hot corrosion resistance of exhaust valves on heavy fuel oil burning engines. A predictive trend establishing the deterioration of engine health due to normal wear and tear in components is acceptable provided corrective action is undertaken with preventive maintenance or condition monitoring to minimise loss of performance. If the necessary preventive maintenance or health monitoring of components taking part in the combustion or gas exchange process is not carried out, it could lead to a thermal overload condition.
The type of material used and the rate of heat removal are two of the many other factors that limit the operating temperature of a component. For a cylinder liner made of pearlitic grey cast iron with good tribological properties, the surface temperature should be limited to 370 °C to prevent ‘heat cracks’ from allotropic expansion of the material [11]. Therefore, to increase engine power, the design constraint is taken care of in present day diesel engines with a deep cylinder cover, which means only a negligible proportion of the cylinder liner is exposed to the combustion process. The cylinder cover is made of cast steel which can withstand higher temperatures. The piston crown is made of forged chrome molybdenum steel without any form of cladding and can sustain relatively high surface temperatures but has very poor corrosion resistance to vanadate salts deposited on it as part of the combustion process. It is one of two combustion chamber components that is cooled intermittently, in addition to constant underside cooling, by cold scavenge air during the gas exchange process. If it is expected that the surface temperature will be above the design threshold due to high heal flux then a cladding with high corrosion resistance and low thermal conductivity needs to be applied. Another component that is subjected to the most arduous conditions is the exhaust valve spindle that is cooled intermittently by the scavenge air and its contact with the valve seat. It is made of Nimonic, which offers greater resistance against hot corrosion.
To date, there has been research into the solutions to the thermal overload in the cylinder head of a heavy duty 6-cylinder diesel engine, in which thermal cracks were found in the valve-bridge [12]. The temperature of the cylinder head bottom was measured, the flow distribution of coolant through the upper nozzles of the cylinder head bottom was tested, and the water jacket of the cylinder head was inquired. A 3D model was developed to simulate the water jacket performance in the worst cooling conditions. Four designs of water jacket were proposed and simulated, and all these schemes showed improvement in the flow field of the water jacket. From the test results, the maximum temperature in the value bridge of the cylinder head was reduced by 9.2 °C, and the temperature gradient reduction was 19.55%, indicating that the proposed designs reduced the thermal stress of the diesel engine cylinder head [12].
Engine pistons were regarded as an important part of an engine, and new geometries, materials, and manufacturing techniques are always being proposed for pistons [13]. Notwithstanding these studies, a huge number of damaged pistons were reported, among which thermal fatigue and mechanical fatigue played an important role and was analysed by Silva. Stresses at the piston crown and pin holes, as well as stresses at the grooves and skirt as a function of land clearances were presented. Thermal fatigue cracks were easy to identify as some visible fatigue cracks on the areas with cyclic thermal gradients could be seen on brake disks and other components. Two reasons were considered through which thermal gradients act on stressed, i.e., vertical distribution of the temperature along the piston, and temperature difference at the head of the piston due to the flow of the hot air or fuel impingement [13].
An experimental and analytical approach was undertaken by Lee et al. to study stress distributions and causes of failure in diesel cylinder heads [14]. The influence of thermal shock loading under rapid transients was analysed, and the steady state temperature gradients and the level of temperatures were reported as the primary causes of thermal fatigue in cast-iron cylinder heads [14]. They also provided a finite element analysis to predict the detailed temperature and stress distributions within the cylinder head, and validated the model using measurements. These works attributed thermal shock loading as playing a role in thermal fatigue, along with steady-state temperature gradients and the level of temperatures [14].
In order to protect the structural engineering materials of engines from corrosion, erosion, and wear, thermal barrier coating technologies have been proposed and investigated [15,16,17,18,19]. Different types of coating were used to provide engine lubrication and thermal insulation, as they could insulate engine components from the hot gas stream, which improved the engine durability [16,17]. However, very little evidence has been published that considers the probable causes of the thermal overload that will cause thermal fatigue from the engine side. None of them addressed the suggestions of diesel engine operation conditions in order to avoid the engine thermal overload.
In this paper, the hypothesis for the most probable causes of thermal overload of diesel engines is discussed and validated. Low λ value is identified as the most probable cause of voluminous flame production, resulting in a high surface temperature of engine components, i.e., engine thermal overload. After the probable cause of the engine thermal overload is identified, a numerical calculation will be presented to estimate the flame temperature for various air excess ratio, which will provide guidance for the operation conditions of diesel engines to avoid engine thermal fatigue due to thermal overload.

2. Fundamental Analysis

2.1. Diesel Engine Combustion

In a conventional diesel combustion process, fuel is injected into high-temperature air at the end of the compression process followed by auto ignition and heat release. After an injection event, the process can be identified on a pressure versus crank angle diagram as four distinct phases: ignition delay period, rapid combustion phase, mixing controlled combustion phase and late combustion phase [20,21,22]. The duration and pressure profile for each of these phases depends on the quality of fuel, fuel injection timing (fixed or variable), spray pattern, spatial distribution of fuel in the combustion space and local air-to-fuel ratio. As the fuel is injected, its lower molecular weight fractions will be dragged by the swirling air towards the periphery of the chamber, while the heavier fractions stay at the core. The spray may be divided into four regions: lean flame region (LFR), lean flame out region (LFOR), spray core and spray tail [23].
LFR is the concentration of vapour between the core and downstream edge of the spray and is not homogeneous in 3D space. In this region, combustion is complete and nitrogen oxides (NO, NO2) are formed in higher local concentrations. Locally, LFOR is near the far downstream edge of the spray, and the mixture is too lean to ignite or support continuous combustion. Following the ignition and combustion in the LFR, the flame propagates towards the core of the spray. In this region, the fuel droplets are larger. They gain heat by radiation from the already established flames and evaporate at a higher rate. The spray tail is the last part of the spray to be injected and usually forms large droplets due to relatively small pressure differential acting on the fuel near the end of the injection process. This region is not responsible for NOx formation but is responsible for formation of unburned hydrocarbons (UHC) and soot [23].

2.2. Hypothesis for the Most Probable Cause of Thermal Overload

The surface temperature of each component will be governed by conservation of energy i.e., the net heat input and output from the material. If the heat input is equal to the output, a steady state surface temperature will ultimately result; however, an increase or decrease in either will result in a change of the surface temperature of the material. It has been observed that when combustion takes place in diffusion flames that there is an increase in flame size when the air has diluted concentrations of oxygen. A blue flame (gas–gas phase reaction) is observed in the area close to the injection nozzle, which, correspondingly, becomes larger as the oxygen concentrations are decreased. As a result, a larger flame volume could result in greater flame/wall interaction and thus an increase in the wall temperatures. Then, the hypothesis for the most probable cause of thermal overload condition on diesel engines is summarised as:
  • Low λ value is the most probable cause of voluminous flame production.
  • High surface temperature of engine components due to a more voluminous flame.
To validate the two elements of the hypothesis above, experiments were undertaken to investigate the effect of λ value on flame size and its temperature to validate the hypothesis (1), and the effect of voluminous flame on component surface temperature to validate the hypothesis (2).

3. Hypothesis Validation and Discussion

3.1. Effect of λ on Flame Size and Temperature

Combustion in this test rig was therefore used to simulate uniflow scavenged two-stroke diesel engine combustion, with the trapped air to fuel ratio indicating conditions in the primary chamber and overall air to fuel ratio indicating conditions across the combustor. A flame visualisation test rig was designed and manufactured using a pair of inter-connected combustion chambers of 456 × 76 × 76 mm and 228 × 170 × 76 mm (shown in Figure 1). The primary combustion chamber operated with a rich fuel/air ratio and, therefore, yielded a mixture of combustion products with excess carbon monoxide and unburned hydrocarbon. The secondary combustion chamber was designed to use the products of combustion from the primary chamber and was supplied with additional air to burn all of the carbon monoxide to carbon dioxide.
Prior to a test, the combustion chambers were preheated with 200 °C air for a minimum period of 30 min or until the exhaust gas temperature reached a steady 60 °C. A K-type thermocouple is used to measure the exhaust gas temperature. Two exhaust gas sampling points were selected, between the primary and secondary combustion chambers and after the secondary combustion chamber (as shown in Figure 1). A section of the exhaust sampling line was kept heated with a line heater. The sample line was divided into three branches, one branch leading to a UHC analyser, a second branch to a NOx analyser and the third to CO2, CO and O2 analysers via a gas conditioning unit. The ignitor was then switched on and the master fuel valve, upstream of the burner, opened to commence firing. On initiation of combustion, the ignitor was switched off and after a short overlap, the flame was allowed to stabilise for a period of 20 min. At the same time, all other parameters were kept constant except for the fuel flow rate, which was reduced gradually to prevent soot formation. The test rig was allowed to stabilise for an additional 15 min at each test point before any reading were recorded.
Fuel rich conditions in the primary combustion chamber were achieved either by keeping the air flow rate constant while increasing the fuel flow rate or vice versa. The former provided the best approach as the flow pattern through the combustion chamber remained constant while the fuel/air ratio value was changing. During the course of initial testing with constant air flow rate and increasing fuel concentrations, it was observed that the flame lift off distance from the burner increased and the observable flame became more voluminous. From the experimentation, carbon monoxide was found to form even at slightly lean conditions (λ = 1.2). Tests were carried out to achieve fuel rich levels down to λ = 0.65, but, at λ = 0.7, a critical point, the flame became unstable due to a longer ignition delay and lift off distance from the burner. This resulted in the termination of combustion with any further reduction in λ. Based on this finding, tests were carried out at λ = 0.7 and above.
Figure 1 can be used to explain the structure of the flame at different λ . The primary combustion chamber was considered to represent the in-cylinder element of a diesel engine and the location of the exhaust temperature probe at the outlet as the position of any critical combustion chamber components, such as the piston crown or cylinder liner. If the fuel rate is increased at constant air mass flow rate or vice versa, λ will decrease and the adiabatic flame temperature is supposed to decrease, as the total energy from the fuel is not released due to only partial oxidation of the hydrocarbons. However, as the combustion reaction slows down, the flame becomes voluminous. The value of λ is calculated with the air mass flow and fuel rate. An indication that this has occurred will be an increase in exhaust temperature at the outlet probe as a result of closer proximity of the flame. As shown in Figure 2, the temperature at the probe increased from 775 to 1000 °C with λ changing from 1.12 to 0.71. This high temperature flame when close to or in contact with any combustion chamber component will result in an increased rate of heat transfer through the component and its consequent failure.

3.2. Effect of Voluminous Flame on Component Surface Temperature

To validate the hypothesis that a voluminous flame is the most probable cause of high surface temperatures on the piston crowns, an experiment was set up on two piston crowns with the application of temperature indicating paints. The thermal paint, named code MC277-7, with an initial colour of yellow giving a quantitative estimate of peak piston crown surface temperatures. Colour change takes place when the material surface temperature is sustained for more than 10 min, which was suitable for this application since it was not required to measure short-term flame impingement. Table 1 shows the temperature in °C for each colour change as a function of time. There is no benchmark for this technique on slow speed diesel engines as it was probably used for the first time for this type of application.
Piston crown temperature estimation was carried out on a Sulzer RTA 84 T engine (Wärtsilä Sulzer, Cranford, NJ, USA), where high rates of hot corrosion were evident on a unit and also on a unit where piston crown wear rates were normal (Figure 3a). The specifications of the selected Sulzer engine is listed in Table 2. The ambient pressure is 1.025 bar, and the pressure ratio of the compressor is 1.7. For the thermal paint crown trials, the engine load was increased over a period of 2 h to 75% followed by 30 min operation at 95% with a new piston crown fitted in each case. This was to make sure that the piston cooling oil bores were clean and any excessive temperature could not be attributed to piston crown cooling inefficiency. The trapped lambda values during experiments on the engine were between 1.6 and 2.0 with an overall lambda value of 3.2. The measured values would co-relate to 0.9–1.2 on a continuous combustion rig as diesel engine combustion is heterogeneous, heavily dependent on air fuel ratio distribution in a relatively large combustion chamber. Design trapped lambda value is in the range of 2–2.2. The compression pressure was around 110 bar at the start of fuel injection and maximum pressure was around 130–135 bar. The high pressure makes the flame compact, but the relative expansion of flame with lower lambda values is consistent.
Figure 3b shows that the colour shades on completion of the trial on the piston crown with the highest wear rate, which are very close to matt glaze and the surface temperatures around the hot zone, are probably much in excess of the design temperature. A comparison of the thermal paint results for the best and worst crown (Figure 3a,b) shows that the latter with normal wear rate has a dusty grey shade with yellowish tinge at places. If we apply a 2 h correction to the change from dusty grey to yellow, the temperature would be considered to be in the vicinity of 435 °C. The test results demonstrate that a high surface temperature and salt deposition on the crown in the heavily burned away regions could have been caused by flame and fuel impingement, respectively. As in an ideal scenario, the flame should be compact and should not come in contact with the piston crown or exhaust valve.

4. Estimation of Flame Temperature with Different λ Values

In the previous section, it has been identified that a voluminous flame in the vicinity of combustion chamber components will result in high thermal stress as a function of the flame temperature. Meanwhile, voluminous flame production at low oxygen concentration. It is necessary to estimate the flame temperature for various λ values to identify the scale of the problem.
Calculations were made for a steady flow constant pressure combustion chamber operating on gas oil to estimate the adiabatic flame temperature and residual oxygen volume in the exhaust gas products. The fuel combustion is assumed to be complete, and the products will be CO2, H2O and N2. The classic combustion equation, where a is the excess air coefficient is given by:
C12H26 + 18.5a [O2 + 3.76N2] = bCO2 + cH2O + dO2 + 69.56aN2.
An elemental balance of the reactants and products returns the following molar volumes of the products of combustion, i.e., b = 12, c = 13, d = 18.5 × (a − 1).
From classical thermodynamics and the first law of a differential form of the general energy equation for a control volume (CV) can be obtained in molar terms:
d E d t = Q ˙ W ˙ + i n N ˙ i e i o u t N ˙ j e j   ,
where E is the total CV system energy; Q ˙ is the rate of heat transfer to/from the CV; W ˙ is rate of work transfer to/from the CV; N ˙ i is the molar flow rate of material into the CV; N ˙ j is the molar flow rate of material out of the CV; e i is the intensive total energy per unit mole of material into the CV; and e j is the intensive total energy per unit mole of material out of the CV.
If all the properties within the CV, as well as those transferred across the CV boundary, do not change with time (steady state and steady flow), then the rate of change of energy must remain constant. Therefore,
d E d t = 0
and
Q ˙ W ˙ = i n N ˙ i e i o u t N ˙ j e j   .
Considering the adiabatic combustion (at constant pressure), the enthalpy of reactants will be equal to the enthalpy of products which results in an increase of temperature of products:
i n N ˙ i e i = o u t N ˙ j e j   .
The intensive total energy e i into the CV is the sum of potential, kinetic, internal and chemical potential energy. In the combustion process, the kinetic and potential energy will be negligible compared to the internal and chemical potential energy; therefore, the total energy E i , into the CV system can be written as:
E i = N i ( u i + h f 0 ¯ ) = N j ( h i T R T + h f i 0 ¯ )   ,
where h f 0 is the heat of formation and h i T is the enthalpy at T (in kelvin).
As the general energy equation equates the heat and work transfer rates to changes in energy levels of materials that undergo state changes, it is the difference between the energy terms that is of interest. Returning to the assumption that combustion takes place at constant pressure, an enthalpy balance of the products and reactants can be used to calculate the temperature of the flame in the cylinder for different values of λ. Therefore, equation above becomes:
j p r o d N j [ h f 0 + { h T j h T 0 } ] j = j r e a c t N i [ h f 0 + { h T i h T 0 } ] i   ,
where T 0 is the thermodynamic reference temperature of 298 K.
Re-writing the above equation in terms of the products gives:
j p r o d N j h j = 12 [ h f 0 + Δ h T 4 ] C O 2 + 13 [ h f 0 + Δ h T 4 ] H 2 O + 18.5 ( a 1 ) [ h f 0 + Δ h T 4 ] O 2 + 69.56 a [ h f 0 + Δ h T 4 ] N 2   .
Re-writing the above equation in terms of the reactants gives:
i r e a c t N i h i = 1 [ h f 0 + Δ h T f ] C 12 H 26 + 18.5 [ h f 0 + Δ h T 3 ] O 2 + 69.56 a 13 [ h f 0 + Δ h T 3 ] N 2 ,
where T f is the temperature of the fuel; T 3 is the temperature at the start of constant pressure combustion process; and T 4 is the temperature at the end of constant pressure combustion process.
The use of enthalpy balance to calculate the flame temperature at fixed λ can be best understood with the following example in which combustion is assumed to take place under stoichiometric conditions, i.e., a = 1, and inlet air temperature is 400 K with a corresponding pressure of 1.46 bar. The general combustion equation can be rewritten as:
C12H26 + 18.5[O2 + 3.76N2] = 12CO2 + 13H2O + 69.56N2 .
Using the enthalpy balance equation and the JANAF (Joint Army-Navy-Air Force) thermo-chemical tables, gives:
j p r o d N j h j = 12 [ 94054 + Δ h T 4 ] C O 2 + 13 [ 57798 + Δ h T 4 ] H 2 O + 69.56 [ 0 + Δ h T 4 ] N 2   ,
i r e a c t N i h i = 1 [ 85370 + 0 ] C 12 H 26 + 18.5 [ 0 + 724 ] O 2 + 69.5613 [ 0 + 710 ] N 2   .
The above two equations gives:
12 [ Δ h T 4 ] C O 2 + 13 [ Δ h T 4 ] H 2 O + 69.56 [ Δ h T 4 ] N 2 = 1857433  kcal  .
The temperature of products from the equation above can be obtained by iteration is equal to 2530 K. Calculation code was written in Matlab software (The MathWorks, Inc., Natick, MA, USA) and used to derive temperatures for a range of λ values at different amount of air preheat.
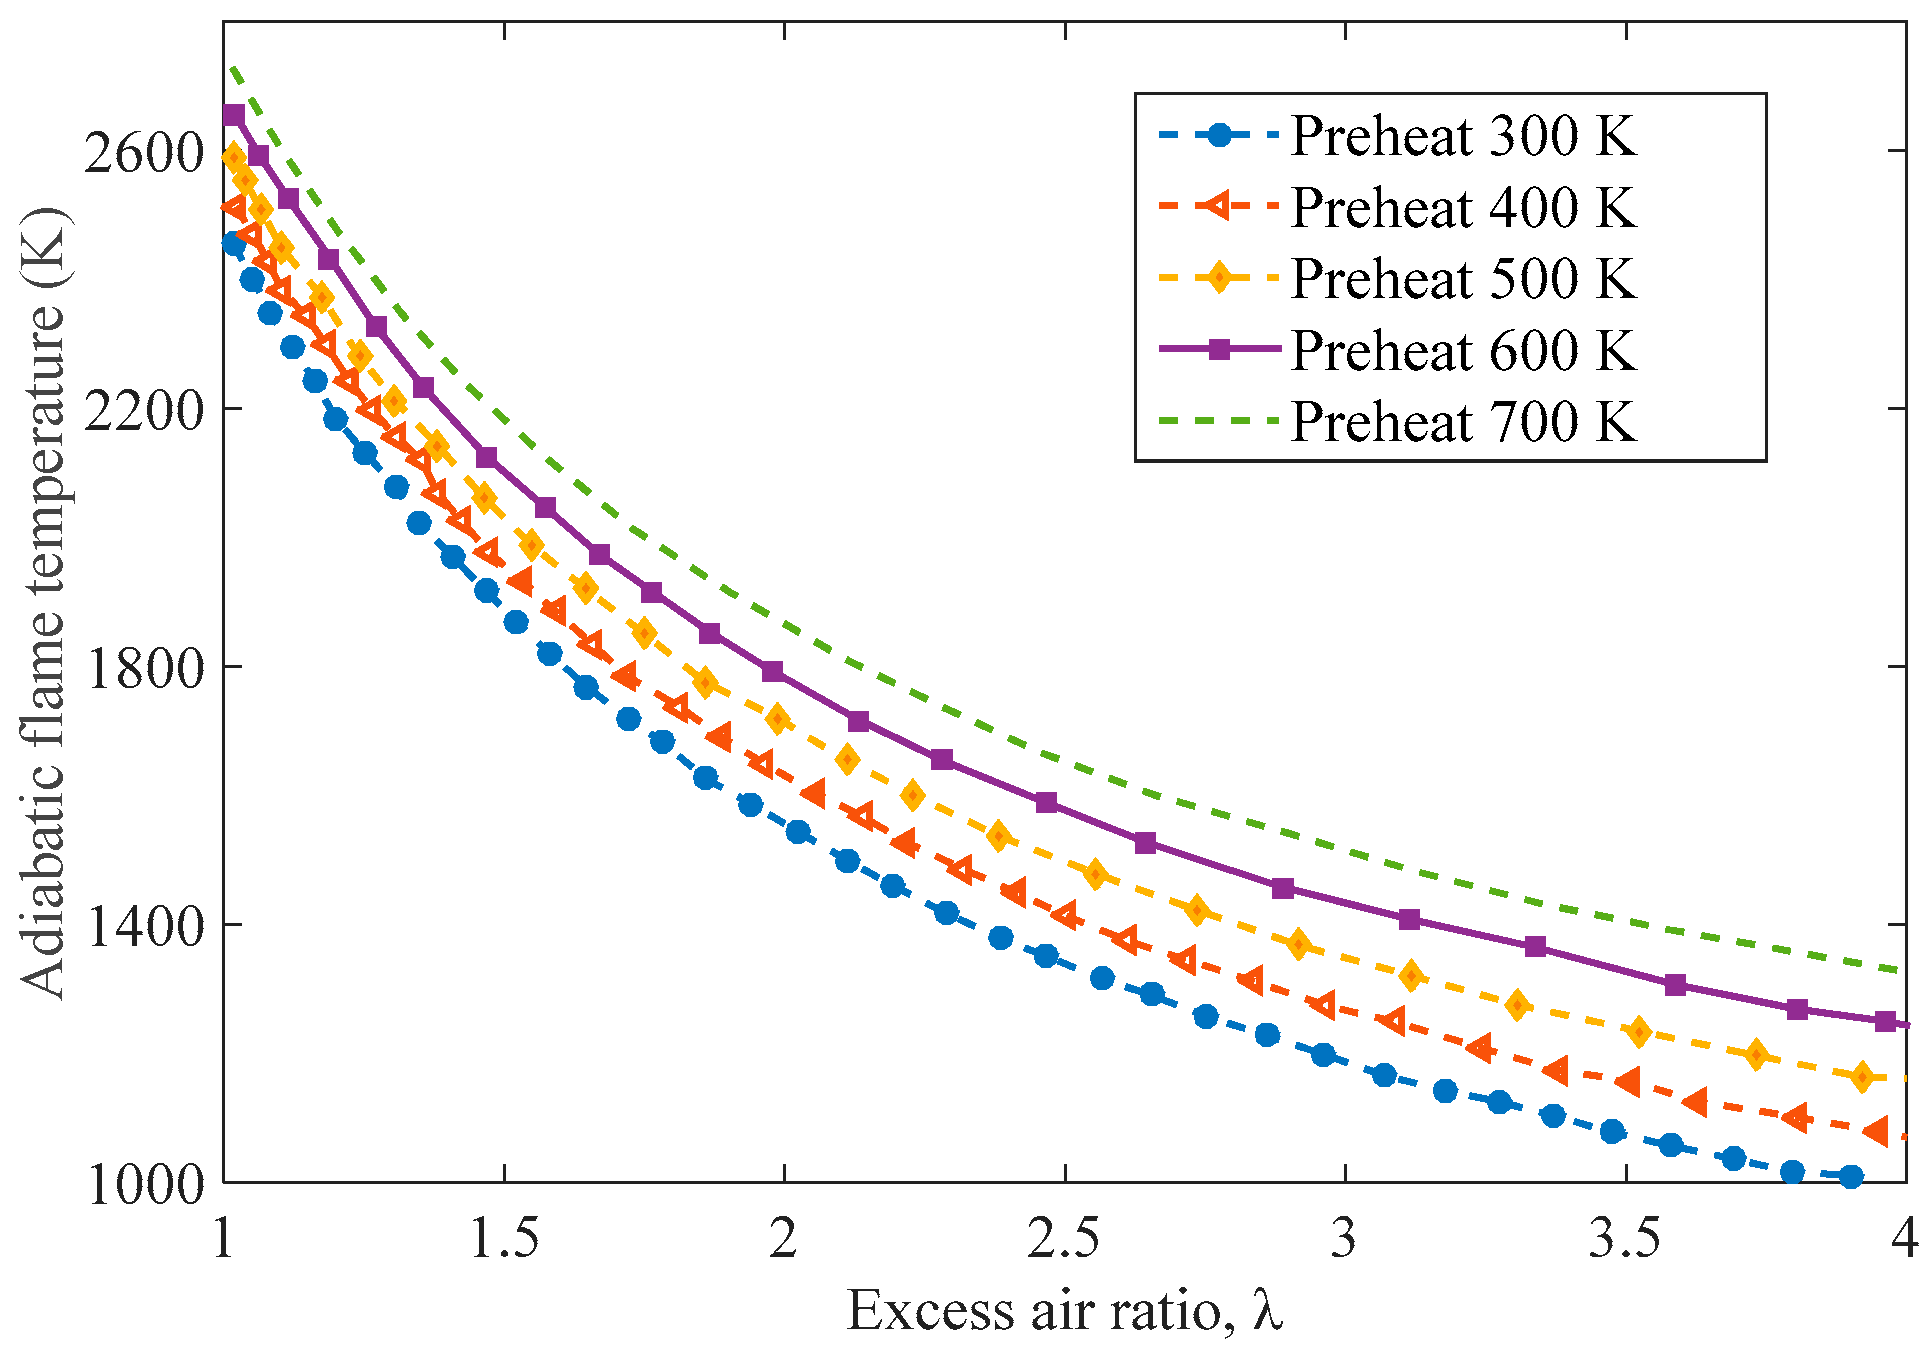
The data in Figure 4 shows the calculation results (using the energy balance equation, where the enthalpy of products is always equal to the enthalpy of reactants) starting from stoichiometric condition. This is a more complex method of obtaining the flame temperature compared to the simpler heat release approach. However, the advantage of this method is that it will provide a more accurate temperature estimate because the variation in gas properties due to temperature and composition changes that are taken into account. This theoretical analysis does not include dissociation effects, which will result in a reduction in flame temperatures when λ values approach unity.
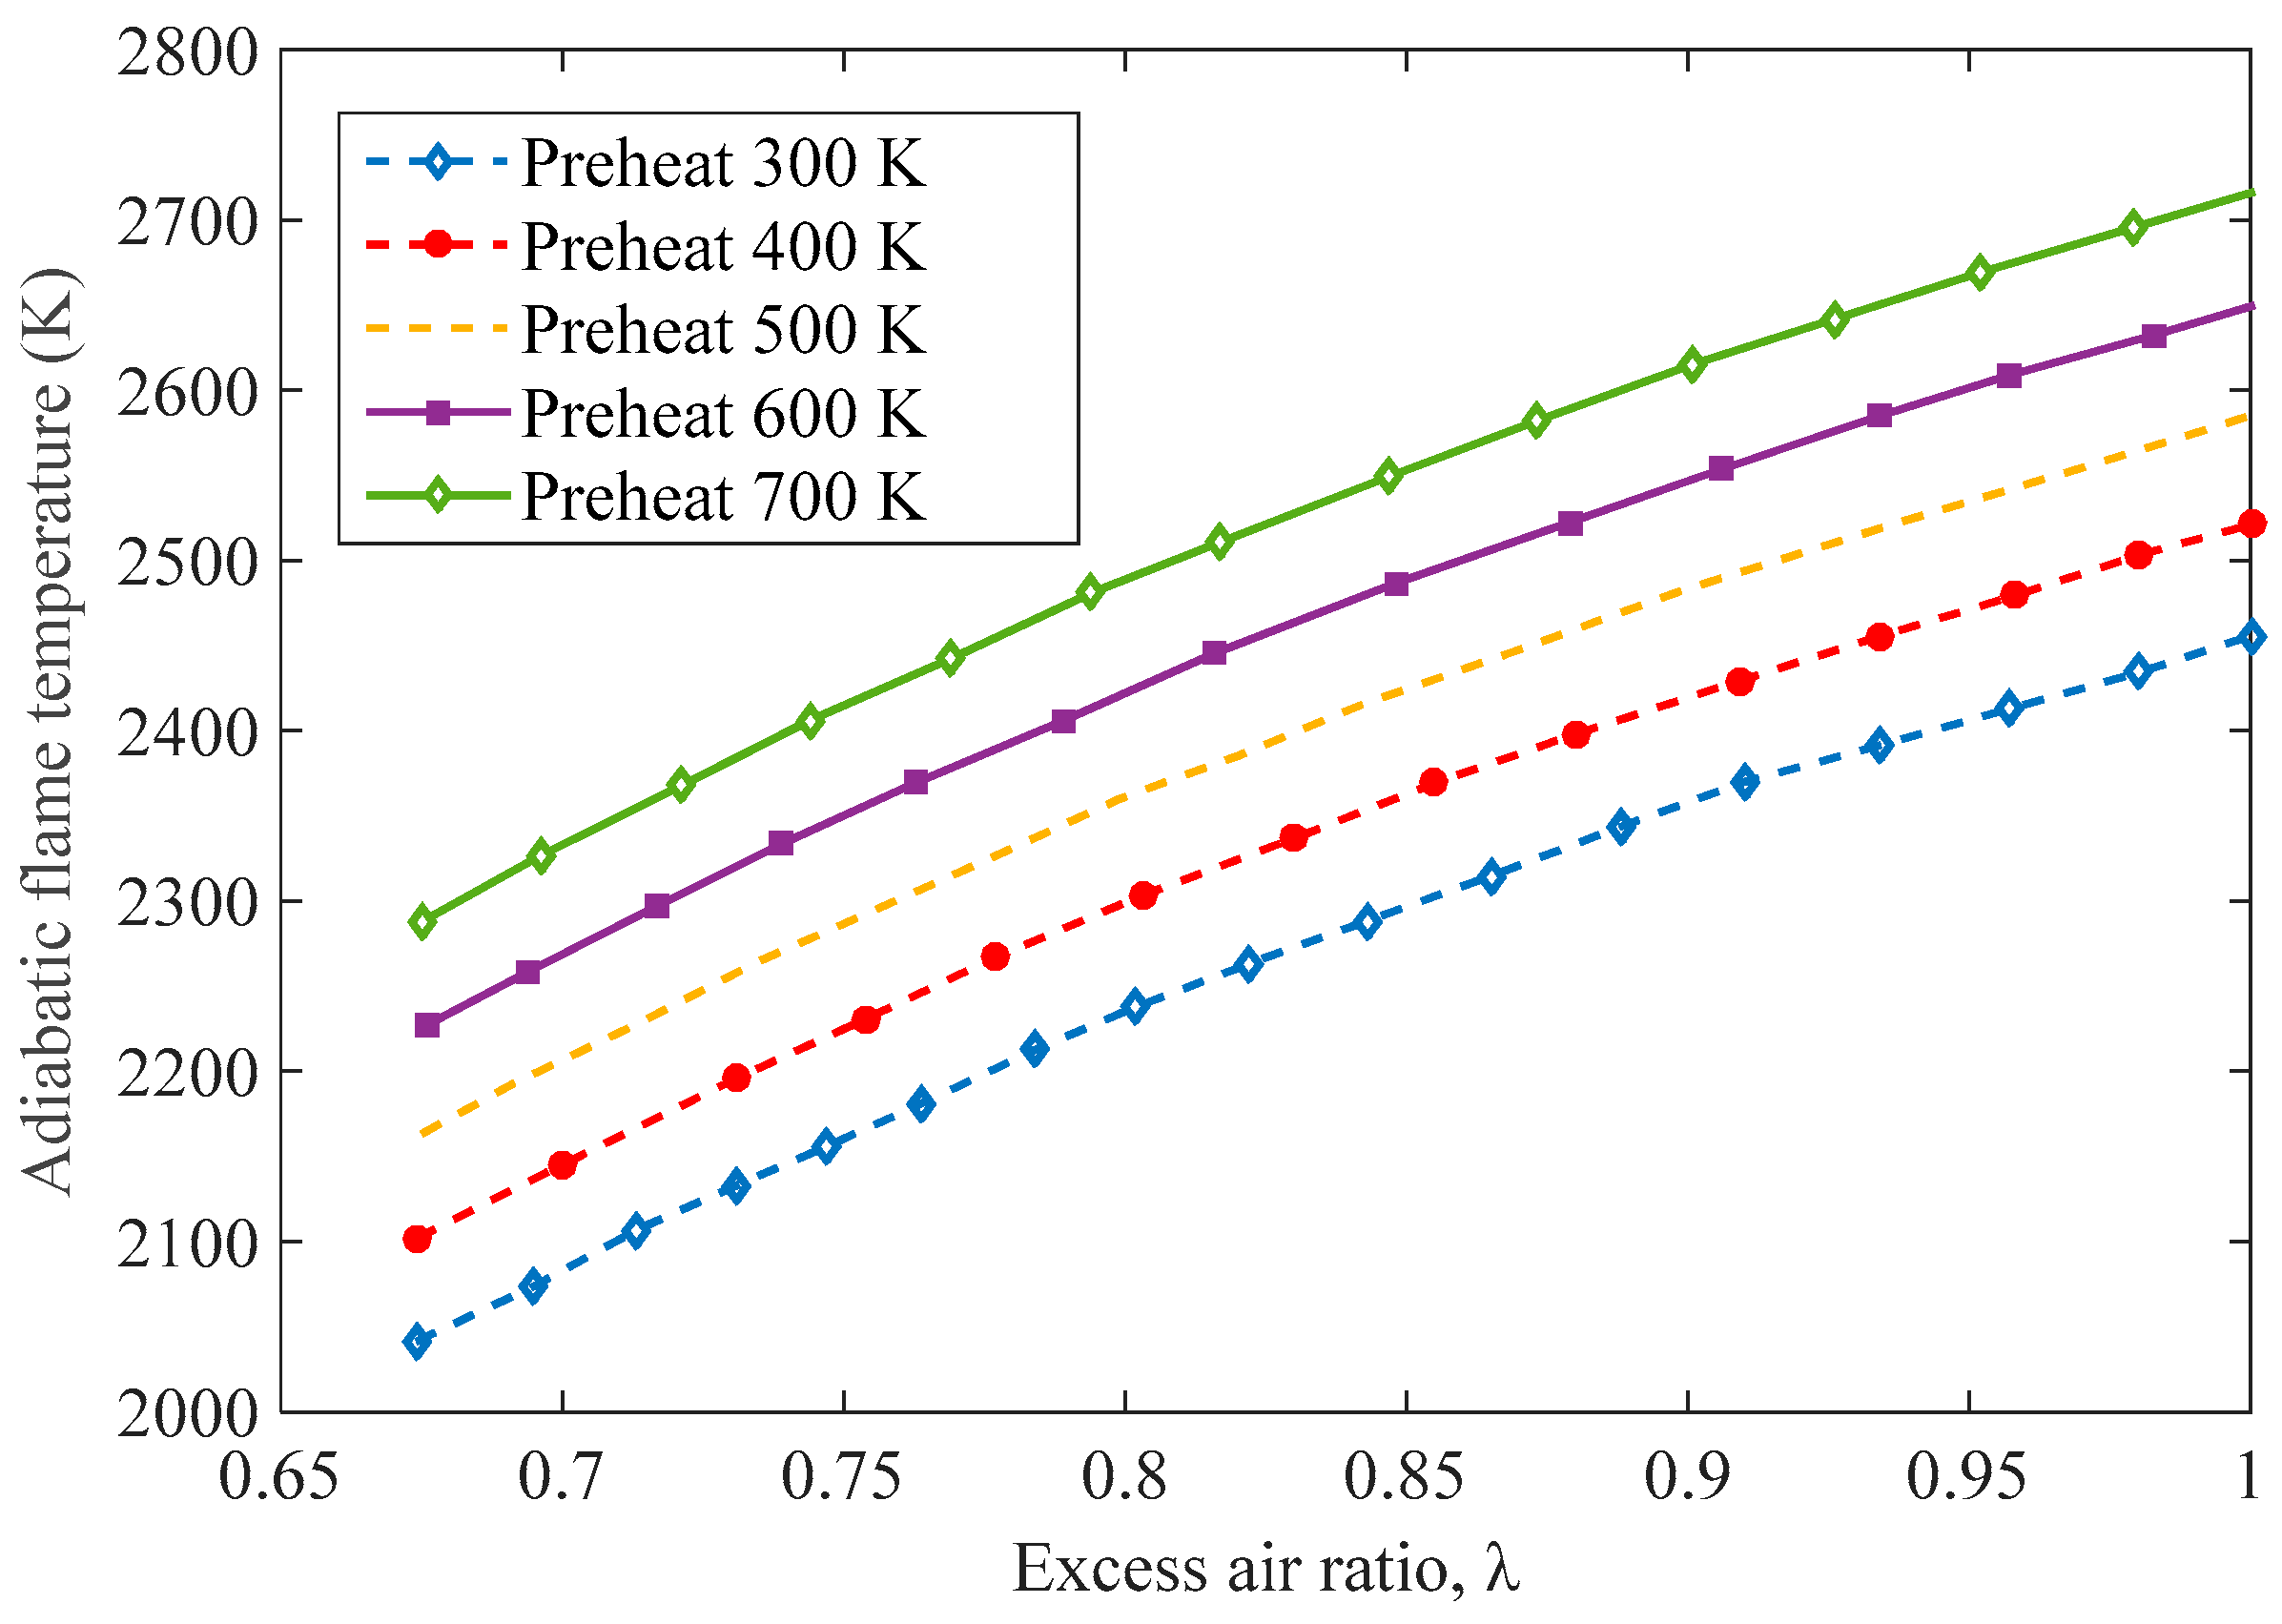
The results in 
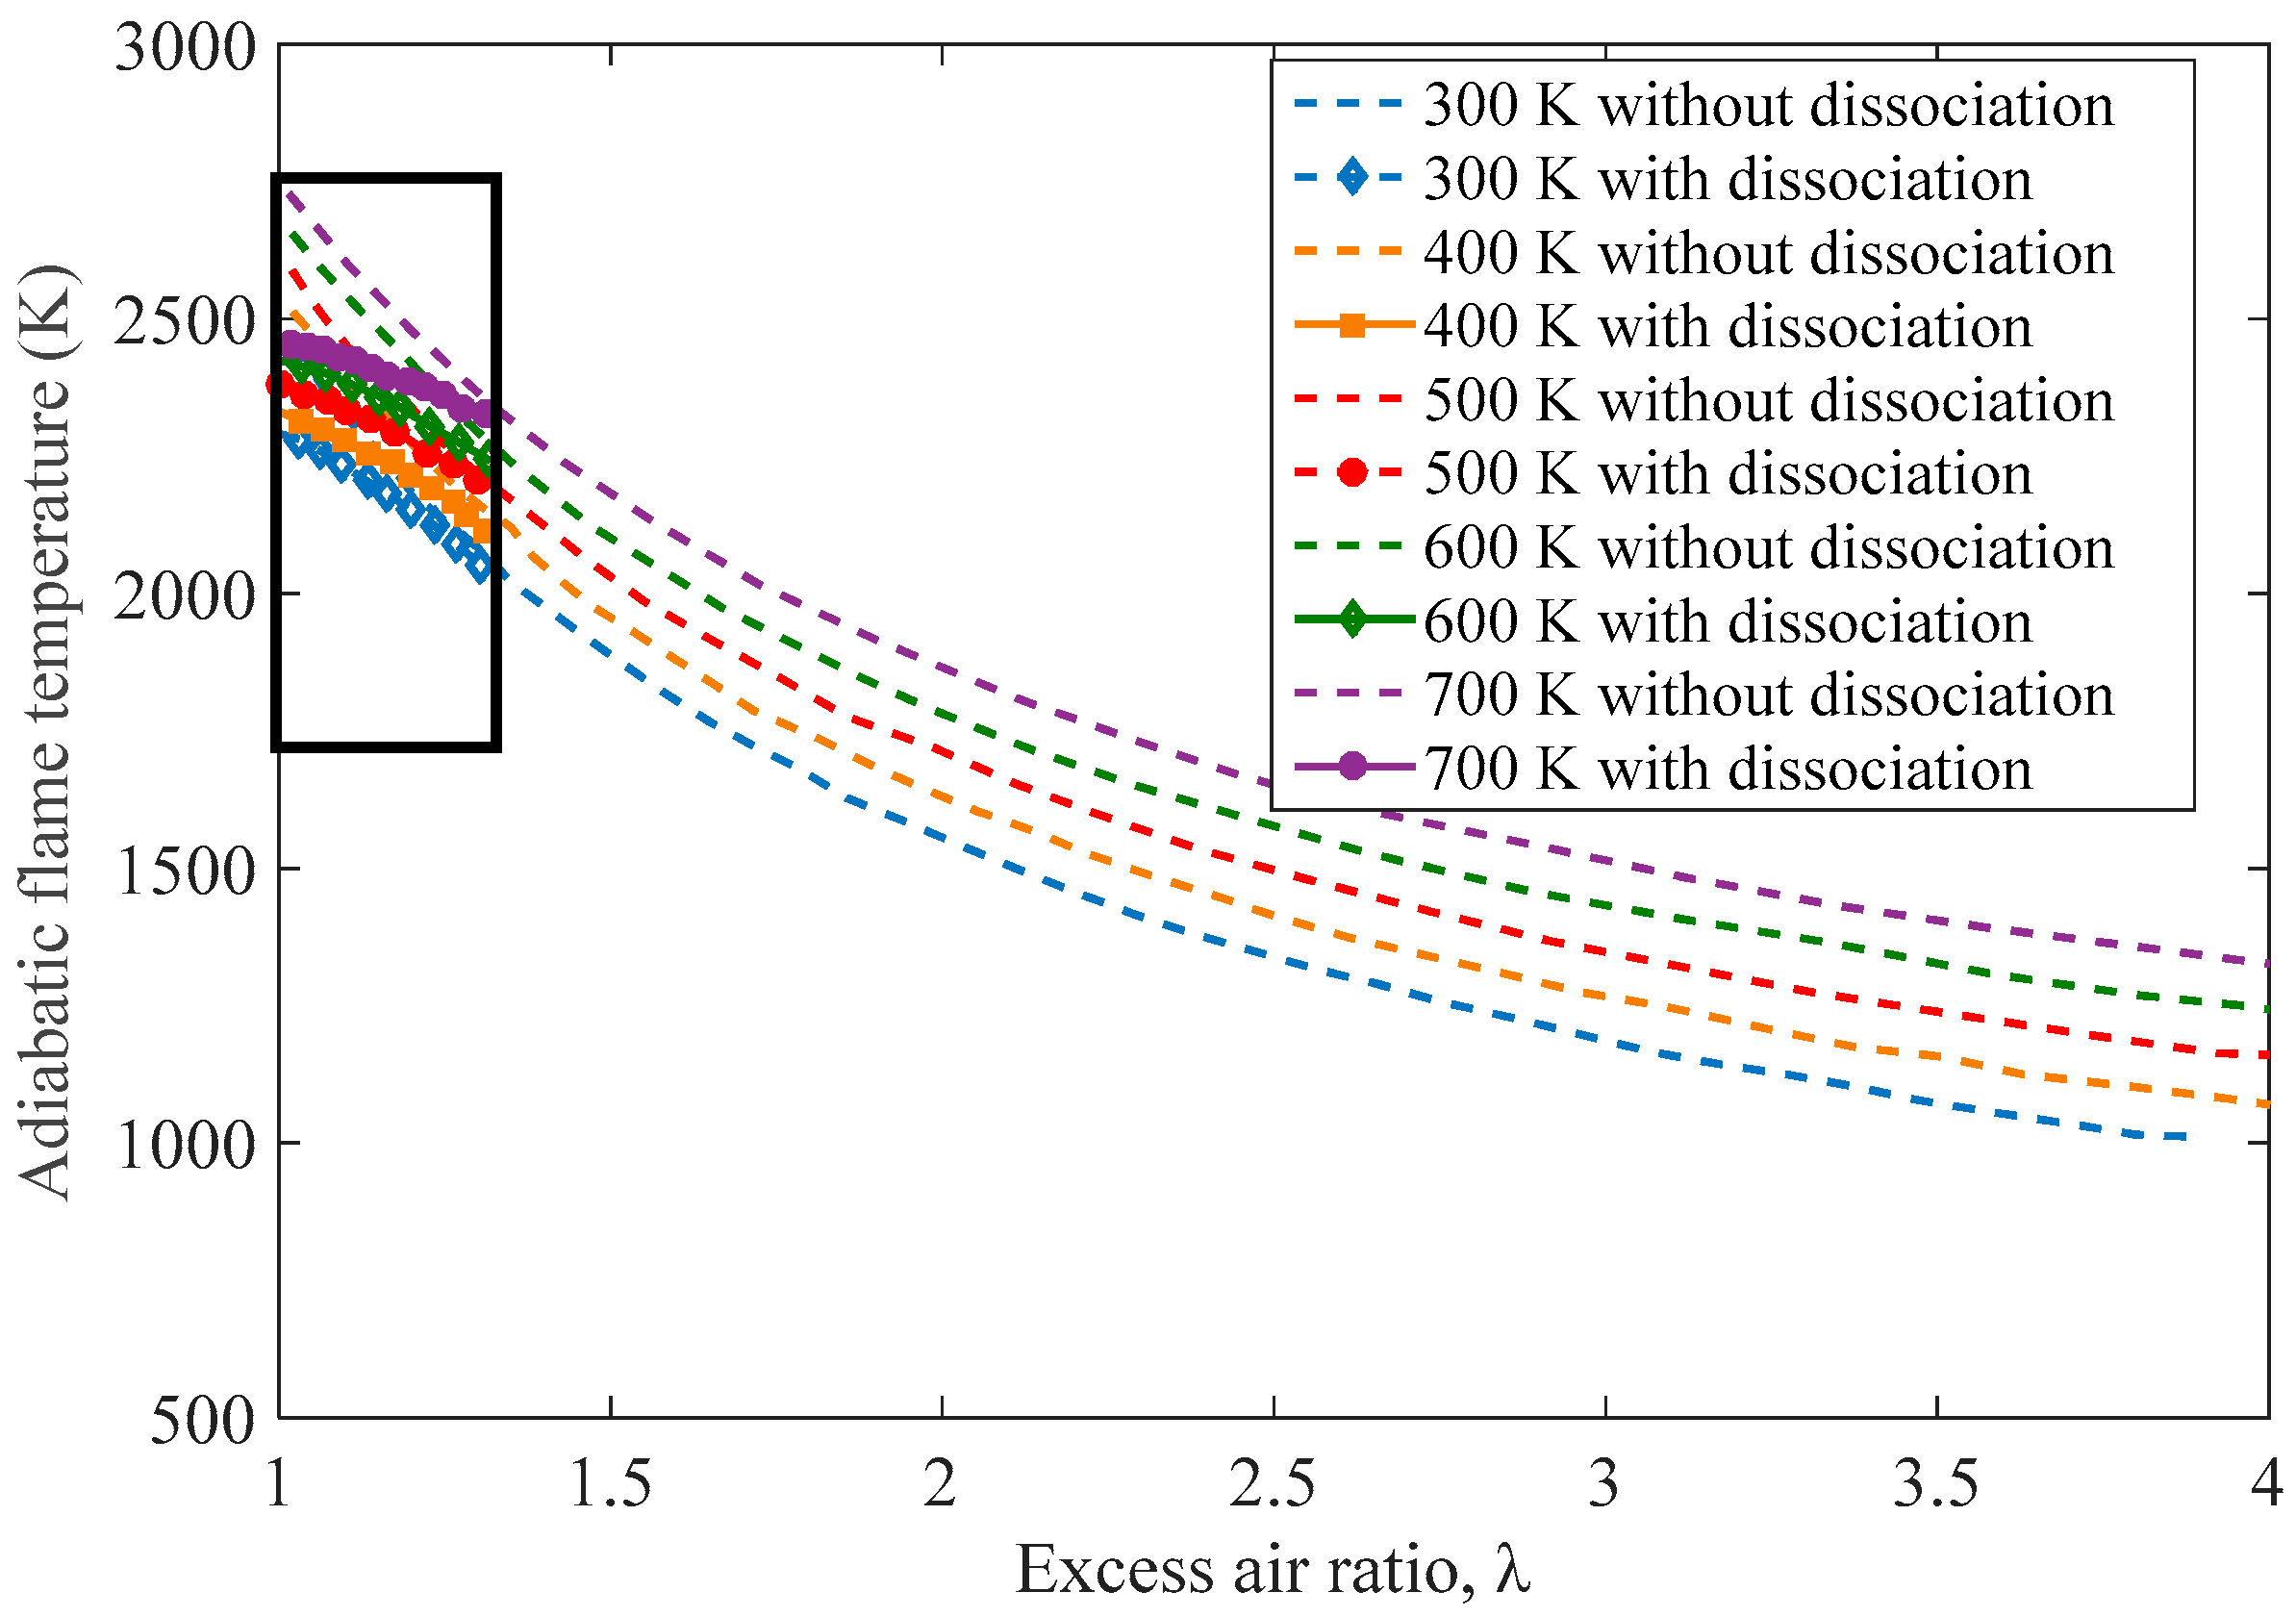
Figure 5 demonstrate the relationship between flame temperature and λ values, indicating a rapid increase in flame temperature as stoichiometric combustion is approached. The flame temperature is greatest at stoichiometric condition and reduced with increase in λ. For fuel rich conditions, the data in Figure 5 shows the theoretical adiabatic flame temperature without dissociation for different λ values.
Calculations made so far were based on complete combustion of hydrocarbon fuel in air with the resulting in CO2, H2O, N2 and O2 products. This method for flame temperature calculation is accurate for temperatures below 1500 K as dissociation, and breakdown of products backing their original elements does not take place. The effect of dissociation results in a reduction of the flame temperature and this becomes significant when temperatures are in excess of 2000 K. In the dissociation mechanism, some of the CO2 will split back into CO and O2, and H2O into H2 and O2. The results show that there is always some oxidant left in the products. Dissociation is an endothermic process and will reduce the amount of energy released. The effect of dissociation on the peak flame temperature is more pronounced when operating close to stoichiometric conditions, which is shown in Figure 6, with no dissociation being compared in the same figure.

5. Discussion

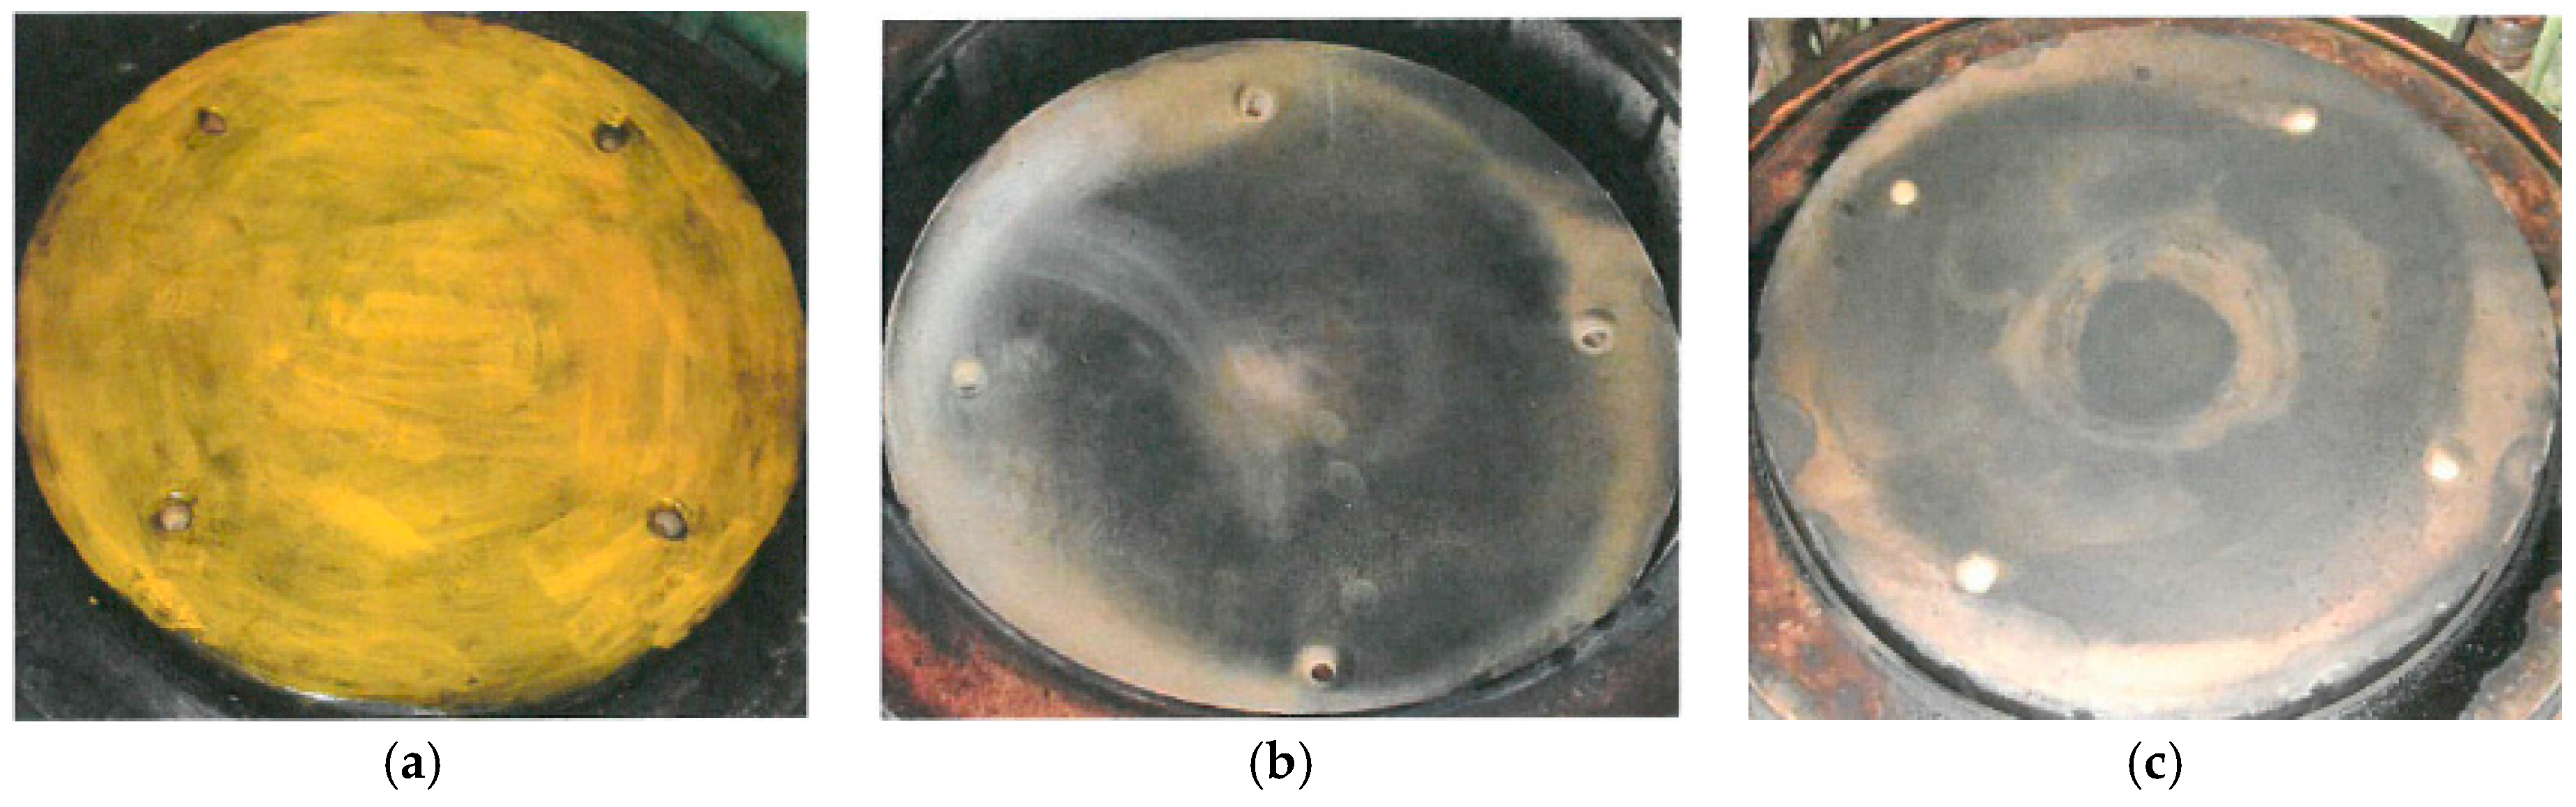
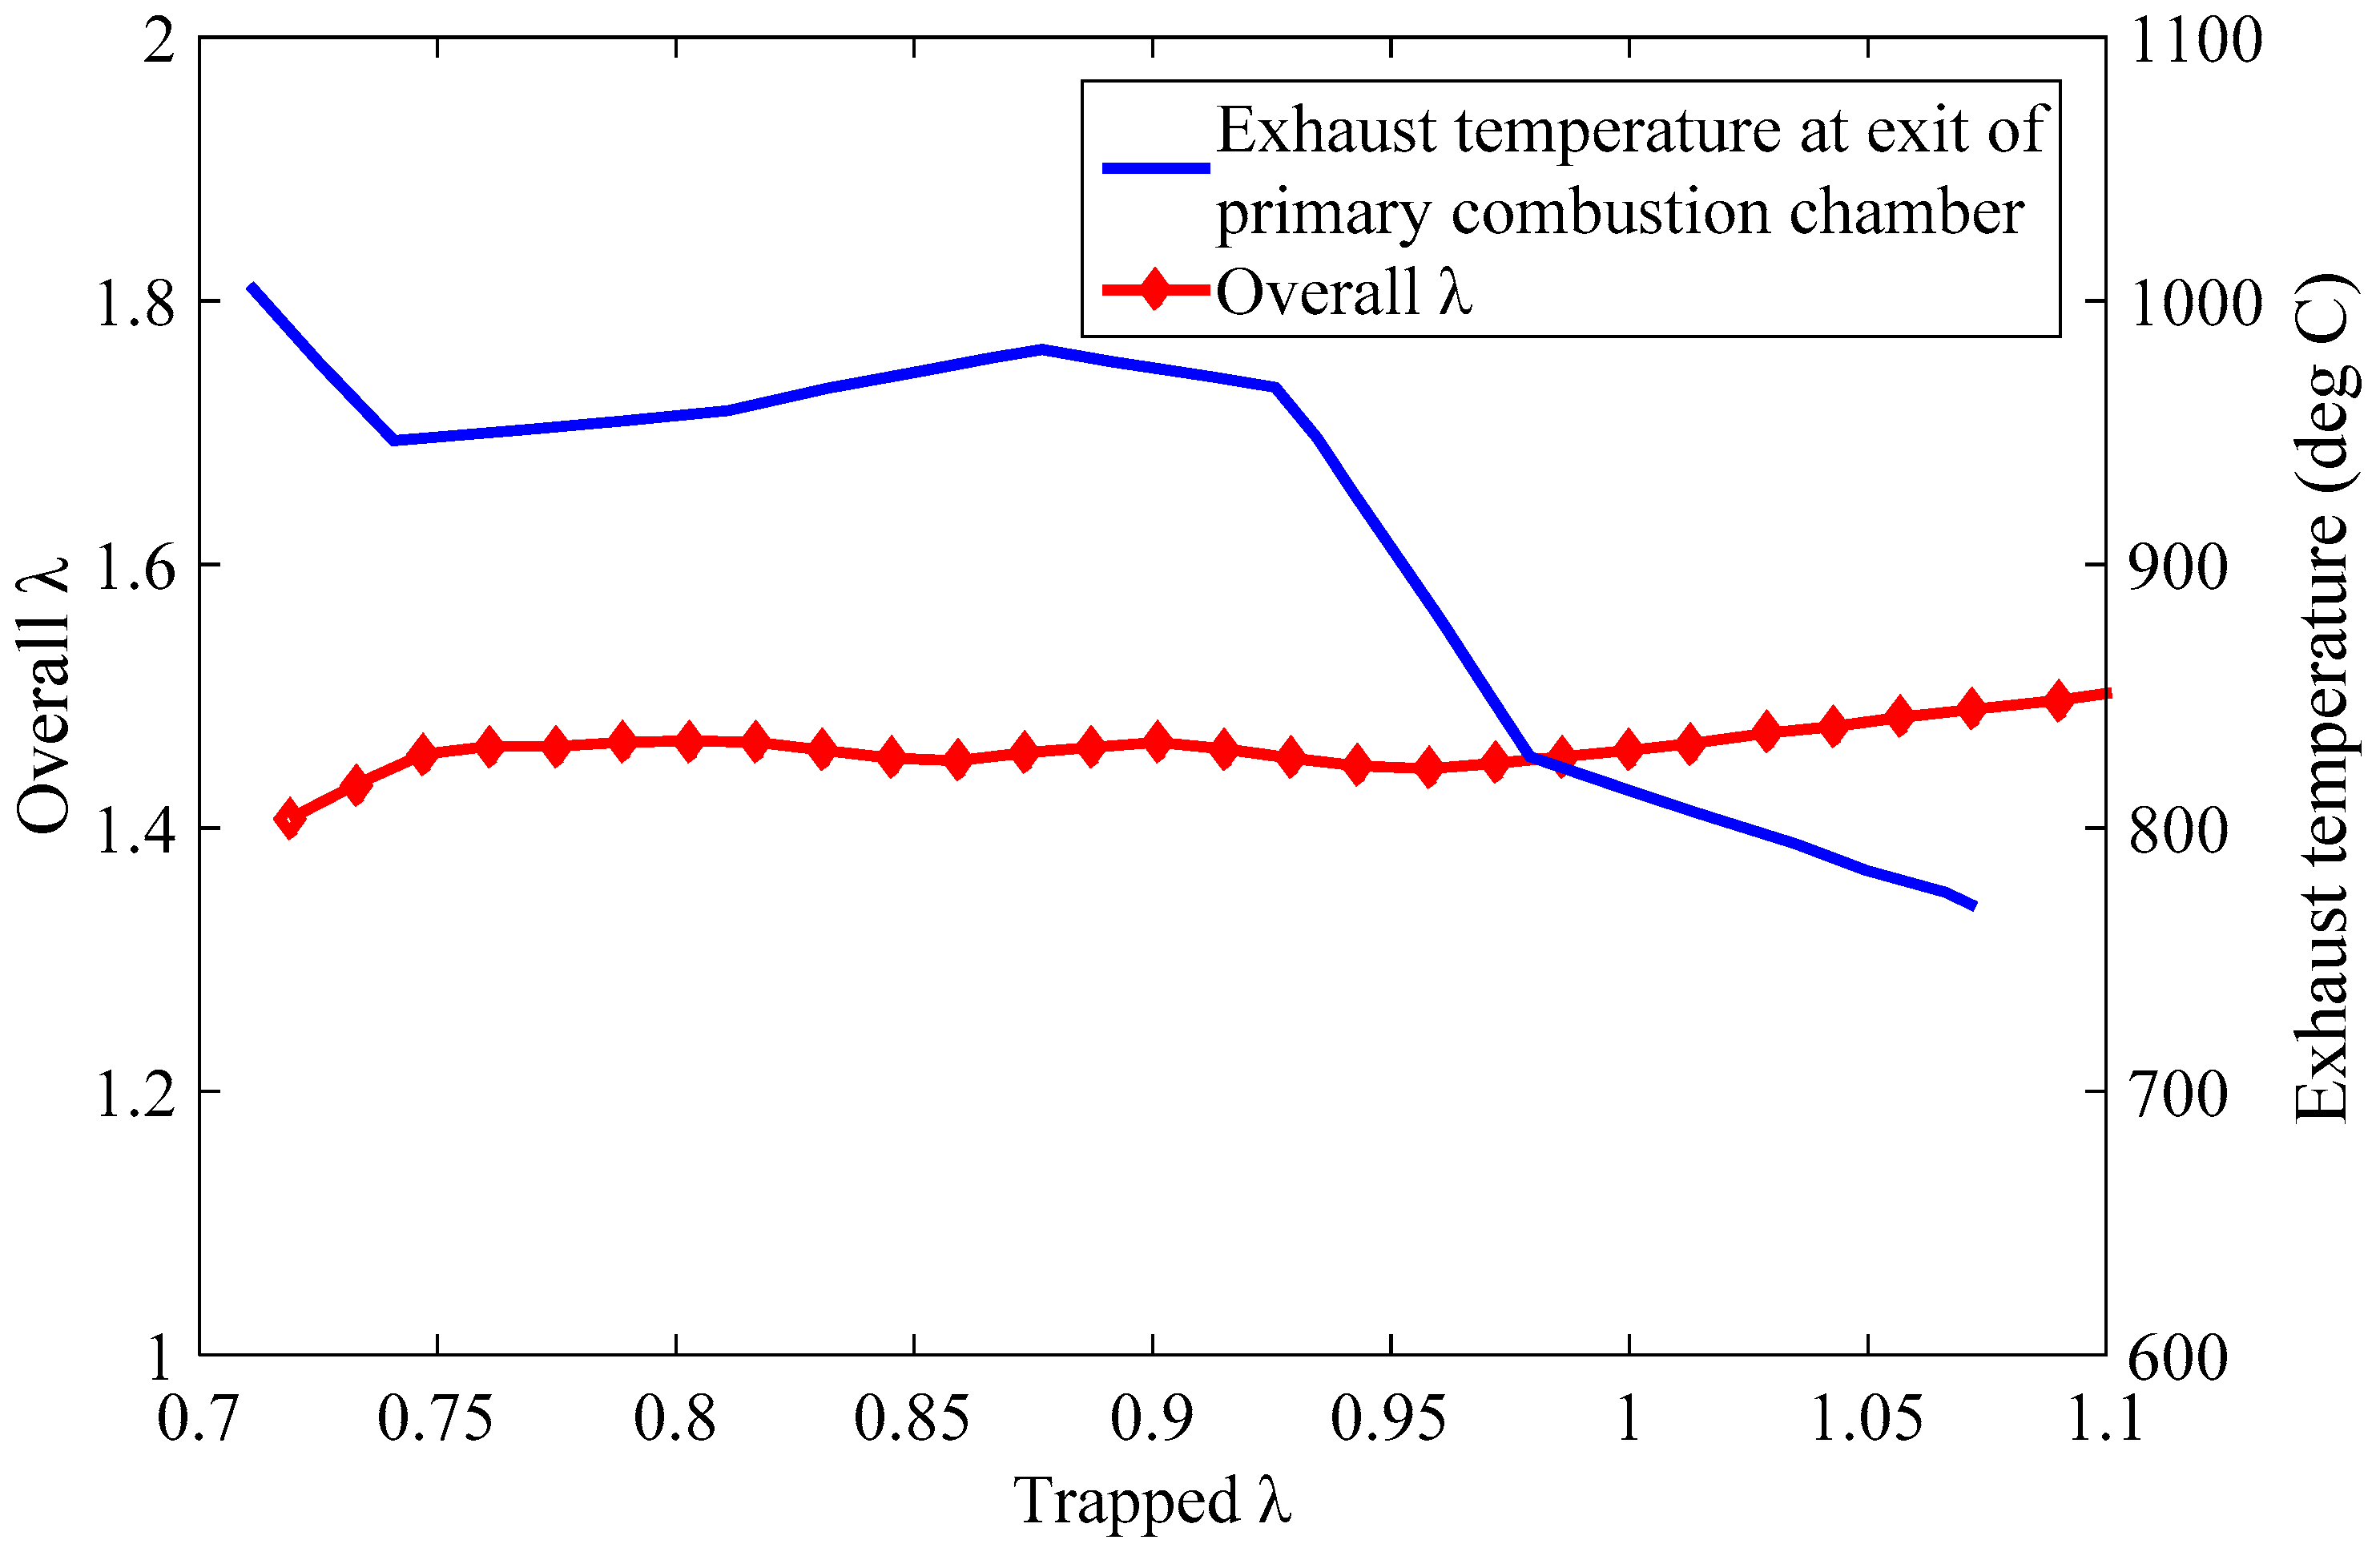
For most diesel engines, other than the homogeneous charge compression ignition engines, the air to fuel ratio is stratified across the combustion space. This results in non-uniform temperatures across the piston crown in the radial and circumferential direction In theory, as discussed above, maximum flame temperature is observed at λ = 1. However, in practice, due to non-uniformity in the air-fuel mixtures, this occurs at λ 1.2 (for continuous combustion systems). For diesel engines, with intermittent combustion, the value of λ at which maximum flame temperature is observed could be higher, possibly in the region of λ = 1.6 to λ = 1.8. An engine operating with λ = 1.6 will have its combustion chamber components running significantly hotter than those operating at greater values of λ. This indicates that engine components responsible for maintaining the pre-requisite air to fuel ratio within the combustion space are critical since malfunction will result in thermal overloading of combustion chamber components.
It could be argued that, in fuel rich conditions, the maximum adiabatic flame temperature is less than stoichiometric conditions; therefore, combustion chamber components should not fail due to temperatures exceeding design threshold values. However, there are significant problems with combustion chamber components failing through excessive temperatures in fuel rich conditions. This does not occur under lean burn conditions, where the flame is more compact and a boundary of air exists between the flame and the component surface. This voluminous flame comes into contact with the combustion chamber components, increasing the rate of heat input, and also inducing the engine to thermal overload.

6. Conclusions

In this research, the most probable cause of diesel engines’ thermal overload is discussed and validated. Test results indicated that when the fuel rate of the flame visualisation test rig was increased at constant air mass flow rate or vice versa, then λ will decrease. The flame also became voluminous due to the lack of active radicals. The exhaust temperature increased from 775 to 1000 °C with λ changing from 1.12 to 0.71. This high temperature flame when close to or in contact with any combustion chanter component would result in an increased rate of heat transfer through the component and its consequent failure. Temperature indicating paints were applied on two piston crowns to investigate the effect of voluminous flame on component surface temperature. A comparison of the thermal paint results indicated that the piston with normal ware rate showed a dusty grey shade with yellowish tinge at places, while the piston with high rates of hot corrosion is very close to matt glaze (much in excess of the design temperature). The test results proved that high surface temperatures and salt deposition on the crown in the heavily burned regions could have been caused by the flame and fuel impingement, respectively.

Acknowledgments

This work was funded using the EPSRC (Engineering and Physical Sciences Research Council) Impact Acceleration Account EP/K503885/1. Data supporting this publication is openly available under an Open Data Commons Open Database License. Additional metadata are available at: http://dx.doi.org/10.17634/160151-2. Please contact Newcastle Research Data Service at [email protected] for access instructions.

Author Contributions

Sangram Kishore Nanda and Anthony Paul Roskilly conceived and designed the experiments; Sangram Kishore Nanda performed the experiments; Sangram Kishore Nanda and Boru Jia analyzed the data and wrote the paper; and Andrew Smallbone revised the manuscript.

Conflicts of Interest

The authors declare no conflict of interest.

References

  1. Reitz, R.D.; Hanson, R.; Splittem, D.K.S. Improving Fuel Efficiency with Fuel-Reactivity-Controlled Combustion. Available online: http://www.erc.wisc.edu/documents/symp09-Reitz.pdf (accessed on 2 January 2017).
  2. Feng, H.; Guo, C.; Yuan, C.; Guo, Y.; Zuo, Z.; Roskilly, A.P.; Jia, B. Research on combustion process of a free piston diesel linear generator. Appl. Energy 2016, 161, 395–403. [Google Scholar] [CrossRef]
  3. Palash, S.M.; Masjuki, H.H.; Kalam, M.A.; Atabani, A.E.; Fattah, I.M.R.; Sanjid, A. Biodiesel production, characterization, diesel engine performance, and emission characteristics of methyl esters from Aphanamixis polystachya oil of Bangladesh. Energy Convers. Manag. 2015, 91, 149–157. [Google Scholar] [CrossRef]
  4. Aghbashlo, M.; Tabatabaei, M.; Mohammadi, P.; Pourvosoughi, N.; Nikbakht, A.M.; Goli, S.A.H. Improving exergetic and sustainability parameters of a DI diesel engine using polymer waste dissolved in biodiesel as a novel diesel additive. Energy Convers. Manag. 2015, 105, 328–337. [Google Scholar] [CrossRef]
  5. Zamboni, G.; Moggia, S.; Capobianco, M. Hybrid EGR and turbocharging systems control for low NOx and fuel consumption in an automotive diesel engine. Appl. Energy 2016, 165, 839–848. [Google Scholar] [CrossRef]
  6. Singh, D.; Subramanian, K.A.; Singal, S.K. Emissions and fuel consumption characteristics of a heavy duty diesel engine fueled with hydroprocessed renewable diesel and biodiesel. Appl. Energy 2015, 155, 440–446. [Google Scholar] [CrossRef]
  7. Miao, Y.; Zuo, Z.; Feng, H.; Guo, C.; Song, Y.; Jia, B.; Guo, Y. Research on the Combustion Characteristics of a Free-Piston Gasoline Engine Linear Generator during the Stable Generating Process. Energies 2016, 9, 655. [Google Scholar] [CrossRef]
  8. Zheng, Z.; Yue, L.; Liu, H.; Zhu, Y.; Zhong, X.; Yao, M. Effect of two-stage injection on combustion and emissions under high EGR rate on a diesel engine by fueling blends of diesel/gasoline, diesel/n-butanol, diesel/gasoline/n-butanol and pure diesel. Energy Convers. Manag. 2015, 90, 1–11. [Google Scholar] [CrossRef]
  9. Cho, C.P.; Pyo, Y.D.; Jang, J.Y.; Kim, G.C.; Shin, Y.J. NOx reduction and N2O emissions in a diesel engine exhaust using Fe-zeolite and vanadium based SCR catalysts. Appl. Therm. Eng. 2017, 110, 18–24. [Google Scholar] [CrossRef]
  10. Can, Ö.; Öztürk, E.; Solmaz, H.; Aksoy, F.; Çinar, C.; Yücesu, H.S. Combined effects of soybean biodiesel fuel addition and EGR application on the combustion and exhaust emissions in a diesel engine. Appl. Therm. Eng. 2016, 95, 115–124. [Google Scholar] [CrossRef]
  11. Bauccio, M. ASM Metals Reference Book; ASM International: Novelty, OH, USA, 1993. [Google Scholar]
  12. Wang, Z.; Huang, R.; Cheng, X.; Huang, Y.; Shen, J.; Zhong, Y.; Qin, J. Tests and numerical simulations on the thermal load of the cylinder head in heavy-duty vehicle diesel engines. In Proceedings of the ASME/IEEE 2007 Joint Rail Conference and Internal Combustion Engine Division Spring Technical Conference, Pueblo, CO, USA, 13–16 March 2007; pp. 361–373.
  13. Silva, F.S. Fatigue on engine pistons—A compendium of case studies. Eng. Fail. Anal. 2006, 13, 480–492. [Google Scholar] [CrossRef]
  14. Lee, K.S.; Assanis, D.N.; Lee, J.; Chun, K.M. Measurements and Predictions of Steady-State and Transient Stress Distributions in a Diesel Engine Cylinder Head; 0148-7191; SAE Technical Paper: Detroit, MI, USA, 1999. [Google Scholar]
  15. Schlegel, N.; Ebert, S.; Mauer, G.; Vassen, R. Columnar-Structured Mg-Al-Spinel Thermal Barrier Coatings (TBCs) by Suspension Plasma Spraying (SPS). J. Therm. Spray Technol. 2015, 24, 144–151. [Google Scholar] [CrossRef]
  16. Clarke, D.R.; Oechsner, M.; Padture, N.P. Thermal-barrier coatings for more efficient gas-turbine engines. MRS Bull. 2012, 37, 891–898. [Google Scholar] [CrossRef]
  17. Yonushonis, T.M. Overview of thermal barrier coatings in diesel engines. J. Therm. Spray Technol. 1997, 6, 50–56. [Google Scholar] [CrossRef]
  18. Padture, N.P.; Gell, M.; Jordan, E.H. Thermal barrier coatings for gas-turbine engine applications. Science 2002, 296, 280–284. [Google Scholar] [CrossRef] [PubMed]
  19. Wang, B.X.; Zhao, C.Y. Modeling radiative properties of air plasma sprayed thermal barrier coatings in the dependent scattering regime. Int. J. Heat Mass Transf. 2015, 89, 920–928. [Google Scholar] [CrossRef]
  20. Patterson, M.A.; Reitz, R.D. Modeling the Effects of Fuel Spray Characteristics on Diesel Engine Combustion and Emission; 0148-7191; SAE Technical Paper: Detroit, MI, USA, 1998. [Google Scholar]
  21. Agarwal, A.K.; Srivastava, D.K.; Dhar, A.; Maurya, R.K.; Shukla, P.C.; Singh, A.P. Effect of fuel injection timing and pressure on combustion, emissions and performance characteristics of a single cylinder diesel engine. Fuel 2013, 111, 374–383. [Google Scholar] [CrossRef]
  22. Yao, C.; Cheung, C.S.; Cheng, C.; Wang, Y.; Chan, T.L.; Lee, S.C. Effect of diesel/methanol compound combustion on diesel engine combustion and emissions. Energy Convers. Manag. 2008, 49, 1696–1704. [Google Scholar] [CrossRef]
  23. Heywood, J.B. Internal Combustion Engine Fundamentals; Mcgraw-Hill: New York, NY, USA, 1988; Volume 930. [Google Scholar]
Figure 1. Schematic diagram of the flame visualisation test rig.
Energies 10 00329 g001
Figure 2. Flame position indication.
Energies 10 00329 g002
Figure 3. View of thermal paint on the top of the piston crowns; (a) before temperature estimation trial; (b) after trial with high wear rate; (c) after trial with normal wear rate.
Energies 10 00329 g003
Figure 4. Adiabatic flame temperature for different λ values with different preheats.
Energies 10 00329 g004
Figure 5. Adiabatic flame temperature under fuel rich conditions with different preheats.
Energies 10 00329 g005
Figure 6. Adiabatic flame temperature with and without dissociation with different preheats.
Energies 10 00329 g006
Table 1. Thermal paint temperature (°C) indication as function of time.
Colour Change5 min10 min15 min30 min60 min120 min
Yellow to dusty grey313277----
Dusty grey to yellow-525-482450435
Yellow to orange601590584573562552
Orange to green699682672656641625
Green to brown806792784770756742
Brown to grey green981948929899869840
Matt glaze1235-----
Table 2. Specifications of the selected Sulzer engine.
Engine TypeSlow Speed
Maker/ModelSulzer RTA 84T-D
Operating cycleTwo stroke
Rated power4100 kW/cylinder
Rated speed (rpm)74
Bore (mm)840
Stroke (mm)3150
Compression ratio17:1
Turbocharging systemConstant pressure

