Letter

Effect of Load Change on the Thevenin Equivalent Impedance of Power System

1
Department of Electrical Engineering, Harbin Institute of Technology, 150001 Harbin, China
2
Department of Electrical and Computer Engineering, North Carolina State University, Raleigh, NC 27606, USA
*
Author to whom correspondence should be addressed.
Energies 2017, 10(3), 330; https://doi.org/10.3390/en10030330
Submission received: 24 December 2016 / Accepted: 1 March 2017 / Published: 8 March 2017

Abstract

:
This paper discusses the effect of load change on the Thevenin equivalent impedance of power systems. In this paper, the Thevenin equivalent impedance influenced by the derivative of active load with respect to reactive load ( d P / d Q ) is analyzed. The Thevenin equivalent impedance forms a closed curve in a complex plane and shrinks to one point when voltage collapses. The magnitude of the Thevenin equivalent impedance at the collapse point is equal to the magnitude of the load impedance. Therefore, the impedance match theory still holds under the effect of the load change. These features are verified on a New England 39-bus system.

1. Introduction

The Thevenin equivalent (TE) is a tool to simplify the power system from a bus. It is utilized widely in power system online security and stability assessments. Therefore, TE parameters identification has received considerable interests [1,2]. However, determining the TE parameters is still a challenging issue. Although the methods based on local measurements can quickly identify TE parameters, load change influences the parameters significantly in practice [3,4]. In the literature, d P / d Q is always set to P / Q . The scenario when d P / d Q is set to other values has not been analyzed completely.
In this letter, we will discuss the effect of the derivative of active load with respect to reactive load on TE impedance. The features are analyzed in Section 2, and the results of the simulations on a New England 39-bus system are given in Section 3.

2. Effect of d P / d Q on Thevenin Equivalent Impedance

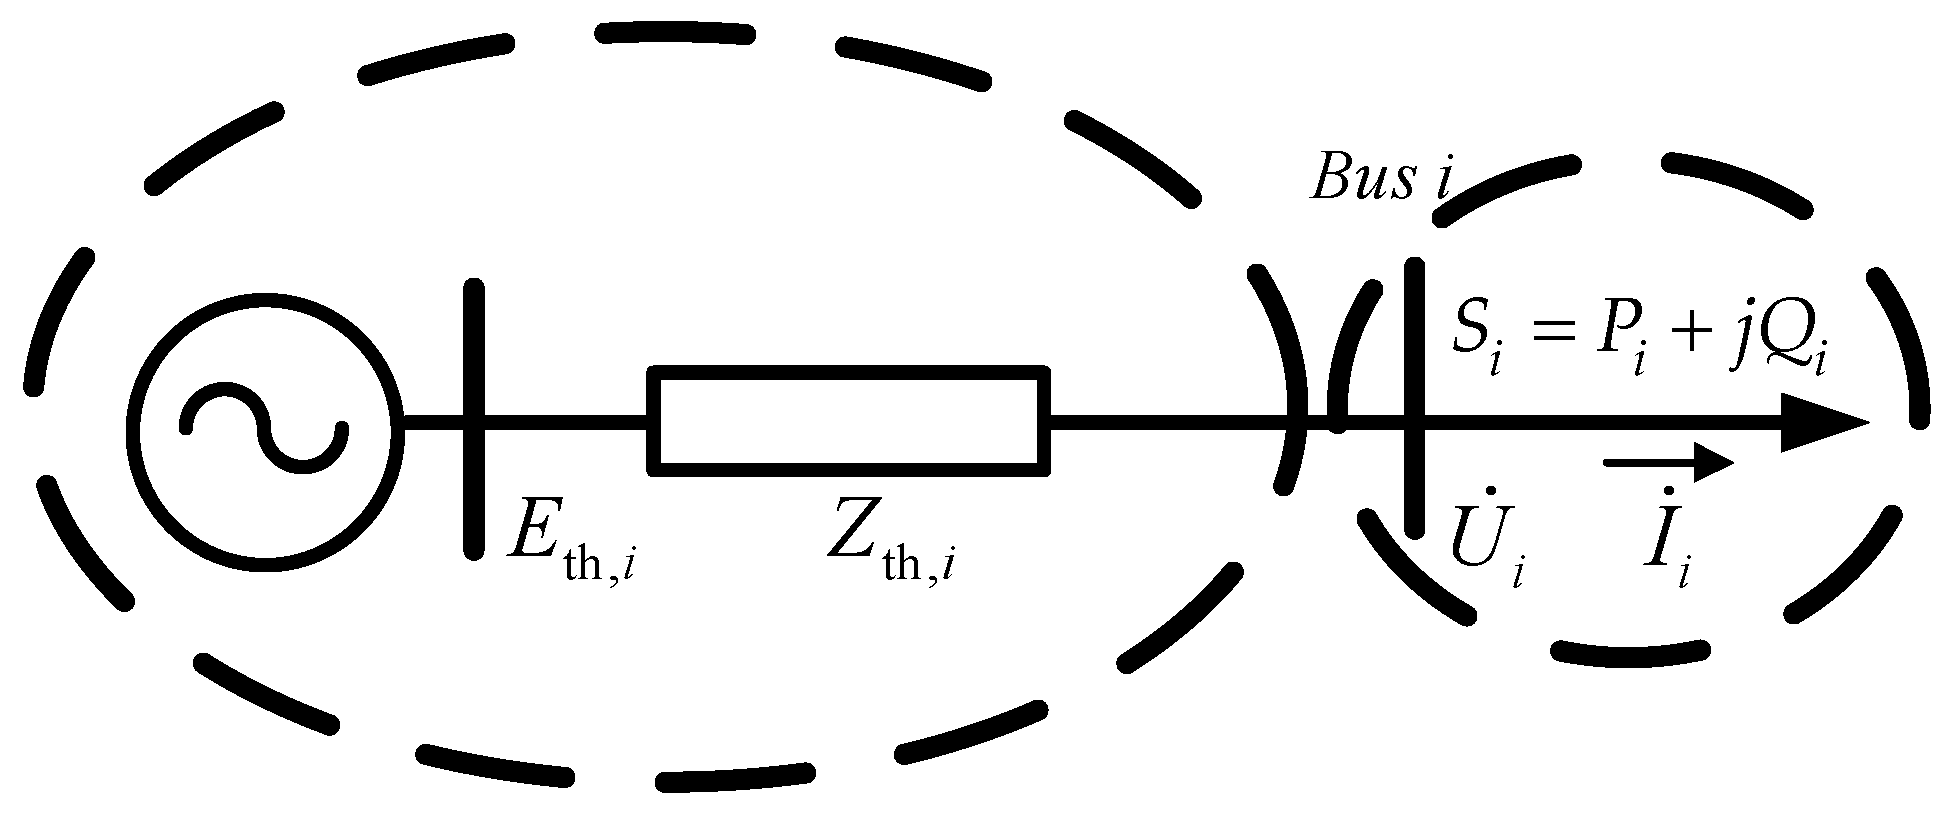
2.1. Problem Statement

As shown in Figure 1, a power system can be simplified to the Thevenin equivalent model from load bus i. In the figure, E ˙ th , i and Z th , i are the TE potential and impedance, U ˙ i and I ˙ i are the voltage and current, and P i and Q i are the active load and reactive load at the bus i, respectively.
According to Figure 1, the equivalent power system can be described by
E ˙ th , i Z th , i I ˙ i = U ˙ i
In [5], E ˙ th , i and Z th , i are assumed unchanged between two measurements, ( U ˙ t 1 , 1 , I ˙ t 1 , i ) and ( U ˙ t 2 , i , I ˙ t 2 , i ). Therefore, from (1), the TE impedance can be expressed by
Z th , i = d U ˙ i d I ˙ i Δ U ˙ i Δ I ˙ i U ˙ t 2 , i U ˙ t 1 , i I ˙ t 1 , i I ˙ t 2 , i
Expanding the numerator and denominator in a totally differential format, (2) can be rewritten as
Z th , i = U ˙ i / P i d P i + U ˙ i / Q i d Q i I ˙ i / P i d P i + I ˙ i / Q i d Q i = U ˙ i / P i k i + U ˙ i / Q i I ˙ i / P i k i + I ˙ i / Q i
The U ˙ i / Q i , U ˙ i / P i , I ˙ i / Q i , and I ˙ i / P i are the sensitivity parameters of bus i, and they have no dependence on k i = d P i / d Q i [6].
The load change ( d S = d P + j d Q ) significantly influences the TE impedance. In the literature, d P i / d Q i is always set to P i / Q i [6]. The scenario when d P i / d Q i is set to other values has not been analyzed.

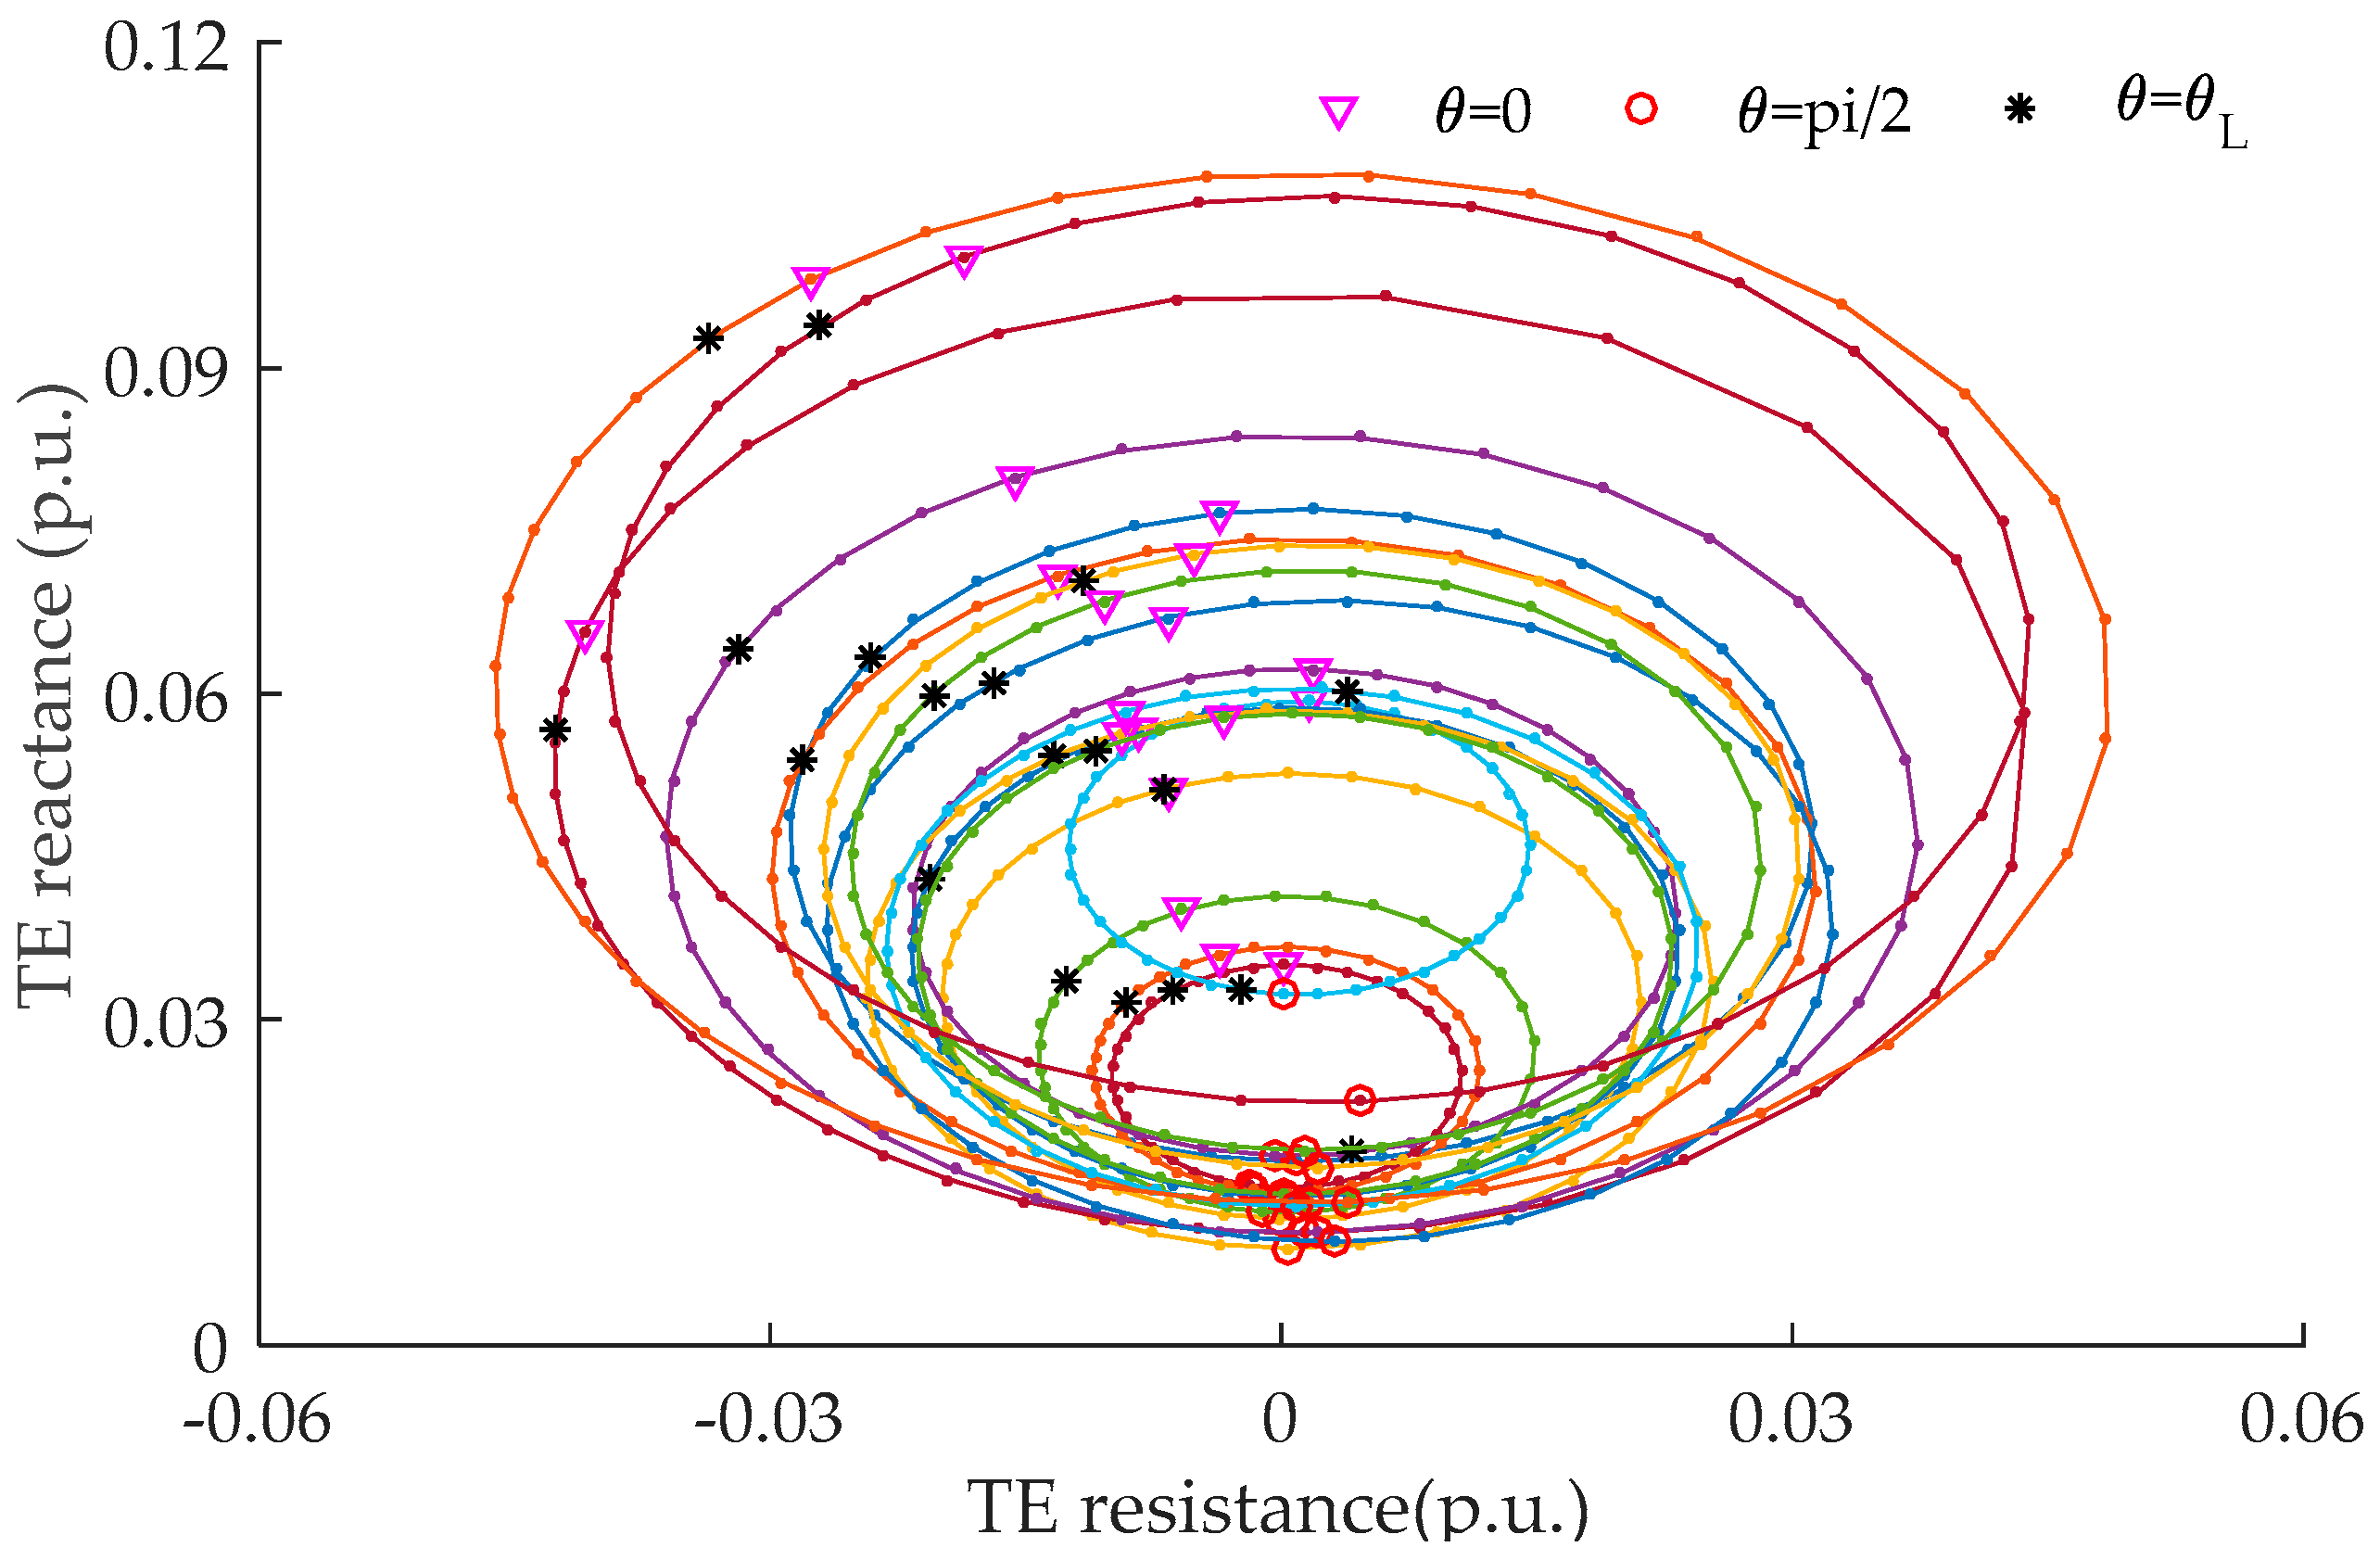
2.2. Thevenin Equivalent Impedance Forming a Closed Curve in Complex Plane

From (3), we know that Z t h , i ( k i ) is a curve, and its derivative can expressed by
d Z t h , i d k i = ( U ˙ i / P i I ˙ i / Q i U ˙ i / Q i I ˙ i / P i ) ( I ˙ i / P i k i + I ˙ i / Q i ) 2
The total differential of the current at bus i can be expressed by
d I ˙ i = ( I ˙ i / P i k i + I ˙ i / Q i ) d Q i
When d I ˙ i 0 , I ˙ i / P i k i + I ˙ i / Q i 0 , Z t h , i ( k i ) is differentiable when k i ( , ) . According to the feature of the derivative, the curve of Z t h , i ( k i ) is continuous when k i ( , ) . When k i or k i , from (3), Z t h , i ( k i ) can be expressed by
Z t h , i | k i = = U ˙ i / P i I ˙ i / P i = Z t h , i | k i =
In (6), it is shown that Z t h , i ( k i = ) = Z t h , i ( k i = ) . So, the TE impedance with different k forms a continuous closed curve in complex plane.

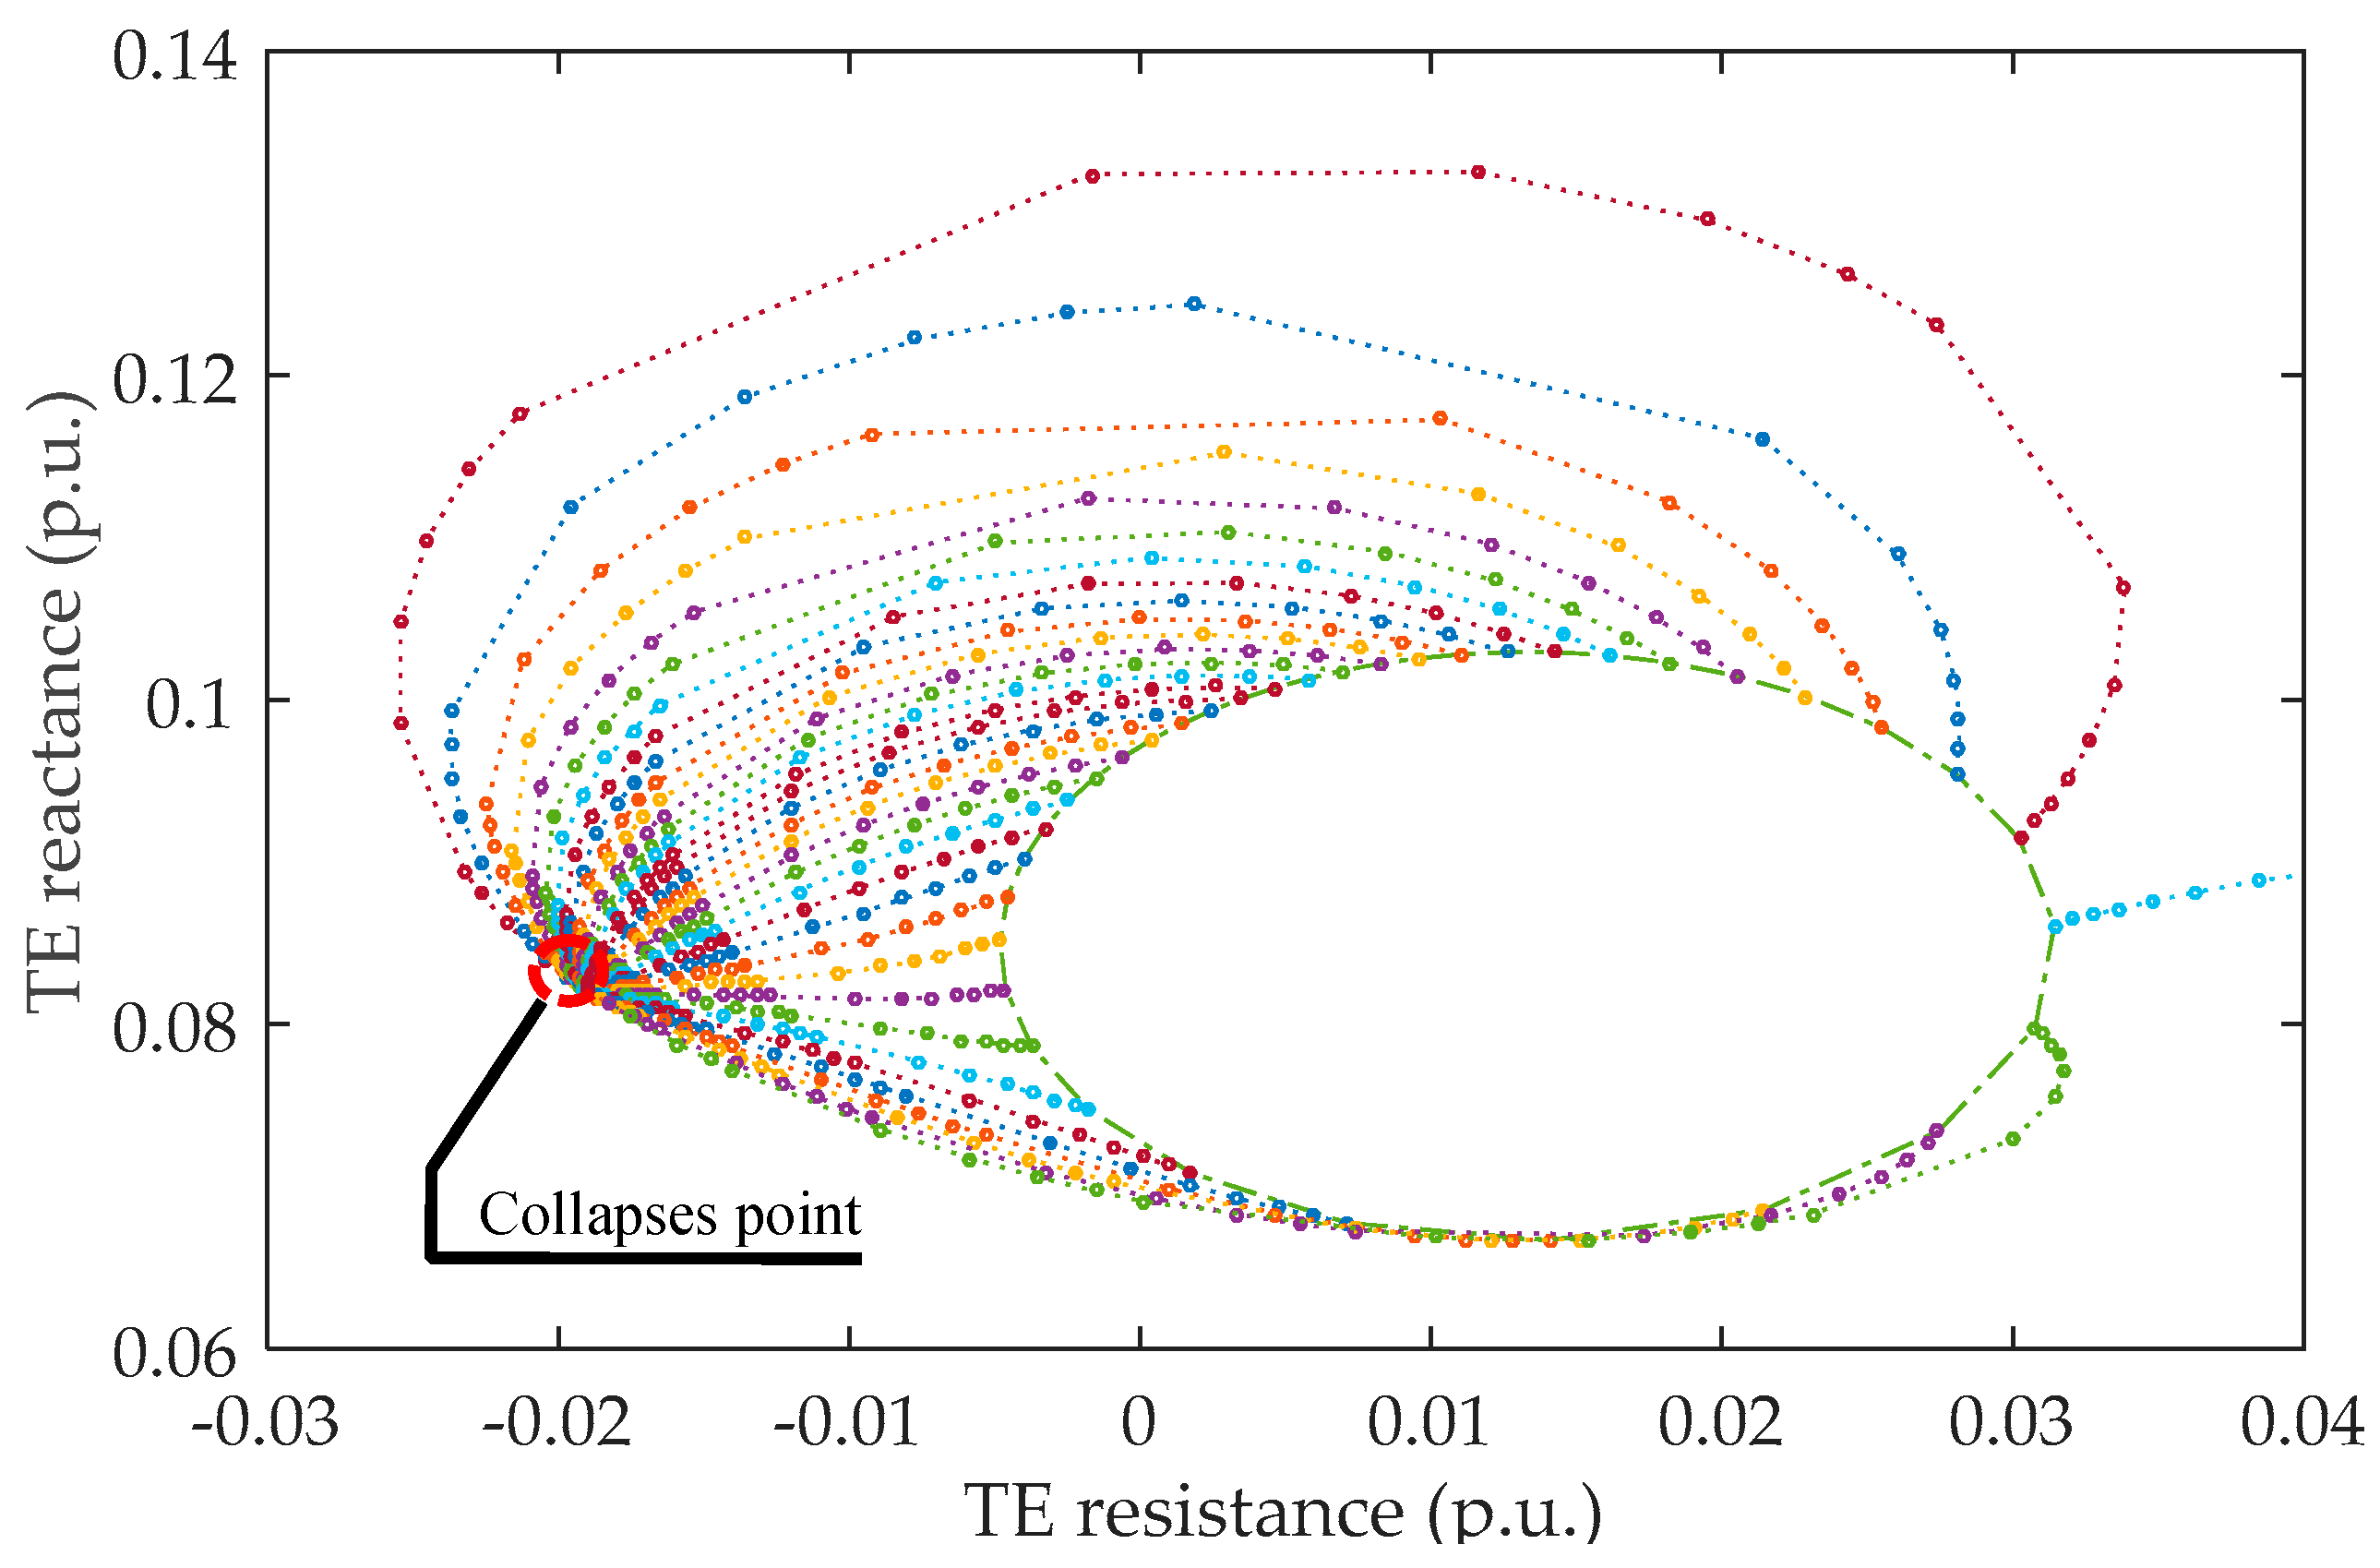
2.3. Thevenin Equivalent Impedances Shrinking to a Point When Voltage Collapses

At bus i , the derivative of voltage and current can be expressed by
[ d U ˙ i d I ˙ i ] = [ U ˙ i / P i U ˙ i / Q i I ˙ i / P i I ˙ i / Q i ] [ d P i d Q i ]
Before the voltage collapses, the coefficient matrix in (7) is invertible. The differential of the active power and reactive power can be expressed by
d P i = I ˙ i / Q i U ˙ i / P i I ˙ i / Q i I ˙ i / P i U ˙ i / Q i d U ˙ i + U ˙ i / Q i U ˙ i / P i I ˙ i / Q i I ˙ i / P i U ˙ i / Q i d I ˙ i
d Q i = I ˙ i / P i U ˙ i / P i I ˙ i / Q i I ˙ i / P i U ˙ i / Q i d U ˙ i + U ˙ i / P i U ˙ i / P i I ˙ i / Q i I ˙ i / P i U ˙ i / Q i d I ˙ i
When the voltage of bus i is approaching collapse, both active power and reactive power at the equivalent bus are approaching to limits. Therefore, their derivatives approach zero ( d P i = 0 and d Q i = 0 ). Substituting d P i = 0 and d Q i = 0 into (8) and (9), we can get (10)
U ˙ i / P i I ˙ i / P i = d U ˙ i d I ˙ i = U ˙ i / Q i I ˙ i / Q i
Substituting (2) into (10), the formula can be rewritten as
Z th , i = U ˙ i / P i I ˙ i / P i = U ˙ i / Q i I ˙ i / Q i
From (11), the value of Z t h , i is unrelated to k i when the voltage collapses. As the system status is certain when the voltage collapses, the value of Z t h , i is unique ( U ˙ i / P i , U ˙ i / Q i , I ˙ i / P i , and I ˙ i / Q i are unique when system status is certain [6]). So, the Thevenin equivalent impedance shrinks to one point and is not influenced by k when voltage collapses.
In the impedance match theory, the Thevenin equivalent impedance is equal to load impedance ( | Z t h , i | = | Z L , i | , where Z L , i = U ˙ i / I ˙ i is the load impedance) at bus i when the voltage collapses. At bus i, when voltage collapses, the load power approaches its extreme values. So, the derivatives of the load power of bus i can be expressed by
d S i | S i max = d ( U ˙ i I i * ) = U ˙ i d I i * + I i * d U ˙ i = 0
The TE impedance can be expressed by
| Z th , i | = | d U ˙ i d I ˙ i | = | U ˙ i d I i * I i * d I ˙ i | = | I ˙ i d I i * I i * d I ˙ i Z L , i | = | d ln I i * d ln I i * Z L , i | = | ( d ln I ˙ i ) d ln I ˙ i Z L , i | = | Z L , i |
In (13), It can be found that when voltage collapses, the magnitude of TE impedance is equal to the load impedance, regardless of k i . Therefore, the impedance match theory still holds.

3. Case Study

In this section, two cases on a New England 39 bus are presented to verify the effect of k i on Thevenin equivalent impedance and impedance match theory. For simplicity, the argument of load change θ is used to instead of the k i in the following discussion. θ = arctan ( k ) and θ ( 0 π ) when k ( , ) .

3.1. Case 1: Thevenin Equivalent Impedance with k

In this case, the TE impedance of all load bus with θ are calculated by (2). Between the two measurements, the magnitude of the load change Δ S is set to 0.005 and the argument of load change θ ranges from 0 to π . The results in complex plane are shown in Figure 2.
In Figure 2, each closed curve represents the TE impedance of a load bus. The simulation results indicate that the TE impedance with k forms a closed curve in complex plane.

3.2. Thevenin Equivalent Impedance When Voltage Approaches Collapse

In this case, the load power of bus 3 increases until voltage collapses. The TE impedance with different loads in complex plane is shown in Figure 3.
In Figure 3, the closed curve in solid line is the TE impedance with initial load power. Each curve in dotted line is the TE impedance with a fixed k when system load power increases from initial value till voltage collapses. The result in Figure 3 shows that the closed curve of TE impedance shrinks to one point when the voltage collapses.
The amplitudes of the TE impedance with three typical k ( θ = 0 , θ = π / 2 and θ = θ L ) are shown in Figure 4.
The result in Figure 4 shows that when voltage collapses, the magnitude of TE impedance is equal to the magnitude of the load impedance. It indicates that the impedance match theory still holds under the effect of the load change.

4. Conclusions

This paper discusses the effect of the derivative of active loads with respect to reactive loads on TE impedance and impedance match theory. The features that Thevenin equivalent impedance forms a closed curve in complex plane and shrinks to a point when voltage collapses are verified on a New England 39 bus system.

Author Contributions

Tiankui Sun, Weixing Li and Zhimin Li conceived and designed the experiments; Tiankui Sun and Shuang Rong performed the experiments, analyzed the data and contributed analysis tools; Tiankui Sun and Jian Lu wrote the paper.

Conflicts of Interest

The authors declare no conflict of interest.

References

  1. Su, H. An Efficient Approach for Fast and Accurate Voltage Stability Margin Computation in Large Power Grids. Appl. Sci. 2016, 6, 335. [Google Scholar] [CrossRef]
  2. Hart, P.M. Characterising the power system at a load busbar by measurement. IEEE Proc. C Gener. Transm. Distrib. 1986, 133, 87–94. [Google Scholar] [CrossRef]
  3. Abdelkader, S.M.; Morrow, D.J. Online Thevenin Equivalent Determination Considering System Side Changes and Measurement Errors. IEEE Trans. Power Syst. 2015, 30, 2716–2725. [Google Scholar] [CrossRef]
  4. Abdelkader, S.M.; Morrow, D.J. Online Tracking of Thévenin Equivalent Parameters Using PMU Measurements. IEEE Trans. Power Syst. 2012, 27, 975–983. [Google Scholar] [CrossRef]
  5. Vu, K.; Begovic, M.M.; Novosel, D.; Saha, M.M. Use of local measurements to estimate voltage-stability margin. IEEE Trans. Power Syst. 1999, 14, 1029–1035. [Google Scholar] [CrossRef]
  6. Luo, H.-W.; Wu, Z.-Q.; Dai, Q.-H.; Deng, Y.; Zhao, K.-Y.; Zeng, X.-J. Fast Computation of Thevenin Equivalent Parameters. In Proceedings of the 2012 Asia-Pacific Power and Energy Engineering Conference (APPEEC), Shanghai, China, 27–29 March 2009; Volume 1, pp. 35–39.
Figure 1. The Thevenin equivalent model.
Energies 10 00330 g001
Figure 2. The calculated Thevenin equivalent (TE) impedances under different θ in complex plane.
Energies 10 00330 g002
Figure 3. The TE impedance curve of bus 3 for different θ under different load levels.
Energies 10 00330 g003
Figure 4. The calculated TE impedance magnitude of bus 3 for typical θ and loading levels.
Energies 10 00330 g004

