Article

Flame Structure and Chemiluminescence Emissions of Inverse Diffusion Flames under Sinusoidally Driven Plasma Discharges

by
Maria Grazia De Giorgi
*,
Aldebara Sciolti
,
Stefano Campilongo
and
Antonio Ficarella
Department Engineering for Innovation, University of Salento, 73100 Lecce LE, Italy
*
Author to whom correspondence should be addressed.
Energies 2017, 10(3), 334; https://doi.org/10.3390/en10030334
Submission received: 15 December 2016 / Accepted: 3 March 2017 / Published: 9 March 2017
(This article belongs to the Special Issue Combustion and Propulsion)

Abstract

:
Reduction of nitric oxides (NOx) in aircraft engines and in gas turbines by lean combustion is of great interest in the design of novel combustion systems. However, the stabilization of the flame under lean conditions is a main issue. In this context, the present work investigates the effects of sinusoidal dielectric barrier discharge (DBD) on a lean inverse diffusive methane/air flame in a Bunsen-type burner under different actuation conditions. The flame appearance was investigated with fixed methane loading (mass flux), but with varying inner airflow rate. High-speed flame imaging was done by using an intensified (charge-coupled device) CCD camera equipped with different optical filters in order to selectively record signals from the chemiluminescent species OH*, CH*, or CO2* to evaluate the flame behavior in presence of plasma actuation. The electrical power consumption was less than 33 W. It was evident that the plasma flame enhancement was significantly influenced by the plasma discharges, particularly at high inner airflow rates. The flame structure changes drastically when the dissipated plasma power increases. The flame area decreases due to the enhancement of mixing and chemical reactions that lead to a more anchored flame on the quartz exit with a reduction of the flame length.

1. Introduction

Non-premixed flames have better stability under wide ranges of operating conditions and safety with respect to premixed-flame-based combustion [1,2,3]. Several previous investigations have been performed to gain an understanding of the characteristics of the flame [4,5,6]. An important limit of the premixed flames is their tendency to blow off operating without external stabilization devices [7].
In a non-premixed coaxial burner, two types of flames could be established: normal diffusive flames (NDFs) and inverse diffusive flames (IDFs). IDF flames are characterized by an inner oxidizer jet surrounded by an outer fuel jet. In presence of high air jet velocity, the fuel of the outer jet is entrained inward and mixes with the air, leading to a partially premixed flame. If not, it burns as a diffusive flame [8].
Inverse diffusive flames are of great interest due to their features of reducing soot production [9] and NOx formation [10], with respect to NDFs. The soot emission from NDF with hydrocarbon fuel is a major problem in practical combustors because the soot particles, beyond the pollution action, act as a point heat source, radiating heat to the combustor walls and producing higher thermal stresses [11]. Moreover, although an NDF presents low tendency to blow off, it has a low heat release rate [12] and over-long flame length due to incomplete combustion [13,14].
In the study of Sidebotham et al. [15], the soot formation characteristics of IDFs were investigated under the effects of temperature, fuel structure, and fuel concentration, underlining that IDFs had lower soot loading than NDF flames. Hence, there is a growing interest in the inverse non-premixed coflow flames [16], even if inverse CH4/air coflow flames present reduced stability limits with respect to normal non-premixed CH4/air coflow flames [16,17].
Inverse jet flames are used in fields as various as rocket engines and staged combustion systems [18,19,20,21]. The injection of central oxidizer with annular hydrogen jet in rocket engine combustors helps to minimize the oxidation of combustor walls [22]. Previous works [8,11,23,24] investigated the effect of the air–fuel velocity ratio on the characteristics of IDF. The higher air–fuel momentum ratio of IDF configuration helps in enhancing mixing in the flame configuration [11].
With the aim to improve the flame stabilization, recent investigations performed the use of nonthermal plasma (NTPs), sometimes called nonequilibrium or “cold” plasmas, for combustion enhancement. Nonthermal plasmas appear interesting for their high energy efficiency, because the power consumption for the actuator is low with respect to heat release from the flame, and for the small temperature rise that they produce with a consequent low impact on thermal production of NOx. Several studies proved that plasma discharges improve the ignition of fuel/air mixtures [25,26], increase flame propagation [27], enhance flame stabilization [28,29], and extend flammability limits [30].
Hence, a plasma actuator may be substantially defined as a device able to change locally the chemical and the flame dynamic by the application of an applied electric field [31]. The electric field may be produced using a high-voltage, short duration, high-frequency pulse or sinusoidal voltage signal. Previous studies showed that nanosecond high-voltage pulses might reduce the ignition delay time, and asserted the application of the plasma actuation for the flame stabilization [32,33]. In [34], an electrical pulse of about 10 kV, with duration of 10 ns and frequency of 30 kHz, was applied to stabilize a lean premixed methane/air flame at atmospheric pressure. The effect was the stabilization of the lean flame and the reduction of the lean extinction limit by about 10%–15%, with a plasma power that was less than 1% of the power of the flame. In [35], a repetitive discharge (9 kHz), with voltage pulse duration of the order 100 ms, was used to extend the flammability limit of a lean premixed propane/air mixture at atmospheric pressure. In this context, there is a lack of investigations regarding the application of sinusoidally driven plasma discharges for combustion enhancement. Sinusoidal plasma actuators were successfully used for cold flow control [31,36,37]. In the field of combustion control, many studies were carried out on the liftoff flame control [38,39] or on the supersonic flow combustion control [40].
Regarding the geometry of actuator, dielectric barrier discharge (DBD), also called silent discharge, appears as one of the more promising nonthermal plasma sources. DBD plasmas are generated between two electrodes that are separated by a dielectric surface [23,24].
DBD repetitive pulsed plasmas have been applied to stabilize methane jet flames [30] or propane jet flames [41]. The liftoff height was found to be reduced by more than 50% in the presence of plasma discharges.
Hence, DBD plasma actuators might be a promising technique for flame stabilization. The present work investigates the behavior of methane/air NDF and IDF flames under the effects of a DBD actuator applied to stabilize and improve the combustion efficiency under different inner airflow rates. The plasma discharge is generated using a pulsed sinusoidal high-voltage signal with dissipated electrical power up to 33 W. The flame characterization was performed by a charge-coupled device (CCD) camera in the visible spectral range and by an UV-intensified CCD camera, in association with different optical filters able to select signals from the chemiluminescent species OH*, CH*, and CO2*.

2. Methodology

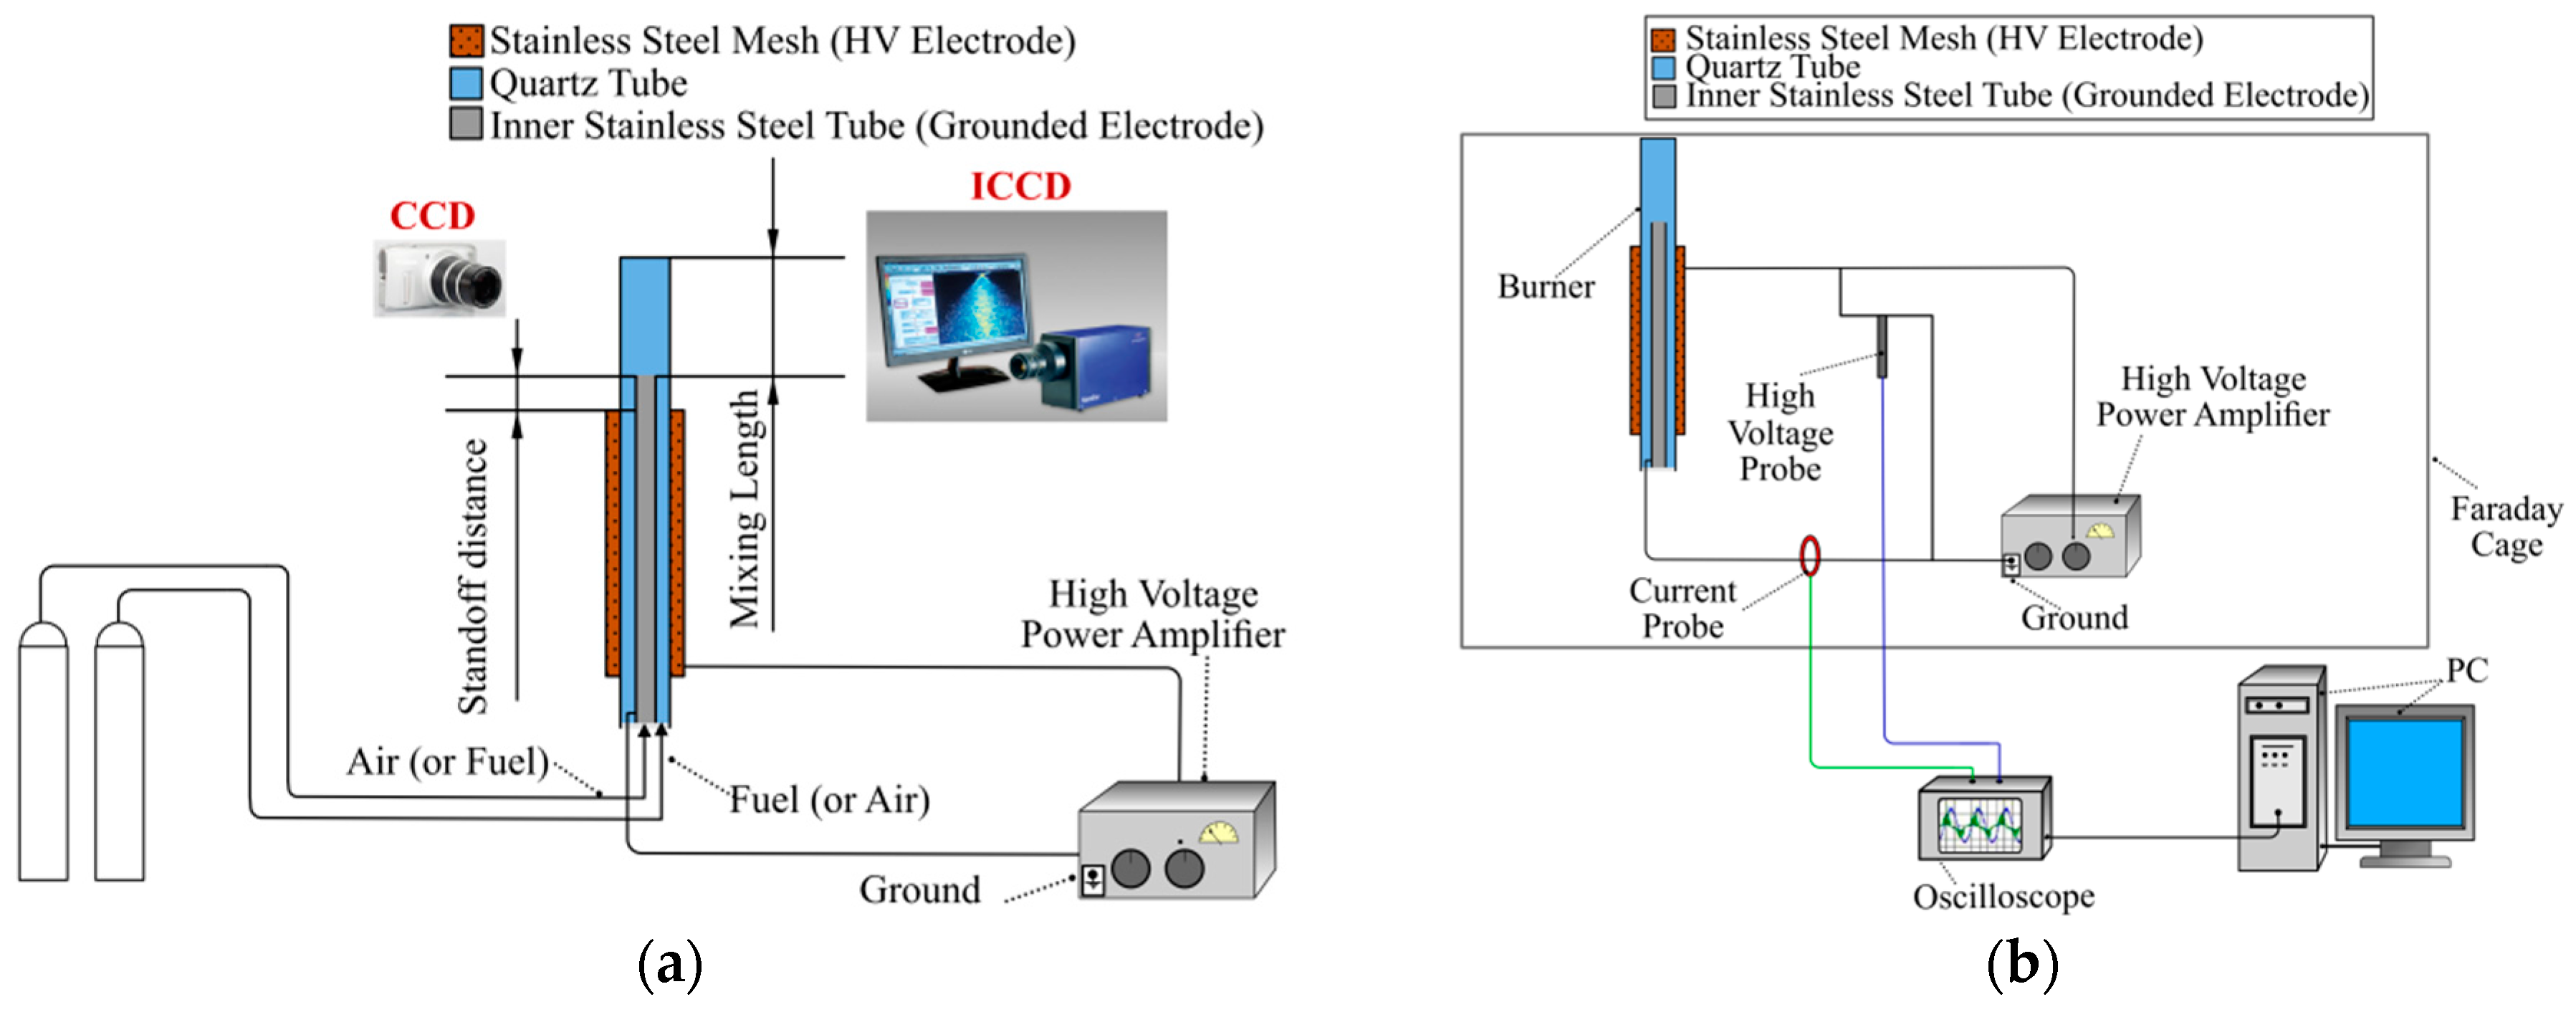
2.1. Experimental Apparatus

Experiments were carried out using a burner equipped with the coaxial DBD plasma actuator, a gases feeder system with air and methane fueling lines; a high-voltage (HV) sinusoidal power supply system; a high-voltage probe, a current probe, and an oscilloscope; and a visible range charge-coupled device (CCD) camera and intensified CCD (ICCD) camera with OH*, CH* and CO2* filters, as shown in Figure 1.
The coaxial burner is realized with two concentric tubes: the internal one is a stainless-steel tube (external diameter 8 mm, thickness 0.5 mm) and the external one is a quartz tube (internal diameter 10 mm, thickness 1 mm). The two tubes are positioned to have a mixing length, defined in Figure 1a, equal to 60 mm.
The gases feeder is composed of air and methane tanks, pressure regulators, and flow controllers. The flow meters used are the SFAB-50U-HQ12-2SV-M12 of Festo® (Esslingen, Germany) for the air [42], with a measurement uncertainty of ±3% of measured value, and the EW-32907-57 of ColeParmer® (Vernon Hills, IL, USA) for the methane [43], with a measurement uncertainty of ±0.8% of reading.
The DBD actuator is realized with a copper ring (80 mm long and thickness equal to 0.6 mm) rolled up the quartz tube that acts as an HV electrode, while the steel central tube acts as the grounded electrode. The HV electrode is connected with the HV Dielectric Barrier Corona and Plasma Discharge Resonant Driver (commercialized by Information Unlimited® Mont Vernon, NH, USA) generator [44]. It supplies the actuator with a sinusoidal voltage waveform V (t) characterized by a frequency of ≈20 kHz and different amplitudes.
The standoff distance, defined in Figure 1a, was set to 0, hence the influence of the plasma actuation is significant for the fuel–air mixing.
In Figure 1b, it is also possible to observe the positioning of the HV probe (Tektronix P6015A) [45] on the HV line and the current probe (Bergoz Current Transformer CT-D1.0-B) [46] on the ground side. The oscilloscope (Tektronix TDS2024C) [47] is used for the signal acquisition from the two probes with an accuracy of ±3%. A dedicated personal computer (PC) is used for the signals’ acquisition. The oscilloscope captures 2500 points at a sampling rate of 25 MHz, therefore, two periods (T) for each waveform. For each input voltage, 128 acquisitions are recorded and averaged.

2.2. Chemiluminescence Measurement Systems

The high-speed CCD camera MEMRECAM GX-3® of (NAC Image Technology, Simi Valley, CA, USA) (visible spectral range emission) [48] was used to capture the flame images in the visible spectral range. Images were taken with a frame rate of 200 Hz.
The Phantom Miro M320S® High-Speed Digital Camera CCD by La Vision® [49], in association with an intensifier by Lambert Instrumentation® [50], was used to visualize the UV emissions from the flame following the plasma application. In particular, using appropriate filters, images of OH*, CH*, and CO2* radicals were carried out. The ICCD has a maximum frame rate at full resolution (1920 × 1080) of 1540 Hz, a sensitivity of 1100 ISO, interframe time of 1.4 μs, and a pixel depth of 12 bit. The intensifier (photocathode material S20, Phosphor screen P46) has a spectral range of 270–450 nm. The intensifier gain was set to 600 for all the chemiluminescence acquisitions. The quantum efficiency (QE) of the intensifier/CCD coupling for the two wavelengths is about 0.6% for OH*, 3.85% for the CH*, and 1.9% for the CO2*. The images for the analysis were taken with a resolution of 200 pixels × 400 pixels, and a flame view area of 70 × 140 mm. For each test point, a set of 50 single-images was recorded. The recording rate was 10 frames per second with an integration time of 50,000 μs and 2 × 2 pixel hardware binning.
The chemiluminescence narrow bandpass filters are centered at 307 nm, 370 nm, and 431 nm, respectively, for OH*, CO2*, and CH* (including the CO2* broadband emission). The optical width of each optical filter is smaller than 10 nm to prevent overlapping of the bandwidth range of transmission. The signals were recorded by the data acquisition (DAQ) device of National Instruments® NI-USB 6008 [51] with an acquisition frequency of 5 kHz and 1 s of acquisition time for each test. A Faraday cage was used to shield the cameras from any electromagnetic interference due to the high electric fields required to generate the plasma discharge.

2.3. Test Conditions

With the aim to study the flame behavior near the blowout, different air and fuel mass flows were driven, which leads to different values of the air-to-fuel momentum flux ratio (O/F)mom that is defined as:
( O F ) mom = ( ρ u 2 ) air ( ρ u 2 ) fuel ,
where ρ is the density and u is the exit velocity. In Table 1, details of the experimental conditions were reported. All the experiments were conducted keeping the pressure at atmospheric level, and the inlet temperature, for both fuel and air, at 288 K.

3. Results and Discussion

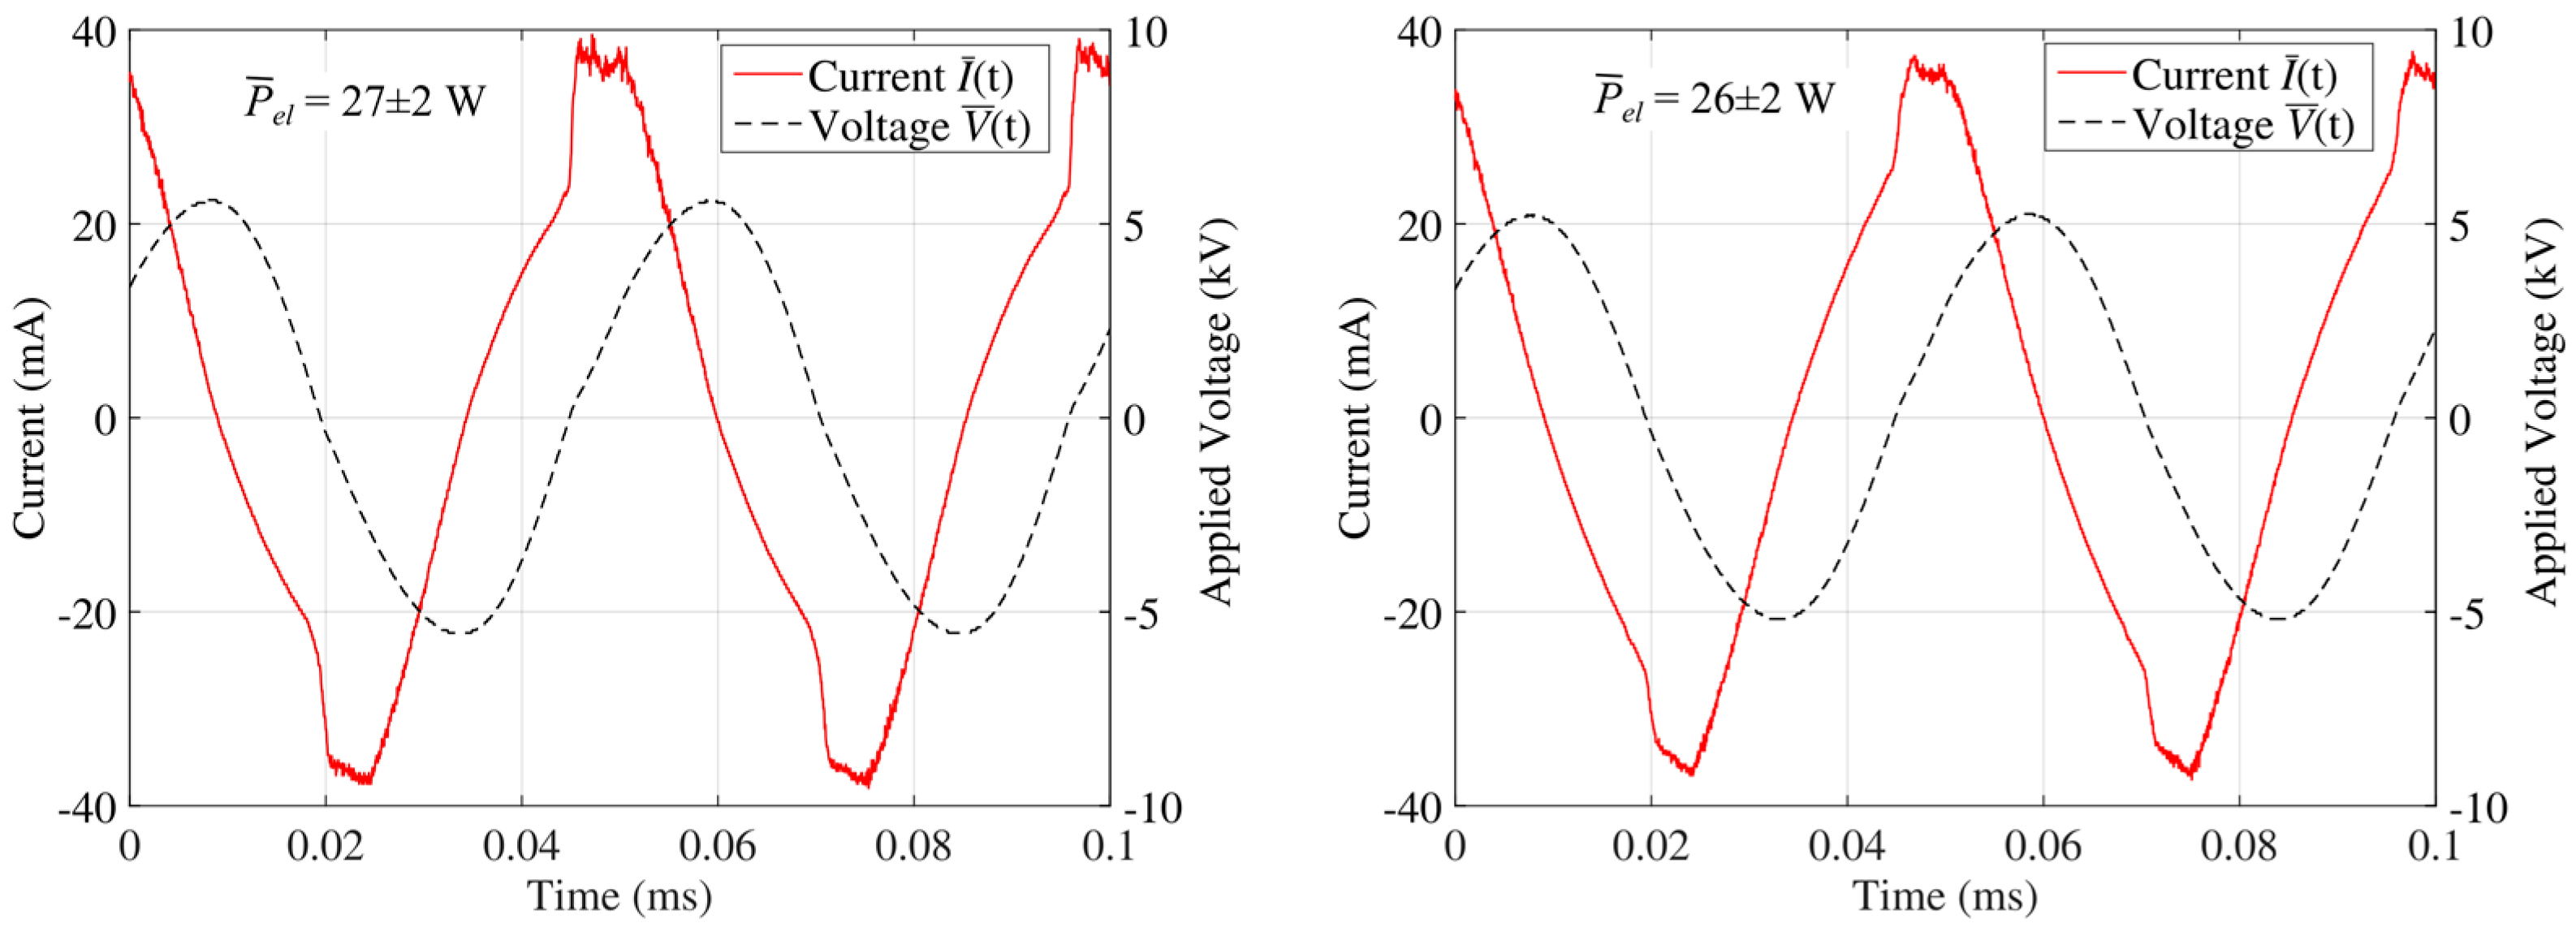
3.1. Electrical Characterization of the Plasma Discharge

As said before, the high-voltage and current probes permit acquisition of the signals of averaged voltage V ¯ ( t ) and of averaged current I ¯ ( t ) . They were used for calculating the electric power dissipation P ¯ e l through the following formula:
P ¯ e l = 1 2 T 0 2 T I ¯ ( t ) V ¯ ( t ) d t ,
Numerical integration was performed by the trapezoidal rule [52] and the corresponding uncertainty resulted in ±4.2%.
All measurements were made in presence of flame. An example of an acquisition (i.e., averaged signals of the applied voltage and the current flowing in the discharge) is reported in Figure 2.
In Table 2, the power dissipation for all the tested operating conditions is reported. It is evident that the rise of the applied voltage leads to an increase of the dissipated power, while at the same voltage, the change in the standoff distance does not influence the power. The electrical power consumption was less than 33 W.

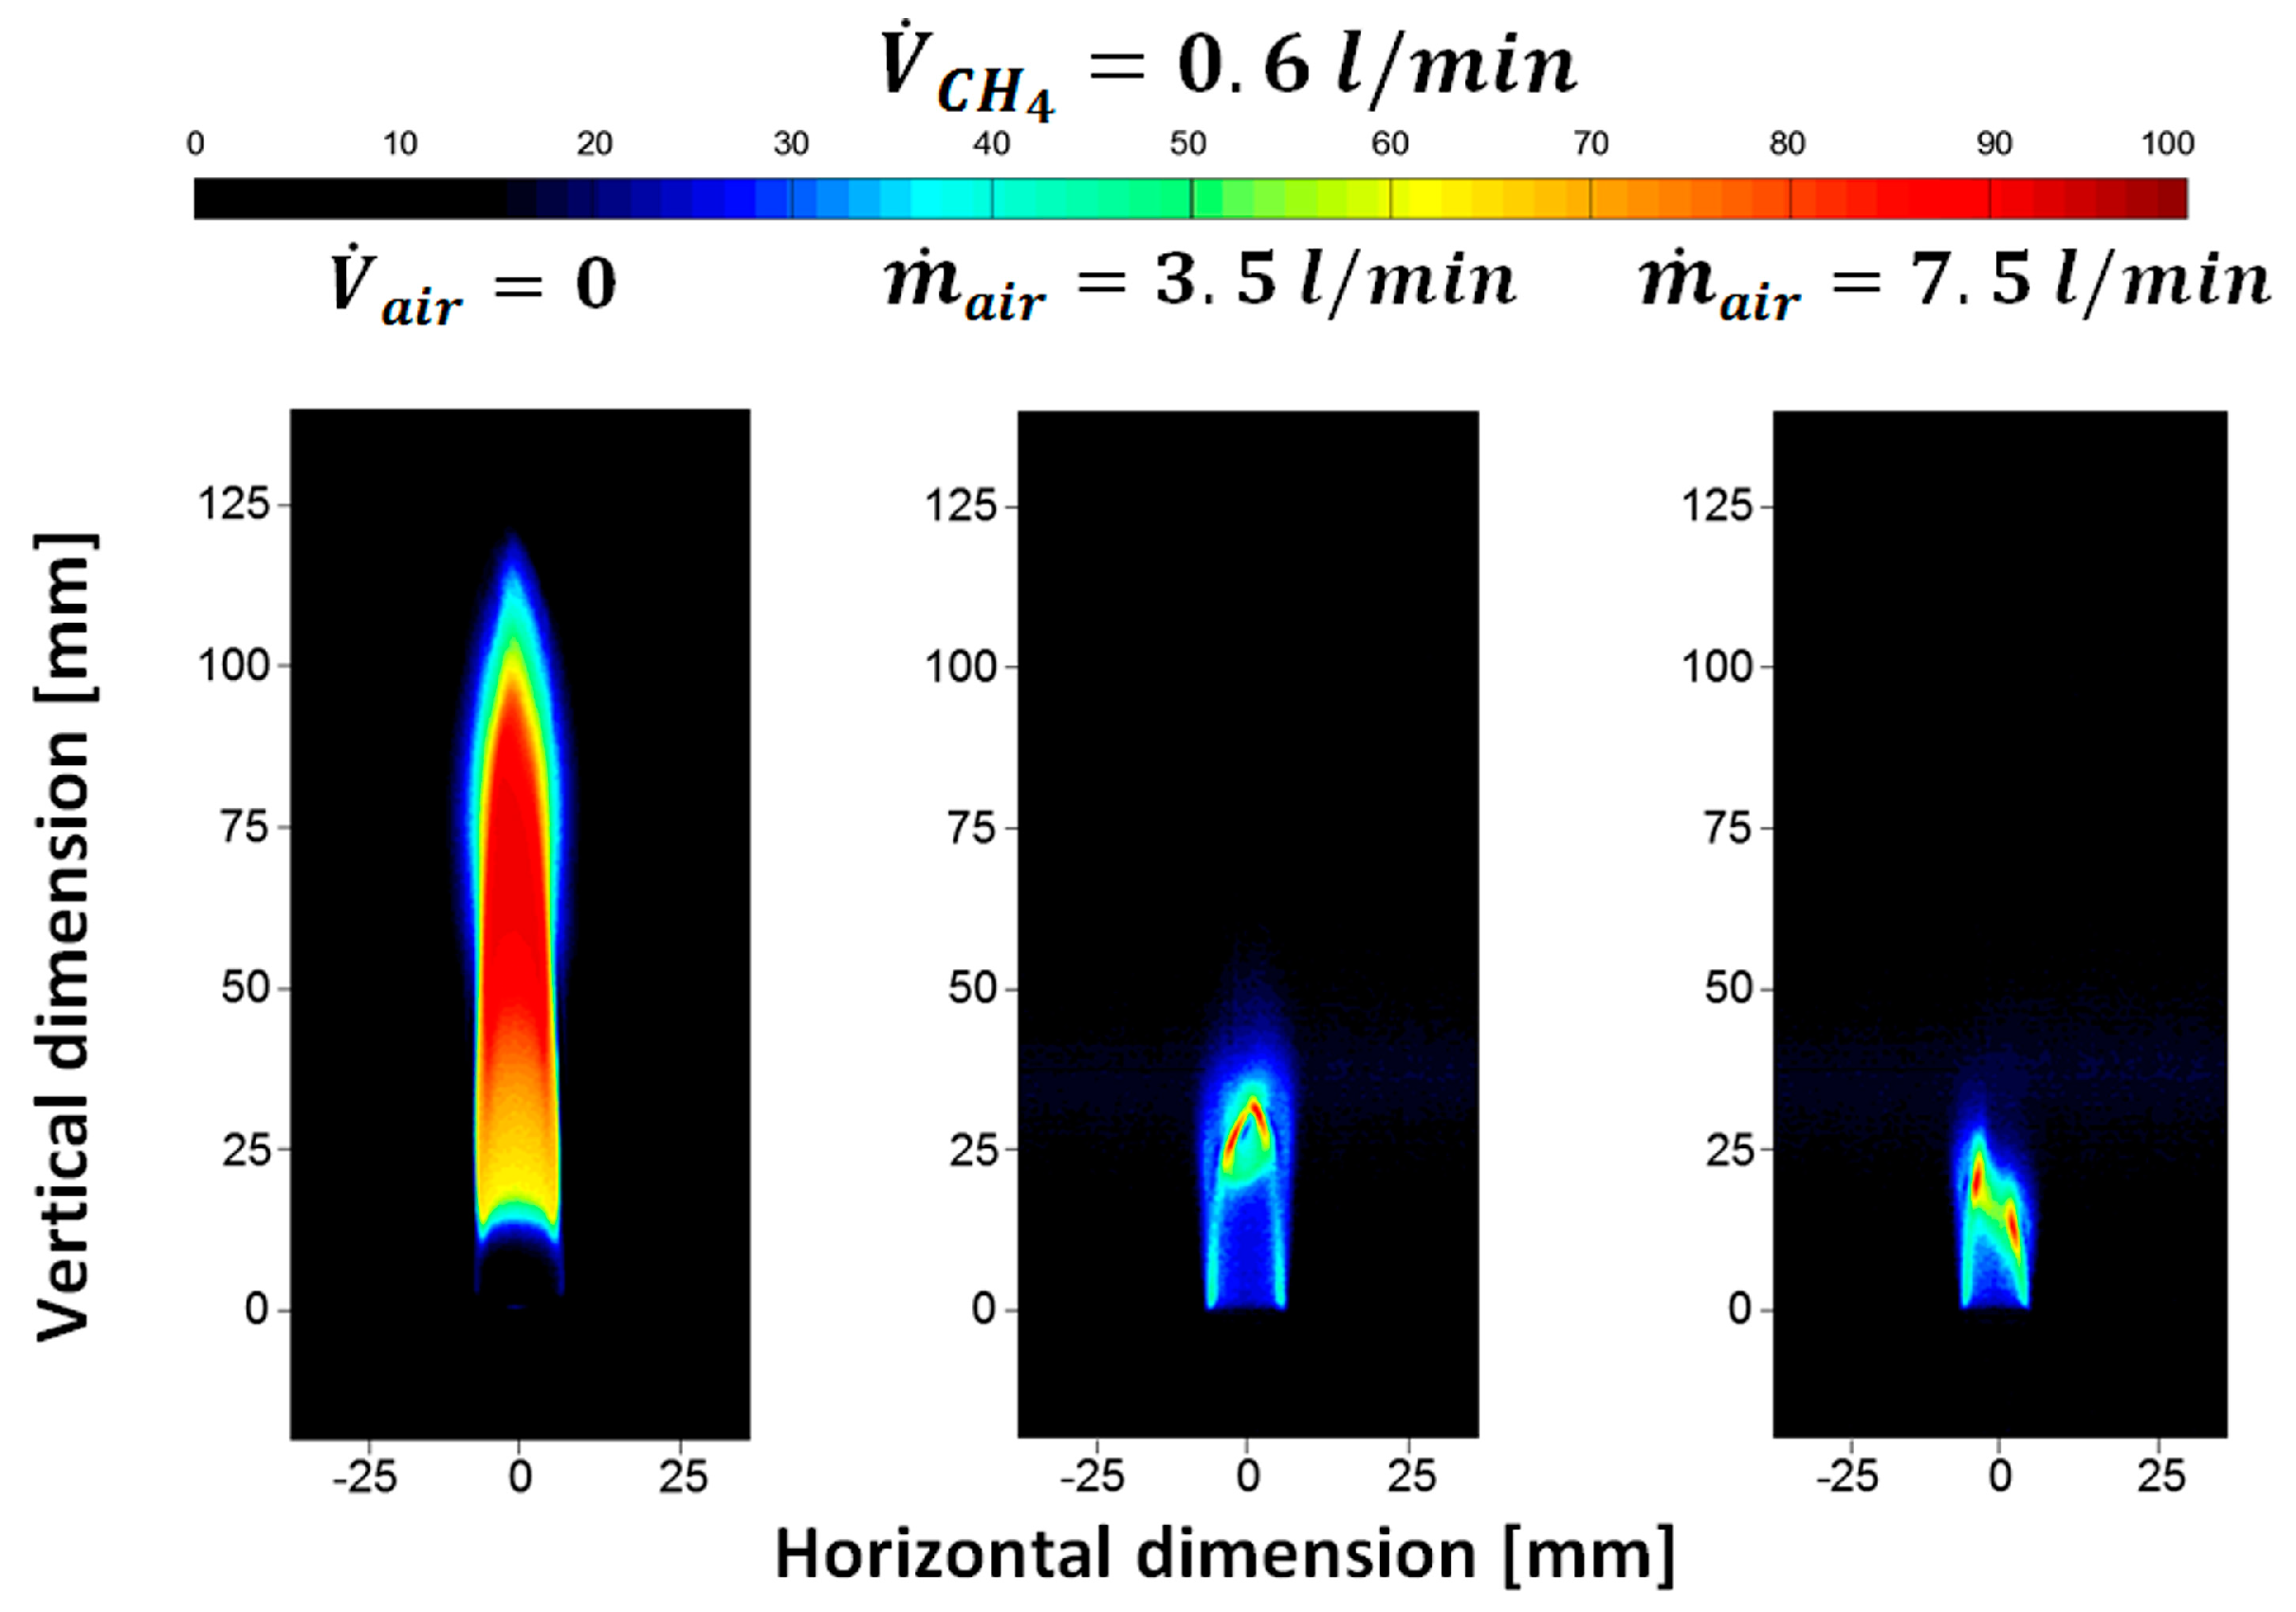
3.2. Visible Appearance of Flame at Different Fueling Mass Flow Rates in Absence of Plasma Actuation

As confirmed in [53], the relative velocity between the air and fuel jets, hence the air-to-fuel momentum flux ratio (O/F)mom, governs the IDF structure. The appearance of IDF flame depends on the airflow rate. The fueling rate and the airflow rate determine the overall equivalence ratio, as well as the momentum flux ratio. Fixing the fueling rate, an increase in the airflow rate decreases the overall equivalence ratio, but increases the (O/F)mom.
Figure 3 shows the visible flame images recorded by a high-resolution CCD camera. In presence of the inner air mass flow rate, the flame shows a relatively bright base and a tower on top of the base, which is different from the flame without the inner air when the flame presents an overall stretched appearance. The flame height decreases if the inner air mass flow rate increases, indicating that the flame propagation speed is relatively fast. The flame height reduction is about 65% and 75% in presence of inner air.
The variation of the color of the flames is an indication of the extent of fuel entrainment. In the case of pure diffusive flame ( V ˙ a i r = 0 ) , the fuel burns with surrounding air. In that case, the flame presents high intensity in false-color mode. In IDF flame, the central air jet entrains the fuel jet. The level of entrainment of the fuel jet by the air jet governs the area where the fuel is burned in the diffusion mode or premixed mode.
By increasing in airflow rate, entrainment is higher, and this minimizes the high-intensity region that might correspond to the soot emission. The same behavior has been reported in [8]. Increasing the airflow, the flame becomes asymmetric. The reduction in the flame length can be explained with the rise of the shear between high-velocity air jet and low-velocity fuel jet that leads to an enhancement of the mixing between them and to formation of shorter flame length. The enhanced mixing between air and fuel jets is also evident from the change in the intensity of the luminous zone. The reduction in visible flame length leads to smaller residence time for incipient soot particles in the high-temperature zone, and this inhibits its surface growth.

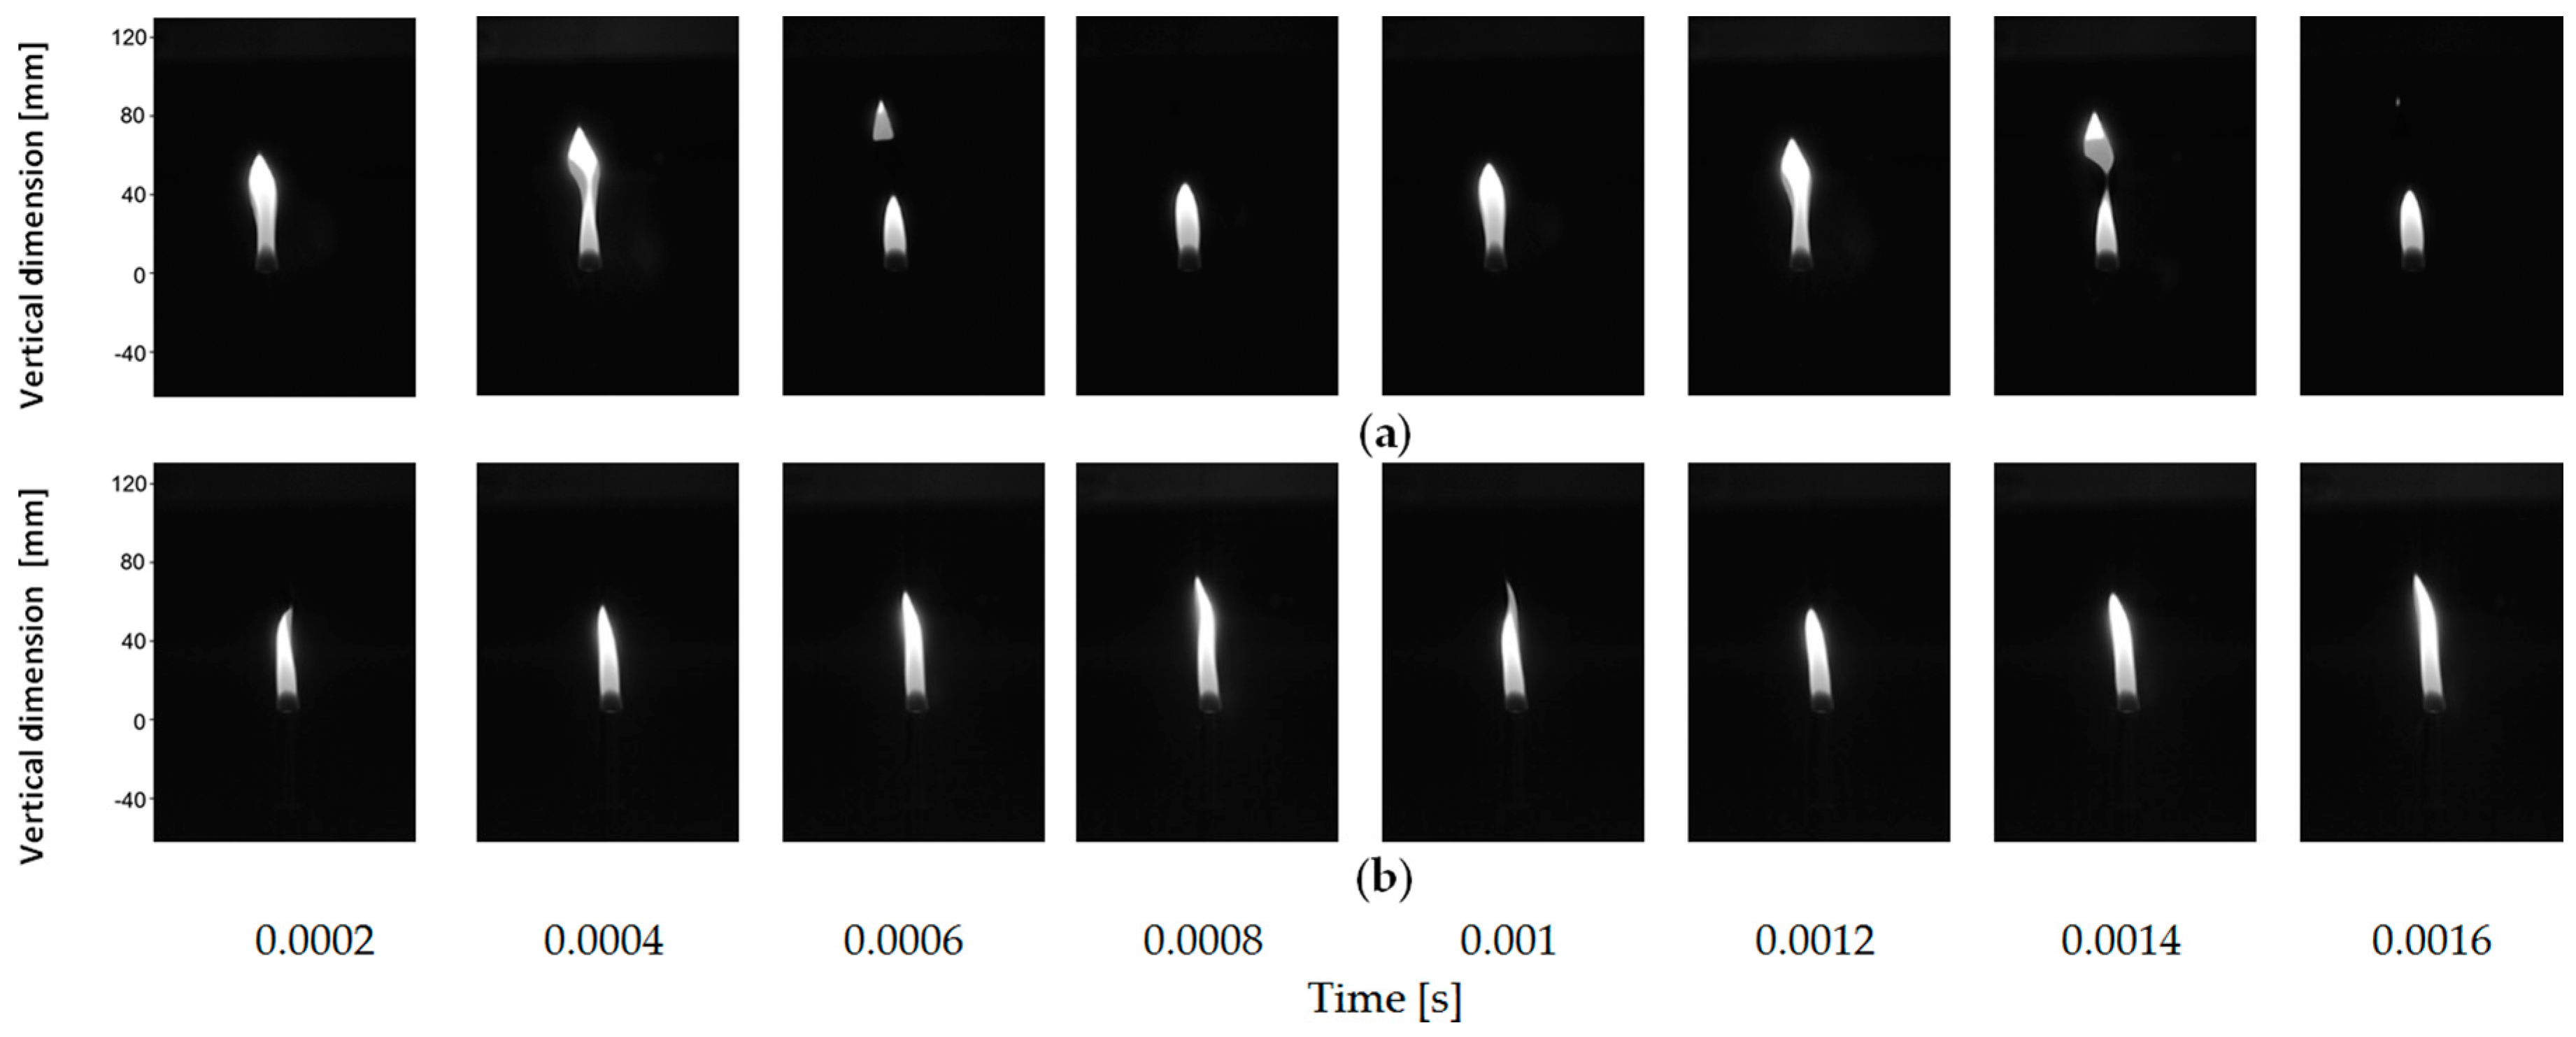
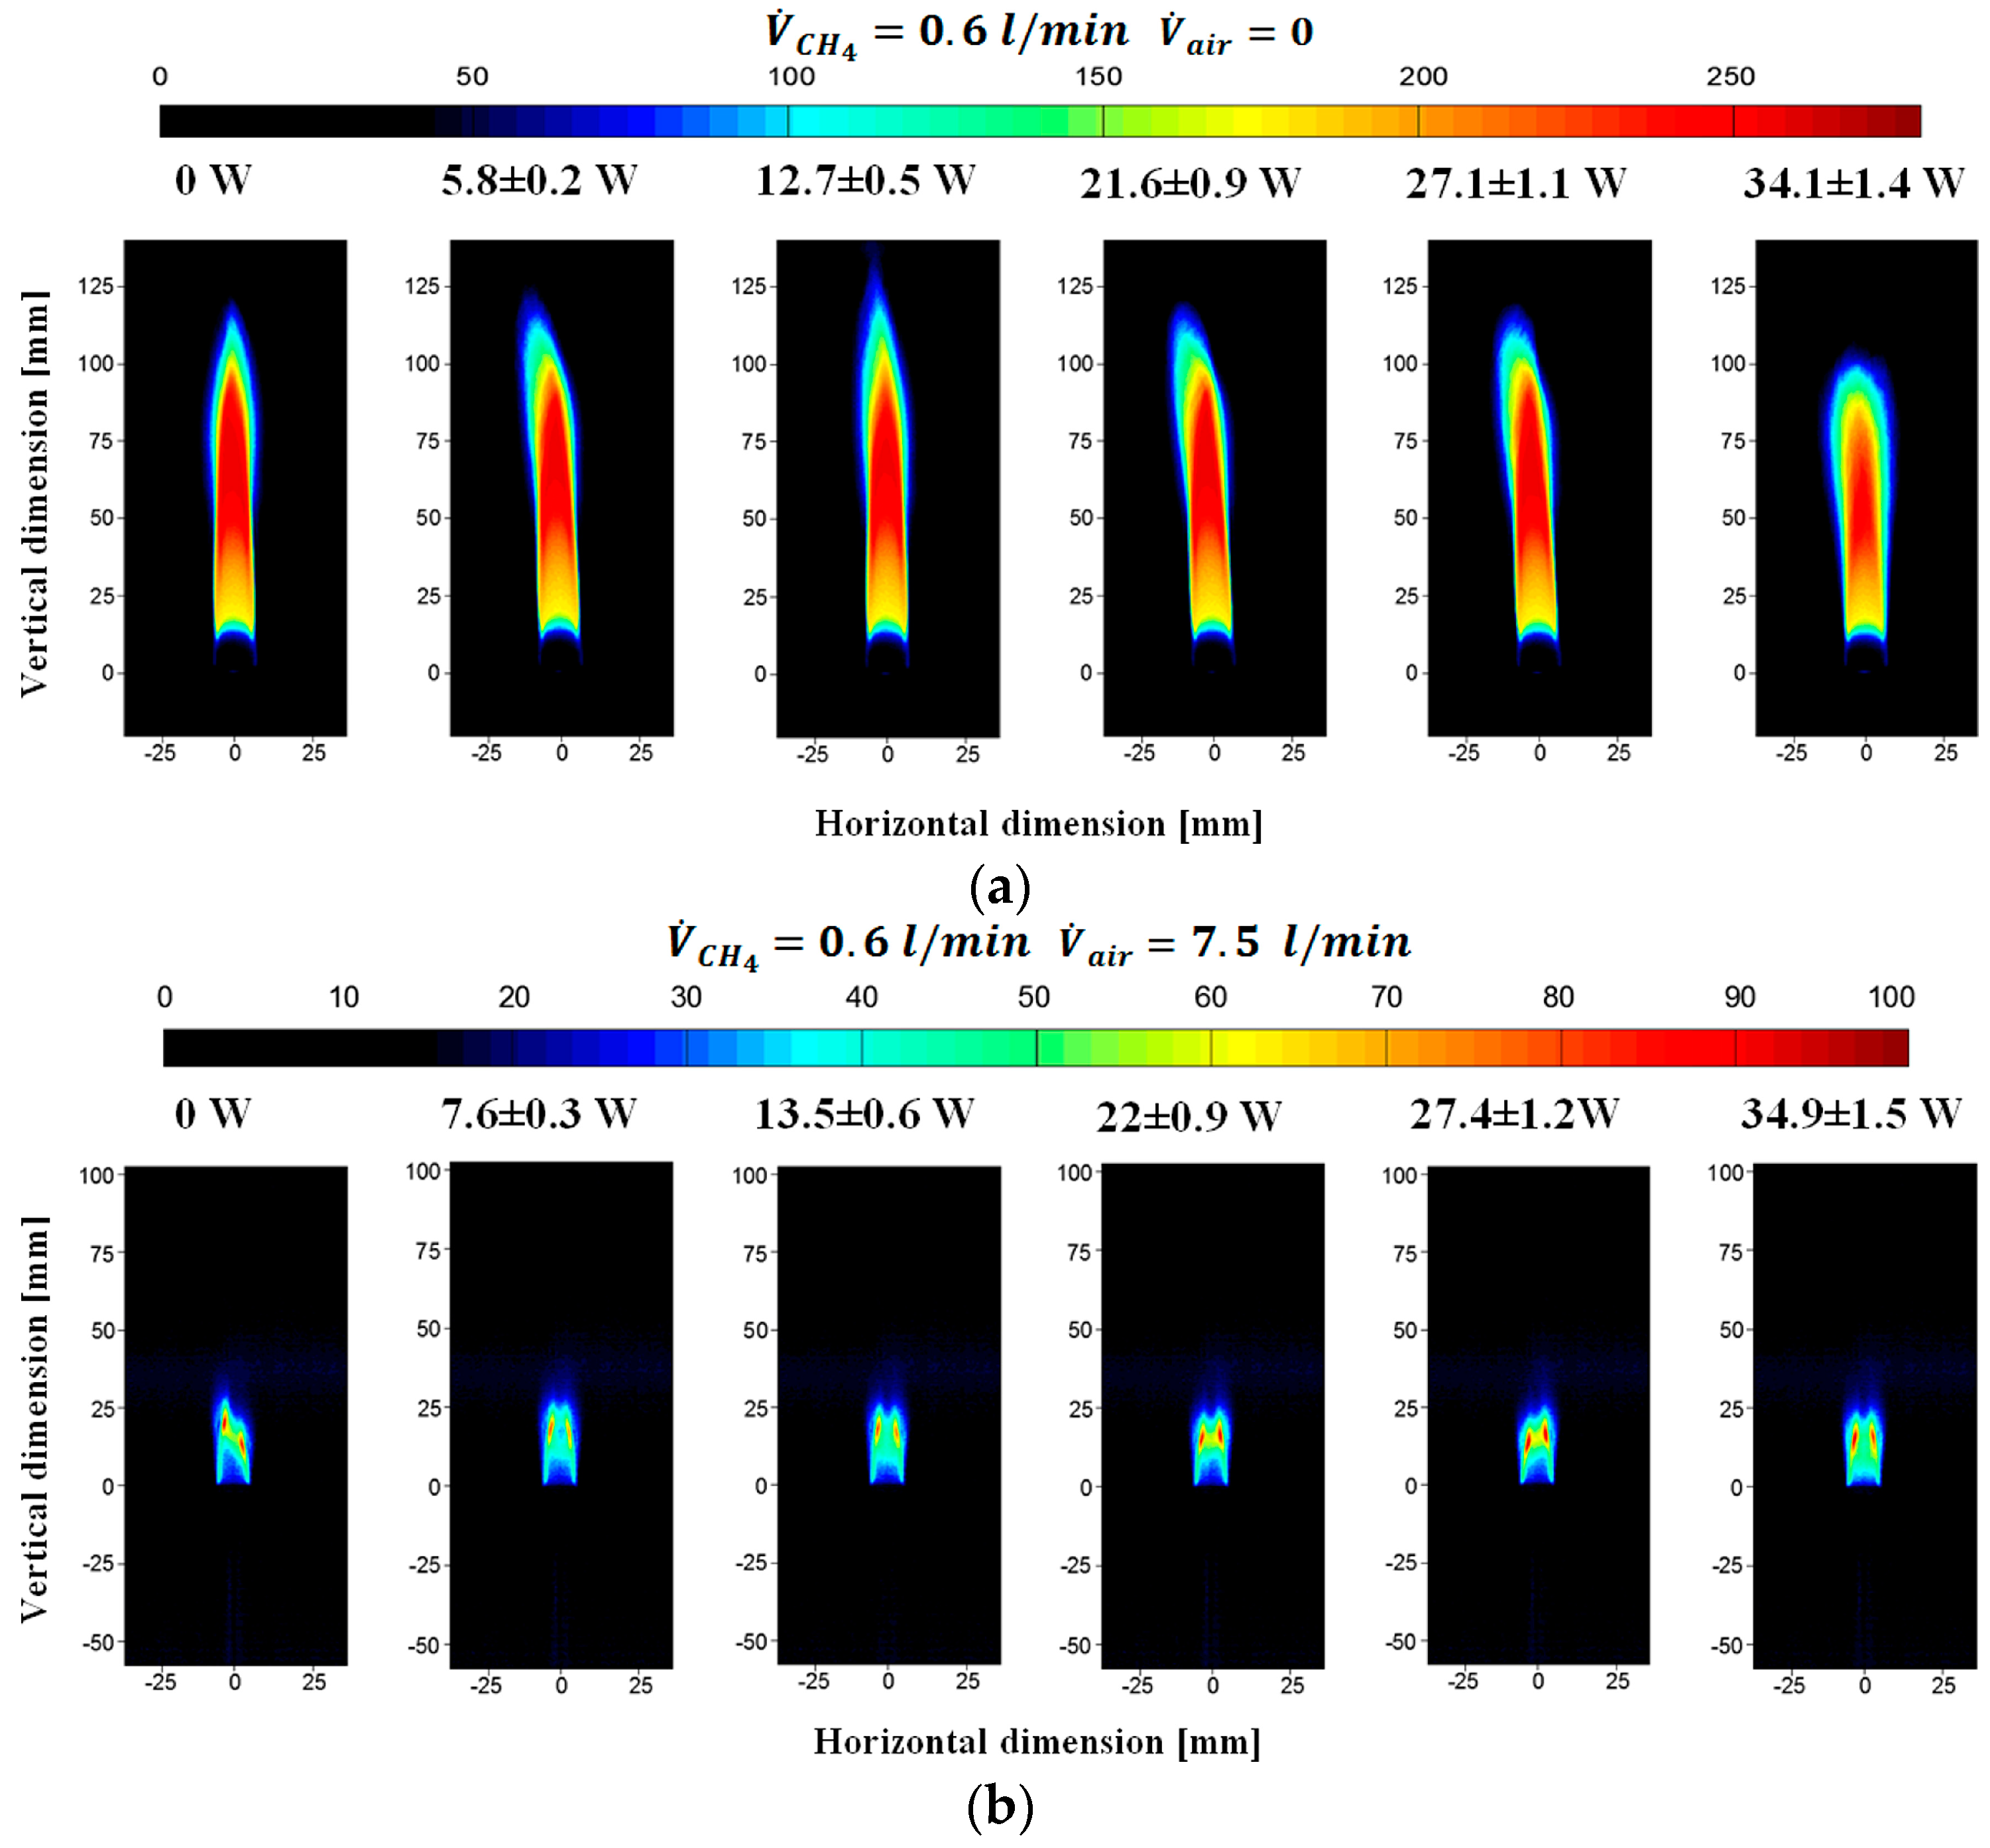
3.3. Visible Flame Morphology and Structure: Effect of DBD Plasma Actuator on the IDF Flame

The effects of the plasma discharges on the flame shape and luminosity can be qualitatively observed from direct flame visualization. Figure 4 shows the temporal evolution of the flame, without inner air flow, in absence and in presence of plasma actuation. The images were acquired with an acquisition frequency of 5 kHz and the time step is equal to 0.0002 s. In Figure 4a, the flame shows a cyclic shape with a period of 0.0008 s, a marked flame separation, and a noticeable change in the flame height. The activation of the plasma demonstrates a strong effect on flame dynamics (see Figure 4b) that appears more stable with a considerable attenuation of the flame height temporal variation.
Figure 5 shows the influence of the applied voltage—which mean the influence of the electrical dissipated power—on the flame appearance. For both the investigated conditions, combustion power from the oxidation of the fuel is about ~330 W, calculated using the lower heating value of methane. As previously shown, when increasing the inner air flow rate, which means the rise of (O/F)mom, it is evident that the momentum of the central air jet plays a significant role in the flame height of the IDF.
It is evident that there is a smaller blue (premixing) zone above the quartz exit due to local air–fuel premixing. The decrease in the momentum of the inner air jet in the axial direction reduces the mixing of the fuel and air jets. This leads to a luminous diffusion flame, which corresponds to the high-intensity region in the upper portion of flame.
The visible flame length of the diffusive outer flame part decreases with the increase of the airflow rate. At the same time, the inner flame part becomes taller.
The response of the flame to DBD discharges depends significantly on the average power deposited by the discharge, especially in presence of the inner airflow (see Figure 5b).
Figure 5a denotes a low influence of the applied plasma power on the flame, which shows a notable height decrease only in the case of the maximum electrical dissipated power. In the cases with intermediate dissipated power levels, the flame appears more asymmetric and sometimes higher than the baseline condition.
In Figure 5b, the flame appears completely asymmetric in standard condition; turning on the DBD actuator, this asymmetry decreases until the condition of maximum electrical power, where the flame is radially symmetric. Also notable is the reduction of the flame height.
The low-intensity zone between the quartz end and the soot formation zone along the axis is also reduced if the plasma is applied.

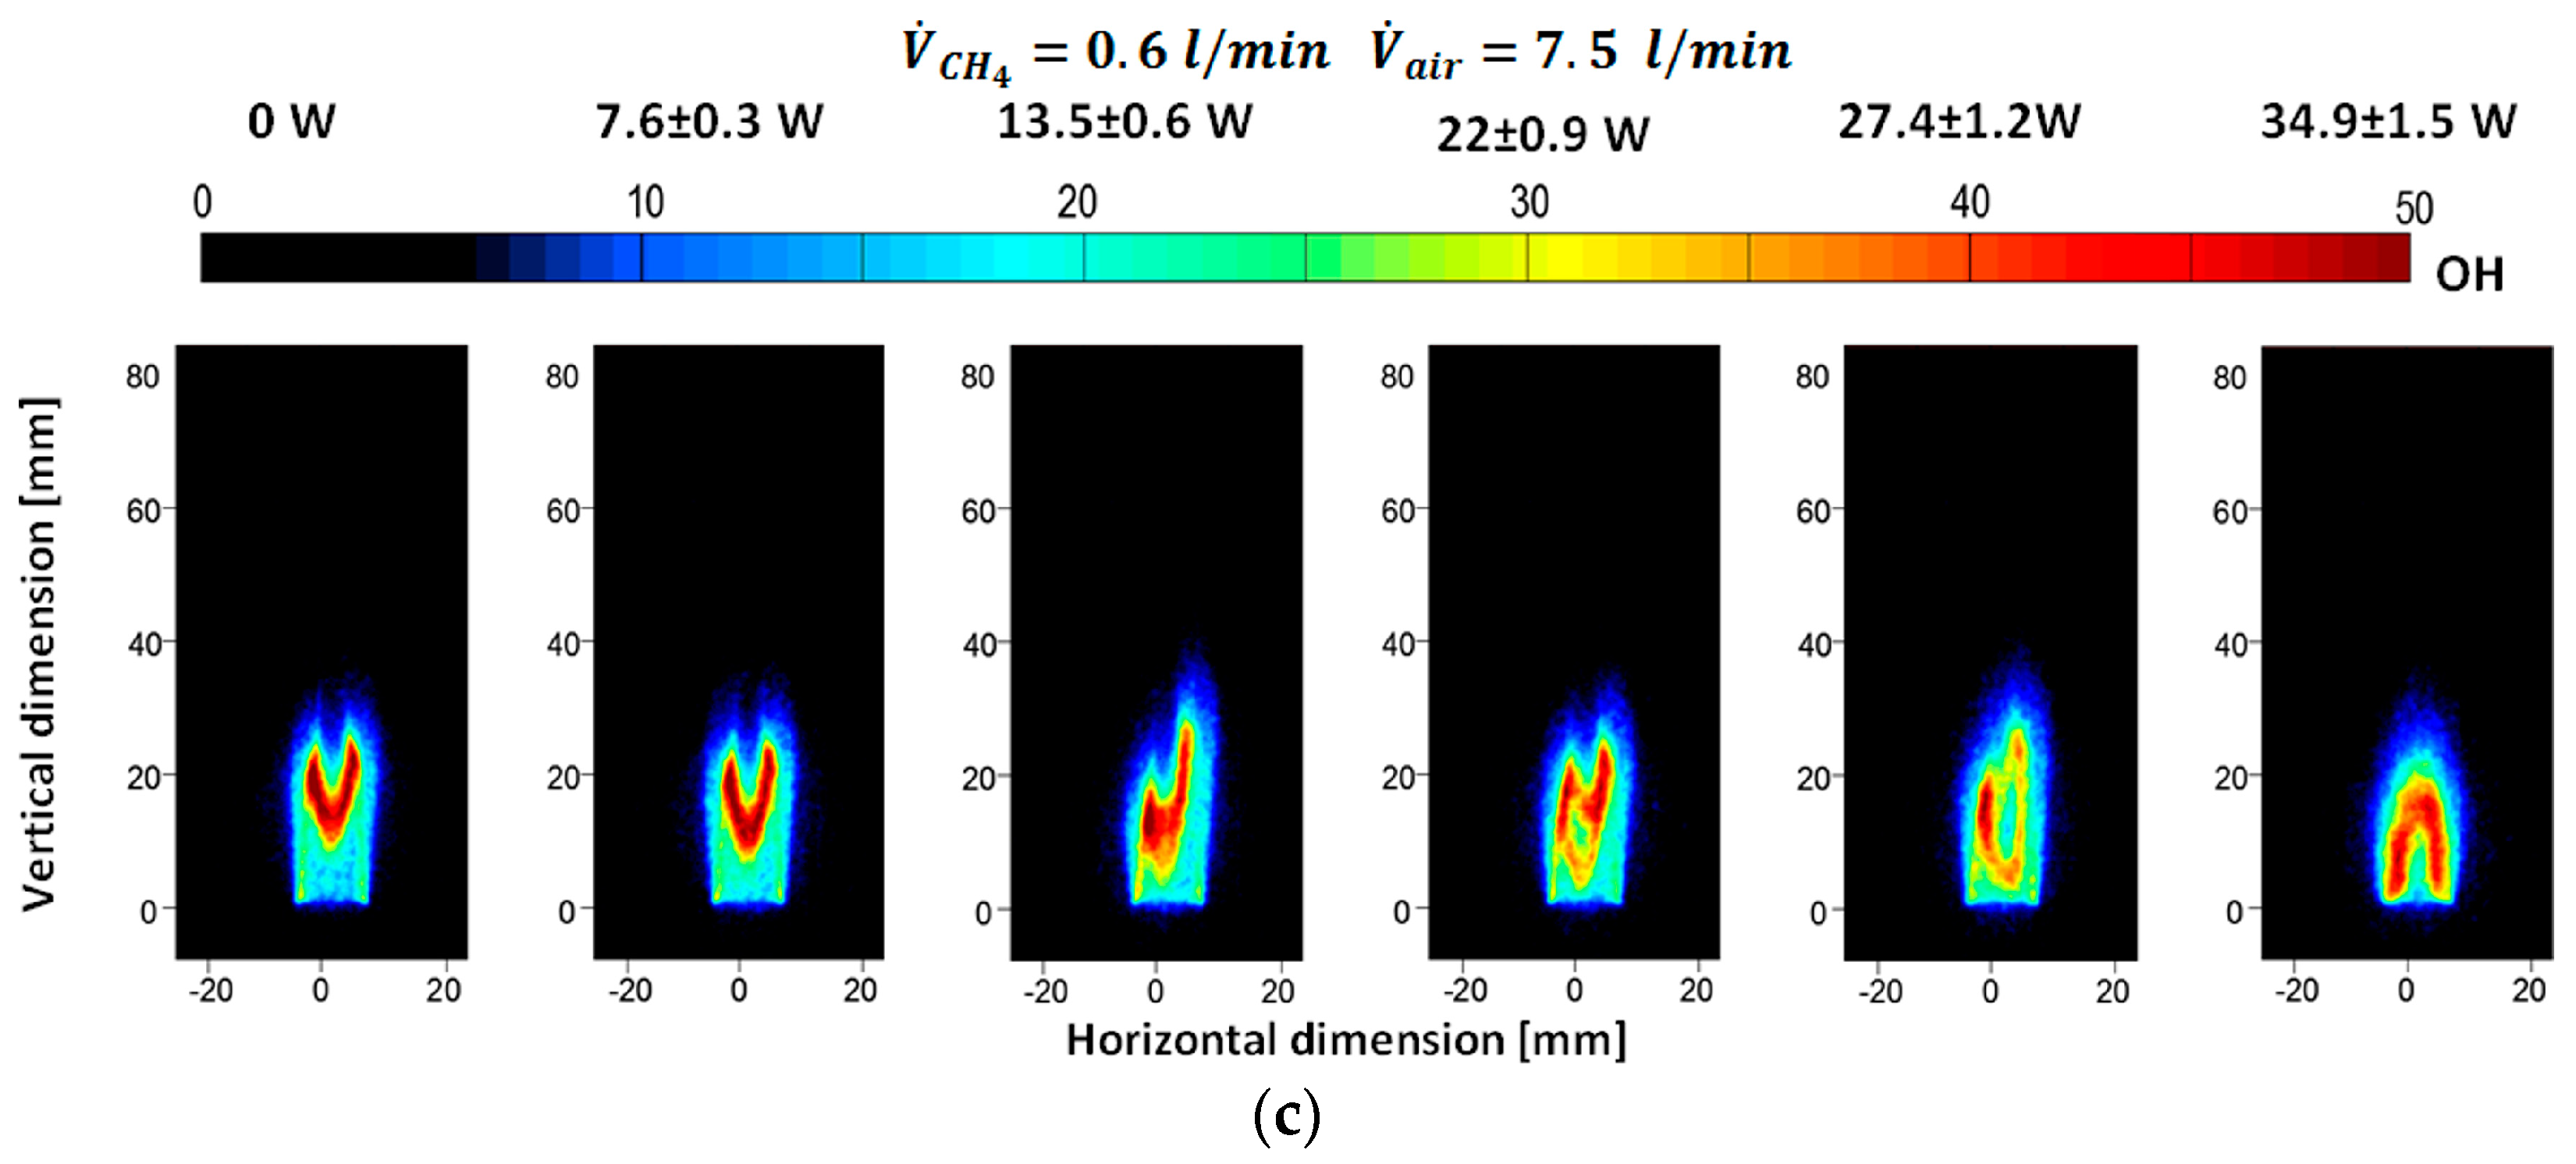
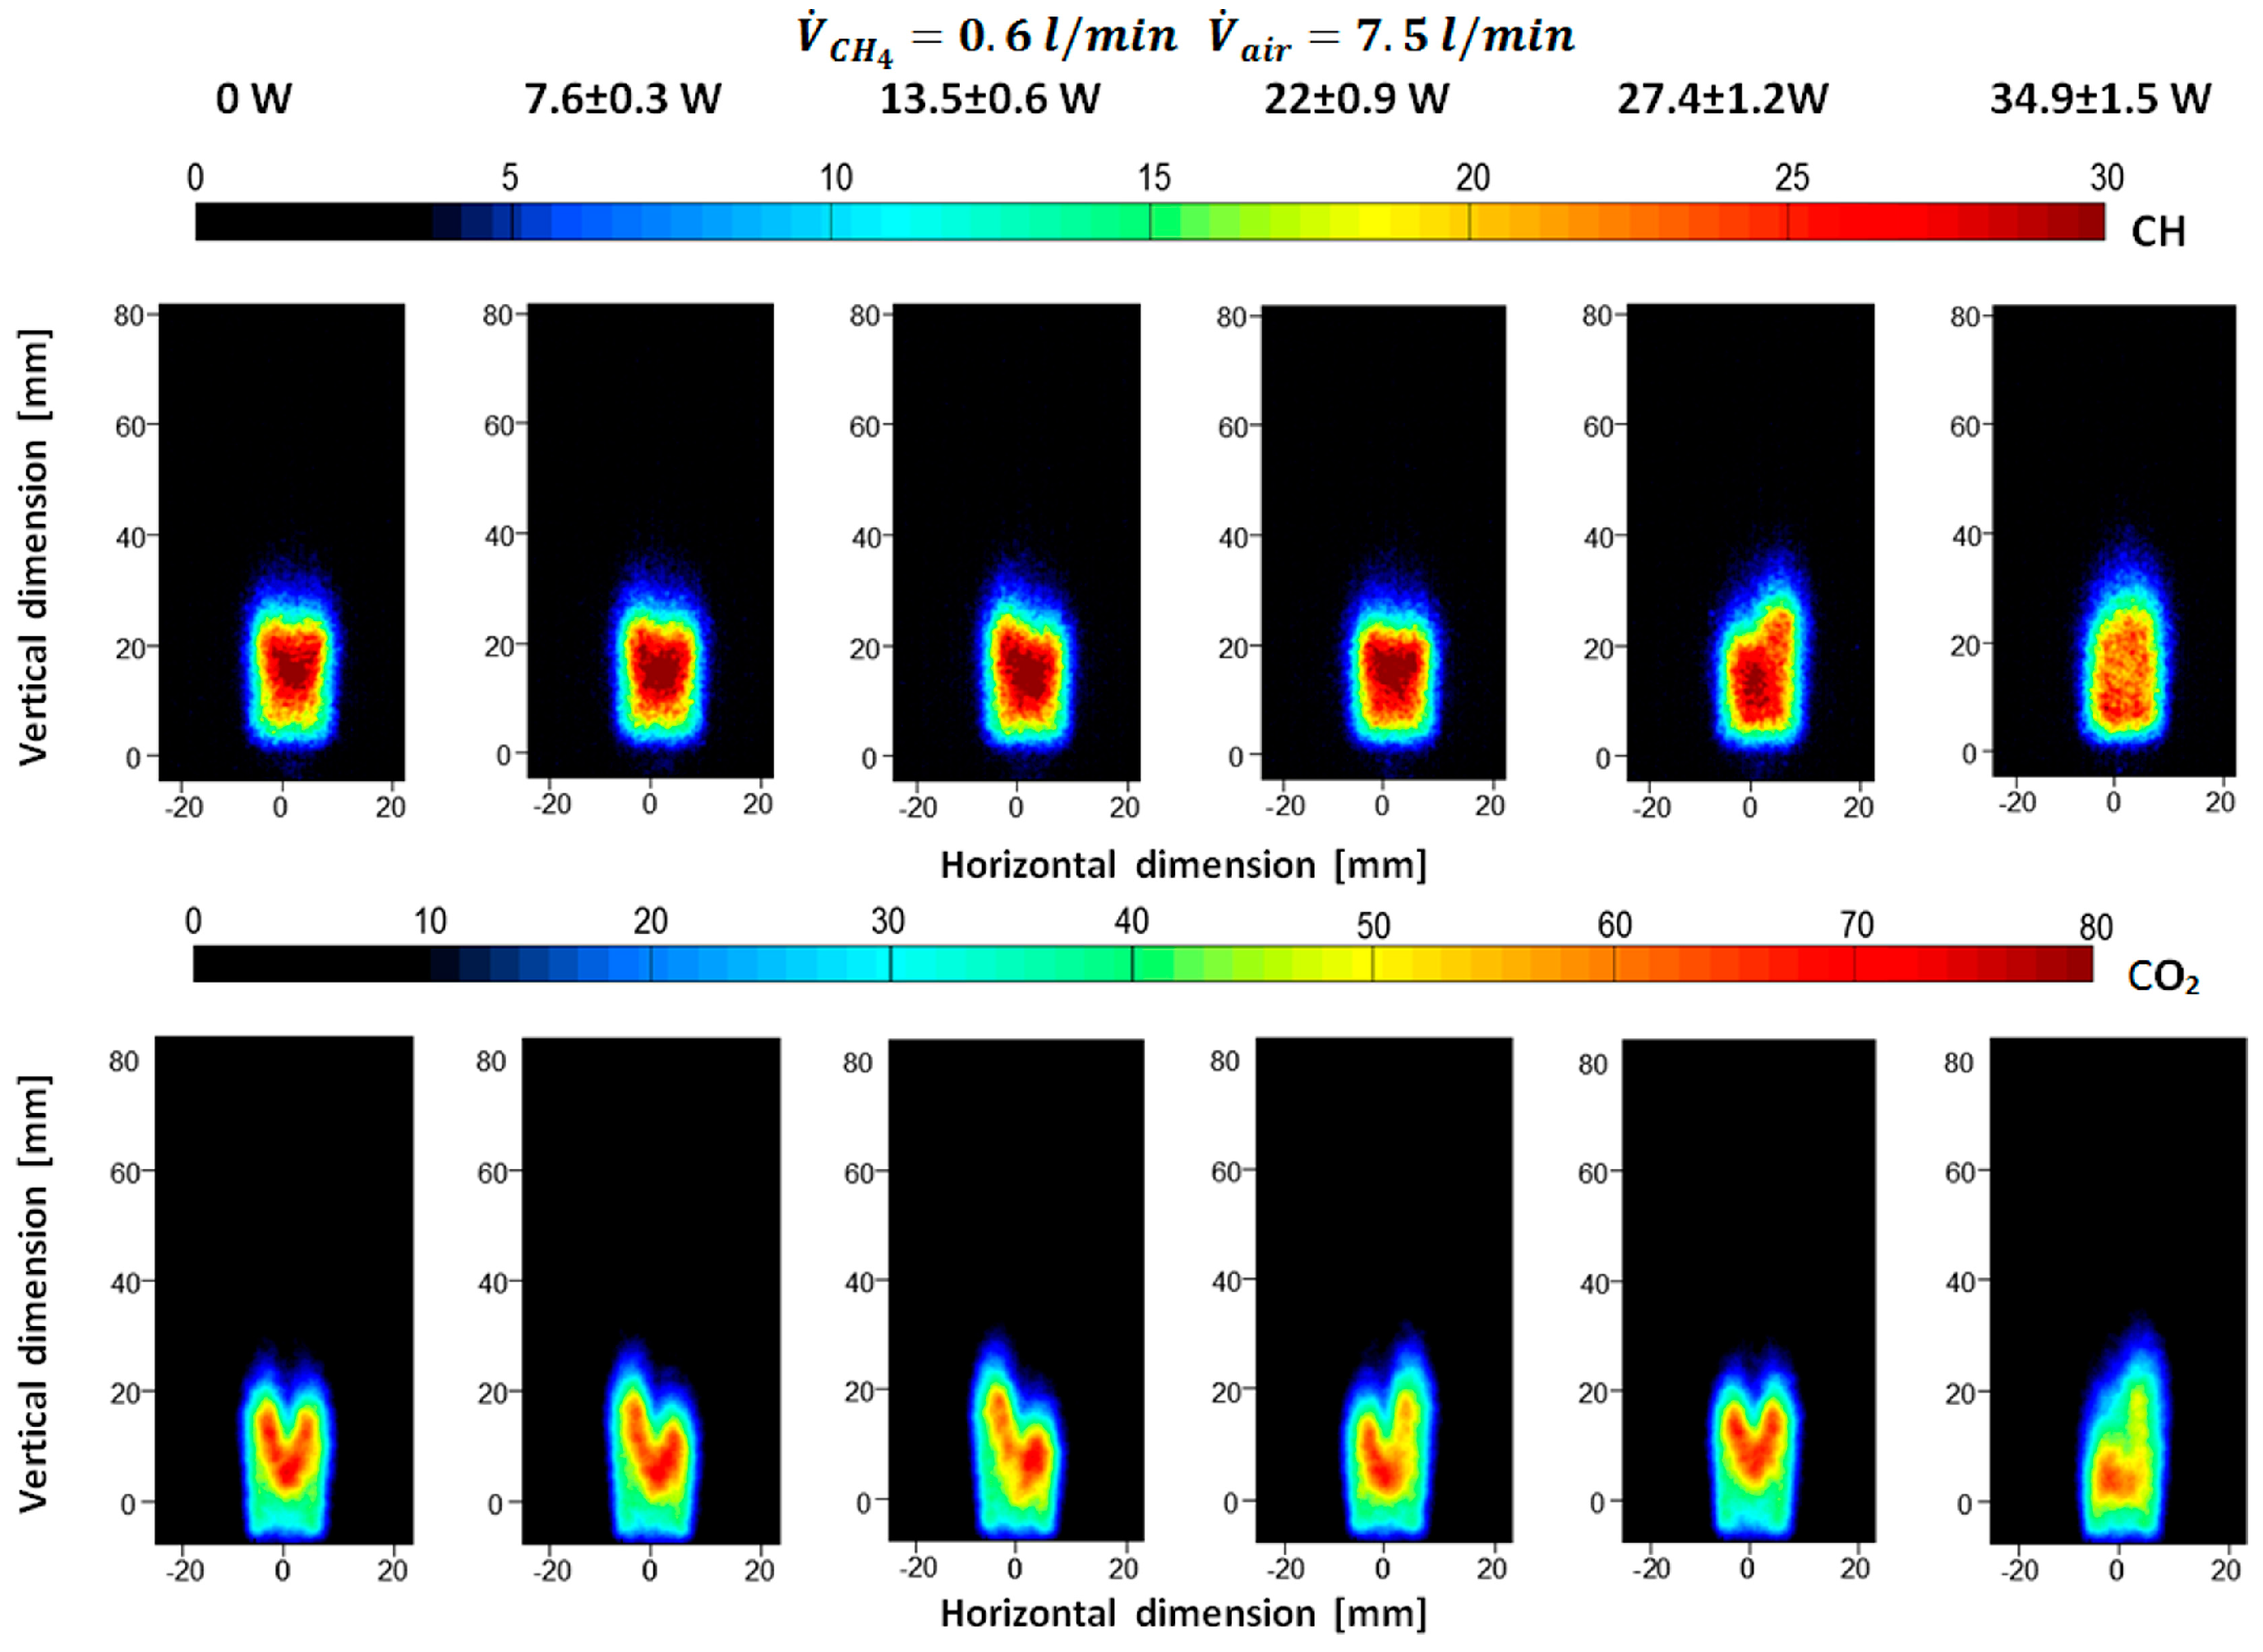
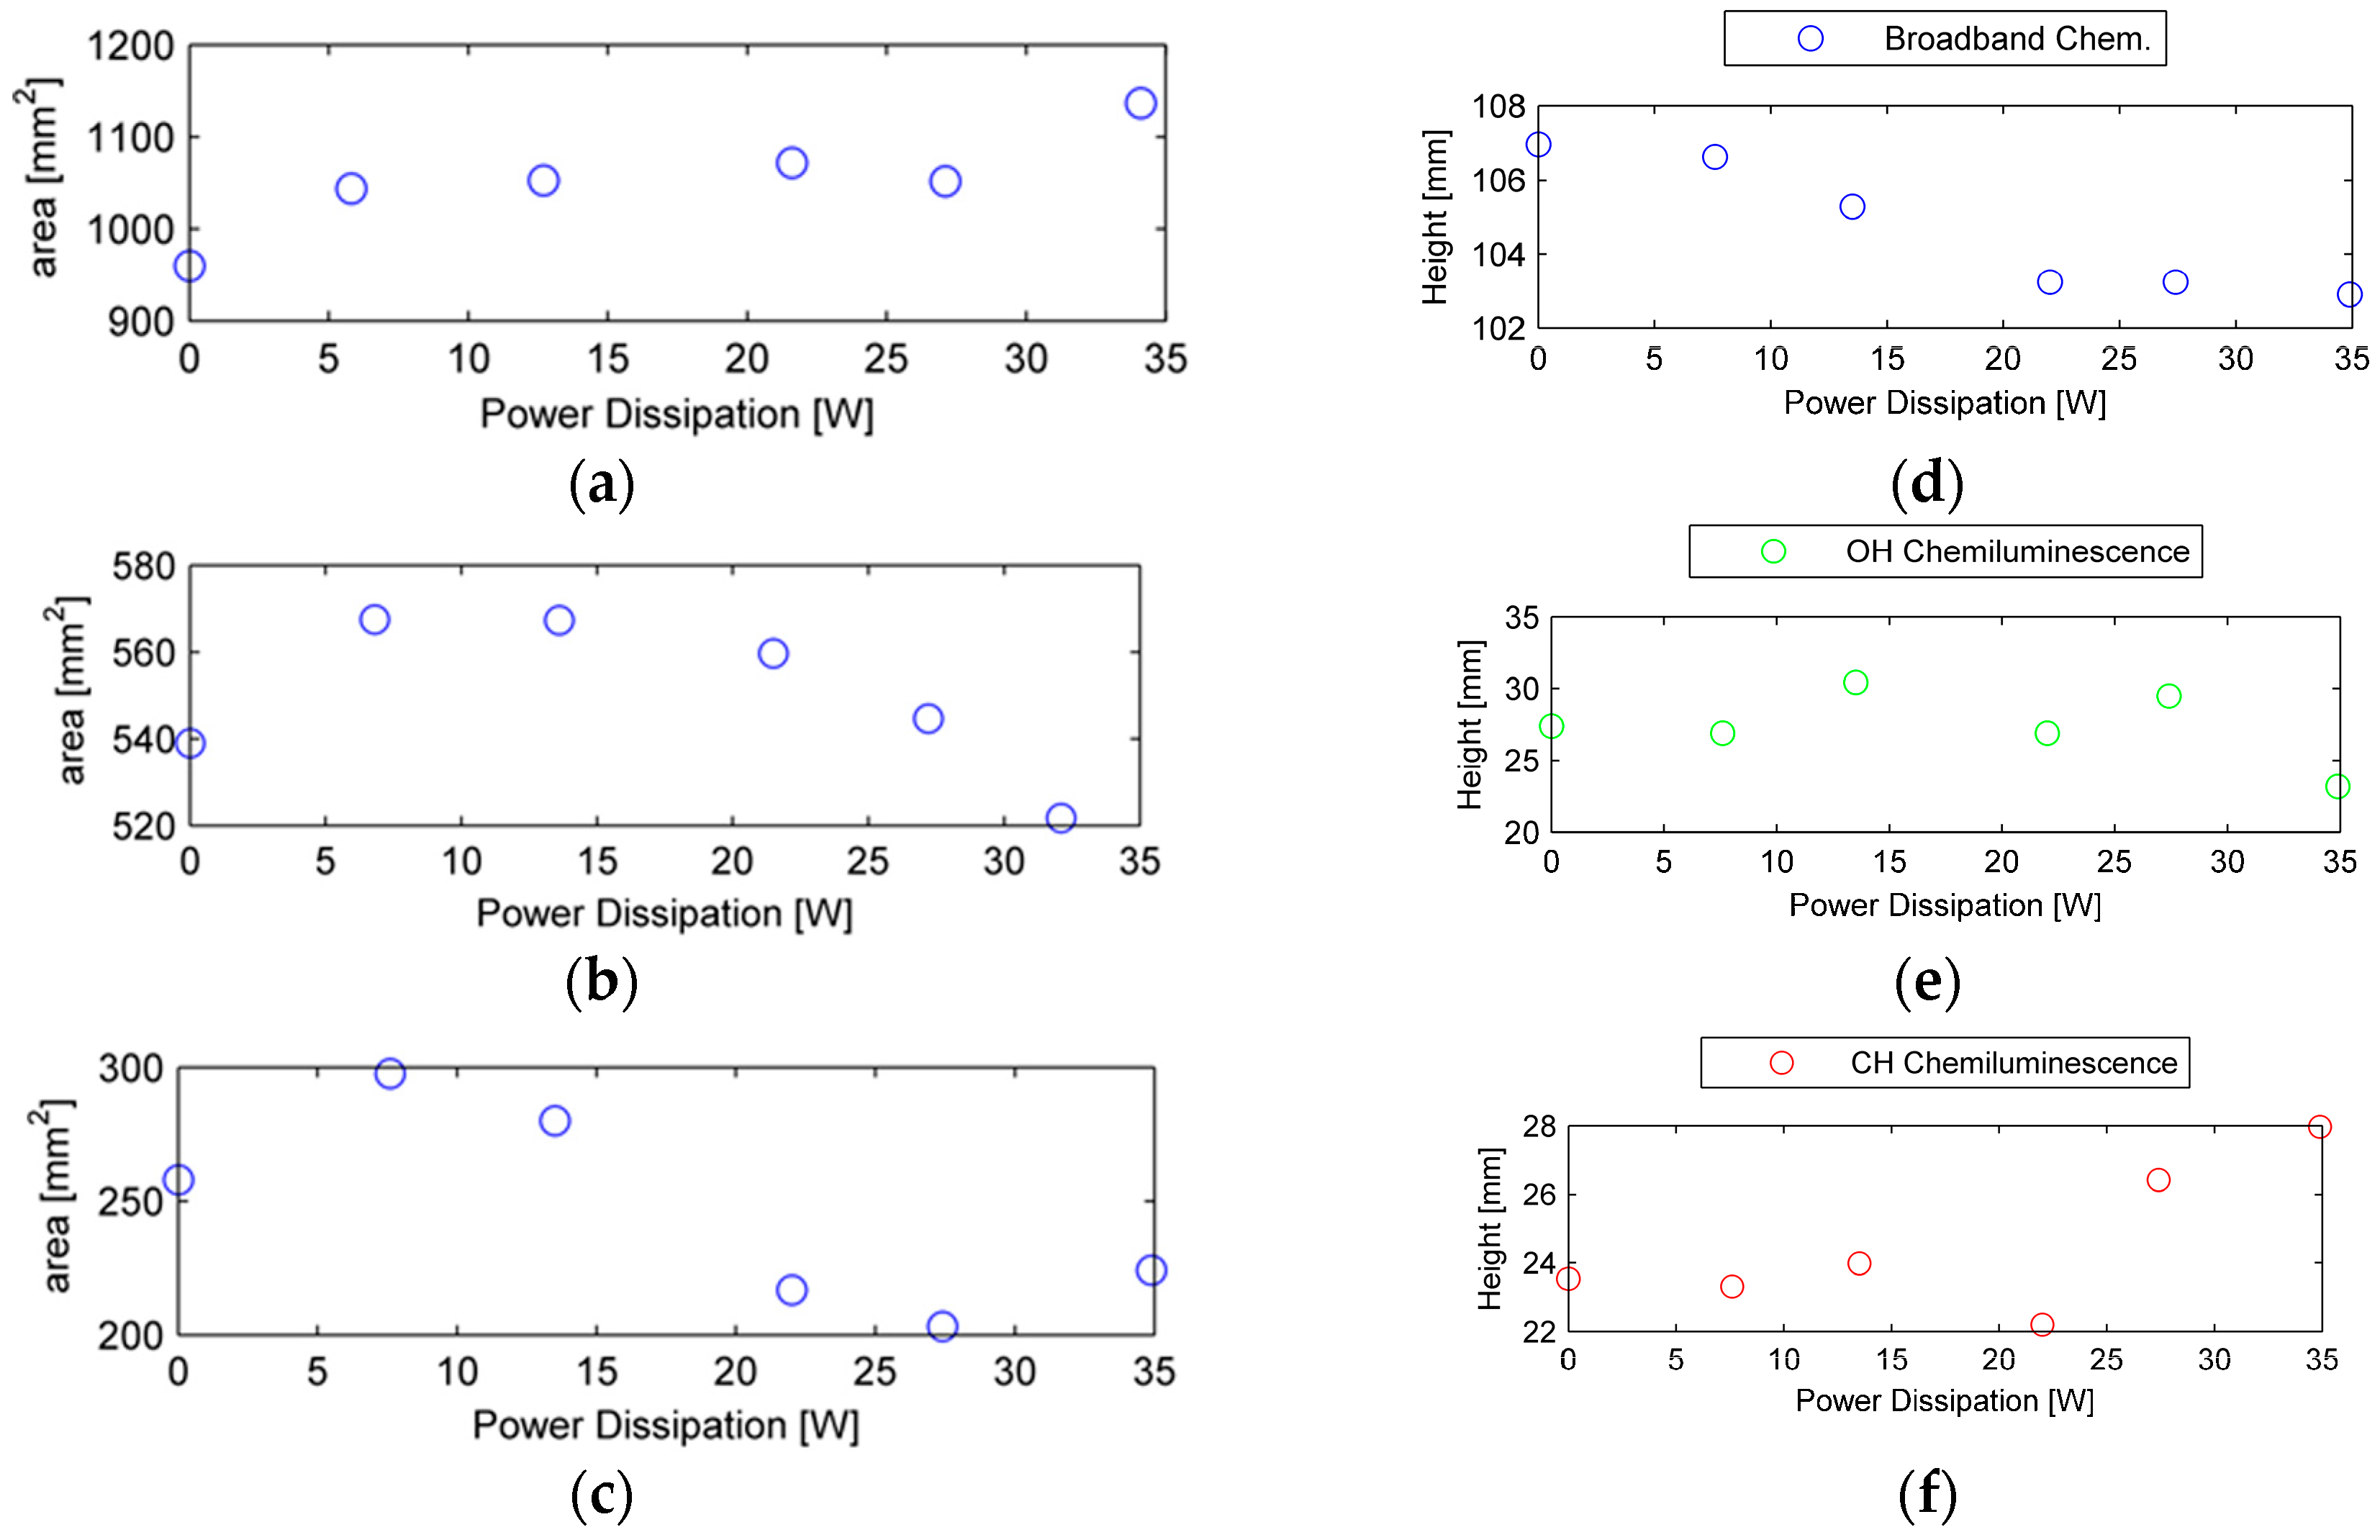
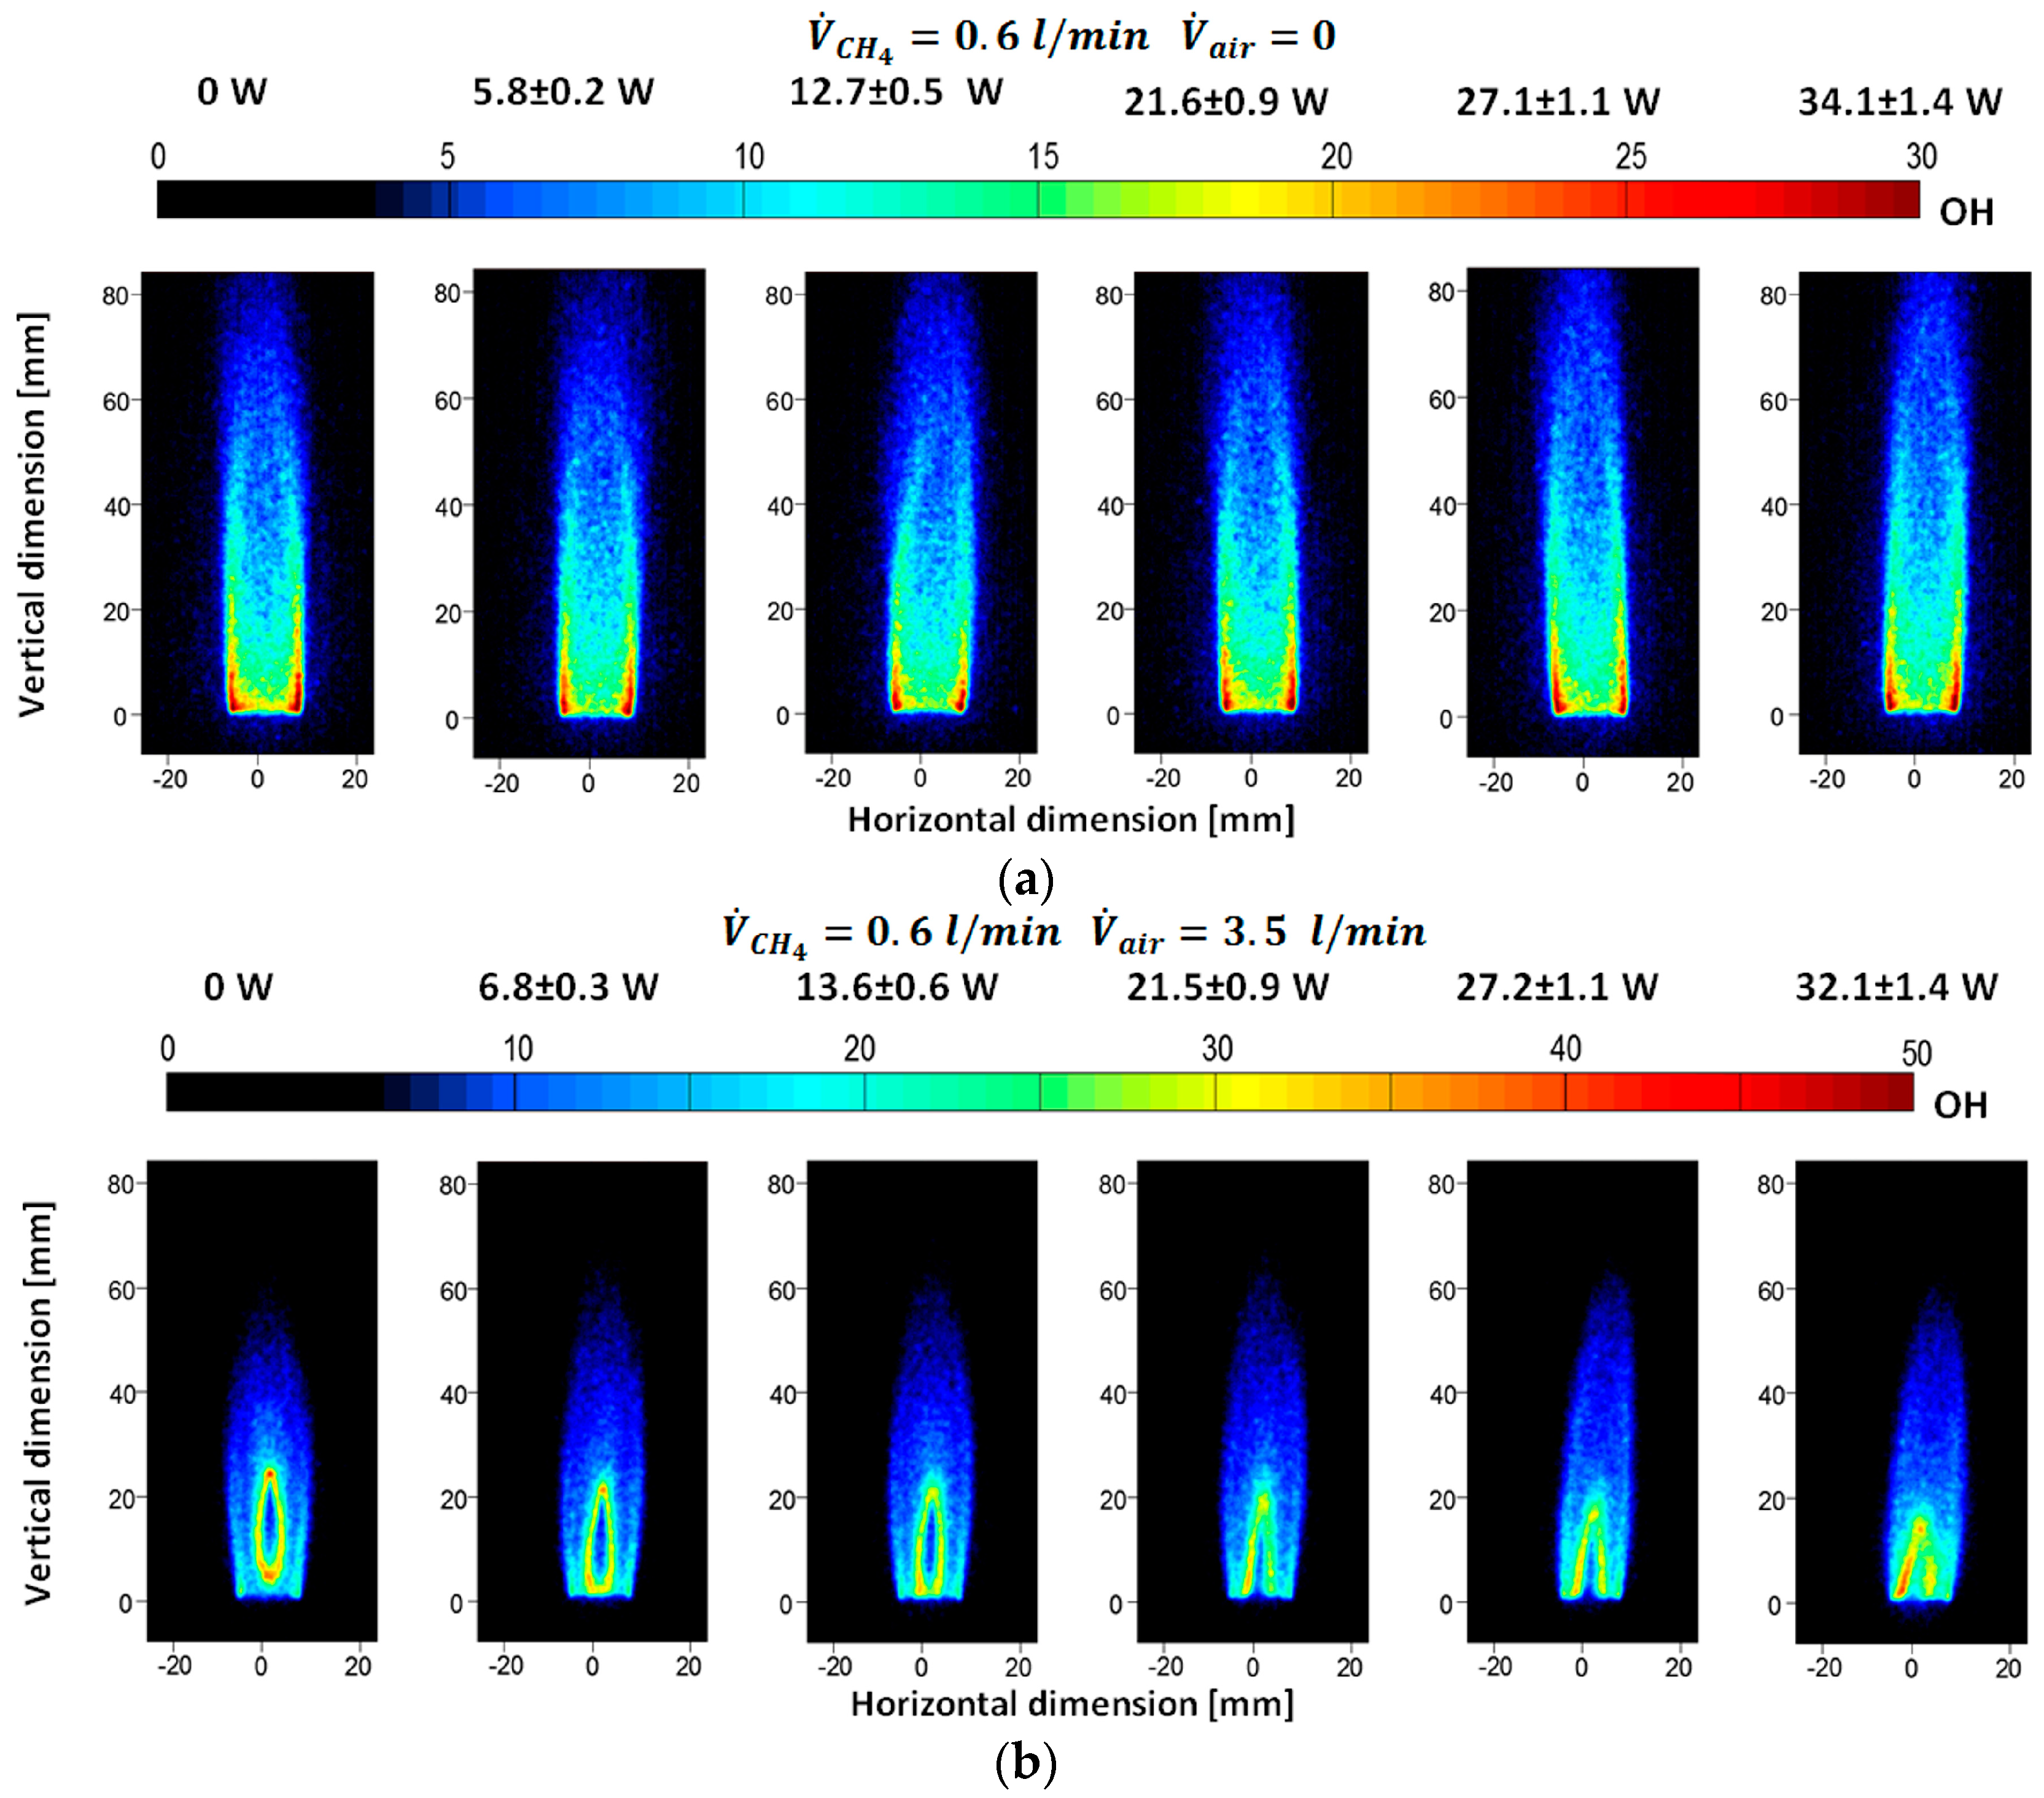
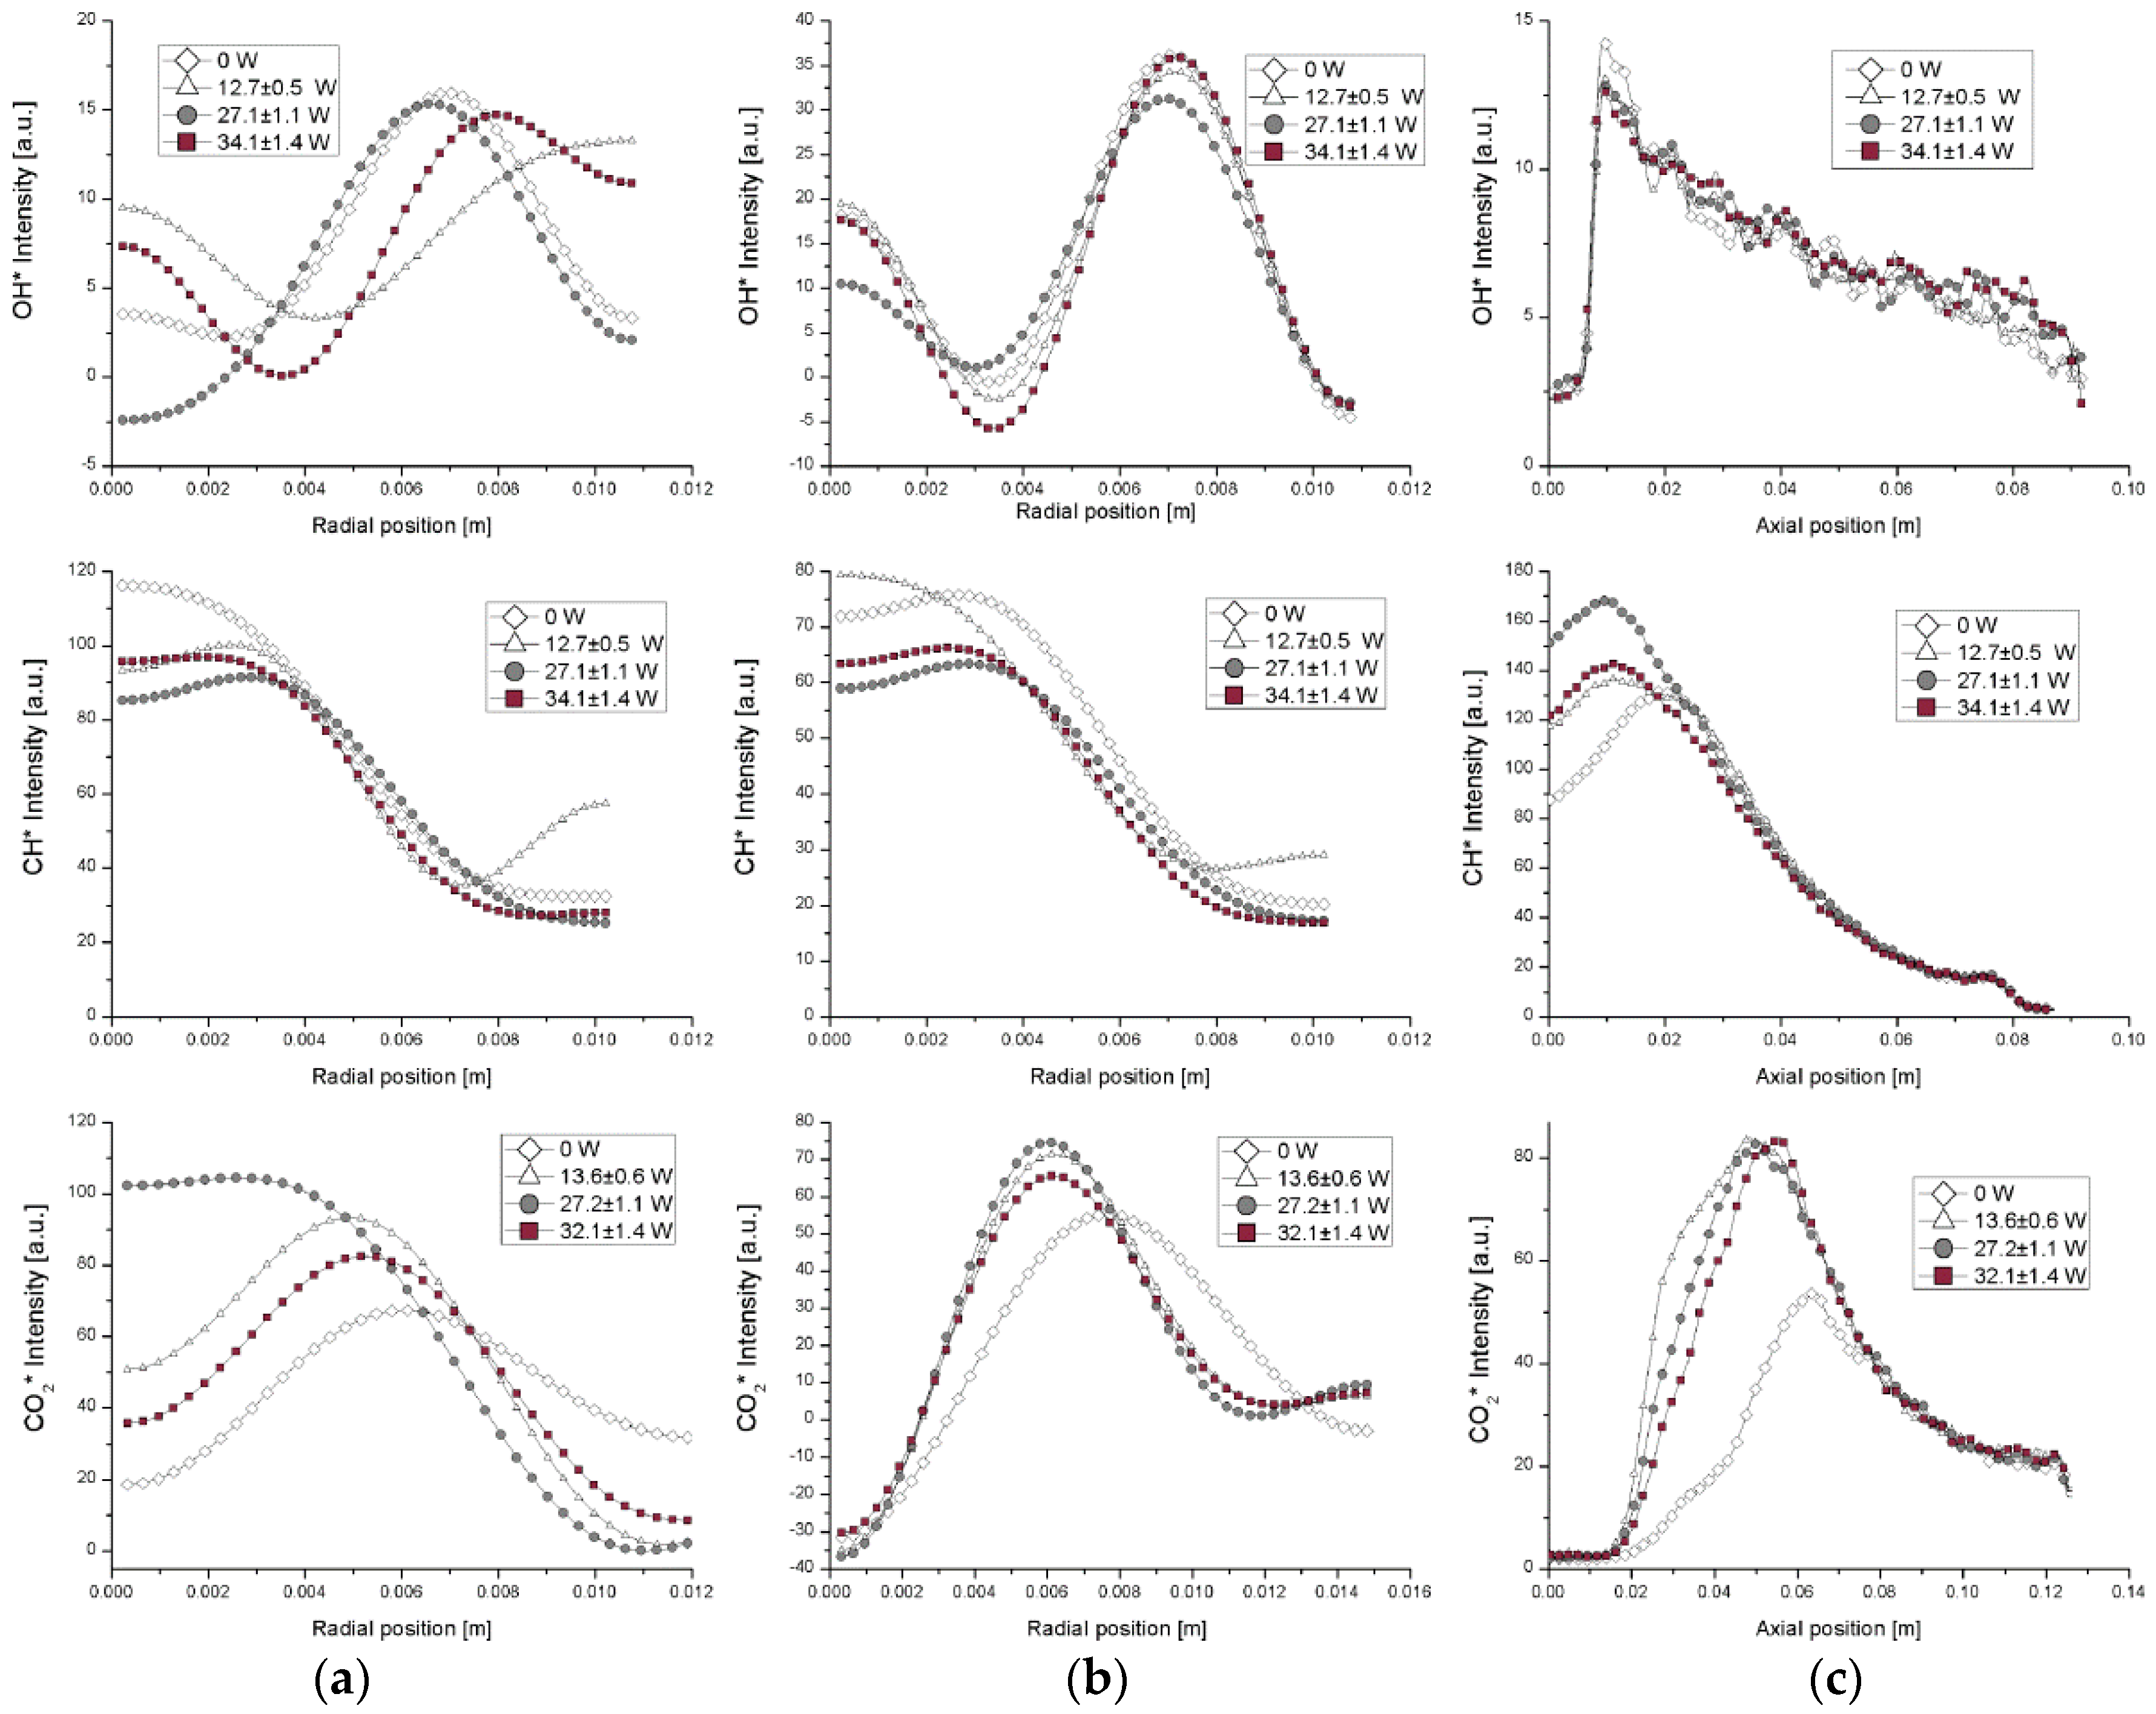
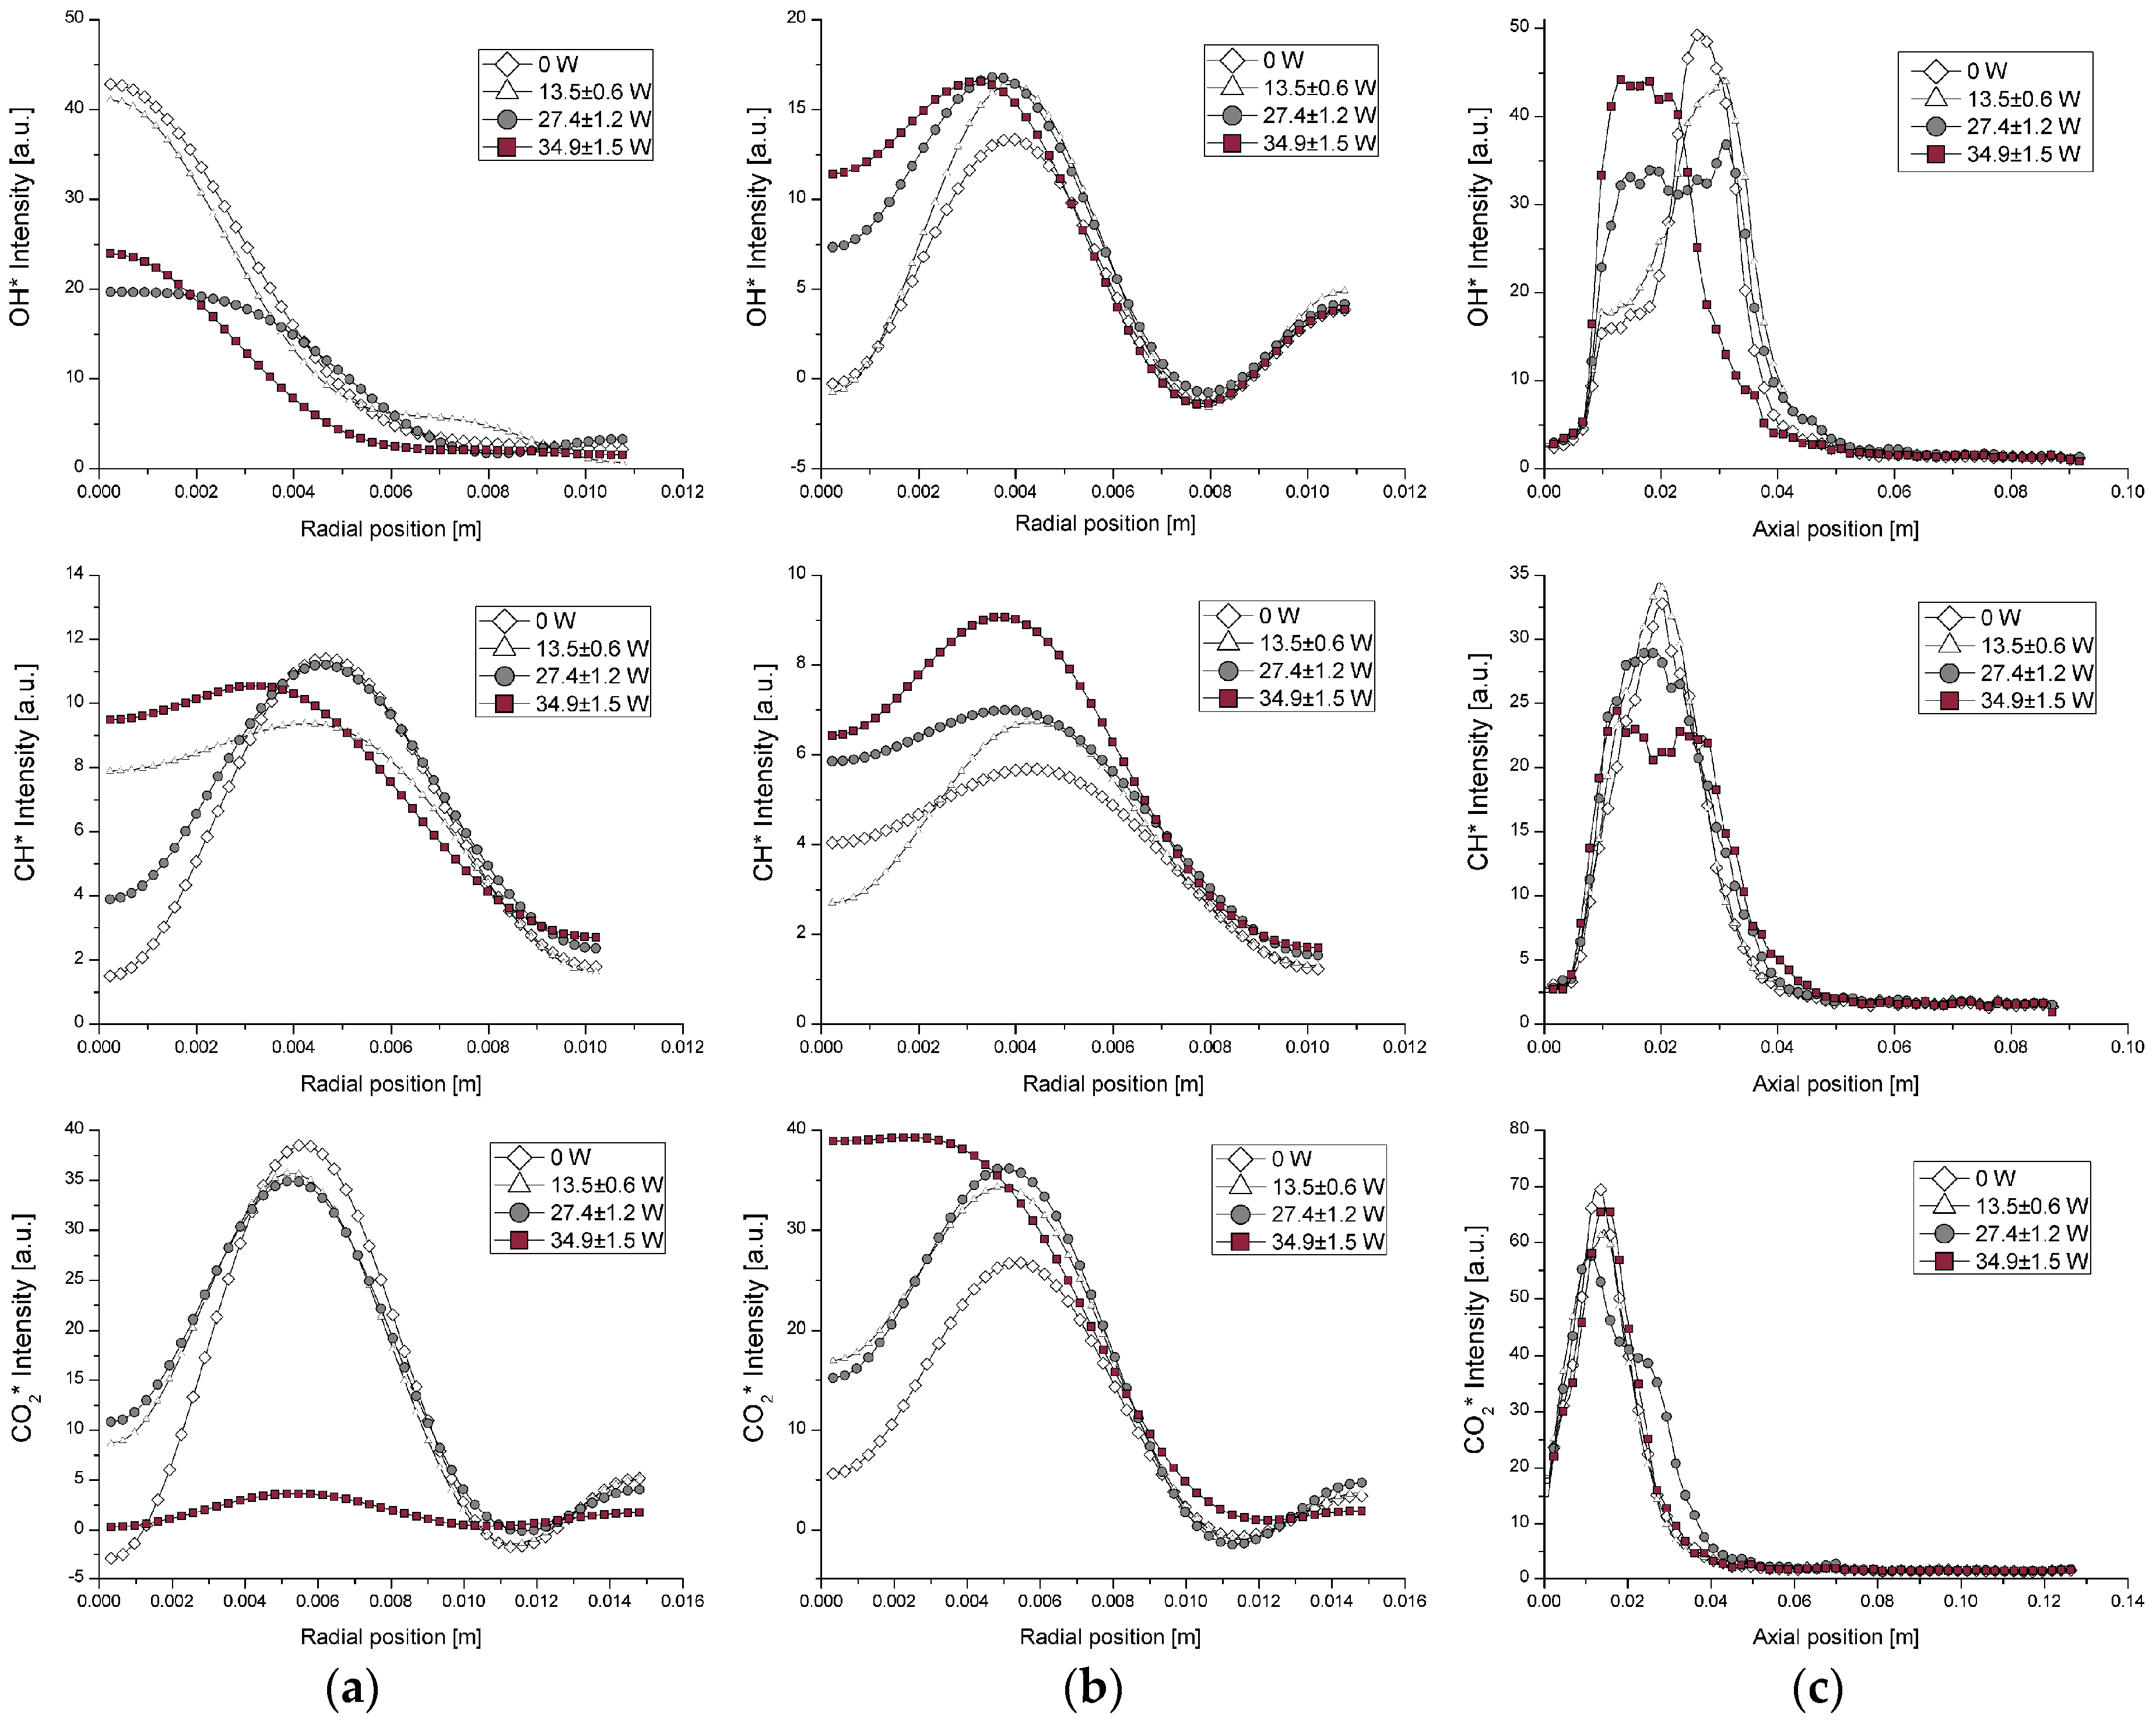
3.4. CCD Imaging Chemiluminescence

Of course, the imaging in the visible spectral range is quite qualitative and may not reveal information about the flame structure. As observed also in [54], the measurement of flame parameters, such as flame height, in IDFs is complicated because soot forms in an annular region outside and above the flame and radiates, obscuring the blue reaction zone, so that a more consistent measurement of flame parameters can be made by acquisition with a color-intensified charge- coupled device (ICCD) camera with narrow bandpass filters.
The present section aims to characterize the flame reaction zone and the flame structures based on the chemiluminescence emissions, acquired by an intensified CCD camera.
First of all, the intensified camera has been used to detect the broadband flame emissions in the UV spectral range. According to the broadband chemiluminescence, the flame area has been estimated for the different cases, as reported in Figure 6a.
In the case of NDF flame, V ˙ a i r = 0 , the estimated time-averaged area increases by raising the plasma-dissipated power. Figure 5a shows an increase of the visible flame thickness, even if the flame height diminishes. Furthermore, the time averaging is also influenced by the more steady flame with plasma actuation and the absence of local extinguishments that are instead present in the baseline case without actuation.
The IDF flame area, on the contrary, shows a trend from ascent to descent increasing the dissipated plasma power, as shown in Figure 6b,c. In particular, at the maximum airflow rate (Figure 6c), a faster decreasing of the area is evident for a dissipated power greater than 20 W. The decrease of the flame area is due to a more anchored flame on the quartz exit with a reduction of the flame length, given by the enhancement of chemical reactions.
Furthermore, the behavior of chemiluminescence emissions acquired by the CCD camera with optical filters was also investigated. In methane–air flames, three main chemiluminescence emitters are present in the UV–vis spectral range: hydroxyl OH*, methylidyne radicals CH*, and CO2*. It should be underlined that the CH* intensity. as measured by the ICCD camera, also includes the chemiluminescence contribution of CO2*, hence CO2* emissions have been also measured.
As the CH* radical is mainly produced in the heat release zone of the flame, it can represent the inner layer of the reaction zone. Furthermore, as the OH* intensity is high in the flame front, the measured two-dimensional imaging of OH* qualitatively indicates the instantaneous shape of the reaction zone.
The images for the cases with and without the plasma discharge are collected with the same camera settings, such that relative differences between the cases can be compared.
Figure 6d–f show the flame heights estimated by the broadband, the OH* and CH* chemiluminescence emission axial profiles, respectively, at the leanest fueling condition. It is evident that the broadband flame height is greater than the flame heights from OH* and CH* emissions, due to radiating soot surrounding and extending above the reaction zone. Hence, the broadband chemiluminescence images overestimate the height of the reaction zone. Regarding the effect of the plasma actuation, the behavior of the broadband flame height agrees with the flame area in Figure 6c, with a decrease resulting from increasing the intensity of the plasma discharges, which means the electrical power. The OH* also shows a decrease of the height at 35 W, with respect to the baseline case, without actuation.
The height of the CH* chemiluminescence emission zone shows a different trend, with a rise at the highest plasma power intensity. It should be underlined that the CH* chemiluminescence signal originates in the flame zone near the stoichiometric surface. For a deeper analysis, Figure 7 shows averaged OH* chemiluminescence images as a function of increasing plasma power at three different inner airflow rate values. Because the OH* intensity reaches a maximum value in the flame front, the measured two-dimensional imaging of OH* qualitatively indicates the instantaneous shape of the reaction zone.
Looking to Figure 7a, it is evident that in the case of NDF flame ( V ˙ a i r = 0 ), the reaction zone is located in the peripheral region of the flame with a maximum on the edge of the quartz tube. The different levels of dissipated power have a low influence on the OH* emission. This result confirms the trend shown in Figure 6a.
By increasing the airflow rate in the inner tube, the OH* intensity also rises. Furthermore, unlike the NDF flame, the change of OH* distribution for the IDF is significant with increasing plasma power.
The test case with an intermediate airflow rate (Figure 7b) shows that the flame emission distribution in the UV range is similar to the test case without airflow, with the peak of OH* emissions occurring in a stretched ring around the centerline. The plasma discharge seems to attach this reaction ring to the quartz tube, making the reaction zone more homogeneous.
In Figure 7c, the reaction zone takes place near the quartz edge with the increasing of the plasma power; following the same power trend, the peak of OH* emissions decreases and results are upturned compared to the baseline configuration.
The OH* distribution exhibits an “M shape” structure, which indicates the higher propagation speed in the center of flame. Under plasma actuation, the flame propagation speed is improved, which pushes the thin reaction zone against the upward flow, giving a new balance between the flow and the burning zone.
Figure 8 shows the emissions of CH* and CO2* for the leaner configuration for every applied plasma level. The CH* signal is mainly descriptive of the heat release zone, which appears centered in the core of the flame, becoming smoother only when plasma level is high.
This last feature is also confirmed in the same figure by the CO2* chemiluminescence emissions; at high plasma levels the map loses its tip, and the core of the emission has less intensity and moves down to the quartz edge.
Figure 9 and Figure 10 report radial and axial profiles of the radical emissions in the case of NDF flame (Figure 9) and in the IDF flame at the highest inner airflow rate (Figure 10). In detail, along the three rows of each figure, OH*, CH*, and CO2* are shown. The first two columns of both the figures show the radial profiles at two axial positions at 20 mm and 10 mm, respectively, from the burner exit; the last column depicts the axial profile along the centerline.
For the NDF case, the axial OH* distribution is quite similar for the different dissipated plasma power levels. On the contrary, the CH* and CO2* profiles show significant differences based on the dissipated plasma power, with a relevant axial shift of the centerline peak intensity towards the quartz exit. Furthermore, the CO2* peak intensity is radially located close to the centerline.
In Figure 10, it is evident that, because of the entrainment of the high velocity central airflow, the reaction zone (from the nozzle exit to the OH* peak location along the centerline) significantly changes, increasing the plasma power. Furthermore, the OH* peak position in the axial profile moves towards the nozzle exit. The CH* radiations decrease relative to the flame without plasma discharge; furthermore, they decrease also by increasing the plasma power, even if the axial distributions are wider in presence of actuation, indicating that more fuel is oxidized, and the upper flame region correspondingly decreases.
Figure 10 also shows a broadening in zone reaction for the actuated cases. This is evident looking at the radial profiles for the OH* and CH* emissions, especially as the axial position increases.

4. Conclusions

A coaxial–cylinder dielectric barrier discharge is used to activate a methane/air Bunsen flame. The physical appearance of the Bunsen flame and its changes are directly imaged by OH*, CH*, and CO2* chemiluminescence imaging.
The results confirm that the emission intensities of crucial radicals in combustion are greatly influenced by the plasma discharge. Results show a rise of the OH* intensity by increasing the airflow rate in the inner tube.
Qualitative chemiluminescence imaging indicates that, during plasma discharge, the shape of the reaction zone of the flame changes, especially for the leaner condition. The overall map area interested by UV emission is not influenced by plasma actuation in the case of NDF flame without inner air. In the IDF configuration with inner airflow, the plasma presents a strong impact on the flame, moving the reaction zone near the edge of the quartz tube and reducing the flame height.
For the NDF case, the axial OH* distribution is quite similar for the different dissipated plasma power levels. On the contrary, the CH* and CO2* profiles are quite influenced by the presence of the plasma discharges, with a relevant axial shift of the centerline peak intensity towards the quartz exit. Furthermore, the CO2* peak intensity is radially located close to the centerline.
At high inner airflow rate, the entrainment of the high-velocity central airflow leads to a significant change of the reaction zone by increasing the plasma power. Furthermore, the OH* peak position in the axial profile moves towards the nozzle exit and the CH* radiations decrease relatively the NDF flame.

Acknowledgments

The authors kindly thank Elisa Pescini for her contributions in toward the electrical characterization, as well Giorgio Dilecce from the Institute of Nanotechnology (CNRNANOTEC, UOS Bari, Italy) for his support in the set-up assessment. These research activities were funded by Programma Operativo Nazionale “Ricerca e Competitività” 2007-2013 (PON “R&C”), Apulia Space Project. This work is also part of NATO AVT-254.

Author Contributions

Maria Grazia De Giorgi conceived and designed the experiments; Maria Grazia De Giorgi, Aldebara Sciolti and Stefano Campilongo performed the experiments and analyzed the data; Antonio Ficarella contributed to the discussions about the results.

Conflicts of Interest

The authors declare no conflict of interest.

References

  1. Oh, J.; Noh, D. Flame characteristics of a non-premixed oxy-fuel jet in a lab-scale furnace. Energy 2015, 81, 328–343. [Google Scholar] [CrossRef]
  2. Lee, S.; Padilla, R.; Dunn-Rankin, D.; Pham, T.; Kwon, O.C. Extinction limits and structure of counterflow nonpremixed H2O-laden CH4/air flames. Energy 2015, 93, 442–450. [Google Scholar] [CrossRef]
  3. Gao, X.; Duan, F.; Lim, S.C.; Yip, M.S. NOx formation in hydrogen–methane turbulent diffusion flame under the moderate or intense low-oxygen dilution conditions. Energy 2013, 59, 559–569. [Google Scholar] [CrossRef]
  4. De Giorgi, M.G.; Sciolti, A.; Campilongo, S.; Ficarella, A. Assessment of the Combustion Behaviour of a Pilot-Scale Gas Turbine Burner Using Image Processing. In Proceedings of the ASME 2014 Power Conference, Baltimore, MD, USA, 28–31 July 2014.
  5. De Giorgi, M.G.; Sciolti, A.; Campilongo, S.; Ficarella, A. Image processing for the characterization of flame stability in a non-premixed liquid fuel burner near lean blowout. Aerosp. Sci. Technol. 2016, 49, 41–51. [Google Scholar] [CrossRef]
  6. De Giorgi, M.G.; Sciolti, A.; Campilongo, S.; Ficarella, A. Experimental data regarding the characterization of the flame behaviour near lean blowout in a non-premixed liquid fuel burner. Data Brief 2016, 6, 189–193. [Google Scholar] [CrossRef] [PubMed]
  7. Baigmohammadi, M.; Tabejamaat, S.; Zarvandi, J. Numerical study of the behavior of methane-hydrogen/air pre-mixed flame in a micro reactor equipped with catalytic segmented bluff body. Energy 2015, 85, 117–144. [Google Scholar] [CrossRef]
  8. Sze, L.K.; Cheung, C.S.; Leung, C.W. Appearance, temperature, and NOx emission of two inverse diffusion flames with different port design. Combust. Flame 2006, 144, 237–248. [Google Scholar] [CrossRef]
  9. Shaddix, C.R.; Williams, T.C.; Blevins, L.G.; Schefer, R.W. Flame structure of steady and pulsed sooting inverse jet diffusion flames. Proc. Combust. Inst. 2005, 30, 1501–1508. [Google Scholar] [CrossRef]
  10. Stansel, D.M.; Laurendeau, N.M.; Senser, D.W. CO and NOx emissions from a controlled-air burner: Experimental measurements and exhaust correlations. Combust. Sci. Technol. 1995, 104, 207–234. [Google Scholar] [CrossRef]
  11. Mahesh, S.; Mishra, D.P. Flame stability and emission characteristics of turbulent LPG IDF in a backstep burner. Fuel 2008, 87, 2614–2619. [Google Scholar] [CrossRef]
  12. Hwang, S.S.; Gore, J.P. Combustion and radiation characteristics of oxygen-enhanced inverse diffusion flame. KSME Int. J. 2002, 1156–1165. [Google Scholar] [CrossRef]
  13. Dong, L.L.; Cheung, C.S.; Leung, C.W. Combustion optimization of a port-array inverse diffusion flame jet. Energy 2011, 36, 2834–2846. [Google Scholar] [CrossRef]
  14. Dong, L.L.; Cheung, C.S.; Leung, C.W. Heat transfer optimization of an impinging port-array inverse diffusion flame jet. Energy 2013, 49, 182–192. [Google Scholar] [CrossRef]
  15. Sidebotham, G.W.; Glassman, I. Flame temperature, fuel structure, and fuel concentration effects on soot formation in inverse diffusion flames. Combust. Flame 1992, 90, 273–283. [Google Scholar] [CrossRef]
  16. Choi, S.; Kim, T.Y.; Kim, H.K.; Koo, J.; Kim, J.S.; Kwon, O.C. Properties of inverse non premixed pure O2/CH4 coflow flames in a model combustor. Energy 2015, 93, 1105–1115. [Google Scholar] [CrossRef]
  17. Song, X.; Gong, Y.; Yu, G.; Guo, Q.; Dai, Z. Chemiluminescence Studies of Coke Oven Gas/O2 Coflow Normal/Inverse Diffusion Flames. J. Eng. Gas Turbines Power 2015, 137, 081505. [Google Scholar] [CrossRef]
  18. De Giorgi, M.G.; Sciolti, A.; Ficarella, A. Application and Comparison of Different Combustion Models of High Pressure LOX/CH4 Jet Flames. Energies 2014, 7, 477–497. [Google Scholar] [CrossRef]
  19. De Giorgi, M.G.; Sciolti, A.; Ficarella, A. Spray and Combustion Modeling in High Pressure Cryogenic Jet Flames. In Proceedings of the ASME Turbo Expo 2012: Turbine Technical Conference and Exposition, Volume 2: Combustion, Fuels and Emissions, Parts A and B, Copenhagen, Denmark, 11–15 June 2012; pp. 1161–1176.
  20. De Giorgi, M.G.; Sciolti, A.; Ficarella, A. Comparisons between different combustion models for High pressure LOX/CH4 jet flames. In Proceedings of the 41st AIAA Fluid Dynamics Conference and Exhibit, Honolulu, HI, USA, 27–30 June 2011.
  21. De Giorgi, M.G.; Tarantino, L.; Ficarella, A.; Laforgia, D. Numerical Modelling of High-Pressure Cryogenic Sprays. In Proceedings of the 40th Fluid Dynamics Conference and Exhibit, Chicago, IL, USA, 28 June–1 July 2010.
  22. Schumaker, S.A.; Driscoll, J.F. Coaxial turbulent jet flames: Scaling relations for measured stoichiometric mixing lengths. Proc. Combust. Inst. 2009, 32, 1655–1662. [Google Scholar] [CrossRef]
  23. De Giorgi, M.G.; Sciolti, A.; Campilongo, S.; Pescini, E.; Ficarella, A.; Martini, L.M.; Tosi, P.; Dilecce, G. Plasma Assisted Flame Stabilization in a Non-Premixed Lean Burner. Energy Procedia 2015, 82, 410–416. [Google Scholar] [CrossRef]
  24. De Giorgi, M.G.; Sciolti, A.; Campilongo, S.; Pescini, E.; Ficarella, A.; Martini, L.M.; Tosi, P.; Lovascio, S.; Dilecce, G. Lean Blowout Sensing and Plasma Actuation of Non-Premixed Flames. IEEE Sens. J. 2016, 16, 3896–3903. [Google Scholar] [CrossRef]
  25. Klimov, A.; Bityurin, V.; Kuznetsov, A.; Tolkunov, B.; Vystavkin, N.; Vasiliev, M. External and Internal Plasma-Assisted Combustion. In Proceedings of the 42nd AIAA Aerospace Sciences Meeting and Exhibit, Reno, NV, USA, 4–8 January 2004.
  26. Bao, A.; Utkin, Y.G.; Keshav, S.; Lou, G.; Adamovich, I.V. Ignition of ethylene-air and methane-air flows by low-temperature repetitively pulsed nanosecond discharge plasma. IEEE Trans. Plasma Sci. 2007, 35, 1628–1638. [Google Scholar] [CrossRef]
  27. Won, S.H.; Cha, M.S.; Park, C.S.; Chung, S.H. Effect of electric fields on reattachment and propagation speed of tribrachial flames in laminar coflow jets. Proc. Combust. Inst. 2007, 31, 963–970. [Google Scholar] [CrossRef]
  28. Pilla, G.; Galley, D.; Lacoste, D.A.; Lacas, F.; Veynante, D.; Laux, C.O. Stabilization of a turbulent premixed flame using a nanosecond repetitively pulsed plasma. IEEE Trans. Plasma Sci. 2006, 34, 2471–2477. [Google Scholar] [CrossRef]
  29. Ombrello, T.; Qin, X.; Ju, Y.; Gutsol, A.; Fridman, A.; Carter, C. Combustion Enhancement via Stabilized Piecewise Nonequilibrium Gliding Arc Plasma Discharge. AIAA J. 2006, 44, 142–150. [Google Scholar] [CrossRef]
  30. Kim, W.; Do, H.; Mungal, M.G.; Cappelli, M.A. Plasma-Discharge Stabilization of Jet Diffusion Flames. IEEE Trans. Plasma Sci. 2006, 34, 2545–2551. [Google Scholar] [CrossRef]
  31. Pescini, E.; De Giorgi, M.G.; Francioso, L.; Sciolti, A.; Ficarella, A. Effect of a micro dielectric barrier discharge plasma actuator on quiescent flow. IET Sci. Meas. Technol. 2014, 8, 135–142. [Google Scholar] [CrossRef]
  32. Anikin, N.; Kukaev, E.; Starikovskaia, S.; Starikovskii, A. Ignition of hydrogen-air and methane-air mixtures at low temperatures by nanosecond high voltage discharge. In Proceedings of the 42nd AIAA Aerospace Sciences Meeting and Exhibit, Reno, NV, USA, 4–8 January 2004.
  33. Starikovskaia, S.M. Plasma assisted ignition and combustion. J. Phys. D Appl. Phys. 2006, 39, R265–R299. [Google Scholar] [CrossRef]
  34. Pham, Q.L.L.; Lacoste, D.A.; Laux, C.O. Stabilization of a Premixed Methane–Air Flame Using Nanosecond Repetitively Pulsed Discharges. IEEE Trans. Plasma Sci. 2011, 39, 2264–2265. [Google Scholar] [CrossRef]
  35. Choi, W.; Neumeier, Y.; Jagoda, J. Stabilization of a Combustion Process near Lean Blow Off by an Electric Discharge. In Proceedings of the 42nd AIAA Aerospace Sciences Meeting and Exhibit, Reno, NV, USA, 4–8 January 2004.
  36. Pescini, E.; Martínez, D.S.; De Giorgi, M.G.; Ficarella, A. Optimization of micro single dielectric barrier discharge plasma actuator models based on experimental velocity and body force fields. Acta Astronaut. 2015, 116, 318–332. [Google Scholar] [CrossRef]
  37. Pescini, E.; Marra, F.; De Giorgi, M.G.; Francioso, L.; Ficarella, A. Investigation of the boundary layer characteristics for assessing the DBD plasma actuator control of the separated flow at low Reynolds numbers. Exp. Therm. Fluid Sci. 2017, 81, 482–498. [Google Scholar] [CrossRef]
  38. Tang, J.; Zhao, W.; Duan, Y. In-depth study on propane–air combustion enhancement with dielectric barrier discharge. IEEE Trans. Plasma Sci. 2010, 38, 3272–3281. [Google Scholar] [CrossRef]
  39. Im, S.K.; Bak, M.S.; Mungal, M.G.; Cappelli, M.A. Plasma Actuator Control of a Lifted Ethane Turbulent Jet Diffusion Flame. IEEE Trans. Plasma Sci. 2013, 41, 3293–3298. [Google Scholar] [CrossRef]
  40. Matsubara, Y.; Takita, K.; Masuya, G. Combustion enhancement in a supersonic flow by simultaneous operation of DBD and plasma jet. Proc. Combust. Inst. 2013, 34, 3287–3294. [Google Scholar] [CrossRef]
  41. Criner, K.; Cessou, A.; Louiche, J.; Vervisch, P. Stabilization of turbulent lifted jet flames assisted by pulsed high voltage discharge. Combust. Flame 2006, 144, 422–425. [Google Scholar] [CrossRef]
  42. Festo Flowmeter Specifications. Available online: http://www.festo.com/net/fi_fi/SupportPortal/default.aspx?cat=1959&q=SFAB&tab=3&type=92 (accessed on 10 November 2015).
  43. Cole Parmer Flow Meters. Available online: https://www.coleparmer.com/i/mn/3290757 (accessed on 10 November 2015).
  44. Dielectric Barrier Corona and Plasma Discharge Resonant Driver by Information Unlimited®. Available online: http://www.amazing1.com/products/dielectric-barrier-corona-and-plasma-discharge-resonant-driver.html (accessed on 10 November 2015).
  45. Tektronix P6015A Specifications. Available online: http://uk.tek.com/datasheet/high-voltage-probe-single-ended/p5100a-tpp0850-p5122-p5150-p6015a-datasheet-0 (accessed on 10 November 2015).
  46. Bergoz Current Transformer CT-C1.0-B Specifications. Available online: http://www.gmw.com/electric_current/Bergoz/documents/CT.11flyer.PDF (accessed on 10 November 2015).
  47. Tektronix TDS2024C Specifications. Available online: http://www.testequipmentdepot.com/tektronix/oscilloscope/tds2024c.htm (accessed on 10 November 2015).
  48. Memrecam® User’s Manual. Available online: http://www.nacinc.com/datasheets/archive/Memrecam_GX-3.pdf (accessed on 10 November 2015).
  49. La Vision ICCD User’s Manual. Available online: http://www.lavision.de/en/products/cameras/iccd_cameras.php (accessed on 10 November 2015).
  50. High-Speed Intensified Camera Specifications. Available online: http://www.lambertinstruments.com/hicatt (accessed on 10 November 2015).
  51. NI-USB 6008 User’s Manual. Available online: http://sine.ni.com/nips/cds/view/p/lang/it/nid/201986 (accessed on 10 November 2015).
  52. Moffat, R.J. Describing the uncertainties in experimental results. Exp. Therm. Fluid Sci. 1988, 1, 3–17. [Google Scholar] [CrossRef]
  53. Mahesh, S.; Mishra, D.P. Dynamic sensing of blowout in turbulent CNG inverse jet flame. Combust. Flame 2015, 162, 3046–3052. [Google Scholar] [CrossRef]
  54. Mikofski, M.A.; Williams, T.C.; Shaddix, C.R.; Blevins, L.G. Flame height measurement of laminar inverse diffusion flames. Combust. Flame 2006, 146, 63–72. [Google Scholar] [CrossRef]
Figure 1. Experimental setup: (a) gases feeder lines, charge-coupled device (CCD) and intensified CCD (ICCD) positioning, high-voltage power-amplifier connection; (b) electrical connection of voltage and current probe and oscilloscope.
Energies 10 00334 g001
Figure 2. Current–voltage characteristic curves for V ˙ air = 7.5 L/min, V ˙ CH 4 = 0.6 L/min.
Energies 10 00334 g002
Figure 3. Visible range flame images at 0.6 L/min methane flow rate, and increasing the air mass flow rate: V ˙ a i r = 0 ; V ˙ a i r = 3.5   L / min ; V ˙ a i r = 7.5   L / min .
Energies 10 00334 g003
Figure 4. Time trend of the normal diffusive flame (NDF) flame at V ˙ a i r = 0 and V ˙ CH 4 = 0.4 L/min: (a) flame without plasma actuation; (b) flame with plasma activated (34 W of dissipated electric power).
Energies 10 00334 g004
Figure 5. Visible flame images at two different airflow rates with V ˙ CH 4 = 0.6 L/min at increasing plasma power. (a) V ˙ a i r = 0 ; (b) V ˙ a i r = 7.5   L / min .
Energies 10 00334 g005
Figure 6. Mean area of broadband UV emissions at 0.6 L/min of methane flow rate, and for three different airflow rates: (a) V ˙ a i r = 0 ; (b) V ˙ a i r = 3.5   L / min ; (c) V ˙ a i r = 7.5   L / min . Height of three different chemiluminescence UV emissions at 0.6 L/min of methane flow rate, 7.5 L/min of airflow rate, and for three different airflow rates: (d) broadband emission; (e) OH* emission; (f) CH* emission.
Energies 10 00334 g006
Figure 7. OH* emissions at 0.6 L/min of methane flow rate, and for three different airflow rates: (a) V ˙ a i r = 0 ; (b) V ˙ a i r = 3.5   L / min ; (c) V ˙ a i r = 7.5   L / min .
Energies 10 00334 g007aEnergies 10 00334 g007b
Figure 8. CH* and CO2* emissions at 0.6 L/min of methane flow rate and 7.5 L/min of airflow rate.
Energies 10 00334 g008
Figure 9. OH*, CH*, CO2* chemiluminescence emissions with V ˙ CH 4 = 0.6 L/min, V ˙ ˙ a i r = 0   L / min , and DBD plasma actuation with three different plasma levels; (a) radial profile located at 30 mm; (b) radial profile located at 10 mm; (c) axial profile. (For the radial profiles, x = 0 for the radial profile is at the flame axis).
Energies 10 00334 g009
Figure 10. OH*, CH*, CO2* chemiluminescence emissions with V ˙ CH 4 = 0.6 L/min, V ˙ ˙ a i r = 7.5   L / min , and DBD plasma actuation with three different plasma levels; (a) radial profile located at 20 mm; (b) radial profile located at 10 mm; (c) axial profile. (For the radial profiles, x = 0 for the radial profile is at the flame axis).
Energies 10 00334 g010
Table 1. Settings for the different test conditions.
V ˙ C H 4 (L/min) V ˙ air (L/min) u C H 4 (m/s) u a i r (m/s) R e C H 4 R e a i r (O/F)mom
0.63.50.351.5263.31714.5234.30
0.67.50.353.2563.311531.12157.49
0.601.52063.3100
Table 2. Dissipated electrical power in different test conditions.
CH4 (L/min)Air (L/min)Peak-to-Peak Voltage (kV)Power Dissipation (W)
0.63.500
8.7 ± 0.36.8 ± 0.3
9 ± 0.313.6 ± 0.6
9.7 ± 0.321.5 ± 0.9
10.4 ± 0.327.2 ± 1.1
10.9 ± 0.332.1 ± 1.4
7.500
8.8 ± 0.37.6 ± 0.3
9.5 ± 0.313.5 ± 0.6
10.5 ± 0.322 ± 0.9
11.2 ± 0.327.4 ± 1.2
12.1 ± 0.434.9 ± 1.5
000
7.5 ± 0.25.8 ± 0.2
9.1 ± 0.312.7 ± 0.5
10.2 ± 0.321.6 ± 0.9
10.7 ± 0.327.1 ± 1.1
11.6 ± 0.334.1 ± 1.4

