
Consideration of Reactor Installation to Mitigate Voltage Rise Caused by the Connection of a Renewable Energy Generator


Abstract
:1. Introduction
2. Considerations for Reactor Installation
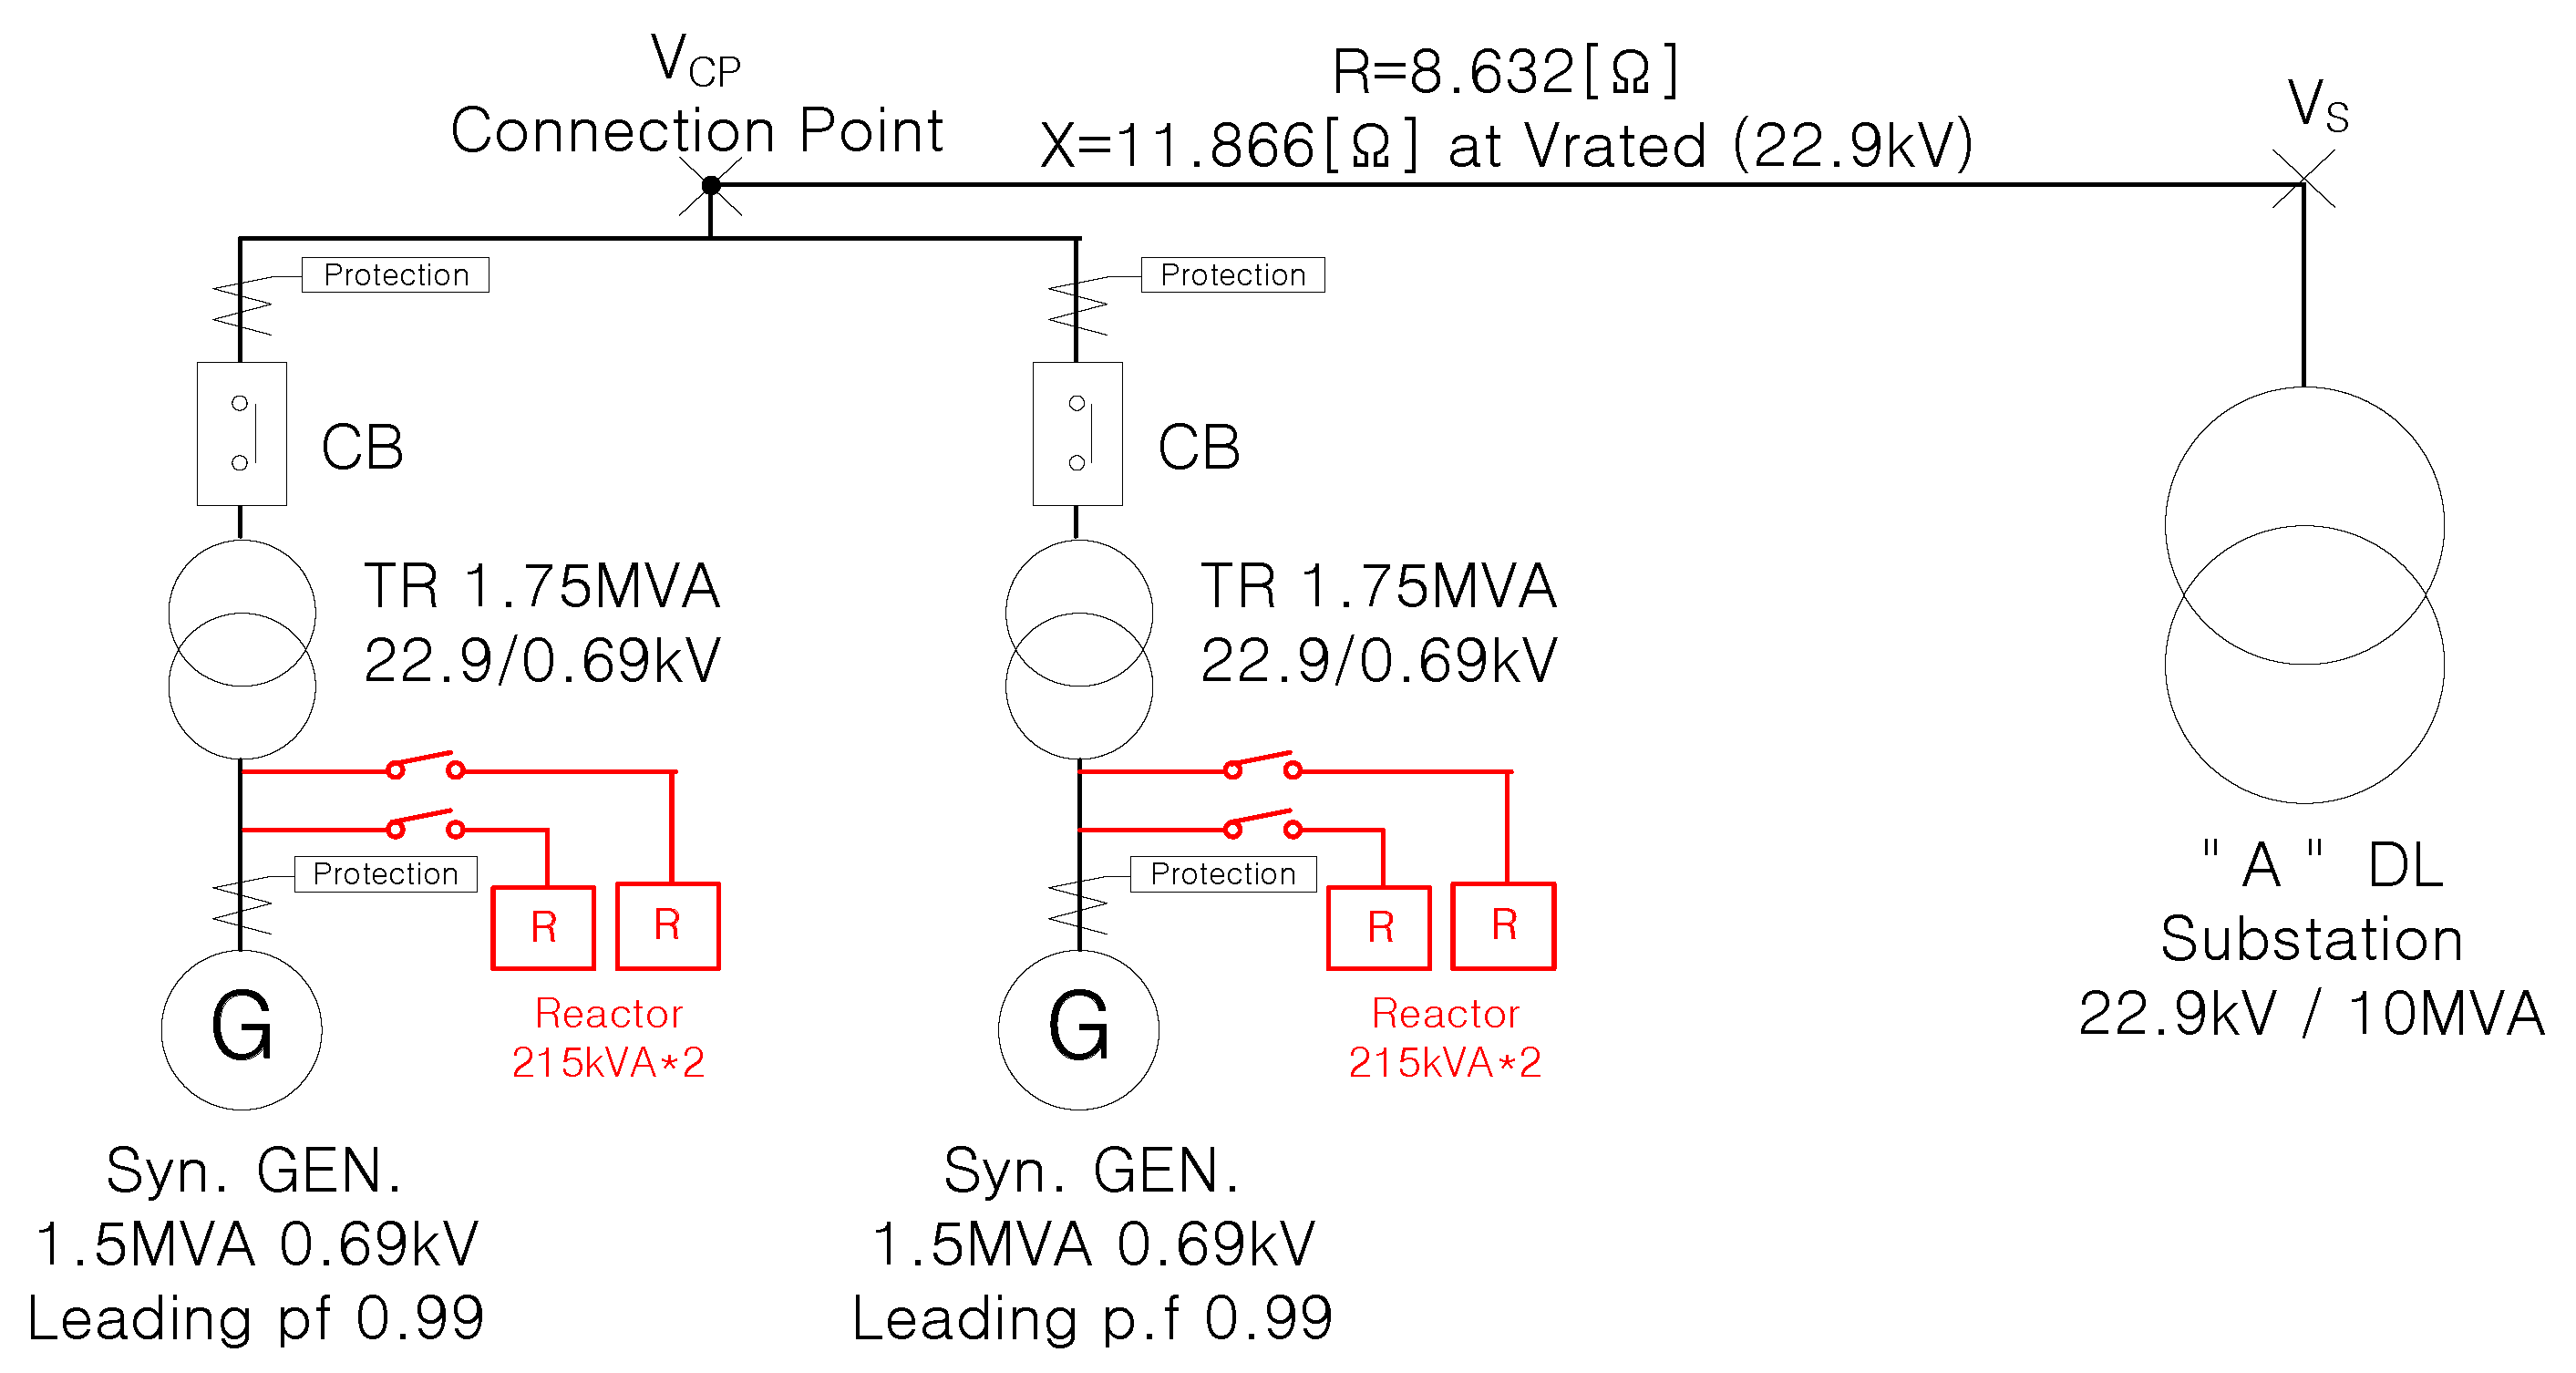
2.1. Capacity
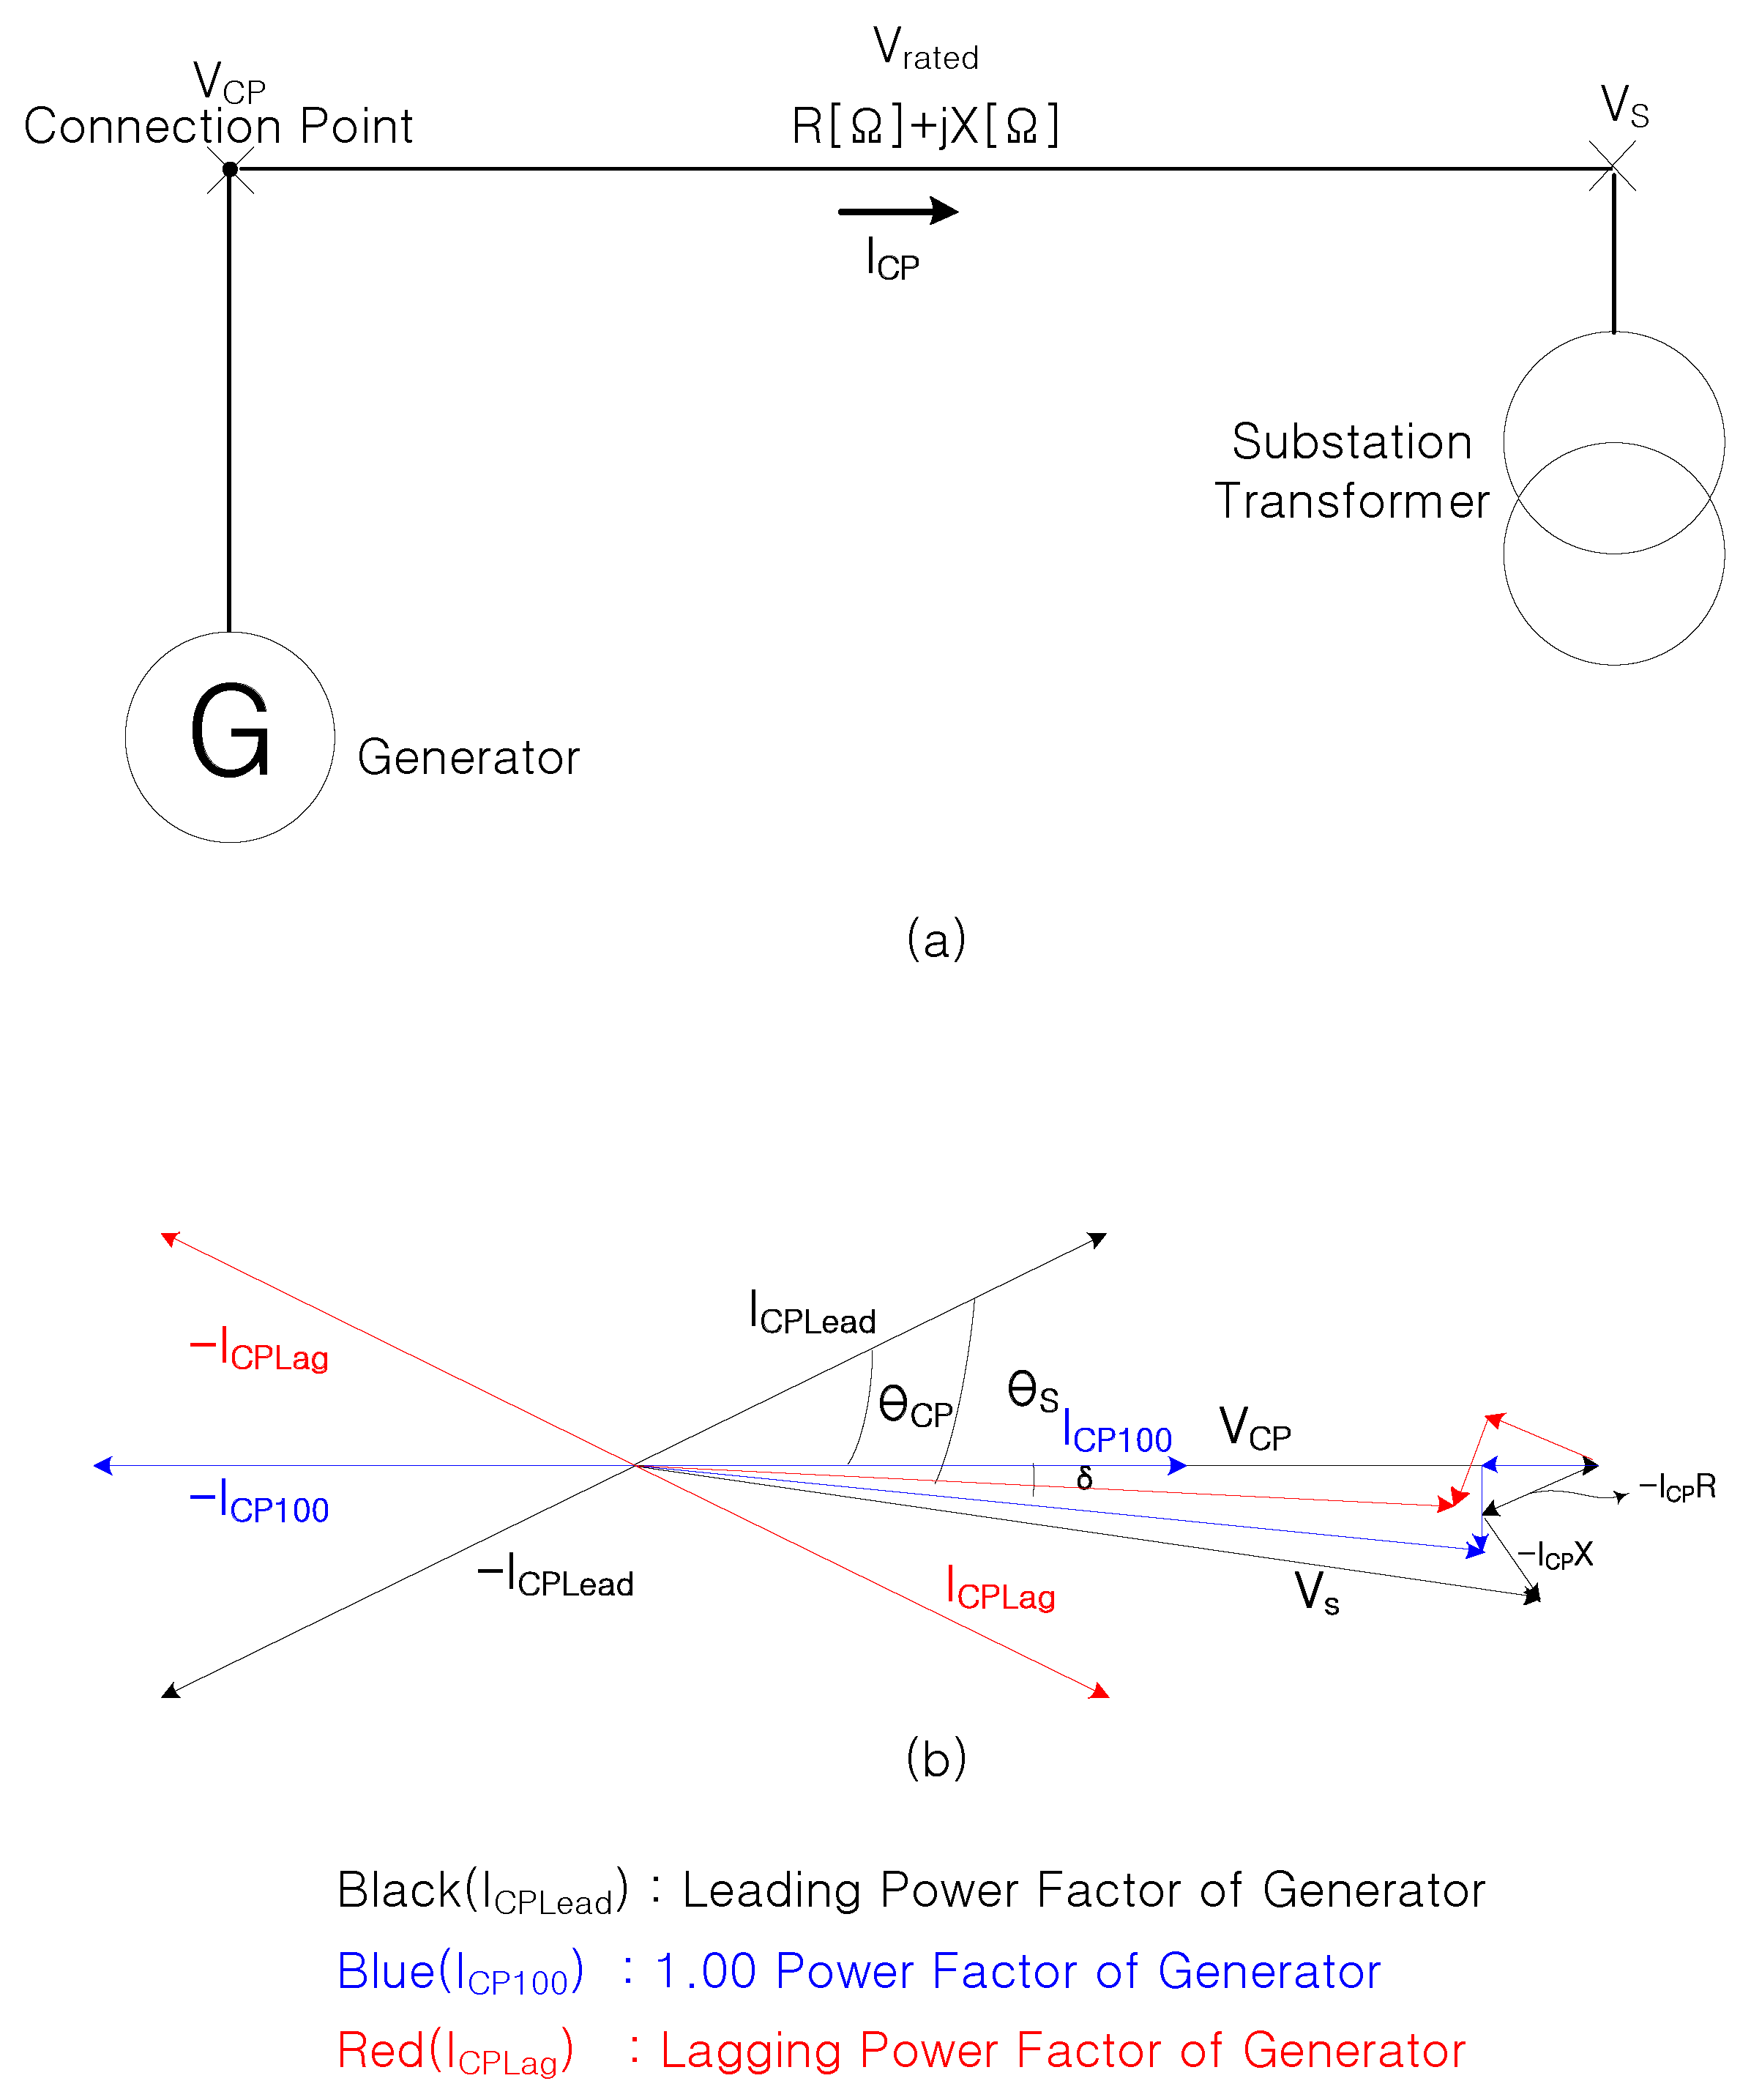
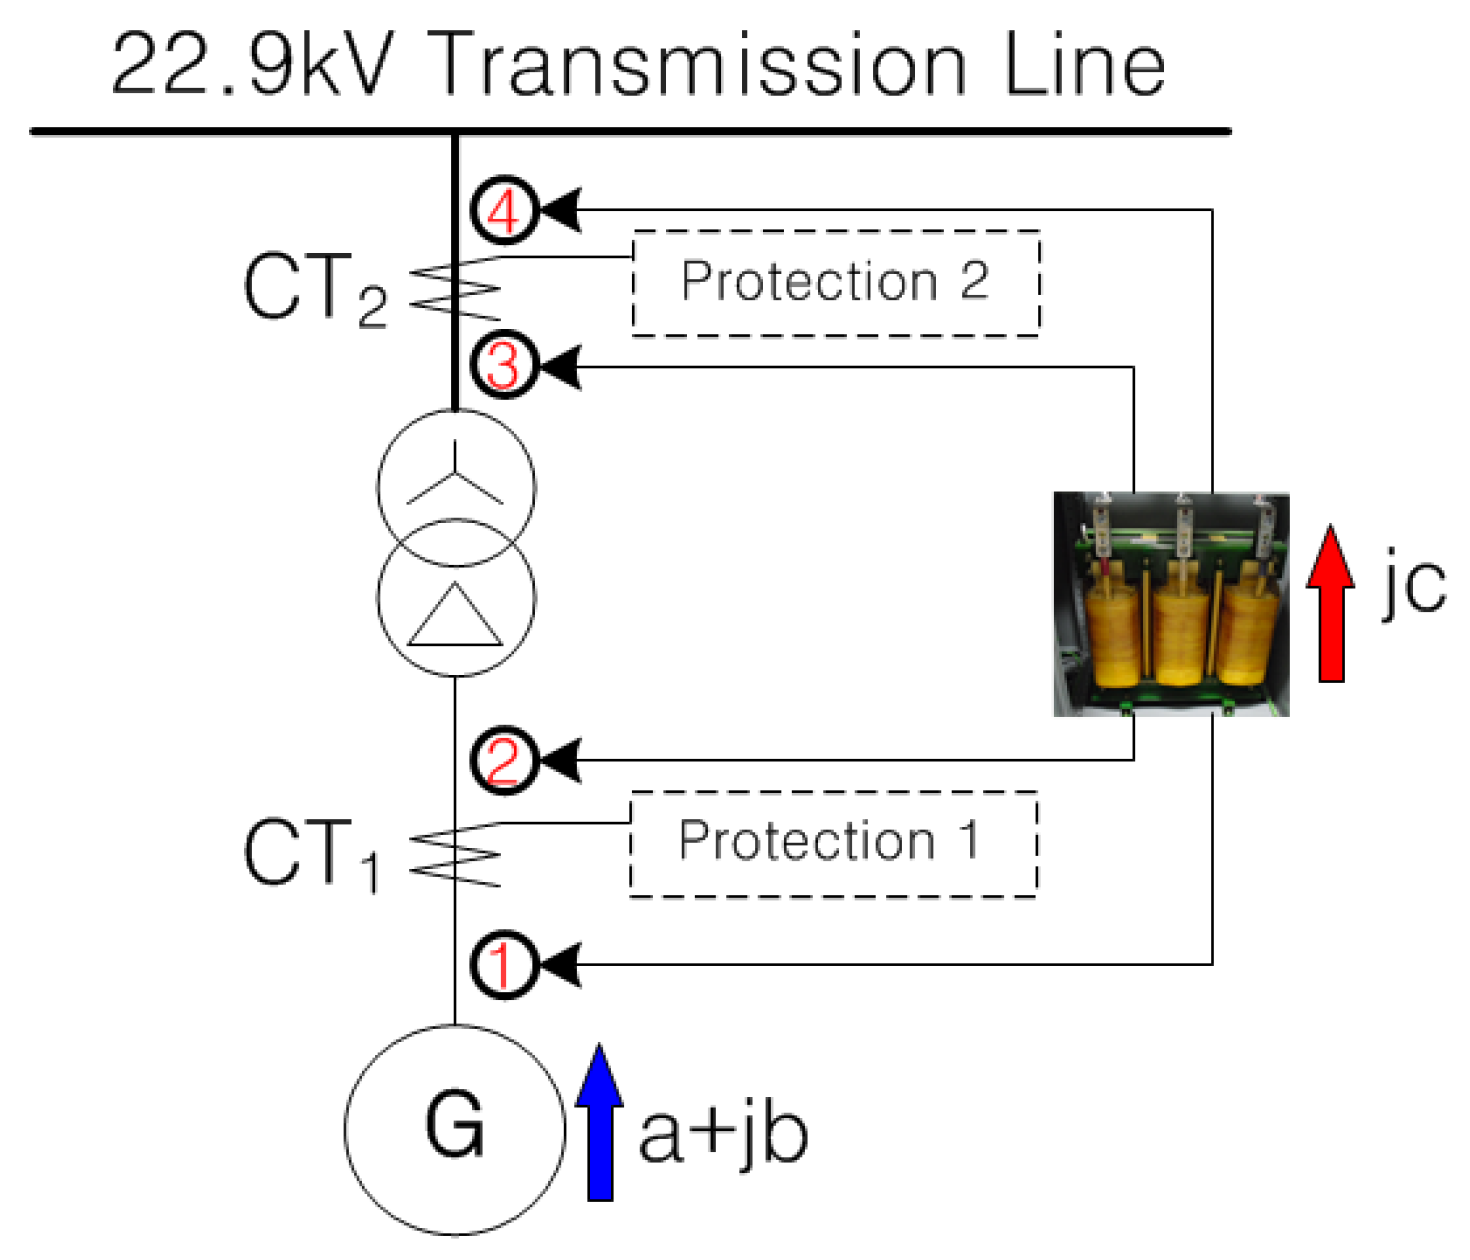
2.2. Selection of Reactor Installing Location
3. Design and Application of Reactors
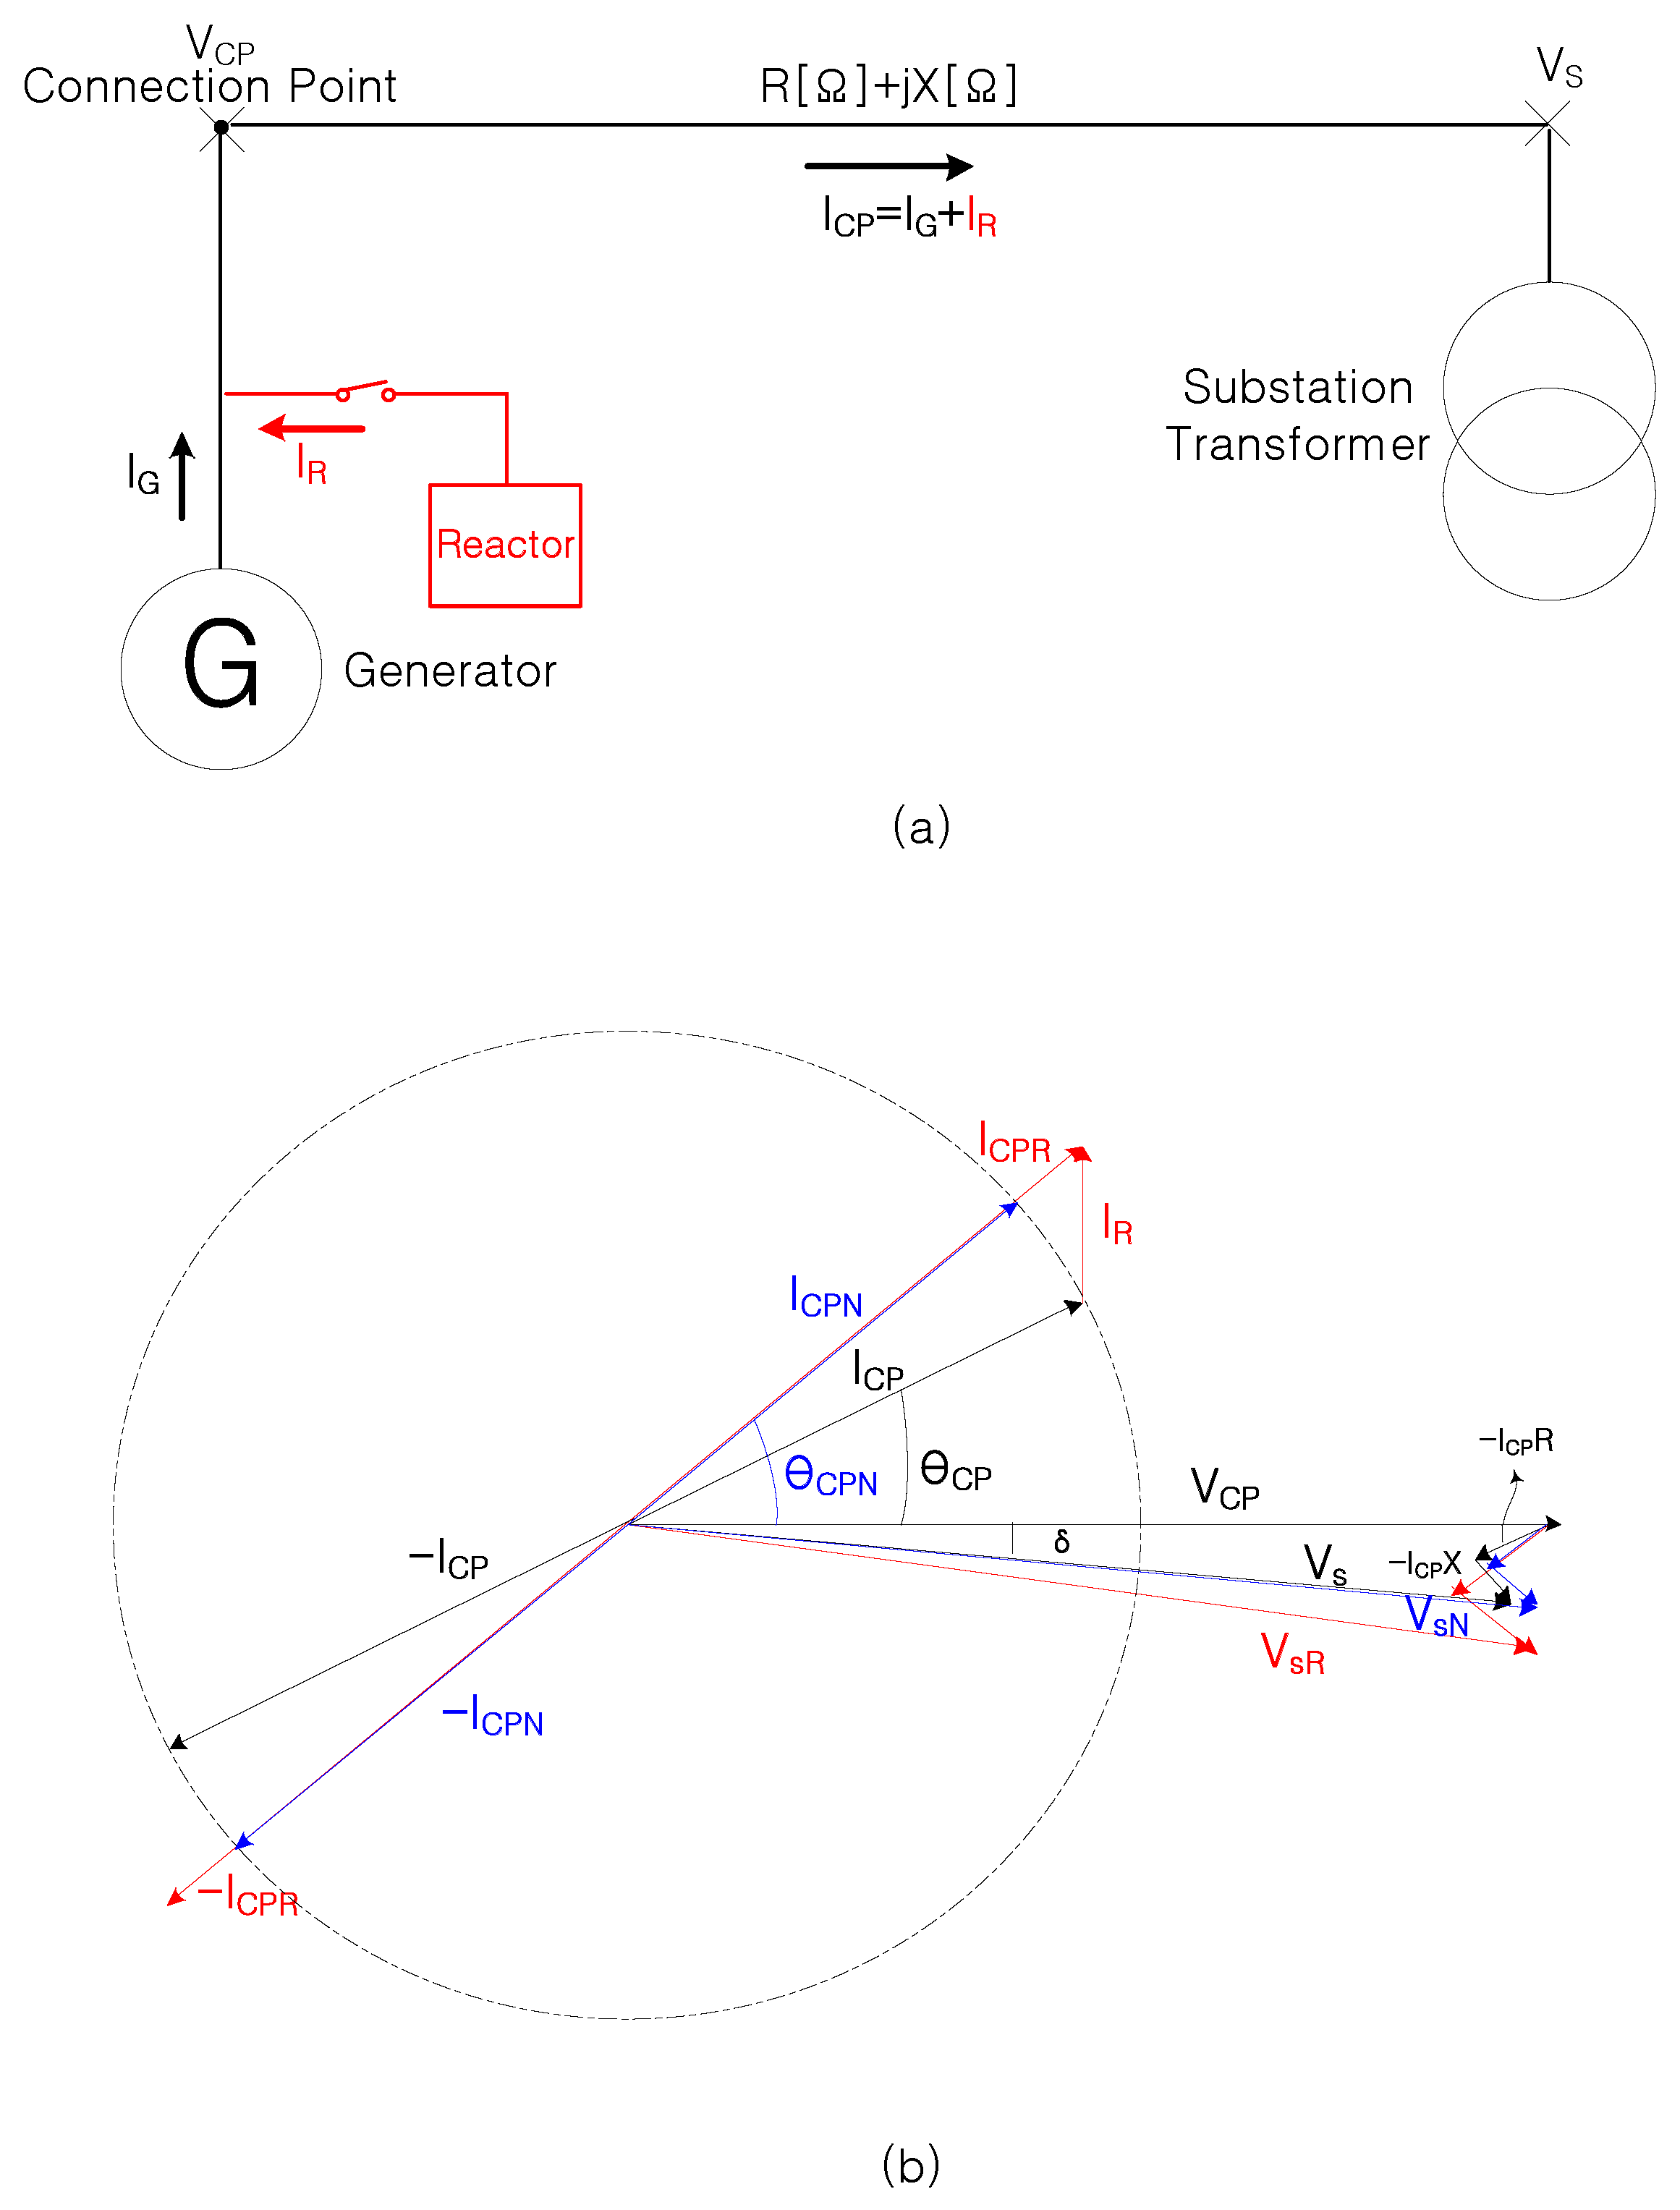
3.1. Design of Reactor
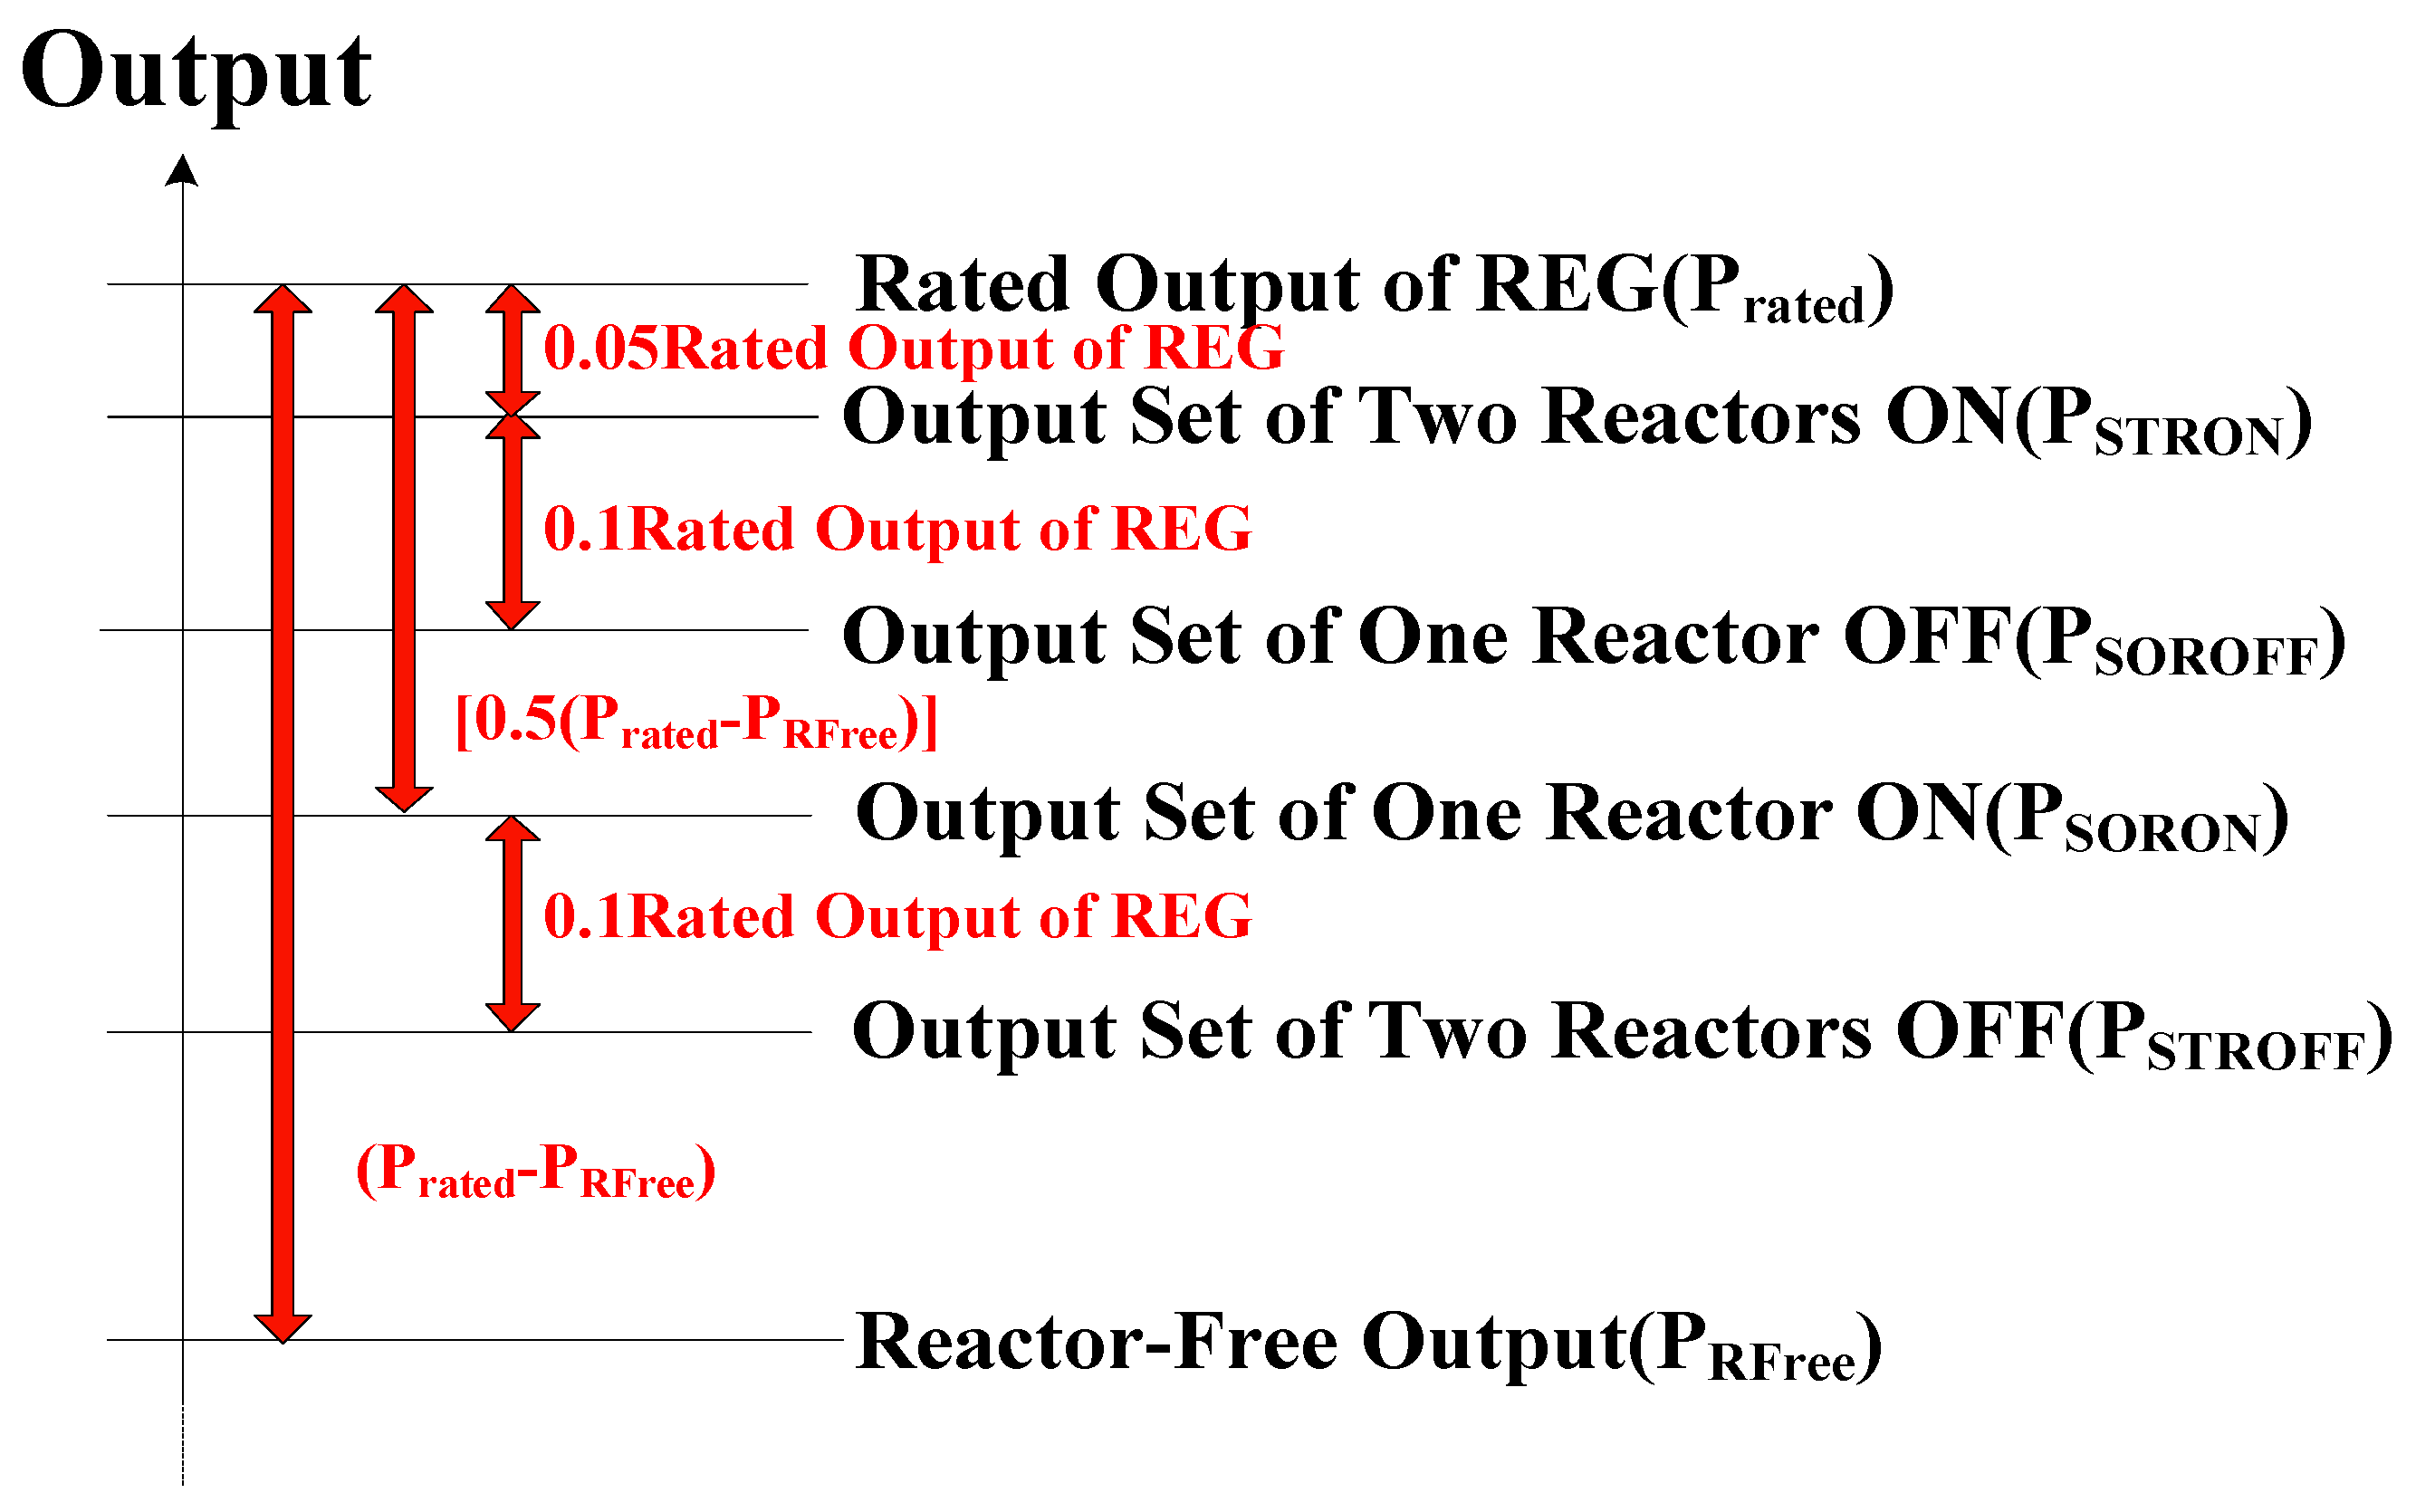
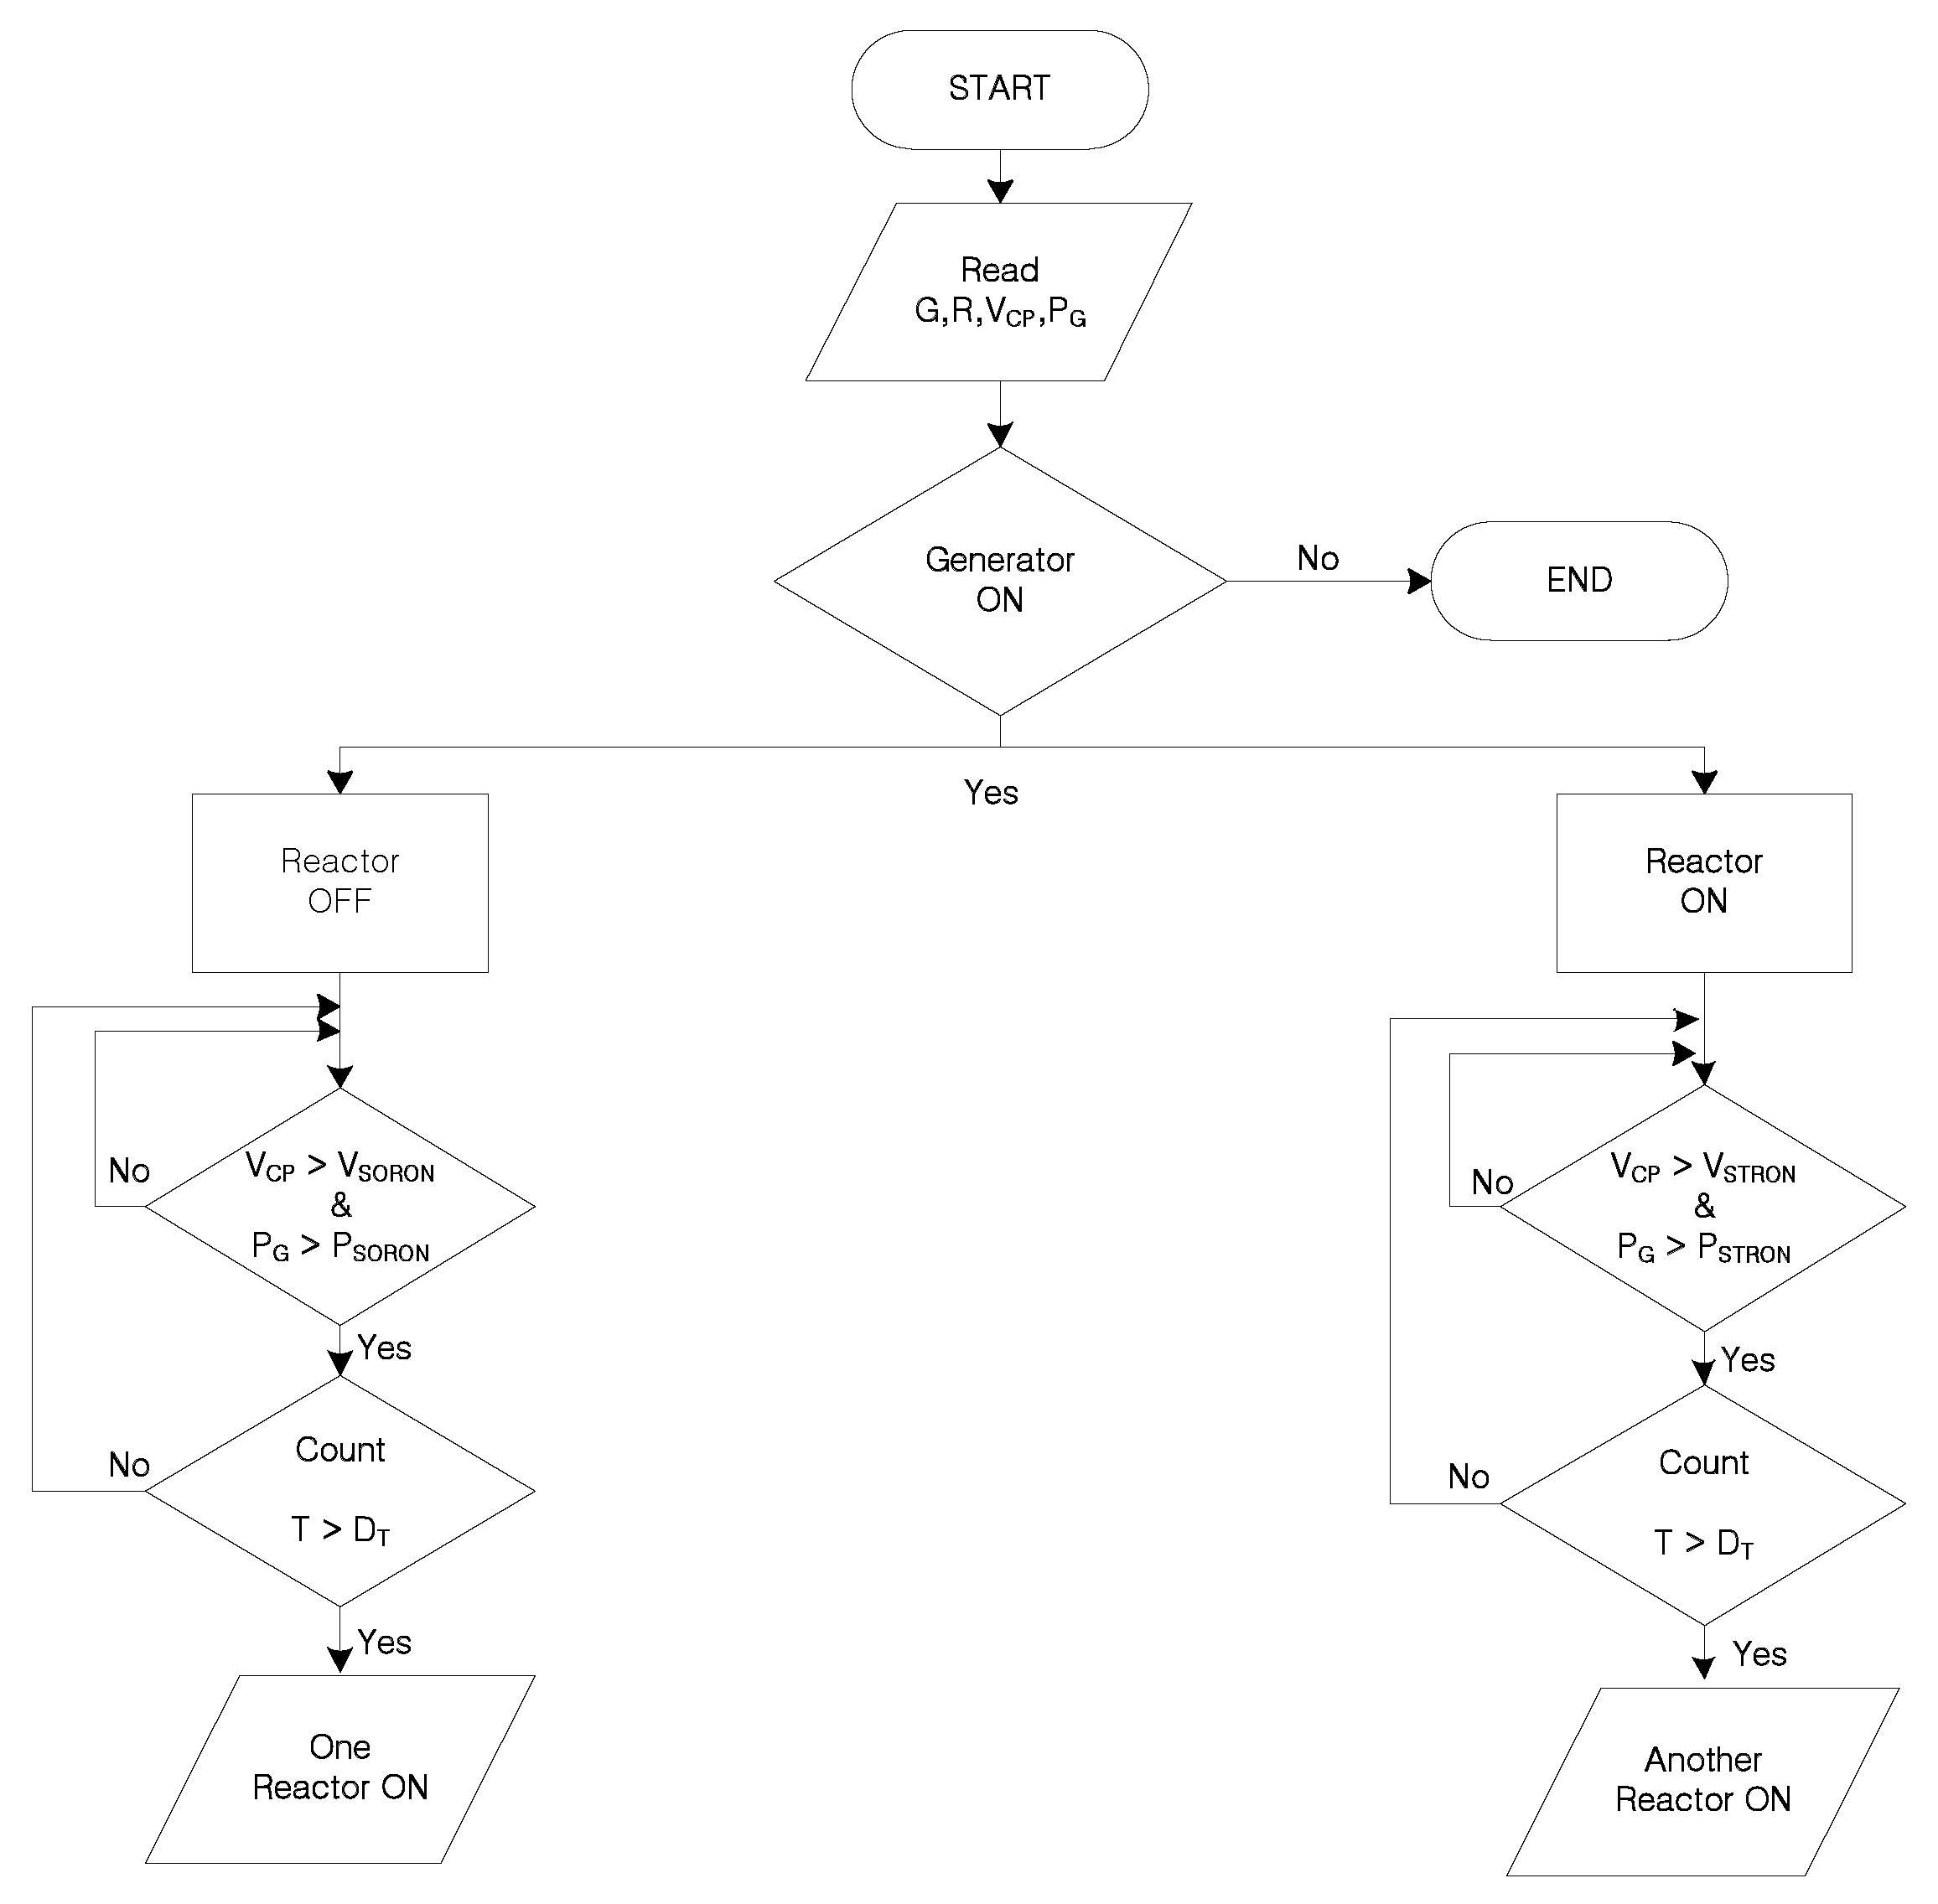
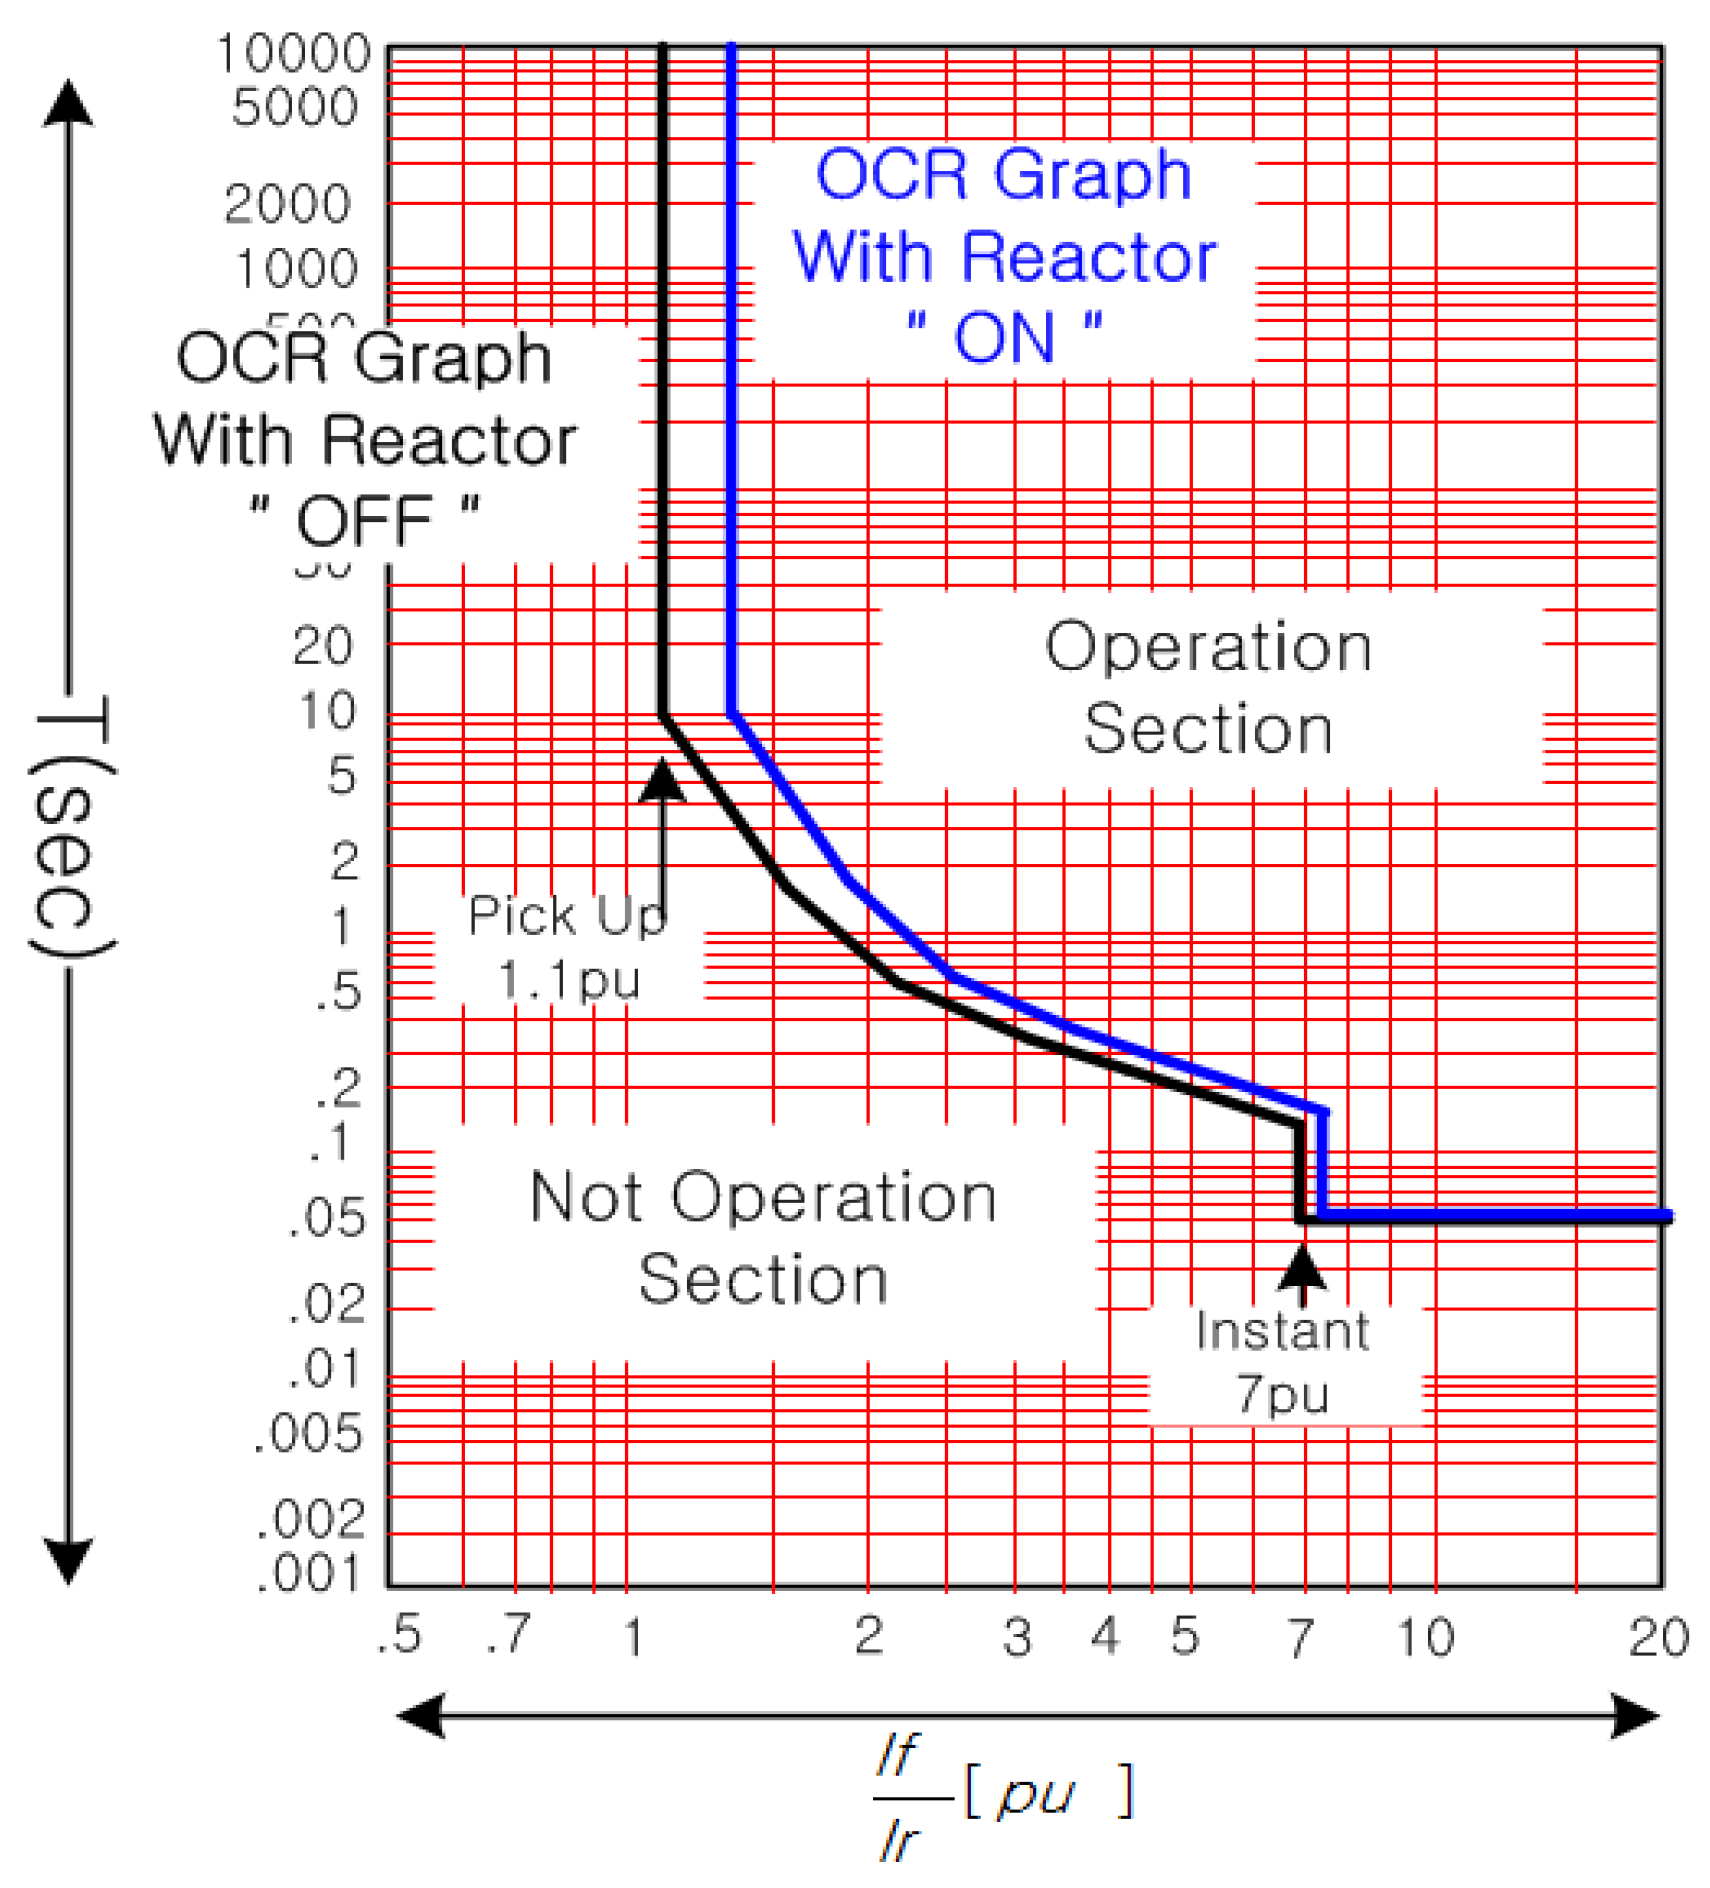
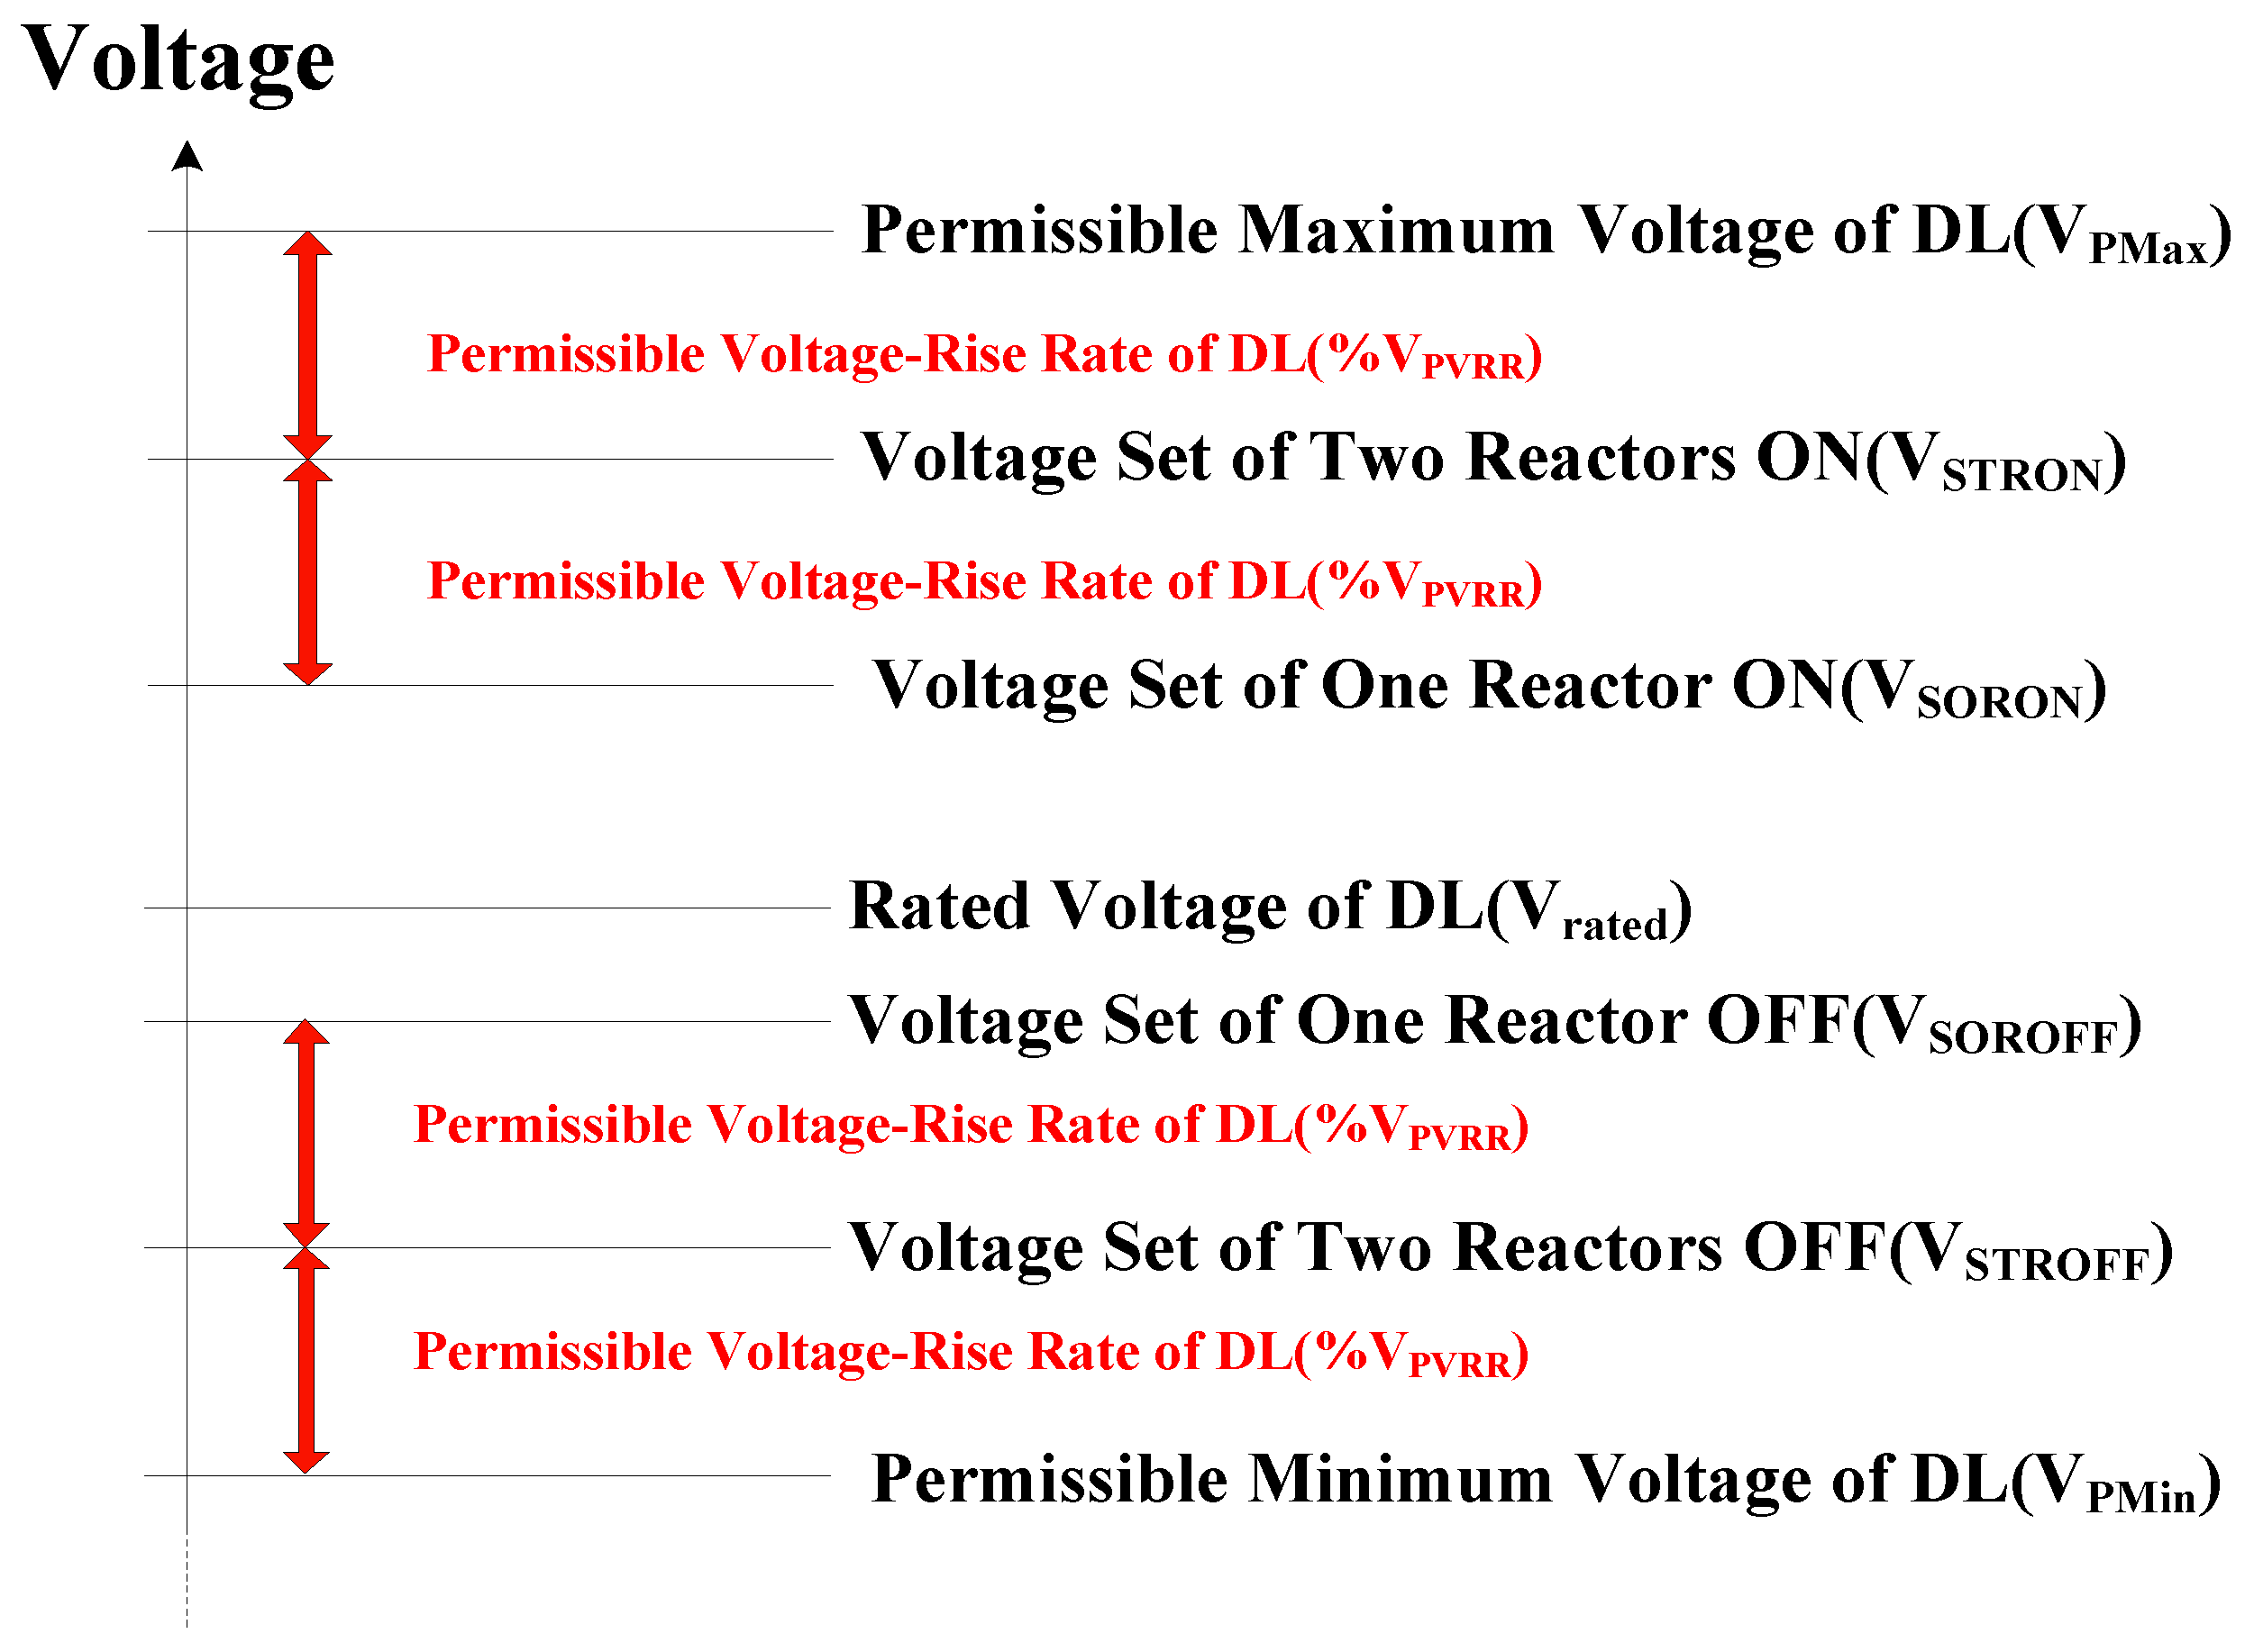
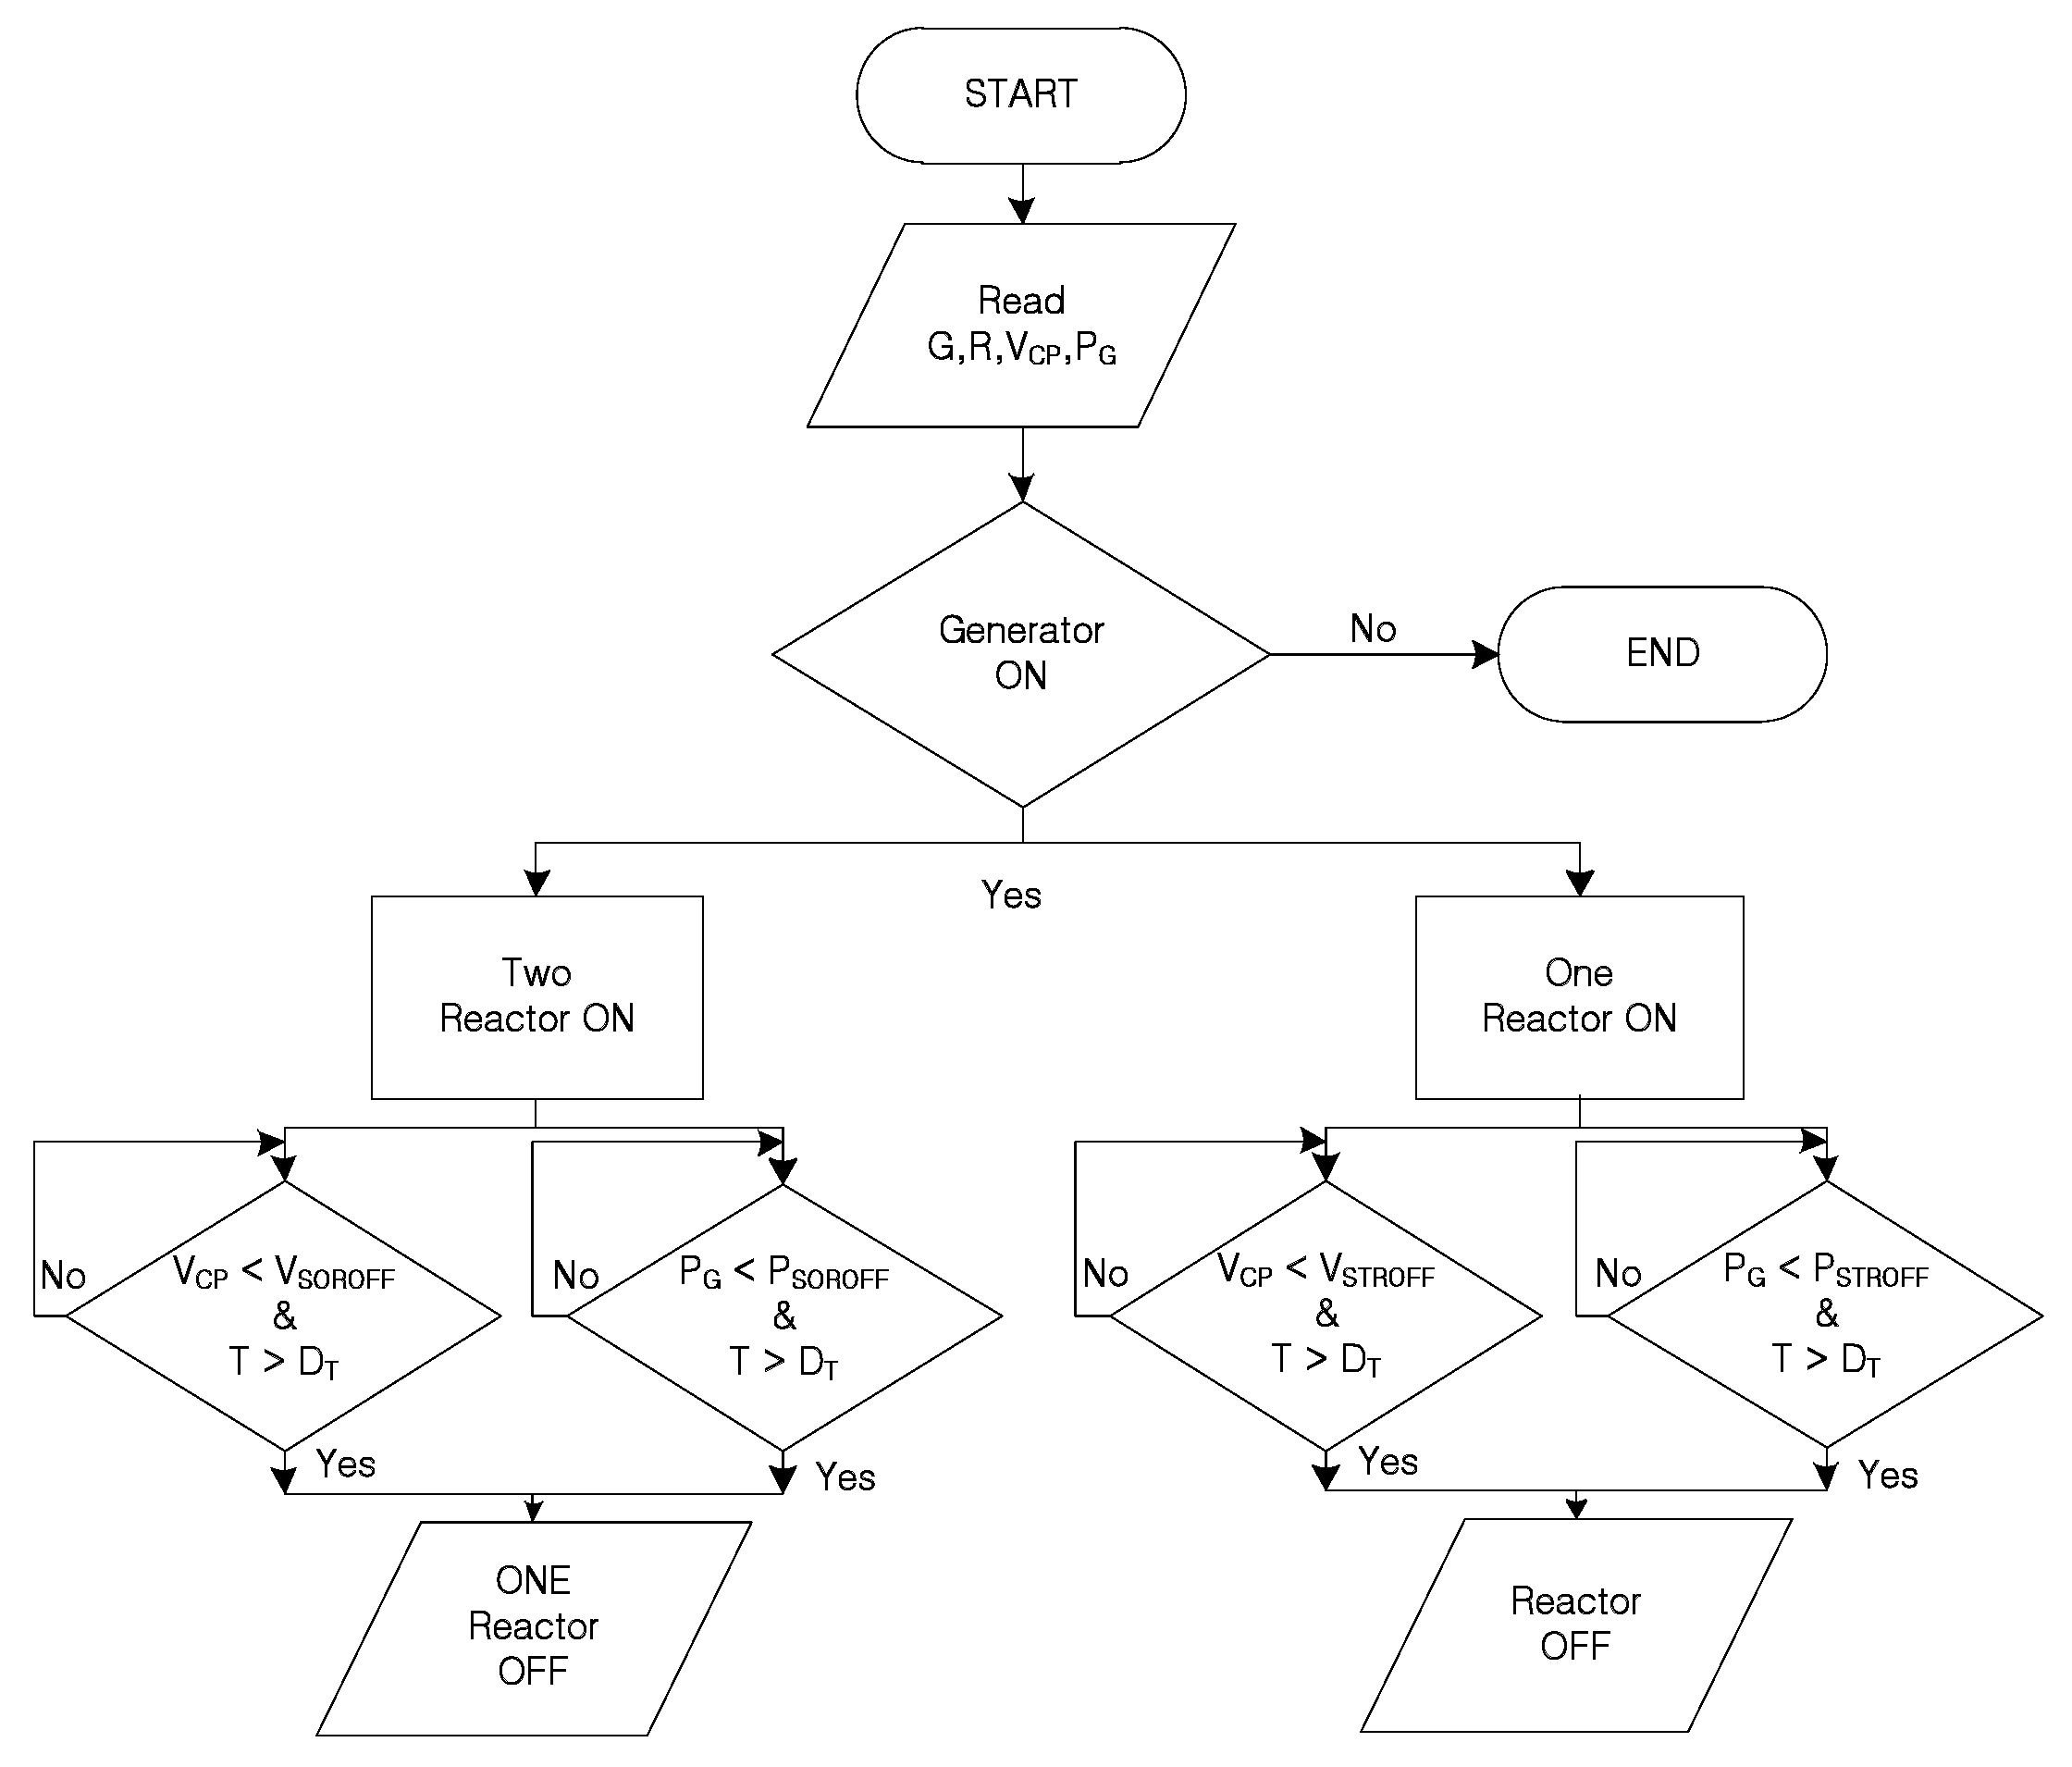
3.2. Operation of Reactor
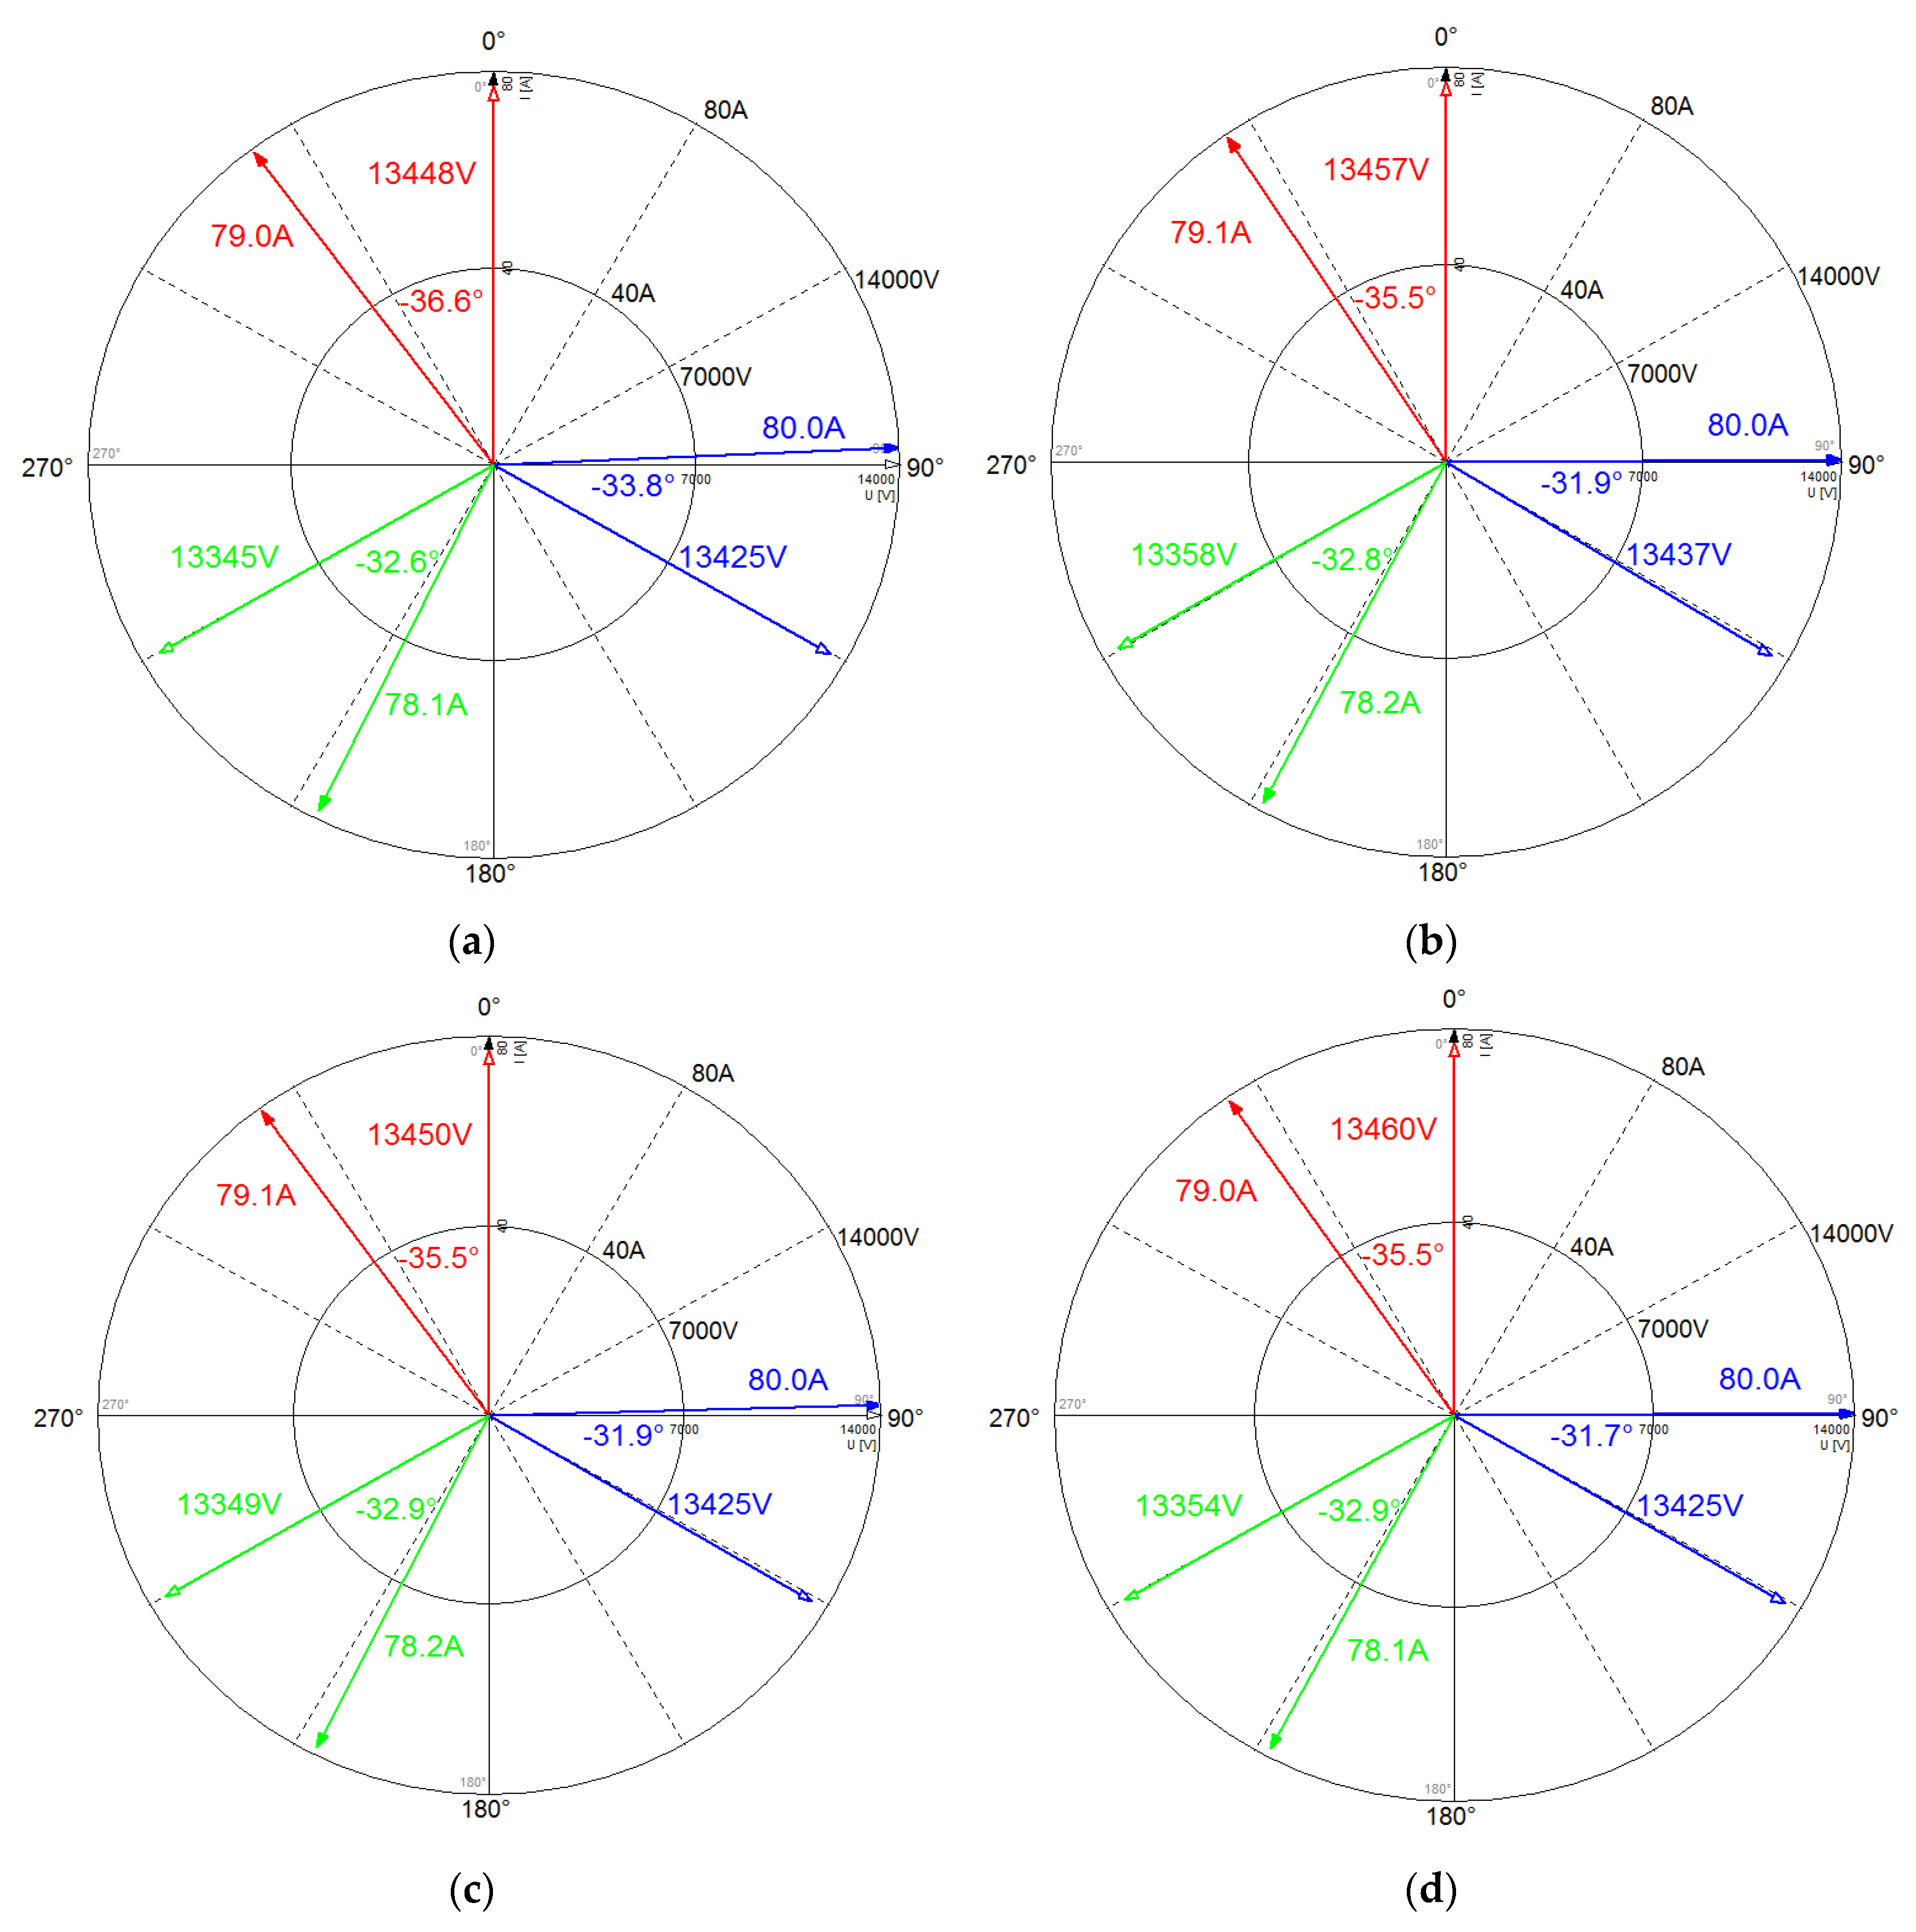
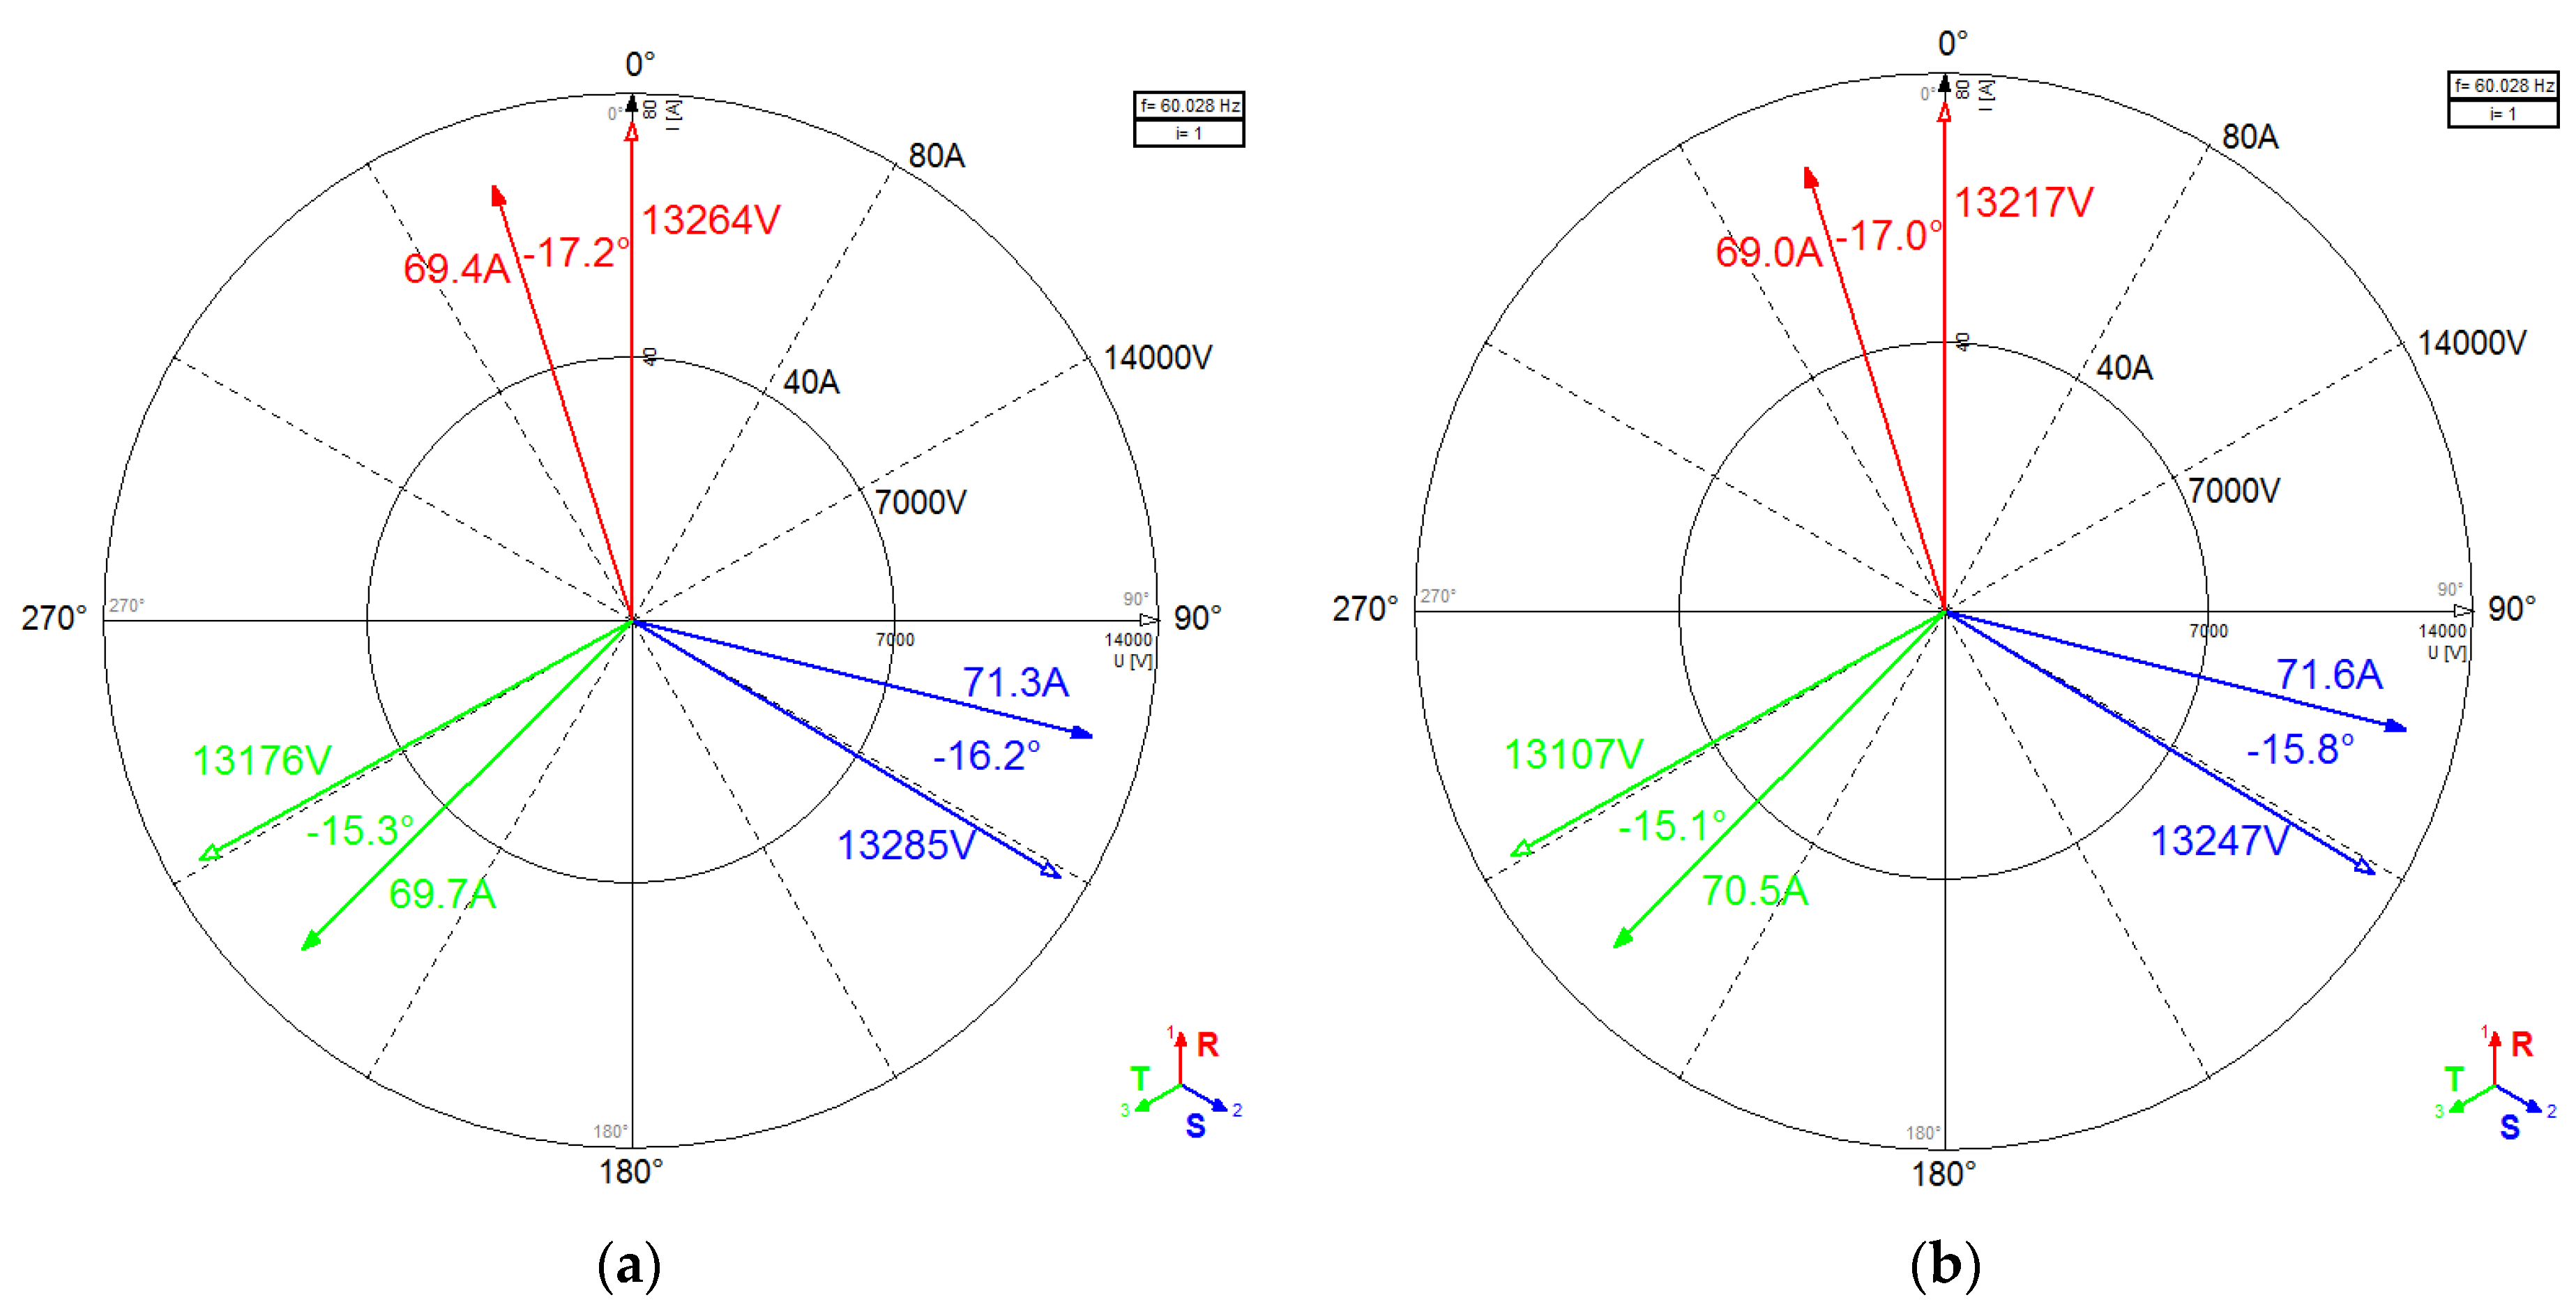
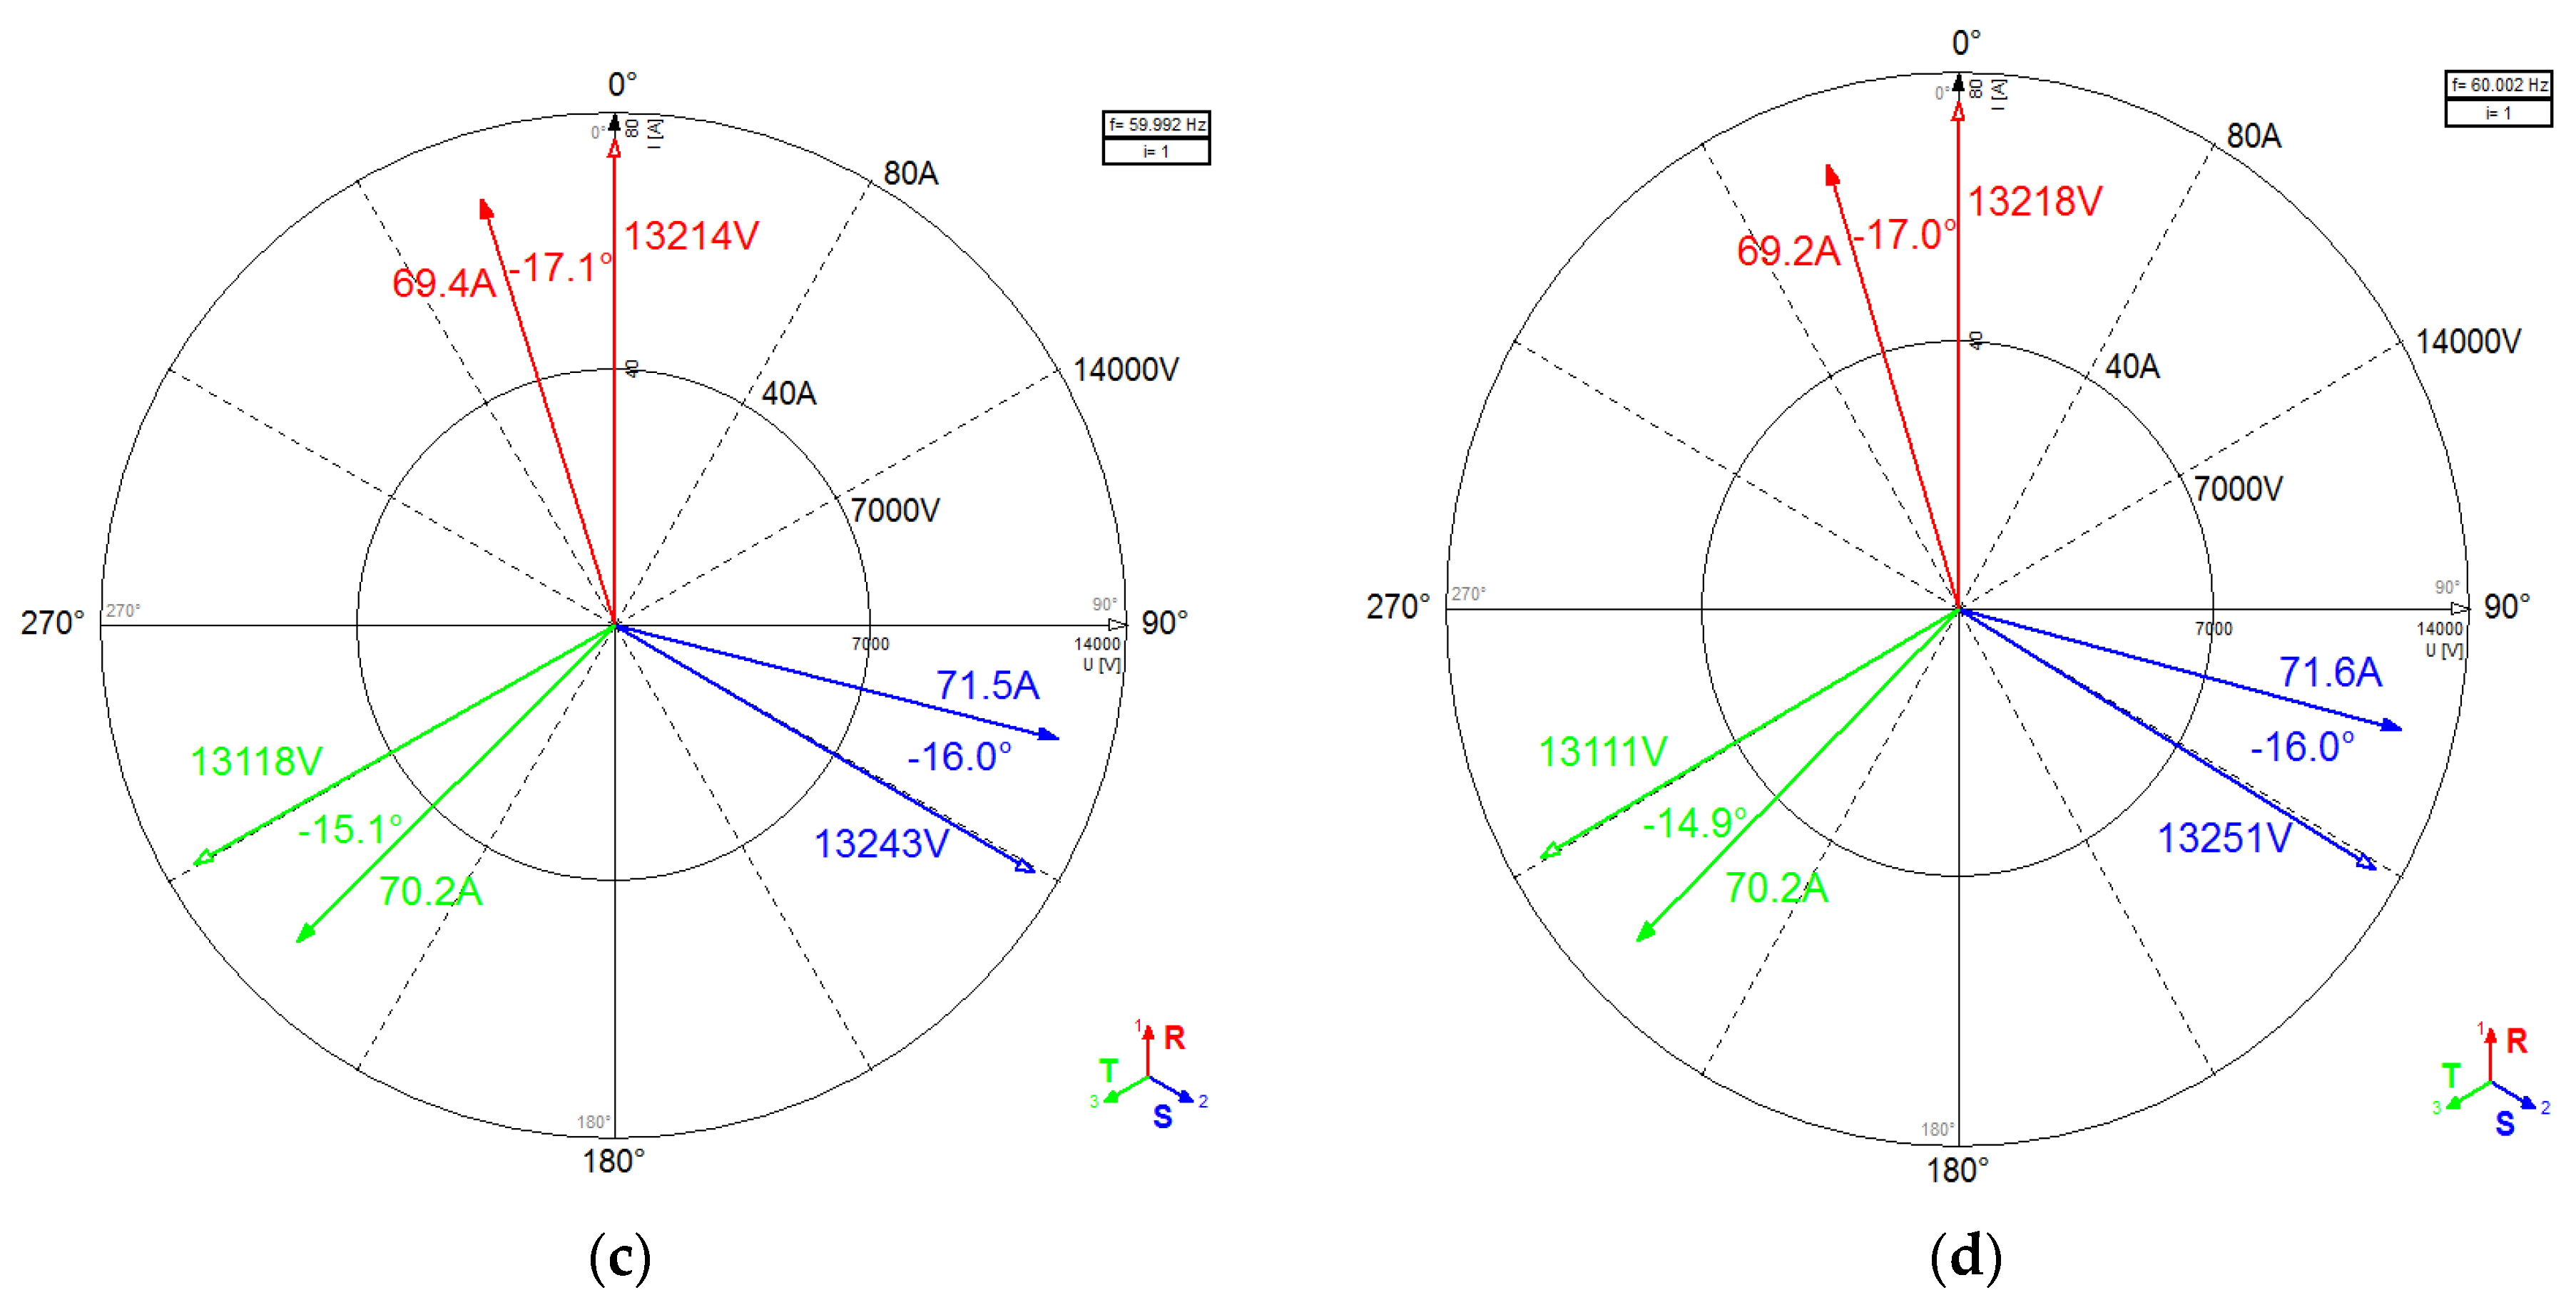
4. Demonstration and Effectiveness
5. Conclusions
Acknowledgments
Author Contributions
Conflicts of Interest
References
- Korea Electric Power Corporation. The Standard for the Connection of the Distributed Energy Resource in the Distribution Power System; KEPCO: Naju, Korea, 2015. [Google Scholar]
- Barker, P.P.; De Mello, R.W. Determining the impact of distributed generation on power systems: Part 1—Radial distribution systems. In Proceedings of the IEEE Power Engineering Society Summer Meeting, Seattle, WA, USA, 16–20 July 2000; Volume 3, pp. 1645–1656.
- Lasseter, R.H. Smart distribution: Coupled microgrids. Proc. IEEE 2011, 99, 1074–1082. [Google Scholar] [CrossRef]
- Joos, G.; Ooi, B.T.; McGillis, D.; Galiana, F.D.; Marceau, R. The potential of distributed generation to provide ancillary services. In Proceedings of the IEEE Power Engineering Society Summer Meeting, Seattle, WA, USA, 16–20 July 2000; Volume 3, pp. 1762–1767.
- Reed, G.F.; Takeda, M.; Iyoda, I. Improved power quality solutions using advanced solid-state switching and static compensation technologies. In Proceedings of the IEEE Power Engineering Society Winter Meeting, Edmonton, AB, Canada, 31 January–4 February 1999; Volume 2, pp. 1132–1137.
- Sun, J.; Czarkowski, D.; Zabar, Z. Voltage flicker mitigation using PWM-based distribution STATCOM. In Proceedings of the IEEE Power Engineering Society Summer Meeting, Chicago, IL, USA, 21–25 July 2002; Volume 1, pp. 616–621.
- Pogaku, N.; Green, T.C. Harmonic mitigation throughout a distribution system: A distributed-generator-based solution. IEE Proc. Gener. Transm. Distrib. 2006, 153, 350–358. [Google Scholar] [CrossRef]
- Basso, T.S.; De Blasio, R. IEEE 1547 series of standards: Interconnection issues. IEEE Trans. Power Electron. 2004, 19, 1159–1162. [Google Scholar] [CrossRef]
- Carrasco, J.M.; Franquelo, L.G.; Bialasiewicz, J.T.; Galvan, E.; Portillo Guisado, R.C.; Prats, A.M.; Leon, J.I.; Moreno-Alfonso, N. Power-electronic systems for the grid integration of renewable energy sources: A survey. IEEE Trans. Ind. Electron. 2006, 53, 1002–1016. [Google Scholar] [CrossRef]
- Klapp, D.; Vollkommer, H.T. Application of an intelligent static switch to the point of common coupling to satisfy IEEE 1547 compliance. In Proceedings of the IEEE Power Engineering Society General Meeting, Tampa, FL, USA, 24–28 June 2007; pp. 1–4.
- Kroposki, B.; Basso, T.S.; DeBlasio, R. Microgrid standards and technologies. In Proceedings of the IEEE Power and Energy Society General Meeting, Pittsburgh, PA, USA, 20–24 July 2008; pp. 1–4.
- Scott, N.C.; Atkinson, D.J.; Morrell, J.E. Use of load control to regulate voltage on distribution networks with embedded generation. IEEE Trans. Power Syst. 2002, 17, 510–515. [Google Scholar] [CrossRef]
- Liu, X.; Aichhorn, A.; Liu, L.; Li, H. Coordinated control of distributed energy storage system with tap changer transformers for voltage rise mitigation under high photovoltaic penetration. IEEE Trans. Smart Grid 2012, 3, 897–906. [Google Scholar] [CrossRef]
- Choi, J.; Kim, J. Advanced voltage regulation method of power distribution systems interconnected with dispersed storage and generation systems. IEEE Trans. Power Deliv. 2001, 16, 329–334. [Google Scholar] [CrossRef]
- Walling, R.A.; Saint, R.; Dugan, R.C.; Burke, J.; Kojovic, L.A. Summary of distributed resources impact on power delivery systems. IEEE Trans. Power Deliv. 2008, 23, 1636–1644. [Google Scholar] [CrossRef]
- Liu, Y.; Bebic, J.; Kroposki, B.; De Bedout, J.; Ren, W. Distribution system voltage performance analysis for high-penetration PV. In Proceedings of the Energy 2030 Conference, Atlanta, GA, USA, 17–18 November 2008; pp. 1–8.
- Keane, A.; O’Malley, M. Optimal allocation of embedded generation on distribution networks. IEEE Trans. Power Syst. 2005, 20, 1640–1646. [Google Scholar] [CrossRef]
- Liew, S.N.; Strbac, G. Maximizing penetration of wind generation in existing distribution networks. IEE Proc. Gener. Transm. Distrib. 2002, 149, 256–262. [Google Scholar] [CrossRef]
- Singh, R.K.; Goswami, S.K. Optimum allocation of distributed generations based on nodal pricing for profit, loss reduction, and voltage improvement including voltage rise issue. Int. J. Electr. Power Energy Syst. 2010, 32, 637–644. [Google Scholar] [CrossRef]
- Harrison, G.P.; Wallace, A.R. Optimal power flow evaluation of distribution network capacity for the connection of distributed generation. IEE Proc. Gener. Transm. Distrib. 2005, 152, 115–122. [Google Scholar] [CrossRef]
- Ochoa, L.F.; Dent, C.J.; Harrison, G.P. Distribution network capacity assessment: Variable DG and active networks. IEEE Trans. Power Syst. 2010, 25, 87–95. [Google Scholar] [CrossRef]
- Divan, D.M.; Brumsickle, W.E.; Schneider, R.S.; Kranz, B.; Gascoigne, R.W.; Bradshaw, D.T.; Ingram, M.; Grant, I.S. A distributed static series compensator system for realizing active power flow control on existing power lines. IEEE Trans. Power Deliv. 2007, 22, 642–649. [Google Scholar] [CrossRef]
- Lee, S.Y.; Wu, C.J.; Chang, W.N. A compact control algorithm for reactive power compensation and load balancing with static Var compensator. Electr. Power Syst. Res. 2001, 58, 63–70. [Google Scholar] [CrossRef]
- Thukaram, D.; Lomi, A. Selection of static VAR compensator location and size for system voltage stability improvement. Electr. Power Syst. Res. 2000, 54, 139–150. [Google Scholar] [CrossRef]
- Singh, B.; Saha, R.; Chandra, A.; Al-Haddad, K. Static synchronous compensators (STATCOM): A review. IET Power Electron. 2009, 2, 297–324. [Google Scholar] [CrossRef]
- Giroux, P.; Sybille, G.; Le-Huy, H. Modeling and simulation of a distribution STATCOM using simulink’s power system blockset. In Proceedings of the the 27th Annual Conference of the IEEE, Denver, CO, USA, 29 November–2 December 2001; Volume 2, pp. 990–994.
- Chen, W.L.; Hsu, Y.Y. Direct output voltage control of a static synchronous compensator using current sensorless dq vector-based power balancing scheme. In Proceedings of the Transmission and Distribution Conference and Exposition, Dallas, TX, USA, 7–12 September 2003; Volume 2, pp. 545–549.
- Freitas, W.; Morelato, A.; Xu, W.; Sato, F. Impacts of AC generators and DSTATCOM devices on the dynamic performance of distribution systems. IEEE Trans. Power Deliv. 2005, 20, 1493–1501. [Google Scholar] [CrossRef]
- Xu, L.; Yao, L.; Sasse, C. Comparison of using SVC and STATCOM for wind farm integration. In Proceedings of the IEEE 2006 International Conference on Power System Technology, Chongqing, China, 22–26 October 2006; pp. 1–7.
- El-Shimy, M.; Badr, M.L.; Rassem, O.M. Impact of large scale wind power on power system stability. In Proceedings of the Power System Conference, (IEEE MEPCON 2008), Aswan, Egypt, 12–15 March 2008; pp. 630–636.
- Repo, S.; Laaksonen, H.; Jarventausta, P.; Huhtala, O.; Mickelsson, M. A case study of a voltage rise problem due to a large amount of distributed generation on a weak distribution network. In Proceedings of the IEEE Power Tech Conference, Bologna, Italy, 23–26 June 2003; Volume 4, pp. 1–6.
- Ok, Y.; Choi, J.; Shin, M.; Choi, Y. Analysis of voltage rise phenomenon in distribution lines associated with grid-connected renewable energy system. In Proceedings of the IEEE International Conference on Power Electronics and ECCE Asia (ICPE-ECCE), Seoul, Korea, 1–5 June 2015; pp. 1790–1795.
- Ok, Y.; Lee, J.; Choi, J. Analysis and Solution for Operations of Overcurrent Relay in Wind Power System. Energies 2016, 9, 458. [Google Scholar] [CrossRef]


| Location of Reactor | CT1 | CT2 | ||
|---|---|---|---|---|
| ON | OFF | ON | OFF | |
| ① | a + j(b + c) | a + jb | a + j(b + c) | a + jb |
| ② | a + jb | a + jb | a + j(b + c) | a + jb |
| ③ | a + jb | a + jb | a + j(b + c) | a + jb |
| ④ | a + jb | a + jb | a + jb | a + jb |
| Remarks | ||||
|---|---|---|---|---|
| 1.000 | 0.000 | 21,824.6 | 4.93% | Gen. capacity: 1.5 MVA 2 ea Gen. voltage : 0.69 kV Connection point voltage: Station voltage: Rated voltage of DL: |
| 0.990 | 0.141 | 22,065.2 | 3.78% | |
| 0.980 | 0.199 | 22,170.2 | 3.29% | |
| 0.940 | 0.341 | 22,443.5 | 2.03% | |
| 0.9385 | 0.345 | 22,451.7 | 2.00% | |
| 0.930 | 0.368 | 22,496.8 | 1.79% | |
| 0.910 | 0.415 | 22,594.1 | 1.35% | |
| 0.900 | 0.436 | 22,639.0 | 1.15% | |
| 0.890 | 0.456 | 22,682.0 | 0.96% | |
| 0.840 | 0.543 | 22,874.2 | 0.11% | |
| 0.8325 | 0.554 | 22,900.5 | 0.00% |
| Characteristic | A | B | C | D |
|---|---|---|---|---|
| Capacity of REG (kVA) | 3000 | 3145 | 3177 | 3235 |
| Power Factor | 0.9900 | 0.9442 | 0.9348 | 0.9180 |
| Active Power (kW) | 2970 | 2970 | 2970 | 2970 |
| Reactive Power (kVar) | 423 | 1036 | 1128 | 1283 |
| Voltage (V) | 22,900 | 22,900 | 22,900 | 22,900 |
| Current (A) | 75.6 | 79.3 | 80.1 | 81.6 |
| Voltage-rise Rate (%) | 3.78 | 2.22 | 2.00 | 1.61 |
| Capacity of Reactor (kVA) | - | 613 | 705 | 860 |
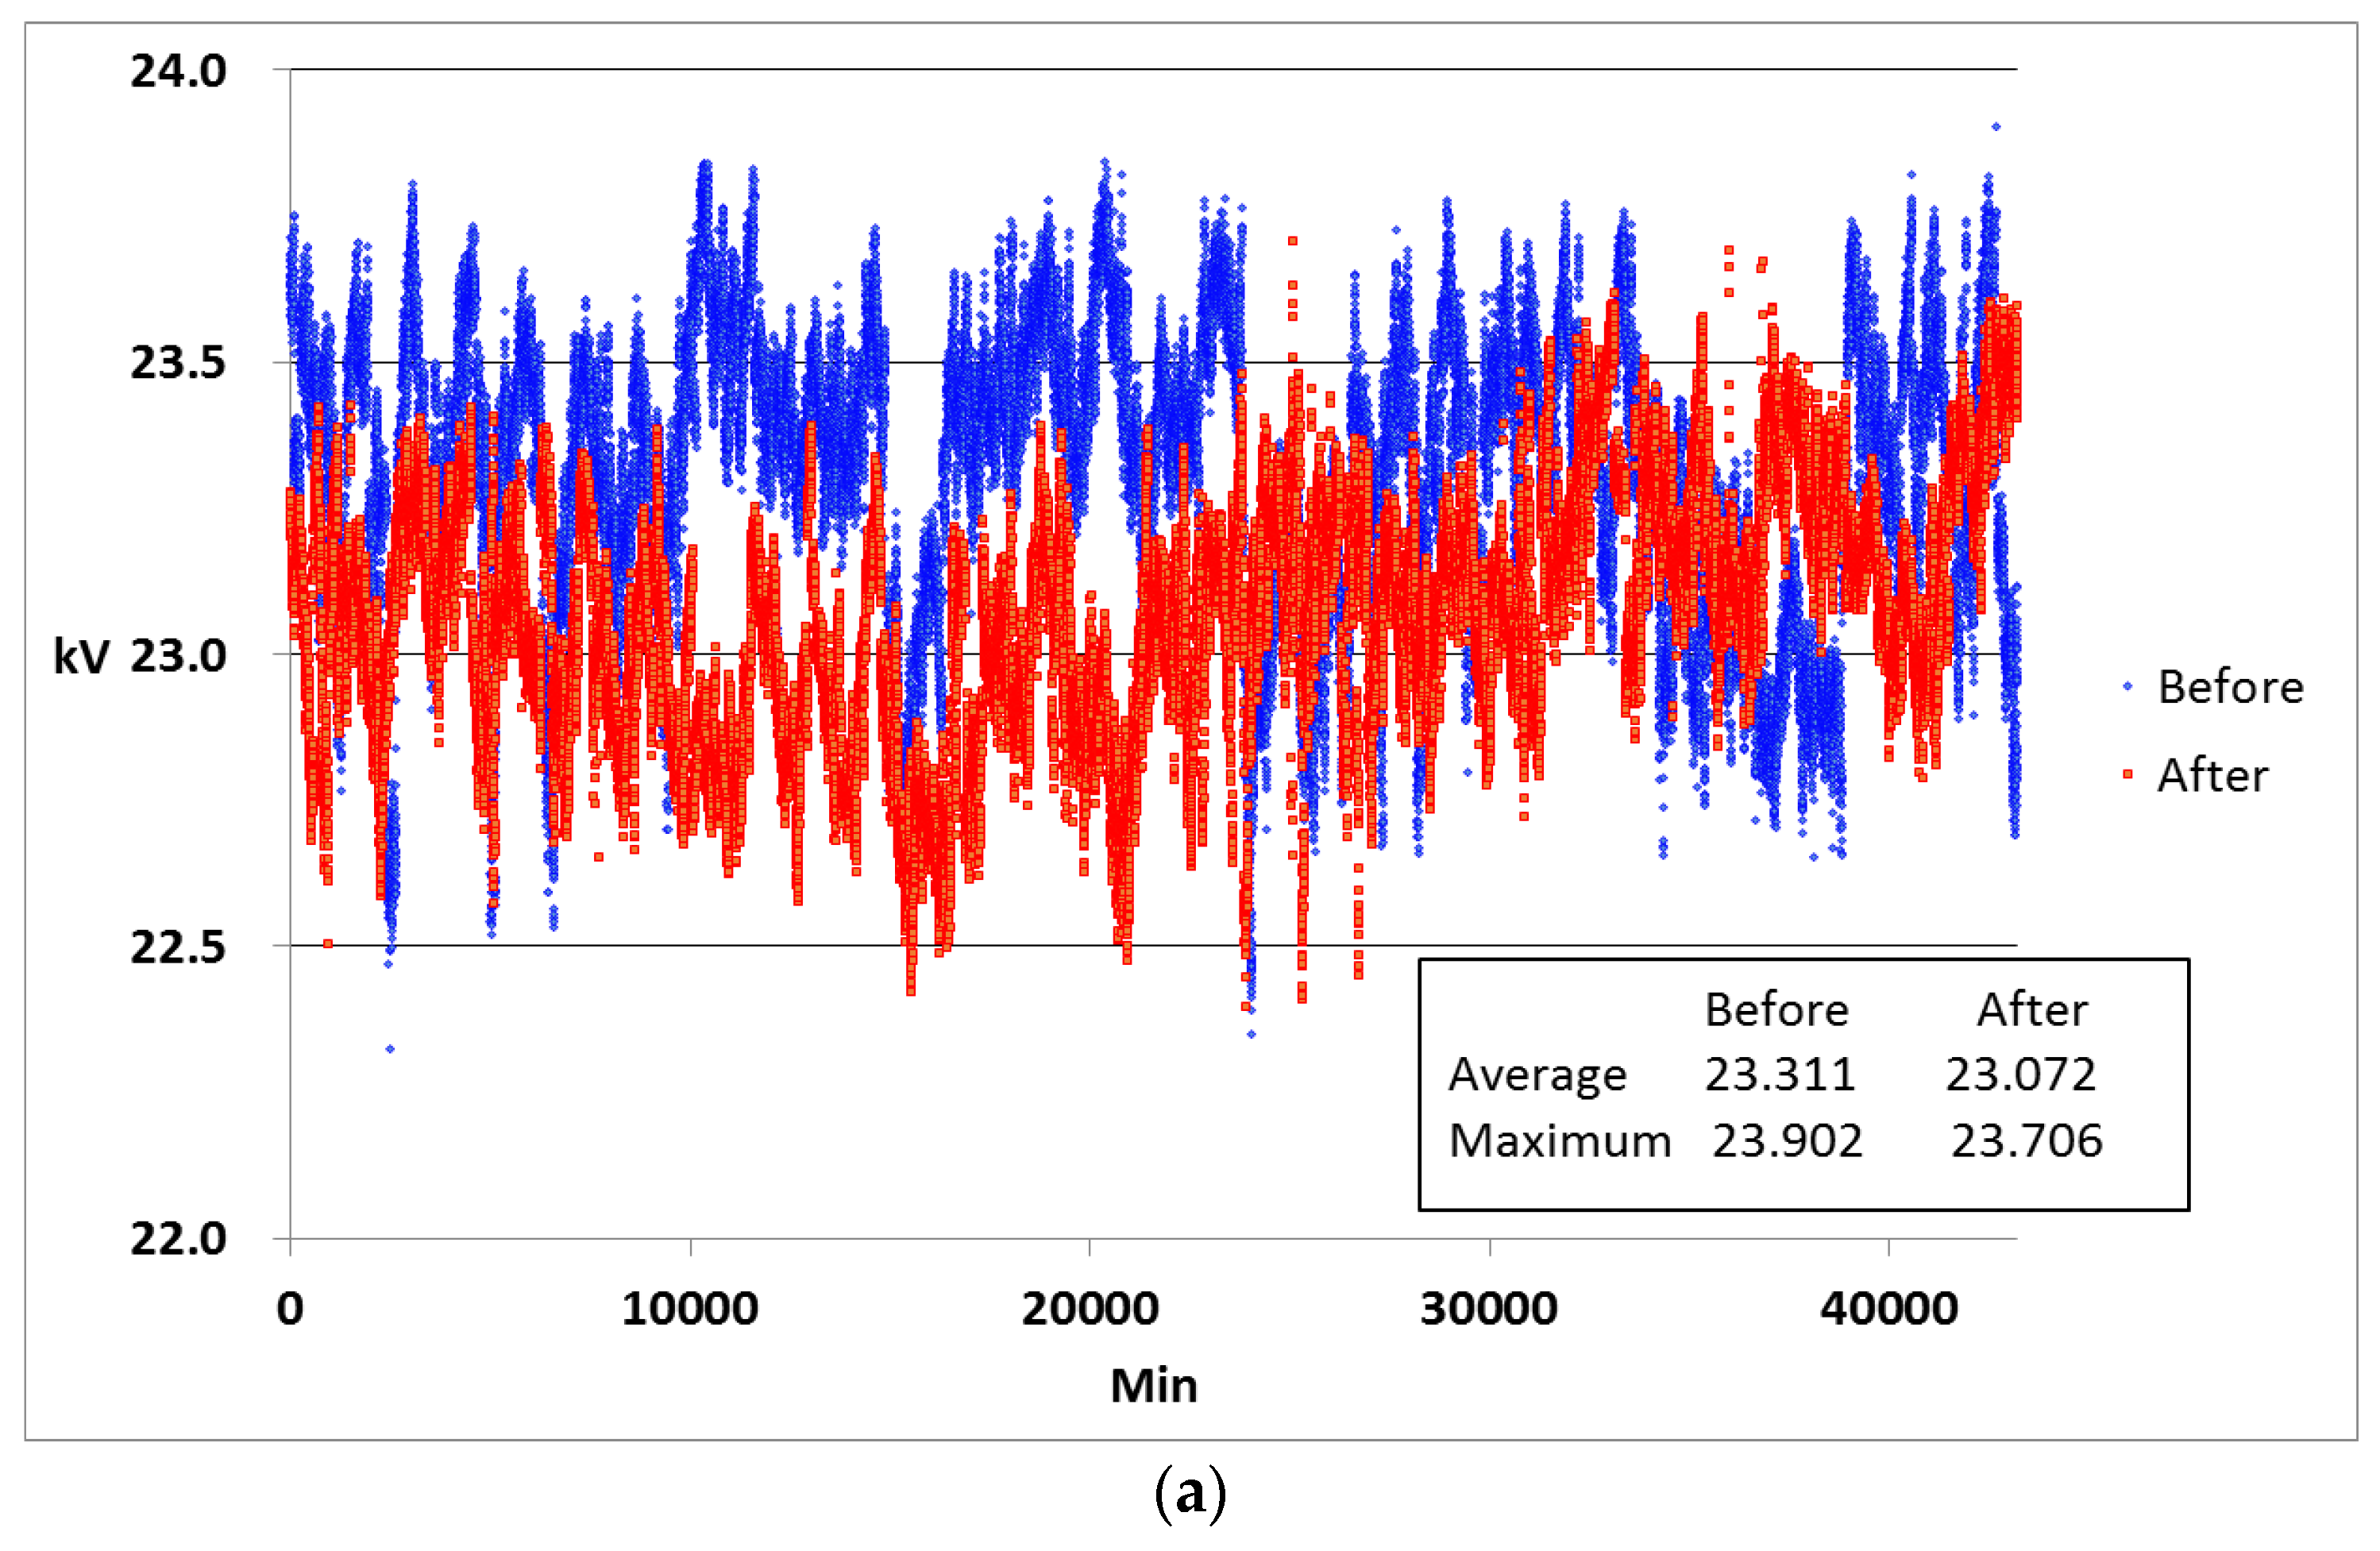
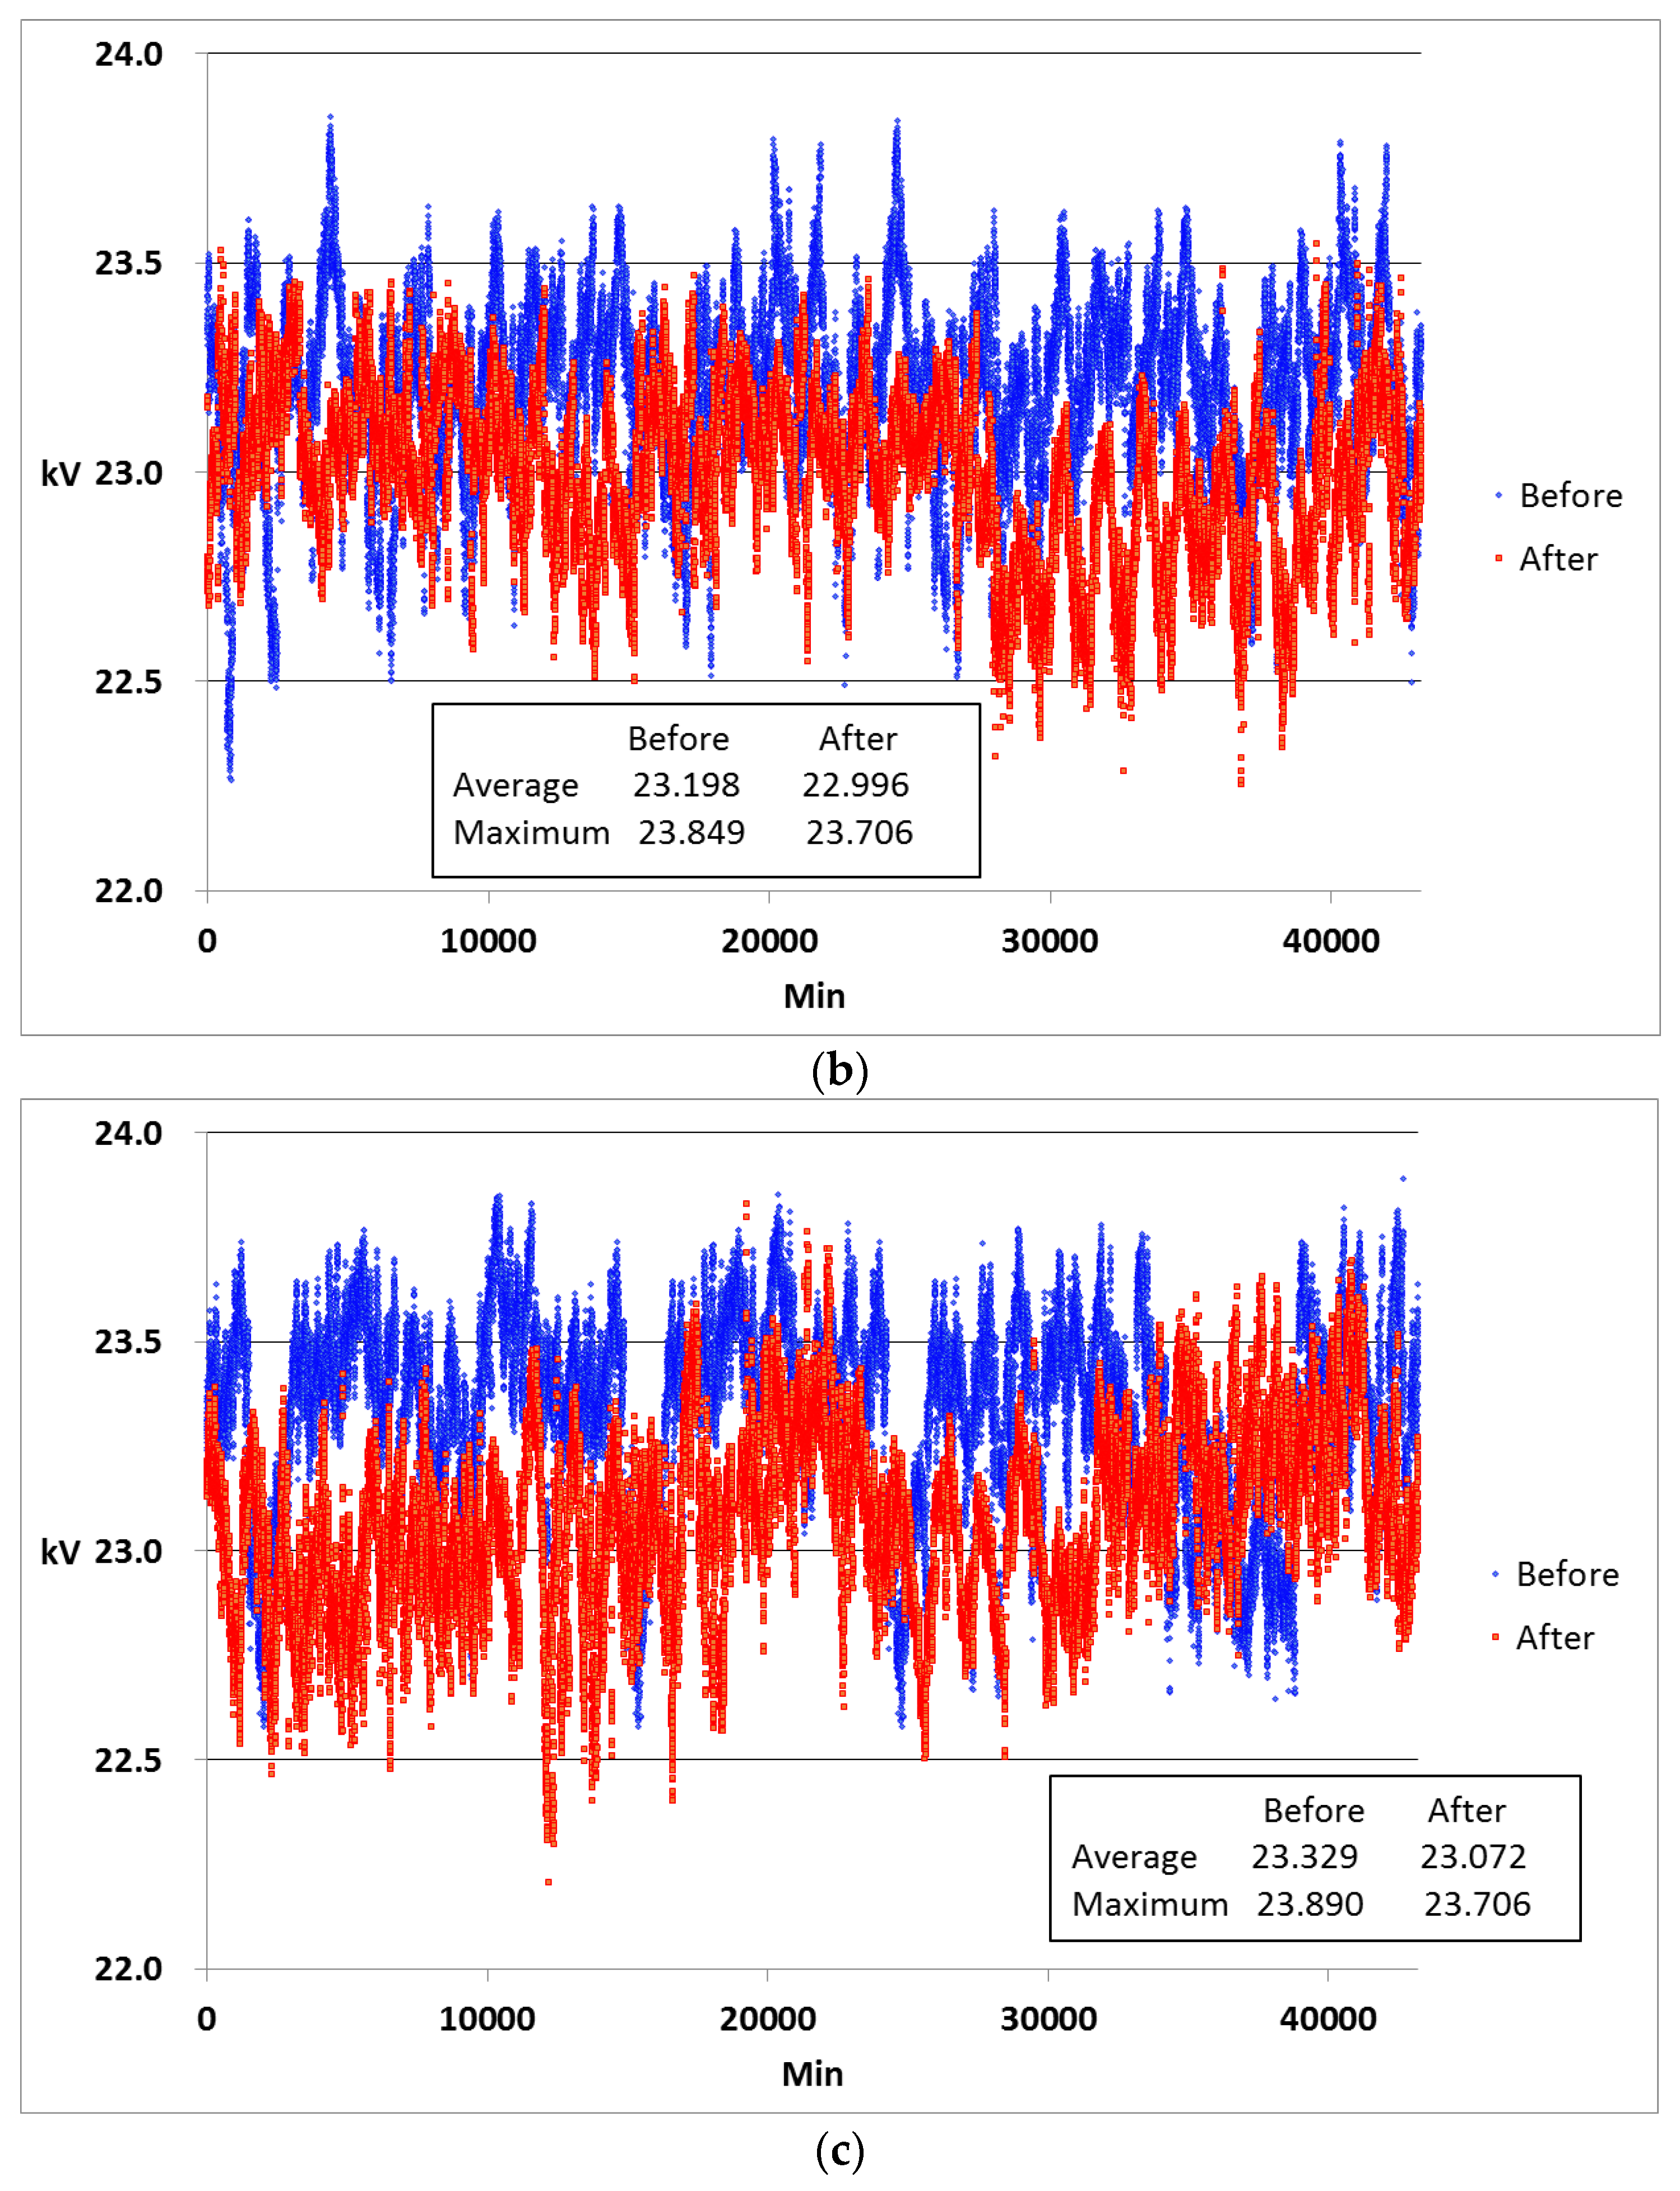
| Electric Values | Without Reactor | With Two Reactors | ||||||
|---|---|---|---|---|---|---|---|---|
| First | Second | Third | Fourth | First | Second | Third | Fourth | |
| VCP (V) | 22,998 | 22,998 | 22,977 | 22,996 | 23,126 | 23,340 | 23,327 | 23,337 |
| ICP (A) | 70.13 | 70.48 | 70.36 | 70.31 | 79.93 | 79.12 | 79.14 | 79.05 |
| cosθCP in leading | 0.960 | 0.961 | 0.960 | 0.961 | 0.834 | 0.834 | 0.834 | 0.835 |
| VS by calculation (V) | 22,459 | 22,449 | 22,435 | 22,448 | 23,125 | 23,337 | 23,324 | 23,331 |
| VCP-VS by calculation (V) | 539 | 549 | 542 | 548 | 1 | 3 | 3 | 6 |
| %VVRR by calculation (%) | 2.36 | 2.40 | 2.37 | 2.39 | 0.00 | 0.01 | 0.01 | 0.03 |
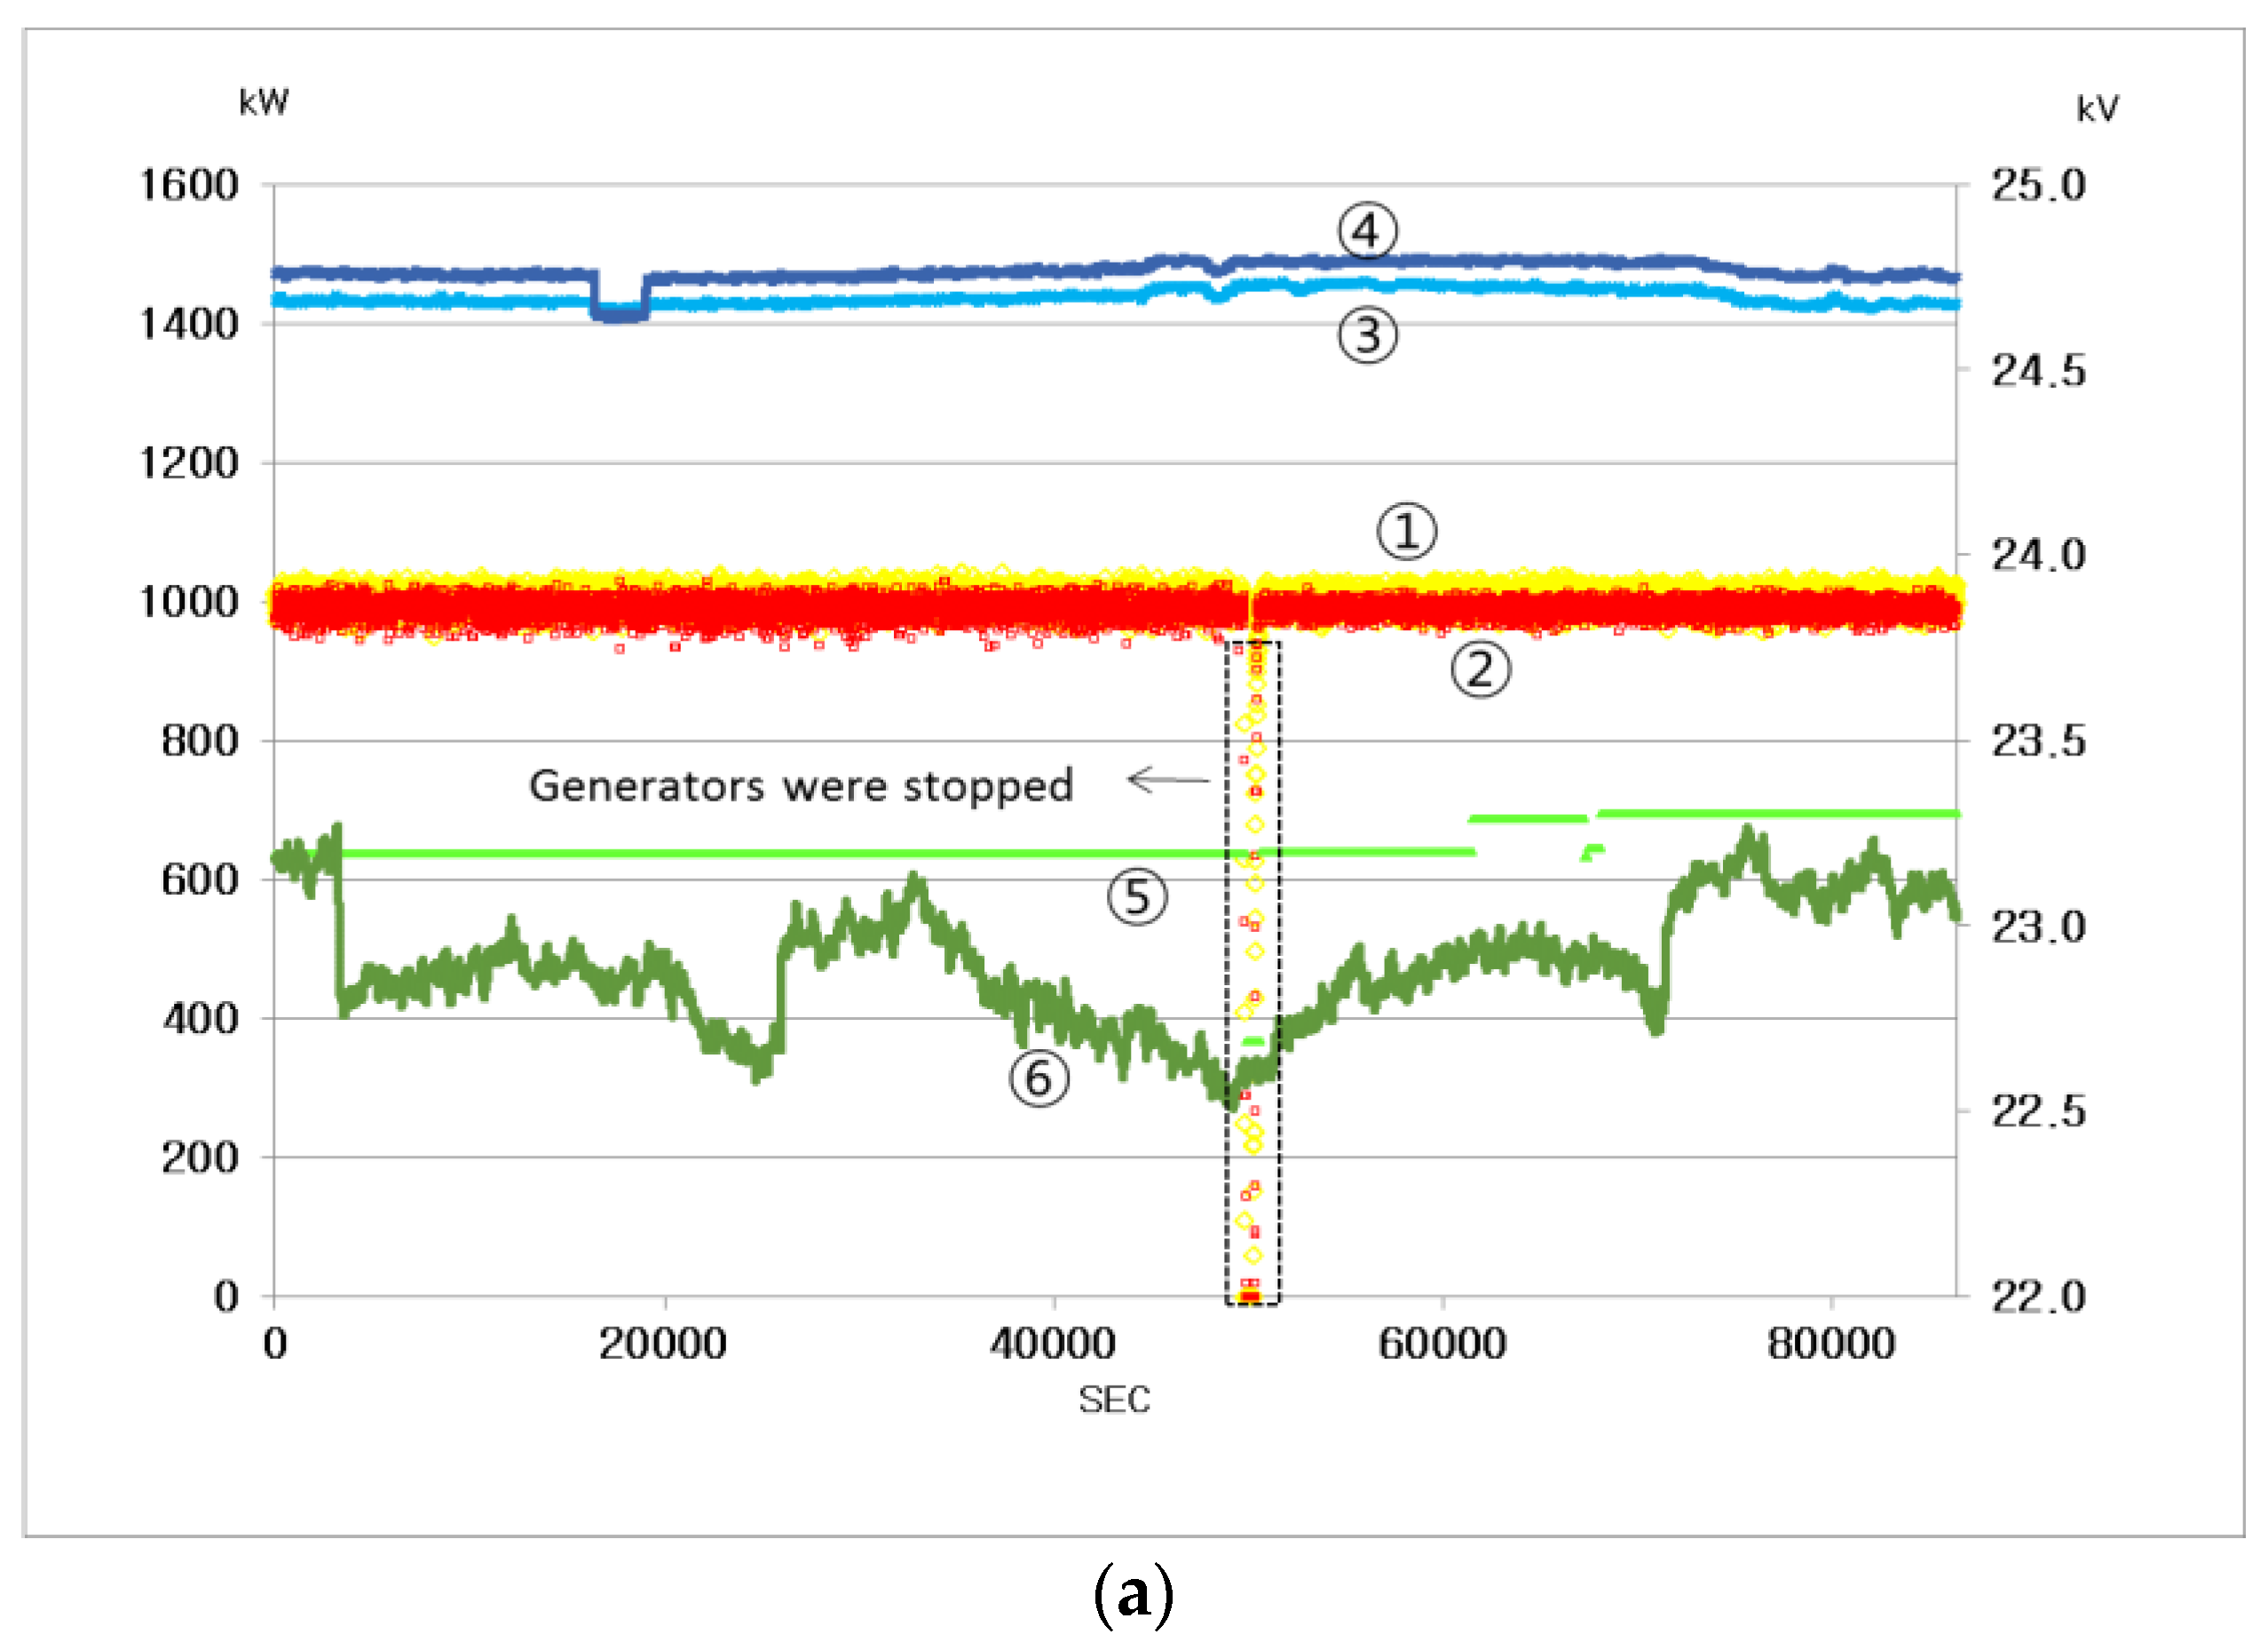
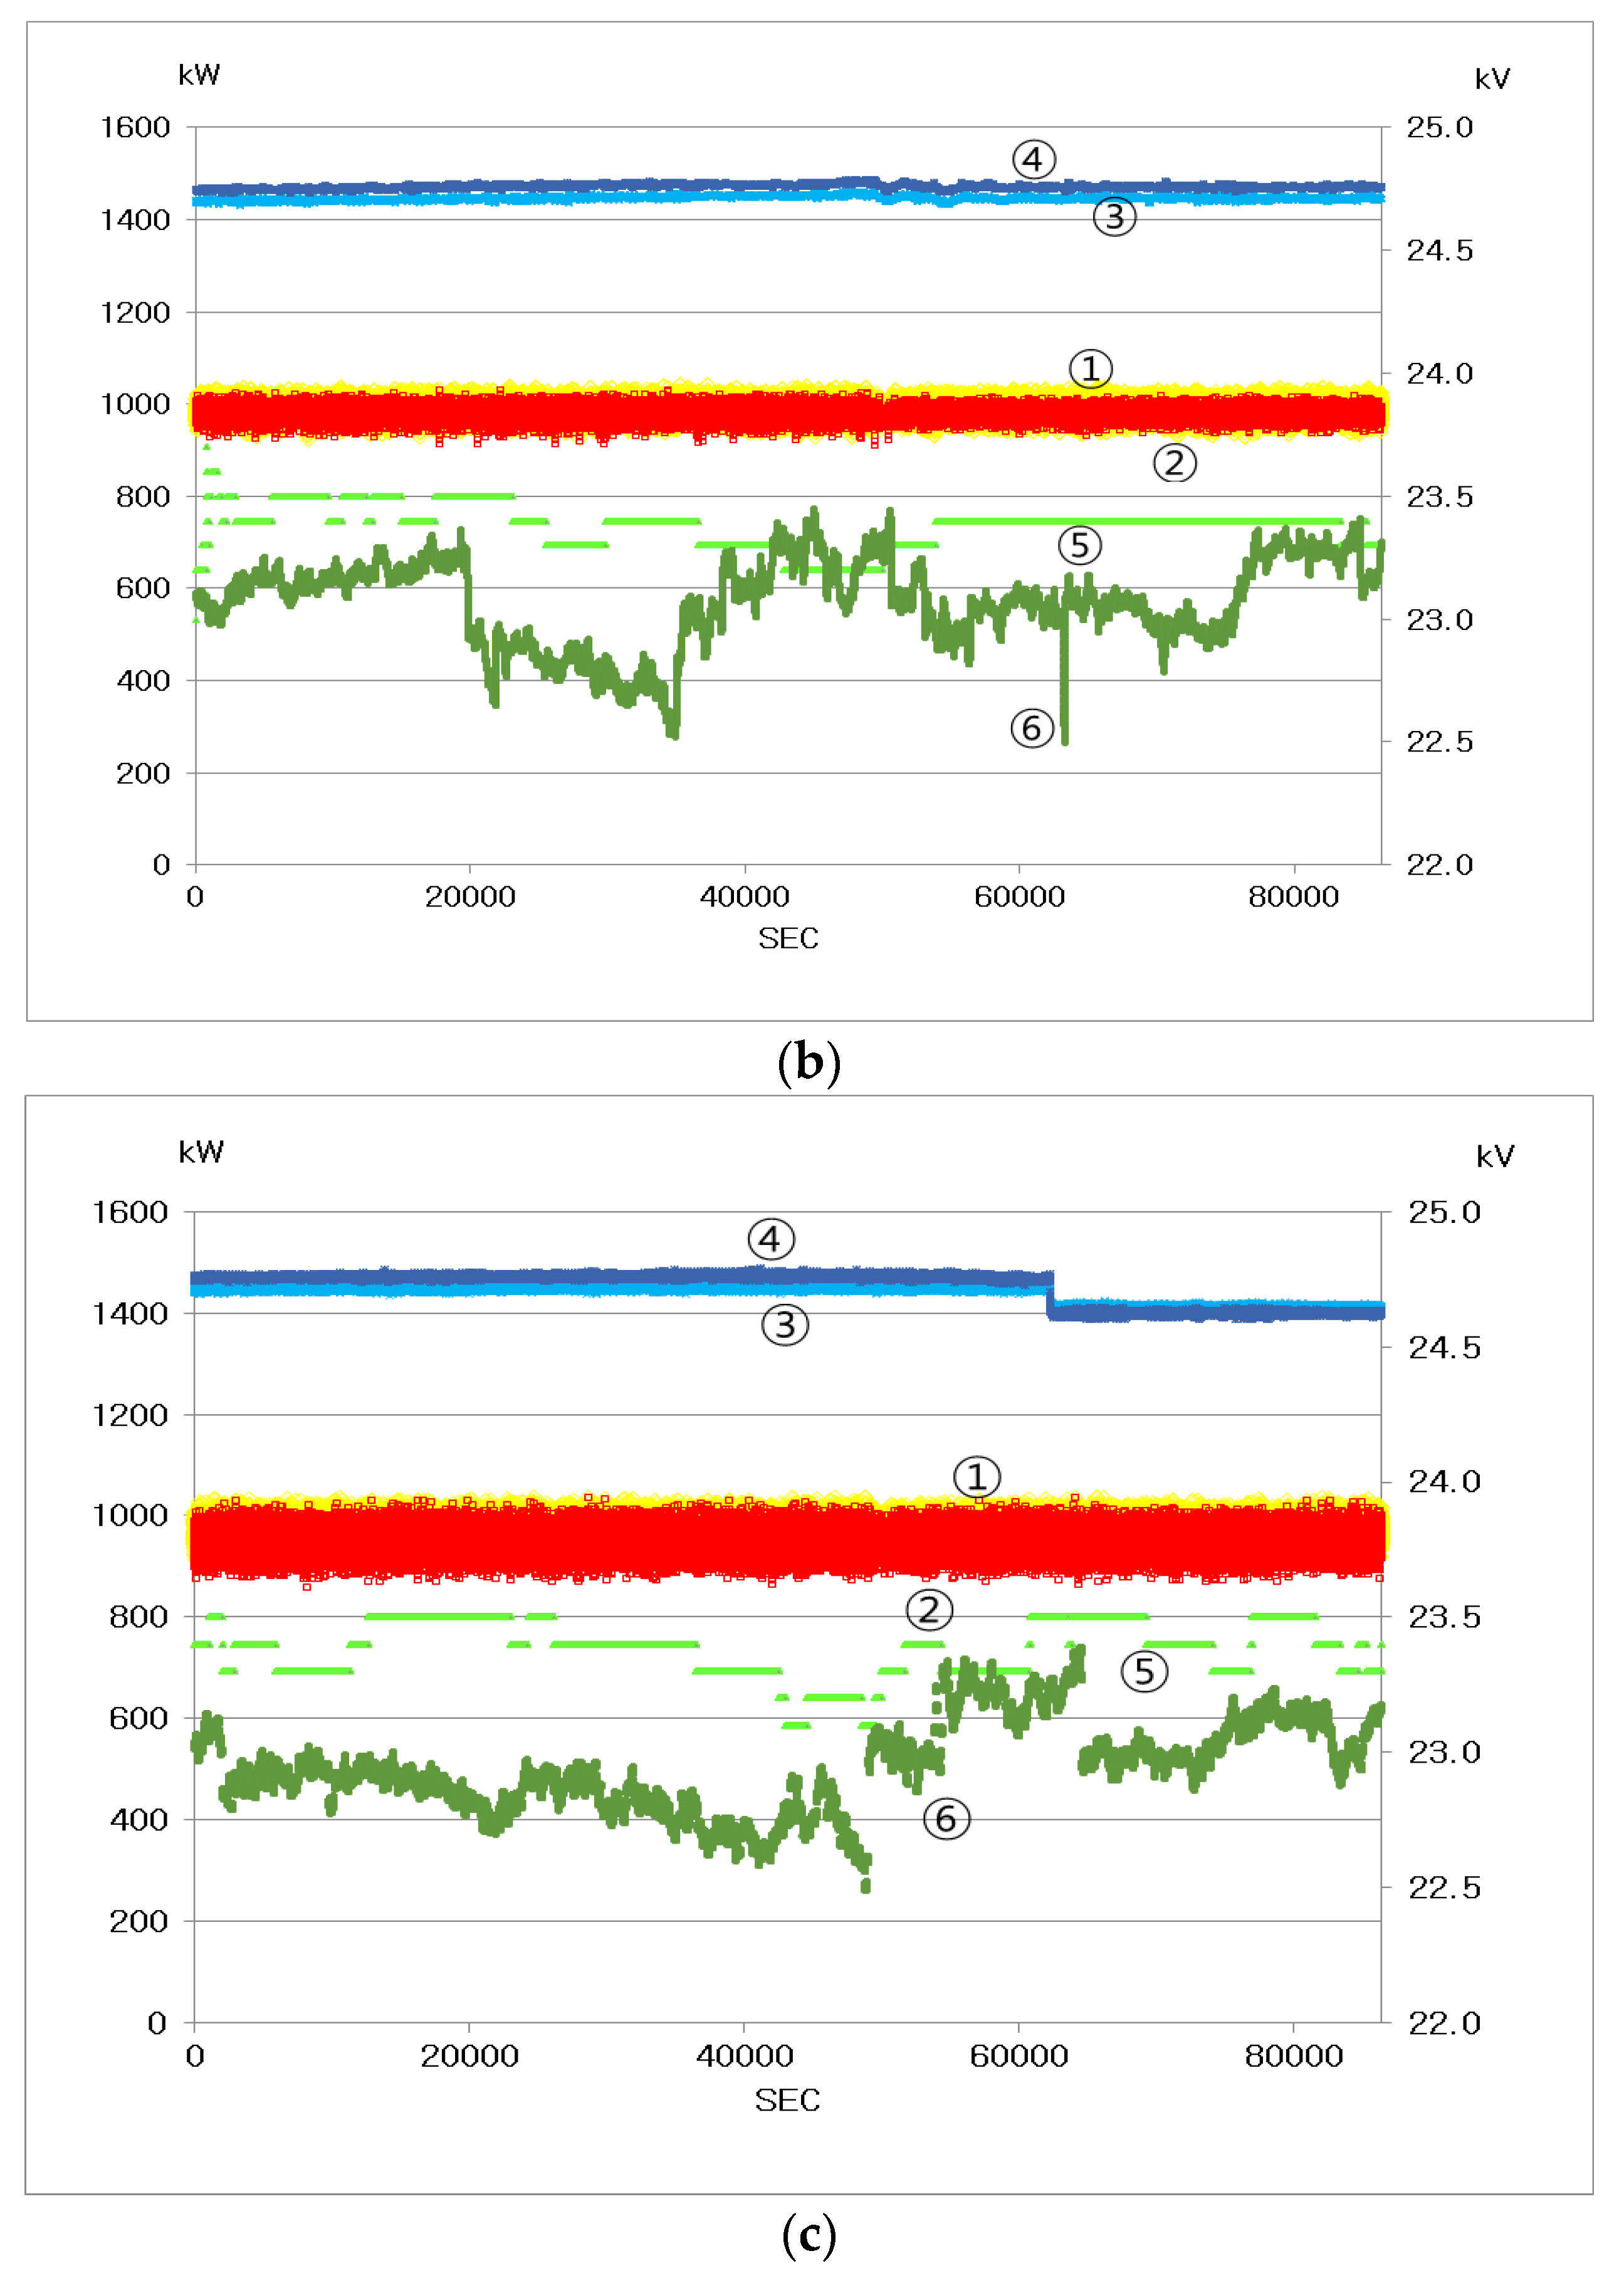
| No. | Active Power and Grid Voltage | First | Second | Third |
|---|---|---|---|---|
| ① | No. 1 Active power without reactor (kW) | 1001 | 986.4 | 971.7 |
| ② | No. 2 Active power without reactor (kW) | 989 | 979.4 | 947.5 |
| ③ | No. 1 Active power with reactor (kW) | 1438 | 1446 | 1439 |
| ④ | No. 2 Active power with reactor (kW) | 1474 | 1471 | 1452 |
| ⑤ | Grid voltage without reactor (V) | 23,218 | 23,380 | 23,380 |
| ⑥ | Grid voltage with reactor (V) | 22,895 | 23,072 | 22,944 |
© 2017 by the authors. Licensee MDPI, Basel, Switzerland. This article is an open access article distributed under the terms and conditions of the Creative Commons Attribution (CC BY) license ( http://creativecommons.org/licenses/by/4.0/).
Share and Cite
Ok, Y.; Lee, J.; Choi, J. Consideration of Reactor Installation to Mitigate Voltage Rise Caused by the Connection of a Renewable Energy Generator. Energies 2017, 10, 344. https://doi.org/10.3390/en10030344
Ok Y, Lee J, Choi J. Consideration of Reactor Installation to Mitigate Voltage Rise Caused by the Connection of a Renewable Energy Generator. Energies. 2017; 10(3):344. https://doi.org/10.3390/en10030344
Chicago/Turabian StyleOk, Yeonho, Jaewon Lee, and Jaeho Choi. 2017. "Consideration of Reactor Installation to Mitigate Voltage Rise Caused by the Connection of a Renewable Energy Generator" Energies 10, no. 3: 344. https://doi.org/10.3390/en10030344