
Review of the Life Cycle Greenhouse Gas Emissions from Different Photovoltaic and Concentrating Solar Power Electricity Generation Systems


Abstract
:1. Introduction
2. Methodology
- Non-organic material-based PVs:as follows:
- ➢
- Crystalline-silicon (c-Si): light is allowed to filter through a series of layers comprising of a protective glass cover, a transparent adhesive, and an anti-reflective coating material to reach positive- and a negative-type silicon crystalline materials bound together and held with positive and negative electrical contacts. The c-Si cells are referred to as the mono- or single-crystalline silicon (sc-Si) cells, when they are cut from a single high-purity crystal. If the c-Si cells are obtained in the form of wafers resulting from the process of cooling and solidification of molten silicon crystal blocks, then, they are designated as poly- or multi-crystalline silicon (mc-Si) cells.
- ➢
- Thin-films: light is allowed to filter through a series of layers comprising a transparent coating, an anti-reflective layer, positive and negative semi-conductor materials, a contact plate and a substrate. Thin films may further be categorized as amorphous-silicon (a-Si), multi-junction thin-film silicon (µc-Si), cadmium telluride (CdTe), copper-indium-diselenide (CIS), and copper-indium-gallium-diselenide (CIGS) thin films on the basis of the material components used.
- Organic material based PVs:
- ➢
- Organic PVs (OPV): built from thin films of organic semiconductors that include polymers.
- ➢
- Dye-sensitized solar cells (DSSC): consists of a photosensitive dye and is based on a semiconductor formed between a photo-sensitized anode and an electrolyte that facilitates the movement of electrons to generate electricity
- Parabolic trough: arrays of parabolic trough reflectors reflect the sunlight to a black absorber tube that is cooled by a heat-transferring fluid. The heat-transferring fluid when hot, is pumped to the heat exchanger of a steam Rankine cycle for power generation.
- Central receiver: solar radiation is reflected on to a centrally placed receiver mounted over the top of a tower by a collector that comprises of two large heliostats.
- Paraboloidal dish: a paraboloidal dish reflector is used as a solar collector and the heat to electricity conversion is achieved by using a Stirling engine.
- Solar chimney: a flat area is covered by a glass cover (with soil and air underneath) that is inclined toward the middle, where a chimney is located at the center and is exposed to the sun. The hot air rising up through the chimney generates electricity by using a wind turbine.
- Solar pond: a large reservoir of water with a black bottom absorbs solar radiation and transforms it into heat in the form of hot water.
3. Results and Discussion
3.1. Review of PV LCA Studies
3.2. Review of CSP LCA Studies
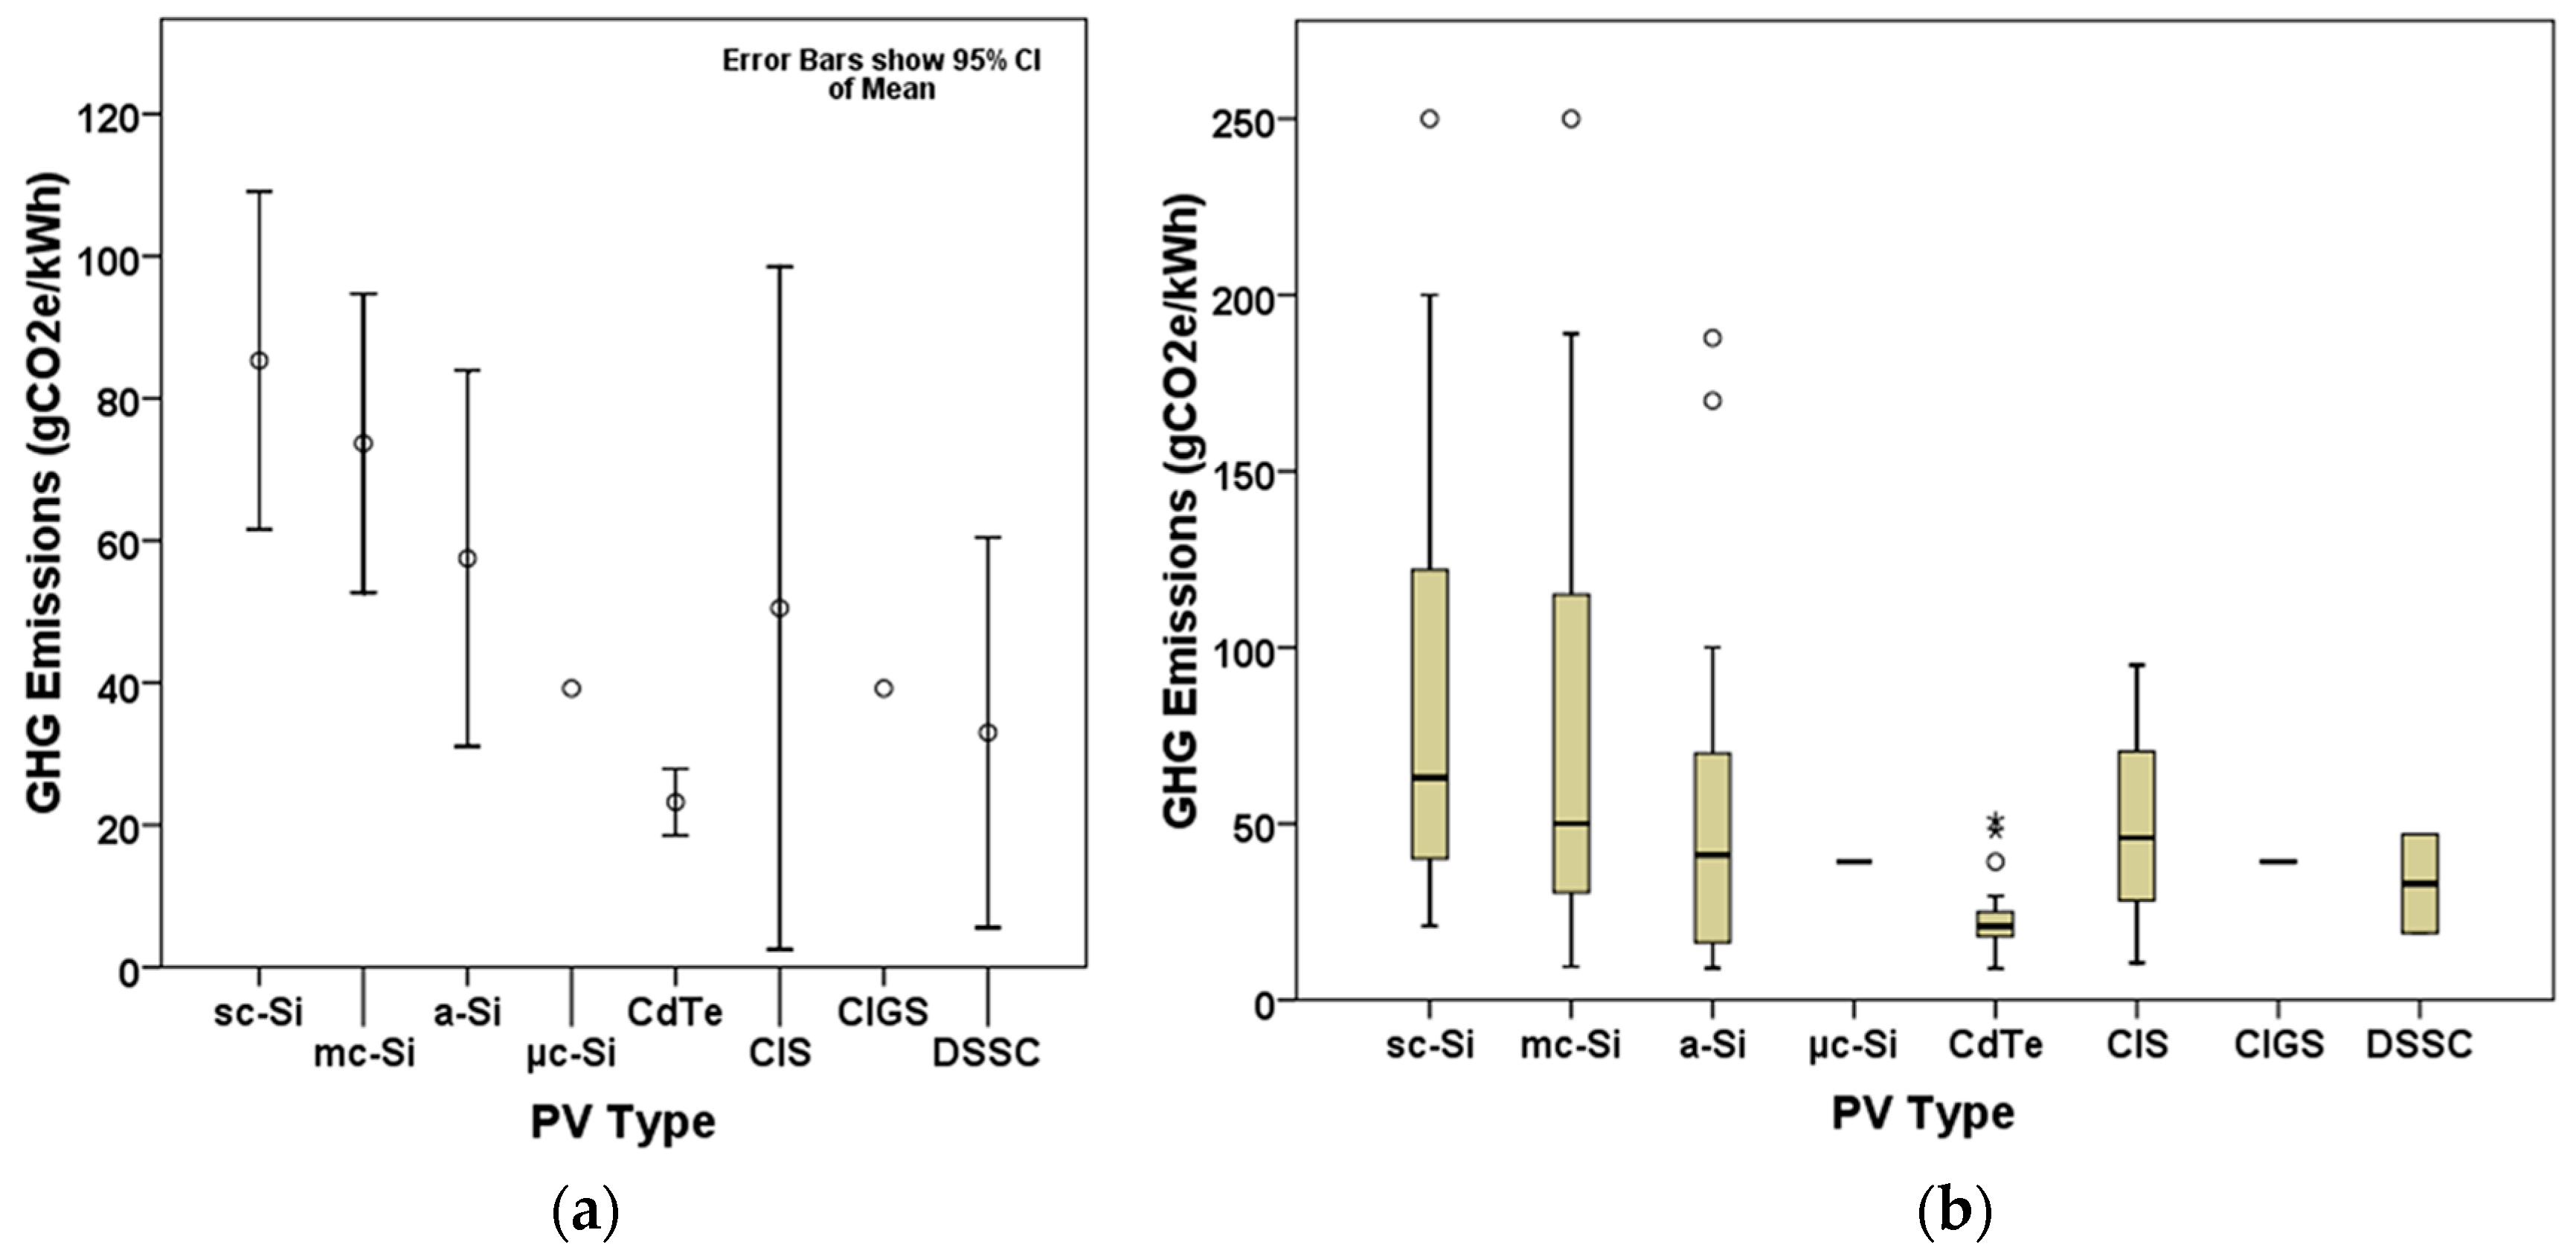
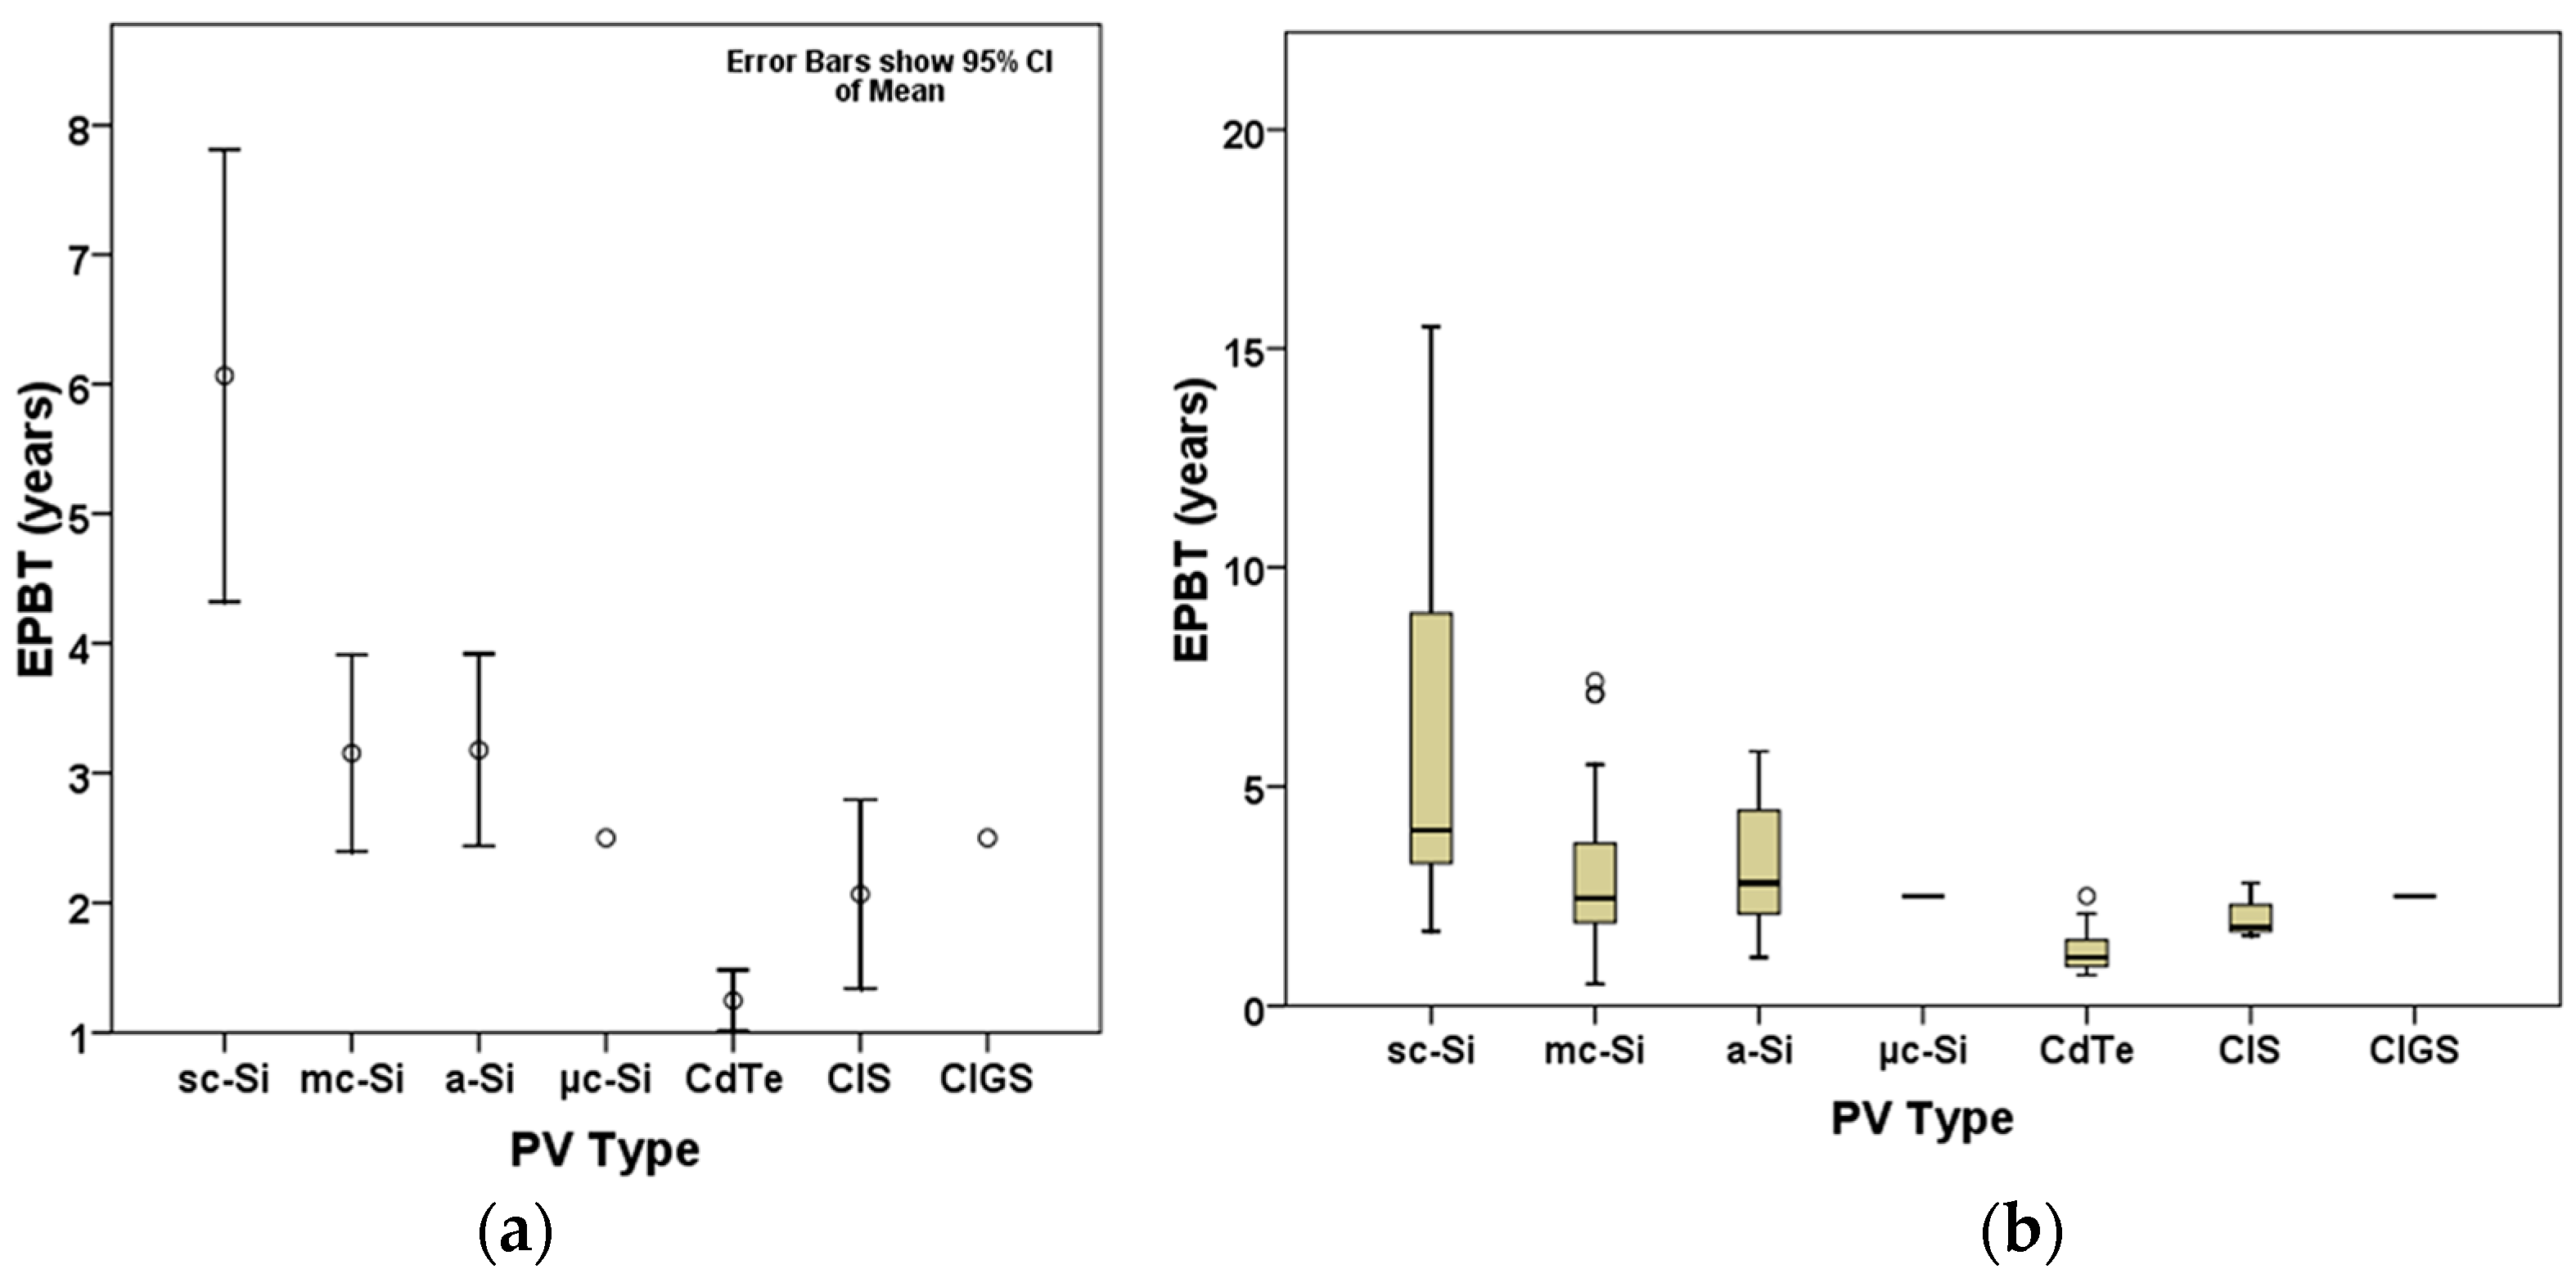
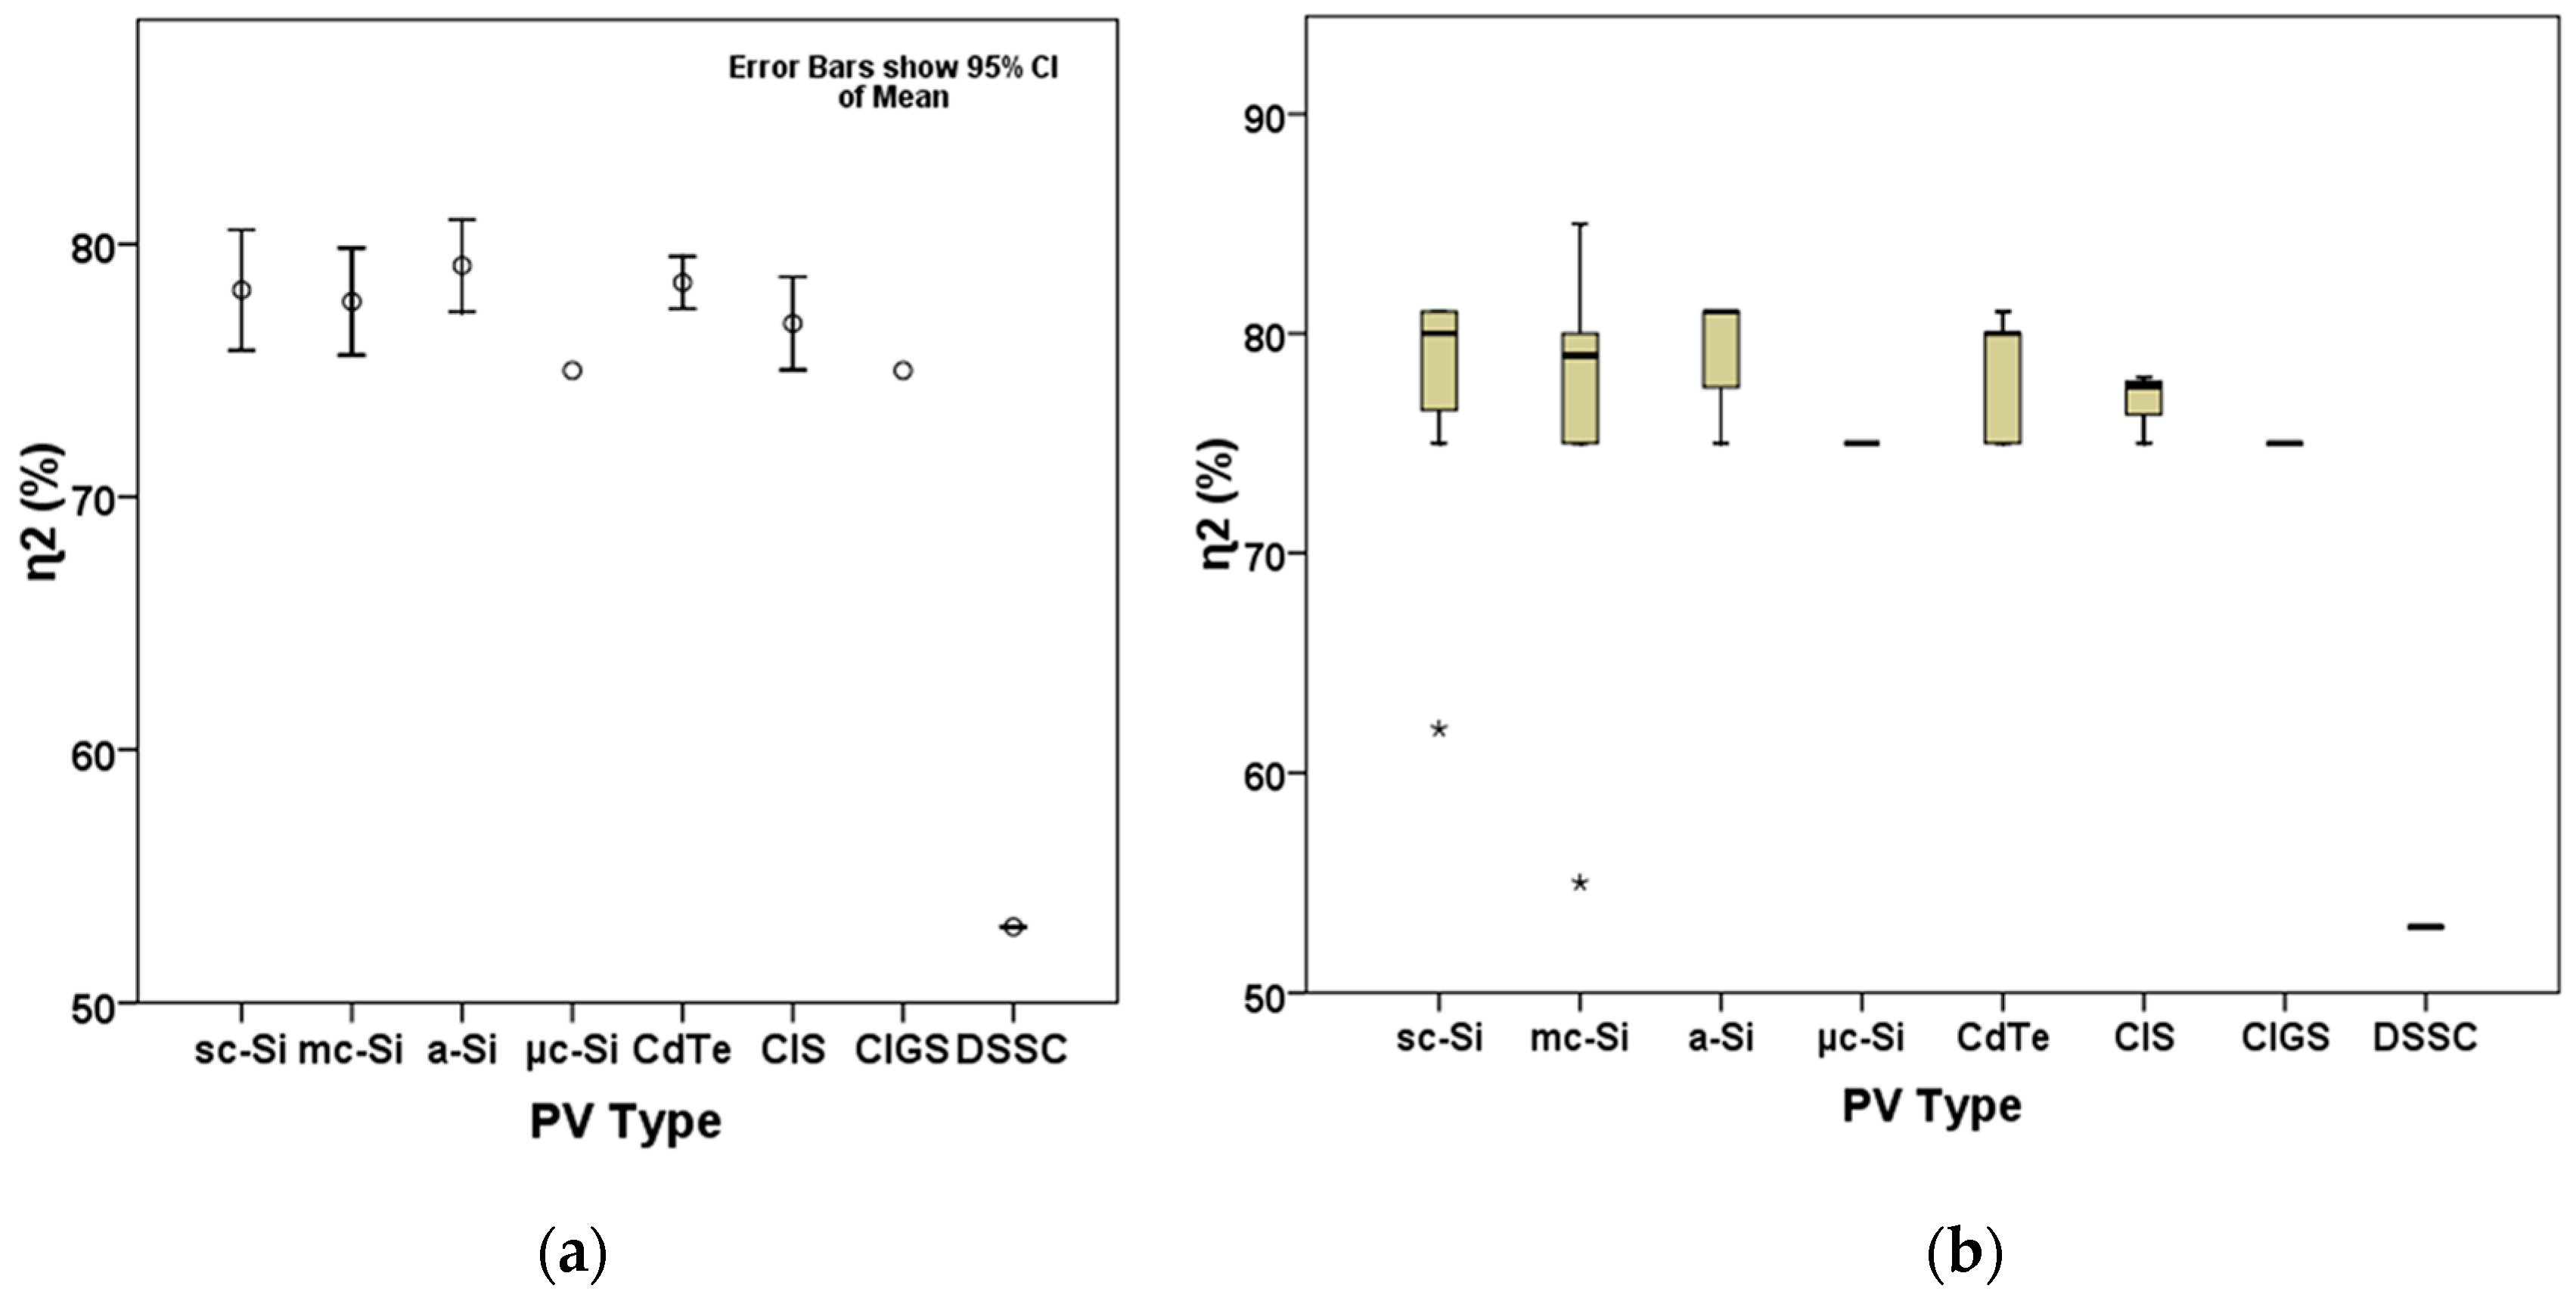
3.3. Statistical Evaluation of PV LCA Studies
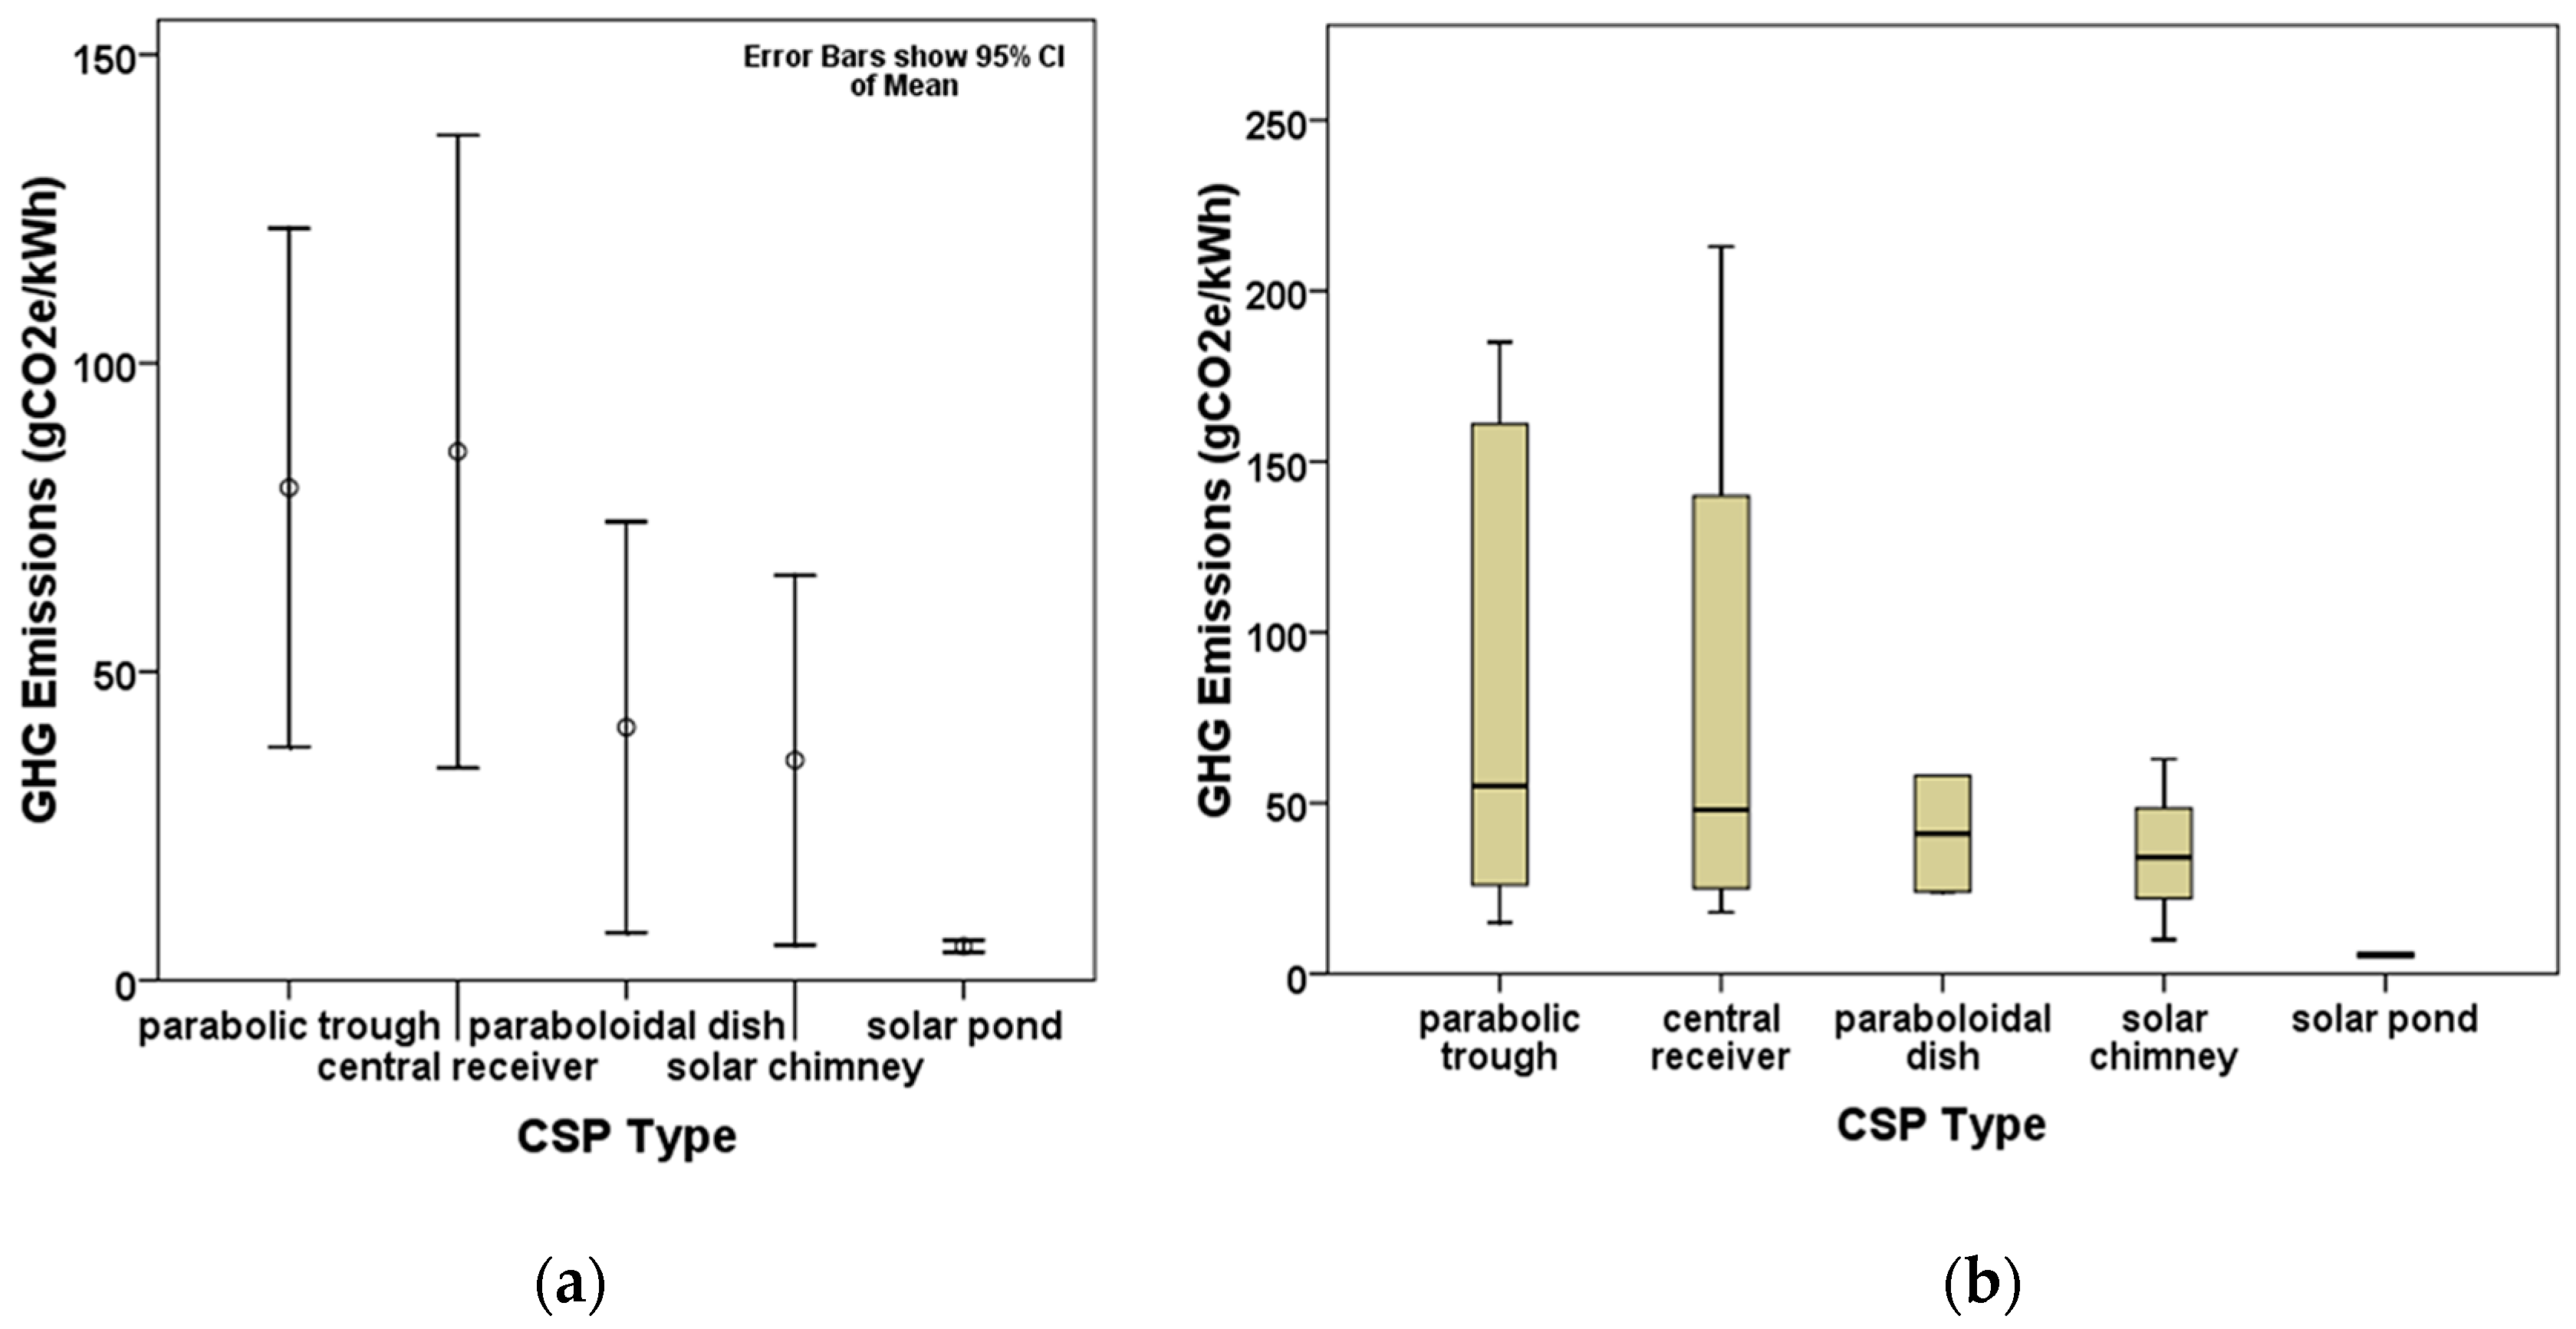
3.4. Statistical Evaluation of CSP LCA Studies
4. Conclusions
Acknowledgments
Author Contributions
Conflicts of Interest
References
- International Energy Statistics. Available online: http://www.eia.gov/cfapps/ipdbproject/iedindex3.cfm?tid=44&pid=44&aid=2&cid=ww,r1,&syid=2008&eyid=2012&unit=QBTU (accessed on 9 November 2015).
- International Energy Outlook 2013. Available online: http://www.eia.gov/forecasts/ieo/pdf/0484(2013).pdf (accessed on 9 November 2015).
- Annual Energy Outlook 2015 with Projections to 2040. Available online: http://www.eia.gov/forecasts/aeo/pdf/0383%282015%29.pdf (accessed on 9 November 2015).
- Schaefer, H.; Hagedorn, G. Hidden energy and correlated environmental characteristics of PV power generation. Renew. Energy 1992, 2, 159–166. [Google Scholar] [CrossRef]
- Environmental Life-Cycle Assessment of Multicrystalline Silicon Solar Cell Modules. Available online: https://stuff.mit.edu/afs/athena/dept/cron/project/urban-sustainability/Old%20files%20from%20summer%202009/Bjorn/solar/LCA%20silicon%20solar%20cell%20modules%201995.pdf (accessed on 21 December 2014).
- Nieuwlaar, E.; Alsema, E.; Van Engelenburg, B. Using life-cycle assessments for the environmental evaluation of greenhouse gas mitigation options. Energy Convers. Manag. 1996, 37, 831–836. [Google Scholar] [CrossRef]
- Kato, K.; Murata, A.; Sakuta, K. An evaluation on the life cycle of photovoltaic energy system considering production energy of off-grade silicon. Sol. Energy Mat. Sol. Cells 1997, 47, 95–100. [Google Scholar] [CrossRef]
- Dones, R.; Frischknecht, R. Life cycle assessment of photovoltaic systems: Results of Swiss studies on energy chains. Prog. Photovolt. Res. Appl. 1998, 6, 117–125. [Google Scholar] [CrossRef]
- Frankl, P.; Masini, A.; Gamberale, M.; Toccaceli, D. Simplified life-cycle analysis of PV systems in buildings: Present situation and future trends. Prog. Photovolt. Res. Appl. 1998, 6, 137–146. [Google Scholar] [CrossRef]
- Kato, K.; Murata, A.; Sakuta, K. Energy pay-back time and lifecycle CO2 emission of residential PV power system with silicon PV module. Prog. Photovolt. Res. Appl. 1998, 6, 105–115. [Google Scholar] [CrossRef]
- PV-BILD: A Life Cycle Environmental and Economic Assessment Tool for Building-Integrated Photovoltaic Installations. Available online: http://css.snre.umich.edu/publication/pv-bild-life-cycle-environmental-and-economic-assessment-tool-building-integrated (accessed on 21 December 2014).
- Alsema, E.A. Energy pay-back time and CO2 emissions of PV systems. Prog. Photovolt. Res. Appl. 2000, 8, 17–25. [Google Scholar] [CrossRef]
- Oliver, M.; Jackson, T. The evolution of economic and environmental cost for crystalline silicon photovoltaics. Energy Policy 2000, 28, 1011–1021. [Google Scholar] [CrossRef]
- Greijer, H.; Karlson, L.; Lindquist, S.E.; Hagfeldt, A. Environmental aspects of electricity generation from a nanocrystalline dye sensitized solar cell system. Renew. Energy 2001, 23, 27–39. [Google Scholar] [CrossRef]
- Kato, K.; Hibino, T.; Komoto, K.; Ihara, S.; Yamamoto, S.; Fujihara, H. A life-cycle analysis on thin-film CdS/CdTe PV modules. Sol. Energy Mat. Sol. Cells 2001, 67, 279–287. [Google Scholar] [CrossRef]
- Nomura, N.; Inaba, A.; Tonooka, Y.; Akai, M. Life-cycle emission of oxidic gases from power-generation systems. Appl. Energy 2001, 68, 215–227. [Google Scholar] [CrossRef]
- Life-Cycle Assessment of Electricity Generation Systems and Applications for Climate Change Policy Analysis. Available online: http://fti.neep.wisc.edu/pdf/fdm1181.pdf (accessed on 21 December 2014).
- Ito, M.; Kato, K.; Sugihara, H.; Kichimi, T.; Song, J.; Kurokawa, K. A preliminary study on potential for very large scale photovoltaic power generation (VLS-PV) system in the Gobi desert from economic and environmental viewpoints. Sol. Energy Mat. Sol. Cells 2003, 75, 507–517. [Google Scholar] [CrossRef]
- Fthenakis, V.M.; Kim, H.C. Energy use and greenhouse gas emissions in the life cycle of thin film CdTe photovoltaics. In Proceedings of the Symposium G-Life Cycle Analysis, MRS Fall Meeting, Boston, MS, USA, 28–30 November 2005.
- Alsema, E.A.; de Wild-Scholten, M.J.; Fthenakis, V.M. Environmental impacts of PV electricity generation—A critical comparison of energy supply options. In Proceedings of the 21st European Photovoltaic Solar Energy Conference, Dresden, Germany, 4–8 September 2006.
- Fthenakis, V.M.; Alsema, E. Photovoltaics energy payback times, greenhouse gas emissions and external costs: 2004–early 2005 status. Prog. Photovolt. Res. Appl. 2006, 14, 275–280. [Google Scholar] [CrossRef]
- Kannan, R.; Leong, K.C.; Osman, R.; Ho, H.K.; Tso, C.P. Life cycle assessment study of solar PV systems: An example of a 2.7 kWp distributed solar PV system in Singapore. Sol. Energy 2006, 80, 555–563. [Google Scholar] [CrossRef]
- Fthenakis, V.M.; Kim, H.C. Greenhouse-gas emissions from solar electric- and nuclear power: A life-cycle study. Energy Policy 2007, 35, 2549–2557. [Google Scholar] [CrossRef]
- Pacca, S.; Sivaraman, D.; Keoleian, G.A. Parameters affecting the life cycle performance of PV technologies and systems. Energy Policy 2007, 35, 3316–3326. [Google Scholar] [CrossRef]
- Raugei, M.; Bargigli, S.; Ulgiati, S. Life cycle assessment and energy pay-back time of advanced photovoltaic modules: CdTe and CIS compared to poly-Si. Energy 2007, 32, 1310–1318. [Google Scholar] [CrossRef]
- Fthenakis, V.M.; Kim, H.C.; Alsema, E. Emissions from photovoltaic life cycles. Environ. Sci. Technol. 2008, 42, 2168–2174. [Google Scholar] [CrossRef]
- Ito, M.; Kato, K.; Komoto, K.; Kichimi, T.; Kurokawa, K. A comparative study on cost and life-cycle analysis for 100 MW very large-scale PV (VLS-PV) systems in deserts using m-Si, a-Si, CdTe, and CIS modules. Prog. Photovolt. Res. Appl. 2008, 16, 17–30. [Google Scholar] [CrossRef]
- García-Valverde, R.; Miguel, C.; Martínez-Béjar, R.; Urbina, A. Life cycle assessment study of a 4.2 kWp stand-alone photovoltaic system. Sol. Energy 2009, 83, 1434–1445. [Google Scholar] [CrossRef]
- Ito, M.; Komoto, K.; Kurokawa, K. Life-cycle analyses of very-large scale PV systems using six types of PV modules. Curr. Appl. Phys. 2010, 10, S271–S273. [Google Scholar] [CrossRef]
- Bravi, M.; Parisi, M.L.; Tiezzi, E.; Basosi, R. Life cycle assessment of a micromorph photovoltaic system. Energy 2011, 36, 4297–4306. [Google Scholar] [CrossRef]
- Fthenakis, V.M.; Kim, H.C. Photovoltaics: Life-cycle analyses. Sol. Energy 2011, 85, 1609–1628. [Google Scholar] [CrossRef]
- Held, M.; Iig, R. Update of environmental indicators and energy payback time of CdTe PV systems in Europe. Prog. Photovolt. Res. Appl. 2011, 19, 614–626. [Google Scholar] [CrossRef]
- Life Cycle Inventories and Life Cycle Assessments of Photovoltaic Systems. Available online: https://www.bnl.gov/pv/files/pdf/226_Task12_LifeCycle_Inventories.pdf (accessed on 21 December 2014).
- Desideri, U.; Proietti, S.; Zepparelli, F.; Sdringola, P.; Bini, S. Life cycle assessment of a ground-mounted 1778 kWp photovoltaic plant and comparison with traditional energy production systems. Appl. Energy 2012, 97, 930–943. [Google Scholar] [CrossRef]
- Kreith, F.; Norton, P.; Brown, D. A comparison of CO2 emissions from fossil and solar power plants in the United States. Energy 1990, 15, 1181–1198. [Google Scholar] [CrossRef]
- Central Research Institute of Electric Power Industry (CRIEPI). 1995 Annual Research Report. Energy Technology Life Cycle Analysis that Takes CO2 Emission Reduction into Consideration; CRIEPI: Tokyo, Japan, 1995. [Google Scholar]
- Martin, J.A. A total fuel cycle approach to reducing greenhouse gas emissions: Solar generation technologies as greenhouse gas offsets in U.S. utility systems. Sol. Energy 1997, 59, 195–203. [Google Scholar] [CrossRef]
- Norton, B.; Eames, P.C.; Lo, S.N.G. Full-energy-chain analysis of greenhouse gas emissions for solar thermal electric power generation systems. Renew. Energy 1998, 15, 131–136. [Google Scholar] [CrossRef]
- Weinrebe, G.; Bohnke, M.; Trieb, F. Life cycle assessment of an 80MWSEGS plant and a 30MWPHOEBUS power tower. In Proceedings of the 1998 ASME International Solar Energy Conference ‘Solar Engineering’, Albuquerque, NM, USA, 14–17 June 1998; ASME: New York, NY, USA, 1998; pp. 417–424. [Google Scholar]
- Lenzen, M. Greenhouse gas analysis of solar-thermal electricity generation. Sol. Energy 1999, 65, 353–368. [Google Scholar] [CrossRef]
- Lechon, Y.; de la Rúa, C.; Sáez, R. Life cycle environmental impacts of electricity production by solar thermal power plants in Spain. J. Sol. Energy Eng. 2008, 130, 021012. [Google Scholar] [CrossRef]
- Final Report on Technical Data, Costs, and Life Cycle Inventories of Solar Thermal Power Plants. Available online: http://www.needs-project.org/RS1a/RS1a%20D12.2%20Final%20report%20concentrating%20solar%20thermal%20power%20plants.pdf (accessed on 3 June 2015).
- Niemann, H.J.; Lupi, F.; Hoeffer, R.; Hubert, W.; Borri, C. The solar updraft power plant: Design and optimization of the tower for wind effects. In Proceedings of the 5th European and African Conference on Wind Engineering EACWE5, Florence, Italy, 19–23 July 2009.
- Burkhardt, J.J.; Heath, G.A.; Turchi, C.S. Life cycle assessment of a parabolic trough concentrating solar power plant and the impacts of key design alternatives. Environ. Sci. Technol. 2011, 45, 2457–2464. [Google Scholar] [CrossRef] [PubMed]
- CSP Technologies, Environmental Impact 2012. Available online: https://www.esmap.org/sites/esmap.org/files/ESMAP_IFC_RE_CSP_Training_World%20Bank%20Fabrizi.pdf (accessed on 3 June 2015).
- Zongker, J.D. Life Cycle Assessment of Solar Updraft Tower Power Plant: EROEI and GWP as a Design Tool. Master’s Thesis, Wichita State University, Wichita, KS, USA, 2013. [Google Scholar]
- Peng, J.; Lu, L.; Yang, H. Review on life cycle assessment of energy payback and greenhouse gas emission of solar photovoltaic systems. Renew. Sustain. Energy Rev. 2013, 19, 255–274. [Google Scholar] [CrossRef]
- Amponsah, N.W.; Troldborg, M.; Kington, B.; Aalders, I.; Hough, R.L. Greenhouse gas emissions from renewable energy sources: A review of lifecycle considerations. Renew. Sustain. Energy Rev. 2014, 39, 461–475. [Google Scholar] [CrossRef]
- IPCC Special Report on Renewable Energy Sources and Climate Change Mitigation. Available online: http://srren.ipcc-wg3.de/report (accessed on 21 December 2014).


| Source | PV Category (Supplementary Case Description) | GHG Emissions (gCO2e/kWh) | EPBT (Years) | Additional Features |
|---|---|---|---|---|
| η1 (%), η2 (%), PR (kW), SR (kWh/m2/yr), TI, GL | ||||
| Schaefer and Hagedorn [4] | sc-Si (annual cell production of 2.5 MW per year; annual load duration time of 2000 h per year) | 130 | 3.7 | η1 = 14; PR = 300; GL = Germany |
| sc-Si (annual cell production of 2.5 MW per year; annual load duration time of 1000 h per year) | 250 | 7.3 | η1 = 14; PR = 300; GL = Germany | |
| sc-Si (annual cell production of 25 MW per year; annual load duration time of 2000 h per year) | 70 | 3.7 | η1= 15.5; PR = 1500; GL = Germany | |
| sc-Si (annual cell production of 25 MW per year; annual load duration time of 1000 h per year) | 150 | 7.3 | η1 = 15.5; PR = 1500; GL = Germany | |
| mc-Si (annual cell production of 2.5 MW per year; annual load duration time of 2000 h per year) | 120 | 3.6 | η1 = 12; PR = 300; GL = Germany | |
| mc-Si (annual cell production of 2.5 MW per year; annual load duration time of 1000 h per year) | 250 | 7.1 | η1 = 12; PR = 300; GL = Germany | |
| mc-Si (annual cell production of 25 MW per year; annual load duration time of 2000 h per year) | 50 | 3.6 | η1 = 13.5; PR = 1500; GL = Germany | |
| mc-Si (annual cell production of 25 MW per year; annual load duration time of 1000 h per year) | 110 | 7.1 | η1 = 13.5; PR = 1500; GL = Germany | |
| a-Si (annual cell production of 2.5 MW per year; annual load duration time of 2000 h per year) | 90 | 2.9 | η1 = 6; PR = 300; GL = Germany | |
| a-Si (annual cell production of 2.5 MW per year; annual load duration time of 1000 h per year) | 170 | 5.8 | η1 = 6; PR = 300; GL = Germany | |
| a-Si (annual cell production of 25 MW per year; annual load duration time of 2000 h per year) | 50 | 2.9 | η1 = 8; PR = 1500; GL = Germany | |
| a-Si (annual cell production of 25 MW per year; annual load duration time of 1000 h per year) | 100 | 5.8 | η1 = 8; PR = 1500; GL = Germany | |
| Netherlands Agency for Energy and the Environment Report [5] | mc-Si (worst case) | 167 | 3.8 | η1 = 13; η2 = 75; SR = 1000; GL = Netherlands |
| mc-Si (base case) | 31 | 1.3 | η1 = 16; η2 = 80; SR = 1000; GL = Netherlands | |
| mc-Si (best case) | 9.8 | 0.5 | η1 = 18; η2 = 85; SR = 1000; GL = Netherlands | |
| Nieuwlaar et al. [6] | a-Si | 47 | 4 | η1 = 10; TI = roof-top; GL = Netherlands |
| Kato et al. [7] | sc-Si (worst case) | 91 | 15.5 | η2 = 81; PR = 3; SR = 1427; TI = roof-top; GL = Japan |
| sc-Si (base case) | 65 | 11 | η2 = 81; PR = 3; SR = 1427; TI = roof-top; GL = Japan | |
| sc-Si (optimistic case) | 21 | 4 | η2 = 81; PR = 3; SR = 1427; TI = roof-top; GL = Japan | |
| mc-Si | 18 | 2.5 | η2 = 81; PR = 3; SR = 1427; TI = roof-top; GL = Japan | |
| a-Si | 15 | 1.5 | η2 = 81; PR = 3; SR = 1427; TI = roof-top; GL = Japan | |
| Dones and Frischknecht [8] | mc-Si | 189 | NA | η1 = 14; PR = 3; TI = roof-top; GL = Switzerland |
| sc-Si | 114 | NA | η1 = 16.5; PR = 3; TI = roof-top; GL = Switzerland | |
| Frankl et al. [9] | sc-Si | 200 | 9 | η1 = 11.2; PR = 20; SR = 1700; TI = roof-top, 30° tilt; GL = Italy |
| Kato et al. [10] | sc-Si (worst case) | 83 | 11.8 | η1 = 12.2; η2 = 81; PR = 3; SR = 1427; TI = roof-top; GL = Japan |
| sc-Si (base case) | 61 | 8.9 | η1 = 12.2; η2 = 81; PR = 3; SR = 1427; TI = roof-top; GL = Japan | |
| sc-Si (best case) | 25 | 3.3 | η1 = 12.2; η2 = 81; PR = 3; SR = 1427; TI = roof-top; GL = Japan | |
| mc-Si (annual cell production of 10 MW per year) | 20 | 2.4 | η1 = 11.6; η2 = 81; PR = 3; SR = 1427; TI = roof-top; GL = Japan | |
| mc-Si (annual cell production of 30 MW per year) | 18 | 2.2 | η1 = 11.7; η2 = 81; PR = 3; SR = 1427; TI = roof-top; GL = Japan | |
| mc-Si (annual cell production of 100 MW per year) | 13 | 1.5 | η1 = 15.7; η2 = 81; PR = 3; SR = 1427; TI = roof-top; GL = Japan | |
| a-Si (annual cell production of 10 MW per year) | 17 | 2.1 | η1 = 8; η2 = 81; PR = 3; SR = 1427; TI = roof-top; GL = Japan | |
| a-Si (annual cell production of 30 MW per year) | 13 | 1.7 | η1 = 10; η2 = 81; PR = 3; SR = 1427; TI = roof-top; GL = Japan | |
| a-Si (annual cell production of 100 MW per year) | 9 | 1.1 | η1 = 12; η2 = 81; PR = 3; SR = 1427; TI = roof-top; GL = Japan | |
| Lewis et al. [11] | a-Si | 187.8 | 5.14 | η1 = 3.89; TI = building-integrated; GL = USA |
| Alsema [12] | sc-Si | 60 | 3.2 | η1 = 14; SR = 1700; TI = roof-top; GL = Netherlands |
| mc-Si | 50 | 3.2 | η1 = 13; SR = 1700; TI = roof-top; GL = Netherlands | |
| a-Si | 50 | 2.7 | η1 = 7; SR = 1700; TI = roof-top; GL = Netherlands | |
| Oliver and Jackson [13] | mc-Si | 120 | NA | η1 = 14; η2 = 55; TI = building-integrated; GL = Swiss Jura Alps, Europe |
| mc-Si | 170 | NA | η1 = 14; η2 = 85; TI = building-integrated; GL = Swiss Jura Alps, Europe | |
| Greijer et al. [14] | DSSC | 19 | NA | η1 = 7; η2 = 53; SR = 2190; GL = Sahara Desert, Africa |
| DSSC | 47 | NA | η1 = 12; η2 = 53; SR = 2190; GL = Sahara Desert, Africa | |
| Kato et al. [15] | CdTe (annual cell production of 10 MW per year) | 14 | 1.7 | η1 = 10.3; η2 = 81; PR = 3; SR = 1427; TI = roof-top; GL = Japan |
| CdTe (annual cell production of 30 MW per year) | 11.5 | 1.4 | η1 = 11.2; η2 = 81; PR = 3; SR = 1427; TI = roof-top; GL = Japan | |
| CdTe (annual cell production of 100 MW per year) | 8.9 | 1.1 | η1 = 12.4; η2 = 81; PR = 3; SR = 1427; TI = roof-top; GL = Japan | |
| Nomura et al. [16] | mc-Si | 104 | NA | GL = Japan |
| mc-Si | 133 | NA | GL = Japan | |
| Meier [17] | a-Si | 39 | 4.9 | η1 = 5.7; TI = building-integrated; GL = USA |
| Ito et al. [18] | mc-Si | 12 | 1.7 | η1 = 12.8; η2 = 78; PR = 1,000,000; SR = 1854 (10° tilt)-2037 (40° tilt); TI = ground-mount; GL = Gobi Desert, China |
| Fthenakis and Kim [19] | CdTe | 23.6 | 1.2 | η1 = 9; η2 = 80; PR = 25,000; SR = 1800; TI = ground-mount; GL = USA |
| Alsema et al. [20] | sc-Si | 35 | 2.6 | η1 = 14; η2 = 75; SR = 1700; TI = roof-top; GL = Europe |
| mc-Si | 32 | 1.9 | η1 = 13.2; η2 = 75; SR = 1700; TI = roof-top; GL = Europe | |
| CdTe | 25 | 1.1 | η1 = 9; η2 = 75; SR = 1700; TI = ground-mount; GL = Europe | |
| Fthenakis and Alsema [21] | mc-Si | 37 | 2.2 | η1 = 13.2; η2 = 75; SR = 1700; TI = roof-top; GL = Europe |
| CdTe | 21 | 1 | η1 = 8; η2 = 75; SR = 1700; TI = roof-top; GL = Europe | |
| CdTe | 25 | 1.1 | η1 = 9; η2 = 75; SR = 1700; TI = roof-top; GL = US | |
| Kannan et al. [22] | sc-Si | 165 | 4.47 | η1 = 11.86; PR = 2.7; SR = 1635; TI = roof-top; GL = Singapore |
| Fthenakis and Kim [23] | mc-Si | 37 | NA | η1 = 13.2; η2 = 80; SR = 1700; TI = roof-top; GL = Europe |
| sc-Si | 45 | NA | η1 = 14; η2 = 80; SR = 1700; TI = roof-top; GL = Europe | |
| CdTe | 16 | NA | η1 = 9; η2 = 80; SR = 1700; TI = roof-top; GL = Europe | |
| Pacca et al. [24] | a-Si | 34.3 | 3.2 | η1 = 6.3; SR = 1359; TI = roof-top, 12° tilt; GL = Michigan, USA |
| mc-Si | 72.4 | 7.4 | η1 = 12.92; SR = 1359; TI = roof-top, 12° tilt; GL = Michigan, USA | |
| Raugei et al. [25] | mc-Si (worst case) | 167 | 5.5 | η1 = 14; η2 = 75; SR = 1700; TI = roof-top; GL = Europe |
| mc-Si (base case) | 72 | 2.4 | η1 = 14; η2 = 75; SR = 1700; TI = roof-top; GL = Europe | |
| mc-Si (best case) | 57 | 2.5 | η1 = 14; η2 = 75; SR = 1700; TI = roof-top; GL = Europe | |
| CIS | 95 | 2.8 | η1 = 11; η2 = 75; SR = 1700; TI = roof-top; GL = Europe | |
| CdTe | 48 | 1.5 | η1 = 9; η2 = 75; SR = 1700; TI = roof-top; GL = Europe | |
| Fthenakis et al. [26] | sc-Si (CrystalClear project with Ecoinvent database) | 32 | NA | η1 = 14; η2 = 80; SR = 1700; TI = ground-mount; GL = Europe |
| sc-Si (UCTE grid mixture with Ecoinvent database) | 42 | NA | η1 = 14; η2 = 80; SR = 1700; TI = ground-mount; GL = Europe | |
| sc-Si (US grid mixture with Franklin database) | 52 | NA | η1 = 14; η2 = 80; SR = 1700; TI = ground-mount; GL = USA | |
| mc-Si (CrystalClear project with Ecoinvent database) | 31 | NA | η1 = 13.2; η2 = 80; SR = 1700; TI = ground-mount; GL = Europe | |
| mc-Si (UCTE grid mixture with Ecoinvent database) | 41 | NA | η1 = 13.2; η2 = 80; SR = 1700; TI = ground-mount; GL = Europe | |
| mc-Si (US grid mixture with Franklin database) | 51 | NA | η1 = 13.2; η2 = 80; SR = 1700; TI = ground-mount; GL = USA | |
| CdTe (UCTE grid mixture with Ecoinvent database) | 20 | NA | η1 = 9; η2 = 80; SR = 1700; TI = roof-top; GL = Europe | |
| CdTe (US grid mixture with Franklin database) | 26 | NA | η1 = 9; η2 = 80; SR = 1700; TI = roof-top; GL = USA | |
| Ito et al. [27] | mc-Si | 12.1 | 1. 9 | η1 = 12.8; η2 = 78; PR = 100,000; SR = 1702 (horizontal)-2017 (30° tilt); TI = ground-mount; GL = Gobi Desert, China |
| mc-Si | 9.4 | 1. 5 | η1 = 15.8; η2 = 78; PR = 100,000; SR = 1702 (horizontal)-2017 (30° tilt); TI = ground-mount; GL = Gobi Desert, China | |
| a-Si | 15.6 | 2.5 | η1 = 6.9; η2 = 77.1; PR = 100,000; SR = 1702 (horizontal)-2017 (30° tilt); TI = ground-mount; GL = Gobi Desert, China | |
| CdTe | 12.8 | 1.9 | η1 = 9; η2 = 77.2; PR = 100,000; SR = 1702 (horizontal)-2017 (30° tilt); TI = ground-mount; GL = Gobi Desert, China | |
| CIS | 10.5 | 1.6 | η1 = 11; η2 = 77.6; PR = 100,000; SR = 1702 (horizontal)-2017 (30° tilt); TI = ground-mount; GL = Gobi Desert, China | |
| García-Valverde et al. [28] | sc-Si | 131 | 9.08 | η2 = 62; PR = 4.24; SR = 1932; TI = roof-top, 30° tilt; GL = Murcia, Spain |
| Ito et al. [29] | sc-Si | 51 | 2.5 | η2 = 78; SR = 1702; TI = ground-mount; GL = Gobi Desert, China |
| mc-Si | 42 | 2 | η2 = 78; SR = 1702; TI = ground-mount; GL = Gobi Desert, China | |
| a-Si | 43 | 2.1 | η2 = 78; SR = 1702; TI = ground-mount; GL = Gobi Desert, China | |
| CIS | 46 | 1.8 | η2 = 78; SR = 1702; TI = ground-mount; GL = Gobi Desert, China | |
| CdTe | 51 | 2.1 | η2 = 78; SR = 1702; TI = ground-mount; GL = Gobi Desert, China | |
| Bravi et al. [30] | sc-Si | 98.9 | 3.8 | η2 = 75; SR = 1700; TI = roof-top, 22° tilt; GL = Grosseto, Italy |
| mc-Si | 180.3 | 3.5 | η2 = 75; SR = 1700; TI = roof-top, 22° tilt; GL = Grosseto, Italy | |
| a-Si, CIGS, CdTe, µc-Si | 39.2 | 2.5 | η2 = 75; SR = 1700; TI = roof-top, 22° tilt; GL = Grosseto, Italy | |
| Fthenakis and Kim [31] | sc-Si | 38 | 2.4 | η1 = 14; η2 = 80; PR = 24; SR = 1700-2280; TI = roof-top; GL = Europe |
| mc-Si | 30 | 1.9 | η1 = 13.2; η2 = 80; PR = 24; SR = 1700-2280; TI = roof-top; GL = Europe, USA | |
| CdTe | 19 | 0.7 | η1 = 9; η2 = 80; PR = 24; SR = 1700-2280; TI = roof-top; GL = Europe, USA | |
| Held and Iig [32] | CdTe | 29.5 | 1.1 | η1 = 10.9; η2 = 80; PR = 200,000; SR = 1200; TI = ground-mount; GL = Central Europe (Germany) |
| CdTe | 20.9 | 0.76 | η1 = 10.9; η2 = 80; PR = 200,000; SR = 1700; TI = ground-mount; GL = Mediterranean region, Europe (Italy) | |
| CdTe | 20.9 | 0.9 | η1 = 10.9; η2 = 80; PR = 200,000; SR = 1700; TI = ground-mount; GL = Mediterranean region, Europe (EU-25) | |
| CdTe | 18.7 | 0.7 | η1 = 10.9; η2 = 80; PR = 200,000; SR = 1900; TI = ground-mount; GL = Spain | |
| CdTe | 18.7 | 0.9 | η1 = 10.9; η2 = 80; PR = 200,000; SR = 1900; TI = ground-mount; GL = Portugal | |
| International Energy Agency Report [33] | sc-Si | 38 | 1.7 | η1 = 14; η2 = 75; SR = 1700; TI = roof-top; GL = Southern Europe |
| mc-Si | 34 | 1.7 | η1 = 13.2; η2 = 75; SR = 1700; TI = roof-top; GL = Southern Europe | |
| CdTe | 18 | 0.8 | η1 = 10.9; η2 = 75; SR = 1700; TI = roof-top; GL = Southern Europe | |
| Desideri et al. [34] | mc-Si | 88.74 | 4.17 | η1 = 14.4; η2 = 80; PR = 1778; TI = ground-mount, 25° tilt; GL = Perugia, Italy |
| Source | CSP Category (Supplementary Case Description) | GHG Emissions (gCO2e/kWh) | EPBT (Years) | Additional Features |
|---|---|---|---|---|
| PR (kW), SR (kWh/m2/yr), GL | ||||
| Kreith et al. [35] | Central receiver | 43 | NA | PR = 100,000; GL = USA |
| CRIEPI Report [36] | Central receiver | 213 | NA | PR = 5000; GL = Saijo, Japan |
| Martin [37] | Parabolic trough | 166 | GL = USA | |
| Norton et al. [38] | Central receiver (energy efficient materials) | 21 | NA | GL = Europe |
| Central receiver (conventional materials) | 48 | NA | GL = Europe | |
| Paraboloidal dish (energy efficient materials) | 24 | NA | GL = Europe | |
| Paraboloidal dish (conventional materials) | 58 | NA | GL = Europe | |
| Parabolic trough (energy efficient materials) | 30 | NA | GL = Europe | |
| Parabolic trough (conventional materials) | 80 | NA | GL = Europe | |
| Solar pond (energy efficient materials) | 5 | NA | GL = Europe | |
| Solar pond (conventional materials) | 6 | NA | GL = Europe | |
| Weinrebe et al. [39] | Parabolic trough | 17 | NA | PR = 80,000; SR = 2300; GL = California, USA |
| Central receiver | 25 | NA | PR = 30,000; SR = 2300; GL = California, USA | |
| Lenzen [40] | Central receiver | 60 | NA | SR = 2350; GL = Australia |
| Parabolic trough | 90 | NA | SR = 2350; GL = Australia | |
| Lechon et al. [41] | Parabolic trough | 185 | 1.04 | PR = 17,000; SR = 2016; GL = Andalucía, Spain |
| Central receiver | 203 | 1.02 | PR = 50,000; SR = 1997; GL = Andalucía, Spain | |
| NEEDS Report [42] | Parabolic trough | 161 | NA | SR = 2000; GL = Spain |
| Central receiver | 140 | NA | SR = 2000; GL = Spain | |
| Niemann et al. [43] | Solar chimney | 10 | NA | PR = 50; GL = Manzanares, Spain |
| Burkhardt et al. [44] | Parabolic trough (wet: use of wet-cooling systems) | 26 | 1 | PR = 103,000 kW; SR = 2700; GL = California, USA; |
| Parabolic trough (dry: elimination of wet-cooling systems) | 28 | 1.08 | PR = 103,000 kW; SR = 2700; GL = California, USA; | |
| Fabrizi [45] | Parabolic trough | 15 | <1 | GL = USA |
| Central receiver | 18 | <1 | GL = USA | |
| Zongker [46] | Solar chimney | 34.1 | NA | GL = USA |
| Solar chimney | 62.9 | NA | GL = USA |
| PV Type | N | X ± SD | Min. | Max. | SE | Q1 | Q2 | Q3 |
|---|---|---|---|---|---|---|---|---|
| sc-Si | 24 | 85.33 ± 59.43 | 21 | 250 | 12.13 | 38 | 63 | 114 |
| mc-Si | 35 | 73.68 ± 63.44 | 9.4 | 250 | 10.72 | 30 | 50 | 120 |
| a-Si | 16 | 57.49 ± 53.96 | 9 | 187.8 | 13.49 | 15 | 41.1 | 50 |
| µc-Si | 1 | 39.2 ± 0 | 39.2 | 39.2 | 0 | 39.2 | 39.2 | 39.2 |
| CdTe | 21 | 23.22 ± 10.94 | 8.9 | 51 | 2.39 | 18 | 20.9 | 25 |
| CIS | 3 | 50.5 ± 42.43 | 10.5 | 95 | 24.5 | 10.5 | 46 | 95 |
| CIGS | 1 | 39.2 ± 0 | 39.2 | 39.2 | 0 | 39.2 | 39.2 | 39.2 |
| DSSC | 2 | 33 ± 19.8 | 19 | 47 | 14 | 19 | 33 | 47 |
| PV Type | N | X ± SD | Min. | Max. | SE | Q1 | Q2 | Q3 |
|---|---|---|---|---|---|---|---|---|
| sc-Si | 19 | 6.07 ± 3.88 | 1.7 | 15.5 | 0.89 | 3.2 | 4 | 8.9 |
| mc-Si | 24 | 3.15 ± 1.89 | 0.5 | 7.4 | 0.39 | 1.9 | 2.4 | 3.6 |
| a-Si | 16 | 3.18 ± 1.51 | 1.1 | 5.8 | 0.38 | 2.1 | 2.8 | 4 |
| µc-Si | 1 | 2.5 ± 0 | 2.5 | 2.5 | 0 | 2.5 | 2.5 | 2.5 |
| CdTe | 18 | 1.25 ± 0.51 | 0.7 | 2.5 | 0.12 | 0.9 | 1.1 | 1.5 |
| CIS | 3 | 2.07 ± 0.64 | 1.6 | 2.8 | 0.37 | 1.6 | 1.8 | 2.8 |
| CIGS | 1 | 2.5 ± 0 | 2.5 | 2.5 | 0 | 2.5 | 2.5 | 2.5 |
| PV Type | N | X ± SD | Min. | Max. | SE | Q1 | Q2 | Q3 |
|---|---|---|---|---|---|---|---|---|
| sc-Si | 16 | 78.19 ± 4.88 | 62 | 81 | 1.22 | 75 | 80 | 81 |
| mc-Si | 26 | 77.73 ± 5.52 | 55 | 85 | 1.08 | 75 | 79 | 80 |
| a-Si | 7 | 79.16 ± 2.46 | 75 | 81 | 0.93 | 77.1 | 81 | 81 |
| µc-Si | 1 | 75 ± 0 | 75 | 75 | 0 | 75 | 75 | 75 |
| CdTe | 21 | 78.49 ± 2.42 | 75 | 81 | 0.53 | 75 | 80 | 80 |
| CIS | 3 | 76.87 ± 1.63 | 75 | 78 | 0.94 | 75 | 77.6 | 78 |
| CIGS | 1 | 75 ± 0 | 75 | 75 | 0 | 75 | 75 | 75 |
| DSSC | 2 | 53 ± 0 | 53 | 53 | 0 | 53 | 53 | 53 |
| CSP Type | N | X ± SD | Min. | Max. | SE | Q1 | Q2 | Q3 |
|---|---|---|---|---|---|---|---|---|
| parabolic trough | 10 | 79.8 ± 67.82 | 15 | 185 | 21.45 | 26 | 55 | 161 |
| central receiver | 9 | 85.67 ± 78.48 | 18 | 213 | 26.16 | 25 | 48 | 140 |
| paraboloidal dish | 2 | 41 ± 24.04 | 24 | 58 | 17 | 24 | 41 | 58 |
| solar chimney | 3 | 35.67 ± 26.49 | 10 | 62.9 | 15.29 | 10 | 34.1 | 62.9 |
| solar pond | 2 | 5.5 ± 0.71 | 5 | 6 | 0.5 | 5 | 5.5 | 5 |
© 2017 by the authors. Licensee MDPI, Basel, Switzerland. This article is an open access article distributed under the terms and conditions of the Creative Commons Attribution (CC BY) license ( http://creativecommons.org/licenses/by/4.0/).
Share and Cite
Kommalapati, R.; Kadiyala, A.; Shahriar, M.T.; Huque, Z. Review of the Life Cycle Greenhouse Gas Emissions from Different Photovoltaic and Concentrating Solar Power Electricity Generation Systems. Energies 2017, 10, 350. https://doi.org/10.3390/en10030350
Kommalapati R, Kadiyala A, Shahriar MT, Huque Z. Review of the Life Cycle Greenhouse Gas Emissions from Different Photovoltaic and Concentrating Solar Power Electricity Generation Systems. Energies. 2017; 10(3):350. https://doi.org/10.3390/en10030350
Chicago/Turabian StyleKommalapati, Raghava, Akhil Kadiyala, Md. Tarkik Shahriar, and Ziaul Huque. 2017. "Review of the Life Cycle Greenhouse Gas Emissions from Different Photovoltaic and Concentrating Solar Power Electricity Generation Systems" Energies 10, no. 3: 350. https://doi.org/10.3390/en10030350