1. Introduction
Wide band-gap power device materials, such as silicon carbide (SiC), are drawing increasing attention due to a number of superior qualities they possess, such as high switching-speed, lower specific on-resistance, and higher junction operating temperature capability [
1,
2,
3,
4,
5,
6,
7]. The application of SiC in a motor drive inverter can reduce both switching and conduction losses, shorten dead time in a phase-lag, and increase switching frequency, etc. Hence, the SiC-inverter can provide higher efficiency and higher power density in comparison to its silicon (Si) inverter counterpart [
8,
9,
10,
11], which is benefit for the electric vehicles with limited capacity battery [
11,
12].
Aside for these inverter-level benefits, the SiC-inverter also affects features of the dynamic performance of a motor drive system, such as fast response, relative stability and robustness, etc. This has not been clearly addressed yet, therefore, this paper investigates the impact of a SiC-inverter on the performance of a motor drive system, which is unlike some previous works that solely considered SiC-inverter systems [
13].
Because of its high efficiency and fast response characteristics, permanent magnet synchronous motors (PMSMs) are widely adopted in a host of high performance applications where low torque ripple, high efficiency, and remarkable dynamic response are highly demanded, such as dynamic positioning systems, machine-tool spindle electrical power steering and traction drives in electric vehicles, etc. [
14]. Hence, the dynamic performance of a PMSM fed by a SiC voltage source inverter (VSI) is worthy of further investigation. Numerous research activities have been conducted to analyze different aspects of the dynamic response, such as frequency response, fast response, relative stability and robustness [
15,
16,
17].
The dynamic performance analysis of a VSI-fed PMSM is based on state equations, with the
d- and
q-axis components of the stator currents and the rotor flux linkage as state variables [
15]. A transfer function of the drive system was developed according to the state equations and control theory [
18,
19,
20]. Then classical techniques such as Bode plots and Nyquist diagrams were used for analyzing the dynamic performance of the controlled system [
20,
21]. The traditional Bode plots were used to evaluate the frequency response in control engineering [
21]. The frequency response manifests the bandwidth and the fast response capability of the system.
Not only an adequate bandwidth promises a fast response ability of a PMSM system, but also sufficient relative stability and robustness guarantee its long-term robust operation. The relative stability of a system can be evaluated by the specified gain- and phase-margins described by Nichols plots of loop transfer functions [
22]. In addition, the robustness of the system can be investigated by H-infinity conditions on sensitivity functions [
23,
24].
The dynamic performance of a motor is mainly related with sampling delay and microprocessor calculation time, control strategies, and the characteristics of a given motor and inverter, etc. Researchers have performed a large amount of valuable work regarding the dynamic performance of the motor drive system [
25,
26,
27]. In [
25], the sampling and microprocessor delay were considering in a transfer function of a drive system to analyze the dynamic performance of a PMSM system. In [
26], a synchronous sampling (synchronized with the pulse-width modulation (PWM) carrier) of instantaneous phase current value was adopted in a current feedback loop, which achieved a higher bandwidth than the conventional methods. In [
27], the oversampling, namely sampling and controller updating done with a higher rate than the regular sampling methodology counterparts, is adopted to improve the frequency response.
Aside from the sampling delay, the computational effort on the digital signal processor (DSP) also causes a time delay [
28,
29,
30,
31,
32]. In order to overcome the time delay, some program compensations have been done [
28]. In addition to the software program improvements, faster microprocessors were adopted recently to reduce the delay time, such as field-programmable gate arrays (FPGAs), which take advantage of parallel calculations [
29,
30,
31,
32]. The use of efficient hardware and software allows the control algorithm to be run in less than 10 μs [
29], which is less than the computation time of a DSP28335 (usually more than 50 μs in our previous projects).
In addition to the sampling and microprocessor analysis, more research activities are currently conducted on the applied control strategies for improving the dynamic performance of PMSM drive systems [
15,
28,
33,
34,
35,
36,
37]. In [
15], a new predictive direct torque control (DTC) method was developed, which is introduced to achieve the fastest dynamic response in the transient state compared to the conventional DTC method. In this proposed method only the parameters of one voltage vector need to be calculated in contrast with the previous studies where the parameters of two voltage vectors must be calculated, resulting in a lower computational burden. In [
28], a proposed controller is based on a combination of deadbeat and direct predictive control techniques for a PMSM drive system. The computational delay was compensated by a modification of the control process. The proposed technique exhibited faster response as well as better robustness than the conventional proportional integral (PI) field-oriented control (FOC) technique. In [
33], a per-phase control in the abc-domain was proposed, which requires only one frame transformation execution. Such a control scheme yields excellent sinusoidal current command tracking and disturbance rejection.
Although many advanced control strategies and emerging fast computation microprocessor technologies have been to improve the dynamic performance of the PMSM drive system, few investigations have been done from the viewpoint of SiC-MOSFET characteristics. Hence, the purpose of this study was to explore the impact of SiC-MOSFET switching on the dynamic performance of a PMSM drive system. The SiC-MOSFET characteristics are evaluated experimentally through a double-pulse test (DPT), taking temperature into consideration. The switching performance is applied to a physical model of voltage distortion in a SiC-inverter to quantify the distorted voltages. Then, the switching performance of a SiC-MOSFET is firstly introduced into the transfer function of the PMSM drive system. As a result, the fast response, the stability, and the robustness of the system can be conveniently investigated from a control theory point of view. Finally, the analytical results are effectively validated by experiments. All the studies of the SiC-MOSFET drive system are compared to a Si-IGBT drive system counterpart.
The remainder of this paper is organized as follows: in
Section 2, the characteristics of the power devices are evaluated by DPT, and the distorted voltage of the inverter is quantitatively calculated. In
Section 3, a novel PMSM transfer function is developed, taking into account the switching performance of the power device. In
Section 4, the dynamic performances of the PMSM are analyzed based on transfer functions. In
Section 5, the experimental setup and the validation are illustrated. Conclusions are drawn in the final section.
2. Power Devices Characteristics
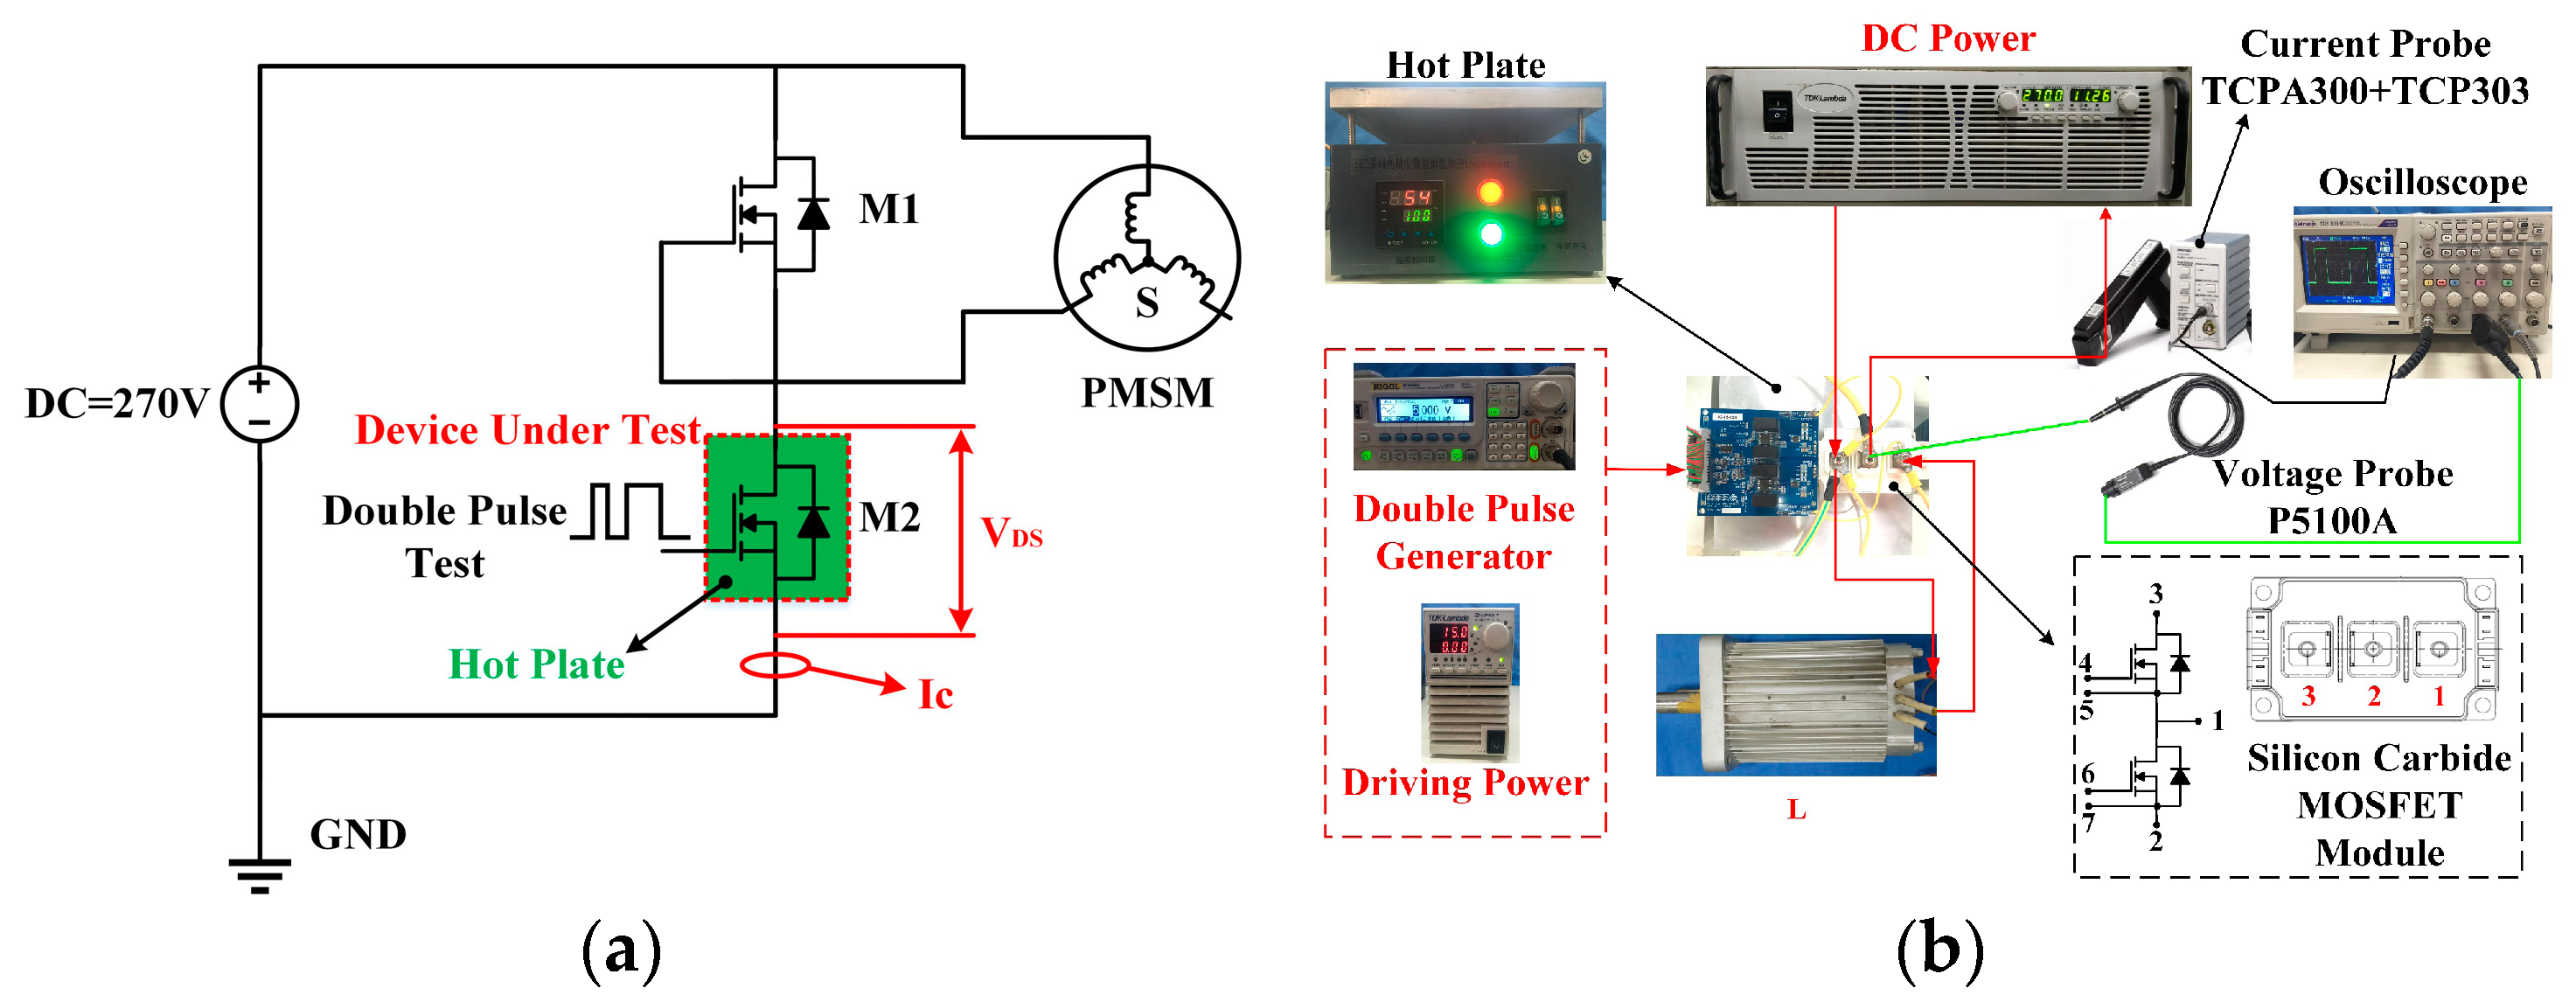
In order to analyze the dynamic performance of the PMSM drive system considering the power device characteristics, in this section of the paper we investigate the switching characteristics of a SiC MOSFET (CAS300M12BM2, CREE, Durham, NC, USA) and a Si IGBT (FF400R12KE3, Infineon, Am Campeon, Neubiberg, Germany) by a double-pulse test (DPT). The DPT setup was built as shown in
Figure 1, where a DC source voltage (270 V) is assigned to a leg of the inverter, and the inductors of two phases in the PMSM are adopted as the load inductors. The lower switch of phase-leg is selected as the device under test (DUT). A high precision voltage probe (P5100A, Tektronix, Beaverton, OR, USA) and a TCPA300 current probe (Tektronix, Beaverton, OR, USA) plus a TCP303 are used to measure the voltage (
VDS) and channel current (
IC) of the DUT, respectively.
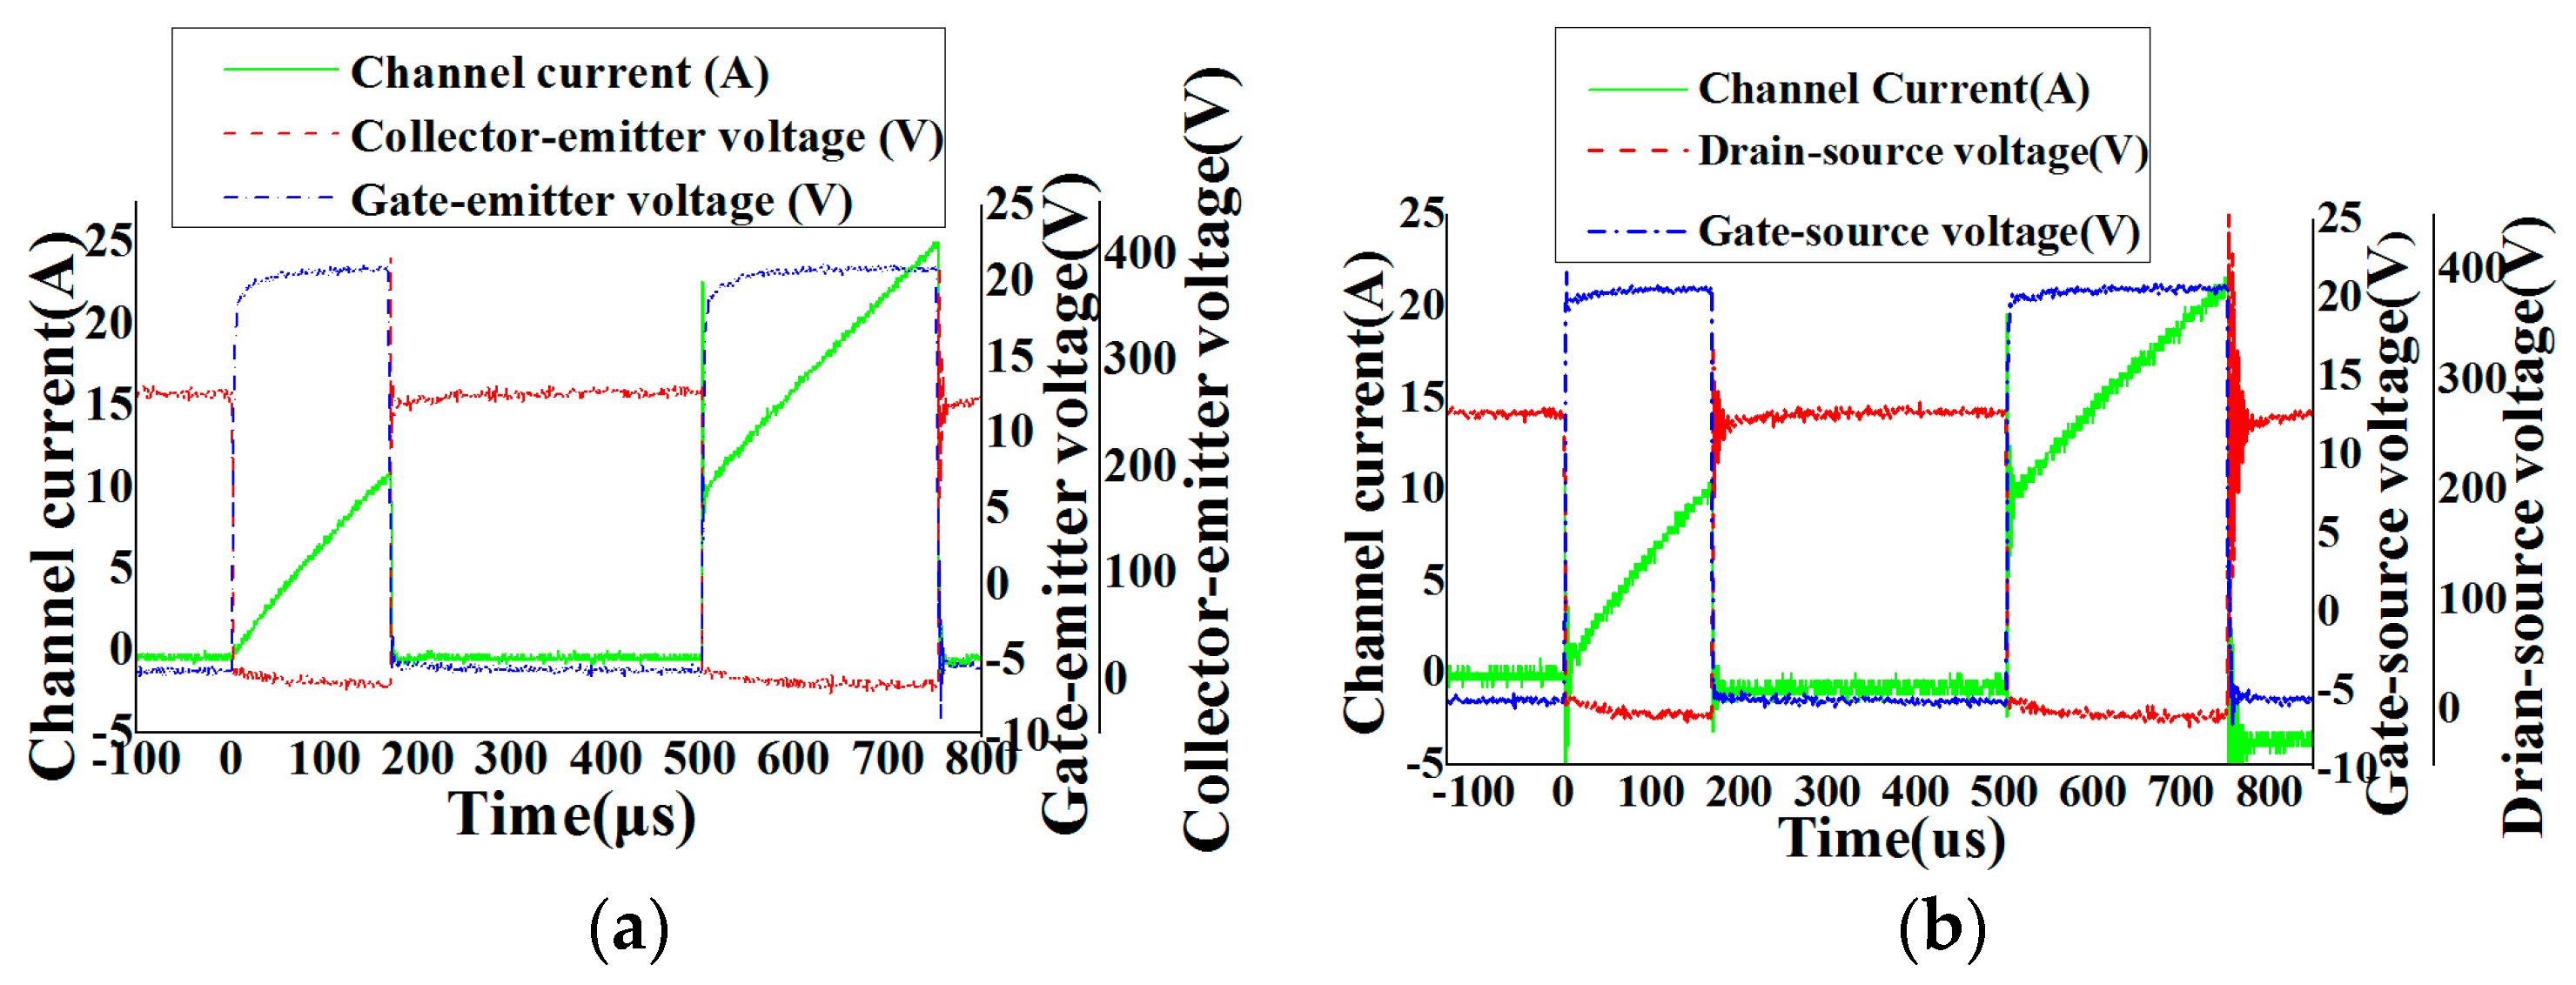
This setup is used to characterize the on-state voltage drop, the turn-on and turn-off transient processes. A comparison of the switching waveforms for the Si IGBT and SiC MOSFET are presented in
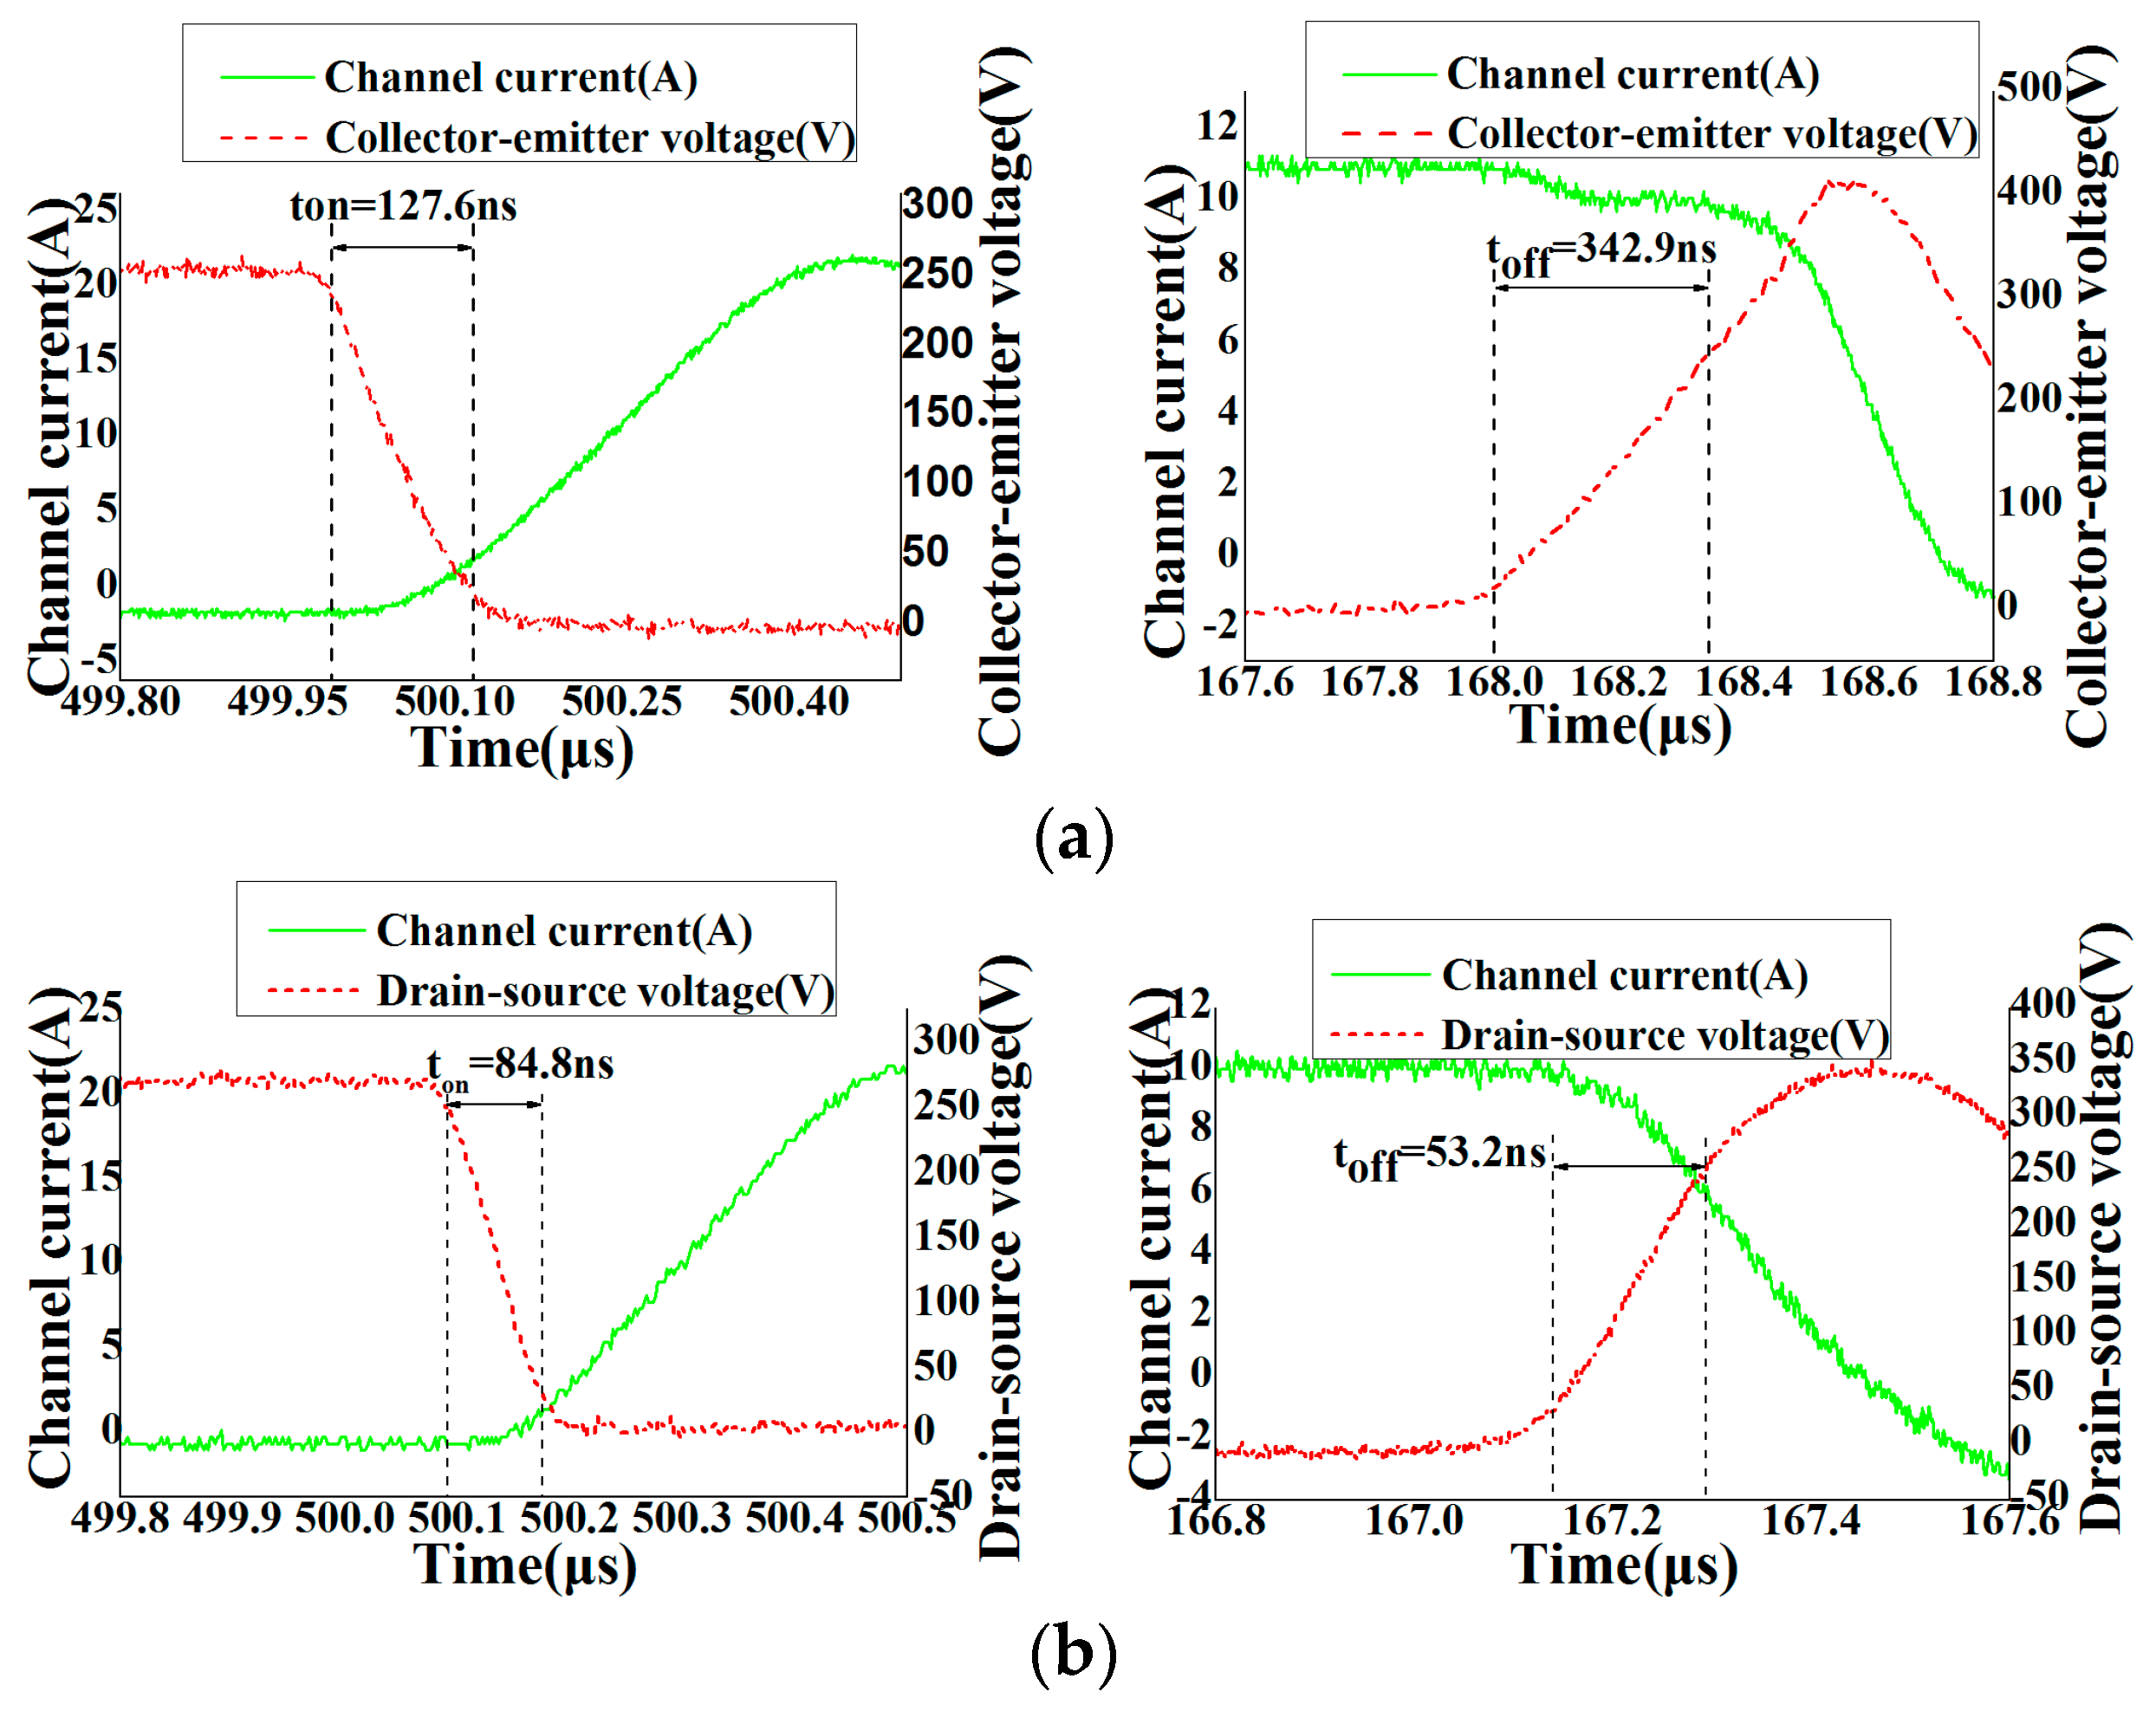
Figure 2. The enlarged figures of turn-on and turn-off transients are shown in
Figure 3. The red lines show the collector-emitter voltage (
VCE) for IGBT or drain-source voltage (
VDS) for the MOSFET. The green lines represent the channel current of the power devices and the blue lines display the waveforms of the gate-drive signals.
Figure 3 shows that the turn-on and turn-off times of the Si IGBT are 127.6 ns and 342.9 ns, respectively, when the ambient temperature is 25 °C and the channel current is 11A. Both the turn-on and turn-off times of the SiC MOSFET, which are 84.8 ns and 153.2 ns, correspondingly, are smaller than those of the Si counterpart.
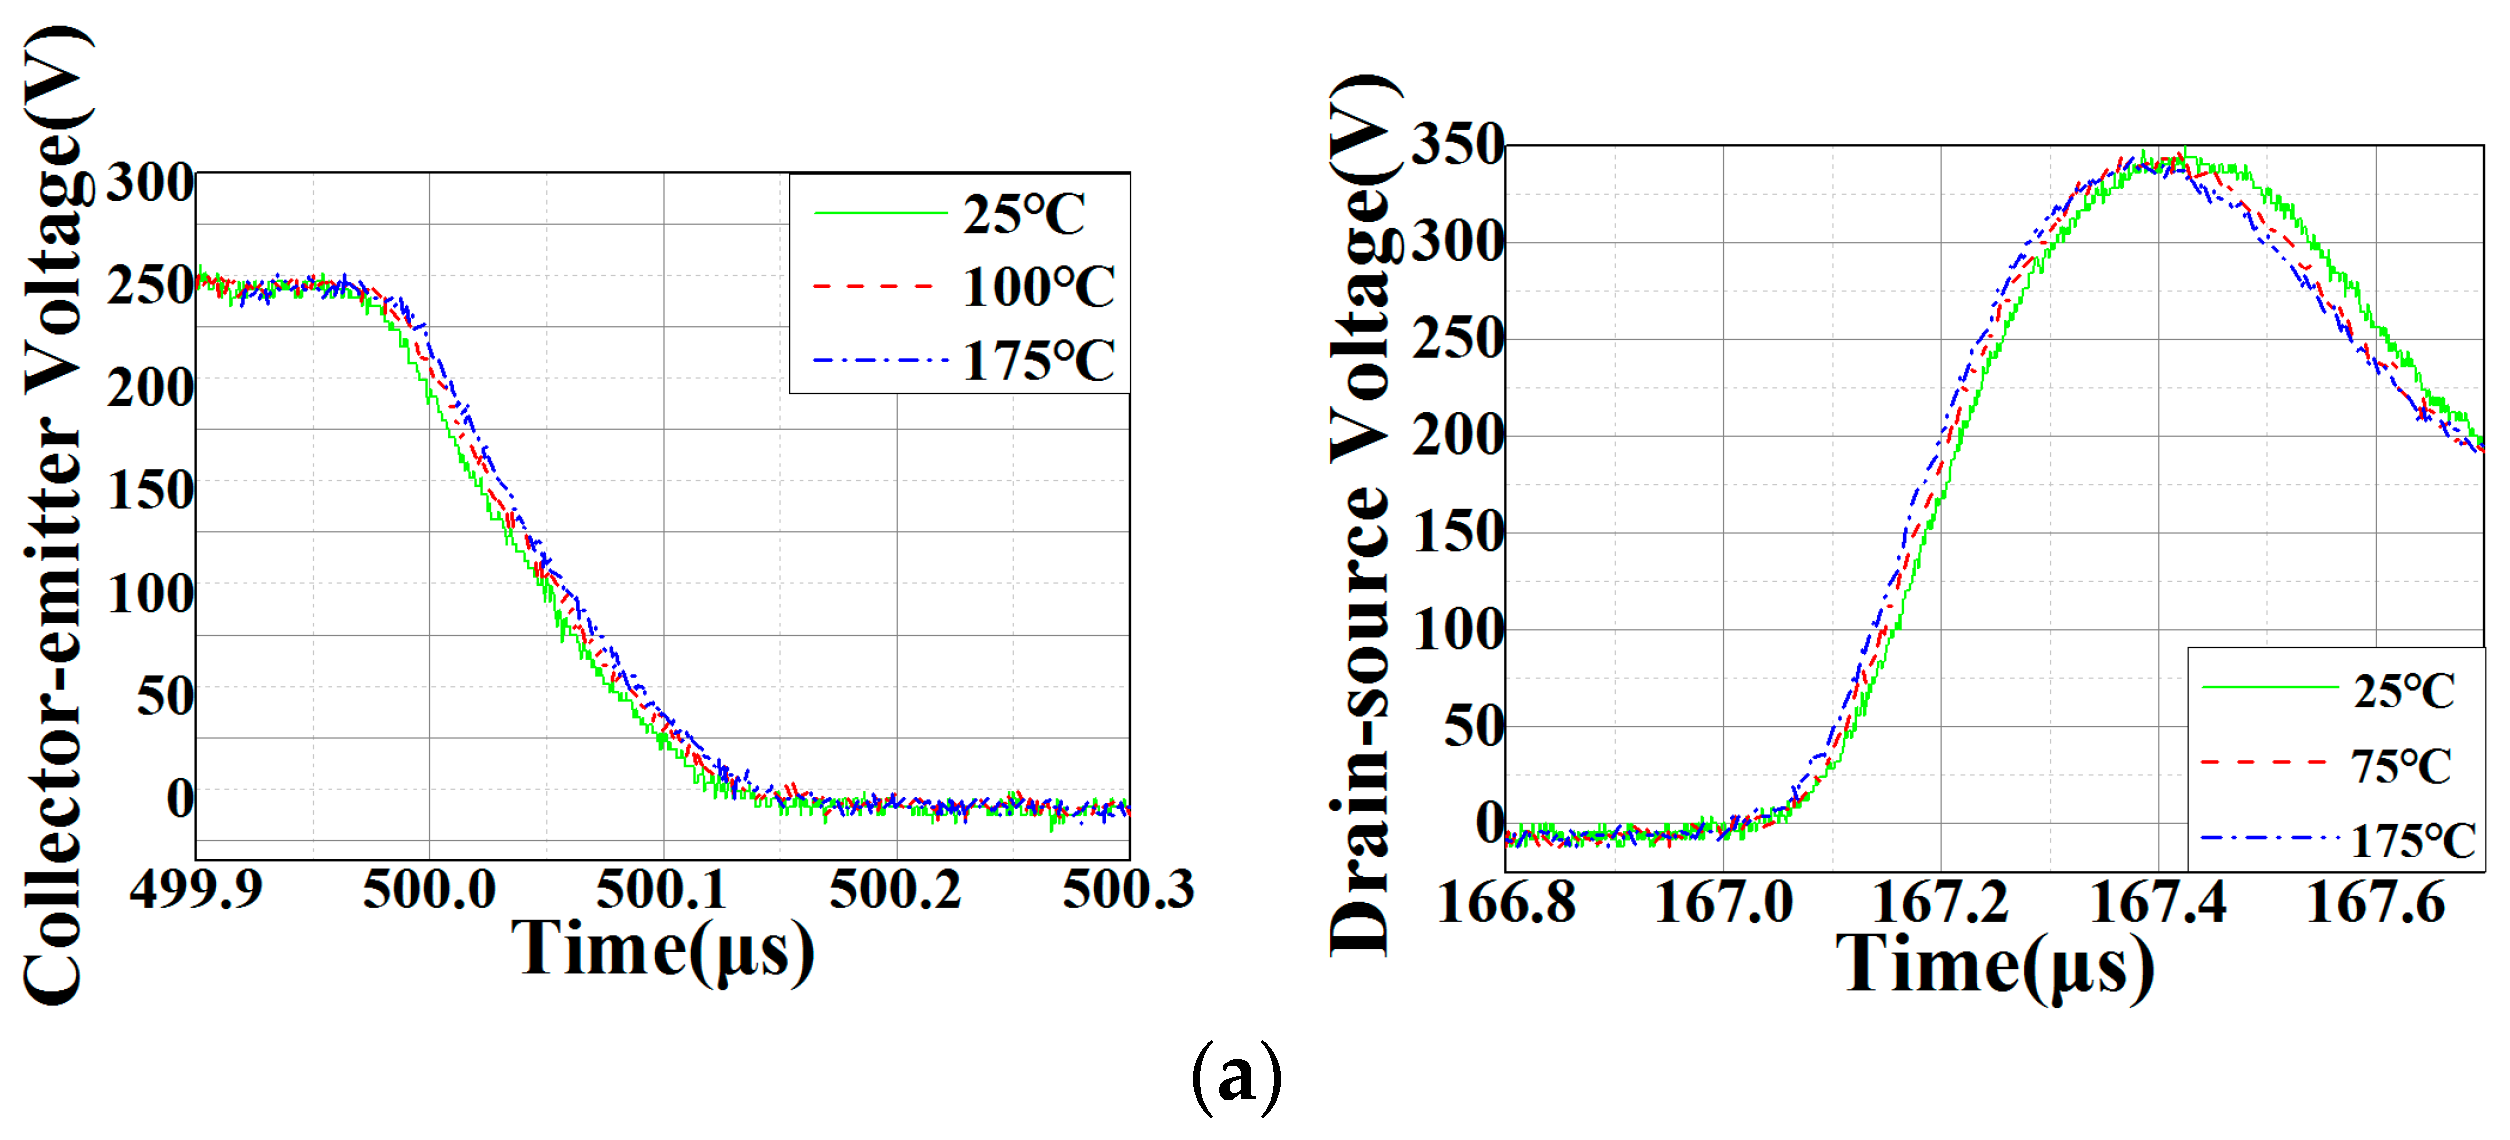
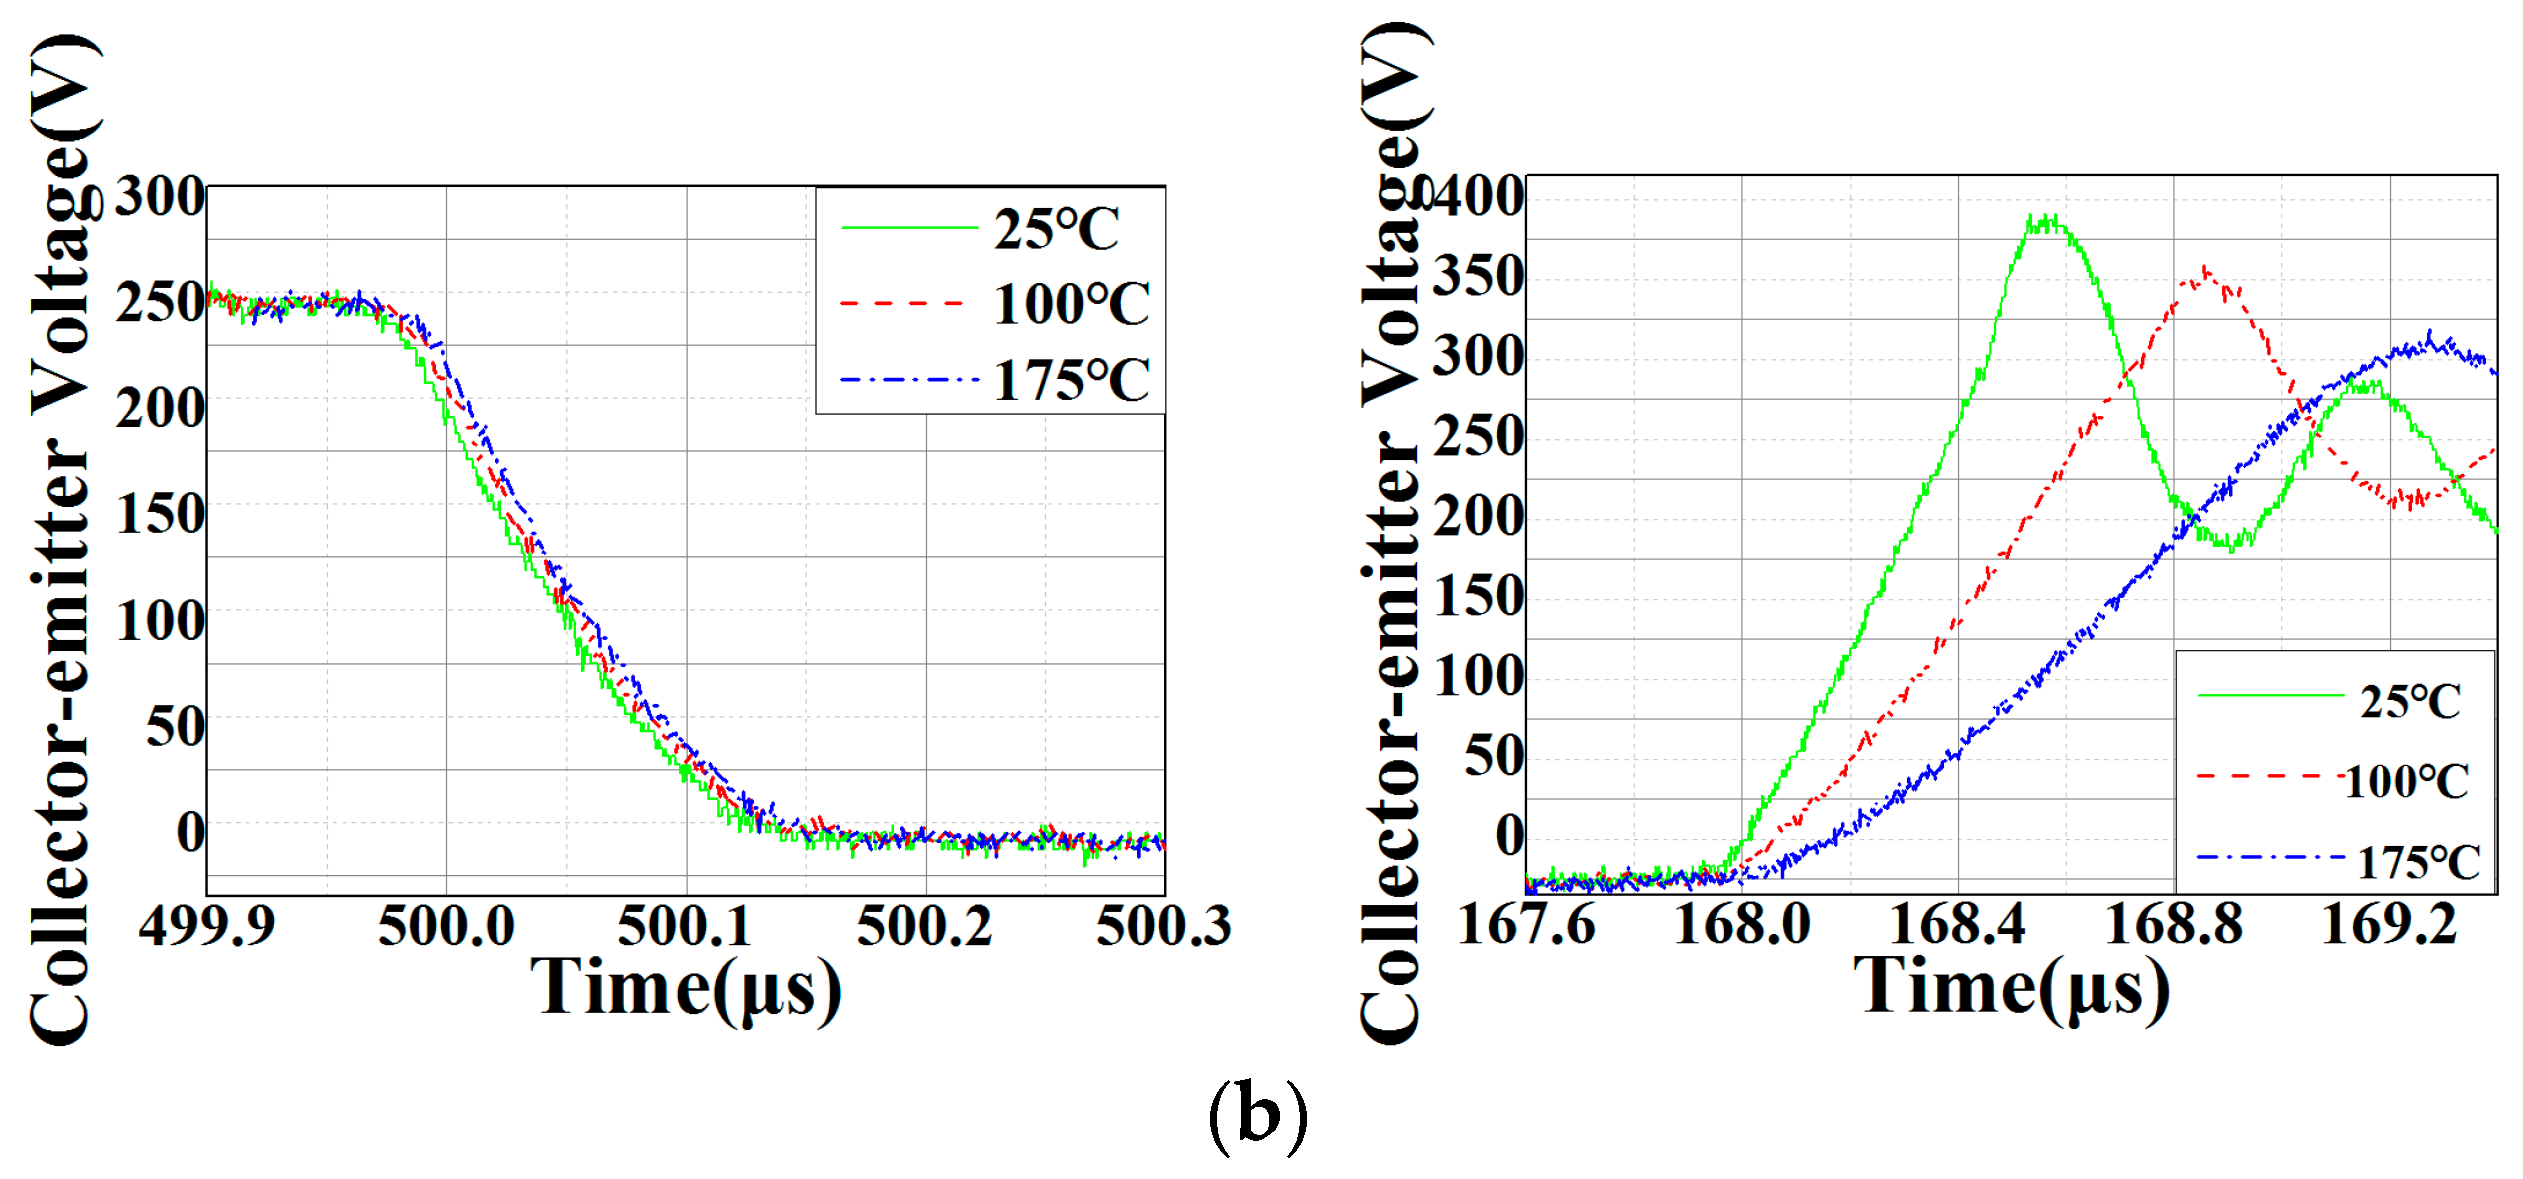
In addition, the accumulation of system losses leads to an increase in the device junction temperature after a long operation time. The characteristics of the devices under different temperatures are systematically explored in this paper, which is helpful to analyze the properties of semiconductor devices in practical applications taking thermal effects into account. Hence, the switching times of both SiC and Si are tested at different temperatures applied by a hot plate.
Figure 4 illustrates the switching times of power devices at different temperatures. The turn-off times of Si IGBT increase as the increasing temperature. However, the switching time of SiC MOSFET remains constant under different temperatures. In addition to the switching times of the two devices, the other characteristics of the two devices are also measured as shown in
Table 1. The voltage drop of SiC MOSFET is about 5% of Si IGBT. The value of SiC MOSFET is 44.2 mV and the counterpart of Si IGBT is 832.5 mV. The output capacitance of SiC MOSFET is also smaller than that of Si IGBT. These different characteristics are vital for calculating the phase voltage distortions and evaluating the dynamic performances of SiC- and Si-drive system.
In [
38,
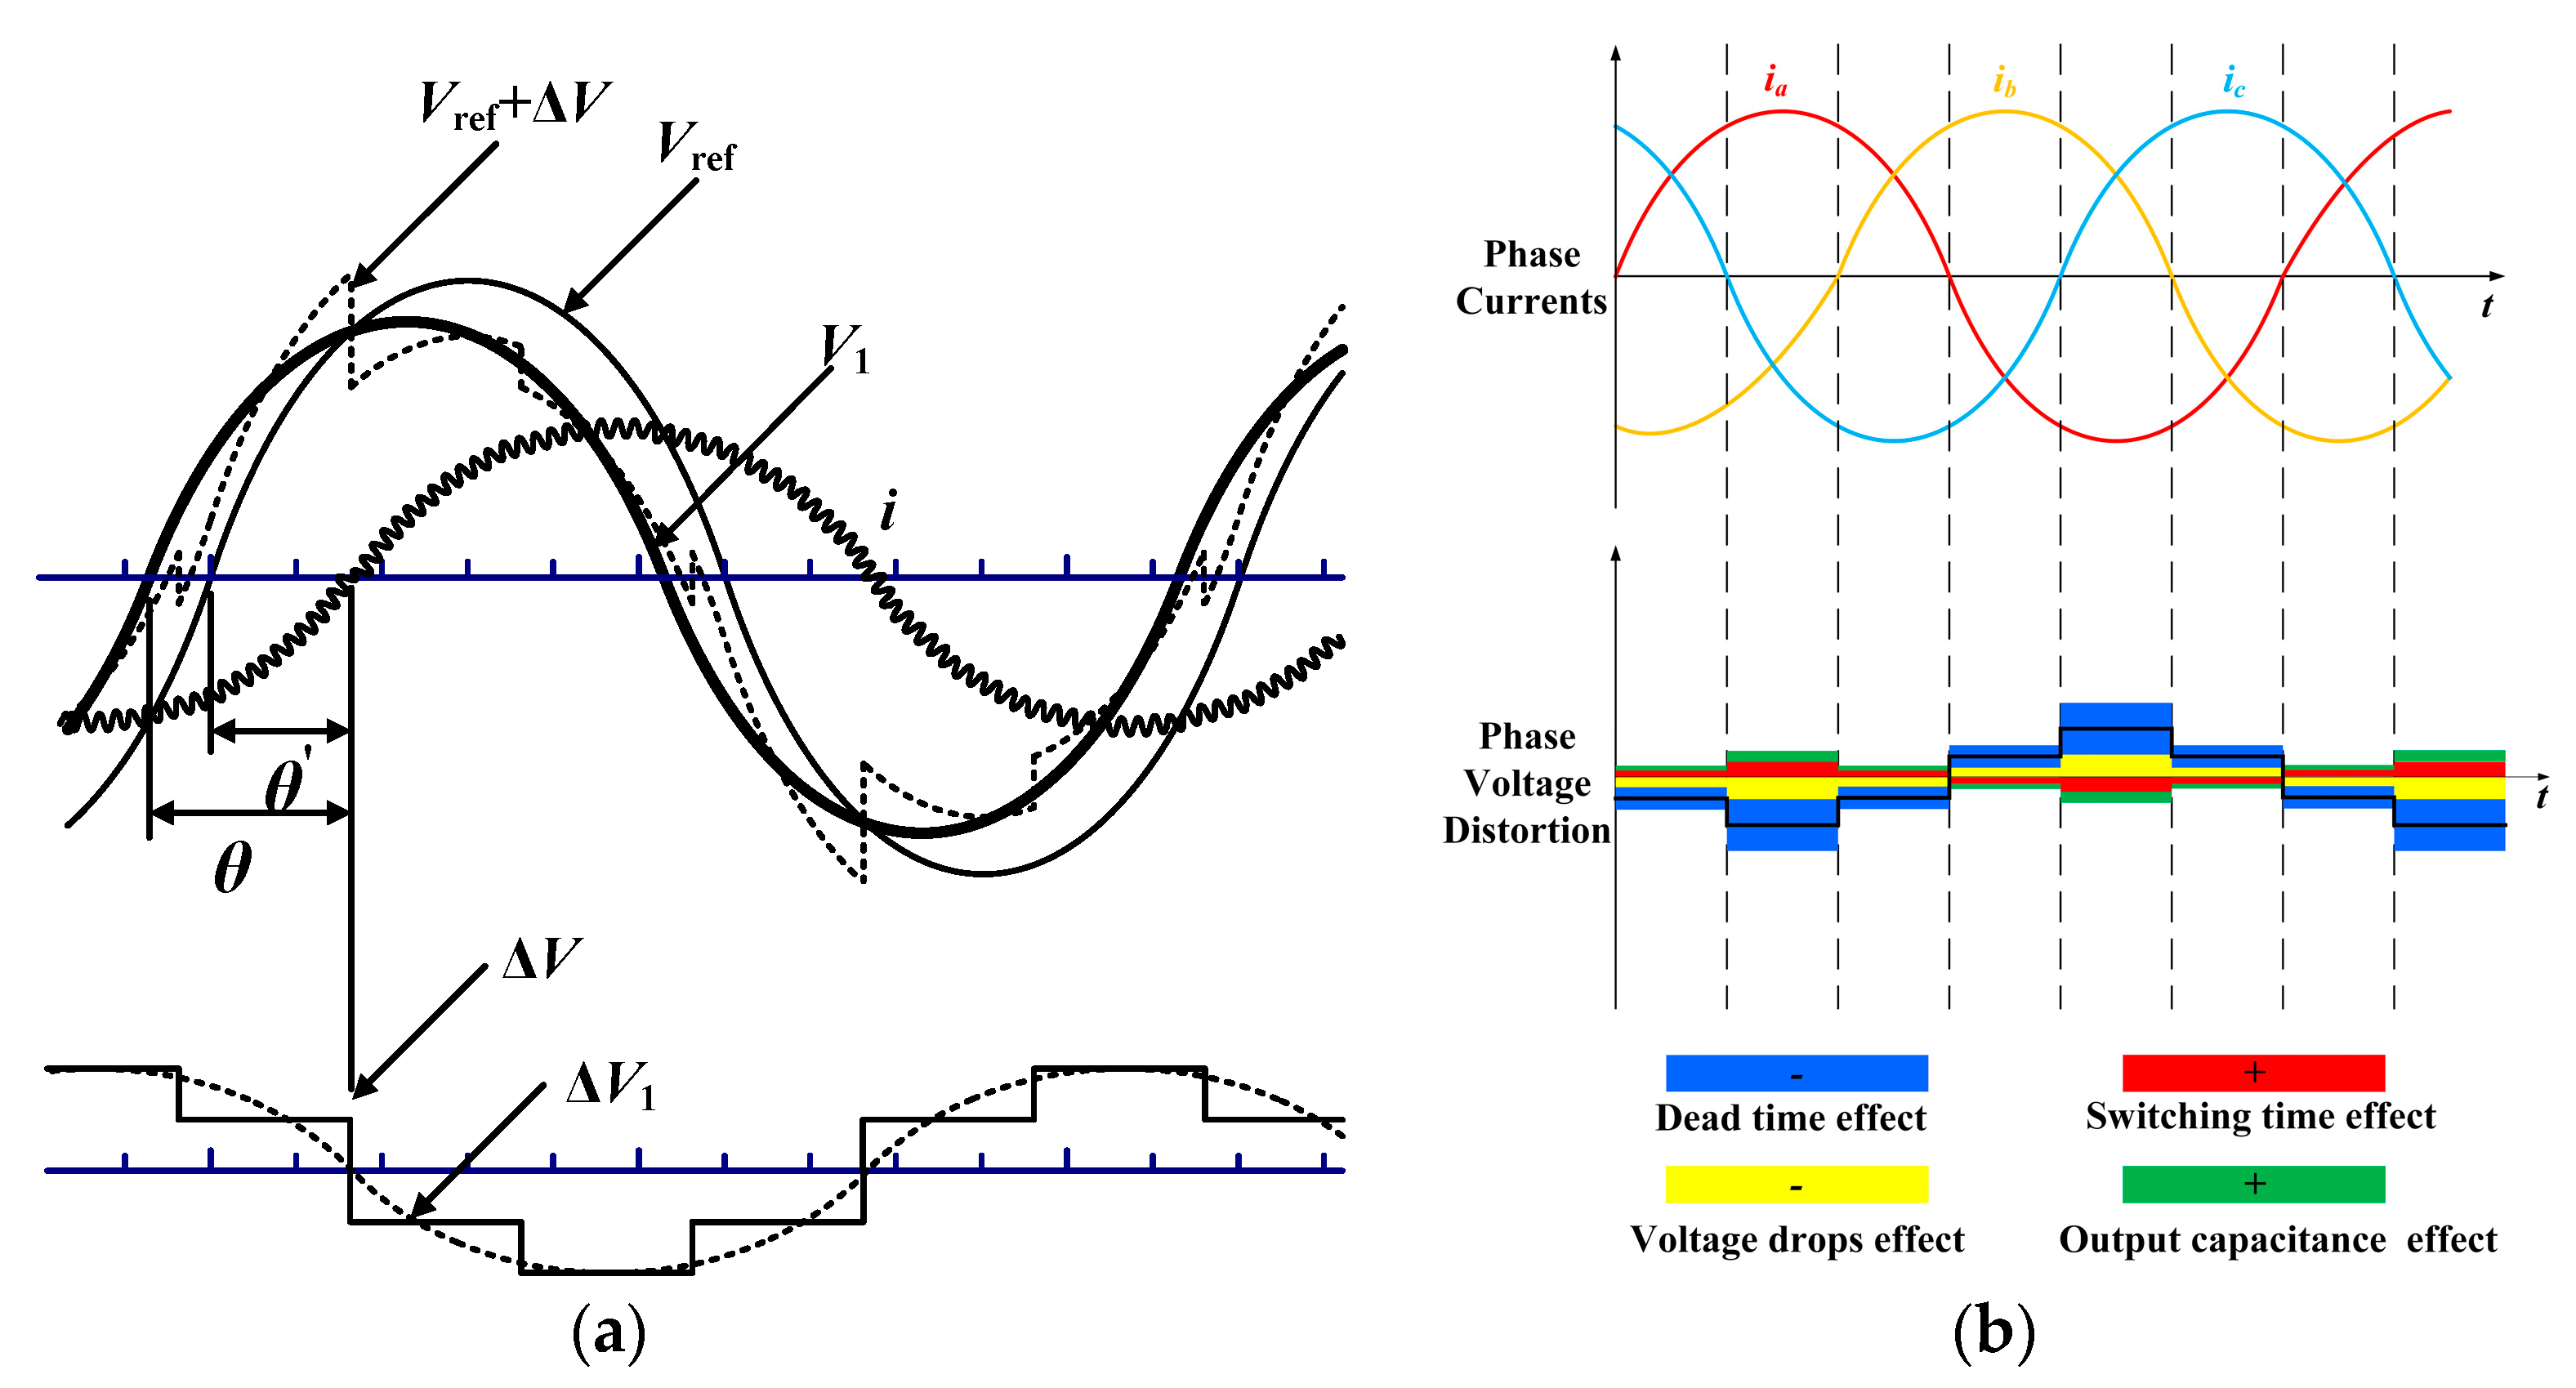
39], the phase voltage distortions of the inverter are developed, taking the dead time, switching time, voltage drop and output capacitance into account. In
Figure 5a, the deviation appears in the waveform of the inverter phase voltage.
Vref displays the ideal fundamental phase voltage of the inverter that would result if there were no distortion voltage effects. As the PMSM is an inductive load, the phase current waveform
i lags behind
Vref by an angle θ′. Since the distortion voltage increases (decreases) the inverter phase voltage for the negative (positive) half cycle of the phase current as shown in
Figure 5b, the average voltage distortion over an entire cycle could be illustrated by the square wave in
Figure 5a.
The average voltage distortion is the superposition of Δ
V on the ideal voltage
Vref shown as broken line in
Figure 5a. Therefore, the fundamental phase voltage with distortion voltage
V1 is the sum of
Vref and Δ
V1, which is described as a heavy solid curve. When the harmonic components of the current are ignored the phase displacement between
V1 and
i corresponds to the fundamental power factor angle of the load. It can be seen that the real fundamental phase voltage differs from the reference one in both the phase and magnitude. Therefore, when the fundamental phase voltage reduces and power factor angle increases, the current will increase to maintain a constant output power.
According to the mathematical model of the phase voltage distortion, less switching times, smaller output capacitances and lower voltage drops of SiC MOSFET will reduce the phase voltage distortion. With a faster switching speed, the dead-time of SiC MOSFET in phase-leg configuration can be reduced, which helps to reduce the phase voltage distortion.
4. Dynamic Performance Analysis of the PMSM
4.1. Fast Response Performance
As a basic requirement of industrial applications, an advanced and smart inverter fed PMSM system needs fast response performance. In general, the fast response performance of the control system can be evaluated via the bandwidth and the settling time.
According to (10), the closed-loop frequency characteristic of the system can be expressed as:
When the closed-loop amplitude-frequency characteristic
equals 0.707 times the amplitude at zero-frequency, the corresponding frequency is defined as cut-off frequency ω
b, i.e.:
Hence, the relationship among the cut-off frequency ω
b, the undamped natural frequency ω
n and the damping ratio ξ can be obtained as:
From the monotonicity analysis of (13), it can be concluded that ω
b decreases as the increase of ξ, and increases as ω
n increses. The following equations are obtained by substituting (3) and (4) into (10):
where, ω
n1 and ω
n2 represent the undamped natural frequencies of SiC- and Si-drive systems, respectively. ξ
1 and ξ
2 represent the damping ratios of SiC- and Si-drive systems, respectively.
Equations (14) and (15) are substituted into (13), resulting in:
Hence, compared with the Si-drive system, the SiC-drive system manifests a higher bandwidth leading to a fast response.
In addition, the settling time of the system
ts can be calculated as:
From (17), the settling time
ts is directly proportional to the delay time constant τ
r of the inverter. Hence, the settling time of the SiC-drive system is shorter than that of a Si-drive system according to (3). According to the aforementioned analyzing results and the system parameters shown in
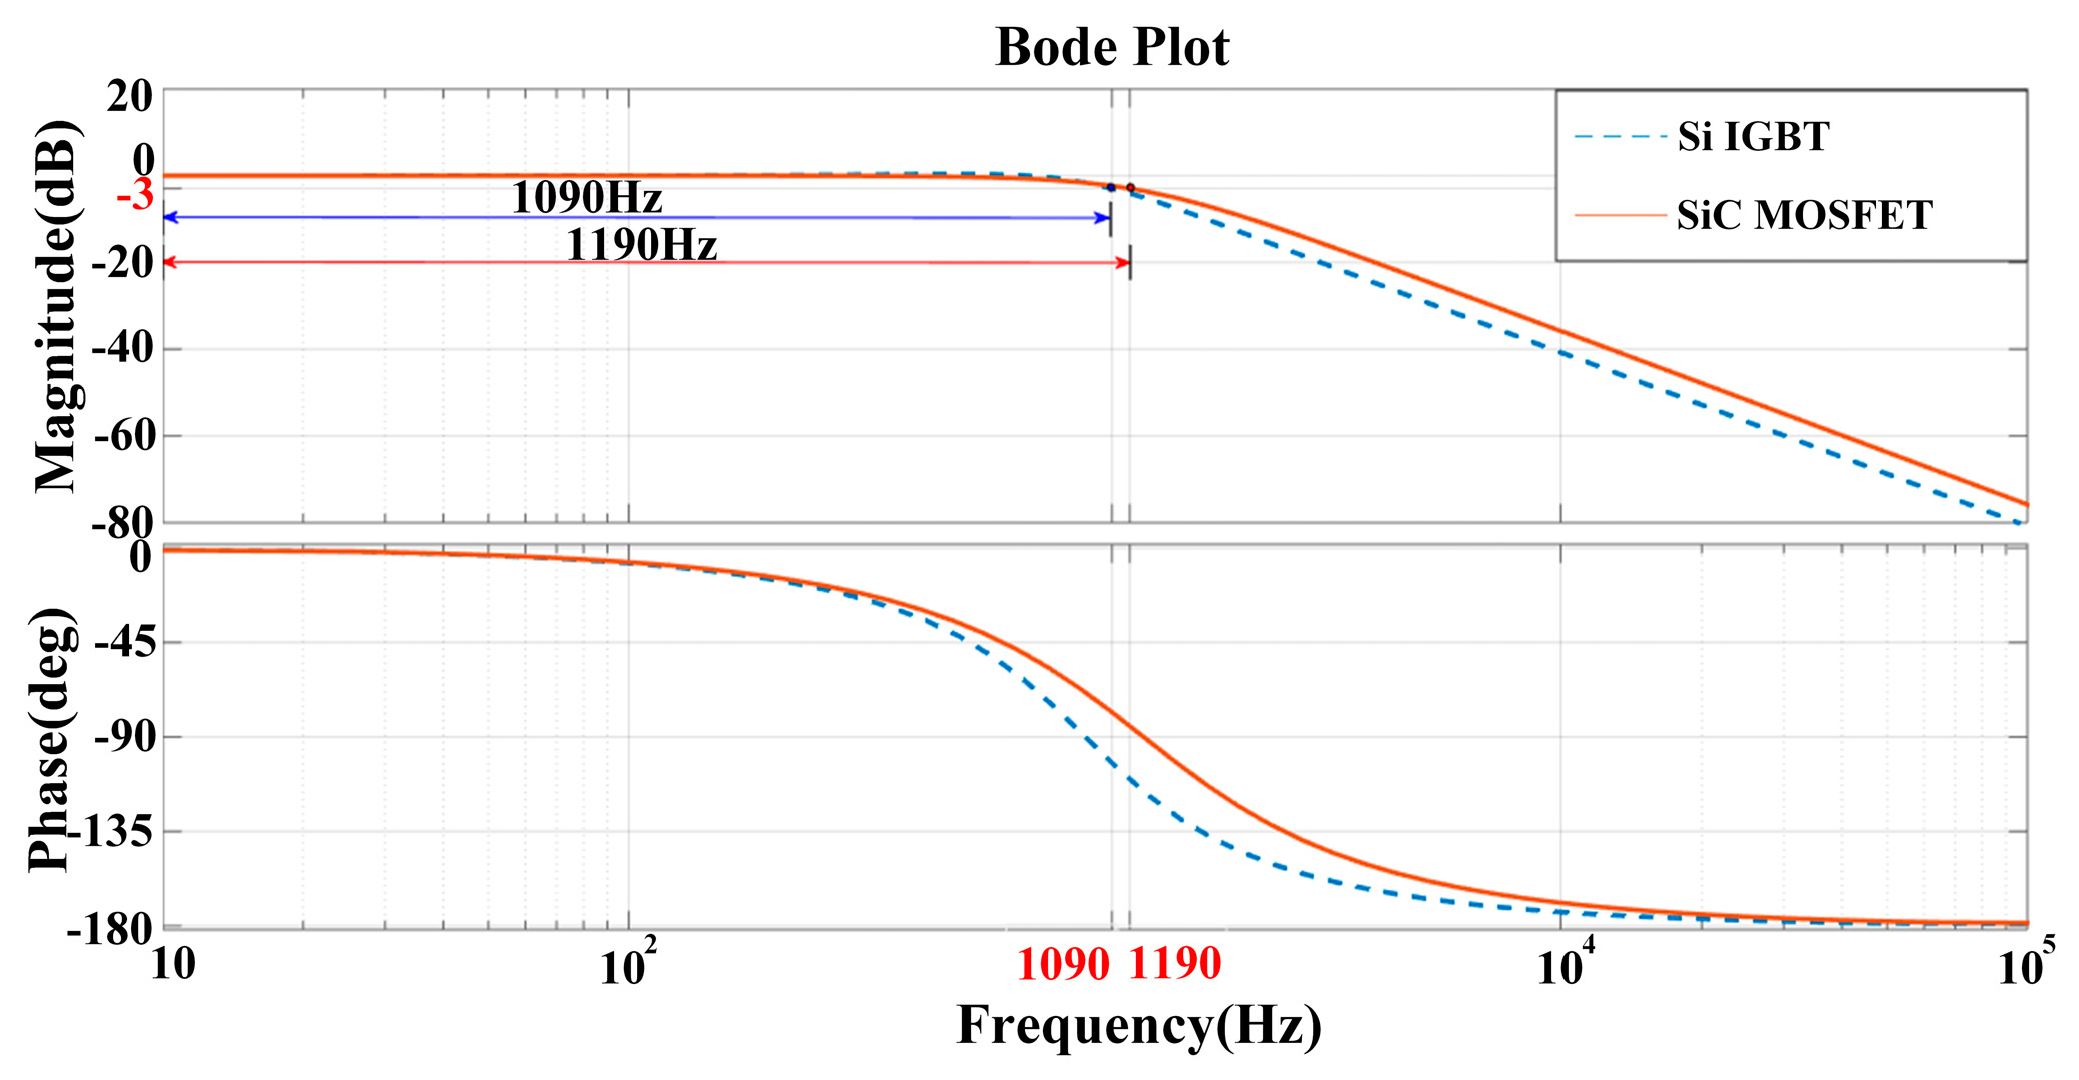
Table 2, the Bode plot of the closed-loop transfer functions for the two systems was drawn, as shown in
Figure 7. The bandwidth ω
b is usually defined by −3 dB amplitude response in Bode plots for a closed loop drive system. Thanks to the superior switching characteristics of SiC MOSFET, the bandwidth of the SiC-drive system is 1190 Hz, which is higher than the 1090 Hz of the Si-drive system.
4.2. Relative Stability Analysis
In the process of motor control system design, stability is a necessary condition for the control system to work properly. Additionally, the control system should also have a high level of relative stability. During the operation of a PMSM system, accumulated losses will lead to an increase in temperature. Furthermore, changes in the temperature affect the stator resistance Ra and q-axis inductance Lq, which are likely to destroy the stability of the whole system.
Based on the Nyquist criterion, when the open-loop transfer function of the control system has no pole in the right part of the S-plane, and the open-loop frequency characteristic curve G(jω) passes through the point (−1, j0), the control system is at the critical stable edge. In this case, if the control system parameters drift, and it is possible to make open-loop frequency characteristic curve of the control system surround the point (−1, j0), resulting in the control system instability.
In control theory, the stability margins which include the phase margin and amplitude margin are evaluation indexes of the relative stability of the system. The phase- and amplitude-margins of the system determine the stability of the dynamic performance.
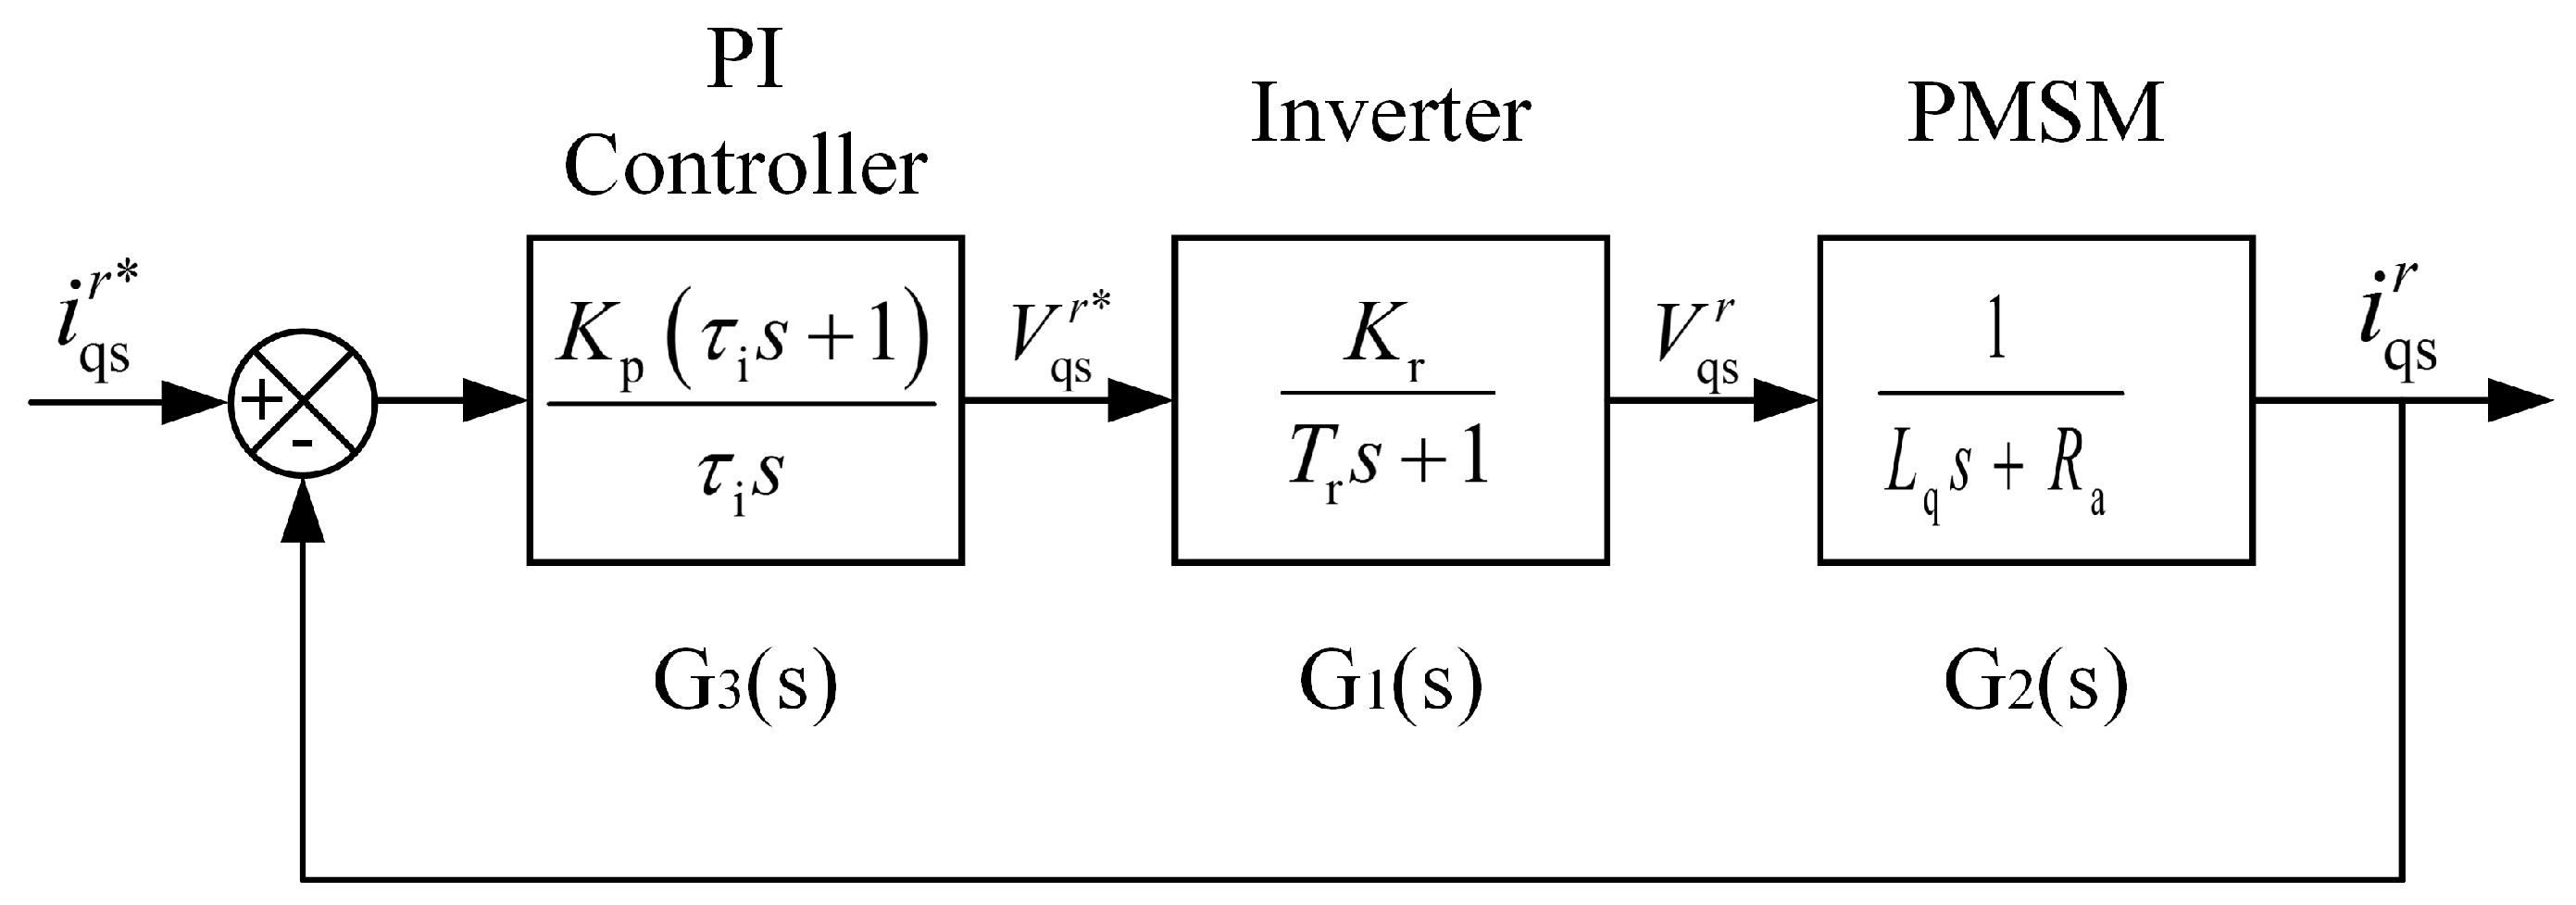
From the open-loop transfer function
G(
s) of the drive system in (9), the frequency characteristic
G(
jω) can be obtained as:
The amplitude-frequency characteristic
A(ω) and the phase-frequency characteristic φ(ω) are:
When the open-loop amplitude-frequency characteristic of a system is equal to 1, i.e.,
, the corresponding frequency is defined as the open-loop cut-off frequency ω
c. The difference between the phase angle φ(ω
c) and −180° at the open-loop cut-off frequency represents the phase margin γ of the system, that is:
According to (19) and (21), the open-loop cut-off frequency can be calculated as:
And the phase margin γ can be derived from (22):
It is observed that the phase margin is only related to the arctangent function, the phase margin increases with an increase of damping ratio ξ. From (15), the damping ratio ξ1 of the SiC-drive system is larger than that of the Si-drive system ξ2, which results in a larger phase margin in SiC-drive system.
When the open-loop frequency characteristic curve of the system intersects with the negative real axis, i.e., φ(ω) = −180°, the corresponding frequency can be obtained by (20), known as the phase cross-over frequency ω
g:
where,
n tends to infinity.
At ω
g, the reciprocal of the open-loop amplitude-frequency characteristic
A(ω
g) is defined as the amplitude margin
Kg of the drive system:
According to (19) and (26), the amplitude margin of a system can be calculated as;
The amplitude margin of the second-order system also tends to infinity, which makes the comparison between the two systems impossible. In order to facilitate the comparison, it is assumed that the phase cross-over frequency ω
g is the corresponding frequency of the phase-frequency characteristic φ(ω) = −179° replacing φ(ω) = −180°. The amplitude margin at this scenario can be calculated as:
Equations (14) and (15) show that the natural frequency ω
n and the damping ratio ξ of the SiC-drive system are higher than the counterparts of the Si-drive system. Hence, it is not difficult to draw the following conclusion from (28):
where
Kg1,
Kg2 represent the amplitude margin of SiC- and Si-drive system, respectively.
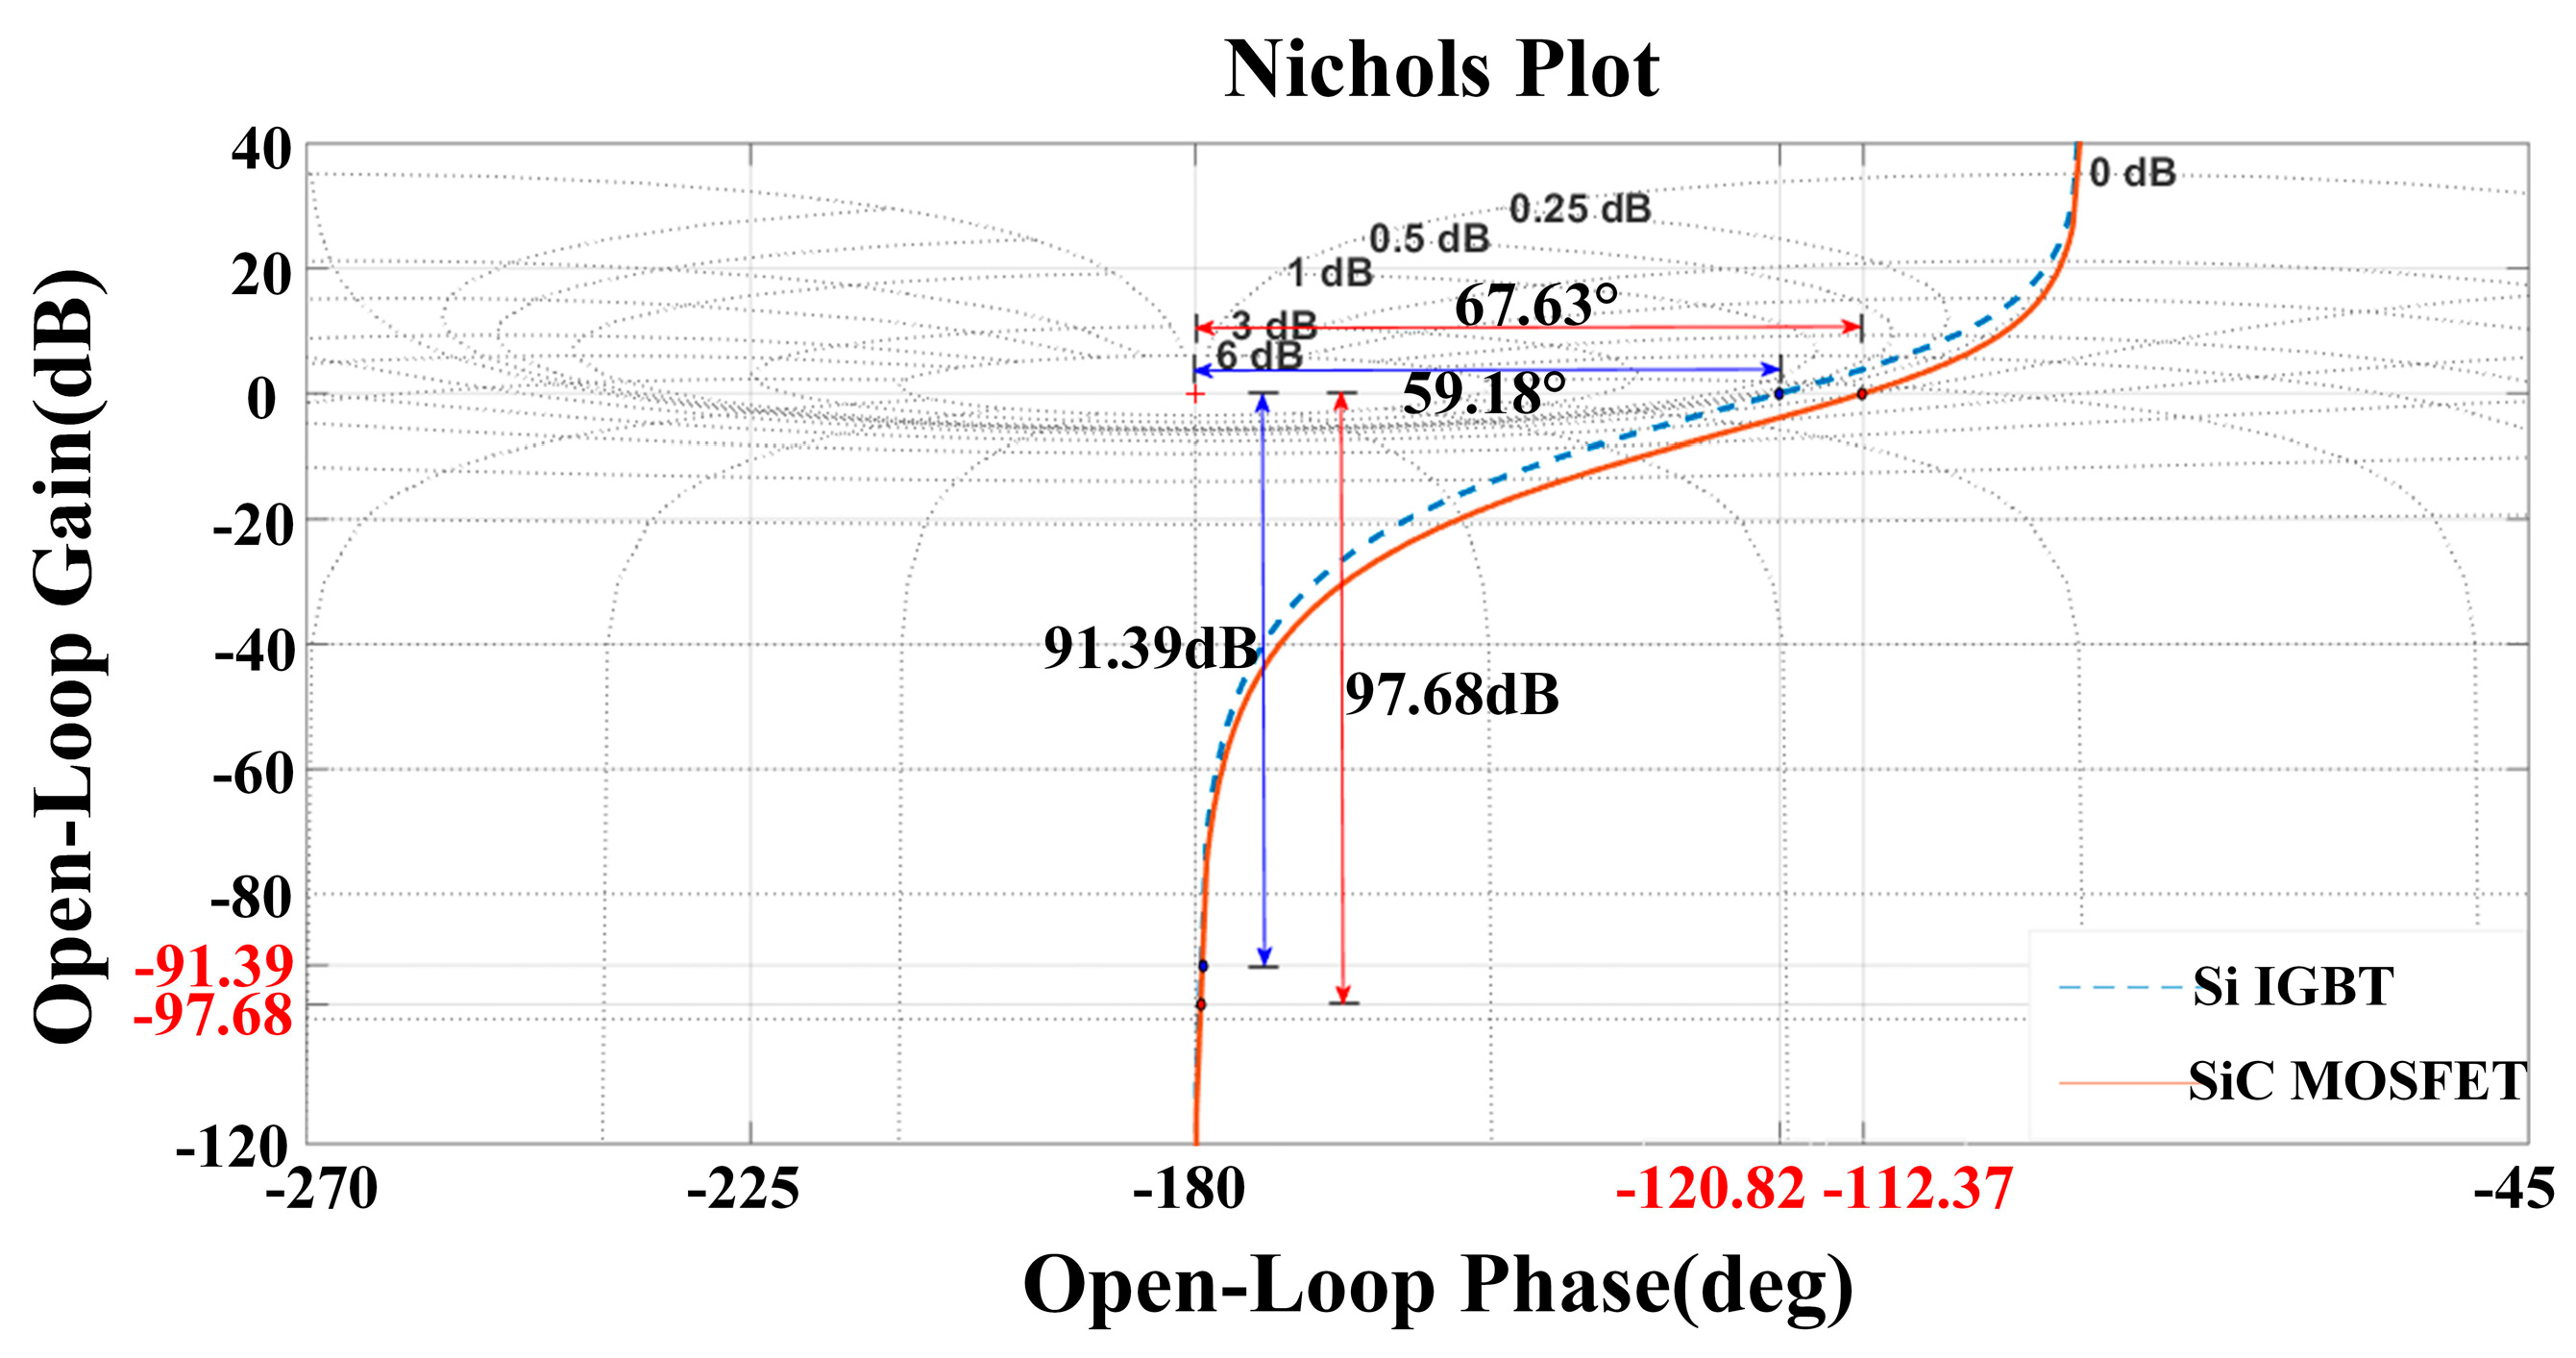
In order to figure out the phase- and amplitude-margins of the system, a Nichols plot is plotted using the transfer function of the drive system. Unlike the Bode plot, the Nichols plot presents both phase and magnitude information in one diagram.
In summary, due to the faster switching speed and lower voltage drop of the SiC MOSFET, the voltage distortion of the system is smaller. Consequently, the natural frequency and damping ratio in the second-order system transfer function of a SiC-drive system are larger than that of a Si-drive system, which yields larger phase- and amplitude-margins in the SiC-drive system.
As shown in
Figure 8, the phase- and amplitude-margins of the SiC-drive system are 67.63° and 97.68 dB, which is larger than the counterparts of the Si-drive system (59.18° and 91.39 dB, respectively). Hence, the relative stability of the SiC-drive system is better.
4.3. Robustness Analysis
Robustness represents the sensitivity of the control system. In a case of a servo system, the robustness performance analysis is one of the fundamental issues in controller design. When the system is influenced by energy-bounded interference signals, such as system parameter variations due to varying load torque, the system robustness is a significant index to evaluate system performance.
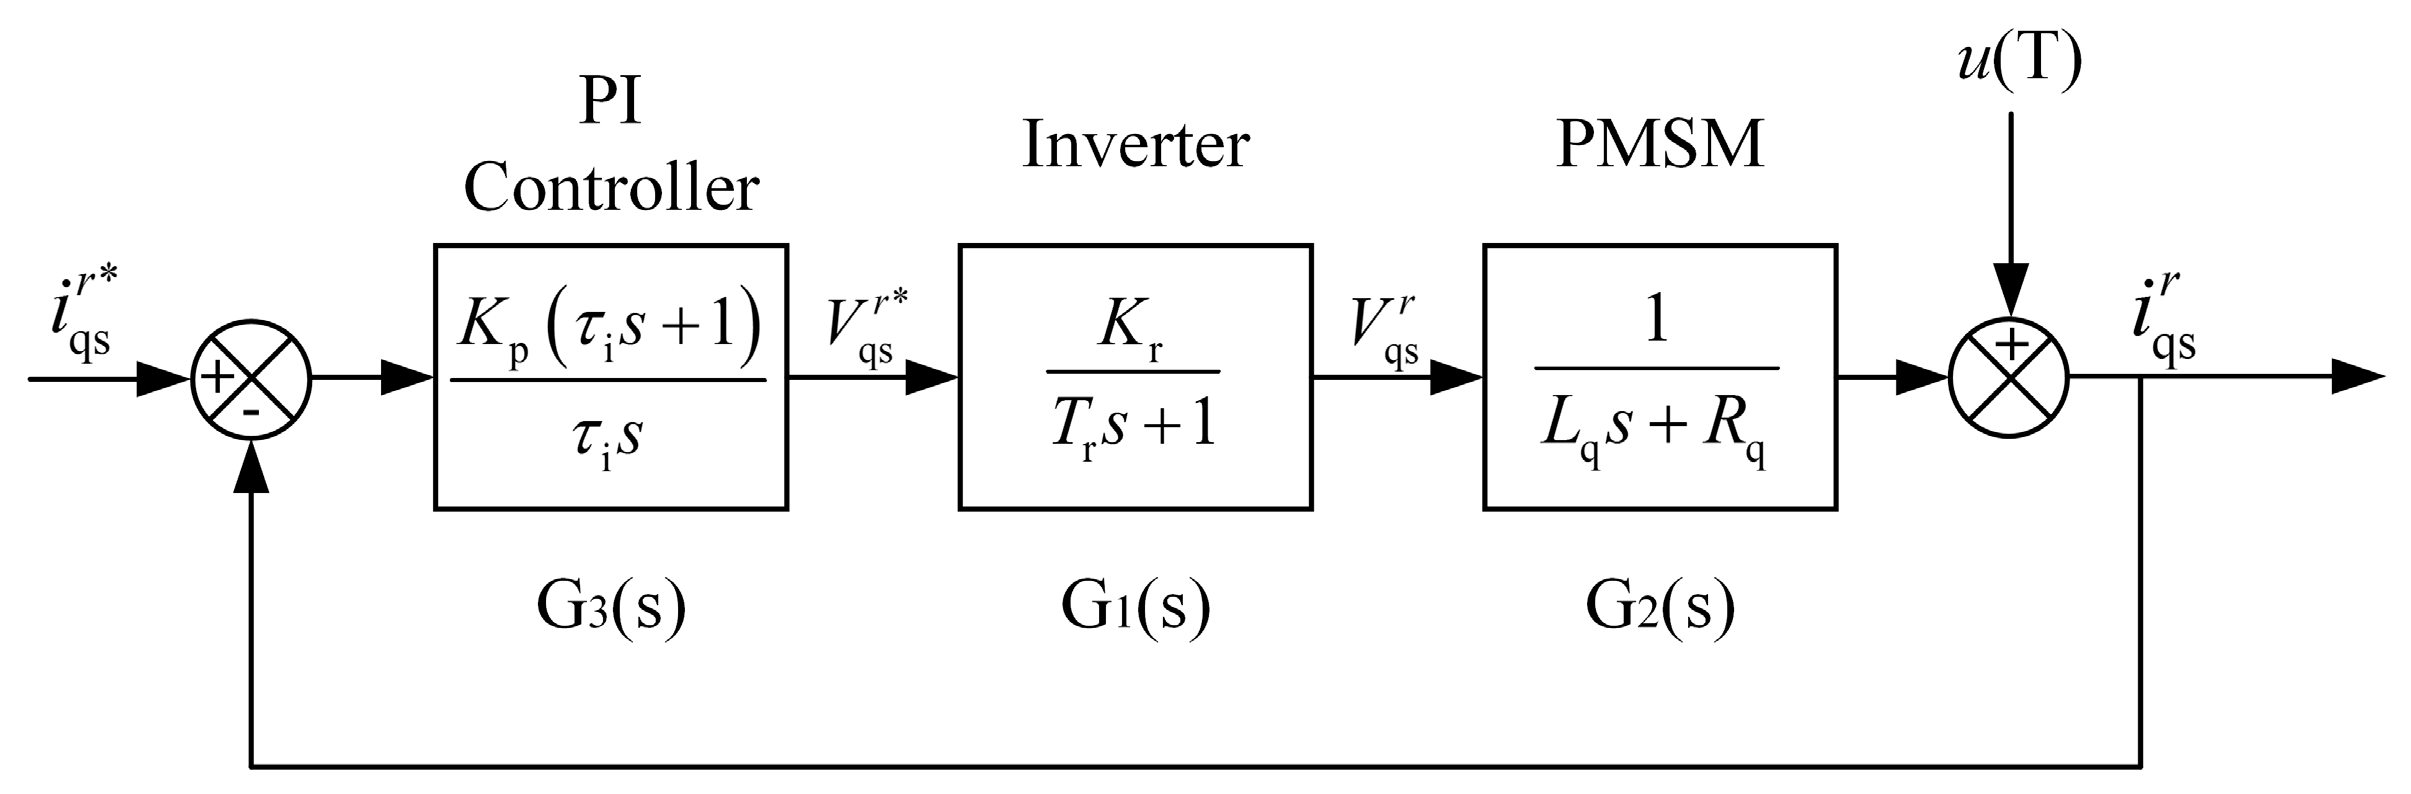
Figure 9 shows a single-input-single-output (SISO) PMSM drive system with negative feedback-control. As the energy-bounded interference signal
u(T) injected into the system, the controlled plant
G2(
s) transforms to
, as described by:
where Δ
G2(
s) is the uncertain part of the plant which is assumed to satisfy the following equation:
where
WT(ω) is a weighting function that represents the upper bound for the plant uncertainty. If the closed-loop system remains stability under such uncertain interferences, it is assumed that the feedback-control system is robust.
The variation rate of the transfer function of the system could be deduced by the following procedures: the errors of the open-loop and closed-loop transfer functions caused by changes of parameters could be expressed by (32) and (33), respectively:
Since
G1(
jω)
·G2(
jω)
·G3(
jω) >>
G1(
jω)
·Δ
G2(
jω)
·G3(
jω), the (33) could be rewritten as:
Combining (9), (10), (32) and (34), the variation rate of the transfer function of the system is derived, as expressed by following equation:
In the robustness analysis, the sensitivity function S(s) is an essential index, which reflects the ratio of the relative deviation of the open-loop characteristics to the gain of the closed-loop frequency characteristics . When the value of S(s) is small enough, the relative deviation of the closed-loop characteristics will be limited within the engineering allowance. Hence, the control system has a robustness capability under energy-bounded interferences.
In addition,
S(
s) could also be defined as the ratio of the variation rate
of the transfer function to the variation rate
of the controlled plant
G2(
s), as described by:
Equation (37) manifests that reducing the gain of
S(
s) would result in the diminution of the adverse effect on control error of PMSM drive system caused by the interference
u(T). The sensitivity function
S(
s) provides a general description of the impact by feedback disturbances in the control system. The
S(
s) of the PMSM drive system in this paper could be obtained as follows by substituting (10) into (37):
According to the switching characteristic of the SiC MOSFET and Si IGBT analyzed above, the SiC MOSFET presents higher switching speed and lower voltage drop. The phase voltage distortion of the SiC MOSFET inverter system is lower than the counterpart of the Si IGBT inverter system. Thus, the gain of SiC-drive system Kr1 is greater than that of the Si-drive system Kr2. Besides, as the delay time constant of an inverter defined in (2), it could be seen that the delay time constant of SiC-inverter τr1 is less than that of the Si-inverter system τr2.
In conclusion, with the greater inverter system gain Kr1 and lower inverter delay time τr1, the sensitivity S(s) of the SiC-drive system is smaller. The preferable robustness performance of the SiC-drive system is thus clarified.
5. Experimental Analysis
The impact of SiC MOSFETs on the dynamic performance of PMSM drive systems is further validated experimentally in a SiC-drive system, and the results were compared with those of the Si-drive system.
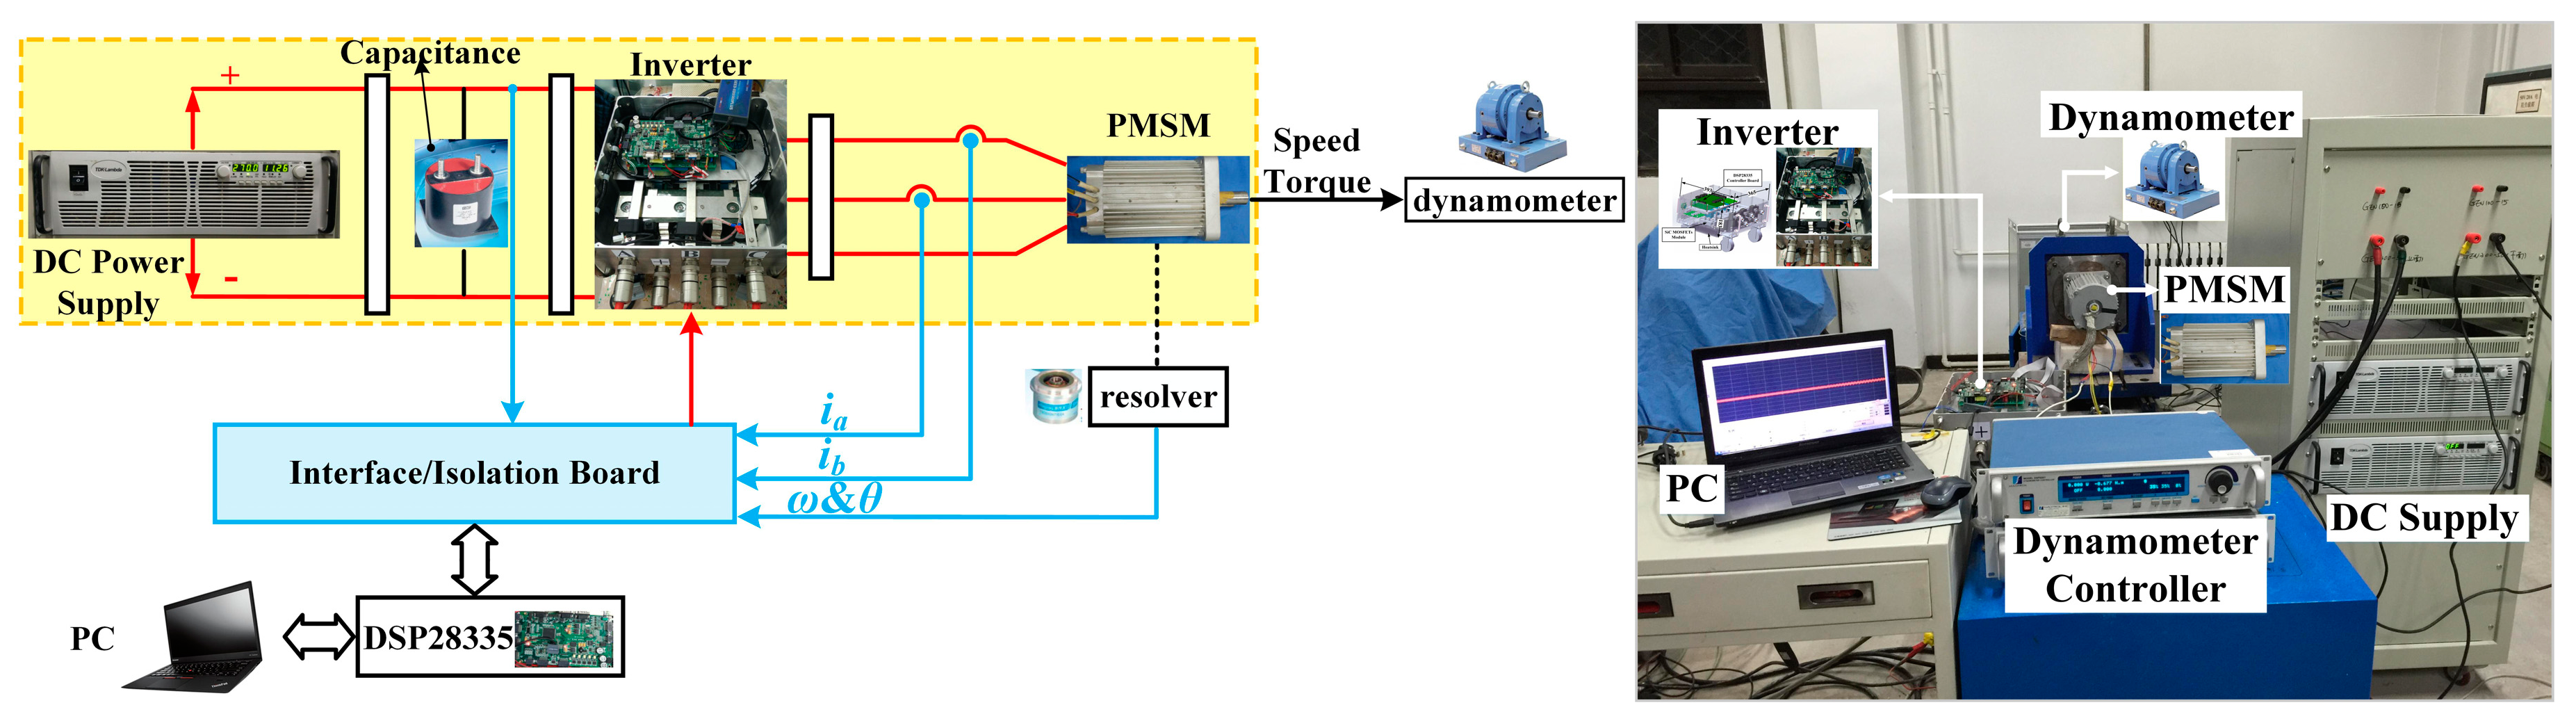
The experimental setup is illustrated in
Figure 10. In order to prevent unpredictable factors from impacting the voltage and current waveforms, the same control boards based on DSP28335, the same current sensors (LEM DHAB s/14) and same PMSM with a Tamagawa resolver (TS2640N321E64) are used in the two test drive systems. An AD2S1210 resolver-digital converter with a highest accuracy of 0.24 rpm is adopted. The only difference is the power switching device: SiC MOSFET (CAS300M12BM2, Cree, 1200 V, 300 A) and Si IGBT (FF400R12KE3, Infineon, 1200 V, 400 A) are adopted.
5.1. Fast Response Performance Results
The same control strategy and PI parameters are set in the two systems, yielding a relative fair comparison. The speed controller is a conventional two-loop PI control. One is the inside loop, namely current loop. The corresponding Kp and Ki are 2.3 and 0.01 for the direct-axis current id separately. The Kp and Ki for the quadrature-axis current iq are 2.5 and 0.005, respectively. The other one is the outside loop, namely the speed loop. The corresponding Kp and Ki are 0.042 and 0.00035, respectively. A series of bandwidths of q-axis currents are measured under different switching frequencies and dead times, and the effects of the different power devices on the bandwidth of PMSM drive system are explored. Additionally, the speed settling times of the two PMSM drive systems are investigated and compared as well.
5.1.1. The q-Axis Current Tracking Experiments
The references of sinusoidal current with different frequencies are assigned to the SiC- and Si-drive systems, respectively, and the loci of actual current tracking are recorded. As the frequency of the reference current increases, the phase difference between the reference and actual current increases, and the amplitude of the actual current waveform decreases. When the amplitude of actual current waveforms declines to 0.707 times the amplitude of the reference current, the corresponding frequency is defined as the bandwidth of the drive system.
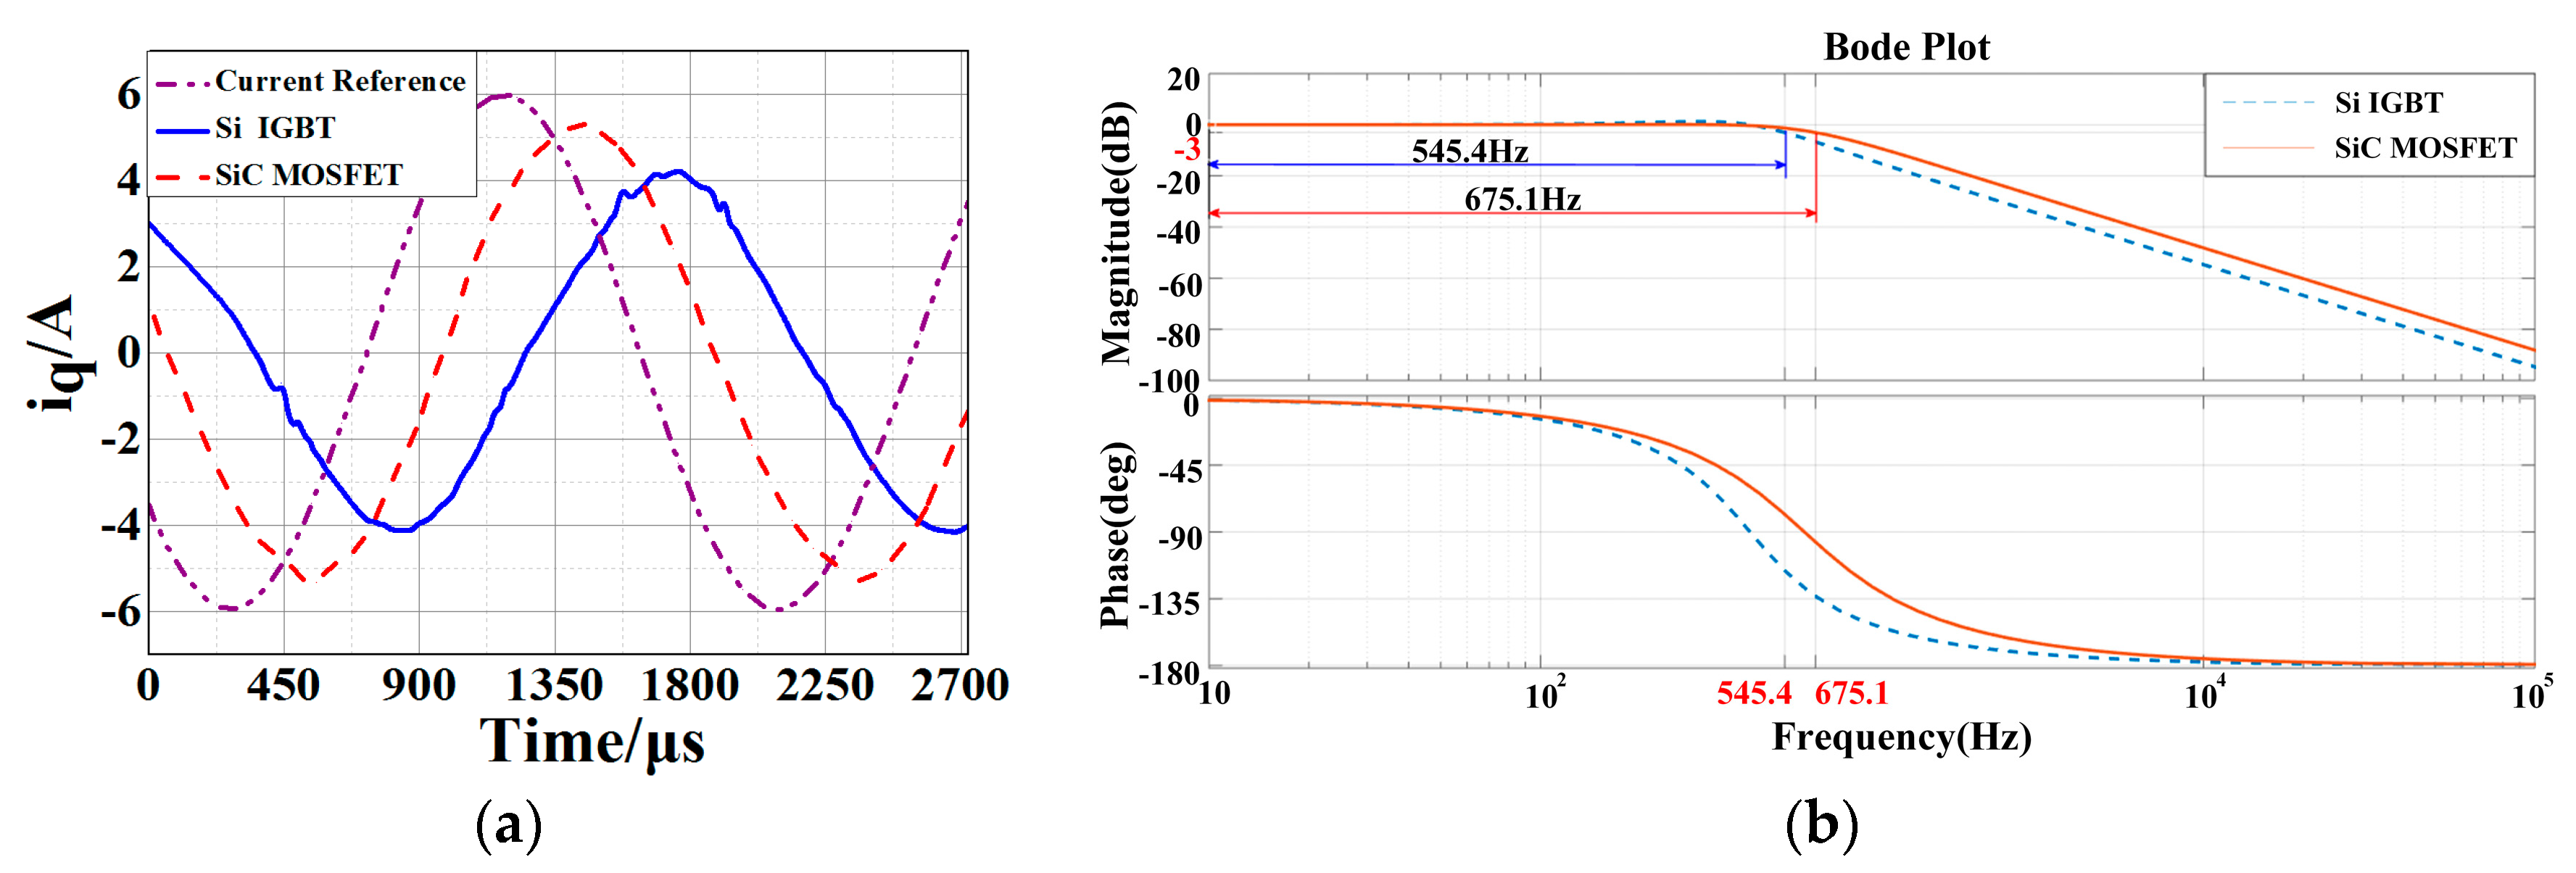
Figure 11 shows the experimental results at a switching frequency of 15 kHz and a dead time of 2 μs.
Figure 11a shows experimental results of the
q-axis reference current and the actual
q-axis current when the frequency and the amplitude of the reference current are 545 Hz and 6 A, respectively. The actual current of the SiC-drive system presents 5.3 A amplitude and 53.8° phase lag. Meanwhile, the actual current of the Si-IGBT system has 4.2 A amplitude and 116° phase lag. The SiC-drive system manifests a faster dynamic response compared with the Si-drive system.
Besides, the loci of the current tracking of the two systems are recorded at a large scale of frequencies, then the Bode plot is obtained shown in
Figure 11b. The bandwidth of the SiC-drive system is 675.1 Hz, which is higher than that of the Si-drive system (545.4 Hz). Moreover, the current bandwidths of the two systems under different switching frequencies and dead times are comprehensively compared in
Table 3.
In accordance with the aforementioned analysis, faster switching speed, lower dead time, smaller voltage drop and output capacitance indeed result in a lower phase voltage distortion, and a higher bandwidth. Hence, the experimental results are consistent with the conclusions presented in
Section 4.
5.1.2. The Step Response of the Speed Loop
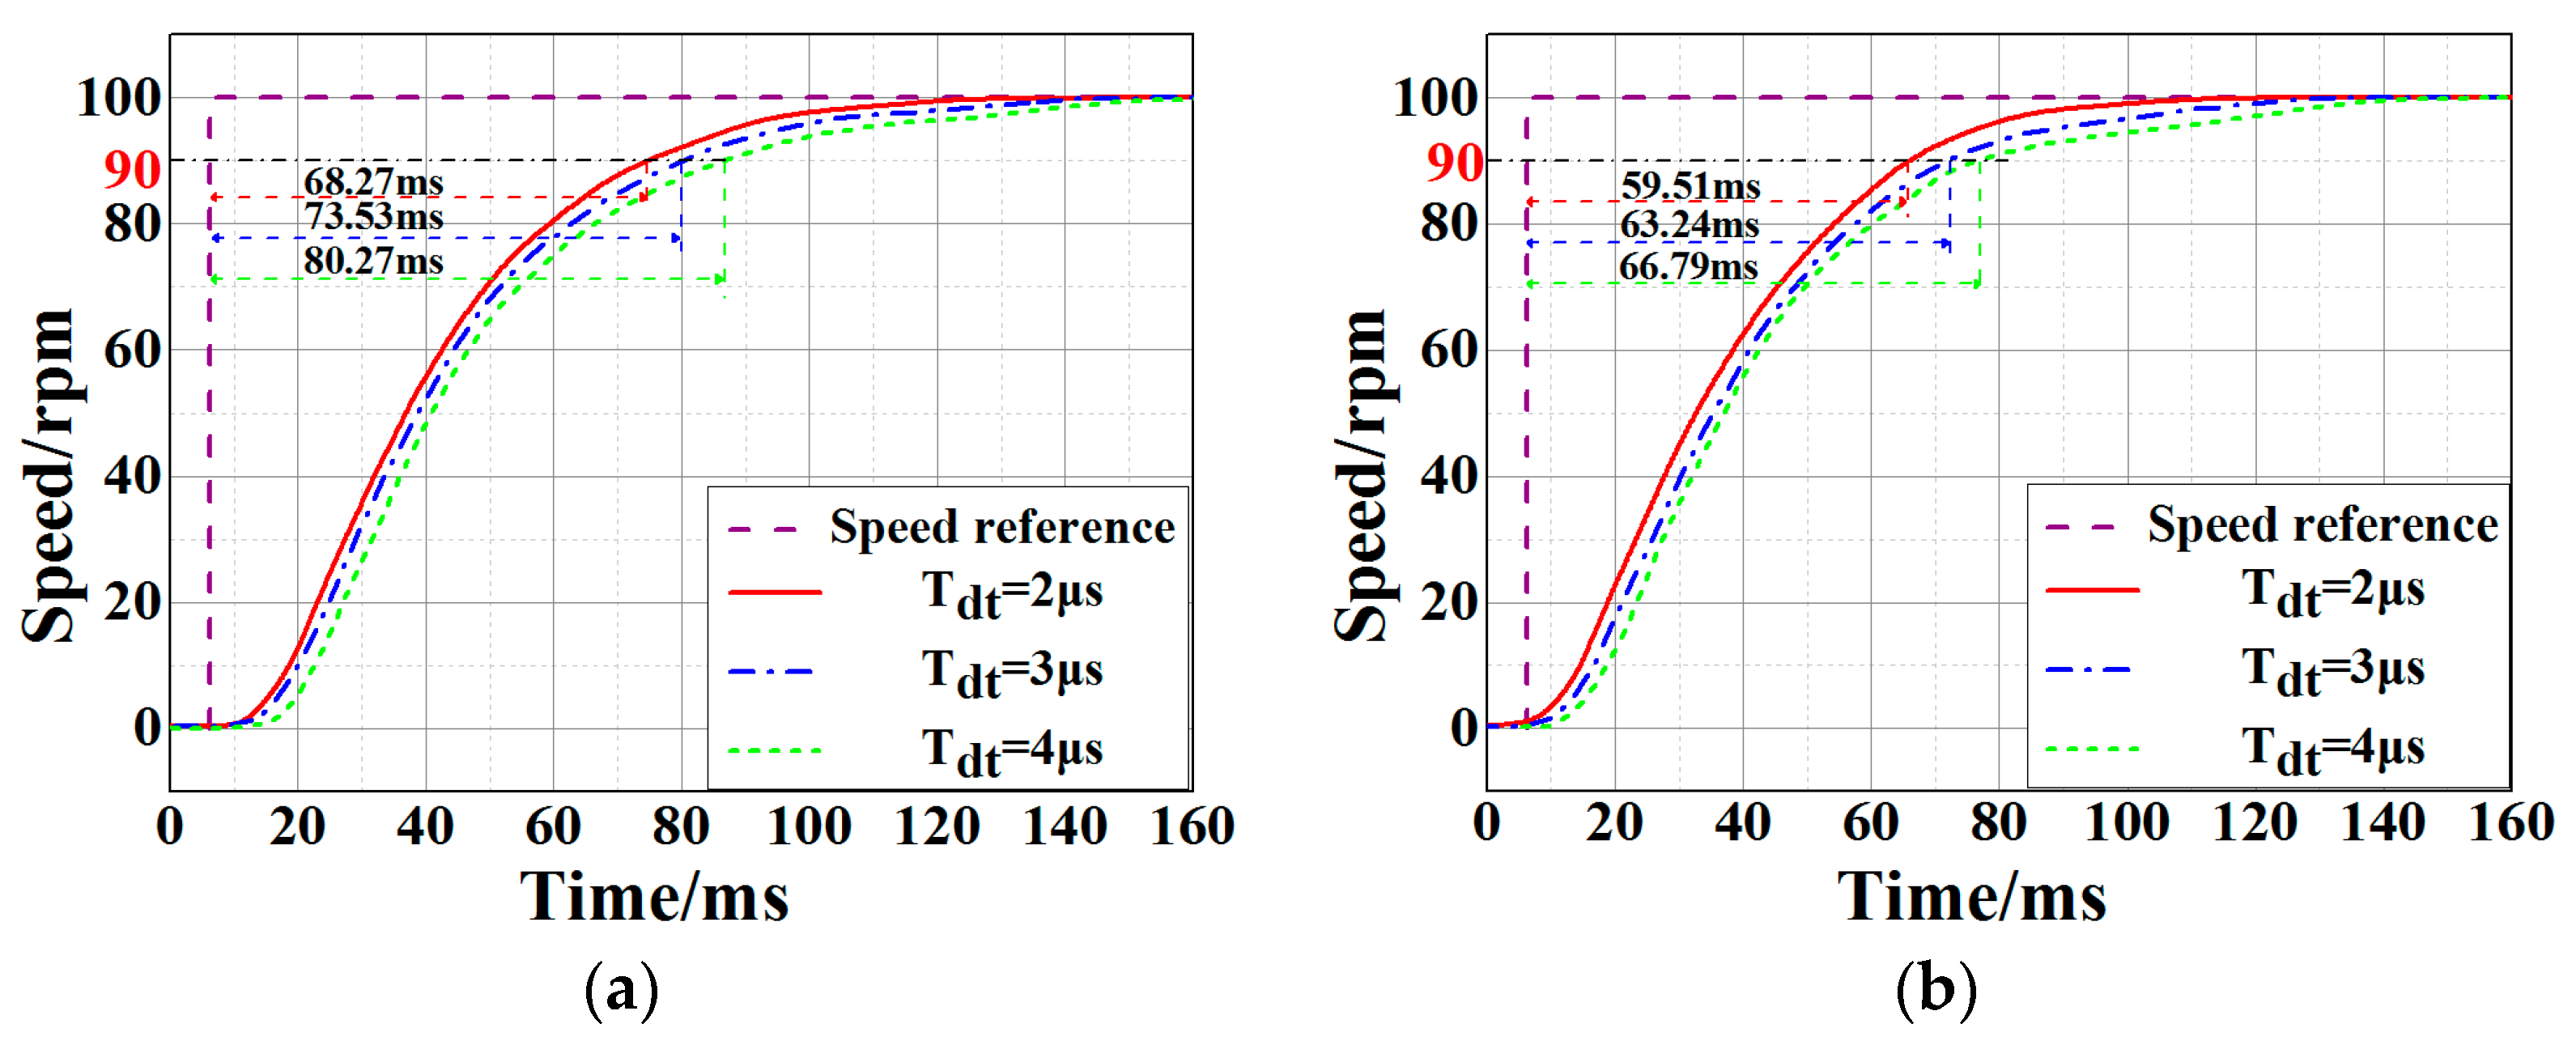
The references of step speed (0 to 100 rpm) are assigned to the two PMSM drive systems under no-load conditions. The speed response loci are captured under different switching frequencies and dead times.
Figure 12a,b illustrate the experimental results of the Si- and SiC-drive systems, respectively, at 15 kHz switching frequency and 2 μs dead time. The setting time of the SiC-drive system is 59.51 ms, which is less than that of the Si-drive system (68.27 ms).
Furthermore, the detailed experimental step response results of speed under different switching frequencies and dead times, are summarized in
Table 4. The settling time extends as the dead time increases and the switching frequency declines, which means the fast response performance of the drive system deteriorates.
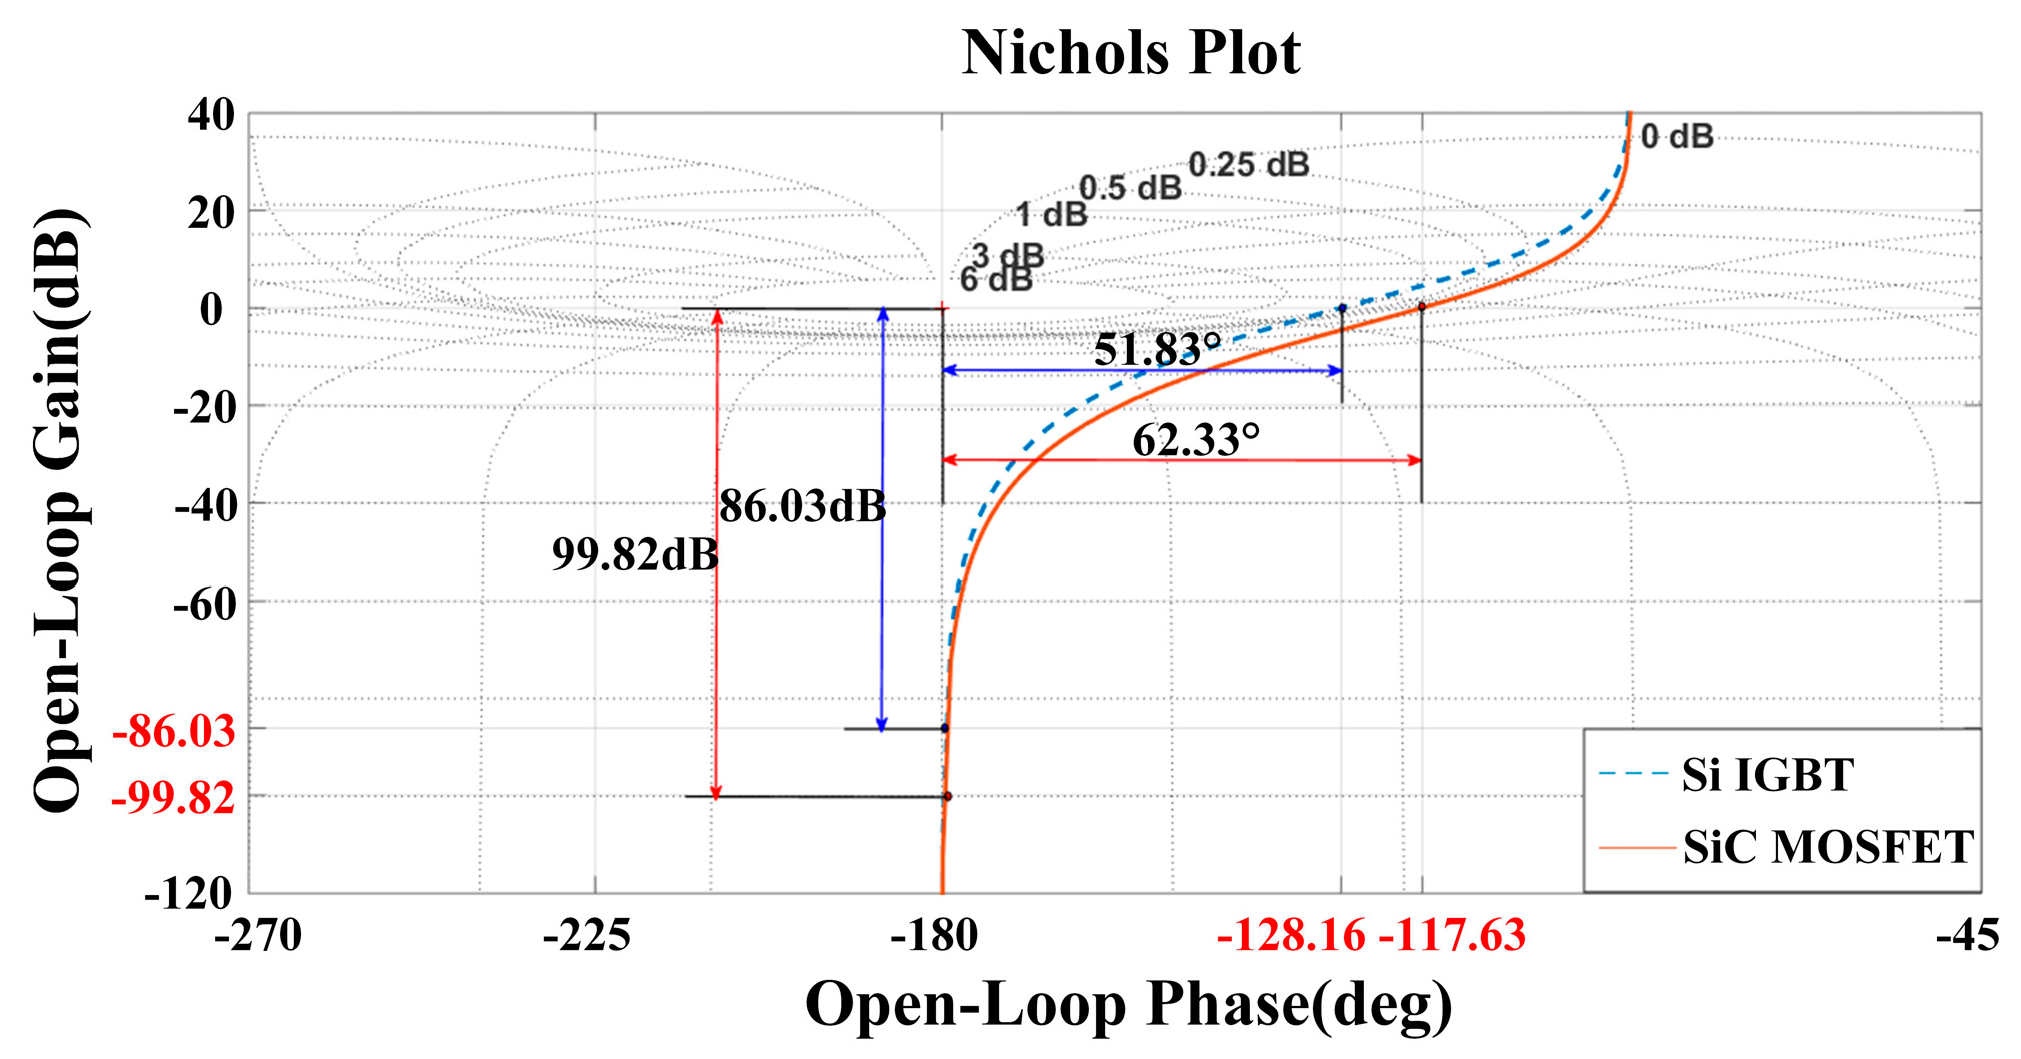
5.2. Relative Stability Results
In this section, the relative stabilities of the two drive systems are investigated by experiments. The Nichols plot is drawn based on the transfer function of the drive system and experiment as shown in
Figure 13. The phase and amplitude margins of the SiC-drive system are 62.33° and 99.82 dB, respectively, while the counterparts of the Si-drive system are 51.83° and 86.03 dB. A significant improvement in relative stability by adopting SiC MOSFETs can be observed from the results. In addition, thanks to the superior characteristics of the SiC MOSFET, the phase and amplitude margins can be further increased by decreasing the dead time and the switching period, whereas, the phase and amplitude margins of the Si-drive system are penalized by its limited switching speed and operation frequency.
5.3. Robustness Performance Results
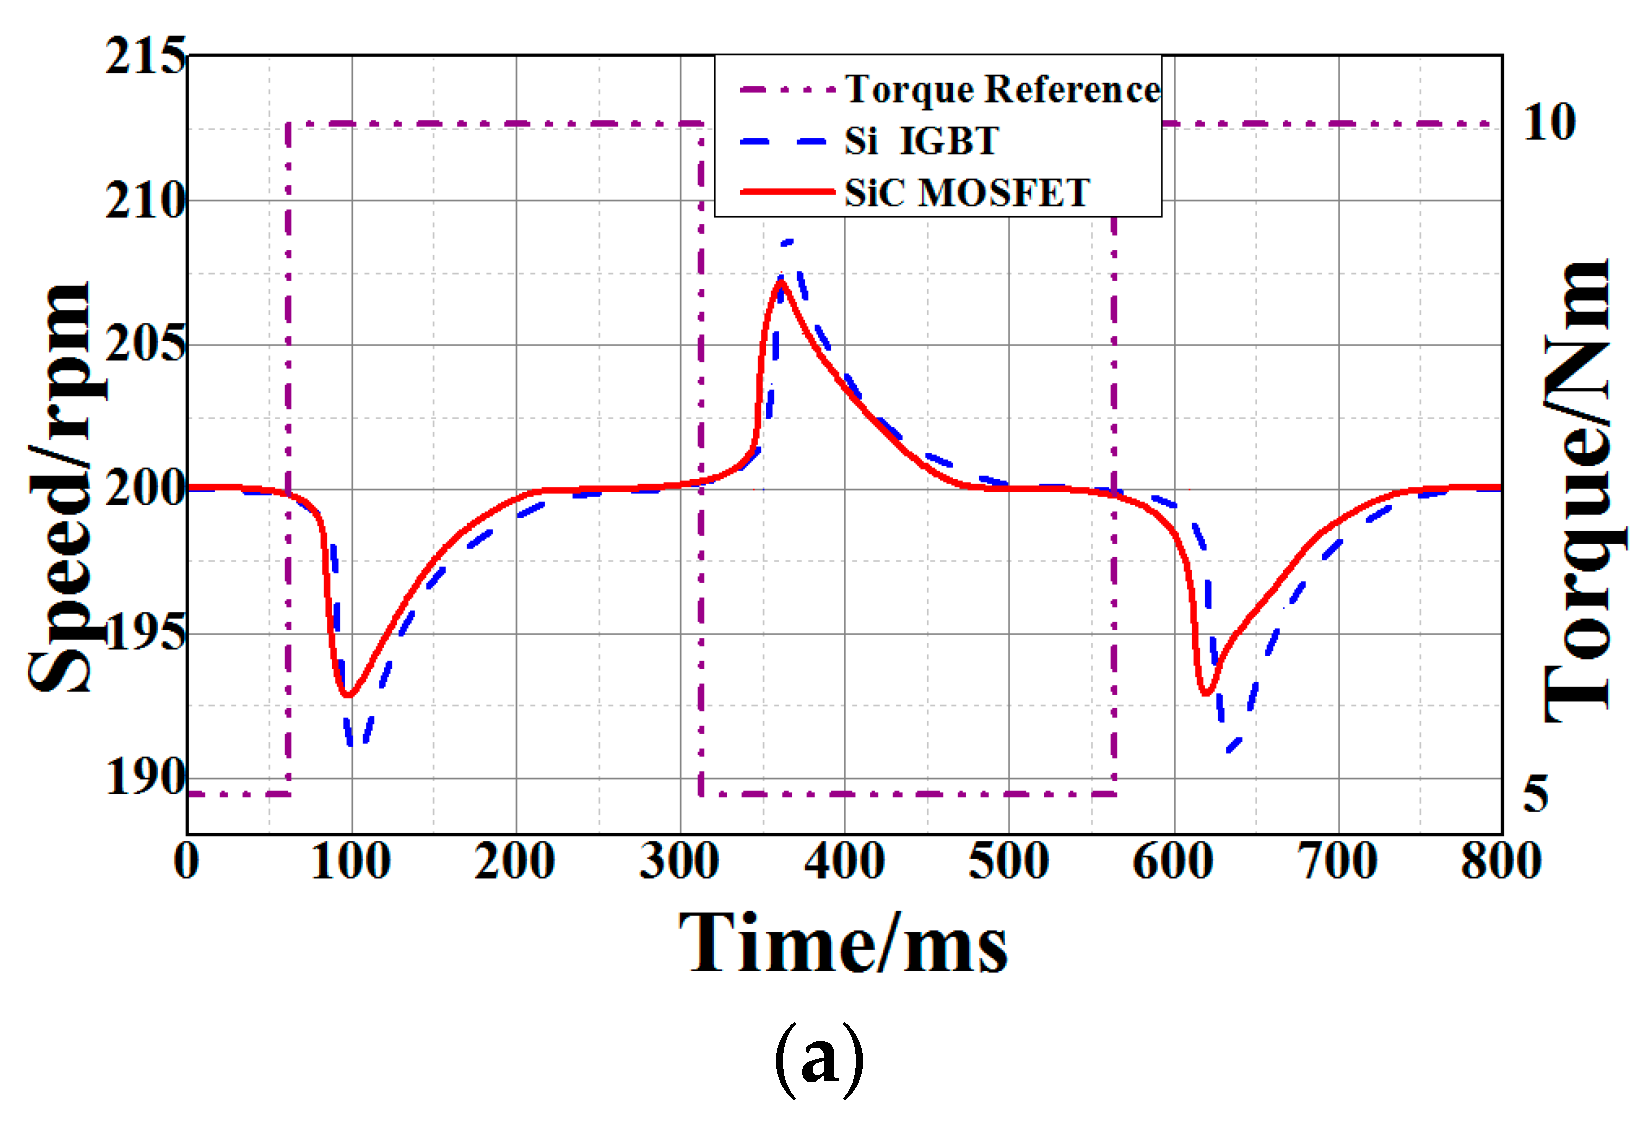
In order to evaluate the robustness performance of the drive system, an external torque is suddenly applied to the motor while the motor is operating at a steady-state.
Figure 14 shows the experimental result.
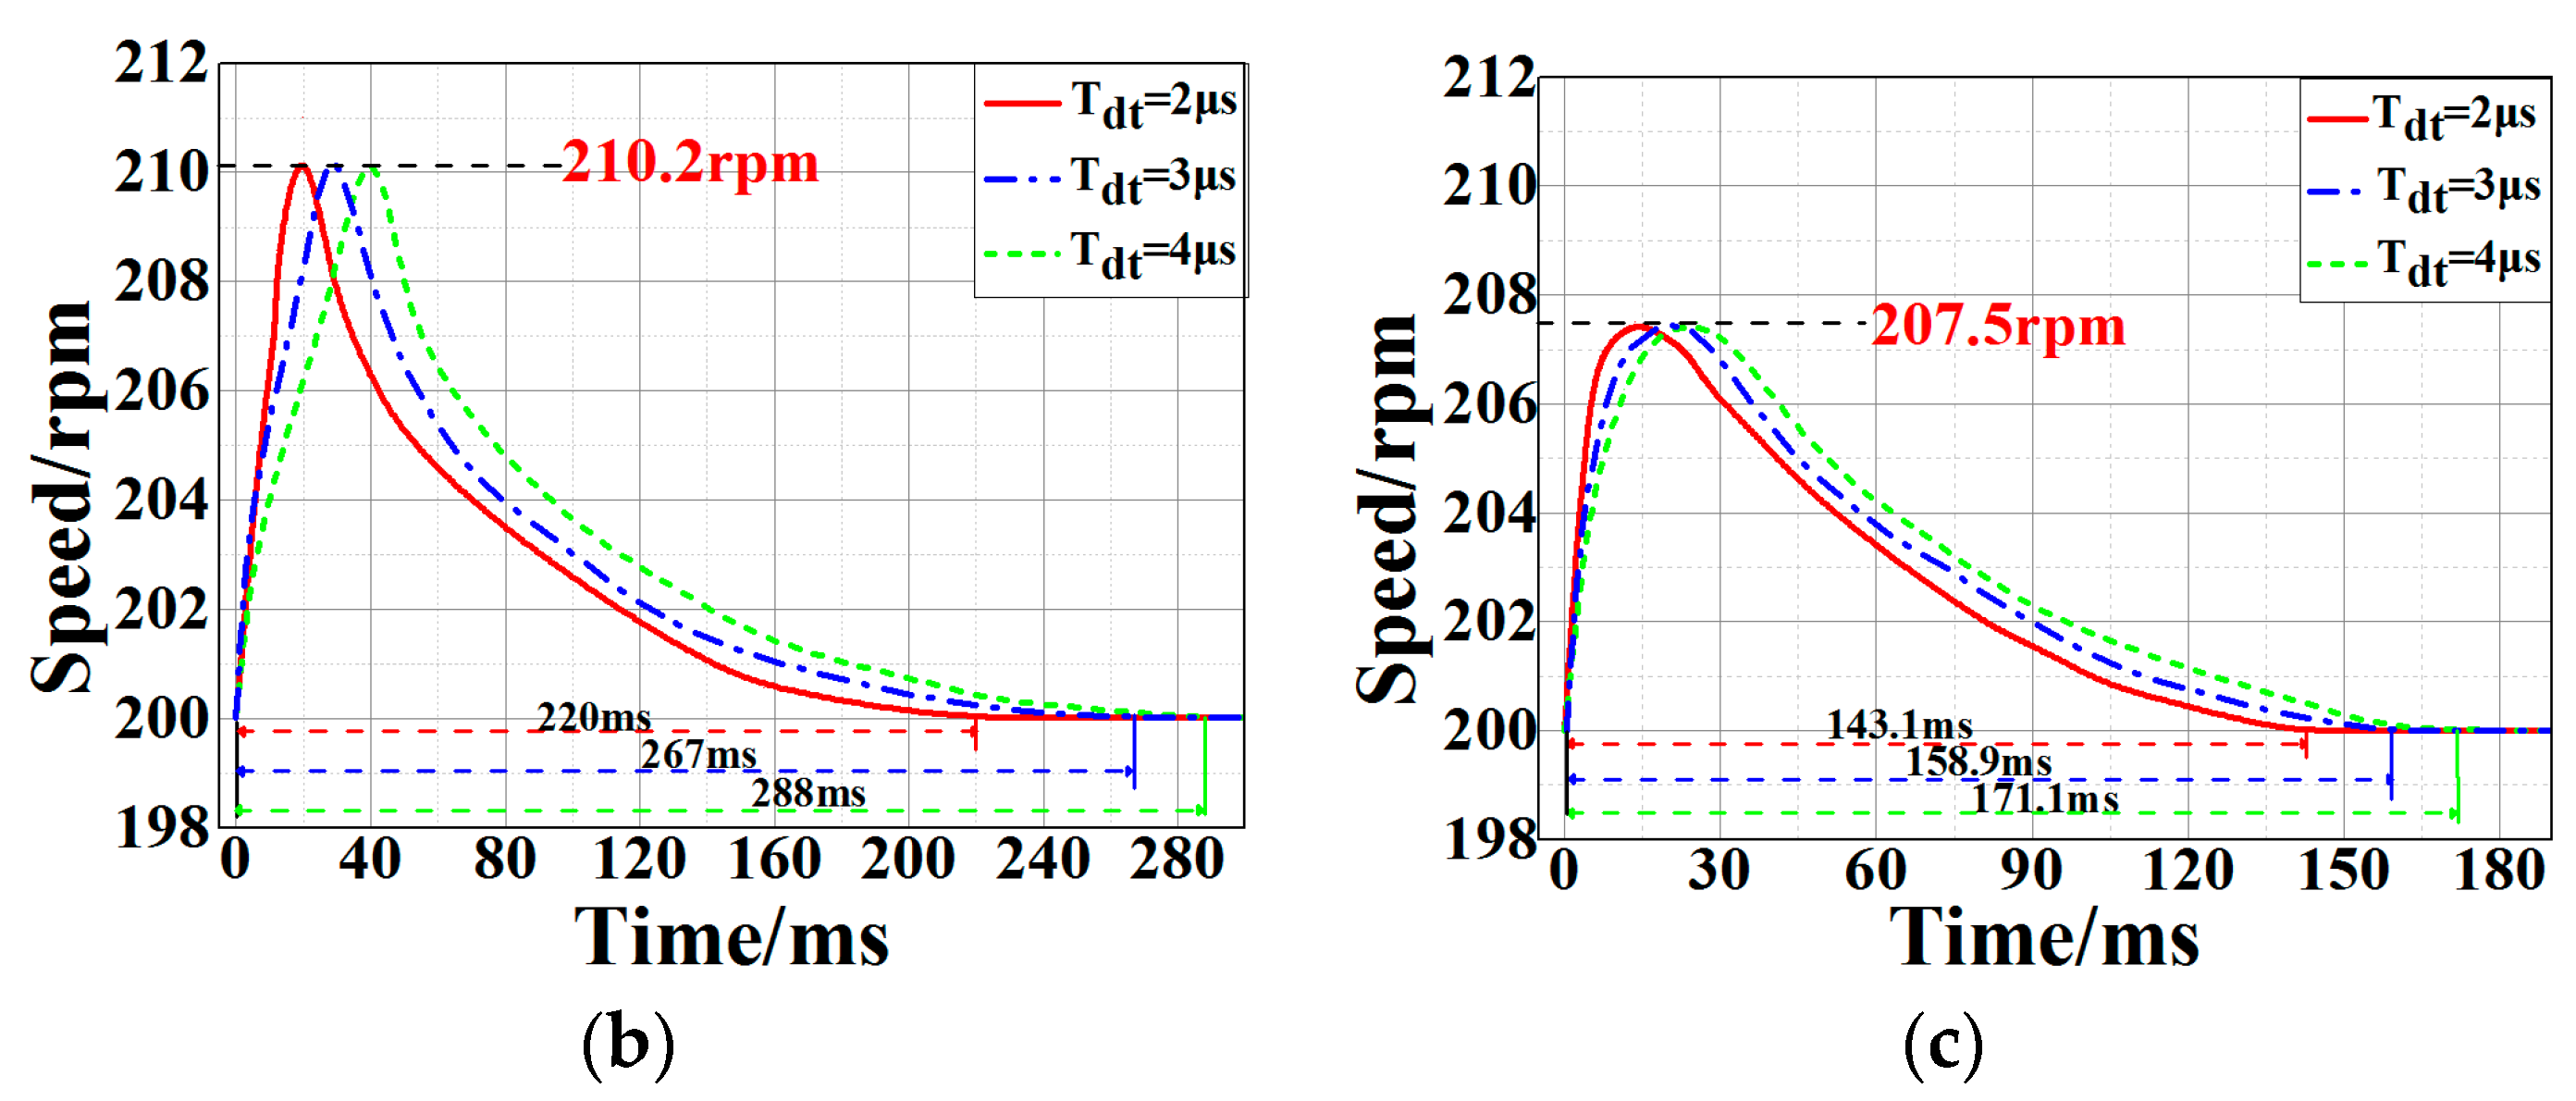
The real speed response curves are measured. The fluctuations of the speeds are due to the external torque changing abruptly from 5 to 10 Nm. Both the speed deviation and regulation restoration time of the SiC-drive system are smaller than the counterparts of the Si-drive system. The different switching frequencies and dead times are adopted to comprehensively investigate the robustness performance of the two drive systems. When the switching frequency and dead time are 15 kHz and 2 μs the speed deviation of the SiC-drive system is 7.5 rpm, while the value of the Si-drive system is more than 10 rpm, as shown in
Figure 14. Besides, the regulation restoration time of the SiC system is 143.1 ms, which is less than that of the Si system (220 ms). Hence, it is experimentally verified that the SiC-drive system achieves the better robustness performance to suppress the disturbance in the transient process.
It is worth mentioning that the turn-off time of the Si IGBT is increasing as temperature rises, which will increase the delay time constant τr and decrease the gain Kr of the Si-inverter. Hence, the fast response, relative stability and robustness capability of the Si-drive system will be worse. On the contrary, the switching time of the SiC MOSFET is almost invariable under different temperatures. As a result, the SiC-drive system can maintain superior dynamic performance for a long-time operation.


